Embed Size (px)
Citation preview

Phenotypic Covariance Structure in Tamarins (GenusSaguinus): A Comparison of Variation Patterns Using MatrixCorrelation and Common Principal Component Analysis
REBECCA ROGERS ACKERMANN AND JAMES M. CHEVERUD*Department of Anatomy and Neurobiology, Washington University Schoolof Medicine, St. Louis, Missouri 63110
KEY WORDS cranial morphology; Callitrichidae; variability;quantitative methods
ABSTRACT Constancy of variation/covariation structure among popula-tions is frequently assumed in order to measure the differential selectiveforces which have caused population differentiation through evolutionarytime. Following Steppan ([1997] Evolution 51:571–594), this assumption isexamined among closely related tamarin species (genus Saguinus), using twodistinct approaches applied to the task of evaluating similarity in patterns ofmorphological variation: common principal component analysis and matrixcorrelations. While the results of these analyses may appear contradictory,closer examination reveals them as complementary, highlighting the wisdomof combined methodologies. Overall, the results reveal a close relationshipamong the morphologically based variance structures of the tamarin speciesa relationship whose pattern is consistent with the pattern of phylogeneticrelatedness as found via a molecular genetic study. More specifically, bothmethodological approaches provide some support for divergence of S. geof-froyi and S. oedipus (with regards to their patterns of morphological varia-tion) from other tamarin species. This suggests that variance/covariancestructure may have diverged through evolutionary time in the tamarin lin-eage, placing assumptions of constancy in doubt. Am J Phys Anthropol 111:489–501, 2000. © 2000 Wiley-Liss, Inc.
The pattern and magnitude of intrapopula-tion variation contribute to our understand-ing of evolution and the degree of similaritybetween related organisms. Similarly, our un-derstanding of this variation (and its bound-aries or limits) shapes the way we divide andunderstand our world and the organismswithin it (in terms of their distributionthrough both space and time). Among onegroup of New World monkeys, the tamarins(family Callitrichidae, genus Saguinus; vonHoffmannsegg, 1807), analyses into variationin coat color, body size, and craniofacial mor-phology have all been applied to the task ofunderstanding relationships among popula-tions (Hershkovitz, 1977; Ferrari, 1993a,b;Cheverud, 1995, 1996). Each of these studies
focuses on phenotypic variation; as the targetof selection, the phenotype offers unique in-sight into evolutionary processes, and can beused to address evolutionary questions utiliz-ing fossils or large museum collections, wherequantitative genetic data are not available.Additionally, phenotypic variation and co-variation are often used as a surrogate forquantitative genetic variation/covariation,
Grant sponsor: National Science Foundation; Grant number:SBR-9632163.
*Correspondence to: James M. Cheverud, Department ofAnatomy and Neurobiology, Washington University School ofMedicine, 660 Euclid Ave., Box 8108, St. Louis, MO 63110.E-mail: [email protected], [email protected]
Received 22 June 1999; accepted 7 December 1999.
AMERICAN JOURNAL OF PHYSICAL ANTHROPOLOGY 111:489–501 (2000)
© 2000 WILEY-LISS, INC.
since large samples of quantitative geneticdata are only obtainable via controlled captivebreeding programs. This substitution is via-ble, because phenotypic covariance matricesfor morphological traits reflect underlying ge-netic organization and mechanisms, and aretherefore generally similar to genetic covari-ance matrices (Cheverud, 1988; Arnold, 1992;Roff, 1995, 1996; Koots and Gibson, 1996).
This substitution is also effective for un-derstanding both micro- and macroevolu-tionary patterns, since patterns of geneticvariation and covariation play an importantrole in determining the average response toselection (Lande, 1979). This is illustratedby the equation Dz 5 Gb, where Dz is then 3 1 vector of change in trait means, b isthe n 3 1 selection gradient vector measur-ing the selection acting on the n traits, andG is the n 3 n additive genetic variance/covariance matrix (Lande, 1979). When thestructure of genetic variation remains con-stant over generations, it is possible to mea-sure the differential selection operating ontwo divergent populations or species by re-arranging the equation to yield b 5 G21Dz,where Dz is the observed difference betweenspecies means and b is the selection respon-sible for the phenotypic separation of thespecies (Lande, 1979). The ability to inter-pret this equation depends on whether con-stancy of variation structure is a valid as-sumption, i.e., whether patterns ofcovariation behave predictably over macro-evolutionary time (Steppan, 1997a,b; Lande,1979; Price et al., 1984; Cheetham et al.,1993).
Following Steppan (1997a), this assump-tion of constancy of variation is examinedamong closely related tamarin species usingtwo distinct approaches: matrix correlationand common principal component analysis.Phenotypic covariation in cranial morphol-ogy is substituted for genetic covariation,and therefore the constancy of the covaria-tion in cranial morphology is at issue. In hisanalysis of species and subspecies of leaf-eared mice, Steppan (1997a) comparedthese two approaches, and found that whilethe phenotypic covariance structure was notconstant, divergence between populationswas small and not associated with their
phylogenetic pattern. There is some evi-dence that subspecific populations of tama-rins (represented by the single speciesSaguinus fuscicollis) show a similar phe-nomenon; divergence in variation structureis random and of small magnitude (Chev-erud, 1995). In order to determine whetherconstancy of covariation structure exists ata higher taxonomic level (species) amongtamarins, patterns of morphological varia-tion and covariation are compared amongsix species: Saguinus fuscicollis, S. geof-froyi, S. midas, S. mystax, S. nigricollis, andS. oedipus.
MATERIALS AND METHODS
Measurements were obtained from a totalof 848 crania of adult tamarins. Crania withfused spheno-occipital and spheno-eth-moidal sutures were considered adult. TheSaguinus specimens were obtained fromcollections at the American Museum of Nat-ural History (AMNH, New York), the BritishMuseum of Natural History (BMNH, Lon-don), the Field Museum of Natural History(FMNH, Chicago), the National Museum ofNatural History (NMNH, Washington, DC),the University of Tennessee (ORAU, derivedfrom the Marmoset Research Center, OakRidge Associated Universities’ colony), andthe University of Sao Paolo (USP, Brazil), asfollows: Saguinus fuscicollis (n 5 289; AMNH,BMNH, FMNH, NMNH, ORAU, USP), S. geoffroyi(n 5 132; AMNH, FMNH, NMNH), S. midas (n 5116; AMNH, BMNH, FMNH, NMNH), S. mystax(n 5 72; AMNH, BMNH, FMNH, NMNH, ORAU,USP), S. nigricollis (n 5 59; AMNH, BMNH,NMNH, ORAU), and S. oedipus (n 5 180; AMNH,NMNH, ORAU).
Three-dimensional coordinates were re-corded for 36 landmarks using a Polhemus3Space digitizer (Table 1, Fig. 1). Each spec-imen was digitized twice to minimize mea-surement error (see Cheverud, 1995); theaverage of repeated measures was used forfurther analyses. A set of 39 linear measure-ments, averaged between left and rightsides and chosen to describe cranial mor-phology without excessive redundancy, wascalculated from the coordinate values (Table2). Phenotypic correlation matrices andvariance/covariance matrices were obtained
490 R.R. ACKERMANN AND J.M. CHEVERUD

for these 39 cranial and facial variables insix species of tamarins, using the residualcorrelation matrix and residual covariancematrix from a MANOVA with the 39 traitsas dependent variables and subspecific affil-iation as the independent variable, thuspooling the correlations and covariancesacross subspecies. For S. oedipus, theOakridge and non-Oakridge groups weresimilarly pooled, since differences betweenthe two groups are significant for a numberof variables.
Analysis 1: common principalcomponents model
While most statistical tests of matrix sim-ilarity consider a null hypothesis of nostructural similarity, the common principalcomponents (CPC) analysis tests whethermatrices share more complex relationships(Flury, 1988; Steppan, 1997a; Phillips andArnold, 1999; Arnold and Phillips, 1999).For example, two matrices might be propor-
tional but not equal, or might share princi-pal component structure (eigenvectors)while differing in the eigenvalues associatedwith the components. Similarly, the two ma-trices might share some portion of theirprincipal components: the partial commonprincipal components (PCPC) model. Thecommon principal component approach(CPC) tests each of these hypotheses, bybuilding up each level in the hierarchy, fromunrelatedness to equality, and testing thesignificance of each level against the nextlower level (Steppan, 1997a; Phillips andArnold, 1999; Arnold and Phillips, 1999).This hierarchy is based on the realizationthat if two matrices share three principalcomponents in common, they necessarilyshare two in common. Similarly, if two ma-trices are equal, they are necessarily pro-portional, and satisfy the CPC and all PCPCmodels. Common principal component anal-yses were conducted using the programCPC (Phillips, 1998), which performs theanalyses outlined by Flury (1988). The num-ber of partial common principal componentsanalyzed was limited to seven, since a stan-dard t-test shows that beyond the fifth prin-cipal component, few loadings are signifi-cantly different from zero for this data set(the choice of seven PCs was therefore con-servative).
Following these analyses, the eigenstruc-tures of the tamarin species were furtherexamined, in order to assist in interpretingthe CPC results. Correlations were calcu-lated between all pairwise comparisons ofthe first seven standardized principal com-ponents for all species comparisons. Addi-tionally, each value of the standardizedPC(1) for each species was divided by (1/=39) to assess morphological divergencefrom isometry (Jolicoeur, 1963).
Analysis 2: matrix correlation model
Elementwise matrix correlations werecalculated between the correlation matricesof all possible pairs of species. In order toestimate the impact of sampling error, ma-trix repeatability (Cheverud, 1996) wasdetermined. This technique compares ob-served correlations to a theoretical maxi-mum, in order to find the actual (adjusted)
TABLE 1. Craniofacial landmarks recorded fromtamarin crania, using three-dimensional digitizer1
Landmark Description Position(s)
IS Intradentale superior, A MidlinePM Premaxillary suture at the
alveolus, ARight, left
NSL Nasale, A MidlineNA Nasion, A MidlineBR Bregma, AP MidlinePT Pterion, AP Right, leftFM Fronto-malare, A Right, leftZS Zygomaxillare superior, A Right, leftZI Zygomaxillare inferior, A Right, leftMT Maxillary tuberosity, A Right, leftPNS Posterior nasal spine, A MidlineAPET Anterior petrous temporal, A MidlineBA Basion, AP MidlineOPI Opisthion, AP MidlineEAM Anterior external auditory
meatus, ARight, left
PEAM Posterior external auditorymeatus, A
Right, left
ZYGO Inferior zygo-temporalsuture, A
Right, left
TSP Temporo-spheno-parietaljunction, A
Right, left
TS Temporo-sphenoidal junctionat petrous, AP
Right, left
JP Jugular process, AP Right, leftLD Lambda, P MidlineAS Asterion, P Right, left1 A (anterior) or P (posterior) after the landmark descriptionindicates in which position(s) the landmark was recorded. Land-marks are also identified in Figure 1. Adopted from Cheverud(1995).
MORPHOLOGICAL VARIATION IN TAMARINS 491

matrix correlation (accounting for error).The observed variance of matrix elements(Vobs) is composed of the error variance ofthe elements (Verr) and the variance of thetrue population values (Vt):
Vobs 5 Vt 1 Verr.
Solved differently, Vt 5 Vobs 2 Verr, whereVerr is the squared standard error of theaverage correlation in the matrix, and Vt isthe actual variance of matrix elements. Thetheoretical maximum matrix correlation be-tween two matrices is then Rmax 5 =t1t2,with t1 equal to the actual variance divided
by the observed variance (Vt/Vobs) for thefirst species’ matrix, and t2 equal to (Vt/Vobs)for the second species’ matrix. Adjusted ma-trix correlations are the observed correla-tion (Robs) between the two matrices dividedby the maximum matrix correlation (Rmax)calculated for that pairwise comparison.
Additionally, hypotheses of morphologicalintegration within each tamarin specieswere tested. Morphological integration, inits most general sense, refers to the connec-tions or relationships among morphologicalelements. As described previously (Chev-erud, 1995, 1996), matrices are used to as-
Fig. 1. Craniofacial landmarks recorded from tamarin crania using three-dimensional digitizer. Refer toTable 1 for descriptions of landmarks.
492 R.R. ACKERMANN AND J.M. CHEVERUD
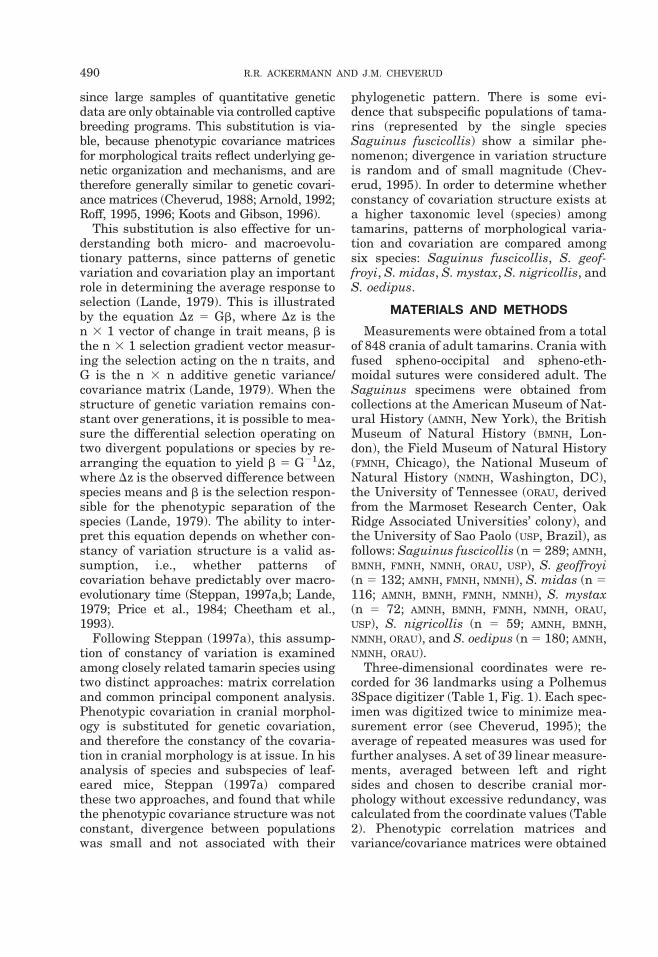
sess morphological integration within sixvirtually independent regions of the cra-nium (cranial vault, cranial base, orbit, oral,zygomatic, and nasal; see Table 2) andwithin the cranium as a whole (total mor-phological integration), by calculating el-ementwise matrix correlations between theobserved species’ correlation matrices andmorphological integration connectivity ma-trices. These connectivity matrices are con-structed in the following manner: when twotraits belong to the specified developmentalset, a value of one is entered in the develop-mental matrix; otherwise, a value of zero isentered. For the total integration matrix, aone is entered if traits belong to the same
developmental trait set, and a zero is en-tered otherwise (Cheverud, 1995, 1996).
The statistical significance of all of theelementwise matrix correlations was ob-tained using quadratic assignment proce-dures, sometimes referred to as Mantel’stest (Cheverud et al., 1989). This procedureis performed by randomly permuting therows and associated columns of one matrixand then calculating the matrix correlationbetween the unaltered matrix and the per-muted matrix. This permutation was re-peated 10,000 times, and a distribution ofmatrix correlations expected under the nullhypothesis of no structural similarity be-tween the matrices was obtained. The ob-served correlation was then compared to theempirically derived distribution, and theproportion of permutation correlationsgreater than or equal to the observed corre-lation functioned as an estimate of the prob-ability of obtaining the observed correlation,given that the null hypothesis is true.
Additionally, a discriminant functionanalysis was performed and the canonicalscores of the group means were used to cal-culate the morphological distances (D2) be-tween species, to see whether variation incovariance among tamarin species corre-sponds to the distances between populationmeans. The D2 matrices were correlated inturn with the correlations between the with-in-species correlation matrices and with thepairwise correlations of the first principalcomponents of the V/CV matrices. Each ofthese measures of variation was then com-pared to the results of the CPC analysis,and interpreted in the context of knownphylogenetic relationships between the spe-cies as measured by phylogenetic analysis(see Cropp et al., 1999) to examine howclosely measurements of morphological sim-ilarity reflect phylogenetic relationship.Cropp et al. (1999) generated their phyloge-netic tree by manually aligning homologoussites of the mtDNA sequences and analyz-ing them with phylogenetic analysis usingparsimony (PAUP). The outgroup referencetaxa consisted of Callimico, Callithrix, Ce-buella, and Leontopithecus, and the mostparsimonius phylogenetic reconstruction forthe genus Saguinus was obtained using the
TABLE 2. Thirty-nine linear craniofacialmeasurements and their membership in functional/
developmental groups1
Measurement Functional/developmental group(s)
IS-PM OralIS-NSL NasalIS-PNS Oral, nasalPM-ZS OralPM-ZI OralPM-MT OralNSL-NA NasalNSL-ZS NasalNSL-ZI Oral, nasalNA-BR Cranial vaultNA-FM OrbitNA-PNS NasalBR-PT Cranial vaultBR-APET Cranial vaultPT-FM OrbitPT-APET Cranial vaultPT-BA Cranial vaultPT-EAM Cranial vaultPT-ZYGO ZygomaticPT-TSP Cranial vault, zygomaticFM-ZS OrbitFM-MT ZygomaticZS-ZI OralZI-MT OralZI-ZYGO ZygomaticZI-TSP ZygomaticMT-PNS OralPNS-APET Cranial baseAPET-BA Cranial baseAPET-TS Cranial baseBA-EAM Cranial baseEAM-ZYGO ZygomaticZYGO-TSP ZygomaticLD-AS Cranial vaultBR-LD Cranial vaultOPI-LD Cranial vaultPT-AS Cranial vaultJP-AS Cranial baseBA-OPI Cranial base1 Adapted from Cheverud (1995). Refer to Table 1 for descriptionof landmarks used in measurements.
MORPHOLOGICAL VARIATION IN TAMARINS 493

heuristic search option (for further details,see Cropp et al., 1999).
RESULTS
On a purely “objective” hypothesis-testingbasis, the results of the CPC analysis saythat there is no equality, proportionality, orshared principal component structureamong any of the V/CV matrices, whetheranalyzed together as a group, or in a pair-wise fashion. In other words, the tamarincovariance matrices are not significantlysimilar in the structure of either their eig-envalues or eigenvectors. This is illustratedby the fact that you cannot take the firststep up from unrelated structure to CPC(1)without encountering a significant P-valuein each of the analyses (i.e., the hypothesisof a single common principal component,CPC(1), is rejected; see Table 3 for an exam-ple). However, Flury (1988) argues that atest of best fit is more appropriate than atest of fit or lack of fit based on the stan-dardized rejection criteria (see also Phillipsand Arnold, 1999; Arnold and Phillips,1999). Although a hypothesis-testing ap-proach may be more appropriate for thisstudy, we also examined the results of themodel-fitting approach to see if they differsubstantially. Under a model-fitting ap-proach, the model with the lowest Akaikeinformation criterion (AIC), a statisticwhich balances the size of the log-likelihoodfunction with the number of parameters es-timated (see Steppan 1997a), is considered
the best-fitting model (given the totalamount of information available for testingthis model). The AIC criterion suggests thatshared CPC structure (to varied degrees) isthe best fit for each of the pairwise compar-isons (Table 4); most of the species havesimilar overall patterns of covariance/varia-tion as shown by their low AIC value fortheir entire principal component structure(full CPC). However, S. oedipus and S. geof-froyi may be more similar to each other thanthey are to some of the other species (suchas S. fuscicollis), with whom they only sharepartial CPC structure; there is also partialCPC structural similarity between S. nigri-collis and S. fuscicollis. However, the inabil-ity to test the significance of these AIC re-sults, combined with their contradiction ofthe hypothesis-testing based results, pre-sents something of a dilemma.
To resolve this dilemma, further evalua-tion of the eigenstructure is warranted. Ex-amining the eigenstructure of the covari-ance matrices reveals very different results.The first seven standardized eigenvectors ofeach species were correlated with the eigen-vectors of the other species in a pairwisefashion. The magnitude of correlation foreach pairwise species comparison varies,and while there is definitely similarity be-tween the species, it is not always clearlyinterpretable. Correlations between thefirst principal components for each speciesare high (excepting S. geoffroyi), indicatingsimilarity in allometric scaling, although
TABLE 3. Comparison of covariance matrices among all six tamarin species1
Hierarchy Morphology estimate (parametric)Higher Lower x2 df P AIC
Equality Proportionality 290.31 5 0.0001 9,231.5Proportionality Full CPC 1,347.55 190 0.0001 8,951.2Full CPC CPC(7) 4,922.72 2,480 0.0001 7,983.6CPC(7) CPC(6) 289.08 160 0.0001 8,020.9CPC(6) CPC(5) 523.63 165 0.0001 8,051.8CPC(5) CPC(4) 326.20 170 0.0001 7,858.2CPC(4) CPC(3) 408.13 175 0.0001 7,872.0CPC(3) CPC(2) 349.23 180 0.0001 7,813.9CPC(2) CPC(1) 275.16 185 0.0001 7,824.7CPC(1) Unrelated 499.50 190 0.0001 7,919.5Unrelated1 At each step in the hierarchy, the hypothesis labeled “Higher” is tested against the hypothesis on the step below, “Lower.” Estimatesof the genetic matrix are based on the variance/covariance of the cranial morphology (with parametric evaluation of samplingproperties). On an objective hypothesis-testing basis, there is no equality, proportionality, or shared principal component structureamong the six V/CV matrices. However, the best solution under the model-building approach may be indicated by the minimum valueof Akaike information criterion (AIC), namely, CPC(3) for this comparison.
494 R.R. ACKERMANN AND J.M. CHEVERUD
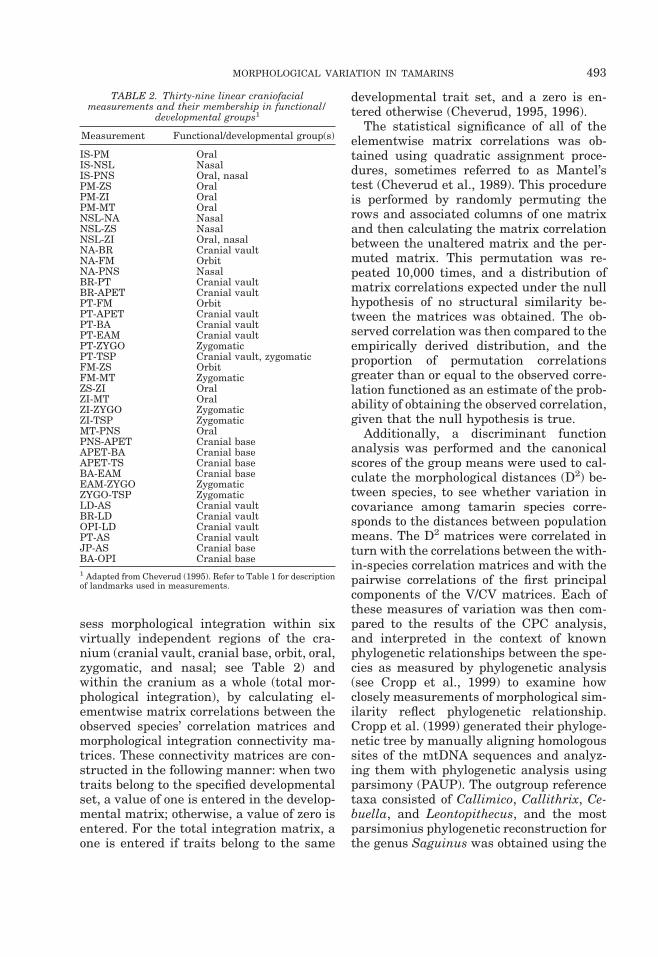
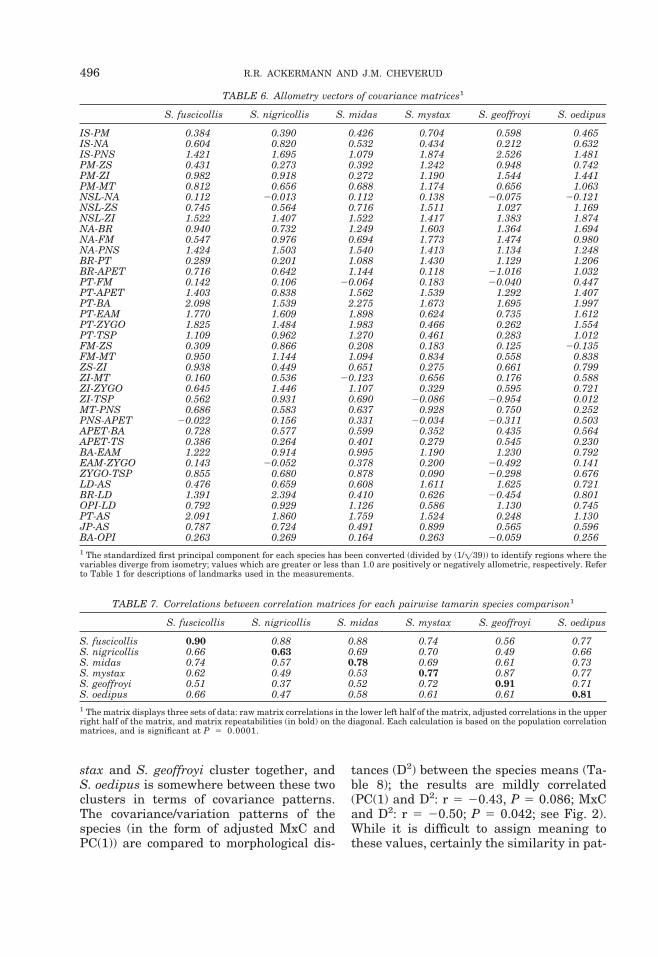
the magnitude of this relationship variesdepending on the species comparison, withthe correlation between PC(1)s rangingfrom r 5 0.60–0.97 (Tables 5, 6). This re-veals a degree of similarity not detectable inthe formal results of the CPC analysis,which simply indicates statistically signifi-cant divergence between the first principalcomponents of the matrices. Additionally,there is some suggestion that further eigen-vector structure is shared among species,since a number of correlation values be-tween the first seven principal componentsare outside of the range 20.4 , r , 0.4 (arange of correlations which commonly oc-curs among 39-element vectors by chancealone; Cheverud et al., 1983). When the firstprincipal component is converted to identifyisometry, allometric similarities in covari-ance structure between tamarin species areapparent (Table 6). Again, S. geoffroyistands out from the other species; the ana-lyzed morphological traits vary uniquelywhen compared to the other tamarin spe-cies, as can be seen in their allometry vec-tors (Table 6). Large differences betweenthe covariance structure of S. geoffroyi andthe other species occur in the region of themidcrania, with negative values indicatingrelatively shortened cranial height (BR-APET), reduced zygomatic flaring (ZI-TSP),
and some marked reduction in other vari-ables of the zygomatic, oral, and nasal re-gions (ZYGO-TSP, EAM-ZYGO, MT-PNS,NA-FM). In fact, the overall pattern of theallometry vector differs in S. geoffroyi com-pared to the other tamarin species, suggest-ing that there is either a real difference incovariance pattern, or that the first princi-pal component of S. geoffroyi may not mea-sure the same morphological phenomenaseen within the other populations.
Matrix correlation analysis reveals a sim-ilar phenomenon to that seen in the resultsof the allometry examination (Table 7), withelementwise matrix correlations betweenthe correlation matrices of each speciesfound to be significant, though variable. Asexpected, the matrix of correlations (MxC)between the species correlation matricescorresponds with, and is correlated with,that found when comparing the first princi-pal component for each species (r 5 0.83,adjusted; P , 0.001). In both cases, S. fus-cicollis is most strongly correlated with S.midas and S. nigricollis, and less correlatedwith S. oedipus, S. mystax, and S. geoffroyi,in descending order. This pattern of rela-tionship is maintained throughout both theMxC and PC(1) between species compari-sons; generally, S. fuscicollis, S. midas, andS. nigricollis cluster closely together, S. my-
TABLE 4. Best AIC solutions for comparison of covariance matrices between each paired tamarin species1
S. fuscicollis S. nigricollis S. midas S. mystax S. geoffroyi S. oedipus
S. fuscicollis EqualityS. nigricollis CPC(6) EqualityS. midas Full CPC Full CPC EqualityS. mystax Full CPC Full CPC EqualityS. geoffroyi CPC(4) Full CPC Full CPC Full CPC EqualityS. oedipus CPC(6) CPC(7) Full CPC Full CPC Full CPC Equality1 Based on Flury’s hierarchy of tests (V0.95), step-up procedure (Flury, 1988; Phillips, 1998; Phillips and Arnold, 1999; Arnold andPhillips, 1999). The best solution under the model-building approach is indicated by the minimum value of the Akaike informationcriterion (AIC), and is shown for each comparison. The comparison between S. mystax and S. nigricollis was not possible for this setof variables (the matrices were “ill-formed,” due to high levels of dissimilarity in their relative eigenstructures).
TABLE 5. Correlations between the standardized first principal components (PC1) of the V/CV matrices for eachspecies
S. fuscicollis S. nigricollis S. midas S. mystax S. geoffroyi S. oedipus
S. fuscicollis 1.00S. nigricollis 0.95 1.00S. midas 0.97 0.90 1.00S. mystax 0.83 0.79 0.82 1.00S. geoffroyi 0.65 0.60 0.65 0.85 1.00S. oedipus 0.93 0.87 0.94 0.90 0.74 1.00
MORPHOLOGICAL VARIATION IN TAMARINS 495
stax and S. geoffroyi cluster together, andS. oedipus is somewhere between these twoclusters in terms of covariance patterns.The covariance/variation patterns of thespecies (in the form of adjusted MxC andPC(1)) are compared to morphological dis-
tances (D2) between the species means (Ta-ble 8); the results are mildly correlated(PC(1) and D2: r 5 20.43, P 5 0.086; MxCand D2: r 5 20.50; P 5 0.042; see Fig. 2).While it is difficult to assign meaning tothese values, certainly the similarity in pat-
TABLE 6. Allometry vectors of covariance matrices1
S. fuscicollis S. nigricollis S. midas S. mystax S. geoffroyi S. oedipus
IS-PM 0.384 0.390 0.426 0.704 0.598 0.465IS-NA 0.604 0.820 0.532 0.434 0.212 0.632IS-PNS 1.421 1.695 1.079 1.874 2.526 1.481PM-ZS 0.431 0.273 0.392 1.242 0.948 0.742PM-ZI 0.982 0.918 0.272 1.190 1.544 1.441PM-MT 0.812 0.656 0.688 1.174 0.656 1.063NSL-NA 0.112 20.013 0.112 0.138 20.075 20.121NSL-ZS 0.745 0.564 0.716 1.511 1.027 1.169NSL-ZI 1.522 1.407 1.522 1.417 1.383 1.874NA-BR 0.940 0.732 1.249 1.603 1.364 1.694NA-FM 0.547 0.976 0.694 1.773 1.474 0.980NA-PNS 1.424 1.503 1.540 1.413 1.134 1.248BR-PT 0.289 0.201 1.088 1.430 1.129 1.206BR-APET 0.716 0.642 1.144 0.118 21.016 1.032PT-FM 0.142 0.106 20.064 0.183 20.040 0.447PT-APET 1.403 0.838 1.562 1.539 1.292 1.407PT-BA 2.098 1.539 2.275 1.673 1.695 1.997PT-EAM 1.770 1.609 1.898 0.624 0.735 1.612PT-ZYGO 1.825 1.484 1.983 0.466 0.262 1.554PT-TSP 1.109 0.962 1.270 0.461 0.283 1.012FM-ZS 0.309 0.866 0.208 0.183 0.125 20.135FM-MT 0.950 1.144 1.094 0.834 0.558 0.838ZS-ZI 0.938 0.449 0.651 0.275 0.661 0.799ZI-MT 0.160 0.536 20.123 0.656 0.176 0.588ZI-ZYGO 0.645 1.446 1.107 0.329 0.595 0.721ZI-TSP 0.562 0.931 0.690 20.086 20.954 0.012MT-PNS 0.686 0.583 0.637 0.928 0.750 0.252PNS-APET 20.022 0.156 0.331 20.034 20.311 0.503APET-BA 0.728 0.577 0.599 0.352 0.435 0.564APET-TS 0.386 0.264 0.401 0.279 0.545 0.230BA-EAM 1.222 0.914 0.995 1.190 1.230 0.792EAM-ZYGO 0.143 20.052 0.378 0.200 20.492 0.141ZYGO-TSP 0.855 0.680 0.878 0.090 20.298 0.676LD-AS 0.476 0.659 0.608 1.611 1.625 0.721BR-LD 1.391 2.394 0.410 0.626 20.454 0.801OPI-LD 0.792 0.929 1.126 0.586 1.130 0.745PT-AS 2.091 1.860 1.759 1.524 0.248 1.130JP-AS 0.787 0.724 0.491 0.899 0.565 0.596BA-OPI 0.263 0.269 0.164 0.263 20.059 0.2561 The standardized first principal component for each species has been converted (divided by (1/=39)) to identify regions where thevariables diverge from isometry; values which are greater or less than 1.0 are positively or negatively allometric, respectively. Referto Table 1 for descriptions of landmarks used in the measurements.
TABLE 7. Correlations between correlation matrices for each pairwise tamarin species comparison1
S. fuscicollis S. nigricollis S. midas S. mystax S. geoffroyi S. oedipus
S. fuscicollis 0.90 0.88 0.88 0.74 0.56 0.77S. nigricollis 0.66 0.63 0.69 0.70 0.49 0.66S. midas 0.74 0.57 0.78 0.69 0.61 0.73S. mystax 0.62 0.49 0.53 0.77 0.87 0.77S. geoffroyi 0.51 0.37 0.52 0.72 0.91 0.71S. oedipus 0.66 0.47 0.58 0.61 0.61 0.811 The matrix displays three sets of data: raw matrix correlations in the lower left half of the matrix, adjusted correlations in the upperright half of the matrix, and matrix repeatabilities (in bold) on the diagonal. Each calculation is based on the population correlationmatrices, and is significant at P 5 0.0001.
496 R.R. ACKERMANN AND J.M. CHEVERUD

terning of the relationships is striking, andwill be further interpreted in light of thetamarin phylogenetic relationships foundby Cropp et al. (1999).
All six tamarin species fit the models oftotal morphological integration proposed byCheverud (1995), with primary contribu-tions from the higher correlations among
TABLE 8. Morphological distances (D2) between the means of all paired tamarin species
S. fuscicollis S. nigricollis S. midas S. mystax S. geoffroyi S. oedipus
S. fuscicollis 0.0S. nigricollis 9.2 0.0S. midas 26.7 21.5 0.0S. mystax 30.5 29.9 31.3 0.0S. geoffroyi 63.3 59.0 61.0 51.6 0.0S. oedipus 57.2 51.5 54.7 55.4 26.5 0.0
Fig. 2. Comparison of the three different methods used to compare tamarin species. Note that thecorrelation values (Y-axis) for each pairwise species comparison (X-axis) show a similar overall pattern,regardless of which method is used.
MORPHOLOGICAL VARIATION IN TAMARINS 497

traits in the oral region and cranial vault.This is consistent with the results of previ-ous analyses of S. fuscicollis and S. oedipus(Cheverud, 1995, 1996), and suggests that aconsistent pattern of total morphological in-tegration within the cranium may existmore broadly among members of the genusSaguinus.
DISCUSSION
Two general conclusions can be drawnfrom this analysis. The first stems from thestrict hypothesis testing approach of theCPC analysis, and states that the six spe-cies of tamarins vary uniquely; their pat-terns of variation and covariation are notequal, proportional, or similar in their ei-genstructure. The second, supported by thematrix correlation results and the AIC in-terpretation of the CPC analysis, states thatvariation between species is structurallysimilar, particularly between the first prin-cipal components of the V/CV matrices.Based on the CPC analysis alone, the hy-pothesis of constant covariance matricesmust be rejected. However, there are signif-icant correlations and shared principal com-ponent structures among the covariancematrices when other methods of analysisare used. Which methods tell the “correct”story?
Steppan (1997) compares the results ofCPC and correlation approaches, providinga discussion of the relative merits of the twomethods. To summarize, matrix correla-tions provide an easily interpretable, con-tinuously distributed statistic, which de-scribes overall similarity, while CPC doesnot; however, unlike CPC, they do not have
a direct statistical test for matrix identity(Steppan, 1997a). Small sample sizes canreduce matrix correlations, while they tendto cause acceptance of a higher degree ofshared covariance structure with CPC anal-ysis. Additionally, the accuracy of matrixcorrelations increases with increasing num-bers of characters, while the likelihood ofincorrectly rejecting common structure in-creases when using CPC with an increasingnumber of characters (Steppan, 1997a).
So while the varied results of this studyare contradictory, they are not necessarilymutually exclusive when viewed with aneye towards Steppan’s (1997a) conclusions.The CPC analysis results can be significantwithout being overly meaningful; it is pos-sible that when the CPC test is applied tothe task of evaluating data sets with largenumbers of variables, such as this tamarindata set, highly significant heterogeneitycan be found when there is only a smallamount of difference between two popula-tions. This is merely a function of degrees offreedom, and while it does not invalidatethe Flury test, it does suggest that it isprudent to perform it in conjunction withother tests of similarity or difference in or-der to better answer questions such as,“Yes, they are different, but precisely howdifferent?” or “Is this difference meaning-ful?”
With this in mind, the results open to newinterpretation. The tamarin species are un-doubtedly different, and each has its ownunique structure of variation and covaria-tion, as shown by the CPC analysis. Yetthey are also remarkably similar, with mod-erate to high correlations between each
TABLE 9. Morphological integration for each tamarin species, displayed as the correlation between thecorrelation matrices for each species and the morphological integration matrices
Total morphologicalintegration Cranial base Oral Nasal Cranial vault Zygomatic Orbit
S. fuscicollis 0.206*** 20.076* 0.203*** 0.014 0.198*** 20.010 20.085**S. nigricollis 0.133*** 20.044 0.234*** 20.006 0.041 0.000 20.046S. midas 0.189*** 20.425 0.079 0.010 0.217*** 0.002 20.063*S. mystax 0.153*** 20.069 0.200*** 0.007 0.150** 20.071* 20.067**S. geoffroyi 0.130*** 20.068* 0.066 20.002 0.166*** 0.031 20.034S. oedipus 0.184*** 20.015 0.195*** 0.055 0.128** 20.025 20.089***
* Significant at P , 0.10.** Significant at P , 0.05.*** Significant at P , 0.01.
498 R.R. ACKERMANN AND J.M. CHEVERUD

pairwise species comparison of their V/CVmatrices. This measure of overall similaritycan be further dissected to show that theyare most similar in the structure of theirfirst principal component, that patterns ofcorrelation within each species are them-selves highly correlated, and that generalpatterns of morphological integration areconsistent between the species.
Evidence from molecular studies (Croppet al., 1999) and analysis of feeding adapta-tions (Garber, 1992) supports the division ofSaguinus into two major clades, with S. fus-cicollis and S. nigricollis in one clade, andthe remaining species in a second. The pat-terning of morphological similarity, shownby the results of the matrix correlations(MxC), corresponds somewhat with the mo-lecularly derived phylogenetic relationshipsbased on the molecular mtDNA evidence ofCropp et al. (1999) (see Fig. 3). S. fuscicollisand S. nigricollis, both members of the small-bodied clade of Cropp et al. (1999), are consis-tently closely associated via morphologicalvariation. Cropp et al. (1999) place S. midasand S. mystax within the large-bodied cladewith S. oedipus and S. geoffroyi. While themorphological evidence shown here also sup-ports a close relationship between S. oedipus,S. geoffroyi, and S. mystax, in the morpholog-ical analyses (MxC), S. midas is most similarto S. fuscicollis, supporting a fuscicollis/nigri-collis/midas grouping. This general patternis reinforced through further examination ofthe eigenstructure of the first principal com-ponent, and corresponds with the morpho-logical distances (D2) obtained between thespecies means. So, despite the evidence thatS. midas is not phylogenetically closely re-lated to the small-bodied tamarins, it doeshave a pattern of morphological variationwhich is similar to that found in the small-bodied tamarins—and, indeed, it does looklike them. These results suggest that bothcranial morphology and, to some extent,patterns of morphological variation, mayhave been reorganized during the diversifi-cation of the large-bodied clade.
Overall, matrix correlation results aresupported by closer examination of eigen-structure and by measures of morphologicaldistances. Additionally, matrix correlation
demonstrates that the patterns of variationand covariation between the tamarin spe-cies are, at least in part, consistent withtheir molecularly derived phylogenetic his-tory (Cropp et al., 1999), as well as theirrelationships determined from studies offeeding behavior (Garber, 1992). Returningto the CPC analysis, the same patterns canbe teased from the results even though theresults themselves were not “significant.”When the AIC was used to identify commonstructure, shared full principal componentstructure was observed between a numberof species pairs. Interestingly, two of thespecies (S. oedipus and S. geoffroyi) distin-guished from the others in the CPC analysisdue to less structural similarity in principalcomponent structure are among those found
Fig. 3. Cluster diagrams representing hypotheticalphylogenetic relationships among tamarin species, asreconstructed from four different sources. A: Mitochon-drial sequence data (Cropp et al., 1999). B: Matrix cor-relation analysis (MxC). C: Correlations between thefirst principal components of the covariance matrices(PCI). D: Morphological distances between group means(D2).
MORPHOLOGICAL VARIATION IN TAMARINS 499

to be most different using the matrix corre-lation method, and are sister species inCropp et al. (1999).
CONCLUSIONS
Two methods for analyzing the degree ofsimilarity between patterns of covariationproduce very different objective resultswhen applied to the task of evaluating dif-ferences in cranial-facial morphologicalvariation patterns of six closely related spe-cies of New World monkeys. However, thestrengths and shortcomings of matrix corre-lation and CPC methods appear comple-mentary (not a surprising consequence,since one is grounded in evaluating similar-ity and the other in difference), making theuse of both for analyzing the relationshipsbetween covariance matrices prudent. Suchbroader assessment of the tamarin covaria-tion patterns shows that both methods canbe simultaneously useful and correct; whilethe species are significantly different (CPCanalysis), this difference does not precludethe possibility of moderate to high overallsimilarity (matrix correlation analysis), aswell as allometric similarity (excluding S.geoffroyi) and similarity in patterns of mor-phological integration.
General patterns of mammalian cranialgrowth and development, such as disjunc-tion of the neural and somatic growth sys-tems, may result in common patterns ofmorphological integration across mam-mals— patterns which have been found invarious species of primates and rats (Chev-erud, 1982, 1995; Zelditch, 1988; Zelditchand Carmichael, 1989; Zelditch et al., 1990).The existence of a common pattern of mor-phological integration between the tamarinspecies is closely linked to the presence ofcommon correlation patterns, so our detec-tion of strong correlations between thetamarin species is not surprising.
However, the presence of discernible (andsignificant) differences in correlation/covari-ance structure at this species level of compar-ison cautions against uncritical extrapolationof constancy to other taxonomic levels. Othershave found that the variation in correlationpattern in subspecific populations does notrelate to phylogenetic or geographic relation-
ships (Riska, 1985; Wagner, 1989), suggestingthat at lower taxonomic levels the variationmay be random and perhaps controlled byevolutionary processes such as genetic drift(Cheverud et al., 1989; Riska, 1985; Steppan,1997b). Certainly changes in covariance andcorrelation patterns could be associated withmajor shifts in function, or with pronouncedmorphological divergence between organismsthrough evolutionary time. Similarity in thepatterns of correlation/covariance was shownto relate somewhat to the phylogeny of thetamarin species being considered, althoughthe meaning of this needs to be explored fur-ther. Conversely, this study does find a degreeof correspondence between the covariationpatterns of the tamarin species and their phy-logenetic history, providing some evidence fordirectionality in the divergence of variance/covariance structure through evolutionarytime at higher taxonomic levels. This can beinterpreted as evidence that whether or notpatterns of covariation behave predictablyover macroevolutionary time, or even if theyare similar, the assumption that they are con-stant is open to question.
ACKNOWLEDGMENTS
We thank those who provided generoushelp and access to the tamarin skeletal ma-terial: B. Patterson, S. Stanley, and L.Heaney (Field Museum of Natural History,Chicago), R. Thorington and R. Chapman(National Museum of Natural History), S.Tardiff and F. Smith (University of Tennes-see), P.E. Vanzolini (Museu de Zoologia,University of Sao Paolo), R. MacPhee(American Museum of Natural History),and the staff at the British Museum of Nat-ural History. Special thanks are due to S.Cropp for her contributions to the collectionand analysis of the tamarin data, to T.Vaughan for his comments on earlier draftsof the manuscript, to P. Phillips for his helpwith interpreting the results of the CPCanalyses, and to two anonymous reviewerswhose remarks greatly improved the finalproduct.
LITERATURE CITED
Arnold SJ. 1992. Constraints on phenotypic evolution.Am Nat 140:85–107.
500 R.R. ACKERMANN AND J.M. CHEVERUD

Arnold SJ, Phillips PC. 1999. Hierarchical comparisonof genetic variance-covariance matrices. II. Coastal-inland divergence in the garter snake Thamnophiselegans. Evolution 53:1516–1527.
Cheetham AH, Jackson JBC, Hayek L-AC. 1993. Quan-titative genetics of bryozoan phenotypic evolution. I.Rate tests for random changes versus selection indifferentiation of living species. Evolution 47:1526–1538.
Cheverud JM. 1982. Phenotypic, genetic, and environ-mental morphological integration in the cranium.Evolution 36:499–516.
Cheverud JM. 1988. A comparison of genetic and phe-notypic correlations. Evolution 42:958–968.
Cheverud JM. 1995. Morphological integration in thesaddle-back tamarin (Saguinus fuscicollis) cranium.Am Nat 145:63–89.
Cheverud JM. 1996. Quantitative genetic analysis ofcranial morphology in the cotton-top (Saguinus oedi-pus) and saddle-back (S. fuscicollis) tamarins. J EvolBiol 9:5–42.
Cheverud JM, Rutledge JJ, Atchley WR. 1983. Quanti-tative genetics of development: genetic correlationsamong age-specific trait values and the evolution ofontogeny. Evolution 46:1965–1967.
Cheverud JM, Wagner GP, Dow MM. 1989. Methods forthe comparative analysis of variation patterns. SystZool 38:201–213.
Cropp SJ, Larson A, Cheverud JM. 1999. Historicalbiogeography of tamarins, genus Saguinus: the mo-lecular phylogenetic evidence. Am J Phys Anthropol108:65–89.
Ferrari SF. 1993a. The adaptive radiation of Amazo-nian callitrichids (Primates, Platyrrhini). Evol Biol7:81–103.
Ferrari SF. 1993b. Ecological differentiation in the Cal-litrichidae. In: Rylands AB, editor. Marmosets andtamarins: systematics, ecology, and behaviour. NewYork: Oxford University Press. p 314–328.
Flury B. 1988. Common principal components and re-lated multivariate models. New York: Wiley.
Garber PA. 1992. Vertical clinging, small body size, andthe evolution of feeding adaptations in the Callitri-chinae. Am J Phys Anthropol 88:469–482.
Hershkovitz P. 1977. Living New World monkeys(Platyrrhini), volume 1. Chicago: University of Chi-cago Press.
Jolicoeur P. 1963. The degree of generality of robustnessin Martes americana. Growth 27:1–27.
Kohn LAP, Atchley WR. 1988. How similar are geneticcorrelation structures? Data from mice and rats. Evo-lution 42:467–481.
Koots KR, Gibson JP. 1996. Realized sampling vari-ances of estimates of genetic parameters and the dif-ference between genetic and phenotypic correlations.Genetics 143:1409–1416.
Lande R. 1979. Quantitative genetic analysis of multi-variate evolution, applied to brain:body size allome-try. Evolution 33:402–416.
Phillips PC. 1998. CPC: common principal componentsanalysis. University of Texas at Arlington. Softwareavailable at www.uta.edu/biology/phillips/software.
Phillips PC, Arnold SJ. 1999. Hierarchical comparisonof genetic variance-covariance matrices. I. Using theFlury hierarchy. Evolution 53:1506–1515.
Price TD, Grant PR, Boag PT. 1984. Genetic changes inthe morphological differentiation of Darwin’s groundfinches. In: Wohrmann K, Loescheke V, editors. Pop-ulation biology and evolution. Berlin: Springer. p 50–66.
Riska B. 1985. Group size factors and geographic vari-ation of morphometric correlation. Evolution 39:792–803.
Roff DA. 1995. The estimation of genetic correlationsfrom phenotypic correlations—a test of Cheverud’sconjecture. Heredity 74:481–490.
Roff DA. 1996. The evolution of genetic correlations: ananalysis of patterns. Evolution 50:1392–1403.
Steppan SJ. 1997a. Phylogenetic analysis of phenotypiccovariance structure. I. Contrasting results from ma-trix correlation and common principal componentanalysis. Evolution 51:571–586.
Steppan SJ. 1997b. Phylogenetic analysis of phenotypiccovariance structure. II. Reconstructing matrix evo-lution. Evolution 51:587–594.
von Hoffmannsegg G. 1807. Beschreibung vier affenar-tiger Thiere aus Brasilian. Mag Gesellsch Naturt FrBerl 1:83–104.
Wagner GP. 1989. A comparative study of morphologi-cal integration in Apis mellifera. Z Zool Syst Evolu-tionforsch.
Zelditch M. 1988. Ontogenetic variation in patterns ofphenotypic variation in the laboratory rat. Evolution42:28–41.
Zelditch M, Carmichael A. 1989. Ontogenetic variationin patterns of developmental and functional integra-tion in skulls of Sigmodon fulviventer. Evolution 43:814–824.
Zelditch M, Straney DO, Swiderski D, Carmichael A.1990. Variation in developmental constraints in Sig-modon. Evolution 44:1738–1747.
MORPHOLOGICAL VARIATION IN TAMARINS 501