Embed Size (px)
Citation preview

Compatibilitatea electromagnetică în structuri Smart Grid
Universitatea POLITEHNICA din București
Școala Doctorală de Inginerie Electrică
PhD THESIS Electromagnetic Compatibility in Smart Grid Structures
Summary
Key-words: Smart Grid, electromagnetic compatibility, renewable energy sources, prosumers, energy storage systems, harmonic distortion, optimization mathematical models.
PhD student: ing. Alexandra Cătălina SIMA
PhD advisor: Prof. PhD. ing. Mihai Octavian POPESCU
Bucharest 2021

2
Contents Index .................................................................................................................................. 4
Introduction ........................................................................................................................ 6
1. Smart Grid: functions and electromagnetic compatibility ............................................ 8
1.1. Smart Meters .................................................................................................................. 8
1.2. Prosumers ...................................................................................................................... 8
1.3. Artificial intelligence ....................................................................................................... 9
1.4. Power sources based on wind energy ............................................................................. 9
1.5. Power sources based on solar energy ............................................................................. 9
1.6. Distribution systems in Smart Grid .................................................................................. 9
1.7. The interconnection of renewable energy sources to the public power system ............. 10
1.8. Energy storage systems ................................................................................................ 11
1.9. Electromagnetic compatibility ...................................................................................... 11 1.9.1. Influence or interference ............................................................................................................... 11 1.9.2. Electromagnetic disturbing phenomena ....................................................................................... 11 1.9.3. Types of couplings ......................................................................................................................... 11 1.9.4. Power quality ................................................................................................................................. 11
2. Mathematical optimization models and case studies in Smart Grid ........................... 13
2.1. Investment planning in transmission lines and generating units (Generation and Transmission Expansion Planning - G & TEP) ............................................................................. 13
2.1.1. The mathematical model of G&TEP problem ................................................................................ 13
2.2. Transmission expansion planning problem (TEP) Considering the Integration of Energy Storage Systems ........................................................................................................................ 15
2.2.1. The mathematical model related to the TEP problem considering the integration of energy storage systems 15
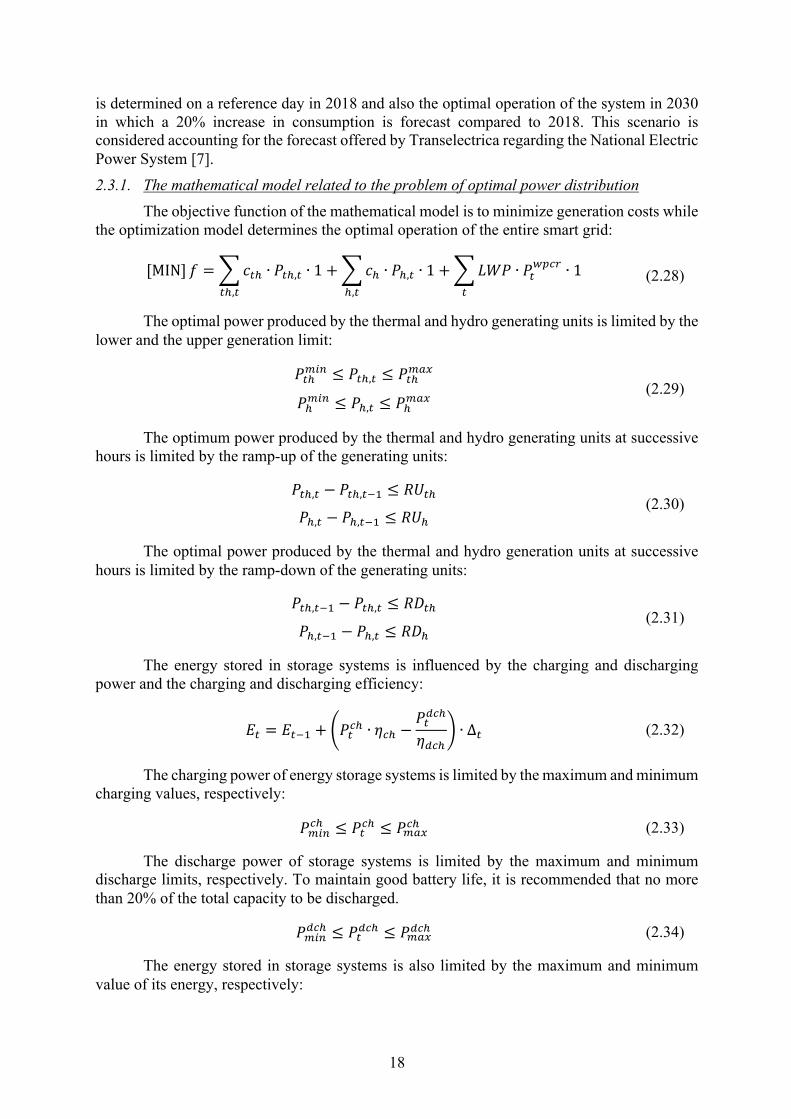
2.3. Optimal economic dispatch in a smart grid ................................................................... 17 2.3.1. The mathematical model related to the problem of optimal power distribution ......................... 18
2.4. Smart grid data ............................................................................................................. 19
2.5. Results .......................................................................................................................... 19 2.5.1. Results of G&TEP ........................................................................................................................... 19 2.5.2. The results of the TEP problem considering the integration of energy storage systems .............. 20 2.5.3. Economic dispatch results ............................................................................................................. 20
3. Operation analysis of the Smart Grid pilot system ..................................................... 23
3.1. UMC smart grid data ..................................................................................................... 23 3.1.1. Characteristic data of smart grid components .............................................................................. 23 3.1.2. Modeling of smart grid components ............................................................................................. 24
3.2. Smart grid operation simulation results ........................................................................ 27
3
3.2.1. Analysis of the results obtained using Homer Pro software .......................................................... 27 3.2.2. Experimental results on distortion regime in Smart Grids ............................................................. 29
4. Conclusions and personal contributions ..................................................................... 32
References ........................................................................................................................ 37

4
Index
Notations related to optimization problems Indexes:
𝑏 – buses; 𝑑 – supplied consumers; 𝐸𝑆𝑆 – storage energy systems; ℎ – hydro generating units; 𝑙 – transmisison lines; 𝑠 – considered scenarios; 𝑠𝑜 – system opertaion conditions; 𝑡ℎ – thermal generating units; 𝑤𝑝 – wind generating units.
Sets: 𝑑! – users supplied from bus b; ℎ! – hydro generating units connected to bus b; 𝑙" – transmission lines to be built; 𝑟(𝑙) – consumer bus; 𝑠(𝑙) – generation bus; 𝑡 – time; 𝑡ℎ! – thermal generating unit connected to bus b; 𝑤𝑝! – wind unit connected to bus b.
Parameters: 𝜋# – probability of scenario 𝑠 [p.u.]; 𝐵$ – transmission line susceptance 𝑙 [S]; 𝑐%&& – production costs of storage energy systems 𝐸𝑆𝑆 [€/MWh]; 𝑐' – production costs of hydro unit ℎ [€/MWh]; 𝐶$ – maximum transmission capacity of line 𝑙 [MW]; 𝑐(&) – shedding costs of load d [€/MWh]; 𝑐*' – production costs of thermal unit 𝑡ℎ [€/MWh]; 𝑐+" – production costs of wind unit 𝑤𝑝 [€/MWh]; 𝐺%&&,' – charging limit of 𝐸𝑆𝑆 [MW]; 𝐺%&&)-#,' – discharging limit of 𝐸𝑆𝑆 [MW]; 𝐺' – hydro generating unit capacity ℎ [MW]; 𝐺*' – thermal generating unit capacity𝑡ℎ [MW]; 𝐺+" – wind generating unit capacity𝑤𝑝 [MW]; 𝐿* – load at time 𝑡; 𝐼𝐵%&& – investment budget in storage systems [€]; 𝐼𝐵( – investment budget in new transmission lines [€]; 𝐼𝐵+" – investment budget in wind generating units [€]; 𝐼𝐶%&& – investment cost for storage energy systems 𝐸𝑆𝑆; 𝐼𝐶( – investment costs for new transmission 𝑙 [€]; 𝐼𝐶+" – investment costs for wind power plants 𝑤𝑝 [€/MW]; 𝐿) – demand of load d [MW]; 𝐿𝑉%&&.-/ – minimum discharging level of 𝐸𝑆𝑆 [MWh]; 𝐿𝑉%&&.01 – maximum charging level of 𝐸𝑆𝑆 [MWh]; 𝐿𝑊𝑃 – associated costs with spilled wind; 𝑃+".01 – maximum capacity of new wind generating unit 𝑤𝑝 [MW];

5
𝑃.01,' – maximum charging limit of ESS at time 𝑡; 𝑃.-/,' – minimum charging limit of ESS at time 𝑡; 𝑃.01),' – maximum discharging limit of ESS at time 𝑡; 𝑃.-/),' – minimum charging limit of ESS at time 𝑡 𝑃'.01 – maximum production capacity of hydro units ℎ at time 𝑡; 𝑃*'.01 – maximum production capacity of thermal units 𝑡ℎ at time 𝑡; 𝑃'.-/ – minimum production capacity of hydro units ℎ at time 𝑡; 𝑃*'.-/ – minimum production capacity of thermal units 𝑡ℎ at time 𝑡; 𝑅𝑈' – ramp-up of hydro unit ℎ; 𝑅𝑈*' – ramp-up of thermal unit 𝑡ℎ; 𝑅𝐷' – ramp-down of hydro unit ℎ; 𝑅𝐷*' – ramp-down of thermal unit 𝑡ℎ; 𝐸.01 – maximum energy stored in ESS [kWh]; 𝐸.-/ – minimum energy stored in ESS [kWh]; 𝜎#2 – share of operating system condition 𝑠𝑜 [h]; 𝜂%&& – conversion efficiency of ESS; 𝜂,' – charging efficiency of ESS; 𝜂),' – discharging efficiency of ESS; 𝜏 – time period (1 h).
Binary variable: 𝑢$ – binary variable is 1 if the new l line is build and 0; Λ*+" – availability of wind units 𝑤𝑝 at moment 𝑡.
Continuous variable: 𝐺+" – capacity of new wind unit 𝑤𝑝 [MW]; 𝐿𝑆) – load shedding of end-user 𝑑 [MW]; 𝐿𝑉%&& – charging level of 𝐸𝑆𝑆 [MWh]; 𝑃*,' – charging power of ESS at time 𝑡; 𝑃*),' – discharging power of ESS at time 𝑡; 𝑃%&&,' – charging power of 𝐸𝑆𝑆 [MW]; 𝑃%&&)-#,' – discharging power of 𝐸𝑆𝑆 [MW]; 𝑃+" – produced power by wind unit 𝑤𝑝 [MW]; 𝑃' – produced power by hydro unit ℎ [MW]; 𝑃',* – produced power by wind units at time 𝑡; 𝑃*' – power produced by thermal unit 𝑡ℎ [MW]; 𝑃*',* – power produced by thermal unit 𝑡ℎ at time 𝑡; 𝑃*+",4 – spilled power from wind units at time 𝑡; 𝑃+",* – power produced by wind units 𝑤𝑝 at time 𝑡; 𝑃𝐹$ – transmisison line power flow [MW]; 𝐸* – storaed energy is ESS at time 𝑡; q! – phase shoft angle of voltage at bus 𝑏 [rad].

6
Introduction
In Europe, a reduction of at least 55% in pollutant emissions has been set, compared to 1990, which must be achieved by 2050. Europe, through The European Green Deal aims to be the first continent in 2050 where energy production will be achieved without polluting emissions [1]. To reduce pollutants, the installation of new renewable energy sources (RES) is encouraged, which can ensure a major reduction in the level of pollution caused by the generation and use of electricity [2]. Renewable energy is produced by converting renewable natural energy into one that can be used by consumers. One of the advantages of these sources is that do not emit pollutant emissions, but a major disadvantage is the intermittent nature that does not provide security of the supply and in this context can be used storage systems [3], [4].
The transmission network is a natural monopoly (where competition does not make sense) and is used by all producers and consumers to exchange electricity. Consumption is constantly increasing, the infrastructure of the electric power system is aging, the limitations on pollutant emissions that lead to shut down certain plants that do not meet the requirements determines the need to plan investments in transmission lines, generating units and energy storage units. The transport system operator (in Romania, Transelectrica) wants to facilitate the exchange of energy between producer and consumers, to increase the supply security and to maximize social welfare while minimizing total operating and investment costs. The National Energy Dispatcher is responsible for the safe operation of the electricity system, given the presence of the electricity market and the emergence of imbalances between consumption and production covered by the balancing market. The electricity market operator (in Romania, OPCOM) is responsible for programming the operation of power generators, while the national energy dispatcher economically distributes the power produced to maintain the balance between production and consumption, considering the constraints in the power system.
Smart grids effectively integrate energy and data communications users connected to it to minimize its operating costs. Smart grids have many users and achieve cost-effective management [2], [5].
The doctoral thesis "Electromagnetic compatibility in Smart Grid structures" proposes different optimization models that are implemented and studies the development of Smart Grid networks when investments are needed in generating units and network elements to supply consumers so as to minimize investment and operation costs in the presence of renewable sources of stochastic nature and energy storage systems whose integration into power systems will increase significantly in the coming years due to the European Green Deal. It is also proposed a small-scale Smart Grid network with renewable energy sources, energy storage systems, a diesel generator that supplies a university campus. The Smart Grid network is analyzed in terms of optimal operation, with minimal costs, as well as the electromagnetic compatibility of the devices interconnected to it. The low-power Smart Grid network can be considered an integral part of a large network that requires optimal investments in transport and generation to ensure system resilience considering the uncertainty of renewable energy production. The analysis is intended to validate by simulation the structure of the smart grid that is implemented at the Maritime Base in Constanța. Different operation case studies of the Smart Grid system are analyzed, on and off grid operation, at the variation of the input parameters, which would be almost impossible to achieve in practice.
The structure of the doctoral thesis follows the natural logic of the development of the phenomenon: in the presence of renewable energy sources, a series of devices with different operating profiles are part of the Smart Grid network. This network requires optimal operation with minimal costs and a high degree of electromagnetic compatibility. The integration of these
7
small smart grids into the power system requires adequate mathematical models to optimize the development of transmission and generation facilities to ensure the resilience and adequacy of the energy system.
Chapter 1 entitled Smart Grid: functions and electromagnetic compatibility describes the smart grid along with its components and prosumers. Subsequently, renewable energy sources based on wind, solar and storage energy systems and their connection to the grid are described separately. Also, electromagnetic compatibility is defined, the types of couplings (inductive, capacitive and by electromagnetic radiation) and harmonic distortion are analyzed.
Chapter 2 entitled Mathematical optimization models and case studies in Smart Grid describes several optimization problems, namely, the generation and transmission expansion problem, the transmission expansion planning problem considering energy storage systems and the optimal economic dispatch problem. These problems are developed in the presence of renewable energy sources and applied on a smart grid that is similar to a real one located in southeastern part of Romania. The mathematical models elaborated for each problem are described, as well as the results of their application on the analyzed intelligent network. The optimal solution is presented as well as the value of the objective function for the analyzed cases. The proposed and implemented optimization problems aim to study the development of Smart Grid networks when investments in generating units and network elements are needed to supply consumers to minimize investment and operating costs in the presence of renewable sources that have a stochastic character and of energy storage systems whose integration into power grids will increase significantly in the coming years due to the European Green Deal.
Chapter 3 Operation analysis of the Smart Grid pilot system analyzes a real intelligent electrical network, located at the Maritime Base of Constanța, part of the University Maritima of Constanta. On and off grid operation are considered. The situation in which electricity is injected into the public power system, for a fee, when Maritime Base of Constanța becomes a prosumer is considered. The possibility of expanding the smart grid is also analyzed, highlighting the importance of prosumers for the system to be profitable. An analysis of the harmonic distortion in the presented smart grid is also performed. The analysis is intended to validate by simulation the structure of the smart grid implemented at the Maritime Base of Constanța which contains both renewable and conventional sources that use fossil fuels. During this analysis, different cases of operation of the Smart Grid system were made, due to the variation of the input parameters, which would be almost impossible to achieve in practice. The results of the simulations demonstrate the correct operation of the entire system in on and off grid operation.

8
1. Smart Grid: functions and electromagnetic compatibility
In a Smart Grid network (Figure 1.2) there is a two-way communication between the generation source and the consumer, the consumer (prosumer) is able to exchange energy with the network. Information on the production, consumption and condition of the storage unit need to be known in real time for the system to function properly, so there is a need to use Smart Meters [8], [9].
Figure 1.2 The structure of Smart Grid
The official definition of smart grids at international level is: Smart grids are power grids, which with the help of a concrete management, support for the requirements of the near future, bidirectional communication, in real time, between network components: producers, energy storage units and consumers through an energy-efficient and cost-effective system [8].
The need for the power system to be safe to operate, energy efficient and sustainable through the use of renewable energy sources and storage systems, with bidirectional exchanges of energy and data has led to the emergence and development of the Smart Grid. The smart grid is an energy efficient, dynamic system with difficult technological features [8].
1.1. Smart Meters Smart meters are part of smart grids that are needed for automatic processing, transfer,
management and use of measured data. They provide relevant and on time information about consumption and their systems to network participants, including the consumer [11]. The existence of two-way communication offers the possibility to transform the consumer into a prosumer.
1.2. Prosumers An important element in Smart Grid systems are the prosumers who consume/produce
services and products. This type of consumer requires a two-way connection to be able to consume and inject energy from and into the grid. The active participation of prosumers in the operation of the energy system increases competition in the energy market and can contribute to lower electricity prices, thus improving supply safety. Also, the exchange of energy between prosumers and the grid is necessary to increase energy efficiency (achieving the balance between production and efficient consumption) and also the efficient use of the public electricity grid for the production and decentralized storage of electricity using renewable energy sources that contribute to reducing pollutant emissions and meeting the targets set for their reduction. Energy exchange between prosumers can reduce the need for distribution

9
expansions. As links between users exist, the surplus of the prosumer can be exchanged with a prosumer who is in deficit [12]. To achieve energy exchange with the grid, a prosumer can use photovoltaic panels, small wind turbines, thus helping to reduce pollutant emissions.
1.3. Artificial intelligence In smart grids, existing communication and information technologies automatically
react to changes that occur and increase the efficiency, reliability and sustainability of electricity production and distribution [17]. Artificial intelligence techniques such as expert systems, fuzzy logic and artificial neural networks have contributed to the development of the field of power electronics and power systems. These techniques provide powerful tools for design, simulation, control, estimation, fault diagnosis and fault control in smart grids and grids using renewable energy sources [18].
1.4. Power sources based on wind energy The movement of air masses causes the rotation of the turbine blades that drive the
electric generator transforming the kinetic energy of the wind into mechanical and electrical energy. The electric generator transforms the mechanical energy into electrical energy, the obtained electric current being alternative current.
Wind power plants (WPPs) have developed the most compared to other renewable energy sources. Starting with 2010, the installed capacity in the WPPs increases and reaches in 2011 approximately 820 MW installed, in 2016 approximately 2978 MW installed, and in 2020 3024 MW installed. In general, the power of a wind turbine is between about 2MW and 4MW.
1.5. Power sources based on solar energy The conversion of solar energy into electricity is based on the internal photoelectric
phenomenon, the solar energy being used in a direct way. The electric current resulting from the conversion of solar energy is direct current. These systems have developed intensely due to environmental regulations. The first use of these installations was mentioned for powering the first American satellites [2]. In 2013, the installed capacity in photovoltaic power plants was 1124 MW, and in 2020 1392 MW.
The orientation of the photovoltaic panels is important for optimal use of the equipment, it must be positioned so that the sun's rays are incident on the surface of the panel.
1.6. Distribution systems in Smart Grid The use of a DC power systems (Figure 1.8 (a)) may offer advantages over the use of
an AC power systems (Figure 1.8 (b)). In the event of a failure of the public network, the local power system is disconnected via the interface device (2) in Figure 1.8 (a) and (b), after which the generators can continue, if properly sized, to supply the local loads off-Grid.
In the case of the DC power system, the AC/DC converter (1) in Figure 1.8 (a) disconnects the 50 Hz power system from the DC power system, it can still be powered by existing generators and storage systems. Off-Grid control of the DC power system is simpler then the off-Grid control of the AC power system because it is necessary to control a single parameter, the voltage and it is not necessary to maintain the frequency of 50 Hz. The AC power system uses more converters than the DC one even if in the case of the DC power system it is necessary to use the AC/DC interface converter (1), dimensioned for the total load.
DC/DC converters are simpler and use fewer semiconductor elements than AC/DC converters or DC/AC ones. A large number of converters negatively affect the power quality, so from the point of view of energy efficiency, the use of a DC network can be more advantageous. The unique AC/DC converter which is the interface of sensitive users and/or

10
distributed generation, allows easier control of harmonic disturbances that are usually injected by loads and generators into the 50 Hz power system. In a DC power system, the power quality is higher with a stabilized voltage and not influenced by voltage variations in the public supply network. Voltage sags could be compensated without the existence of storage facilities in the 50 Hz network, following certain DC voltage control strategies in the case of the interface converter (1) and also the use of capacitors [2].
(a)
(b)
Figure 1.8 Comparison between DC (a) and AC (b) distribution system
1.7. The interconnection of renewable energy sources to the public power system The connection of renewable sources in national power system is done [2]: - In 20 kV power systems for installed capacities below 10 MW; - In 110 kV power system for installed powers up to 100…150 MW;

11
- In the transport system (220kV and 400 kV) for installed powers of 300…1000 MW.
1.8. Energy storage systems Regulations on the limitation of pollutant emissions are becoming stricter, the share of
renewable energy sources is constantly increasing. The operation of power plants using renewable energy determines conventional power plants to operate at partial load or are turned-off, with renewable sources having priority in covering the load curve. These renewable sources are intermittent energy sources and to be able to provide increased security in the supply of consumers, the existence of power reserves is necessary. This need arises because between the production and consumption of energy, between available and necessary there are mismatches of time and quantity. Part-load operation, starting and stopping of conventional power plants increases costs and decreases the life of equipment in power plants. Thus, the use of energy storage devices is becoming more widely used, important and improved [2].
1.9. Electromagnetic compatibility The International Electrotechnical Commission defines EMF as "the ability of a piece
of equipment or system to function satisfactorily in its electromagnetic environment without introducing intolerable electromagnetic disturbances into its surroundings" [10].
1.9.1. Influence or interference Interference is felt at the receiver, this statement refers to the fact that electromagnetic
energy from other transmitters (apart from the transmitter intended for the receiver in question) influences (modifies or interferes) a useful signal [24].
1.9.2. Electromagnetic disturbing phenomena Nonlinear loads (power electronics) cause harmonic electric currents that flow through
the impedances of the power supply lead to harmonic voltage distortion. In the case of low voltage networks there are a large number of devices based on power electronics.
1.9.3. Types of couplings The couplings produce the influence or even the interference of the useful signal [24]. The galvanic coupling that occurs between two electrical circuits that share a portion of
the circuit. Inductive coupling occurs due to the influence of static or time-varying magnetic fields.
The inductive coupling is also called "transformer coupling" because the estimation of the interface is possible with the help of transformer operating expressions.
Capacitive coupling occurs due to the influence of static or time-varying electric fields. The capacitive coupling is determined by the existence of parasitic capacitances.
Electromagnetic radiation coupling occurs when the interference signal is caused by the electromagnetic radiation field.
1.9.4. Power quality Renewable energy sources produce harmonic distortions, they are connected to the
electricity grid through converters. Photovoltaic panels, wind turbines with generators operating at variable frequencies, electricity storage systems include sources at t.c. requiring converters (inverter), frequency-controlled voltage of the mains to which the source is connected [9].
The evaluation of the non-sinusoidal regime determined by the presence of converters is performed with the help of total harmonic voltage and current distortion. The total distortion factor THD (Total Harmonic Distortion) is based on the effective value of the amplitude of the harmonics in the current curve [23].
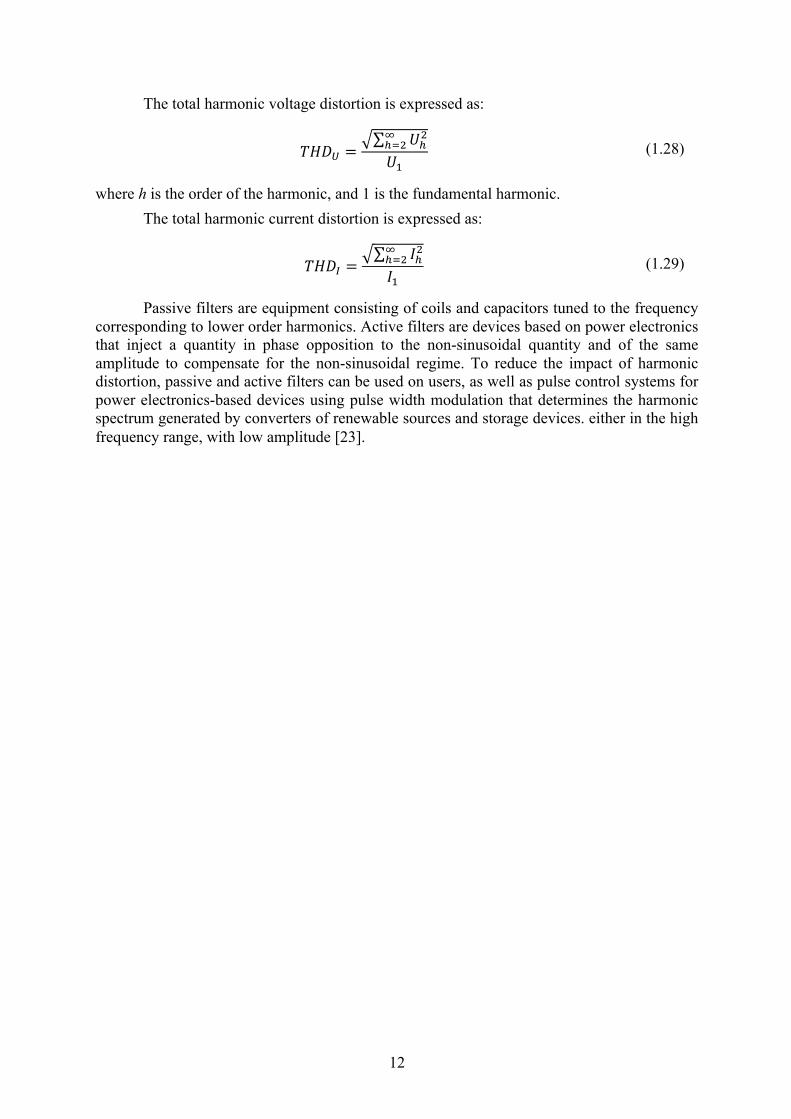
12
The total harmonic voltage distortion is expressed as:
𝑇𝐻𝐷5 =E∑ 𝑈'67
'86𝑈9
(1.28)
where h is the order of the harmonic, and 1 is the fundamental harmonic. The total harmonic current distortion is expressed as:
𝑇𝐻𝐷: =E∑ 𝐼'67
'86𝐼9
(1.29)
Passive filters are equipment consisting of coils and capacitors tuned to the frequency corresponding to lower order harmonics. Active filters are devices based on power electronics that inject a quantity in phase opposition to the non-sinusoidal quantity and of the same amplitude to compensate for the non-sinusoidal regime. To reduce the impact of harmonic distortion, passive and active filters can be used on users, as well as pulse control systems for power electronics-based devices using pulse width modulation that determines the harmonic spectrum generated by converters of renewable sources and storage devices. either in the high frequency range, with low amplitude [23].

13
2. Mathematical optimization models and case studies in Smart Grid
This chapter describes several optimization problems: the generation and transmission expansion planning (G&TEP) problem, transmission expansion planning problem considering energy storage systems and the optimal economic dispatch. These problems are developed in the presence of renewable energy sources. To calculate the optimal solution, in the case of the problems analyzed in this chapter, the GAMS optimization program (The General Algebraic Modeling System) is used, which uses the branch-and-bound algorithm to solve the problems described in this paper. The proposed and implemented optimization problems aim at studying the development of Smart Grid networks when investments are needed in generating units and network elements to supply consumers so as to minimize investment and operating costs in the presence of stochastic renewable sources. and electricity storage systems whose integration into electricity networks will increase significantly in the coming years due to the European ecology package.
The analysis performed in this chapter is performed on a smart grid similar to a real electricity grid, located in the southeastern part of Romania, where there are favorable wind conditions for the integration of wind generation units.
In this work are used storage systems with Li - Ion batteries with a conversion efficiency of 0.9 and is considered the aggregate storage capacity, the location of each storage system is presented below.
2.1. Investment planning in transmission lines and generating units (Generation and Transmission Expansion Planning - G & TEP)
In the analyzed G&TEP problem, the increase in consumption until 2030 is considered. Three scenarios regarding this increase are also considered, considering the use of electric cars and electrical equipment for end users [51]. In real cases, scenarios with an evolution of random consumption until 2030 are of interest. The investment decision is made at the beginning of the planning horizon, in this case the planning horizon is considered equal to 11 years (starting with 2019). The mathematical model presented is used by the transport operator.
2.1.1. The mathematical model of G&TEP problem The objective function (2.1) of the mathematical model is to minimize generation costs, consumer disruption costs and investment costs is:
[𝑀𝐼𝑁]𝑓 =L𝐼𝐶+"𝐺+"+"
+L𝐼𝐶(𝑢$$;$!
+L𝜋# ∙#
OL𝜎#2 ∙#2
PL𝑐*'𝑃*',#2*
+
+L𝑐'𝑃',#2'
+L𝑐+"𝑃+",#2+"
+L𝑐(&) 𝐿𝑆),#2)
QR
(2.1)
The mathematical model consists of the objective function (2.1) and the constraints (2.2) - (2.13). The limitation of the production capacity for each wind generator that can be built is:
0 ≤ 𝐺+" ≤ 𝑃+".01 , ∀𝑤𝑝 (2.2)

14
The binary variable that determines the construction of transport lines ul = 1 if the line is constructed and ul = 0 if it is not constructed is:
𝑢$ ∈ {0,1}, ∀𝑙𝜖𝑙" (2.3)
The constraint (2.4) limits the investment cost for new wind turbines. It must be less than the investment budget for new generators.
L𝐼𝐶+"𝐺+"+"
≤ 𝐼𝐵+" (2.4)
The constraint (2.5) limits the investment cost for new transmission lines. It must be less than the investment budget for the new transmission lines.
L𝐼𝐶(𝑢$ ≤ 𝐼𝐵($;$!
(2.5)
The balance between production and consumption at each node of the system is:
L𝑃*',#2,# +*∈*"
L 𝑃',#2,#'∈'"
+ L 𝑃+",#2,#+"∈+""
− L 𝑃𝐹$,#2,#$|#($)8!
+
+ L 𝑃𝐹$,#2,#$|4($)8!
= L ]𝐿),#2,# − 𝐿𝑆),#2,#^)∈)#
, ∀𝑏 (2.6)
The power flow through each existing transmission line is expressed as:
𝑃𝐹$,#2,# = 𝐵$]𝜃#($),#2,# − 𝜃4($),#2,#^, ∀𝑙\𝑙𝜖𝑙" (2.7)
The constraints that define the flow of power through the new transmission lines are nonlinear constraints and are expressed as follows:
𝑃𝐹$,#2,# = 𝑢$𝐵$]𝜃#($),#2,# − 𝜃4($),#2,#^, ∀𝑙𝜖𝑙" (2.8’)
The model described is a model of DC power flow in which losses are neglected. This hypothesis is often encountered because the voltage amplitude between two connected nodes is considered to be approximately constant. In view of the above, the nonlinear constraints defining the power flow through the transmission lines (2.8') can be reformulated and transformed into equivalent linear constraints, thus linearizing the products between binary and continuous variables. The resulting linear expressions where M is a positive constant, large enough and equal to 300000:
−𝑢$𝐶$ ≤ 𝑃𝐹$,#2,# ≤ 𝑢$𝐶$ , ∀𝑙𝜖𝑙"
−(1−𝑢$)𝑀 ≤ 𝑃𝐹$,#2,# − 𝐵$]𝜃#($),#2,# − 𝜃4($),#2,#^ ≤
≤ (1−𝑢$)𝑀, ∀𝑙𝜖𝑙"
(2.8)
Power flow is limited by the capacity of each transmission line:
−𝐶$ ≤ 𝑃𝐹$,#2,# ≤ 𝐶$ , ∀𝑙 (2.9)
The power produced by each type of generator is limited by its capacity:

15
0 ≤ 𝑃*',#2,# ≤ 𝐺*',∀𝑡 0 ≤ 𝑃',#2,# ≤ 𝐺',∀ℎ
0 ≤ 𝑃+",#2,# ≤ 𝐺+",∀𝑤𝑝 (2.10)
The amount of undelivered power of consumer d is less than his consumption:
0 ≤ 𝐿𝑆),#2,# ≤ 𝐿),#2,#, ∀𝑑 (2.11)
The phase shift angle is limited by:
−𝜋 ≤ 𝜃!,#2,# ≤ 𝜋, ∀𝑏 (2.12)
Voltage phase shift angle at reference bus:
𝜃!,#2,# = 0, referencebus. (2.13)
The mathematical model is applied to a network similar to a real one located in South-Eastern Romania. This optimization problem is a linear integer programming problem. Model (2.1) - (2.13) is a model of DC power flow [52]. The optimal solution of the mathematical model determines the optimal number of transmission lines needed to be built and their location, as well as the number of wind generating units needed, their capacity and location minimizing investment costs, disconnecting consumers and also generation costs.
2.2. Transmission expansion planning problem (TEP) Considering the Integration of Energy Storage Systems
In this chapter the formulation of the TEP problem considering the integration of energy storage sources is made considering the power circulation model at direct voltage. Investment decisions are made only once, at the beginning of the planning horizon. The mathematical model presented is used by the transmission operator. 2.2.1. The mathematical model related to the TEP problem considering the integration of
energy storage systems The objective function (2.14) of the mathematical model is to minimize the investment
costs related to the construction of new transmission lines and energy storage systems, the operating costs of the generating units and the costs related to the disconnection of consumers from the network:
[𝑀𝐼𝑁]𝑓 =L𝐼𝐶( ∙ 𝑢$$;$!
+L𝐼𝐶%&& ∙ 𝐺%&&,'
%&&
+
+𝜏 ∙
⎣⎢⎢⎢⎢⎢⎡ L𝑐*' ∙ 𝑃*'(𝑡)
*'
+L𝑐' ∙ 𝑃''
(𝑡) +
+L𝑐+" ∙ 𝑃+"(𝑡)+"
+L𝑐(&) ∙ 𝐿𝑆)(𝑡) +)
+L𝑐%&& ∙ 𝐿𝑉%&&(𝑡)%&& ⎦
⎥⎥⎥⎥⎥⎤
(2.14)
The mathematical model consists of the objective function (2.14) and the constraints (2.15) - (2.27).

16
The investment cost related to the construction of the new transmission lines is lower than the investment budget available for their construction. The second relation in the set of relations (2.15) defines the binary variable that indicates the construction of the new transmission lines, ul = 1 or otherwise, if the line is not constructed, ul = 0.
L𝐼𝐶(𝑢$ ≤ 𝐼𝐵($;$!
𝑢$ = {0,1}, ∀𝑙 ∈ 𝑙" (2.15)
The investment cost associated with the new energy storage units is:
L𝐼𝐶%&& ∙ 𝐺%&&,'
%&&
≤ 𝐼𝐵%&& (2.16)
The charging level of energy storage systems [MWh] is:
𝐿𝑉%&&(𝑡) = 𝐿𝑉%&&(𝑡 − 𝜏) + 𝑃%&&,' (𝑡) ∙ 𝜂%&& ∙ 𝜏 −𝑃%&&)-#,'(𝑡)𝜂%&&
∙ 𝜏 (2.17)
The charging level [MWh] is limited by the minimum and maximum limit of the storage system:
𝐿𝑉%&&.-/ ≤ 𝐿𝑉%&&(𝑡) ≤ 𝐿𝑉%&&.01 , ∀𝐸𝑆𝑆 (2.18)
The charging and discharging powers of the storage system are limited by:
0 ≤ 𝑃%&&,' (𝑡) ≤ 𝐺%&&,' , ∀𝐸𝑆𝑆
0 ≤ 𝑃%&&)-#,'(𝑡) ≤ 𝐺%&&)-#,', ∀𝐸𝑆𝑆 (2.19)
The balance between production and consumption at each bus of the system is given by:
𝜏 ∙
⎣⎢⎢⎢⎡ L 𝑃*'(𝑡) +
*∈*"
L 𝑃''∈'"
(𝑡) +L𝑃%&&)-#,'
%&&
(𝑡) +
+ L 𝑃+"+"∈+""
(𝑡) − L 𝑃𝐹$(𝑡) + L 𝑃𝐹$(𝑡)$|4($)8!$|#($)8! ⎦
⎥⎥⎥⎤
=
= 𝜏 ∙ qL ]𝐿)(𝑡) − 𝐿𝑆)(𝑡)^)∈)#
+L𝑃%&&,' (𝑡)%&&
r , ∀𝑏
(2.20)
The power flow through each existing transmission line is:
𝑃𝐹$ = 𝐵$]𝜃#($) − 𝜃4($)^, ∀𝑙\𝑙𝜖𝑙" (2.21)
The constraints that define the flow of power through the new transmission lines are nonlinear constraints and are expressed as follows:
𝑃𝐹$ = 𝑢$𝐵$]𝜃#($) − 𝜃4($)^, ∀𝑙𝜖𝑙" (2.22’)

17
The model described is a model of DC power flow in which losses are neglected. This hypothesis is often encountered because the amplitude of the voltage between two connected nodes is considered to be approximately constant (the voltage is considered equal to 1 p.u.). In view of the above, the nonlinear constraints defining the power flow through the transmission lines (2.22') can be reformulated and transformed into equivalent linear constraints, thus linearizing the products between binary and continuous variables, and the nonlinear constraint (2.22') becomes:
−𝑢$𝐶$ ≤ 𝑃𝐹$ ≤ 𝑢$𝐶$ , ∀𝑙𝜖𝑙"
−(1−𝑢$)𝑀 ≤ 𝑃𝐹$ − 𝐵$]𝜃#($) − 𝜃4($)^ ≤ (1−𝑢$)𝑀, ∀𝑙𝜖𝑙" (2.22)
where M is a constant large enough and equal to 300000. Power flow is limited by the capacity of each transmission line:
−𝐶$ ≤ 𝑃𝐹$ ≤ 𝐶$ , ∀𝑙 (2.23)
The power produced by each type of generator is limited by its capacity:
0 ≤ 𝑃* ≤ 𝐺*,∀𝑡 0 ≤ 𝑃' ≤ 𝐺*,∀𝑡
0 ≤ 𝑃+"(𝑡) ≤ 𝐺+",∀𝑤𝑝 (2.24)
The reduction in user consumption d must be less than its consumption:
0 ≤ 𝐿𝑆) ≤ 𝐿) , ∀𝑑 (2.25)
The phase shift angle is limited by:
−𝜋 ≤ 𝜃! ≤ 𝜋, ∀𝑏 (2.26)
The phase shift angle of the voltage at the reference bus is given by:
𝜃! = 0, referencebus. (2.27)
The mathematical model is applied to a network similar to a real network, located in South-Eastern Romania. This optimization problem is linear integer programming. Model (2.14) - (2.27) is a model of DC power flow [52].
The optimal solution of the mathematical model determines the optimal number of transmission lines needed to be built and their location, as well as the number of energy storage units and their location minimizing investment costs, disconnection of consumers and also generation costs.
2.3. Optimal economic dispatch in a smart grid This section describes the problem of optimal economic dispatch in a smart grid. This
problem is developed based on the results obtained for the problems presented above (G & TEP and TEP considering the integration of energy storage systems). The optimal solutions lead to the integration in the network located in the southeast of Romania of wind energy sources and energy storage sources, realizing the first step of transforming the network located in the southeast of Romania into a smart grid [53].
In this analysis, two scenarios are considered, for which the optimal distribution of power in a smart electricity grid is achieved [56] - [59]. The optimal operation of the smart grid
18
is determined on a reference day in 2018 and also the optimal operation of the system in 2030 in which a 20% increase in consumption is forecast compared to 2018. This scenario is considered accounting for the forecast offered by Transelectrica regarding the National Electric Power System [7]. 2.3.1. The mathematical model related to the problem of optimal power distribution
The objective function of the mathematical model is to minimize generation costs while the optimization model determines the optimal operation of the entire smart grid:
[MIN] 𝑓 =L𝑐*' ∙ 𝑃*',* ∙ 1 +L𝑐' ∙ 𝑃',* ∙ 1 +L𝐿𝑊𝑃 ∙ 𝑃*+",4 ∙ 1
*',**',*
(2.28)
The optimal power produced by the thermal and hydro generating units is limited by the lower and the upper generation limit:
𝑃*'.-/ ≤ 𝑃*',* ≤ 𝑃*'.01
𝑃'.-/ ≤ 𝑃',* ≤ 𝑃'.01 (2.29)
The optimum power produced by the thermal and hydro generating units at successive hours is limited by the ramp-up of the generating units:
𝑃*',* − 𝑃*',*@9 ≤ 𝑅𝑈*'
𝑃',* − 𝑃',*@9 ≤ 𝑅𝑈' (2.30)
The optimal power produced by the thermal and hydro generation units at successive hours is limited by the ramp-down of the generating units:
𝑃*',*@9 − 𝑃*',* ≤ 𝑅𝐷*'
𝑃',*@9 − 𝑃',* ≤ 𝑅𝐷' (2.31)
The energy stored in storage systems is influenced by the charging and discharging power and the charging and discharging efficiency:
𝐸* = 𝐸*@9 + v𝑃*,' ∙ 𝜂,' −𝑃*),'
𝜂),'w ∙ Δ* (2.32)
The charging power of energy storage systems is limited by the maximum and minimum charging values, respectively:
𝑃.-/,' ≤ 𝑃*,' ≤ 𝑃.01,' (2.33)
The discharge power of storage systems is limited by the maximum and minimum discharge limits, respectively. To maintain good battery life, it is recommended that no more than 20% of the total capacity to be discharged.
𝑃.-/),' ≤ 𝑃*),' ≤ 𝑃.01),' (2.34)
The energy stored in storage systems is also limited by the maximum and minimum value of its energy, respectively:

19
𝐸.-/ ≤ 𝐸* ≤ 𝐸.01 (2.35)
The equilibrium between production and demand is:
𝑃+",* +L𝑃*',* +L𝑃',*'
+ 𝑃*),'*'
≥ 𝐿* − 𝑃*,' (2.36)
The power generated by wind generating units is limited by their availability:
𝑃+",* + 𝑃*+",4 ≤ Λ*
+" (2.37)
The mathematical model (2.28) - (2.37) is constructed without considering the losses of reactive power in the smart grid [60].
The optimal solution of the mathematical model determines the optimal operation of smart grids, also presenting the loading and unloading of storage systems on the reference day of the two considered years (2018 and 2030).
2.4. Smart grid data The data related to the smart network are presented in the PhD thesis.
2.5. Results The results obtained following the application of mathematical models on the real
network located in southeastern Romania are presented below. 2.5.1. Results of G&TEP
It can be seen that the FOB value in Figure 2.4 decreases at the same time as the investment budget increases. With the increase in the budget, more new transmission lines and new wind farms can be built, so that consumers are supplied, and the total cost of disconnecting consumers decreases. In addition, wind power plants have a production cost of 0 € / MWh, the other plants with the highest production cost will not generate electricity if lower cost plants can generate as long as the balance between production and consumption is maintained. The minimum value of FOB is recorded for the budgets of € 75 million and € 1500 million, respectively € 100 million and € 2200 million because there are no disconnected consumers, so the costs of disconnecting consumers are 0 € / MW.
The optimal number of new transmission lines that need to be built is three (lines 16, 11, 13) and the optimal number and capacity of WPPs are shown in Figure 2.5 (WPP3 –600 MW, WPP20 - 207 MW, WPP21 - 200 MW, WPP22 - 89 MW and WPP24 - 291 MW), thus, it can be seen that the budget to be changed.
Figure 2.4 Variation of the objective function

20
The budget needed to build all the new elements needed to supply all consumers is € 50 million (for new transmission lines) and € 1,500 million (for new WPPs). With a budget of € 50 million and € 1,500 million, the FOB value (annualized cost) is € 1574 million. This budget has been recalculated knowing the investment costs of each new item. For the new transmission lines, the investment cost is 400,000 € / km, and for the new WPPs it is 1000,000 € / MW, these values are used in the extension of the real energy system in 2018, in Romania.
The optimal solution is shown in Figure 2.6 and Figure 2.7. Applying the optimal solution to the electricity network considered involves supplying all consumers in each operating condition of the system and in each scenario considered for 2030.
Figure 2.6 Construction of new transmission lines
Figure 2.7 Capacity of new wind farms
2.5.2. The results of the TEP problem considering the integration of energy storage systems Under this problem, new transmission lines and new energy storage systems can be built. The new transport lines that can be built are the same as those considered in the G & TEP problem. The optimal solution of the mathematical model is to build all ESS without building transmission lines, the value of the objective function being 353 938. Storage systems are charged from wind power plants when consumption is low and are discharged when consumption increases. All consumers are supplied, so disconnection costs are minimized, investment costs are also minimized because new transmission lines are not built and only storage systems are built because they have a lower investment cost. Generation costs are also minimized due to the use of wind power plants and electricity storage systems, where possible, instead of thermal units that have a higher generation cost.
2.5.3. Economic dispatch results After the installation of wind generating units that reduce polluting emissions, it can be
considered the installation of electricity storage systems thus minimizing investment costs and performing the first step of transforming the network located in southeastern Romania into a smart grid.
After the implementation of the mathematical model presented, the optimal operation of the entire analyzed system containing wind generating units and electricity storage systems is determined. Two scenarios are considered, in the first scenario the operation of the system in

21
2018 is analyzed, and in the second scenario, in 2030, the load is expected to increase by 20% compared to 2018.
Optimal operation of the system in 2018 Figure 2.12 shows the optimal power generated by the thermal generation units in 2018,
while Figure 2.13 shows the optimal power generated by the hydro generation units. Figure 2.14 shows the optimal power generated by the wind generating units. It can be
seen that when the weather conditions are favorable for wind turbines, the maximum power is produced by this type of units, because the production cost is lower (0 €/MWh) than the generation cost of other types of generators.
Figure 2.15 shows the charging and discharging of storage systems in 2018, and Figure 2.16 shows the energy stored in the ESS. ESSs are loaded when production is greater than consumption and are discharged when consumption is greater than production.
Figure 2.12 Thermal plants generated power
in 2018
Figure 2.13 Hydro plants generated power in
2018
Figure 2.14 Wind farms generated power in
2018
Figure 2.15 Charging and discharging powers in
2018
Figure 2.16 Storage energy in 2018
Optimal operation of the system in 2030 Figure 2.17 and Figure 2.18 show the optimal power generated by the thermal and hydro
generating units in 2030. It can be seen that production has increased compared to 2018 due to increased consumption. The increase in power produced was necessary due to the increase in consumption.
Figure 2.19 shows the optimal power generated by the wind generating units in 2030. It can be seen that in Figure 2.14 and Figure 2.19 (both scenarios), the power generated by the

22
wind generating units is used to the maximum due to the low generation cost. Therefore, the total cost of generation is minimized.
Figure 2.20 shows the charging and discharging of energy storage systems in 2030, and Figure 2.21 shows the energy stored in the ESS. Compared to 2018, the loading and unloading power increases as well as the energy stored in storage systems. In 2018, storage systems are not as used as in 2030 because the optimal operation of the system to increase the life of storage systems considering the charging/discharging cycles is achieved.
Figure 2.17 Thermal plants generated power in
2030
Figure 2.18 Hydro plants generated power in
2018
Figure 2.19 Wind farms generated power in
2030
Figure 2.20 Charging and discharging powers
in 2030
Figure 2.21 Storage energy in 2030
The mathematical model of the optimization problem determines the optimal
functioning of the analyzed smart grid. It may be modified to determine the optimal operation of any other transmission network.
The system can meet the requirements of consumers even in 2030, because the power produced is sufficient, as well as the capacity of transmission lines.
The integration of energy storage systems is necessary to have an energy reserve, due to the volatility of renewable energy sources and the variation of demand. In recent years, the use of energy storage systems has increased.

23
3. Operation analysis of the Smart Grid pilot system
In this chapter, a Smart Grid electrical network located at the Maritime Base of Constanța, which is part of the University Maritime of Constanța (UMC), is analyzed. The smart grid can work connected or disconnected from the network, the system diagram is illustrated in Figure 3.1. In Figure 3.2 you can see the location of the smart grid on Cuarțului Street no. 2, Constanța, Romania, provided by Homer Pro. The analysis performed in Homer Pro is intended to validate by simulation the structure of the smart grid implemented at the Maritime Base of Constanța that contains both renewable and conventional sources that use fossil fuels. During this analysis, different cases of operation of the Smart Grid network were carried on at the variation of input parameters, which would be almost impossible to achieve in practice. The results of the simulations demonstrate the correct operation of the entire system in on and off grid operation.
Analyzing Figure 3.1, the smart grid has in its composition an electricity storage system, photovoltaic panels, a wind turbine, converters, a generator, a logic controller (PLC) and a two-way smart meter.
Figure 3.1 Layout of the Smart Grid network within the Maritime Base of Constanța
3.1. UMC smart grid data The wind turbines are located near the lake at the Maritime Base of Constanța, and the
photovoltaic panels are located on the roof of the buildings. The 8.8kW diesel generator is located outside and the rest of the elements inside.
3.1.1. Characteristic data of smart grid components The nominal parameters of the smart grid are presented in the PhD thesis. After the implementation of the smart grid in the Homer Pro software, the optimal
solution regarding system costs, operation and sizing is determined. The smart grid scheme implemented in the Homer Pro software is shown in Figure 3.13.
Figure 3.2 The layout of the Smart Grid electrical network within UMC implemented in the Homer
Pro software

24
Data on solar radiation and meteorological data measured for the analyzed area, Strada Cuarțului, no. 2, Constanța, Romania (44 ° 13’N; 28 ° 37.2’E) are collected from the NASA Prediction of Worldwide Energy Resource (POWER). The smart grid is analyzed using the power distribution strategy called Load Following (LF) for both on-grid and off-grid operation.
The objective function is represented by the net present cost (NPC), the LF power distribution strategy considers the optimal solution, the solution with the lowest NPC. The net present cost is the present value of all costs of installing and using the system over the lifetime of the project, minus the present value of all revenues obtained over the same lifetime of the project. HOMER calculates the updated net cost of each component of the system and of the system as a whole [75], [76].
𝐶ABC =𝐶0//,*2*
𝐶𝑅𝐹(𝑖, 𝑅"42D) (3.3)
with 𝐶0//,*2* the total updated cost being denoted. With i is denoted the annual discount rate, and Rproj is the life of the project (in this case 20 years). The CRF is the capital cost recovery factor and is calculated with [76]:
𝐶𝑅𝐹(𝑖, 𝑅"42D) =𝑖(1 + 𝑖)E!$%&
(1 + 𝑖)E!$%& − 1 (3.4)
Therefore, the objective function used by Homer software is [76]:
[𝑀𝐼𝑁]𝐶ABC = L𝐶0//,*2*
𝐶𝑅𝐹(𝑖, 𝑅"42D),2."2/F/*F
(3.5)
3.1.2. Modeling of smart grid components Photovoltaic system: The modeling of smart grid components is described according to the Homer Pro
software that is used in this analysis [75], [76].
𝑃BG = 𝑌BG𝑓BG v�̅�H
�̅�H,&HCw ∙ }1 + 𝛼"]𝑇C − 𝑇C,&HC^� (3.6)
The nominal capacity of the photovoltaic system, more precisely its power under standard test conditions, is denoted by YPV [kW]. The power reduction factor is denoted by fPV [%]. At each time point, the global solar radiation incident on the surface of the photovoltaic panel �̅�H[kW/𝑚6] is calculated. The �̅�H,&HC is the incident solar radiation under STC conditions [1kW /m2]. The power coefficient of the temperature of the photovoltaic system is denoted by αp [% /°C], denoted with TC [°C] the temperature of the photovoltaic system in the current time interval and with TC,STC the temperature of the photovoltaic system in STC conditions [25 °C].
Wind system The power produced by the wind turbine is calculated at any given time using a three-
step process. Step 1 - calculation of wind speed for the height at which the platform of the wind
system is located, in this chapter, the height of the support pole is 13m.

25
Step 2 - calculation of the power produced by the wind turbine at the wind speed at that time, at the standard value of air density.
Step 3 - adjust the value of the power produced for the actual air density. The wind speed at the height of the platform is:
𝑈'I! = 𝑈0/F. ∙ �𝑍'I!𝑍0/F.
�J
(3.7)
The wind speed at the height of the nacelle is denoted by Uhub [m/s], and the wind speed at the height of the anemometer Uanem [m/s]. The notation Zhub represents the height of the turbine nacelle, Zanem [m] is the height of the anemometer and α is the exponent of the three-step process.
To adjust the power generated by the wind turbine for the actual operating conditions, we multiply the value of the forecasted power according to the power curve with the air density ratio, according to the following equation:
𝑃KHL = �𝜌𝜌M� ∙ 𝑃KHL,&HB (3.7)
with PWTG [kW] is denoted the power generated by the wind installation, with PWTG, STP [kW] is denoted the power generated by the wind installation under standard conditions of temperature and pressure, with ρ [kg/m3] is denoted the current density of air, and with ρ0 [kg/m3] the density of air under standard conditions of temperature and pressure ρ0 = 1,225 [kg/m3].
Demand The consumption of the Maritime University of Constanța (UMC) is composed of the
consumption of the Maritime Base of Constanța together with the dormitories for students and the activity of the university. The Maritime Base of Constanța is considered an active consumer because it has the possibility to inject electricity from renewable sources in the public electricity network.
Diesel Generator 8.8kW Diesel generator power is fixed and generator data does not change. The calculation of the fuel curve used by the generator describes the amount of fuel
consumed to produce electricity. HOMER software considers the fuel curve a straight line. The fuel consumption of the generator in units/h depending on the power produced is:
𝐹 = 𝐹M ∙ 𝑌NF/ + 𝐹9 ∙ 𝑃NF/ (3.8)
with F0 [units/h/kW] the intersection coefficient of the fuel curve is denoted, and with F1 [units/h/kW] the slope of the fuel curve. The nominal capacity of the generator is denoted by Ygen [kW], while by Pgen [kW] the produced power of the generator is denoted.
The efficiency of the generator is defined in HOMER as the electricity produced divided by the chemical energy of the used fuel:
𝜂NF/ =3,6 ∙ 𝑃NF/
�̇�OIF$ ∙ 𝐿𝐻𝑉OIF$ (3.9)
26
The power generated is denoted by 𝑃NF/ [kW], and by �̇�OIF$[𝑘𝑔/ℎ] the mass flow rate of the fuel. The notation 𝐿𝐻𝑉OIF$[𝑀𝐽/𝑘𝑔] represents the lower calorific value of the fuel (as energy value). In the previous relation, the value 3.6 appears due to the conversion 1kWh = 3.6MJ.
The mass flow rate of the fuel depends on F (generator fuel consumption), but the exact relationship depends on the unit of fuel. If the unit of fuel is kg, then �̇�OIF$ and F are equal. If the unit of fuel is liter (l), the relationship between �̇�OIF$ and F includes the density of the fuel ρfuel [kg/m3]:
�̇�OIF$ = 𝜌OIF$ ∙ �𝐹
1000� (3.10)
Storage system At each time point, the maximum amount of energy that the storage system can absorb
is calculated. The charging power varies from time to time depending on the charging status and the loading / unloading history of the storage system.
Three separate limitations are imposed on the maximum load capacity of the storage system.
The first limitation refers to the maximum amount of power that can be absorbed by the storage system:
𝑃!0*,,.01,,." =𝑘𝑄9𝑒@PQ* + 𝑄𝑘𝑐(1 − 𝑒@PQ*)
1 − 𝑒@PQ* + 𝑐(𝑘Δ𝑡 − 1 + 𝑒@PQ*) (3.11)
with 𝑄9[𝑘𝑊ℎ] is denoted the energy available in the storage system at the beginning of the time period, and with Q [kWh] the total amount of energy in the storage system at the beginning of the time period. The ratio of storage capacity is denoted by c, with k [h-1] the constant of the storage rate is denoted, and with Δt the time period.
The second limitation refers to the maximum loading rate of the storage system [A / Ah]. The loading power of the storage system corresponds to the maximum loading rate is:
𝑃!0*,,.01,4.î =(1 − 𝑒@J'Q*)(𝑄.01 − 𝑄)
Δ𝑡 (3.12)
with 𝛼, [𝐴/𝐴ℎ] the maximum loading rate of the storage system is noted, and with Qmax [kWh] the total storage capacity of the system is noted.
The third limitation refers to the maximum charging current of the storage system. The maximum charging power of the storage system corresponding to the maximum charging current is:
𝑃!0*,,.01,,.î =𝑁!0**𝐼.01𝑉/2.
1000 (3.13)
The number of batteries in the storage system is denoted by 𝑁!0**, by Imax [A] the maximum charging current of the storage system and by Vnom the nominal voltage of the storage system.
The maximum load power of the storage system is:

27
𝑃!0*,.01 =𝑀𝐼𝑁(𝑃!0*,,.01,,.", 𝑃!0*,,.01,4.î, 𝑃!0*,,.01,,.î)
𝜂!0** (3.14)
Charging efficiency is denoted with 𝜂!0**. At each time, the maximum amount of energy that the storage system can discharge is
calculated. The maximum discharging power varies at any given time depending on the charging status and charging/discharging of the storage system.
The maximum power that can be discharged by the storage system is:
𝑃!0*,).01,,." =−𝑘𝑐𝑄.01 + 𝑘𝑄9𝑒@PQ* + 𝑄𝑘𝑐(1 − 𝑒@PQ*)
1 − 𝑒@PQ* + 𝑐(𝑘Δ𝑡 − 1 + 𝑒@PQ*) (3.15)
with Q1 [kWh] is denoted the energy available in the storage system at the beginning of the time period, and Q [kWh] denotes the total amount of energy in the storage system at the beginning of the time period. The ratio of storage capacity is denoted by c, with k [h-1] the constant of the storage rate is denoted, and with Δt the time period. The maximum storage capacity of the system is noted with Qmax [kWh].
The maximum discharge power of the storage system is:
𝑃!0*,).01 = 𝜂!0** ∙ 𝑃!0*,).01,,." (3.16)
3.2. Smart grid operation simulation results 3.2.1. Analysis of the results obtained using Homer Pro software
Figure 3.17 shows the operating structure of Homer software to determine the optimal solution for costs and system operation.
Two options of the Homer Pro software are used: Search Space and Homer Optimizer, respectively. Search Space uses user-imposed component capacity, and Homer Optimizer optimally measures components based on net present cost (NPC).
Figure 3.17 Operating structure for determining the optimal solution
A) Search Space, operation On-Grid If the Search Space option is used, the capacity of the smart grid components is the one
installed at the Maritime Base of Constanța, presented in Table 3.2. The operation of the smart grid does not bring a monetary benefit to the Maritime University of Constanța, as it is

28
undersized for its current consumption. For this solution, the updated net cost is $ 41 354 (operating and maintenance costs + energy used from the public transportation network).
Table 3.1 Size of smart grid components - Search Space
Component Characteristic data Wind turbine 3 kW Photovoltaic panels 5.04 kW Storage system Li-Ion 6.74 kWh Converters 19.9 kW Diesel generator 8.8 kW
B) Homer Optimizer, operation On-Grid The optimal solution presented in Table 3.3 consists in the installation of 50.16 kW in
photovoltaic panels, 5x3 kW Bornay wind turbines, 46.7 kW converter systems and the use of the current 8.8 kW generator. For this system, the updated net cost is -7,049 $, obtaining a monetary benefit. The generator is used as a power reserve in the event of a fault. The storage system is not used because the consumption of the Maritime Base in Constanța is too high and there is no correlation between the power produced from renewable sources and the possibility of energy storage. All consumers are powered, the smart grid is connected to the public electricity grid. After covering its own consumption, the surplus electricity is injected into the public grid.
Table 3.2 Optimal solution for on-grid operation
Component Characteristic data Wind turbine 5 x 3 kW (15kW) Photovoltaic panels 209 x 0.24 kW (50.16kW) Converters 46.7 kW Diesel generator 8.8 kW
C) Homer Optimizer, operation Off-Grid The optimal solution consists in the installation of 50 kW in photovoltaic panels, 5
Bornay wind turbines of 3 kW, the use of the current generator of 8.8 kW, converter systems of 19.9 kW and 10 BMZ storage systems of 6.7 kW. The discounted net cost is $ 30,671, with no monetary benefit (operating and maintenance costs). The smart grid works islanding, there are times when the load is not powered. In this case, the installation of other types of elements, of higher capacities, must be considered in order to be able to cover the entire consumption in case of insular operation.
Table 3.3 The optimal solution for off-grid operation
Component Characteristic data Wind turbine 5 x 3 kW (15 kW) Photovoltaic panels 209 x 0.24 kW (50.16 kW) Storage system Li-Ion 10 x 6.74 kWh (67.4 kWh) Converters 19.9 kW Diesel generator 8,8 kW
Analyzing the results of cases A, B and C, it can be seen that the variant in which a monetary benefit appears is the one of operation connected to the public network and the injection into the network for a fee of the surplus electricity from renewable sources.

29
Table 3.5 shows the value of the objective function (net present cost) of the smart grid for each analyzed case. Only in case B there is a benefit.
Table 3.4 Objective function (net present cost) for each case analyzed
Study case Net present cost [$] A 41 354 B -7 049 C 30 671
In case A the system has the highest operating costs because it is undersized and purchases electricity from the public grid. In case C, the system operates islanding, so no electricity is purchased from the public grid, the cost is lower, but it is necessary to consider investing in other equipment of higher capacity to supply the entire consumption. In case B, the network is resized considering the available space. Surplus energy from renewable sources is injected into the public grid so the benefit of $ 7 049 appears (Table 3.5). 3.2.2. Experimental results on distortion regime in Smart Grids
The photovoltaic panels are connected to the 50 Hz network by means of inverters that cause a distorting regime in the electrical networks, especially in the periods when the production of the photovoltaic panel is influenced by the shading of the panel. The converters used in the smart grid are forced switching converters with pulse width modulation to reduce harmonic distortion. Statistical analysis for 95% of the time was performed for current and voltage harmonics as well as for the total harmonic distortion factor of current and voltage.
The figures below illustrate the daily variations of the 50 Hz electric currents (Figure 3.27), as well as the variations of the values of 95% of the current harmonics of order 3, 5, 7, 11 recorded at the interface point between the described smart grid previously and the supply system of the Nautical Base (Figure 3.28) in April. As can be seen, the photovoltaic system is the one that produces electricity substantially in relation to other sources, observing the characteristic production curve of a photovoltaic system. The analyzed day is cloudy, causing significant variations in the current produced by photovoltaic panels. Figure 3.31 illustrates the variation of the harmonic voltage of order 1 on the three phases. Figure 3.32 shows the variations of the values of 95% of the voltage harmonics of order 3, 5, 7, 11. The current harmonics follow the trend of variation of the electric current injected by the photovoltaic system. These harmonics have been measured in the internal network of the Nautical Base, and their amplitude is attenuated to the CCP with the public network, without causing problems regarding the management of harmonic distortion. Voltage harmonics are within acceptable limits of international standards. It can be seen that the order 5 voltage harmonic has the highest effective value in relation to the other harmonics.
The variation of the total harmonic current distortion has a shape in opposition to the current produced by the photovoltaic installation (Figure 3.36). Starting from the definition expression of the total harmonic distortion it can be observed that the minimum value of THD is obtained for a maximum value of the current injected by the photovoltaic installation. It should be noted that the maximum values of THD are recorded at the beginning, respectively at the end of the production period of the photovoltaic installation. This is determined by the fact that the photovoltaic installation is just starting to produce, respectively ending its production, the value of the fundamental harmonic electric current being very small during these periods. Therefore, to obtain useful information on the impact of photovoltaic installations on the quality of electricity using THD, it is necessary to calculate these values (of THD) for periods when the output of the photovoltaic system is at least 20% of its nominal output. The

30
variation of the total harmonic voltage distortion (Figure 3.35) falls within the permissible limits set by international standards.
Figure 3.27 The variation of the 50 Hz electric
current on the three phases in April
Figure 3.28 Variation of the effective value of current harmonics of order 3,5,7 and 11 on
phase L1 in April
Figure 3.31 The variation of the harmonic
voltage gives order 1 on the three phases in April
Figure 3.32 Variation of the effective value of
the voltage harmonics of order 3,5,7 and 11 on phase L1 in April
Figure 3.35 Variation of the total harmonic
voltage distortion on the three phases in April
Figure 3.36 Variation of the total harmonic
current distortion on the three phases in April
The figures below illustrate the daily variations of the 50 Hz electric currents on the three phases (Figure 3.38), as well as the variations of the 95% values of the current harmonics of order 3, 5, 7, 11 recorded at the interface point between smart grid (Figure 3.39) in May. On this day you can see the presence of significant amounts of clouds in the analyzed area. As can be seen in Figure 3.38, the harmonic current of order 1 has the characteristic shape generated by a photovoltaic panel over which pass clouds that alternate with periods of sunshine and clear sky. After midday the panel produces less on this day than in April, presented above. Figure 3.39 illustrates the variations of current harmonics of order 3, 5, 7, 11. It can be seen how the level of harmonics increases during periods when the sky is cloudy. Figure 3.42 illustrates the variation of the harmonic voltage of order 1 on the three phases. Figure 3.43 shows the variations of the values of the voltage harmonics of order 3, 5, 7, 11. The voltage harmonics are within the acceptable limits established by international standards.
These measurements demonstrate that the large-scale integration of high-capacity equipment (photovoltaic inverters) can lead to an increase in harmonic voltage distortion. Further studies are needed to quantify the impact and the extent to which this impact will increase the likelihood of interference.
From the THDI variation (Figure 3.46) it has high values not only at the beginning and end of the production period of the photovoltaic installation but also when the panels are shaded,

31
the distortion regime being high at these times. On each of the three phases there are extreme values for THDI due to the fact that at this moment the value of the harmonic electric current 1 is very small.
The variation of the total harmonic voltage distortion (Figure 3.47) falls within the permissible limits set by international standards.
Figure 3.38 The variation of the 50 Hz electric
current on the three phases in May
Figure 3.39 The variation of the effective value of the current harmonics of order 3,5,7 and 11
on the L1 phase in May
Figure 3.42 The variation of the harmonic voltage
gives order 1 on the three phases in April
Figure 3.43 The variation of the effective value of the voltage harmonics of order 3,5,7 and 11
on the L1 phase in May
Figure 3.46 Variation of the total harmonic
current distortion on the three phases in May
Figure 3.47 Variation of the total harmonic
voltage distortion on the three phases in May

32
4. Conclusions and personal contributions
The PhD thesis entitled "Electromagnetic compatibility in Smart Grid structures" is in agreement with the current interests of producers, distributors and consumers of electricity to find the most appropriate solutions for the operation of the smart grid, at a minimum cost with a high level of power quality to reduce pollutant emissions.
• One possibility to reduce the impact on the environment, in the context of electricity generation, is the use of distributed resources, increasingly present in electricity networks.
• The European Green Deal aims to achieve electricity production in Europe by 2050 without polluting emissions.
• The large-scale integration of renewable energy sources affects the operation of power systems, and measures are needed to compensate for the uncertainties regarding the production of these sources.
• In recent years, battery-based storage systems have developed extensively, being integrated both at the place of electricity production and near the places of consumption.
• The use of storage systems can reduce energy costs during peak hours and can maintain the stability of the power grid when there are variations in production from renewable energy sources or unforeseen breakdowns.
• The need for the power system to have a safe operation, to be energy efficient and sustainable through the use of renewable energy sources and storage systems, with bidirectional exchanges of energy and data led to the development of Smart Grid.
• The development of a flexible, efficient, robust, reliable two-way energy system that includes renewable energy sources and storage systems has led to smart grids.
• A smart grid efficiently integrates energy and IT decisions of the participants (producers and consumers) interconnected to it in order to increase the economic efficiency of the electricity grid by minimizing losses and increasing supply security, without affecting the power quality.
• The smart grid ensures the active participation of consumers in covering the load curve and allows the inclusion of all energy generation and storage systems, being able to cope with changes caused by generation sources (classic and volatile) and consumers, with high flexibility.
• The consumer has always been at the center of the liberalization and deregulation of the energy sector, initially looking for the cheapest electricity supplier allowing the economic efficiency of the electricity market.
• With the liberalization of the energy sector, there was competition between electricity companies, the consumer being able to choose the supplier freely.
• A basic element in Smart Grid systems are active consumers (prosumers) who consume /produce services and products. This type of consumer requires a two-way connection to be able to consume and inject energy from and into the grid.
• Smart meters installed in active consumers allow the existence of a two-way communication path.
• The decrease of the prices of the technologies that achieve the production of electricity and at the same time the increase of the digitization level contributes to the existence of active consumers.

33
• In a smart electricity network, active consumers have the possibility to inject electricity, from renewable sources, into the public grid.
• In the case of public electricity networks, due to the aging of the infrastructure, the increase in consumption and the limitations on greenhouse gas emissions, it is necessary to invest in infrastructure.
• The infrastructure of the electricity system is aging, consumption is increasing and the limitations on pollutant emissions that lead to the closure of certain plants that do not meet the requirements lead to the need to plan investments in transmission lines and generating units and energy storage units.
• The optimization of the investment in electricity generation units and in the expansion of the transport infrastructure is achieved by minimizing the costs, simultaneously with the increase of the food safety.
• Optimizing the development of the power system in the presence of renewable sources requires measures to ensure the adequacy and resilience of the system considering the uncertainty of production from renewable sources.
• The optimal solution of mathematical models determines the optimal number of transmission lines needed to be built and their location as well as the number of wind generating units needed, their capacity and location minimizing investment costs, disconnecting consumers and also generation costs.
• The proposed and implemented optimization problems aim at studying the development of Smart Grid networks when investments in generation units and network elements are needed to supply consumers so as to minimize investment and operating costs in the presence of renewable sources that are stochastic and electricity storage systems whose integration into electricity networks will increase significantly in the coming years due to the European Green deal.
• The large-scale integration of low power systems requires optimal power distribution to ensure variable consumption that is achieved with minimal costs and maximizing the benefits that can be obtained from the participation of these smart grids in the electricity market.
• The analysis is performed on a smart grid similar to a real electricity grid, located in the southeastern part of Romania, where there are favorable wind conditions for the integration of wind generation units.
• Various scenarios have been implemented regarding the increase of consumption that consider the intensification of electrification for end users. In real cases, scenarios with an evolution of random consumption until 2030 are of interest.
• The proposed optimization models were made in professional programs considering the constraints of investment, power circulation and operation of the energy system in Romania
• The developed algorithms can be applied and implemented on different network areas with renewable sources such as wind installations and storage systems.
• The need to reduce the impact on the environment, the existence of financial incentives for the integration of renewable sources (photovoltaic panels), the digitalization of the energy sector and the desire of university campus users to reduce electricity costs led to the emergence of "smart" campuses.
• The analysis performed in Homer Pro is intended to validate by simulation the structure of the smart grid implemented at the Maritime Base of Constanța which contains both renewable and conventional sources that use fossil fuels.

34
• Different cases of operation of the Smart Grid network are analyzed at the variation of the input parameters, which would be almost impossible to achieve in practice. The results of the simulations demonstrate the correct operation of the entire system in On and Off Grid operation.
• Renewable energy sources connected to the electricity grid through converters produce harmonic distortions.
• The quality of electricity is affected by electromagnetic disturbances in the power system, such as harmonics of current and voltage.
• Electromagnetic compatibility is quantified by quality indicators whose permissible range of variation is established in international standards.
• Deviation of electricity quality indicators (total harmonic distortion) from the values accepted by standards can cause damage to consumers and reduce the life of equipment.
• The evaluation of the non-sinusoidal regime determined by the presence of converters is performed with the help of total harmonic voltage and current distortion.
• The analysis of the distortion of the voltage and current curves is particularly important because the transmission, generation and distribution systems are made for a sinusoidal waveform of the curves. The distorting regime affects the performance of electricity networks, and therefore affects the quality of energy used by consumers.
• In the operation of the Smart Grid network islanded from the public electricity network, harmonic disturbances represent an important technical problem that needs to be managed by the local energy management system, so that no interference occurs with other equipment and control systems are not affected.
• The total harmonic distortion of the current produced by the converters of photovoltaic installations is higher at the beginning and end of the production period, when the value of the fundamental current is low.
• In periods of cloudy skies, the operation of photovoltaic system converters can lead to increased harmonic disturbances, especially in the field of high (supraharmonic Characteristic data) frequencies that can affect the operation of programmable controllers and intelligent measurement systems.
Personal contributions
• The problem of investment in generating units and transmission lines (Generation and Transmission Expansion Planning Problem - G & TEP) applied to a smart electricity network similar to a real electricity network located in the southeastern part of Romania was proposed and implemented.
• The mathematical model was developed considering the integration of wind sources in the smart grid. Generation costs, consumer disruption costs and investment costs in new network elements are minimized.
• The stochastic approach is used, decisions from time zero are represented by investments in transmission lines and generating units, while decisions from time t refer to the optimal distribution of power between generating groups and optimal power circulation.
• Within the G & TEP problem, different investment budgets in the new network elements are considered and the variation of the objective function is represented in the case of the optimal solution for each of them. The construction of the new elements for each budget is also presented.

35
• The expansion of the transmission network considers the continuous increase of consumption, the availability of existing production units and the construction of new ones. Three scenarios were considered for increasing consumption that consider the use of electric cars and electrical equipment for end users. In real cases, scenarios with an evolution of random consumption until 2030 are of interest.
• The investment problem in the extension of the transmission network was proposed and implemented considering energy storage systems (TEP + ESS) applied on a smart grid similar to a real electricity network located in the southeastern part of Romania. The expansion of the transmission network considers the continuous increase in consumption, the availability of existing production units and the construction of new ones.
• The deterministic mathematical model integrates storage systems with Li-Ion batteries. Investment costs related to the construction of new transmission lines and energy storage systems, operating costs of generating units and costs related to disconnecting consumers from the grid are minimized.
• The optimal solution resulting from the implementation of the G & TEP problem and the consumption on a reference day was considered, thus determining the optimal functioning of the storage systems as well as the optimal solution regarding the investment in the new proposed elements.
• The proposed mathematical models, G & TEP and TEP considering energy storage systems, can be used by the transmission operator to determine the optimal solutions for placing new components in existing electricity networks, as well as to minimize generation costs and costs associated with disconnecting consumers.
• The problem of optimal power distribution applied on a smart electricity network similar to a real electricity network located in the southeastern part of Romania was proposed and implemented.
• Starting from the results of the previously analyzed problems, the smart grid optimally sized according to the information provided by the analysis of the optimal solution, the optimal power distribution was determined.
• Two scenarios were considered: in the first scenario the functioning of the system in 2018 is analyzed, and in the second scenario, in 2030, in which the possibility of increasing the load necessary to be fed is considered.
• The mathematical model presented can be applied by the national energy dispatcher and can be modified to determine the optimal distribution of power in any other electricity transmission network.
• It was proposed and analyzed the topological configuration of an intelligent network for powering a university campus at the Maritime Base of Constanța, which includes educational spaces and spaces for student accommodation.
• The functioning of renewable sources and storage systems implemented in the smart grid on the university campus was analyzed.
• The operation of a small intelligent electricity network, a real intelligent electricity network, located in Constanța, at the Maritime Base, was implemented and analyzed. Different cases of network operation and the possibilities of obtaining a monetary benefit following the implementation and operation of the smart grid under certain conditions were analyzed.
• The possibility of injecting into the public network of electricity produced from renewable sources was analyzed, thus, the Maritime Base of Constanța becomes an active consumer.

36
• It was demonstrated the importance of sizing the components according to their own consumption as well as opting for the injection of electricity into the public grid.
• The operation of the smart grid in the mode connected to the public electricity network as well as the islanding operation mode were analyzed, the consumers being fed from renewable sources and storage systems.
• The possibility of expanding the smart grid implemented in the university campus was analyzed and the benefits resulting from this decision were presented.
• The harmonic distortions present in the intelligent, internal electricity network of the Maritime Base were measured using the Janitza electricity quality analysis system.
• Harmonic current and voltage distortions were analyzed in two reference days in two different months, April and May.
• The total harmonic distortion of current and voltage in cloudy sky conditions that alternates with periods of clear sky was analyzed.
• Functional models were developed in the HOMER Pro and GAMS software programs in which intelligent electrical networks were implemented based on information from existing electrical networks.
Future development directions
− simulation of hydrogen energy storage systems for the use of energy produced from renewable sources in Dobrogea;
− simulation in HOMER Pro of an electrolyzer present in the intelligent network from the Nautical Base from Constanța;
− analysis of thermal energy consumption and measures to cover it using the generating units of the smart grid;
− implementation of intelligent electrical network protection systems operating in island to ensure the electrical safety of the entire system;
− the analysis of the distortion regime determined by the different photovoltaic installations not only as amplitude of the individual harmonics, but also regarding the phase shift angle of the voltage harmonics;
− analyzing the power quality in the smart grid from the point of view of unbalance and supra-harmonics;
− the integration of electric vehicles and the analysis of electromagnetic compatibility in power supply installations, as well as the interference between charging stations and other disruptive equipment in the network.

37
References
[1] https://ec.europa.eu/romania/news_ro - accesat la data de 14.04.2021 [2] N. Golovanov, H. Albert, Ș. Gheorghe, N. Mogoreanu, G.C. Lazaroiu, „Surse regenerabile de
energie electrică în sistemul electroenergetic”, Ed. AGIR, București, 2015. [3] https://www.europarl.europa.eu/factsheets/ro/sheet/70/energia-din-surse-regenerabile, accesat la
data de 16.04.2021. [4] C. A. Sima, M. O. Popescu, C. L. Popescu and G. Lazaroiu, "Integrating Energy Storage Systems
and Transmission Expansion Planning in Renewable Energy Sources Power Systems," 2019 54th International Universities Power Engineering Conference (UPEC), Bucharest, Romania, 2019, pp. 1-6, WOS:000619338200029.
[5] A. Ipakchi and F. Albuyeh, "Grid of the future", Power and Energy Magazine, IEEE, Vol.7, No.2, March-April 2009, pp.52-62.
[6] M. O. Popescu, C. L. Popescu and C. A. Sima, "Electric Power’s Seasons," 2019 11th International Symposium on Advanced Topics in Electrical Engineering (ATEE), Bucharest, Romania, 2019, pp. 1-4, WOS:000475904500142.
[7] www.transelectrica.ro., accesat la data de 14.04.2021 [8] IEEE Guide for Smart Grid Interoperability of Energy Technology and Information Technology
Operation with the Electric Power System (EPS), End-Use Applications, and Loads," in IEEE Std 2030-2011 , pp.1-126, 10 Sept. 2011.
[9] H. Albert, Ș. Gheorge, N. Golovanov, L. Elefterescu, R. Porumb, „Calitatea energiei electrice, Contribuții. Rezultate. Perspective”, Ed. AGIR, București, 2013.
[10] https://www.iec.ch. [11] https://www.vttresearch.com/sites/default/files/julkaisut/muut/2008/Definition_of_smart_meterin
g_and_applications_and_identification_of_benefits.pdf, accesat la data de 20.05.2021. [12] P. Koponen, L. D. Saco, N. Orchard, T. Vorisek, J. Parsons, C. Rochas, A. Z. Morch, V. Lopes, M.
Togeby, „Definition of Smart Metering and Applications and Identification of Benefits”, European Smart Mettering Alliance Project, Mai, 2008.
[13] CSERES, K. (2018). The Active Energy Consumer in EU Law. European Journal of Risk Regulation, vol. 9, no. 2, pp. 227-244.
[14] D. Kuiken, H.F. Más, M. Haji Ghasemi, N. Blaauwbroek, T.H. Vo, T. van der Klauw, P.H. Nguyen, „Energy Flexibility from Large Prosumers to Support Distribution System Operation—A Technical and Legal Case Study on the Amsterdam ArenA Stadium”, Energies, 2018, vol. 11, pp. 11-122.
[15] A. Toffler, „The Third Wave” (William Morrow 1980). [16] www.sma.de., accesat la data de 7.04.2019. [17] A. Ferreira, P. Leitao, P. Vrba, „Challenges of ICT and artificial intelligence in smart grids”, 2014
IEEE International Workshop on Intelligent Energy Systems (IWIES), Oct. 2014, pp. 6-11. [18] B. K. Bose, „Artificial Intelligence Techniques in Smart Grid and Renewable Energy Systems—
Some Example Applications”, in Proc. of the IEEE, vol. 105, no. 11, Nov. 2017, pp. 2262-2273. [19] B. Qela, H. T. Mouftah, „Observe, Learn, and Adapt (OLA)—An Algorithm for Energy
Management in Smart Homes Using Wireless Sensors and Artificial Intelligence”, IEEE Transactions on Smart Grid, vol. 3, no. 4, Dec. 2012, pp. 2262-2272.
[20] F. Vatra, P. Postolache, C.A. Vatra, A. Poida, „Integrarea si funcționarea centralelor eoliene si a instalațiilor fotovoltaice în sistemul electroenergetic”, Ed. SIER, București, 2012.
[21] https://www.ge.com/renewableenergy/wind-energy/offshore-wind/haliade-x-offshore-turbine, accesat la data de 27.05.2021.
[22] IEEE Power&Energy Magazine, vol. 15, no. 6, Nov./Dec. 2017. [23] G.C. Lazaroiu, „Controlul calității energiei electrice în sistemele de distribuție”, Ed. Agir,
București, 2011. [24] G. Hortopan, „Principii și tehnici de compatibilitate electromagnetică, Ed. Tehnică, 2005. [25] Notițe de curs, Electrosecuritate și compatibilitate electromagnetică, Prof. dr. ing. Mihai Octoavian
Opoescu, 2018, București. [26] T. Williams, K. Armstrong, „EMC for Systems and Installations”, Ed. Newnes, 1999.
38
[27] P. F. Keebler, „Meshing power quality and electromagnetic compatibility for tomorrow's smart grid” in IEEE Electromagnetic Compatibility Magazine, vol. 1, no. 2, pp. 100-103, Second Quarter 2012.
[28] www.sier.ro/Articolul_6_1_2.pdf, accesat la data de 10 decembrie 2018 [29] O. Toledo, D. Filho, A. Diniz, "Distributed photovoltaic generation and energy storage systems: a
review," Renew. Sustain. Energy Rev., vol. 14, no. 1, pp. 506-511, 2010. [30] X. Tan, Q. Li, H. Wang, "Advances and trends of energy storage technology in microgrid", Electr.
Power Energy Syst., vol. 44, no. 1, pp. 179-191, 2013. [31] S.X. Chen, H.B. Gooi, M.Q. Wang, "Sizing of energy storage for microgrids," IEEE Trans. Smart
Grid, vol. 3, no. 1, pp. 142-151, 2012. [32] L.L. Garver, "Transmission network estimation using linear programming", IEEE Trans. Power
Apparat. Syst., vol. 89, no. 7, Sept. 1970, pp. 1688-1697. [33] S. de la Torre, A.J. Conejo, J. Contreras, "Transmission expansion planning in electricity markets,"
IEEE T. Power Syst., vol. 23, no. 1, Feb. 2008, pp. 238‚Äí248. [34] K. Padiyar, R. Shanbhag, "Comparison of methods for transmission system expansion using
network flow and DC load flow models", International Journal of Electrical Power and Energy Systems, vol. 10, no. 1, Jan. 1988, pp. 17-24.
[35] B. Alizadeh, S. Jadid, "Reliability constrained coordination of generation and transmission expansion planning in power systems using mixed integer programming", IET Generation, Transmission and Distribution, vol. 5, no. 9, Sept. 2011, pp. 948-60.
[36] M. Rider, A. Garcia, R. Romero, "Power system transmission network expansion planning using AC model", IET Generation, Transmission and Distribution, vol. 1, no. 5, Sept. 2007, pp. 731-742.
[37] R.A. Hooshmand, R. Hemmati, M. Parastegari, "Combination of AC transmission expansion planning and reactive power planning in the restructured power system", Energy Conversion and Management, vol. 55, March 2012, pp. 26-35.
[38] C. A. Sima, M. O. Popescu, C. L. Popescu and V. Dumbrava, "Storage integration for optimal grid support," 2020 IEEE International Conference on Environment and Electrical Engineering and 2020 IEEE Industrial and Commercial Power Systems Europe (EEEIC / I&CPS Europe), Madrid, Spain, 2020, pp. 1-6.
[39] J. Choi, T. Mount and R. Thomas, "Transmission System Expansion Plans in View Point of Deterministic, Probabilistic and Security Reliability Criteria," Proceedings of the 39th Annual Hawaii International Conference on System Sciences (HICSS'06), 2006, pp. 247b-247b, doi: 10.1109/HICSS.2006.510.
[40] N. G. Ude, H. Yskandar, R. C. Graham, "A Comprehensive State-of-the-Art Survey on the Transmission Network Expansion Planning Optimization Algorithms", Access IEEE, vol. 7, pp. 123158-123181, 2019.
[41] P. V. Pengo, G. Rebello, E. Jose de Oliveira, I. Chaves da Silva Junior, "Transmission Line Exclusion Algorithm to Solve the Expansion Planning Problem", PowerTech 2019 IEEE Milan, pp. 1-6, 2019.
[42] J. Zhan, W. Liu and C. Y. Chung, "Stochastic Transmission Expansion Planning Considering Uncertain Dynamic Thermal Rating of Overhead Lines," in IEEE Transactions on Power Systems, vol. 34, no. 1, pp. 432-443, Jan. 2019, doi: 10.1109/TPWRS.2018.2857698.
[43] C. A. Sima, G. C. Lazaroiu, V. Dumbrava, G. C. Lazaroiu, C. Panait and M. Roscia, "Deterministic Approach for Generation and Transmission Expansion Planning," 2018 5th International Symposium on Environment-Friendly Energies and Applications (EFEA), 2018, pp. 1-6, WOS:000458100600065.
[44] D. Sainju, R. Sinha, B. R. Pokhrel, “Static Expansion Planning of Transmission Line Using Mixed Integer Linear Programming Method”, in Proc. 2016 IEEE 6th Conference on Power Systems (ICPS), New Delhi, India, March 2016.
[45] A. Capasso, A. Cevrone, R. Lamedica, L. Palagi, “A new deterministic approach for transmission system planning in deregulated electricitymarkets,” Int. J. Elec. Power, vol. 73, June 2015, pp. 1070‒1078.
[46] C. A. Sima, M. Octavian Popescu, C. L. Popescu, M. Alexandru and G. Lazaroiu, "Increasing RESs Share Using Generation and Transmission Expansion Planning - Stochastic Approach," 2019

39
11th International Symposium on Advanced Topics in Electrical Engineering (ATEE), Bucharest, Romania, 2019, pp. 1-6, WOS:000475904500057.
[47] C. A. Sima, M. O. Popescu, C. L. Popescu and G. Lazaroiu, "RESs Integration and Transmission Expansion Planning Considering Load Shedding Costs," 2019 IEEE Milan PowerTech, 2019, pp. 1-6, WOS:000531166202041.
[48] J. L. Higle, “Stochastic programming: optimization when uncertainty matters,” Tutorials in Operations Research, Chapter 2, 2014, Editura Informs, pp.30-53.
[49] C. A. Sima, G. C. Lazaroiu, V. Dumbrava and M. Costoiu, "A Deterministic Approach for Generation Expansion Planning Optimization," 2018 IEEE PES Innovative Smart Grid Technologies Conference Europe (ISGT-Europe), 2018, pp. 1-6, WOS:000458690200128.
[50] C.A. Sima, G.C. Lazaroiu, V. Dumbrava, M. Roscia, D. Zaninelli and P. Duquenne, "Stochastic programming approach for TEP optimization considering RES integration in electricity marke," Proc. 2017 Int. Conf. ENEGY and ENVIRONMENT (CIEM), pp. 485-489, 2017.
[51] C. L. Popescu and M. O. Popescu, "Life in 2030-brief presentation from the IEEE reviews," 2013 8TH INTERNATIONAL SYMPOSIUM ON ADVANCED TOPICS IN ELECTRICAL ENGINEERING (ATEE), Bucharest, 2013, pp. 1-4.
[52] A.J. Conejo, L. B. Morales, S. J. Kazempour, A.S. Siddiqui, „Investment in Electricity Generation and Transmission”, Springer, 2016.
[53] A. Soroudi, A. Rabiee, A. Keane, Stochastic real-time scheduling of wind-thermal generation units in an electric utility. IEEE Syst. J. PP(99), 1-10 (2015).
[54] S.X. Chen, H.B. Gooi, M.Q. Wang, “Sizing of energy storage for microgrids,” IEEE Trans. Smart Grid, vol. 3, no. 1, pp. 142–151, 2012.
[55] S. A. Helal, R. J. Najee, M. O. Hanna, M. F. Shaaban, A. H. Osman and M. S. Hassan, "On optimal scheduling for smart homes and their integration in smart grids," 2017 IEEE 30th Canadian Conference on Electrical and Computer Engineering (CCECE), Windsor, ON, 2017, pp. 1-4.
[56] K. Ogimi, K. Uchida, A. Yona and T. Senjyu, "Optimal operation method for DC smart-house with smart grid considering forecasted error," 8th International Conference on Power Electronics - ECCE Asia, Jeju, 2011, pp. 1126-1131.
[57] B. Zaker and M. Mohammadi, "Probabilistic optimal operation of a smart grid including wind power generator units," Iranian Conference on Smart Grids, Tehran, 2012, pp. 1-5.
[58] C.A. Sima, Popescu, M.O., Popescu, C.L. "Sensitivity analysis of optimal economic dispatch," (2020) UPB Scientific Bulletin, Series C: Electrical Engineering and Computer Science, 82 (2), pp. 223-236, WOS:000538186100017.
[59] C. A. Sima, M. O. Popescu, C. L. Popescu and M. Roscia, "Optimal Operation of a Renewable Energy Power System," 2019 IEEE PES Innovative Smart Grid Technologies Europe (ISGT-Europe), Bucharest, Romania, 2019, pp. 1-5, WOS:000550100400155.
[60] A. Soroudi, Power System Optimization Modeling in GAMS, Ed. Springer, 2017. [61] H. Sharma and S. Mishra, "Hybrid Optimization Model for Smart Grid Distributed Generation
Using HOMER," 2019 3rd International Conference on Recent Developments in Control, Automation & Power Engineering (RDCAPE), 2019, pp. 94-99, doi: 10.1109/RDCAPE47089.2019.8979121.
[62] Ali M. Eltamaly, Mohamed A. Mohamed, M. S. Al-Saud & Abdulrahman I. Alolah (2017) Load management as a smart grid concept for sizing and designing of hybrid renewable energy systems, Engineering Optimization, 49:10, 1813-1828.
[63] C. A. Sima, M. O. Popescu, C. L. Popescu, M. Alexandru, L. B. Popa, V. Dumbrava, C. Panait, "Energy Management of a Cluster of Buildings in a University Campus," 2021 12th International Symposium on Advanced Topics in Electrical Engineering (ATEE), 2021, pp. 1-6.
[64] Jeslin Drusila Nesamalar, S. Suruthi, S. Charles Raja, Karthick Tamilarasu, Techno-economic analysis of both on-grid and off-grid hybrid energy system with sensitivity analysis for an educational institution, Energy Conversion and Management, Volume 239, 2021, 114188
[65] Brahim Belmahdi, Abdelmajid El Bouardi, Simulation and Optimization of Microgrid Distributed Generation: a Case Study of University Abdelmalek Essadi in Morocco, Procedia Manufacturing, Volume 46, 2020, Pages 746-753.

40
[66] H. Sharma and G. Kaur, "Optimization and simulation of smart grid distributed generation: A case study of university campus," 2016 IEEE Smart Energy Grid Engineering (SEGE), 2016, pp. 153-157, doi: 10.1109/SEGE.2016.7589517.
[67] K. S. Khan, Z. Ullah, B. Khan, I. Sami, S. M. Ali and C. A. Mehmood, "Assessment of hybrid off-grid wind photovoltaic system: A case study of university campus," 2017 International Conference on Energy Conservation and Efficiency (ICECE), 2017, pp. 16-21, doi: 10.1109/ECE.2017.8248822.
[68] M. S. Purser, Y. Kalaani and R. J. Haddad, "A technical and economical study of implementing a micro-grid system at an educational institution," 2015 IEEE Power & Energy Society Innovative Smart Grid Technologies Conference (ISGT), 2015, pp. 1-5, doi: 10.1109/ISGT.2015.7131781.
[69] M. I. Muhamad, M. A. M. Radzi, N. I. A. Wahab, H. Hizam and M. F. Mahmood, "Optimal design of hybrid renewable energy system based on solar and biomass for halal products research institute, UPM," 2014 IEEE Innovative Smart Grid Technologies - Asia (ISGT ASIA), 2014, pp. 692-696, doi: 10.1109/ISGT-Asia.2014.6873876.
[70] Kermani, M (Kermani, Mostafa); Adelmanesh, B (Adelmanesh, Behin); Shirdare, E (Shirdare, Erfan); Sima, CA (Sima, Catalina Alexandra); Carni, DL (Carni, Domenico Luca); Martirano, L (Martirano, Luigi), „Intelligent energy management based on SCADA system in a real Microgrid for smart building applications”, Renewable Energy, vol. 171, Jun. 2021, pp. 1115-1127, WOS:000637528400006, Q1.
[71] Mohammed H. Alsharif, Rosdiadee Nordin, Mahamod Ismail, Green wireless network optimisation strategies within smart grid environments for Long Term Evolution (LTE) cellular networks in Malaysia, Renewable Energy, Volume 85, 2016, Pages 157-170.
[72] H. Shahinzadeh, M. Moazzami, S. H. Fathi and G. B. Gharehpetian, "Optimal sizing and energy management of a grid-connected microgrid using HOMER software," 2016 Smart Grids Conference (SGC), 2016, pp. 1-6, doi: 10.1109/SGC.2016.7882945.
[73] https://www.enel.ro/enel-energie/ro/Prosumatori.html, accesat la data de 20 aprilie 2021. [74] https://www.opcom.ro/pp/home.php, accesat la data de 20 aprilie 2021. [75] https://microgridnews.com/category/events/homer-webinars/, accesat la data de 25 februarie 2021. [76] https://www.homerenergy.com, accesat la data de 25 februarie 2021.