Embed Size (px)
Citation preview

THESIS
Presented to obtain the degrees of
Doctor of
Centre international d’études supérieures en sciences
agronomiques (France)
And
Doctor of Philosophy
of Kasetsart University (Thailand)
Graduate School of Kasetsart University (Thailand)
Doctoral School « Sciences des Procédés – Sciences des Aliments (SPSA) » (France)
Fields: Tropical Agriculture (Thailand)
Biotechnology‐Microbiology (France)
Presented by
Natedao MUSIGAMART
Defended on 13 MARCH 2015
Jury
Ms. FERREIRA-DIAS, S. Professor, Universidade de Lisboa Reviewer M. KASEMSAP, P. Professor, Kasetsart University Reviewer Ms. FULCRAND, H. M. OUSAWAT, C. M. DUBREUCQ, E.
Researcher, Professor, Professor,
INRA UTCC Montpellier SupAgro
Examiner Examiner Examiner
M. SRIROTH, K. Professor, Kasetsart University Examiner M. VAYSSE, L. Researcher, CIRAD Examiner Ms. LIENGPRAYOON, S. Researcher, Kasetsart University Examiner
Thesis Directors : Eric DUBREUCQ and Klanarong SRIROTH
Study of the role of lipids from maturated coagula from Hevea brasiliensis latex on
natural rubber behavior in oxidative conditions

i
ABSTRACTS (English, French, Thai)
Study of the role of lipids from maturated coagula from Hevea brasiliensis latex
on natural rubber behavior in oxidative conditions
Abstract
Natural rubber (NR), a derived product from H. brasiliensis latex, is known for its high mechanical properties that are, for some, superior to those of its synthetic counterparts. However, the high degree of unsaturation of poly(cis-1,4-isoprene) makes it susceptible to thermo-oxidation. Fortunately, NR is endowed with non-isoprene components of which some have antioxidant properties. Especially, lipids, the main non-isoprene component retained in NR, have been reported to contain antioxidant substances, especially tocotrienols. It is well known that during the maturation of latex coagula, both NR physical properties and chemical composition are altered, but the complex mechanisms of this alteration are still to be elucidated. In the present work, the evolution of some native antioxidant molecules during maturation was followed in relation with some physical properties. Two experimental conditions of maturation were chosen. The first experiment involved uncontrolled conditions based on traditional unsmoked (USS) or ribbed smoked sheet (RSS) processing, while the second was performed in a dedicated maturation device with full control of environmental factors (relative humidity, temperature and oxygen content) followed by a processing based on that of Technically Specified Rubber (TSR). The evolution of samples during maturation was studied at different scales: bulk properties (P0, P30 and PRI), mesostructure (% gel content, Mw and Mn) and biochemical composition (lipids components). In parallel, in vitro antioxidant activity of NR lipid extracts was also investigated using an optimized DPPH method. Lipid quantity and quality evolved during maturation, especially under aerobic conditions. The total amount of lipid extract decreased, with a release of free fatty acids at early stage of maturation followed by a later decrease, unsaturated fatty acids being the first to disappear. The amount of extractable free γ-tocotrienol did not change much during maturation, while its esterified form was enriched in saturated fatty acids. The antioxidant activity measured in vitro correlated well with free γ-tocotrienol concentration but not with the resistance of rubber to thermo-oxidation assessed by P30 or PRI. Indeed, the in vitro conditions of measurement were far from those occurring inside rubber material. The localization of antioxidants in rubber and especially their physical possibility to interact with the double bonds of poly(cis-1,4-isoprene) or with oxidant species should be further investigated to understand what drives the drop of P30 along maturation time. Non-extractable lipids or more polar non-isoprene molecular species (proteins, polyphenols, etc…) could also influence the resistance to thermo-oxidation.
Keywords Natural rubber, Hevea brasiliensis, lipids, thermo-oxidation, antioxidants.

ii
Etude du rôle des lipides de coagula maturés de latex d’Hevea brasiliensis sur le
comportement du caoutchouc en conditions oxydantes
Résumé
Le caoutchouc naturel (CN), un produit dérivé du latex d’Hevea brasiliensis, est connu pour ses propriétés mécaniques supérieures pour certaines à celles de ses concurrents synthétiques. Néanmoins, le haut degré d’insaturation du poly(cis-1,4-isoprene) le rend susceptible à la thermo-oxydation. Heureusement, le CN est doté de composés non-isoprènes dont certains ont des propriétés antioxydantes. Les lipides sont les plus importants non-isoprènes retenus dans le caoutchouc et contiennent des molécules à activité antioxydante en particulier les tocotriènols. Il est connu que durant la maturation de coagula de latex, la composition chimique et les propriétés du caoutchouc obtenu sont altérées, mais les mécanismes complexes de cette altération ne sont pas encore complètement élucidés. Dans cette étude, l’évolution de certaines molécules antioxydantes natives pendant la maturation a été suivie en relation avec certaines propriétés physiques du caoutchouc. Deux expérimentations de maturation ont été mises en œuvre. La première mettait en jeu des conditions non contrôlées de maturation suivies d’un procédé de confection du caoutchouc basé sur celui des feuilles fumées (RSS) ou non (USS). La seconde a été conduite dans un dispositif expérimental dédié permettant le contrôle des facteurs de l’environnement tels que l’humidité relative, la température et la concentration en oxygène. Le procédé de confection du caoutchouc était dans ce cas basé sur celui des caoutchoucs spécifiés techniquement (TSR). L’évolution des échantillons pendant la maturation a été étudiée à différentes échelles : propriétés en masse (P0, P30 et PRI), mésostructure (% gel, Mw and Mn) et composition biochimique (lipides). En parallèle, l’activité antioxydante in vitro des extraits lipidiques correspondants a été mesurée en utilisant une méthode DPPH optimisée. La quantité et la qualité des lipides extraits évoluent pendant la maturation, en particulier en aérobiose. La quantité totale de lipides décroit, avec, en début de maturation, une libération d’acides gras dont la quantité diminue ensuite, avec une disparation des espèces insaturées en premier. La quantité de γ-tocotrienol libres extraits change peu au cours de la maturation alors que sa forme estérifiée montre un enrichissement en acides gras saturés. L’activité antioxydante de l’extrait lipidique mesurée in vitro est corrélée avec la concentration de γ-tocotrienol libre mais pas avec les valeurs de P30 et PRI qui estiment la résistance du caoutchouc à la thermo-oxydation. Cette absence de corrélation pourrait être due à la différence des conditions de mesure in-vitro de celles existantes au sein du matériau caoutchouc. La localisation des antioxydants dans le caoutchouc et en particulier leur possibilité physique d’interagir avec les doubles liaisons du poly(cis-1,4-isoprene) ou avec des espèces oxydantes reste à étudier afin de comprendre ce qui régit la chute de P30 au cours de la maturation. Des lipides non-extractibles ou des molécules non-isoprènes plus polaires (protéines, polyphénols, …) pourraient également influencer la résistance du caoutchouc à la thermo-oxydation.
Mot clés Caoutchouc naturel, Hevea brasiliensis, lipides, thermo-oxydation, antioxydants

iii
การศกษาบทบาทขององคประกอบไขมนในยางกนถวยทเตรยมจากนายางธรรมชาตตอการเปลยนแปลงสมบตภายใตสภาวะการเกดออกซเดชน
บทคดยอ
ยางธรรมชาตทไดจากการแปรรปนายางพารา Hevea brasiliensis มคณสมบตทางกลทดกวายางสงเคราะห อยางไรกตามโครงสรางของ poly (cis-1,4-isoprene) ทประกอบดวยพนธะคจานวนมากทาใหออนแอตอกระบวนการออกซเดชน แตยางพารากมกลมของสารตามธรรมชาตทมคณสมบตในการตานอนมลอสระททาใหเกดกระบวนการออกซเดชน โดยเฉพาะสารกลมไขมนซงถอเปนสารกลมทไมใชยางกลมหลกทคงอยในยางธรรมชาตทมรายงานวามสมบตเปนสารตานอนมลอสระโดยเฉพาะ tocotrienols เปนททราบดวาในระหวางการบมยางกนถวยมการเปลยนแปลงทงคณสมบตทางกายภาพและทางเคมของยางธรรมชาต ซงกลไกททาใหเกดการเปลยนแปลงนยงคงไมเปนททราบแนชด วตถประสงคของงานวจยนเพอตดตามการเปลยนแปลงของสารตานอนมลอสระตามธรรมชาตทสมพนธกบการเปลยนแปลงของสมบตทางกายภาพ โดยทดลองทาการบมตวอยางยางธรรมชาตในสองสภาวะคอ สภาวะทไมมการควบคมปจจยแวดลอมโดยใชหลกการเดยวกนกบการทายางแผนดบหรอยางแผนรมควน ในขณะทการทดลองทสองจะทาการบมตวอยางในเครองบมทมออกแบบใหสามารถควบคมปจจยแวดลอมได (ความชนสมพทธ, อณหภม และปรมาณออกซเจน) โดยใชกระบวนการในการเตรยมตวอยางเชนเดยวกบการผลตยางแทง TSR ทาการศกษาการเปลยนแปลงของตวอยางในระหวางการบมทแตละระดบโครงสราง ไดแก คณสมบตทางกายภาพ (P0, P30 and PRI), โครงสรางระดบ mesostructure (%gel content, Mw และ Mn) และองคประกอบทางชวเคม (องคประกอบของไขมน) รวมถงสมบตในการตานอนมลอสระของไขมนดวยวธ DPPH โดยผลพบวาทงชนดและปรมาณไขมนมการเปลยนแปลงในระหวางการบมโดยเฉพาะในสภาวะทมออกซเจน ในชวงแรกของการบมปรมาณของไขมนทงหมดลดลงพรอมกบการปลดปลอยกรดไขมนอสระ หลงจากนนมแนวโนมลดลงโดยกรดไขมนไมอมตวเปนกลมแรกทสลายตว ปรมาณของ γ-tocotrienol ทสกดไดในรปอสระไมมการเปลยนแปลงทชดเจนในระหวางการบม ในขณะทรป esterified มกรดไขมนอมตวเปนองคประกอบโดยสวนใหญ ผลการทดสอบสมบตในการตานอนมลอสระแบบ in vitro ดวยเทคนค DPPH พบวามความสมพนธกบความเขมขนของ γ-tocotrienol ในรปอสระ แตไมสมพนธกบระดบความตานทางตอการเกดออกซเดชนเมอตรวจสอบจากคา P30 หรอ PRI โดยแทจรงแลวการทดสอบแบบ in vitro มความแตกตางจากสภาวะทเกดขนจรงในยางธรรมชาตเปนอยางมาก ดงนนควรมการศกษาเพมเตมทงตาแหนงของสารตานอนมลอสระในยาง โดยเฉพาะความเปนไปไดในการเขาถงตาแหนงพนธะคในโครงสรางของยางธรรมชาตรวมถงอนมลอสระเพอทาความเขาใจถงกลไกทขบเคลอนใหเกดการลดลงของคา P30 ในระหวางการบม นอกจากนไขมนทไมถกสกดออกมา หรอสารกลมทไมใชยางชนดอนทมความเปนขวมากกวา (โปรตน, โพลฟนอล และอน ๆ) อาจมอทธพลตอระดบความตานทานตอกระบวนการออกซเดชนเชนเดยวกน คาสาคญ ยางธรรมชาต, Hevea brasiliensis, ไขมน, กระบวนการออกซเดชน, สารตานอนมลอสระ

iv
ACKNOWLEDGMENTS
This work has been carried out under the collaboration between CIRAD, Montpellier
SupAgro and Kasetsart University. The work was financially supported by French-Thai
committee project, CIRAD, Montpellier SupAgro, EURASIA 2 and Kasetsart University
which is gratefully acknowledged.
I would like to express my gratitude to Professor Dr. Eric Dubreucq, my Ph.D.
director from Montpellier SupAgro and Assoc. Professor Dr. Klanarong Sriroth, my Ph.D.
director from Kasetsart University for their invaluable advice, guidance, support and
encouragement throughout my Ph.D. study.
I am sincerely grateful to the two reviewers of this thesis, Professor Suzana Ferreira-
Dias from Instituto Superior de Agronomia (ISA), Universidade de Lisboa (ULisboa),
Portugal and Assoc. Professor Dr. Poonpipope Kasemsap from Kasetsart University,
Thailand.
My deepest gratitude goes to my thesis committees, Dr. Laurent Vaysse and Dr.
Siriluck Liengprayoon. You made this thesis possible; your support throughout my work is
precious. Thank you very much for being so patient when helping me to write this
manuscript. Especially for Dr. Laurent Vaysse, thank you for helping me not only to learn
how to engage myself in a research work, but also showed me the good definition of real
scientific quality in the work and let me know that I might have one.
I am sincerely thankful for Dr. Hélène FULCRAND from INRA, Assoc. Professor Dr.
Chiradet OUSAWAT from University of Thai Chamber of Commerce, Dr. Frederic Bonfils
and Dr. Jerome Sainte-Beuve from CIRAD-UMR IATE, Montpellier for their advice and
useful discussions in this work.
I deeply appreciate my former M.S. advisor, Assoc. Professor Dr. Sornprach
Thanisawanyangkura for his constant encouragement, supports and sincere care to lead me a
step forward.

v
I would like to thank to Christine, Karim, Veronique, Jerome, Nathalie, Bruno,
Claudia and Erica for their experimental help. Thank you to everyone in Building 32 and 33
Montpellier SupAgro, France for their friendship and all the help they have given me in the
lab and the office.
My thankfulness is also to all my Thai friends who have cheered me up through
several hard times. Thanks to Pi Por, Nong Jum, Pi Rot, Dr. Celine, Eve, Jack, Kob, Kade,
Pookie, Tan and everyone in LBTNR lab for their valuable friendship and constant supports.
Thanks a lot to my lovely sister, Pi Au (+Khun Andre) and “DORAS” friends who listened
and prayed for me throughout my study.
Many people have accompanied me along the way, both as colleagues and as friends.
To list all the names would be impossible in a limited page, so I would like to thank all who
their names are not mentioned here but they have greatly inspired and encouraged me until
this PhD came to a perfect end.
Most importantly, I would like to thank my parents and my family for their
unconditional love and strong support no matter how far away I live.
To this end, I take full responsibility for any mistake that may be found in this thesis.

vi
TABLE OF CONTENT
ABSTRACTS (ENGLISH, FRENCH, THAI) ........................................................................... I ACKNOWLEDGMENTS ............................................................................................................ IV TABLE OF CONTENT ............................................................................................................... VI LIST OF TABLES ........................................................................................................................ XI LIST OF FIGURES .................................................................................................................... XII GENERAL INTRODUCTION .................................................................................................... 1 LITERATURE REVIEW ............................................................................................................. 3
1. Present situation of natural rubber ..................................................................................................... 3 2. Natural rubber latex and raw rubber production ............................................................................. 4
2.1 Tapping and latex collection ............................................................................................................ 4 2.2 Raw natural rubber production ......................................................................................................... 5
3. Natural rubber structure and properties ........................................................................................... 9 3.1 Latex composition ............................................................................................................................ 9 3.2 Natural rubber mesostructure ......................................................................................................... 14 3.3 Natural rubber properties ................................................................................................................ 16
4. Natural rubber maturation ................................................................................................................ 17 4.1 Modification of latex biochemical composition during maturation .............................................. 18 4.2 Evolution of NR structure and properties during maturation ........................................................ 19
5. NR oxidation and antioxidants .......................................................................................................... 21 5.1 NR oxidation ................................................................................................................................... 21 5.2 Antioxidants .................................................................................................................................... 23 5.3 Native antioxidant in natural rubber .............................................................................................. 25 5.4 Antioxidant activity assay .............................................................................................................. 29
MATERIALS AND METHODS ............................................................................................... 31
1. Standards and chemicals .................................................................................................................... 31 2. Latex sources ........................................................................................................................................ 32
2.1 Latex source for uncontrolled maturation conditions experiment ................................................. 32 2.2 Latex source for controlled maturation conditions experiment ..................................................... 32
3. Maturated sample preparation .......................................................................................................... 33 3.1 Unsmoked rubber sheet (USS) preparation ................................................................................... 33 3.2 NR sample prepared under uncontrolled maturation conditions (mini-sheets) ............................ 33 3.3 Natural rubber sample prepared under controlled maturation conditions ..................................... 34 3.4 Maturation box device .................................................................................................................... 37
4. Lipid extraction from dry rubber...................................................................................................... 38 5. Lipid composition analysis ................................................................................................................. 39
5.1 Qualitative analysis of lipids by thin layer chromatography (TLC) ............................................. 39 5.2 Quantitative analysis of lipids by high performance thin layer chromatography (HPTLC) ........ 39 5.3 Total fatty acid and unsaponifiable compositions analysis by GC-FID/MS ................................. 44 5.4 γ-tocotrienol derivertives identification ......................................................................................... 47
6. Natural rubber properties measurement ......................................................................................... 49 6.1 Determination of dry rubber properties, Initial plasticity (P0) and PRI ........................................ 49 6.2 Mesostructure analysis by size exclusion chromatography coupled with a multi-angle scattering detector, SEC-MALS............................................................................................................................ 51

vii
7. Antioxidant activity test of total lipid using 2,2-diphenyl-1-picrylhydrazyl, DPPH method ..... 52 7.1 γ-tocotrienol and NR lipid extracts samples antioxidant measurement ........................................ 52 7.2 Method repeatability and reproducibility ....................................................................................... 53
CHAPTER 1: METHODOLOGY DEVELOPMENT .......................................................... 55
1. Introduction ......................................................................................................................................... 55 2. Maturated mini-sheet preparation .................................................................................................... 56
2.1 Effect of volume reduction ............................................................................................................. 56 2.2 Effect of latex dilution .................................................................................................................... 59 2.3 Effect of the drying method ........................................................................................................... 59 2.4 Maturation duration ........................................................................................................................ 62
3. Optimization of High Performance Thin Layer Chromatography (HPTLC) for NR lipid composition analysis ................................................................................................................................ 64
3.1 Mobile phase optimization ............................................................................................................. 65 3.2 Standard calibration curve .............................................................................................................. 66 3.3 Repeatability and reproducibility of the HPTLC method ............................................................. 68 3.4 Conclusion ...................................................................................................................................... 68
4. Optimization of 2,2-di-phenyl-1-picrylhydrazyl (DPPH) antioxidant activity assay for NR lipids .......................................................................................................................................................... 71
4.1 Solvent modification ...................................................................................................................... 71 4.2 Comparison of a microplate spectrophotometer and cuvette spectrophotometer measurements . 72 4.3 Standard concentration range ......................................................................................................... 73 4.4 Measurement repeatability and reproducibility ............................................................................. 74 4.5 Conclusion ...................................................................................................................................... 74
5. Structural identification of γ-tocotrienol derivatives ...................................................................... 77 5.1 γ-tocotrienol derivatives identification from γ-tocotrienol standard ............................................. 77 5.2 Tocotrienol derivatives identification from NR lipid extract ........................................................ 78 5.3 Conclusion ...................................................................................................................................... 91
CHAPTER 2: CHARACTERIZATION OF THE STRUCTURE, PROPERTIES AND BIOCHEMICAL COMPOSITION OF NATURAL RUBBER OBTAINED FROM COAGULA MATURATED UNDER UNCONTROLLED CONDITION AND TREATED USING A USS OR RSS LIKE PROCESSING ................................................. 92
1. Initial pH of latex, and pHs of coagula and serum during maturation......................................... 93 2. Fresh and dry matter of laminated mini-sheets ............................................................................... 94 3. Evolution of bulk properties of NR from matured coagula under uncontrolled maturation conditions (USS/RSS like process) ......................................................................................................... 96 4. Evolution of lipid extract composition of NR from matured coagula under uncontrolled maturation conditions (USS/RSS like process) .................................................................................. 100
4.1 Lipid quantity ............................................................................................................................... 100 4.2 Qualitative analysis of lipid evolution during maturation ........................................................... 101 4.3 Quantitative analysis of lipid evolution during maturation ......................................................... 104
5. In vitro antioxidant activity test of NR lipid extract by 2,2-di-phenyl-1-picrylhydrazyl (DPPH) method..................................................................................................................................................... 118
5.1 Antioxidant activity of lipid extracts from rubber obtained from maturated coagula ................ 118 5.2 Antioxidant activity of purified γ-tocotrienol derivatives ........................................................... 123
6. Conclusion .......................................................................................................................................... 125

viii
CHAPTER 3: CHARACTERIZATION OF THE STRUCTURE, PROPERTIES AND BIOCHEMICAL COMPOSITION OF NATURAL RUBBER OBTAINED FROM COAGULA MATURATED UNDER CONTROLLED CONDITION AND TREATED USING A TSR LIKE PROCESS ............................................................................................ 126
1. Initial pH of latex, and pHs of coagula and serum during maturation....................................... 126
1.1 Comparison with uncontrolled conditions ................................................................................... 126 1.2 pH follow-up of mini-coagula samples under controlled conditions .......................................... 127
2. Fresh and dry matter of mini-crepes .............................................................................................. 129 2.1 Comparison with uncontrolled conditions ................................................................................... 130 2.1 Evolutions of fresh and dry matter of maturated coagula under controlled conditions .............. 130
3. Evolution of bulk properties of NR from maturated coagula under controlled maturation conditions (TSR like process) ............................................................................................................... 132
3.1 Comparison with uncontrolled conditions ................................................................................... 132 3.2 Evolution of bulk properties of mini-crepes under controlled conditions .................................. 133
4. Mesostructure analysis ..................................................................................................................... 137 4.1 Total gel content ........................................................................................................................... 137 4.2 Weight-average molar mass (Mw) and number-average molar mass (Mn) ................................. 140
5. Evolution of lipid extract composition from matured coagula under controlled maturation conditions (TSR like process) ............................................................................................................... 142
5.1 Lipid quantity ............................................................................................................................... 142 5.2 Qualitative analysis of lipid evolution during maturation ........................................................... 143 5.3 Quantitative analysis of lipid evolution during maturation ......................................................... 146
6. In vitro antioxidant activity test of NR lipid extract by 2,2-di-phenyl-1-picrylhydrazyl (DPPH) method..................................................................................................................................................... 159
6.1 Comparison with uncontrolled experiment .................................................................................. 159 6.2 Evolution of lipids extract antioxidant activity under controlled conditions .............................. 161
7. Conclusion .......................................................................................................................................... 162 GENERAL CONCLUSION .................................................................................................... 165 REFERENCES .......................................................................................................................... 172
APPENDICES 181

ix
LIST OF TABLES
Table 1 The specifications of different grades of TSR rubber. .......................................................... 8 Table 2 List of standards, solvents and chemicals. ........................................................................... 31 Table 3 The sample treatments and maturation conditions of mini-cup coagula. ............................ 36 Table 4 Lipid standards for HPTLC calibration curves. ................................................................... 43 Table 5 Concentrations of standard solution injected in GC (mg.mL-1) .......................................... 45 Table 6 Concentrations of standard solution injected in GC-MS (mg.mL-1) ................................... 46 Table 7 Concentration ranges of tocotrienol and tocopherol standards used for DPPH
antioxidant activity method repeatability and reproducibility. .......................................... 54 Table 8 Physical properties of USS (3 L of latex) and mini-USS (500 mL of latex) from
RRIM600 and PB235 clones. ............................................................................................ 57 Table 9 Physical properties of mini-USS prepared from diluted and non-diluted latex of
RRIM600 and PB235 clones. ............................................................................................ 59 Table 10 Physical properties of non-maturated mini-USS (day 0) and maturated mini-USS
(day 7) of RRIM600 clone obtained using 3 drying conditions. ....................................... 61 Table 11 Physical properties of non-maturated mini-USS (day 0) and maturated mini-USS
(day 7) of PB235 clone obtained from 3 drying conditions. ............................................. 61 Table 12 Lipid standards concentration levels for calibration curves. ............................................. 66 Table 13 Measurement repeatability obtained from peak area analysis of γ-tocotrienol, sterol,
trioleylglycerols (TG) and free fatty acid (FFA) standards (3 plates on the same day). ... 69 Table 14 Measurement reproducibility obtained from peak area analysis of γ-tocotrienol,
sterol, trioleylglycerols (TG) and free fatty acid (FFA) standards (1 plate/day, 3 working days). ................................................................................................................... 70
Table 15 The initial slope and %DPPHrem60 of α-tocopherol standard at 0.01 and 0.02 mg.mL-1 concentrations obtained from 2 spectrophotometer measurements. .................................. 72
Table 16 Initial slope value and %DPPHrem60 obtained from γ-tocotrienol standard at the concentration of 0, 0.01, 0.02, 0.05, 0.1 and 0.2 mg.mL-1 (3 replications). ...................... 74
Table 17 Measurement repeatability of DPPH assay obtained from initial slope from 0-3 min and % DPPHrem60 of γ-tocotrienol, δ-tocotrienol, α-tocopherol and γ-tocopherol standards (Values were expressed as means ± standard deviations, n=3). ........................ 75
Table 18 Measurement reproducibility of DPPH assay obtained from initial slope from 0-3 min and %DPPHrem60 of γ-tocotrienol, δ-tocotrienol, α-tocopherol and γ-tocopherol standards (Values were expressed as means ± standard deviations, n=3). ........................ 76
Table 19 Absolute value of initial slope obtained from purified γ-tocotrienol dimers (I, II .......... 124 Table 20 The ratio of water contents of fresh laminated crepes and fresh laminated USS sheets
obtained from RRIM600 and PB235 coagula. ................................................................ 130

x
LIST OF FIGURES
Figure 1 World natural rubber production shares (2013). .............................................................. 3 Figure 2 Exportation of NR products of Thailand in year 2013. .................................................... 4 Figure 3 Various fractions of centrifuged latex.. .......................................................................... 10 Figure 4 Examples of inherent molar mass distribution for several natural rubber clones (SEC
in cyclohexane according to Bonfils and Char (2005)). ............................................... 15 Figure 5 Enzymatic and non-enzymatic classification of antioxidants. ....................................... 25 Figure 6 Molecular and chemical structures of tocopherol and tocotrienol. ................................ 27 Figure 7 NR sample preparation for uncontrolled maturation condition experiment. .................. 35 Figure 8 Mini-glass cup (a) and (b) plastic cup for the mini-cup coagula preparation. ............... 37 Figure 9 Flow chart of NR sample prepared under controlled maturation conditions. ................ 41 Figure 10 The maturation device system. ..................................................................................... 42 Figure 11 HPTLC three-dimensional image of the calibration curve of six standards (a) and
(b) an example of calibration curve obtained for free fatty acids standard. ................. 43 Figure 12 Chromatogram of fatty acid methyl ester (FAME) standards (a) and (b) calibration
curve of linoleic acid. ................................................................................................... 45 Figure 13 Chromatogram of unsaponifiable standard mixture (a) and calibration curve of
γ-tocotrienol (b). ........................................................................................................... 47 Figure 14 Doubled rubber sheet with punched test pieces ........................................................... 51 Figure 15 Unsmoked sheet (USS) (a) and (b) mini-USS processing............................................ 58 Figure 16 Physical properties (P0, P30 and PRI) evolution during 14 days of maturation of
sheet coagula from (a) RRIM600 and (b) PB235 rubber clones. ................................. 63 Figure 17 RRIM600 coagula from 2 replications of (a) 3 days and (b) 7 days of maturation. .... 64 Figure 18 TLC pictures obtained from lipid extracts of PB235 rubber from maturated coagula . 65 Figure 19 HPTLC three-dimensional image of the calibration curve of 8 standards (a and b),
(c) the example of calibration curve of γ-tocotrienol commercial standard and (d) γ-tocotrienol ester (peak no. 6) purified from RRIM600 lipid extract. ........................ 67
Figure 20 Variation of % DPPH remaining obtained from γ-tocotrienol standard at the concentration of 0, 0.01, 0.02, 0.05, 0.1 and 0.2 mg.mL-1 (3 replications). ................. 73
Figure 21 TLC of lipids from RRIM600 lipid samples at 0 day (D0), 2 days (D2) and 7 days (D7) of maturation and γ-tocotrienol standard (γ) developed in the mobile phase of hexane/diethyl ether/acetic acid, 80:20:1 (v/v/v). ........................................................ 77
Figure 22 Total ion count chromatogram (TIC) (a) and mass spectra of (b) free γ-tocotrienol (peak 1), γ-tocotrienol dimers at (c) peak 2 and (d) peak 3 obtained from HPLC-MS analysis of γ-tocotrienol standard sample. ............................................................. 79
Figure 23 TLC of the first 20 collected fractions from liquid column chromatography on silica gel from RRIM600 lipid developed in the mobile phase of hexane/diethyl ether/acetic acid, 80:20:1 (v/v/v). ................................................................................. 80

xi
Figure 24 Total ion count chromatogram (TIC) (a) and (b) mass spectrum of γ-tocotrienol dimer obtained from HPLC-MS analysis of RRIM600 lipid extract. .......................... 81
Figure 25 TLC of RRIM600 lipid samples at 0 day (D0), 2 days (D2) of maturation and γ-tocotrienol oxidized standard (γ) developed in (a) mobile phase hexane/diethyl ether/acetic acid, 90:10:1 (v/v/v) compared the same deposits developed with (b) mobile phase hexane/diethyl ether/acetic acid, 80:20:1 (v/v/v). .................................. 82
Figure 26 Total ion count chromatogram (a) and mass spectra of spot no.5 purified from RRIM600 lipid extract at (b) peak 1 at Rt of 18.1 min and (c) peak 2 at Rt of 23.3 min. ............................................................................................................................... 85
Figure 27 Total ion count chromatogram (a) and mass spectra of spot no. 6 purified from RRIM600 lipid extract at (b) peak 1 at Rt of 24.2 min and (c) peak 2 at Rt of 31.5 min. ............................................................................................................................... 86
Figure 28 Total ion count GC-MS chromatogram of (a) saponified and silylated spot no. 5 and (b) silylated spot no. 6 from PB235 lipid extract sample. ..................................... 87
Figure 29 Mass spectra of (a) C16:0, (b) C18:2 and (c) C18:1 from spot no. 5 isolated from PB235 lipid sample. ..................................................................................................... 88
Figure 30 Mass spectra of (a) C16:0, (b) C18:0, (c) C20:0 and (d) γ-tocotrienol from spot no. 6 isolated from PB235 lipid sample. ...................................................................... 89
Figure 31 TLC of (a) γ-tocotrienol oxidized standard, (b) γ-tocotrienol esters fraction before saponification and (c) fraction of γ-tocotrienol esters after saponification obtained from liquid column chromatography of PB235 lipid extract. (2 elution times using mobile phase of hexane/diethyl ether/acetic acid, 50:50:1 and 90:10:1, v/v/v). .......... 90
Figure 32 pH evolutions of (a) RRIM600 and (b) PB235 coagula during 14 days of maturation under uncontrolled conditions. ................................................................... 93
Figure 33 Fresh weight, dry weight and water content of laminated samples obtained from (a) RRIM600 and (b) PB235 rubber clones during 14 days of maturation. ...................... 95
Figure 34 Evolution of physical properties of RRIM600 rubbers obtained from (a) outdoor air drying and (b) smoke drying during 14 days of maturation. ........................................ 98
Figure 35 The evolution of physical properties of PB235 rubbers obtained from (a) outdoor air drying and (b) smoke drying during 14 days of maturation. ................................... 99
Figure 36 Lipid extracts (%w/w dry rubber) of (a) RRIM600 and (b) PB235 maturated sheets from outdoor air and smoke drying during 14 days. .................................................. 100
Figure 37 TLC of total lipid extracts from (a) RRIM600 and (b) PB235 maturated rubbers during 14 days of maturation, developed in hexane/diethyl ether/acetic acid (80:20:1, v/v/v) and detected by 40% orthophosphoric acid and aqueous solution saturated with copper acetate (1:1, v/v). ..................................................................... 103
Figure 38 Evolution of free fatty acids and triacylglycerol of furan fatty acid (% w/w dry rubber) of (a) RRIM600 and (b) PB235 lipid extracts obtained from outdoor air and smoke dried samples during 14 days of maturation. .................................................. 107

xii
Figure 39 Evolution of γ-tocotrienol and its esters (% w/w dry rubber) of (a) RRIM600 and (b) PB235 lipid extracts obtained from outdoor air and smoke dried samples during 14 days of maturation. ................................................................................................ 108
Figure 40 Evolution of sterols and sterol esters (% w/w dry rubber) of (a) RRIM600 and (b) PB235 lipid extracts obtained from outdoor air and smoke dried samples during 14 days of maturation. ..................................................................................................... 109
Figure 41 Evolution of the neutral lipid composition evolution (% w/w dry rubber) of (a) RRIM600 and (b) PB235 lipid extracts obtained from outdoor air and smoke dried samples during 14 days of maturation. ....................................................................... 110
Figure 42 Total fatty acid composition of RRIM600 lipid extracts lipid extracts obtained from (a) outdoor air drying and (b) smoke dried samples during 14 days of maturation. .. 113
Figure 43 Total fatty acid composition of PB235 lipid extracts obtained from (a) outdoor air drying and (b) smoke dried samples during 14 days of maturation. .......................... 114
Figure 44 Unsaponifiable composition of RRIM600 lipid extracts obtained from (a) outdoor air drying and (b) smoke dried samples during 14 days of maturation. ..................... 116
Figure 45 Unsaponifiable composition of PB235 lipid extracts obtained from (a) outdoor air drying and (b) smoke dried samples during 14 days of maturation. .......................... 117
Figure 46 %DPPHrem of RRIM600 lipid extracts obtained from (a) outdoor air drying and (b) smoke drying compared with γ-tocotrienol at 0, 0.01, 0.02 and 0.05 mg.mL-1 concentrations (3 replications) from 0 to 60 min of measurement. ............................ 119
Figure 47 %DPPHrem of PB235 lipid extracts obtained from (a) outdoor air drying and (b) smoke drying compared with γ-tocotrienol at 0, 0.01, 0.02 and 0.05 mg.mL-1 concentrations (3 replications) from 0 to 60 min of measurement. ............................ 120
Figure 48 Correlation between absolute initial slope value and %DPPHrem60 obtained from lipid extracts of RRIM600 and PB235 rubber clones and tocotrienols standards. ..... 121
Figure 49 Absolute values of initial slope obtained from (a) RRIM600 and (b) PB235 lipid samples during 14 days of maturation from outdoor air drying and smoke drying. The numbers in green are the free γ-tocotrienol content in the lipid solution (mg.mL-1) calculated from HPTLC results. N/D: not detected. ................................. 122
Figure 50 pH evolutions of mini-cup coagula obtained from (a) RRIM600 and (b) PB235 rubber clones. ............................................................................................................. 129
Figure 51 Fresh weight, dry weight and water content of mini-creped samples obtained from RRIM600 and PB235 clones during 28 days of maturation. ..................................... 131
Figure 52 Evolutions of physical properties of (a) Na+O-, (b) Na-O- and (c) Na-O+ coagula obtained from RRIM600 clone during 28 days of maturation. .................................. 135
Figure 53 Evolutions of physical properties of (a) Na+O-, (b) Na-O- and (c) Na-O+ coagula obtained from PB235 clone during 28 days of maturation. ....................................... 136
Figure 54 Evolutions of total gel content (%) obtained from (a) RRIM600 and (b) PB235 rubber clones during 28 days of maturation. .............................................................. 139
xiii
Figure 55 Evolutions of weight-average molar mass (Mw) and number-average molar mass (Mn) obtained from (a) RRIM600 and (b) PB235 rubber clones during 28 days of maturation. .................................................................................................................. 141
Figure 56 Lipid extract (% w/w dry rubber) obtained from (a) RRIM600 and (b) PB235 rubber clones during 28 days of maturation. .............................................................. 144
Figure 57 TLC of total lipid extract obtained from (a) RRIM600 and (b) PB235 maturated mini-cup coagula during 28 days from 3 maturation conditions. Developed in hexane/diethyl ether/acetic acid (80:20:1, v/v/v) and detected by 40% orthophosphoric acid and aqueous solution saturated with copper acetate (1:1, v/v). 147
Figure 58 Evolutions of free fatty acids (FFA) and triacylglycerol of furan fatty acid (TGF) (% w/w dry rubber) obtained from (a) RRIM600 and (b) PB235 clones during 28 days of maturation. ..................................................................................................... 151
Figure 59 Evolutions of γ-tocotrienol and its esters (% w/w dry rubber) obtained from (a) RRIM600 and (b) PB235 clones during 28 days of maturation. ................................ 152
Figure 60 Evolutions of free sterols and sterol esters (SE) (% w/w dry rubber) obtained from (a) RRIM600 and (b) PB235 clones during 28 days of maturation. .......................... 153
Figure 61 Evolutions of wax (% w/w dry rubber) obtained from lipid extracts of (a) RRIM600 and (b) PB235 clones during 28 days of maturation. ................................ 154
Figure 62 Neutral lipid component evolutions (% w/w dry rubber) obtained from lipid extracts of (a) RRIM600 and (b) PB235 clones during 28 days of maturation. ......... 155
Figure 63 Total fatty acid composition of RRIM600 lipid extracts obtained from (a) Na+O-, (b) Na-O- and (c) Na-O+ maturation conditions during 28 days of maturation. ....... 157
Figure 64 Total fatty acid composition of PB235 lipid extracts obtained from (a) Na+O-, (b) Na-O- and (c) Na-O+ maturation conditions 28 days of maturation. ........................ 158
Figure 65 Unsaponifiable composition of RRIM600 lipid extracts obtained from (a) Na+O-, (b) Na-O- and (c) Na-O+ maturation conditions during 28 days of maturation. ....... 160
Figure 66 Absolute value of initial slope obtained from (a) RRIM600 and (b) PB235 lipid extracts. The numbers in green are the free γ-tocotrienol content in the lipid solution (mg.mL-1) calculated from HPTLC results. ................................................. 164

1
GENERAL INTRODUCTION
Hevea brasiliensis Müll. Arg., commonly called para rubber tree or rubber tree is the
most economically important latex source for natural rubber (NR) industry. Today, the
world’s three largest producing countries are Thailand, Indonesia and Vietnam, which
together accounted in 2013 for approximately 68% of total NR production (IRSG, 2014).
NR from H. brasiliensis is composed mainly of poly(cis-1,4-isoprene) associated with
a small portion of some biological elements that give NR highly specific properties. These
non-isoprene components comprise proteins, carbohydrates, lipids and inorganic constituents
and represent the main difference between NR and its synthetic counterpart (Vaysse et al.,
2012). Non-isoprene components have been the subject of numerous studies and are claimed
to be involved in many superior mechanical properties of rubber, for instance high green
strength, tack and low internal heat build-up, which are highly required for vehicle tire
manufacturers. Meanwhile, non-isoprene components have also been mentioned to relate
with quality inconsistency of NR compared to synthetic rubber.
NR in raw state is also known to be susceptible to oxidative degradation due to its
structure containing appreciable amounts of double bonds. This results in deterioration of its
physical properties such as initial plasticity (P0) and Plasticity Retention Index (PRI). The
degree of NR resistance to oxidation could vary depending on conditions of rubber
processing. Generally, antioxidants are added during second transformation processing to
improve rubber resistance to oxidation. These antioxidants prevent oxidative deterioration of
the polyisoprene chain by eliminating free radicals. Beside the synthetic antioxidants
commonly used in processing, NR naturally contains its own antioxidant molecules as well
(Nadarajah et al., 1971 ; Hasma, 1984 ; Hasma and Othman, 1990).
Previous comprehensive studies on the influence of lipids, a major non-isoprene class
of molecules, on NR properties reported that some of the non-isoprene substances present in
Hevea latex behaved as antioxidants. Tocotrienols, which are vitamin E derivatives, and plant
sterols, seem to exhibit an antioxidant activity according to a positive correlation observed
with higher PRI of NR (Hasma, 1984 ; Liengprayoon, 2008). Nevertheless, the antioxidant

2
capacity of these components is not yet fully understood. The present work focuses on native
antioxidants from NR samples with a wide range of physical properties. Therefore, NR
samples were prepared under various maturation conditions since it is known to have an
impact on P0 and PRI, two industrial indicators used to determine physical properties and
resistance of NR to thermo-oxidation. To better understand the impact of native antioxidants
against oxidation, NR properties and antioxidant activity of lipids extracts obtained from the
different conditions were determined.
The first part of this thesis, reviews general information concerning the production,
biochemical composition and non-isoprene components of NR, and the current knowledge on
native antioxidants and their influence on rubber properties. The experimental part of this
work is divided into three chapters. The first one presents the methodological developments
realized for this work; the second and third part concerns the evolution of lipid composition
of NR obtained from uncontrolled and controlled maturation, respectively. In these two
experimental setups, structure and properties of maturated rubber samples and antioxidant
activity of NR lipids will be described. The kinetic of evolution of lipid components during
maturation will be presented in details.

3
LITERATURE REVIEW
1. Present situation of natural rubber
Over the past decade, the share of the global consumption of NR in the elastomer
market stayed steady around 42%. In 2013, the world production of NR was about 12 million
tons (IRSG, 2014); around 93% of the NR world production comes from Asian countries as
presented in Figure 1.
Figure 1 World natural rubber production shares (2013).
Data Source: (IRSG, 2014)
For Thailand, around 4.1 million tons of the NR produced in year 2013 held more
than one third of total world NR production (IRSG, 2014). Within this quantity, various NR
grades are produced and exported including concentrated latex (19%), block rubber (38%),
sheet rubber (22%), compound rubber (19%) and others (2%) as shown in Figure 2. The raw
NR produced in the world as well as in Thailand is marketed more in dry form and available
in different grades. Sheet and crepe rubbers were the two marketable forms of dry NR before
the introduction of technically specified rubber (TSR). TSR is a modern form of marketable
rubber and can be produced from latex, field coagulum or a blend of both. Advantages of
TSR are assurance of quality with respect to important technical parameters, clean and easy

4
handling and packing, minimum storage space and reduction in processing time (George and
Kuruvilla Jacob, 2000).
Figure 2 Exportation of NR products of Thailand in year 2013.
Data source: RRIT (2014)
Among the various grades of TSR, TSR20 is the most commonly exported grade for
the top exporting countries. In TSR20 rubber processing, the raw material is cup coagula (or
cuplump) blended or not with low grade rubber sheets. Cup coagula are coagulated rubber.
They present variable qualities related to their origins and collection methods between
tapping and processing. The primary processing of latex to raw rubbers as well as production
of various forms of dry NR are described afterwards.
2. Natural rubber latex and raw rubber production
The production of usable rubber includes several steps which are tapping, latex
collection and processing to transform fresh Hevea latex into different marketable forms.
2.1 Tapping and latex collection
The tapping operation consists of cutting bark around the stem without injuring
the cambium growth area. About 2-3 mm thick of bark is shaved off to cut open the
specialized cells known as laticifers (latex vessels) in the soft bark. Tapping is repeated at a
certain frequency by making thin shavings just below the previous cut. The best time for
tapping is late at night or early in the morning (low daily temperature). The latex is collected
22%
38%
19%
19%
2%
Ribbed smoke sheets
Block rubber
concentrated latex
compound rubber
others

5
by allowing it to flow into a small cup attached to the trunk. The collection of latex can be
done 3 to 4 h after tapping (Premakumari and Panikka, 1992 ; Kush, 1994).
Once the tree is tapped, latex composition is susceptible to bacterial growth and
rapid acidification is observed. This degradation of proteins and the formation of organic
acids neutralize the negative charges on rubber particles and the latex gradually coagulates.
Therefore, fresh latex cannot be kept for long without a preservative treatment. Ammonia is
the most common preservative used to prevent premature coagulation during transfer to a
factory or a smallholder processing center. The latex that exudes after collection will be
gathered later by the tappers in a coagulated form called cuplump. The development of field
coagulum can be induced by adding acid or by leaving the whole harvested latex in the cup
without any stabilizers (Intapun et al., 2009).
2.2 Raw natural rubber production
Hevea latex and NR are distinct products. The former is a stable colloidal
dispersion of rubber particles in an aqueous medium while the latter is a visco-elastic product
obtained following coagulation of the latex, processing and drying of the coagulum (Ehabe et
al., 2006). On arrival at the factory, the latex is sieved and blended. Field latex is either
centrifuged to give concentrated latex or coagulated and processed into dry NR. Productions
of the three main NR products are described below.
2.2.1 Concentrated latex
Concentrated latex and its by-product, skim rubber are made by separating
field latex preserved with ammonia through centrifugation. The degree of ammoniation of
latex prior to centrifuging depends upon the period since collection and ranges from 0.25% if
centrifuging is immediate, to 1% if the period is two days or more. Only the minimum
required quantity of ammonia shall be added (Mathew and Claramma, 2000). Upon arrival at
the factory, ammoniated field latex is drawn from each delivered batch and tested using a
hydrometer or latexometer to estimate dry rubber content (DRC). Concentration of ammonia,
volatile fatty acid (VFA) are also measured. Then, the field latex is filtered through 40 or

6
60 mesh stainless-steel gauze continuing into a bulking tank. The latex is transferred by
gravity into a header tank where another sieve is fitted to remove any coagulum that may
have formed during the preliminary treatment in the reception or bulking tanks. From here, a
series of chutes distribute the product to each of the centrifuges, where it is separated into
concentrated latex and skim latex. Latex concentrate is used to create various tubings, a
myriad of dipped goods, and foam for upholstery and bedding. Latex concentrate is mixed
with various compounding chemicals before being processed into gloves, condoms, balloons,
catheters and baby soothers, for instance. The manufacturing processes have many
proprietary features depending on the products and need (Yip and Cacioli, 2002).
2.2.2 Crepe rubber
Crepe rubbers are processed from fresh latex coagulum, field coagulum or
cutting or rubber sheet. After necessary primary treatment of these materials, they are passed
through a set of crepe making machines then crinkle and lace-like rubber are obtained.
Among different types of starting materials, the latex crepe is classified as the best quality
crepe. Pale latex crepe is produced from latex selected specially under strictly controlled
conditions and hence is of premium quality. This kind of crepe is used for high quality
products such as pharmaceutical articles, light colored and transparent good, adhesives, tapes
and tubings (Kuriakose and George, 2000). Since the color and cleanliness are the main
concern for crepe quality grading as prescribed in the Green Book, latex to be used for the
production shall be free from yellow pigments as far as possible. Therefore, latex has to be
collected from clones which are identified on the extent of yellow pigments i.e carotenoid in
latex. RRIM600 is one of Hevea clones that is selected for pale crepe production due to its
latex containing minimum -carotene and is less susceptible to enzymatic coloration (De and
White, 2001).
2.2.3 Sheet rubber
Conversion of fresh latex into rubber sheets is the oldest method of
processing. This is widely adopted by rubber farmers due to its simplicity, lower cost of
processing and the viability even when the quantity of latex is small. Raw rubber sheets are

7
of various types like ribbed smoked sheets (RSS), air-dried sheets (ADS) and unsmoked
sheets (USS) depending on the drying methods.
The bulked latex is usually diluted to a rubber content of 15-16% and placed
in coagulation tanks with formic acid or acetic acid. Dilution helps in faster settling of
impurities and in obtaining a softer coagulum which can easily be sheeted. It also helps in
improving the clarity of sheets. The coagulum from undiluted latex is harder and it contains
more proteins and other non-isoprene components which may appear as rust when the sheet is
dried (Kuriakose and Thomas, 2000). After complete coagulation, the coagulum is washed
and sheeted through the plane and grooved rollers to have around 2.5 to 3.0 mm final
thickness. Freshly machined and dripped sheets contain about 20% moisture. For the
preparation of RSS, these sheets are dried in smoke houses, while for the production of ADS,
smokeless drying chambers are used. Concerning drying methods of sheets, drying in a
smoke house has definite advantages. It is quicker than sun drying and does not cause
oxidation by UV-radiation. In addition, the burnt rubber trees, coconut husks and other
organic materials create a smoke that preserves and gives the rubber its particular odor. For
exportation, RSS is the main form exported among different types of sheet rubbers. These
RSS are sorted visually into different grades on the basis of color, translucency, presence of
mold and other foreign matter. For its marketable form, the sheets are pressed into bales of
113.5 kg and given a protective wrap. The surfaces of the bales are finally coated with a
solution of talcum to protect from oxidation. Classification of rubber sheets are based on
visual criteria and have no technological basis.
2.2.4 Block rubber
There are many grades of block rubber i.e., TSR XL, TSR 5L, TSR 5,
TSR 5CV, TSR 10CV produced from latex, field coagulum or a blend of both. The raw
material used for TSR production is processed through a traditional crumb-rubber factory,
where it is cleaned by passing the material through a slab-cutter and/or pre-breakers. The
resultant crumb is washed in wash tanks and then fed to a series of creper machines which
build the rubber into a blanket. The blanket is then crumbed through a shredder or extruder.

8
The crumb is dried in a forced-air dryer at temperatures between 105ºC and 120ºC and the
final, dried crumb is pressed into blocks.
The production of TSR started in the 1960s, prior to which raw NR was
marketed in conventional forms like sheet and crepe. In 1964, The International Standards
Organization (ISO) first came out with the draft Technical Specifications for NR. Based on
these specifications, Malaysia introduced their Standard Malaysian Rubber (SMR) scheme
the following year. Since then all NR manufacturing countries started marketing NR as
Technically Specified Rubber, or TSR. TSR is mostly a block type made adopting new
methods of processing. The blocks are generally 35 kg bales available on the international
market. All the block rubbers are also guaranteed to conform to certain technical
specifications as laid out by national schemes or to ISO 2000 standard.
Table 1 The specifications of different grades of TSR rubber.
Parameters TSR-CV TSR-L TSR-5 TSR-10CV TSR-10 TSR-20CV TSR-20
Dirt retained (max % wt) 0.05 0.50 0.50 0.10 0.10 0.20 0.20
Ash content (max % wt) 0.60 0.60 0.60 0.75 0.75 1.00 1.00
Nitrogen content (max % wt) 0.60 0.60 0.60 0.60 0.60 0.60 0.60
Volatile matter (max % wt) 0.80 0.80 0.80 0.80 0.80 0.80 0.80
Initial plasticity, P0 () - 30 30 30 30 30 30
Plastic Retention Index, PRI () 60 60 60 50 50 40 40
Color (max) Lovibond units - 6 - - - - -
Mooney Viscosity (ML 1+4, 100 °C)
60 + 5* - - 60 + 7,-5* - 60 + 7,-5* -
*Not specification status, but are controlled at the producer end. The specification of TSR are given in ISO 2000:2003; Rubber, raw natural – Guidelines for the specification of technically specified rubber (TSR).
TSR comprises the majority of dry rubber produced from the major NR
exporting countries of the world. In Thailand, Malaysia and Indonesia, TSR is designated as
Standard Thai Rubber (STR), Standard Malaysian Rubber (SMR) and Standard Indonesian
Rubber (SIR), respectively. The main advantages claimed for TSR compared to the
conventional sheet and crepe grades of rubbers are: First, its quality can be easily assessed;
e.g. P0, PRI and volatile matter, helping to avoid mistakes in valuation of the material. The
specifications in force at present are given in the following Table 1. Secondly, as compact,

9
polyethylene wrapped bales, handling and transportation costs are reduced through
mechanized handling and containerization.
3. Natural rubber structure and properties
3.1 Latex composition
The composition of latex derived from Hevea tree is a mixture of many different
chemicals, both organic and inorganic. The major component of latex is rubber hydrocarbon
poly(cis-1,4-isoprene) which forms 30 to 45% w/v latex. Besides rubber and water (55-60%
w/v latex), fresh latex has been reported to contains 5-6% of non-isoprene components
consisting of carbohydrates, proteins, lipids, amines, and other inorganic constituents. The
quantity of these non-isoprene components varies by several factors such as age of the trees,
weather, clones, soil and tapping system utilized (Eng and Tanaka, 1993 ; Nair, 2000). Early
researchers reported that the tree sap of Hevea has three types of particles dispersed in the
liquid phase. They are rubber hydrocarbon, Frey-Wyssling particles (Frey-Wyssling, 1929)
and the globular particles named lutoids. Cook and Sekhar (1954) were the first to attempt
separating the latex particles into fractions by means of ultracentrifugation. Their work was
continued later by Moir (1959) under controlled conditions resulting in the identification of
several distinct fractions after centrifugation as presented in Figure 3.
3.1.1 Lutoids
Next in abundance is lutoids accounting for 10 to 20% of the volume.
Lutoids are a sub-cellular membrane-bound body ranging in size from 2 to 5 µm. This
membrane encloses a fluid serum known as lutoids serum or B serum (as located in the
bottom fraction of ultra-centrifuged latex) which was mentioned to destabilize rubber
hydrocarbon (Nair, 2000). In addition, lutoids contain a wide range of hydrolytic enzymes
and some of their enzymatic properties are analogous to the lysosomes of animal cells
(Dupont et al., 1976). Approximately 20% of the dry matter in lutoids is made of water-
soluble proteins, of which about 70% is hevein. This substance is anionic and shown to
contain no less than 5% sulfur, all as cysteine (Webster and Baulkwil, 1989).

10
Figure 3 Various fractions of centrifuged latex. Fractions 1-3 correspond to white rubber
phase. Fraction 4 is a yellow orange layer constituted by Frey-Wyssling particles. Fraction 5
is an almost clear serum (C-serum) corresponding to the latex cytosol. Fractions 6-11
constitute the bottom fraction where lutoids are highest in quantity.
Source: Moir (1959)
3.1.2 Frey-Wyssling particles
Frey-Wyssling particles are spherical and yellow or orange colored, larger in
size and constitute 1% to 3% of latex volume. This particle’s diameter ranges from 0.5 to
2 µm. The membrane encloses a fluid serum known as lutoid serum or B serum which is a
destabilizer of NR hydrocarbon (D'Auzac and Jacob, 1989).
3.1.3 C-serum
Both rubber particles and the membrane-bound organelles compose most of
the bottom fraction to form a colloidal mixture in an aqueous suspension called cytosol.
Cytosol represents 40 to 50% of latex volume and has the highest rubber synthesis activity
and general metabolism. The latex cytosol contains minerals, organic acids, amino acids,
nitrogenous bases, reducing agents and high molecular weight compounds such as proteins,
lipids and nucleotides (Jacob et al., 1993).

11
3.1.4 Non-isoprene components
Around 10% of the dry matter of H. brasiliensis comprises non-isoprene
components. They comprise different biochemical compounds such as proteins,
carbohydrates, lipids, and inorganic constituents. The nature and quantity of non-isoprene
components in Hevea latex can vary greatly depending on the clones, the exploitation system
and the environmental conditions (Vaysse et al., 2012).
3.1.4.1 Proteins
Fresh Hevea latex contains about 1-2% proteins (w/w) of which
about 20% is adsorbed on the surface of rubber particle; an equal quantity is found in bottom
fraction (lutoids) and the remainder in the serum phase (Yeang et al., 2002). Adsorbed
proteins and phospholipids impart a net negative charge to rubber particles, thereby
contributing to the colloidal stability of latex. Moreover, the protein content was also reported
to show clonal variations (Wititsuwannakul and Wititsuwannakul, 2001). While over
200 species of proteins can be found in NR latex, most of them are removed during
processing. Only a small fraction remains in the products as residual extractable proteins.
Though some proteins have been identified to be potential allergens in latex, information
about whether all proteins could survive the stringent manufacturing process is presently
incomplete (Yip and Cacioli, 2002).
3.1.4.2 Lipids
Lipids in Hevea latex occur mainly in the rubber particles and bottom
fractions. Ho et al. (1975) indicated that lipids associated with the rubber particles and the
latex fractions were important in the stability of rubber particles. Depending on the clone,
lipids amount to 2.5–3.8% versus dry rubber in latex. The three main families of NR lipids
were classified as neutral lipids, glycolipids and phospholipids (Hasma, 1984 ; Hasma and
Subramaniam, 1986 ; Liengprayoon et al., 2013).

12
Neutral lipids
A typical composition in latex lipid consists of more than 50%
neutral lipids (% of total lipids) while the other components are mainly phospholipids and
glycolipids. Neutral lipids are composed of more than 14 components including sterols, sterol
esters, free fatty acids, fatty acid esters, wax esters, monoglycerides, diglycerides,
triglycerides, tocotrienols and phenolic substances. As in most plant lipids, the fatty acid
composition of Hevea latex is mainly linoleic acid (C18:2), stearic acid (C18:0), oleic acid
(C18:1) and palmitic acid (C16:0), These fatty acids were detected mainly as esterified forms
in latex (Hasma, 1984 ; Liengprayoon, 2008).
Phospholipids
Phospholipids are the major lipid components of biological
membranes. The occurrence of phospholipids as essential membrane components is
attributable to their tendency to form a variety of structures that will allow them to guard their
hydrophobic tails from water (Voet and Voet, 1995). In the latex state, phospholipid
representes around 18–25% (w/w total lipids) depending on clones. Phospholipids is of great
importance to the physiology of the latex flow since it is closely related to latex stability
(Dupont et al., 1976). The stability of rubber particles suspended in latex is dependent on the
negatively charged film of proteins and phospholipids. The main phospholipids detected from
latex lipids were phosphatidylcholine (PC), phosphatidylinositol (PI), and to a lesser extent,
phosphatidylethanolamine (PE) (Hasma, 1984 ; Liengprayoon et al., 2013). Besides its
importance in latex stability, phospholipids were claimed to participate in the branching
formation in dry state (Rojruthai et al., 2009).
Glycolipids
Different forms of glycolipids, such as glycosylated glycerolipids,
esterified sterols and glycosylceramides are present in virtually all biological membranes.
Among them, galactolipids are the most abundant plant membrane lipids, especially in green

13
tissues where they represent about 75% of total membrane lipids (Dörmann and Benning,
2002). Glycolipids of fresh latex consisted of four glycolipid families: steryl glucoside (SG),
esterified steryl glucosides (ESG), monogalactosyl diacylglycerol (MGDG) and digalactosyl
diacylglycerol (DGDG). In fresh latex, glycolipids were found in the range of 0.8-1% (w/w
dry rubber) or 21-36% of total lipids. Several works dealing with lipid composition of latex
from different clones reported that the relative amount of glycolipids was found to be clone
independent (Hasma, 1984 ; Nair et al., 1993 ; Liengprayoon et al., 2013). In addition, clonal
variation was also observed in the relative proportions of glycolipid classes with 43–51%
DGDG, 30–34% SG, and 7–19% ESG but not MGDG (8%) (Liengprayoon et al., 2011)
3.1.4.3 Carbohydrates and cyclitols
Quebrachitol (monomethyl-1-inositol), sucrose and glucose are the
major low molecular weight organic solutes in latex. Quebrachitol, a cyclitol, is the most
concentrated single component in the serum phase (75-95% of the total carbohydrates and
cyclitols present in latex) (Ohya and Koyama, 2001). Its concentration is found to vary with
clones and amounts for around 1% of whole latex. It is a major contributor to the osmotic
pressure of the cytosol (D'Auzac and Jacob, 1989). Sucrose is the main sugar in latex as it is
the initial molecule in isoprene synthesis and the main element in the laticiferous metabolism.
Sucrose concentration in latex is one of the key measurements of latex diagnosis that used to
express the physiological state of the exploited trees (Le Roux et al., 2000 ; Silpi et al.,
2006). The concentration of sucrose in latex varies with clones and is influenced by
exploitation techniques (Nair, 2000).
Non-isoprene components could be dissolved or suspended in the
aqueous medium of the latex or absorbed on the surface on rubber particles including
contained in other organelles such as lutiods or Frey-Wyssling particles. However, around
50% of these non-isoprene components are leached or degraded during dry rubber processing
and their location could not be precisely indicated. In dry matter of latex, 10% is accounted
for non-isoprene components and only 5% of those components remained with NR after
primary processing (Vaysse et al., 2012).

14
3.2 Natural rubber mesostructure
Industrial utilization of dry NR in various products originated from its special
structure and properties. Due to its natural origin as other biopolymers, NR has a complex
structure. Mesostructure is a term used to describe dry NR macromolecular structure and gel.
Macromolecular structure concerns the average-molar masses, molar mass distribution
(MMD), branching, etc. For polymer characterization, average molar masses and MMD are
important features because they could significantly impact on physical properties.
The most common averaged-molar masses used in establishing molar mass-
property relationships are the number-averaged molar mass (Mn), the weight-average molar
mass (Mw), and the z-average molar mass (Mz). The Mw is inevitably higher than the Mn and a
measure of the spread of molar masses within a sample is provided by the ratio Mw/Mn which
is defined as polydipersity index (Ip). Any polymer defined as monodisperse indicated that all
the molecules are of the same sizes. NR from different clones was reported to have a wide
range of Ip from 4 to 10 (Subramaniam, 1993). Currently, size exclusion chromatography
(SEC) multi-angle light scattering (MALS) is a useful technique applied for polymer average
molar masses and MMD determination. It importantly aids in the establishment of structure-
property relationships for polymers. A new innovative and alternative technique is under
study to assess the mesostructure of natural rubber such as asymmetrical flow field flow
fractionation-multi-angle light scattering (A4F-MALS) (Dubascoux et al., 2012).
3.2.1 Molar masses and molar masse distribution
The molar massed and molar masse distribution in polymer systems play an
important role in determining their bulk properties. Subramaniam (1972) was the first who
studied MMD of fresh NR latex samples with SEC, expressed as MMD0. The MMD0 of NR
is an important criterion to estimate certain NR properties that will be obtained after
processing (Bonfils et al., 2000). Depending on the clone as well as ages of rubber trees,
MMD0 expresses two types of distribution: bimodal or unimodal with a shoulder (sometimes
also called ‘quasi-unimodal’) (Figure 4). In young trees, a situation where the lower molar
mass peak is larger may be found which was claimed to be due to incomplete biosynthesis of

15
rubber chain (Subramaniam, 1993). This explanation was in accordance with the work of
Tangpakdee et al. (1996) who found the increase of number-average molar mass (Mn) with
an increase of H. brasiliensis seedling (1, 3, 7, 36 and 84 months) by GPC and osmometry. In
addition, though the shapes of distribution curves are different, the range of molar mass is
approximately the same in rubber from all clones, normally in the region of 105-107 g.mol-1
(Eng and Tanaka, 1993). Furthermore, the type of harvesting and processing also influenced
on MMD as mentioned in the work of Bonfils et al. (2000) which compared the MMD of
TSR10 rubber prepared from an unimodal rubber clone (PB217) and bimodal rubber clone
(PR107) by SEC. It was found that after processing the inherent MMD (MMD0) was no
longer maintained.
Figure 4 Examples of inherent molar mass distribution for several natural rubber clones
(SEC in cyclohexane according to Bonfils and Char (2005)).
3.2.2 Gel
Gel is defined as a network of polymers formed as a result of extensive
branching or crosslinking, which is usually swollen by solvents but does not dissolve in non-
destructive solvents (Lee, 1993 ; Eng et al., 1997). Two types of gel exist in NR: macrogel
and microgel. Macrogel (macroaggregates) is the part of NR that is visible and insoluble in a
conventional polyisoprene solvent and that can be eliminated by centrifugation. Microgel
(microaggregates), contained in the soluble part, cannot be eliminated by centrifugation but

16
can be retained by filtration (porosity < 1 m) (Bonfils and Char, 2005). Campbell and Fuller
(1984) also used the term microgel to interpret the cloudiness of the solutions obtained when
dissolving a sample of NR in dichloromethane.
Regarding gel quantification method from ASTM, swelling index is used to
define type of macrogel. Low and high swelling index refer to hard gel and loose gel,
respectively. Hard gel usually indicates the presence of a material that does not break down
readily by milling while the latter gel type is opposite (ASTM, 2000). Recently, it was
proposed to quantify indirectly NR gel content in terms of “total gel” that was the sum of
macrogel and the microgel calculated from the difference between the initial concentration on
rubber put in solution and the injected concentration of the rubber solution measured by
SEC-MALS (Bonfils and Char, 2005 ; Wisunthorn et al., 2012).
NR gel content was reported to vary with many conditions. Latex from
virgin trees and from the tree which is not tapped for long period were found to contain very
high gel content; the amount of macrogel can be as high as 70%. However, the macrogel
content decreases on every tapping and reaches a value of about 5% on regular tapping
(Sekhar, 1962). Storage of latex after tapping may also influence gel quantity. Freshly
prepared NR has low gel content, of about 5 to 10%. During storage, the gel content increases
and may reach 50% or even higher after a long storage (Subramaniam, 1987). Under dry
storage, this phenomenon is called “storage hardening” (Rodriguez and De Paoli, 1985 ;
Subramaniam, 1993 ; Gan, 1996). Gel content can also be increased by other factors such as
clonal characteristics and rubber process (Dogadkin and Kuleznev, 1960 ; Ngolemasango et
al., 2003).
3.3 Natural rubber properties
The properties of NR are generally described by rheological terms such as
viscoelasticity and plasticity. In rubber processing, rheological behavior of NR must be
preliminarily determined in order to aid rubber property prediction during the process. Initial
Wallace plasticity (P0) and Mooney viscosity (ML) are important quality indicators that are
used in rubber manufacturing to describe those properties. P0 is an indicator showing the NR
17
flow produced during a simple compression at 100°C. The high P0 value indicates a high
resistance of NR to flow under pressure. Factors such as clones, storages, drying conditions
or rubber processing are fundamental and can affect rubber P0 value (Yip, 1990 ; Moreno et
al., 2005). Mooney viscosity (ML) gives an indication of the amount of mechanical force
required on raw rubber to obtain a mix with consistent rheological properties. ML and P0
show, in general, a good linear correlation (Moreno et al., 2005). ML of freshly prepared
rubber ranges from 50 to 90 units (ML(1+4) at 100 °C) depending on the mixture of clonal
latex used in the preparation (Subramaniam, 1987).
Plasticity retention index or PRI is a measure of the resistance of rubber to
molecular breakdown at evaluated temperature. It is the percentage of retention of initial
Wallace plasticity value after heating the test pellet at 140 °C for 30 min. This index is used
to predict rubber’s breakdown during the mixing process. PRI is conversed with P0 as rubbers
with a lower plasticity value have a higher PRI (Yip, 1990). Even if the PRI is dedicated to
estimate the amount of rubber molecular breakdown, some crosslinking may occur during
this test making interpretation of the results difficult. This is due to an opposite effect the
crosslinking on P0 compared to oxidative breakdown. As well as other property indicators,
PRI variations in NR were mentioned to be influenced by genetic differences among clones
and by the disparity of climatic conditions during tapping. Fri et al. (2007) mentioned that
even the effects of some agronomic traits of the Hevea plants on the behavior of its rubber
have been postulated, indeed NR postharvest treatments such as coagulation, coagula
maturation, drying and storage also significantly affected on structure and consequently on
NR properties.
4. Natural rubber maturation
Hevea latex is subjected to several treatments before the dry marketable products are
obtained. Postharvest treatments of latex influences properties of raw NR material. For the
most produced and exported commercial TSR grades of Thailand, TSR10 and TSR20, their
main raw materials are the “cup coagula” obtained by natural coagulation of latex. It is well
known that these rubber coagula have to be stored for a certain period of time before
processing. This period is called “maturation” which is crucial for the processors as it affects

18
the quality of the processed rubber (Ehabe et al., 2002 ; Fri et al., 2007 ; Intapun et al., 2010).
Several works indicated an impact of microbial activity on the change of structure and
properties during maturation. The richness in organic compounds of latex and NR coagula
allows microbial growth. Studies of NR coagula maturation showed an evolution of microbial
growth and activity during maturation. It has been proposed that the biochemical
modifications of the coagula caused by microorganisms during maturation have an effect on
NR characteristics (Salomez et al., 2014). Indeed, not only polyisoprene but also non-
isoprene components are involved in NR structure and properties.
4.1 Modification of latex biochemical composition during maturation
NR is obtained after latex coagulation through two main methods either natural or
acid. Natural coagulation could be achieved by neutralizing the negative charges on the
rubber particles. This process may result from enzyme activities from Hevea latex and from
contaminating microorganisms or microbial metabolism in latex. For acid coagulation,
excellent separation with almost no rubber left in serum can be achieved simply by a proper
adjustment of the pH of latex from neutral to 5.4. The choice of coagulation is usually made
according to the primary processing type of dry rubber.
For natural coagulation, initial non-isoprene components in fresh latex including
protein, carbohydrates, lipids, organic and inorganic compounds are modified by microbial
activity. In this stage, microbial degradation of non-isoprene components results in the
change of pH from 6.5 to around 5.2 (first 24 h). This pH drop is due to the acids produced
during the acidification phase. These acids, formic, acetic, lactic, butyric, and propionic acids
are volatile fatty acids (VFA) which are assumed to be originated from sugar degradation.
Nevertheless, the contribution of the major latex carbohydrates, quebrachitol, in this
microbial degradation of sugar is not conclusive since in the study of Lowe (1959) ammonia-
preserved latex quebrachitol, myoinositol and L-inositol were not degraded during 11 days of
storage and it was supposed that quebrachitol was not a substrate for VFA formation.
Afterwards in the work of John (1966), 12 strains of microorganisms in latex were found to
be able to metabolize carbohydrates and quebrachitol via an oxidative pathway to acids,
which implied that it was possible substrate for acid production.

19
In a later stage of natural coagulation, pH increases more or less fast up to 8 or
9 possibly due to a release of ammonia by protein degradation. Indeed, the evolution of pH
seemed to be the result of a balance between acidification by carbohydrate fermentation and
an alkalization by organic acid consumption and protein degradation (Intapun et al., 2010 ;
Salomez et al., 2014). In fact, the modifications of hydrophilic compounds (carbohydrates
and proteins) were described to be involved in natural coagulation more than lipids. These
could possibly be due to the fact that an initial phase of microbial growth requires
preliminarily carbon source for cell structure and carbohydrates and proteins could be more
readily used than lipids. Incidentally, roles of lipids in latex as native antioxidant molecules
were more discussed especially in the dry NR since lipids remain as major non-isoprene
components in dry rubber due to their hydrophobic properties. In addition, these changes of
biochemical composition generate not only an impact on NR quality but also an
environmental issue. Apart from fatty acids originating from carbohydrate material, other
sulphur and nitrogen containing proteins and amino acids present in the serum could also be
degraded by microbial fermentation. In addition to the VFA, these substances cause strong
odors in the field and around the rubber coagulation piles.
4.2 Evolution of NR structure and properties during maturation
NR structures and bulk properties are closely related, therefore, mesostructure of
maturated coagula such as molar mass distribution, weight-averaged molar mass and gel
content are regularly determined in order to explain NR property evolution. During the first
days of maturation, P0 could increase or decrease dependening on microorganism
concentration. Intapun et al. (2010) has clearly shown that NR prepared from sodium azide –
a biocide latex provide constant P0 value during maturation, while a significant variation up to
38% increase or 20% decrease was observed with various inoculum concentration applied.
Varghese et al. (2005) mentioned that microorganism could promote both crosslinking which
resulted in an increase of P0 and scission of polyisoprene macromolecules that brought a
decrease of P0. In case of PRI that reflects the susceptibility of NR to thermo-oxidation, it
was found to decrease proportionally to the microorganism initial concentration in latex; the
more inoculated the latex, the more sensitive to thermo-oxidation (decrease of PRI). No
change of PRI during maturation was observed when microbial activity was prevented.
20
Intapun et al. (2009) also performed the study on NR coagulation under two different
conditions (presence and absence of oxygen) over 45 days of maturation. The result showed
that P0 and PRI parameters were higher in anaerobic than in aerobic condition, which
suggests that the decrease of NR property values might be due to oxidative microbial
mechanisms.
Intapun et al. (2010) also described the mesostructure evolution of NR during
maturation. It was observed that averaged-molar mass weight (Mw) decreased slightly after
6 days of maturation (from 1500 kg.mol-1 to 1400 kg.mol-1) when the latex was treated with
an biocide (sodium azide). Meanwhile Mw values with a faster drop (from 1500 down to
1150 kg.mol-1) after 6 maturation days were obtained from latex with the presence of active
microorganisms. It was also found that the drop rate of Mw increased with the quantity of
microorganisms. This showed that microorganisms led to polyisoprene chain scission. A
different trend was observed from the average-molar mass (Mn) evolution. Mn of coagula
without biocide treatment demonstrated a stable value around 700 kg.mol-1 whereas samples
treated with biocide showed an increase of Mn over time, up to 900 kg.mol-1. Gel quantities
increased with maturation time and reached a plateau after two days of maturation for both
biocide treated or non-biocide treated rubbers meaning that gel formation may occur without
microbial activity. High gel containing rubber samples (non-biocide) had a stable Mn over
maturation. This could be due to a balance between scissions and the crosslinking illustrated
by gel content. Rubber treated with antibiotic seemed to be protected from scission (slight
decrease of Mw), while the increase of Mn may be due to gel formations by short chain
polyisoprene releases through oxidative reaction.
Beside, significant effects of maturation on mesostructure and the bulk properties
of processed NR previously mentioned, Hevea clone specific behaviors on property were also
studied (Fri et al., 2007). The physical properties (P0 and ML) of rubber from clones PB217
(slow metabolisms, unimodal MMD), GT1 (intermediate metabolism, bimodal MMD) and
PB235 (high metabolism, unimodal MMD) were determined during maturation of 18 to
45 days. PB217 and GT1 clone rubber properties decreased with an increase of maturation
whereas PB235 rubber was less sensitive to maturation. Generally, decreasing of bulk
properties due to maturation was explained by the degradation of long polyisoprene chains.

21
However, by observing the PRI evolution, it did not appear that the chains were susceptible
to thermal-oxidation. PB235 (high metabolism) and PB217 (low metabolism) clone rubber
had PRI remaining constant throughout, while those from clone GT1 and another
intermediate metabolism clone, RRIM600 (intermediate metabolism, bimodal MMD),
decreased significantly during maturation (Fri et al., 2007).
Contrary results were observed by Ekpini et al. (2001) and Zhong et al. (2009). P0
and ML of PR107 and PB217 which are both slow metabolism rubber clones (unimodal
MMD) increased during maturation. Unlike the previous work, PRI values of PR107 and
PB217 clone maturated cup coagula significantly decreased (37% and 19%, respectively).
The disparities observed from the various clones implied that the different NR properties
could not be directly related only to level of rubber tree metabolism but some inherent
dissimilarity in the non-isoprene constituents and/or variations in maturation environments
such as temperature and air humidity must be considered.
5. NR oxidation and antioxidants
Most of polymer particularly those based on unsaturated monomer like NR, are rather
susceptible to oxidative degradation which results in a loss of physical properties (Abad et
al., 2002). Indeed, oxidative degradation could possibly occur at different steps throughout
NR production process until in a form of finished product. Thus antioxidants which are
considered as a substance capable of preventing or slowing the oxidation are expected to
prevent NR from oxidative degradation. They can be either native oxidants naturally present
or synthetic antioxidants added in manufacturing process.
5.1 NR oxidation
All polymers, natural and synthetic, organic or inorganic will eventually degrade
in an oxygen atmosphere at elevated temperatures. Some kind of commercially important
polymers could be degraded by thermal oxidation at relatively low temperatures. Oxidation
occurring in the temperature ranges from ambient to approximately 200 C is usually referred
to as autoxidation. Reactions which result in oxidative degradation are not identical for all

22
polymers, but vary with the chemical structure of polymer and with the conditions at which
oxidation occurs (Hawkins, 1964).
Oxidative degradation of NR takes place as a result of the reaction between the
unsaturation and oxygen in the presence of heat as well as hydrogen abstraction which
ultimately leads to chain scission (Nwanorh, 1998). The oxidation of NR in the solid state is
complex since two competitive processes; scission and crosslinking, are taking place almost
simultaneously. These two mechanisms change the physical properties of the material. Chain
scission will result in the loss of stiffness and elasticity, whereas crosslinking will result in
increased stiffness and a consequent increase in brittleness. As a general rule, the more
predominant effect of the oxidation process is chain scission (Ngolemasango et al., 2006).
For polyisoprene, whether a scission or crosslinking mechanism predominates depends
strongly on the quantity of oxygen that diffuses into the material. A brief outline of the
oxidation process is given below (Tobolsky and Mercurio, 1959).
(1) Initiation RRR 2
The formation of free radicals (R•) during polymerization, processing or service of
the rubber product is the first stage of polymer degradation and is called as initiation (1) of
degradation process.
(2) Propagation ROOOR 2
RROOHRHROO
OHROROOH
Propagation (2) is the second stage when atmospheric oxygen reacts with the free
radicals (R•) to form peroxy radicals (ROO•). Peroxy radical further reacts with labile
hydrogen atom of the polymer molecules to form unstable hydro peroxides (ROOH). Hydro
peroxides immediately decompose via hemolytic cleavage to form alkoxy and hydroxyl
radicals and further propagate the degradation mechanism. Propagation stage of degradation
process is very rapid compared to the initiation stage. This autocatalytic oxidation reaction
progresses until termination (3) takes place by formation of stable products.
23
(3) Termination productstableROOROO
Currently, plasticity retention index (PRI) is the only international standard test
used to provide a rapid assessment of the susceptibility of raw natural rubber to thermal
oxidative degradation given by the ratio of P30 (plasticity after aging at 140 C for 30min) to
P0 (in %).
5.2 Antioxidants
In biological system, the ability to use oxygen allows the metabolization of
various organic compounds for energy. However, as an highly reactive atom, oxygen is
capable of becoming part of potentially damaging molecule commonly called “free radical”.
Free radicals are electrically charged molecules, with an unpair electron, this structure causes
them to seek out and capture electrons from other substances to neutralize themselves.
Though the free radicals from the initial attack could be neutralized, another free radical is
formed in the process causing a chain reaction. Reactive oxygen species (ROS) is a term
which encompasses all highly reactive, oxygen-containing molecules, including free radicals
such as hydroxyl radical, hydrogen peroxide, singlet oxygen and various lipid peroxides
(Percival, 1998). Reactive oxygen species (ROS) are generated by biotic and abiotic stresses
such as drought, salinity, strong light, extreme temperatures, heavy metals, UV radiation,
atmospheric contamination, mechanical wounding, nutrient starvation and pathogen attacks
(Jaspers and Kangasjärvi, 2010). Fortunately, free radical formation is controlled naturally by
various beneficial compounds known as antioxidants.
Antioxidants can be defined as compounds or systems that delay oxidation
reaction by inhibiting formation of free radicals or by interrupting propagation of the free
radical by one (or more) of several mechanisms. Those mechanisms include (1) scavenging
species that initiate peroxidation, (2) chelating metal ion such that they are unable to generate
active species, (3) quenching O2- preventing formation of peroxides, (4) breaking the
autoxidative chain reaction, and/or (5) reducing localized O2 concentration. The most
effective antioxidants are those that interrupt the free radical chain reaction (Nawar, 1996 ;
Huang et al., 2005 ; Brewer, 2011).
24
There are two basic categories of antioxidants, namely synthetic and natural. They
are usually containing aromatic or phenolic ring, these antioxidants donate H+ to free radicals
formed during oxidation becoming a radical themselves. These radical intermediates are
stabilized by the resonance delocalization of the electron within the aromatic ring and
formation of quinine structures. In general, both synthetic antioxidants (BHA, BHT and
propyl gallate) and natural botanicals contain phenolic function in this manner (Brewer,
2011). Indeed depending on the scientific discipline, antioxidants could be defined and
categorized differently based on their structure, occurrence, mode of action, solubility and
kinetic (Flora, 2009).
In biochemistry and medicine point of view, antioxidants are grouped by their
enzymatic and non-enzymatic radical scavenging system (Figure 5). There are several
intrinsic free radical scavenger systems which involve enzymatic and non-enzymatic
reactions in biological system. One of the most effective intracellular enzymatic antioxidants
is enzymatic antioxidant defense systems which is super oxide dismutase (SOD) that converts
super oxide radicals to hydrogen peroxide (H2O2). Glutathione peroxidase (GSH-Px) and
catalase will then convert H2O2 to a water molecule. SOD, GSH-Px and catalase together
provide the primary antioxidant defense mechanism. The non-enzymatic antioxidant defense
system includes ascorbic acid (vitamin C), -tocopherol (vitamin E), glutathione (GSH) and
-carotene (Kharrazi et al., 2008 ; Flora, 2009).
In case of Hevea tree, native antioxidants are synthetized by its own biosynthesis
pathways and their presences varies according to the physiological status of rubber trees as
well as other agronomical conditions. Recently, the development of molecular biology in
rubber tree had revealed molecular mechanisms that involve antioxidant mechanisms. For
instance, HbAPX, an ascorbate peroxidases gene was reported to be involved in antioxidant
system. HbCuZnSOD and HbMnSOD encoded antioxidant superoxide dismutase enzymes,
and their roles in drought response were confirmed in rubber tree (Leclercq et al., 2012).
Besides oxidation occurring in biological systems, it could also occur in dry NR .At this state,
the enzymatic processes could probably not be efficient anymore because of the no or low
water activity and the most probably denaturation of enzymes during drying processes.

25
Therefore, when studying the resistance of dry rubber to oxidation, previously cited non-
enzymatic antioxidants should be the primary target.
Figure 5 Enzymatic and non-enzymatic classification of antioxidants.
Source: Flora (2009)
5.3 Native antioxidant in natural rubber
NR, being an elastomer containing appreciable amount of unsaturation, is very
susceptible to thermal oxidative degradation which generally results in its physical property
deterioration both in raw and vulcanized state. Fortunately, due to its natural origin, NR is
endowed with native antioxidants that promote its resistance to oxidation. The degree of
resistance is however not consistent and depends on the methods of rubber processing. NR
especially those prepared from natural coagulation are more susceptible to oxidation than the
acid coagulated ones. This variation is attributed to the differences in their non-isoprene
content (Hasma and Othman, 1990). Field latex has antioxidants that some of which are
predominantly water-soluble and some are predominantly non water-soluble. When latex is
converted to rubber by coagulation, most of non-water-soluble antioxidants are retained
(Nadarajah et al., 1971).
Various compounds in Hevea latex have been described to be native antioxidants
such as amino acids, phenols, phospholipids, tocotrienols and betaines (Nadarajah et al.,
1971). Their appearance and activity were studied under different conditions. Tan and Audley

26
(1968) carried out identification of endogenous phenolic substrates in different latex fractions
and found three types of betaines i.e. betaines ergothioneine, hercydine and trigonelline
mostly accumulated in lutoids or bottom fraction. Indeed, plant betaine is an amphoteric
compound that is electrically neutral over a wide range of physiological pH values. Its role
was attributed to the stabilization of the structures and activities of enzymes and protein
complexes and to the maintaining of the membrane integrity against the damaging effects of
abiotic stress (Sakamoto and Murata, 2002). The occurrence of the three betaines compounds
in latex was eventually found to be dependent on soil condition and activity of ergothioneine-
synthesizing fungi. Though an accumulation of ergothioneine in latex bottom fraction could
be confirmed as a phenomenon of vacuolar uptake and storage of materials in plant cell
generally, its removal from latex and physiological significance is as yet unknown (Audley
and Tan, 1968).
In case of proteins, due to the colloidal nature of latex, proteins are not
homogeneously dispersed. Latex proteins are found in the sera and also associated with latex
organelles. About 70% of latex proteins are soluble (C-Serum+B-Serum), with the remaining
being associated with membranes. A small number of these latex proteins have given rise to
the problem of latex allergy. Besides the allergenic issue, proteins present on rubber particles
identified as rubber elongation factor (REF) is thought to be involved in rubber biosynthesis,
although the exact mechanism is still under investigation (Yeang et al., 2002). Moreover, an
antimicrobial activity against invasion of pathogenic fungi of hevein, a small (4.7 kDa)
cysteine-rich protein in the lutoids, was also reported (Van Parijs et al., 1991). The presence
and/or functions of proteins as antioxidants were less discussed in latex state. In addition,
removal of proteins from latex was not found to affect its properties since deproteinized latex
films showed good processability and vulcanizate properties compared to ordinary NR
(Hayashi et al., 1995 ; Sakaki et al., 1995). Nevertheless, positive effects of NR proteins
against thermal oxidation were mentioned in the NR sample prepared from acid coagulation
of protein-removed latex. In other works, the reintroduction of proteins or other non-isoprene
components in to NR samples was used to determine their effect on NR properties. For
example, Boucher and Carlier (1964) reported that phosphoaminolipids, amine and amino
acids reduced the oxidisability of raw rubber at 80 C. In addition, mixing of these
nitrogenous substance with other non-isoprene extract could act as antioxidant as effectively

27
as the whole non-isoprene component. Thus they could be considered as having a synergistic
effect. A similar work carried out by Tuampoemsab and Sakdapipanich (2007) also
mentioned that addition of the extracted NR protein showed a strong protection on
deproteinized rubber toward oxidation by increasing PRI.
Another important antioxidant molecule in NR is tocotrienol, the unsaturated
species of vitamin E. Tocotrienol differ structurally from tocopherol only by the presence of
trans double bonds at 3',7' and 11' positions in the phytyl tail (Sen et al., 2006) (Figure 6).
The discovery of tocotrienol in Hevea latex was firstly reported by Whitle et al. (1966), They
reported that Hevea latex is the major non-food source of tocotrienol with the content varying
from 0.02% to 0.15% (w/w of dry rubber). In general, the hydrogen donating power of
tocotrienol was believed to be in the order of α > β > γ > δ form under in vivo test and
reversed order (δ > γ > β > α) was obtained under in vitro test.
Isomers R1 R2
α CH3 CH3
β CH3 H
γ H CH3
δ H H
Figure 6 Molecular and chemical structures of tocopherol and tocotrienol.
Sources: Tan (2005)
The different forms of tocotrienols, α-, γ- and δ- form, were found depending on
the clones and rubber processing (Nadarajah et al., 1971 ; Hasma and Othman, 1990 ;
Horvath et al., 2006). The work of Liengprayoon (2008) reported the quantity of tocotrienol
family in unsmoked sheet (USS) prepared from 4 different Hevea clones. A positive
correlation between tocotrienol obtained after saponification reaction and PRI was observed.
Among tocotrienol families, α-tocotrienol seemed to exhibit more antioxidant activity in
every studied clone.
28
Incidentally, Nadarajah et al. (1971) studied the content of tocotrienol of Hevea
latex from six clones that coagulated under different conditions (acid, bacterial and natural
coagulations). No significant difference of tocotrienol content from these coagulated samples
was observed. However the amount of esterified tocotrienol was found highest in natural
coagulated rubber. The drying temperature at 140 °C was found to decrease tocotrienol
content whereas the amount of tocotrienol of unheated and heated rubber at 100 °C was
similar. Other authors stated that tocotrienol molecules are probably sensitive to oxidation
under high temperature (Kamal-Eldin and Appelqvist, 1996).
Besides, studying the content of tocotrienols related to NR properties, the effect of
addition the isolated tocotrienol from NR to PRI was also examined. Hasma and Othman
(1990) found that isolated tocotrienol had a maximum protection on NR against thermal
oxidation at a level of 0.1% (% dry rubber weight) and γ-tocotrienol gave a better protection
than the α-form. PRI was increased from 20 to 86 and 81 when γ- and α-tocotrienol were
added, respectively. The tocotrienol extract from NR reshowed a sufficient protection level
even the rubber was subjected to high drying temperature (60 and 110 °C) or to
microorganism activity (maturated and/or degraded rubber). Therefore the low resistance of
NR toward oxidation might be due to other factors not only the decomposition of this native
antioxidant molecule. One of the causes could be the increase of pro-oxidant such as free
copper release from copper complex substances by microorganism activity.
In vulcanized rubber, Morimoto (1985) demonstrated a positive correlation
between the presence of tocotrienol and the tensile strength of the unspecified clone in the
vulcanized state. He reported that the vulcanized heat-aged sample (at 100 °C for 24 h),
which was prepared from hot acetone extracted RSS (lipid-removed rubber), had the lowest
tensile strength. Meanwhile, the tensile strength value of vulcanized and heat-aged
vulcanized of non-extracted rubber did not show any difference. To confirm the influence of
tocotrienol, an acetone extracts which was identified to contain tocotrienol as a major
component was returned to extracted rubber by roll milling. It was found that the tensile
strength of the extracted rubber was increased and finally reached to the original level.
29
From previous works, activities against thermo-oxidation of native antioxidants
were mainly claimed based on the extraction and reintroduction of these isolated compounds
into extracted NR and/or normal NR then correlated with certain properties. However the
antioxidant activity of isolated compounds from NR itself was not much studied. Since
various in vitro antioxidant activity assays are available, it could be considered as a
complementary experiment to better explain the function of native antioxidants against NR
oxidation.
5.4 Antioxidant activity assay
Due to an increase demand in identifying new biomolecules that could be
beneficial for health and other applications, several methods for rapid screening of
antioxidant activity of molecules were developed. Now, many in vitro test methods are
available but they are often performed in specific conditions that address different type of
antioxidant activity (Laguerre et al., 2009). Therefore, in most of the work carried out on
identifying antioxidant activity of plant extract require the positive results from at least two
methods to confirm their antioxidant properties. In terms of methods, chemical properties
such as structure and solubility as well as mode of action have to be taken into consideration.
Two strategies based the two different measurements are summarized by Laguerre
et al. (2009). Non-competitive, also called indirect method, are mentioned to be the easiest
one. This strategy consists in measuring in the absence of any oxidizable substrate, the ability
of an antioxidant to reduce a stable artificial free radical. An only disadvantage of this
strategy is that a competitive reaction scheme in which antioxidant and substrate compete for
oxidizing species could not be provided. The examples of the most widely used non-
competitive methods that measure the antiradical of various molecules are DPPH
(2,2-diphenyl-1-picrylhydrazyl) and ABTS (2,2ʹ-azino-bis-3-ethylbenzothiazoline-6-sulfonic
acid). Therefore, in contrast to a non-competitive strategy, the competitive one involves an
oxidizable substrate and consists in measuring the inhibitory effect of an antioxidant on the
oxidation of a substrate. As the competition between antioxidant and pro-oxidant occur under
the same environment, the approaches of measurement could be performed either (i)

30
measuring the formation of oxidation products resulting from oxidation of a substrate, or (ii)
measuring the substrate loss.
The methods based on the assessment of oxidation product formation are
considered to be sensitive and suitable for most cases. However, the disadvantage is that the
oxidation reaction that leads to primary oxidative product formation could be further oxidized
to secondary products. Due to the lack of any universal oxidation marker it could result in the
limited applicability. concerning the second approach, the method named CAT (conjugated
autoxidizable triene) developed also by Laguerre et al. (2008) is an example of competitive
method that measured a substrate loss. The degradation of conjugated triene in emulsion is
accompanied by an absorbance decrease at 273 nm and the addition of antioxidant molecules
results in a delay of oxidative process and enables the quantification of the antioxidant
capacity.
Various works that determined the antioxidant properties of biomolecules have
often used the indirect method due to its simplicity and rapid. Most of the work carried out an
extraction of bioactive compound from plants using polar organic solvents such as ethanol
and methanol as well as water hence most of developed methods are based on aqueous
system. In contrast, the antioxidants possibly retained in dry rubber would be lipid-soluble as
most of hydrophilic compound are leached out during processing and lipids remain as a major
non-isoprene component. In addition, only some of lipid molecules such as tocotrienol could
be solubilized in polar organic solvent but to test their synergistic effect as total lipids
solubilization in polar organic solvent is impossible. Therefore, the work presented here aims
at studying the evolution and activity of native antioxidants with suitable method. Therefore,
the information obtained could be correlated with structure and physical properties of NR
during maturation analyzed in parallel.

31
MATERIALS AND METHODS
1. Standards and chemicals
Standards, solvents and chemicals used for lipid extraction and lipid analyses are
listed in Table 2.
Table 2 List of standards, solvents and chemicals. Name Suppliers and country Reference
Organic solvents and chemicals Acetic acid Merck, Germany 1000632500 Acetone Carlo Erba, Italy 400974 Acetonitrile RCI LabScan, Thailand 75058 Alumina oxide Sigma, USA A6139 Chloroform RCI Labscan, Thailand 67663 Copper (II) acetate Univar, Australia 860 Diethyl ether Merck, Germany 1009211000 2,2-Diphenyl-1-picrylhydrazine, DPPH Sigma, Germany D9132 Ethanol Merck, Germany 1009832500 Hydrochloric acid Merck, Germany 1003172500 Propan-2-ol (HPLC grade) Fisher, England 67630 Methanol Merck, Germany 1060092500 Methanolic HCl Sigma, Germany 33050-U Molybdenum blue spray reagent 1.3% Sigma, Germany M1942 n-hexane Merck, Germany 1043672500 N-methyl-N-(trimethylsilyl)-trifluoro acetamide (MSTFA)
Sigma, Germany M7891
Orthophosphoric acid (85%) Merck, Germany 1005731000 Pyridine BDH, England 2038099 Primuline Sigma, Germany 206865 Toluene UNIVAR, USA 552 Silica gel60 Merck, Germany 1093851000 Sodium azide Ajak Finechem 1222 Sodium chloride Univar, Australia 465 Sodium hydroxide J.T Baker, Italy 3722 Sodium methoxide solution Sigma, Germany 403067 Standards Cholesteryl stearate Fluka, Switzerland K2846 Methyl tetradecanoate, C14:0 Larodan, Sweden 20-1400-13 Methyl hexadecanoate, C16:0 Larodan, Sweden 20-1600-13 Methyl palmitoleate, C16:1 Larodan, Sweden 20-1601-9 Methyl octadecanoate, C18:0 Larodan, Sweden 20-1800-13 Methyl oleate, C18:1 Larodan, Sweden 20-1700-13 Methyl linoleate, C18:2 Larodan, Sweden 20-1802-13 Methyl linolenate, C18:3 Larodan, Sweden 20-1803-9 Methyl eicosanoate, C20:0 Larodan, Sweden 20-2000-13 Glyceryl trioleate Sigma, Germany T7140

32
Table 2 (Continued) Name Suppliers and country Reference
Methyl linoleate Sigma, Germany L1876 Mix 34 for TLC (monoolein, diolein, triolein, methyl oleate, oleic acid)
Larodan, Sweden 90-3034
Mix 40 for TLC (cholesterol, cholesteryl oleate, triolein, oleic acid, PC (egg))
Larodan, Sweden 90-3040
Oleic acid Sigma, Germany 70750 Plant sterol mixture (β-sitosterol 53%, stigmasterol 7%, campesterol 23% and brassicasterol 13% w/w)
Larodan, Sweden 60-1003-7
Stigmasterol Sigma, Germany S2424 α-tocotrienol Cayman Chemicals, USA 10008377 γ-tocotrienol Cayman Chemicals, USA 10008494 δ-tocotrienol Cayman Chemicals, USA 10008513 α-tocopherol Sigma, Germany T3251 Synthetic polyisoprene standards Polymer Standards Service,
Germany
2. Latex sources
Two Hevea clones, RRIM600 and PB235 were used for all experiments. The rubber
trees were tapped early in the morning. After tapping, latex was collected and filtered through
a stainless steel sieve. The filtered latex was used for lipid extraction and sample preparation.
2.1 Latex source for uncontrolled maturation conditions experiment
The experiments involving maturation under uncontrolled conditions were carried
out in the plantation of Visahakit Thai Rubber Co., Ltd. located in Chantaburi province,
Thailand. The field of RRIM600 clone was planted in 1995 and firstly tapping in 2002. The
applied tapping system was 1/2S, 2d3 which the trees were tapped on a 1/2 spiral cut
downward for 2 out of 3 days while PB235 plantation was planted in 1994 and the tapping
was started in 2001 with a 1/2S, d2 system.
2.2 Latex source for controlled maturation conditions experiment
The experiments involving maturation under controlled conditions using a
maturation device were performed at Faculty of Sciences and Industrial Technology, Prince
of Songkla University, Surat Thani campus in Surat Thani province, Thailand. Latex of

33
RRIM600 clone was obtained from Prince of Songkla University rubber plantation in Surat
Thani campus. This plantation was planted in 1990 and tapped since 1997. The taping system
used was 1/2S, 3d4 which the trees were tapped on a half spiral cut downward for 3 out of
4 days and no stimulation was applied. In the case of PB235 clone, the latex was collected
from the plantation of Mrs.Preyawan Sudchamnong located in Khun Talay district, Surat
Thani province, Thailand. This plantation was planted in 1988 and tapped since 1994 with a
1/3S, 3d4 tapping system without stimulation.
3. Maturated sample preparation
3.1 Unsmoked rubber sheet (USS) preparation
The RRIT technical recommendations for rubber sheet making process were
followed as shown in Figure 7. Three liters of filtered fresh latex were diluted with 2 L of
water. The diluted latex was poured into a coagulation tank (35x20x9 cm) and added with
300 mL of 0.42 M formic acid. The pH of latex was lowered to around 4.6. Bubbles were
removed by skimming the acidified latex surface with a metallic plate. The coagulation tank
was covered to avoid contamination by dust. After coagulation, the coagulum was removed
from the coagulation tank and passed once into a specific crusher to reduce the thickness to
around 1 cm. The rubber sheet was then passed through a flat hand mangle for 2-3 times and
through a rough hand mangle 2 times to imprint cross lines on the rubber sheet. During the
sheeting process, rubber sheet was cleaned by rinsing with water. The rubber sheet was hung
and dried under the shade in a ventilated area for 7 to 10 days.
3.2 NR sample prepared under uncontrolled maturation conditions (mini-sheets)
Unsmoke sheet preparation was used as a model for the experiments where the
maturation conditions were not controlled (natural conditions prevailing in the plantation). In
order to utilize a reasonable volume of latex, a specific procedure for mini-sheet preparation
was developed to reduce the size of the rubber sheet but keeping similar properties as those of
USS sheet prepared from RRIT recommendation (3 L of latex). The development of this
procedure is detailed in Chapter 1.

34
Around 10.5 L of freshly tapped latex was filtered and pooled into a 20 L bucket
through a metal sieve (2 mm pore size). The pH of filtered latex was measured. For each mini
sheet, five hundred milliliters of latex were poured into coagulation box (18x28x7 cm) and
gently mixed with 333 mL of water. For acid coagulation sample (0 day of maturation),
50 mL of 0.42 M formic acid solution was added. For maturated coagula, pH of fresh
coagulum and serum were measured before the coagulated rubber was removed from the
coagulation box. The coagulated rubber was passed 1-2 times into a crusher to reduce the
thickness to around 1 cm. The rubber sheet was then passed through a flat hand mangle for
2-3 times and through a rough hand mangle 2 times to imprint cross lines. The number of flat
hand mangle passes was adjusted in order to obtain similar thickness as that of USS (final
thickness of around 3 mm). The obtained mini-sheets were cut into two halves. The first half
was dried under the shade in a ventilated area until complete transparent sheet was obtained.
The second half was dried in a smoked house (Grand Rubber Company, Kaeng Hang Meao
district, Chantaburi province) at 60 oC until no white spot appears on the sheets. The drying
time, the weight and thickness of fresh and dry half sheets from both drying methods were
recorded. Mini-sheets made from naturally coagulated rubber that were let maturate in
coagulation box for 1, 2, 3, 7, 9, and 14 days were prepared following a sheeting process
similar as that used for acid coagulated sheets. The coagulation boxes were stored in an
aerated room in rubber plantation. Three replications were performed for each maturation
time. Each sample was used for P0 and PRI measurement as well as structural and lipid
composition analyses. The flow chart of mini-sheet preparation is shown in Figure 7.
3.3 Natural rubber sample prepared under controlled maturation conditions
The cup coagula were used as a model for controlled maturation conditions
experiment. The samples were prepared using the procedure described by (Intapun, 2009)
with minor modifications. For each clone, fresh latex was filtered through a 1 mm pore size
metal sieve and pooled into a bucket. The initial pH of the latex was measured. This filtered
latex was used for mini-cup coagula preparation with the conditions summarized in Table 3.
In order to follow the evolution of physical properties, structures and lipid composition of NR
obtained from maturated cup coagula, 3 mini-cup coagula from each maturation condition
were randomly sampled after 0, 3, 5, 7,14, 21 and 28 days.
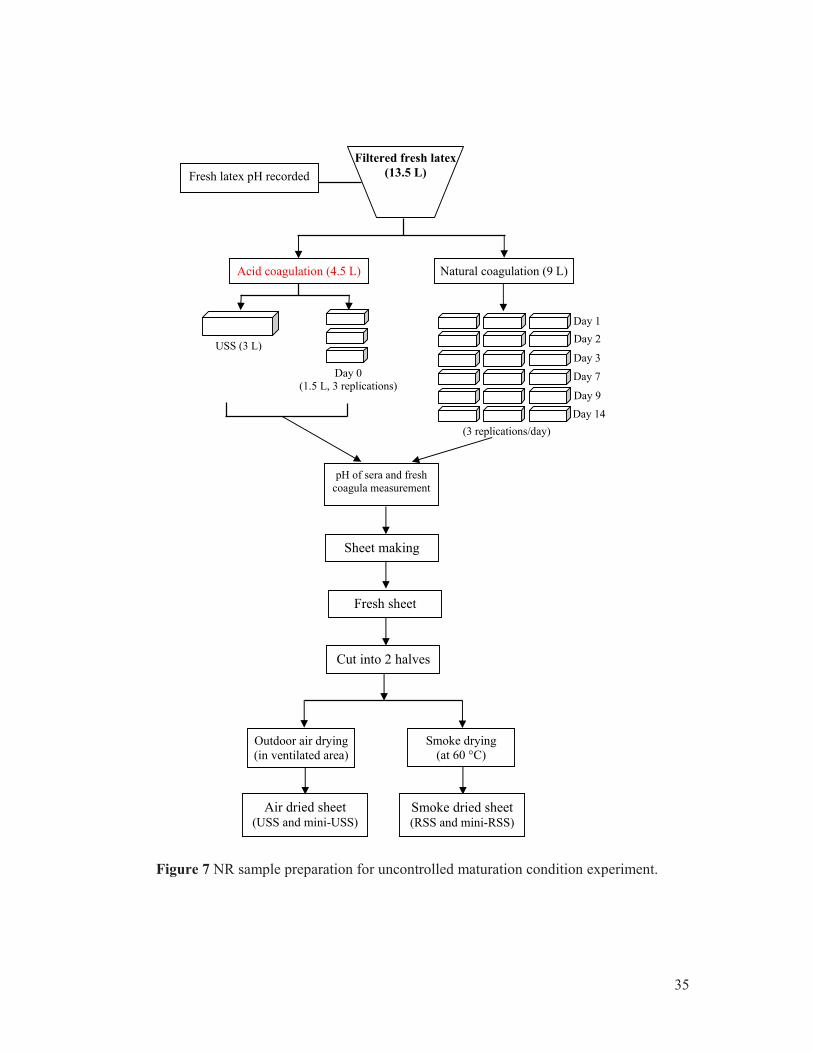
35
Figure 7 NR sample preparation for uncontrolled maturation condition experiment.
Day 0 (1.5 L, 3 replications)
USS (3 L)
Filtered fresh latex(13.5 L) Fresh latex pH recorded
Acid coagulation (4.5 L) Natural coagulation (9 L)
(3 replications/day)
Day 1
Day 2
Day 3
Day 7
Day 9
Day 14
Sheet making
Fresh sheet
Cut into 2 halves
Air dried sheet (USS and mini-USS)
Outdoor air drying (in ventilated area)
Smoke drying (at 60 °C)
Smoke dried sheet (RSS and mini-RSS)
pH of sera and fresh coagula measurement

36
Table 3 The sample treatments and maturation conditions of mini-cup coagula.
Treatments Maturation conditions
Coagulations Maturation times
(day) Code
Sodium azide added latex (10% of NaN3 solution added) Anaerobic Acid 0, 3, 5, 7, 14, 21 and 28 Na+O-
Field latex (no NaN3 addition)
Anaerobic Acid 0
Na-O- Natural 3, 5, 7, 14, 21 and 28
Aerobic Acid 0
Na-O+ Natural 3, 5, 7, 14, 21 and 28
Forty five milliliters of latex were poured into a 4.7x5.5x6.8 cm mini-glass cup
(Figure 8a) that were placed on stainless steel trays in maturation device for 3 days to allow
latex to coagulate. After that, the mini-cup coagula were removed from the glass cup and
placed in plastic cups (upper diameter 6.5 cm diameter, Figure 8b) until the sampling day.
For day 0 sample, 5% of formic acid solution was added into the latex to decrease the pH of
latex to 5.2. For sodium azide treated latex, since the coagulation was prevented, therefore, at
day 3 the sodium azide added latex containing glass cups were taken out temporarily from the
device and 200 µL of 5% formic acid solution was added into the latex in order to induce
coagulation. Then the obtained mini cup coagula were put back in a maturation device until
the targeted maturation day. The pH of serum and fresh rubber coagulum were measured by
inserting a pH probe in the coagula samples through a precut hole before they were passed
through a mini-creper. This mini-creper is a scaled-down version of the creper used in the
TSR factory. It has the following specification: roll diameter 10 cm; roll length 30 cm,
diamond type groove (space between grooves 6 mm, groove width 2 mm), gap between rolls:
0.04 mm, speed of front roll: 190 rpm.min-1, friction ratio: 1.3:1 (front:rear), engine power:
2.2 kW. The creping procedure consisted in 15 passes with folded crepe and 1 time of pass
with unfolded crepe under water shower placed over the nip of rolls (width 30 cm, water flow
6.2 L.min-1). The mini-crepe samples were dried in a hot air oven (UE700, Memmert GmbH
& Co. KG., Germany) at 125 oC for 2 h without air renewal. The fresh and dry weights of the
obtained mini-crepes were recorded. These dried crepes were used for further analysis
(structure, physical properties and biochemical analysis). The flow chart of the mini-coagula
sample preparation and maturation conditions is showed in Figure 9.

37
Figure 8 Mini-glass cup (a) and (b) plastic cup for the mini-cup coagula preparation.
3.4 Maturation box device
A maturation box device was used in order to control the environmental
conditions during rubber maturation. The device consisted of a water tank, two insulated
boxes and air humidifying column. Each insulated box contained 6 independent maturation
units which could host 18 mini-cup coagula (Figure 10). The maturation conditions
controlled in this experiment were air temperature, air relative humidity and oxygen content.
3.4.1 Air temperature control
The temperature of maturation was controlled through the circulation of
water around the maturation units. The temperature of water was regulated by the immersion
circulator Polystat model (Cole-Parmer, USA) located in the water tank and the water was
circulated by a water pump (900L.h-1, Power Head AP 1600, Sonic, China) from this tank to
the insulated box 1 and 2 as well as to the air humidifying column. Output water flowing
from insulated box 1 was controlled by water valves in order to get proper water levels in
each compartment (water tank, insulated box 1 and 2, and air humidifying column). The
maturation units were immersed in water so that the surrounding water level reached ¾ of the
height of the maturation units. The air temperature inside each maturation unit was recorded
every 30 min by EL-USB-1-LCD temperature data logger (DATAQ Instruments, USA).
|-------5.5 cm------|
|------5.0 cm------|
|----------6.5 cm---------|
|-----------6.8 cm----------| |------4.7cm------|
a) b)

38
3.4.2 Oxygen content and air relative humidity control
The oxygen gas flow in the system was supplied by air compressor (XM
2540 3 HP, Puma). The nitrogen gas from nitrogen tank (9 m3, 99% N2, Linde PLC td,
Thailand) was used for the experiment without oxygen. Both gases were flown in
polyurethane tubes (external diameter = 8 mm, internal diameter = 5 mm) equipped with a
pressure regulator to delivered a 1.4x10⁵ Pa (1378 millibar) pressure. Gas oxygen content was
measured with a dedicated probe (Conox3, VWR GmbH, Germany) connect to a multimeter
(Multi350 model, VWR GmbH, Germany). The oxygen tube and nitrogen tube were
connected to the gas humidifying column separately prior to the maturation system. The air
humidifying column consisted of a polycarbonate tube (thickness 2 mm, external diameter
7.5 cm, height 100 cm) equipped with PVC screw cap (diameter 5 cm) at the top. This
column was filled with temperature-controlled water coming from the water tank, up to
80 cm in height. The water level in humidifying column was controlled by the relative
position of this column to the water tank and by the inlet water flow. The gas inlet tube was
plunged into water to a depth of 90 cm from the top of the column. The end of the tube was
equipped by an air stone diffuser (ball form, diameter 4.5 cm). The gas bubbles went up
through the water, reached the water and the outlet water saturated gas left the humidifying
column through the outlet tube which was insulated by an EPDM rubber foam tube
(Aeroflex-SSH, Aeroflex International Co., Ltd., Thailand). This was in order to keep the
constant temperature and avoid further condensation of water. The gases were distributed to
the maturation units by a system of “Y” connectors. Inlet flow of each maturation unit was
adjusted by a speed flow controller. Gas relative humidity in each maturation box was
recorded every 30 min by EL-USB-1-LCD temperature data logger (DATAQ Instruments,
USA) (Figure 10).
4. Lipid extraction from dry rubber
The method of lipid extraction from latex and dry rubber were based on that of
Liengprayoon (2008). A piece of dried dry rubber sample (2.8+0.1 g) was cut into small
pieces about 2x1x1 mm. The obtained pieces were stored at -20oC overnight before grinding.
The grinding procedure was performed by using a cryogrinder model Pulverisette 0 (Fritsch,
39
Germany) under liquid nitrogen with 2 mm amplitude for 4 min. Then the ground rubber was
immediately transferred to a bottle containing 50 mL of a mix of chloroform/methanol
(2:1, v/v). The mixture was agitated at 160 rpm on a STUART SO1 orbital shaker (Bibby
Scientific, England) for 6 h at 25 °C. The extracted rubber was rseparated from the solvent by
filtration with Whatman no1 filter paper and the total extract was evaporated using a rotary
evaporator. The total extract was redissolved with 4 mL of chloroform/methanol.
5. Lipid composition analysis
Lipid extracts obtained from dry rubber samples were subjected to various analyses.
5.1 Qualitative analysis of lipids by thin layer chromatography (TLC)
Five microliters of diluted lipid extract at 10 mg.mL-1 in chloroform from each
sample was applied on silica gel 60G TLC plates (Merck, Germany). The plate was
developed in a chamber containing the mobile phase. n-hexane/diethyl ether/acetic acid
(80:20:1; v/v/v) was used as mobile phase. The TLC plate was sprayed with a mixture of
40% orthophosphoric acid and aqueous solution saturated with copper acetate (1:1; v/v) and
then heated at 180 oC for 10 min in a redLine model oven (Binder, Germany). Standard for
TLC (mix 40 (Larodan, Sweden)) composed of oleic acid, triolein, phosphatidyl choline from
egg yalk, cholesterol and cholesteryl oleate and γ-tocotrienol (Cayman chemical, USA) were
used as reference.
5.2 Quantitative analysis of lipids by high performance thin layer
chromatography (HPTLC)
5.2.1 Standard preparation and calibration curve
Six commercial lipid standards which were γ–tocotrienol, α-tocotrienol, free
fatty acid (oleic acid (C18:1)), free sterol (stigmasterol), esterified sterol (cholesteryl stearate)
and glyceryl trioleate (to represent triglycerides of furan fatty acid (TFG) as no commercial
standard available) were used. Two of γ–tocotrienol esters and wax standards were purified

40
from RRIM600 lipid extract. All standard stock solutions were prepared in chloroform. Six
concentration levels were used for calibration as detailed in Table 4. The three dimension
image of six chromatograms obtained by densitometry analysis of the HPTLC track
corresponding to the six concentration levels is shown in Figure 11. The obtained peak areas
were plotted against the corresponding concentrations to obtain the calibration curves.
Similar calibrations are done for each TLC plate.
5.2.2 Sample preparation
The lipid samples were diluted to 1 mg.mL-1 in chloroform and 10 µL of
samples solution were spotted on TLC plate (quantity on plate 10 µg).
5.2.3 Instrumentation and chromatographic conditions
HPTLC was performed on silica gel 60F254, 20×10 cm TLC plates (Merck,
Germany). Samples were applied on TLC plates as 4 mm band width at 15 mm apart from the
bottom edge of the plate by using an ATS4 (CAMAG, Switzerland) sample applicator under
a flow of nitrogen gas. The plates were developed in an automatic developing chamber
ADC2 (CAMAG, Switzerland) previously saturated with mobile phase at room temperature
for 3 min. The migration distance was 85 mm for general components separation with a mix
of n-hexane: diethyl ether: acetic acid 80:20:1 (v/v/v) as mobile phase. A 90 mm of migration
distance and mix of n-hexane: diethyl ether: acetic acid 90:10:1 (v/v/v) were used specifically
for γ–tocotrienol esters and esterified sterols analyses. After elution, the plate was dried with
a hair dryer and dipped 2 sec in a mixture of 40% orthophosphoric acid and saturated copper
acetate aqueous solution (1:1; v/v) using an CAMAG chromatogram immersion device III
(CAMAG, Switzerland). The plate was then heated at 180 oC for 10 min in an oven. The
photographs of developed plates were taken by using CAMAG Reprostar3 (CAMAG,
Switzerland) equipped with a Canon Power Short G2 camera using white light. Densitometric
scanning was performed on CAMAG TLC scanner3 (CAMAG, Switzerland) at a wavelength
of 325 nm. The operation of all automatic steps and quantitative analysis was performed with
Win CATS planar chromatography manager software version 1.4.4.6337.

41
Figure 9 Flow chart of NR sample prepared under controlled maturation conditions.
pH recorded
No NaN3 added, Na-
Maturated in maturation boxes (for 3, 5, 7, 14, 21 and 28 days)
Formic acid added
Creping
Drying (125 °C, 2 hrs. in oven)
3 mini-cups (day 0)
Dried mini-crepes
NaN3 added, Na+
18 mini-cups
Formic acid added
Creping
Drying (125 °C, 2 hrs. in oven)
3 mini-cups (day 0)
Dried mini-crepes
Transferred to anaerobic maturation box
Creping
Drying (125 °C, 2 hrs. in oven)
pH measurement (serum and coagulum)
Dried mini-crepes
18 mini-cups
Removed coagula from the glass cups and placed in plastic cups
18 mini-cups
Transferred to anaerobic maturation box
Transferred to aerobic maturation box
Formic acid added (at day 3)
Transferred back to the maturation boxes
Filtered fresh latex

42
Water valves In let Out let Flow meter Speed flow controller Pressure regulator Probe Speed Flow Controller Pressure regulator Probe
N2 Air compressor
Water tank
Box 1
Box 2
Figure 10 The maturation device system. 42
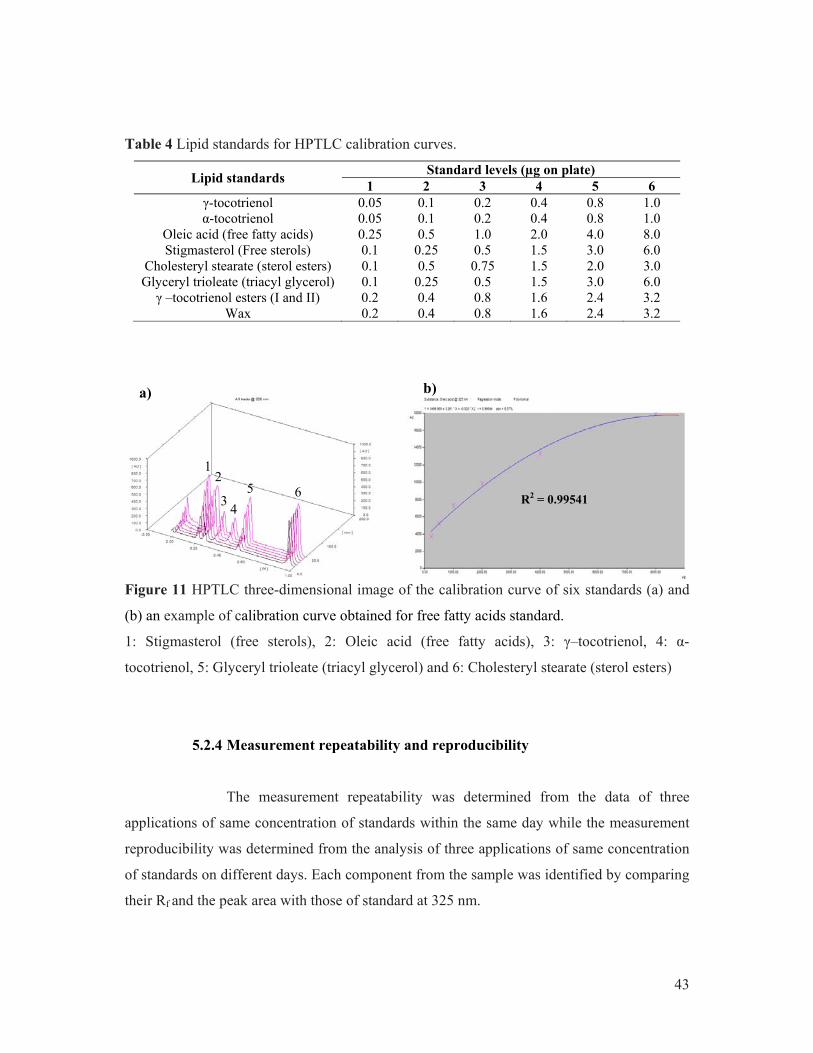
43
Table 4 Lipid standards for HPTLC calibration curves.
Lipid standards Standard levels (µg on plate)
1 2 3 4 5 6 γ-tocotrienol 0.05 0.1 0.2 0.4 0.8 1.0α-tocotrienol 0.05 0.1 0.2 0.4 0.8 1.0
Oleic acid (free fatty acids) 0.25 0.5 1.0 2.0 4.0 8.0 Stigmasterol (Free sterols) 0.1 0.25 0.5 1.5 3.0 6.0
Cholesteryl stearate (sterol esters) 0.1 0.5 0.75 1.5 2.0 3.0 Glyceryl trioleate (triacyl glycerol) 0.1 0.25 0.5 1.5 3.0 6.0 γ –tocotrienol esters (I and II) 0.2 0.4 0.8 1.6 2.4 3.2
Wax 0.2 0.4 0.8 1.6 2.4 3.2
Figure 11 HPTLC three-dimensional image of the calibration curve of six standards (a) and
(b) an example of calibration curve obtained for free fatty acids standard.
1: Stigmasterol (free sterols), 2: Oleic acid (free fatty acids), 3: γ–tocotrienol, 4: α-
tocotrienol, 5: Glyceryl trioleate (triacyl glycerol) and 6: Cholesteryl stearate (sterol esters)
5.2.4 Measurement repeatability and reproducibility
The measurement repeatability was determined from the data of three
applications of same concentration of standards within the same day while the measurement
reproducibility was determined from the analysis of three applications of same concentration
of standards on different days. Each component from the sample was identified by comparing
their Rf and the peak area with those of standard at 325 nm.
R2 = 0.99541
a) b)
1 2 3
4 5 6

44
5.3 Total fatty acid and unsaponifiable compositions analysis by GC-FID/MS
Gas chromatography analysis of total fatty acids of lipid samples obtained from
transesterification reaction was performed by converting them to their more volatile
derivatives namely fatty acid methyl esters (FAME). The unsaponifiable composition
identification by GC-MS was performed after silylation.
5.3.1 Preparation of fatty acid methyl esters (FAME) by transesterification
A 0.05 M sodium methoxide solution was prepared by mixing 62 mL of
0.5 M sodium methoxide solution with 560 mL of methanol (HPLC grade) and a few drops
of phenolphthalein. Thirty milligrams of lipids were transferred to a 100 mL flat bottom flask
and 3 mL of sodium methoxide solution containing phenolphthalein was added into the flask.
The mixture was refluxed at 80 oC for 10 min. Then 3 mL of methanol hydrochloride solution
were added and the mixture was refluxed again for 10 min. After cooling down at room
temperature, 10 mL of water was added fatty acid methyl esters (FAME) were extracted with
10 mL of hexane for three times. The extracted solution was evaporated to dryness, weighed
and re-dissolved in hexane in order to obtain a 1 mg.mL-1 solution ready to be injected in GC-
FID and a 2.8 mg.mL-1 solution for GC-MS injection.
5.3.2 Analysis of total fatty acid composition by GC-FID
A Shimadzu GC17A gas chromatograph (Shimadzu Co., Kyoto, Japan)
equipped with a fused silica capillary column BPX70 (30 m, i.d. 0.25 mm, film thickness
0.25 µm, SGE, Victoria, Australia) and a Shimadzu AOC20i automatic injector (injected
volume 1 μL) were used. Initial linear velocity of helium in column was 34 cm.s-1.
Temperature of the split injector (split ratio 1:15) and of the flame ionization detector were
250 oC and 280 °C respectively. Oven temperature was programmed as follows: 160 oC for
0.5 min, increased to 200 oC at 10°C.min-1 then kept constant for 4.6 min. The total run time
of the analysis was 9.1 min. Data acquisition was performed using the GC solution v 2.10
software (Shimadzu Co., Kyoto, Japan). Calibration curves were performed using fatty acid
methyl ester standard mixtures containing each of the fatty acid at different known

45
concentrations as mentioned in the Table 5 and Figure 12. This proportion between FAME
was chosen regarding the one generally present in lipid from rubber.
Table 5 Concentrations of standard solution injected in GC (mg.mL-1).
Fatty acids Retention
times (min) Level of standard concentrations (mg.mL-1)
1 2 3 4 5 6 7 8
C14:0 2.88 0.2857 0.5714 0.8571 1.4286 2.0000 2.2857 2.5140 2.8571
C16:0 3.76 0.0714 0.1429 0.2143 0.3571 0.5000 0.5714 0.6429 0.7143
C16:1 4.00 0.0500 0.1000 0.1500 0.2500 0.3500 0.4000 0.4500 0.5000
C18:0 4.85 0.0357 0.0714 0.1071 0.1786 0.2500 0.2857 0.3214 0.3571
C18:1 5.09 0.2143 0.4286 0.6429 1.0714 1.5000 1.7143 1.9286 2.1429
C18:2 5.55 0.4929 0.9857 1.4786 2.4643 3.4500 3.9429 4.4357 4.9286
C18:3 6.17 0.1214 0.2429 0.3643 0.6071 0.8500 0.9714 1.0929 1.2143
C20:0 6.29 0.0214 0.0429 0.0643 0.1071 0.1500 0.1714 0.1929 0.2143
Furan fatty acid
7.14 0.2857 0.5714 0.8571 1.4286 2.000 2.2857 2.5714 2.8571
Total 1.58 3.16 4.74 7.89 11.05 12.63 14.15 15.79
Figure 12 Chromatogram of fatty acid methyl ester (FAME) standards (a) and (b) calibration
curve of linoleic acid.
R2 = 0.997025

46
5.3.3 Analysis of unsaponifiable composition by GC-MS
Unsaponifiable compounds were identified by GC-MS after silylation. A
250 µL of lipid sample after transesterified (2.8 mg.mL-1 in hexane) was added with 50 µL of
MSTFA and 50 µL of anhydrous pyridine. The mixture was incubated at 50 °C in a water
bath for 30 min before injected to GC-MS. The injected concentration was 2 mg.mL-1. The
gas chromatograph system used was Shimadzu QP2010S GC-MS equipped with a 5% phenyl
polysiphenylene-siloxane BPX5 capillary column (30 m, i.d. 0.25 mm, film thickness
0.25 µm, SGE Analytical Science, Australia) and a Shimadzu AOC20i automatic injector
(injected volume 1 µL). Linear velocity of helium in column was kept at 32 cm.s-1.
Temperature of the split injector (split ratio 1:20) was 250 °C. Oven temperature was set at
230 °C for 2 min, increased to 300 °C at 4 °C.min-1 then kept constant for 3.5 min. The mass
spectrometer was operated in the electron impact (EI) mode, with electron energy of 70 eV.
Mass spectrometric detection was conducted in scan mode from m/z 100 to 800 at 2.2 scans
per sec; ion source temperature was 200 °C. Control and data acquisition and processing were
performed using the GCMS solution v 2.40 software and the NIST 05 (Shimadzu Co., Kyoto,
Japan) and our own spectrum database. Calibration curves were performed using 9 comercial
standards at different known concentrations as shown in Table 6 and Figure 13.
Table 6 Concentrations of standard solution injected in GC-MS (mg.mL-1).
Components Retention
times (min) Level of standard concentration (mg.mL-1)
1 2 3 4 5 6 7 8
C18 Fatty alcohol 5.43 0.013 0.025 0.050 0.075 0.100 0.150 0.200 0.250
C20 Fatty alcohol 7.67 0.013 0.025 0.050 0.075 0.100 0.150 0.200 0.250
δ-tocotrienol 17.63 0.010 0.020 0.040 0.060 0.080 0.120 0.160 0.200
γ-tocotrienol 19.15 0.010 0.020 0.040 0.060 0.080 0.120 0.160 0.200
Brassicasterol 20.47 0.007 0.013 0.026 0.039 0.052 0.078 0.104 0.130
Campesterol 21.54 0.013 0.026 0.052 0.078 0.104 0.156 0.208 0.260
α-tocotrienol 21.58 0.010 0.020 0.040 0.060 0.080 0.120 0.160 0.200
Stigmasterol 21.99 0.004 0.007 0.014 0.021 0.028 0.042 0.056 0.070
β-sitosterol 23.21 0.027 0.053 0.106 0.159 0.212 0.318 0.424 0.530
Total 0.11 0.21 0.42 0.63 0.84 1.25 1.67 2.09
47
Figure 13 Chromatogram of unsaponifiable standard mixture (a) and calibration curve of
-tocotrienol (b).
5.4 γ-tocotrienol derivertives identification
5.4.1 γ-tocotrienol dimers identification
The chemical structural identification of γ-tocotrienol dimers obtained from
γ-tocotrienol commercial standard was identified by reverse phase HPLC-MS. The analysis
was carried out using an Agilent Series 1100 HPLC system consisting of vacuum degasser,
auto-sampler, a binary pump and a 1290 Infinity Diode Array Detector, Agilent
Technologies, Palo Alto, CA, USA). Chromatographic separation was achieved using a
Pursuit C18 column (5 µm particle size, 200 Å pore size, 4.6x250 mm, Varian). Column
temperature was maintained at 25 °C. Ten microliters of sample dissolved in acetonitrile/
2-propanol (50:50, v/v) at 1 mg.mL-1 was injected. The sample was eluted using an isocratic
R2 = 0.990246

48
solvent system containing acetonitrile/2-propanol/formic acid (50:50:1, v/v/v) at a flow rate
of 1 mL.min-1. This HPLC system was connected to an ion-trap mass spectrometer, Agilent
LC-MSD-Trap-SL (Agilent Technologies, Santa Clara, CA, USA) equipped with an
electrospray interface operating in positive ion atmospheric pressure chemical ionization
(APCI). Ions were detected in ion charged control (ICC) mode (target: 30,000 ions) with an
accumulation time of 300 ms, using the following operation parameters: scanning range
200-1000 m/z; capillary exit voltage (fragmentor) 158.5 V; skimmer voltage: 40 V; octapole
RF 150 V; nebulizer pressure 60 psi; drying gas flow 5 L.min−1; gas temperature 325 °C. A
full scan mass spectrum was acquired over the mass range between m/z 200 and 1000. Data
handling was performed with ChemStation Family Software Products (Rev.A.10.02).
5.4.2 γ-tocotrienol esters purification and identification
5.4.2.1 γ-tocotrienol esters purification by preparative thin layer
chromatography scrapping
γ-tocotrienol esters used in experiment were purified from NR lipid
extract obtained from RRIM600 clone using thin layer chromatography scrapping technique
as there is no commercial standard available. To conduct this purification, 0.8 mL of lipid
solution (20 mg.mL-1) from RRIM600 Hevea clone was applied on the preparative TLC
(preparative silica 60G 20x20 cm, Merck, Germany) for 16 cm length (1 mg.cm-1). The plate
was developed in the chamber containing 100 mL of n-hexane/diethyl ether/acetic acid
(90:10:1, v/v/v). The dried plate were cut from both edges for 2 cm and sprayed with a
mixture of 40% orthophosphoric acid and saturated copper acetate aqueous solution (1:1; v/v)
and then heated at 180 oC for 10 min in an oven. This cut plate was used as reference for
target compound scraping. Two bands which corresponded to Rf of γ-tocotrienol esters were
then scraped off separately and transferred to a 25 mL brown glass vial. Ten milliliters of
diethyl ether were added into the brown glass vial and shaken well for 10 min. The extraction
was repeated 3 times with diethyl ether and the extract was filtered through 0.2 µm syringe
filter (Santorius, USA) to remove the silica gel. These purified γ-tocotrienol esters were used
for chemical structural analysis by using HPLC-MS and lipid component quantitative
analysis by HPTLC.

49
5.4.2.2 γ-tocotrienol esters chemical structural identification by high
pressure liquid column chromatography-mass spectrometry (HPLC-MS)
The chemical structural identification of γ-tocotrienol esters was
identified by reverse phase HPLC-MS. The analysis was performed using a Waters Alliance
e2695 Separations Module equipped with a 2998 PDA detector (Waters, USA) and a
microcolumn CSH130 C18 column (3.5 µm particle size, 2.1x50 mm, Waters, USA). The
samples were eluted using an isocratic solvent system containing acetonitrile/Propan-2-
ol/formic acid (75:25:0.1, v/v/v) that passed through the column at a flow rate of 0.1 mL.min-
1. Ten microliters of sample with a concentration of 1 mg.mL-1 was injected. Components
identified by PDA detection were monitored from 200 to 350 nm. Mass spectrum analyses
were carried out with a SQ Detector2 single quadrupole mass detector (Waters, USA)
equipped with a Z spray introduction source. Nitrogen was used both as a nebulizing gas and
drying gas at flow rates of 400 L.h-1 and 20 L.h-1, respectively. The capillary voltage was
3 kV (in the electrospray positive ion mode) with a source temperature of 120 oC and a
desolvation temperature of 580 oC. A voltage applied to the orifice of the instrument, also
known as the cone voltage was set to a soft value of 20 V to detect protonated molecular ion
[M-H]+ of the separated molecular species. A full scan mass spectrum was acquired over the
mass range between m/z 200 and 1000. Data handling was performed with MassLynx
4.1 software.
6. Natural rubber properties measurement
6.1 Determination of dry rubber properties, Initial plasticity (P0) and Plasticity
retention index (PRI)
The initial Wallace plasticity number (P0) and the plasticity retention index (PRI)
were determined according to SMR bulletin 7 (1992) part. B.8. This P0 and PRI
determination requests a specific equipment: Wallace Rapid Plastimeter.

50
6.1.1 Homogenization of dry rubber
The dry rubber sample was homogenized following SMR bulletin 7 (1992)
part B.2, standard. A 100 g piece of rubber was passed six times through the gap between the
150x300 mm rolls of a laboratory mill rotating at uneven speeds. The rolls were cooled with
running water at room temperature and the nip was set at 1.65+0.16 mm. After each pass, the
rubber was rolled into a cylindrical shape and introduced endwise for the next pass. The
rubber was not rolled after the fifth pass but folded and passed lengthwise through the rolls.
After the sixth pass, the obtained sheet was folded before the test pieces were cut out for the
various tests.
6.1.2 Determination of Initial plasticity (P0)
The homogenized rubber was blended three times (doubling the sheet
between each pass) through the rolls of a roller mill with adjusted nip in order to obtain the
final sheet thickness of 1.6-1.8 mm. The sheet was immediately doubled and the two halves
were pressed slightly together by hand. Six test pellets, approximately 3 mm thickness and
13 mm diameter were punched out from the homogenous dry rubber with a Wallace Punch.
The test pellets were divided into two sets (Figure 14); the first three pellets from each
homogenous sheet were for plasticity measurement before ageing and the other three pellets
were for the measurement after oven ageing.
The test pellet sandwiched between two pieces of cigarette paper (RedStar
Treadmark, China), was compressed between the two parallel platens of the Wallace
Plastimeter (Wallace & Co. Ltd., UK) to a fixed thickness of 1+0.01 mm and held for 15+0.2
sec to reach approximate thermal equilibrium with the platen temperature (100+1 oC). It was
subjected to a constant compressive force of 100+1 N for 15 sec at 100+1 oC. The median
value of the thickness after 15 sec compression of three pellets was taken as the measure of
initial plasticity.

51
Figure 14 Doubled rubber sheet with punched test pieces
1. Punched pellets for initial Wallace plasticity (P0) determination
2. Punched pellets for aged plasticity (PRI) determination
6.1.3 Determination of Plasticity retention index (PRI)
The three test pieces were heated in an air Wallace oven at 140+1 oC for
30+0.25 min. After the aged samples were cooled at room temperature, the plasticity of the
aged pellets (P30) was taken according the same method used for unaged samples (P0). The
median values of the three unaged and three aged test samples were used to calculate PRI as
follows:
PRI = 100)(
)(
0
30 PvalueplasticitymedianUnaged
PvalueplascitymedianAged
6.2 Mesostructure analysis by size exclusion chromatography coupled with a
multi-angle scattering detector, SEC-MALS
6.2.1 Sample preparation
An amount of 30 mg of each dry rubber sample was weighed and placed in a
weighed 50 mL Duran bottle. Filtered tetrahydrofuran (THF) stabilized with 250 mg.L-1 of
2,6-ditert-butyl-4-methylphenol (BHT) was used for sample solubilization and also as mobile
phase. Thirty milliliters of this solvent was transferred into the sample containing bottle. The
samples were incubated in the water bath at 30 oC for 1 week and agitated daily for 1 h at
30 rpm using a Reax2 rotary agitator (Heildolph, Germany). After that, samples were filtered
through 1 µm glass membrane into 1 mL vial before injection.

52
6.2.2 SEC-MALS analysis
The equipment consisted of a refractive index detector (Optilab rEX, Wyatt
Technology) operated at 658 nm and 30 °C and a multi-angle light scattering detector (Dawn
DSP, Wyatt technology Corp.) operated at 633 nm. The columns were two PL gel Varian
mixed ALS columns (20 µm, 7.5x300 mm ID) with a guard column. The temperature of the
column was maintained at 45°C. The mobile phase was THF stabilized with 250 mg.L-1 BHT
at a flow rate of 0.65 mL.min-1 and the injected volume was 150 µL. The solvent used for
sample solubilization and for mobile phase was prepared at the same time in order to avoid
any interference due to the change of solvent lot. The number-average molar mass (Mn) and
weight-average molar mass (Mw) were calculated by ASTRA software version 5.3.4.16
(Wyatt Technology). The values of gel content and average molar masses are calculated from
the mean of the three injections for every sample (independent solution).
ASTRA software performed the calculation of the mass of rubber sample
(m1) injected after filtration by integrating the whole rubber peak on the chromatogram. Thus
the exact concentration of the solution and the injected volume were known before and after
filtration. The exact initial mass of sample before filtration, in 0.15 mL was known (m0). The
total of gel content could be calculated as following:
Total gel content (%) = 1000
10
m
mm
m0 = mass of sample before filtration (in 0.15 mL)
m1 = mass of injected sample (calculated by ATSRA software)
7. Antioxidant activity test of total lipid using 2,2-diphenyl-1-picrylhydrazyl, DPPH
method
7.1 γ-tocotrienol and NR lipid extracts samples antioxidant measurement
The antioxidant activity was measured using 2,2-Diphenyl-1-picryhydrazyl
(DPPH) according to the method of Fagali and Catalá (2008) with modification of solvent
from ethanol to chloroform:ethanol mixture (1:1; v/v) and the use of microassay device. The

53
2.5 mM DPPH stock solution was prepared by dissolving 98.5 mg of DPPH with 100 mL in
chloroform:ethanol 1:1, v/v and then stored at -20 °C until needed. The 0.25 mM DPPH
working solution was prepared freshly before use by diluting 10 mL of DPPH stock solution
in 90 mL chloroform:ethanol solution. Tested concentration of lipid extract was 1 mg.mL-1
dissolved in a mixture of chloroform:ethanol. The antioxidant activity of tested samples was
compared with the known antioxidant, γ-tocotrienol (Cayman Chemical, USA). Gamma-
tocotrienol concentrations used were 0, 0.01, 0.02 and 0.05 mg.mL-1 dissolved in same
solvent as sample. A volume of 125 µL of 0.25 mM DPPH solution was added into the
96-wells plate which contain 125 µL of the chloroform:ethanol solution containing either
samples or γ-tocotrienol. Each sample was analyzed in triplicate.
In the DPPH test, the scavenging of DPPH radicals is followed by monitoring the
decrease in absorbance at 517 nm from the initial purple color to yellow which occurs due to
reduction by the antioxidant or reaction with a radical species. To determine the reaction
kinetics, the assays were continuously monitored at 517 nm for 60 min period at 25 °C by
using a Spectra Max190 microplate reader (Molecular Devices, USA). The 96-wells plate
was covered with a lid to prevent solvent evaporation during measurement. The plate was
shaken for 5 sec before each absorbance measurement. The absorbance value was recorded
every 1 min until 60 min, against a blank of chloroform:ethanol solution. % DPPH remaining
is reported as At/A0 where At is absorbance at each measurement time and A0 is absorbance
at the beginning.
% DPPH remaining = 1000
A
At
At = Absorbance at each measurement time
A0 = Absorbance at the beginning
7.2 Method repeatability and reproducibility
To study the method repeatability and reproducibility, both intra-day and inter-day
absorbance measurement were performed. Method repeatability was determined by taking
different concentrations of γ-tocotrienol, δ-tocotrienol, α-tocopherol and γ-tocopherol
standard as shown in Table 7. The given concentrations were applied 3 times to see the

54
variation of their absorbance measurement within the same working day. For method
reproducibility, the same concentrations were applied but their absorbance measurement was
analyzed from two different working days.
Table 7 Concentration ranges of tocotrienol and tocopherol standards used for DPPH
antioxidant activity method repeatability and reproducibility.
Standards Level of concentrations (mg.mL-1)
γ-tocotrienol and α-tocopherol 0.01, 0.02, 0.05, 0.1 and 0.2 δ-tocotrienol and γ-tocopherol 0.01, 0.02 and 0.05

55
CHAPTER 1
Methodology development
1. Introduction
A previous study conducted on Unsmoked Sheet (USS) type of rubber has reported
the influence of lipid components on NR physical properties (initial plasticity (P0), plasticity
after ageing at 140 oC for 30 min (P30) and plasticity retention index (PRI)) but the obtained
range of properties was too narrow to draw robust conclusions on the quantitative
involvement of non-isoprene components especially on PRI which is linked with the
resistance of rubber towards thermal oxidation (Liengprayoon, 2008). The purpose of the
present work was to continue this approach on a set of samples that displays a wider range of
properties, especially PRI. It is well known that maturation of coagula induces a rapid and
huge change of PRI index(Intapun et al., 2009). In order to understand the evolution of the
non-isoprene components and its effect on physical properties (such as P0 and PRI) and
structure, we have chosen to prepare and study rubber samples with various levels of
degradation obtained under controlled conditions. The first approach was to obtain
“degraded” USS rubber by inserting coagula maturation in the USS making process. This
involved a methodology development step where different parameters were tested (dilution
rate, drying conditions, maturation durations and clones). The structure, physical properties
and non-isoprene components of maturated NR were analyzed along maturation time.
Following the results obtained on the degraded mini-USS model, a second approach
was conducted following the protocol previously developed in Prince of Songkla University
(PSU, Surat Thani, Thailand) that involves the maturation of mini-coagula under strictly
controlled conditions in order to simulate the TSR10 dry rubber processing.
Finally, the optimization of 2 biochemical analyses protocols will be presented. The
use of HPTLC (High Performance Thin Layer Chromatography) to assess the evolution of
lipid extract composition during the maturation was optimized. Moreover, as the present
work intends to focus on resistance of NR towards oxidation through its native antioxidant

56
content, methodologies to assess antioxidant in-vitro activity of lipids extract obtained from
maturated NR were also investigated.
2. Maturated mini-sheet preparation
The previous study of Liengprayoon (2008) has shown that the quality of prepared
USS samples was high, characterized by PRI values ranging from 95 to more than 100. This
narrow range of variation in physical properties did not allow to correlate the nature and
quantity of lipid components with NR superior properties. NR samples with a wider range of
physical properties are thus needed.
In a first approach, the USS obtained from laminar coagula preparation was selected
as a model for maturated rubber sample preparation. The main reason for this choice was that
this processing method was fully optimized either technically (totally controlled processing)
or geographically, with a dedicated workshop in an industrial rubber plantation (with clone
origin controlled rubber trees) located less than 3-h drive from our Kasetsart University
laboratory.
For normal size USS preparation, 3 L of latex was used. As a large number of samples
is required to allow the study of different maturation times with 3 replications for each
condition, it was decided to reduce the sample size, to lower latex consumption and ease the
handling of samples. Moreover two drying methods were compared (the classical outdoor air
drying and the oven drying). Several constraints were taken into account to develop this
scaled down process: latex volume, latex dilution, drying conditions, and coagula maturation
times. Two representative clones were used to provide latex (RRIM600 and PB235) for this
methodological development.
2.1 Effect of volume reduction
To make a USS, the RRIT (Rubber Research Institute of Thailand) recommends
to use 3 L of fresh latex and to dilute it with water at a ratio of 3:2 (latex:water v/v) in order

57
to obtain a diluted latex with a dry rubber content (DRC) of 18-20%. This level of DRC eases
rubber coagulum lamination during sheet making step.
The minimum required quantity for the different analyses of the present study
would be approximately 100-150 g of NR (dry weight). To obtain enough dry rubber samples
and to minimize latex consumption, the volume of 500 mL of latex was chosen assuming that
the averaged DRC was around 30-35%. This volume is 6 times smaller than the traditional
one (3 L). All the volumes used in the processing were reduced consequently. The water
volume was reduced to 333 mL instead of 2 L, the 0.42 M formic acid solution volume was
50 mL instead of 300 mL. The maturation tank was downscaled as well to 18x8x7 cm instead
of 17x42x9.5 cm (Figure 15). The latex of two Hevea brasiliensis clones, RRIM600 and
PB235, were used to prepare the samples.
To assess the effects of volume reduction, P0, P30 and PRI of rubber from normal
USS and mini-USS prepared with diluted latex were measured.
The result showed that the physical properties of USS and mini-USS from the two
studied clones were not different (Table 8). However it was observed that the mini-USS
prepared with the latex from both clones tended to have higher P0 and lower PRI than the
normal one. Despite this non significant tendency, the conditions used for reduction of
volume were validated.
Table 8 Physical properties of USS (3 L of latex) and mini-USS (500 mL of latex) from
RRIM600 and PB235 clones.
Clones Samples P0 P30 PRI
Mean SD Mean SD Mean SD
RRIM600 USS 41.4a 0.38 35.3a 1.01 85.3a 2.95
Mini-USS 44.9a 1.76 34.7a 1.45 78.1a 3.51
PB235 USS 51.7α 1.36 43.2α 2.35 83.4α 2.62
Mini-USS 52.7α 0.49 42.2α 1.92 80.0α 3.11
Data were means from 3 replications. For each column and for each clone, letters design group of means which are not significantly different (student t test), p ≤ 0.05, SD: Standard deviation.

58
Filtered fresh latex
a) USS preparation b) mini-USS preparation
300 mL of formic acid
333 mL of water
1) Pass one time through the crusher.
2) Pass 2-3 times through the flat hand mangle.
3) Pass 2 times through the rough hand mangle.
Mini-USS
.
3 L of latex 2 L of water
500 mL of latex
50 mL of formic acid
Pour into maturation box Pour into coagula tank
Coagula
Drying
Laminated coagula
USS
Drying
Figure 15 Unsmoked sheet (USS) (a) and (b) mini-USS processing.

59
2.2 Effect of latex dilution
Secondly, the effect of removing the latex dilution step in the process of making
the mini-USS was studied, as the lamination step was easier with small size coagula. The
same indicators were used to assess this factor.
When comparing mini-USS prepared from diluted and non-diluted latex, it was
found that their physical properties were not different in the rubber from both clones
(Table 9). However, it was observed that the samples prepared from the diluted latex were
dried within a shorter time compared to the non-diluted samples. It could be explained by the
fact that when the coagulum is made from diluted latex, it may increase the gap between each
rubber particle. This larger gap would help the rate of water transportation from inside the
coagulum to outside faster. Though dilution did not significantly change the properties of the
dry rubber, it was decided to keep this step because of drying issue.
Table 9 Physical properties of mini-USS prepared from diluted and non-diluted latex of
RRIM600 and PB235 clones.
Clones Latex P0 P30 PRI
Mean SD Mean SD Mean SD
RRIM600 Diluted 45.3a 1.06 33.8a 0.35 74.6a 2.55
Non-diluted 42.8a 1.89 34.0a 1.41 75.0a 3.18
PB235 Diluted 54.2α 0.76 45.7α 1.26 83.0α 0.35
Non-diluted 52.3α 1.04 45.3α 1.89 83.9α 0.99
Data were means from 3 replications. For each column and for each clone, letters design group of means which are not significantly different (student t test), p ≤ 0.05, SD: Standard deviation.
2.3 Effect of the drying method
In the perspective of working with maturated samples, it was decided to test other
drying methods than the classical outdoor drying. Sheets were hung under shade so that they
were protected from direct sun light and rain. Indeed it is known that maturated coagula are
more difficult to dry than the fresh ones and request stronger drying conditions in terms of
duration and temperature. This is the case of TSR10 or TSR20 processing, where

60
temperatures between 120 to 135 oC are applied for several h to rubber crumbs issued from
maturated coagula.
Two drying methods (outdoor air drying and oven drying) were tested and
compared. Two kinds of laminated coagula were used:
i) Mini-laminated coagula (made from 500 mL latex diluted with 333 mL water
and acidified with formic acid as optimized before).
ii) Maturated mini-laminated coagula (same volumes of latex and water but no
acid, the naturally coagulated coagula being let 1 week in the tank before lamination).
The same physical properties indicators were used (P0, P30 and PRI) to compare
the treatments.
A preliminary trial was performed in our laboratory oven (WTB binder oven,
Germany) at the temperature of 120 oC with mini-USS. The formation of numerous bubbles
in the rubber led us to decrease temperature to 95 oC for the first comparison trial.
It was found that the non-maturated (“day 0”) sample could dry under this
temperature in a 3-4 h time. For RRIM600 clone, the P0 and PRI obtained for non-maturated
samples were significantly different between outdoor air drying and 95 oC oven drying
(Table 10). Indeed, P0 was lower when the rubber was dried at a higher temperature, and PRI
was higher while P30 remains the same. These results were not significantly confirmed with
PB235 clone though the tendency remained (Table 11).
However, it was observed that at 95 oC, the maturated sheet (i.e. 7 days of
maturation) tended to melt before complete drying, which prevented the measurement of the
physical properties (Table 10 and Table 11 for RRIM600 and PB235 clones, respectively). A
lower drying temperature was then tried and it was chosen to use a smoke dryer used to make
Ribbed Smoked Sheet (RSS). The smoke dryer, belonging to Grand Rubber Company
(Chantaburi province, Thailand), was located not far from the plantation.

61
Contrary to 95 oC drying, smoke house drying allowed the full drying of
maturated samples though the drying duration of maturated samples was longer than for the
non-maturated ones (around 7 days instead of 2-3 days). Concerning the properties, smoke
drying improved the P30 of RRIM600 rubber and therefore PRI, and same observation can be
made for maturated sample of PB235 rubber. It is mostly due to the fact that the smoke
drying will stop earlier the maturation process in the laminated coagula. It is noted that PRI
of maturated samples are logically lower than those of non-maturated sample.
The smoke drying was therefore selected to conduct further experiments.
Table 10 Physical properties of non-maturated mini-USS (day 0) and maturated mini-USS
(day 7) of RRIM600 clone obtained using 3 drying conditions.
Maturation days
Drying temperatures
P0 P30 PRI Mean SD Mean SD Mean SD
0 Outdoor 45.3b 0.75 33.8a 0.25 74.6b 1.80
95 oC 34.2d 0.17 35.5a 1.00 103.9a 2.74
60 oC (smoke) 38.2c 0.17 39.0a 0.29 102.2a 0.43
7 Outdoor 58.2a 2.57 11.8b 6.21 20.6c 11.6
95 oC N/D N/D N/D N/D N/D N/D
60 oC (smoke) 58.2a 0.58 37.8a 0.35 65.1b 1.41 Data were means from 3 replications. For each column, letters design group of means which are not significantly different (student t test), p ≤ 0.05, SD: Standard deviation. N/D: could not determine (the sample was degraded under test temperature.
Table 11 Physical properties of non-maturated mini-USS (day 0) and maturated mini-USS
(day 7) of PB235 clone obtained from 3 drying conditions.
Maturation days
Drying temperatures
P0 P30 PRI Mean SD Mean SD Mean SD
0 Outdoor 54.2a 0.76 45.7a 1.26 83.0ab 0.35
95 oC 49.8a 0.29 44.2a 0.29 88.6a 1.10
60 oC (smoke) 49.3a 1.53 41.8a 0.76 84.8ab 1.31
7 Outdoor 47.0a 8.32 22.3b 6.72 42.8c 11.5
95 oC N/D N/D N/D N/D N/D N/D
60 oC (smoke) 54.3a 2.89 39.0a 3.00 71.9b 6.65 Data were means from 3 replications. For each column, letters design group of means which are not significantly different (student t test), p ≤ 0.05, SD: Standard deviation. N/D: could not determine (the sample was degraded under test temperature).

62
2.4 Maturation duration
The purpose of this methodological development was to obtain significant
evolution of P30 and PRI indicators in a reasonable period of time. Preliminary experiments
were conducted and showed that the 7 days maturation duration was not enough to see very
significant changes of physical properties. Therefore it was chosen to extend maturation time
up to 14 days. For every maturation duration, 3 independent replications were performed.
Figure 16 presents the evolution of rubber physical properties during
14 maturation days of RRIM600 and PB235 samples dried from 2 drying methods. It has to
be noted that after 24 h, RRIM600 latex was not coagulated, which explains that no physical
data could be measured for 1-day maturation. It can be observed that PRI and P30 evolved
significantly during maturation, so 14 days maturation time was extended to 14 days. Chapter
2 will discuss the evolution of these physical properties indicators during maturation and
depending on drying condition in details.
However, despite several repetitions of the protocol, the variance of the rubber
properties data was not considered enough satisfactory to select this protocol for further
studying the lipid composition and the native antioxidant dynamics. This variance could be
due to the difference of environmental conditions such as temperature, air relative humidity
etc. during rubber maturation and/or drying. Indeed, maturation occurred in plastic boxes that
were voluntarily placed in an uncontrolled environment (an open shelter nearby the USS
workshop). One key factor that could explain the high variance could be the microbial
population. Indeed, the initial number of microorganism in Hevea latex and their activity has
been reported to affect NR properties(Rose and Steinbuchel, 2005 ; Intapun et al., 2009). In
our experiment, latex inoculation was uncontrolled and it is possible that it could vary from
one box to another (including between 3 repetitions). Indeed, different contamination levels
could be visually observed when the maturated coagulum were handled and washed before
lamination as presented in Figure 17.

63
Figure 16 Physical properties (P0, P30 and PRI) evolution during 14 days of maturation of
sheet coagula from (a) RRIM600 and (b) PB235 rubber clones.
a) RRIM600 clone b) PB235 clone

64
Following the not fully satisfactory results obtained from mini-sheet protocol, it
was decided to conduct further experiments under strictly controlled environment conditions.
The maturation device used was developed during the PhD thesis of Jutharat Intapun in PSU,
Surat Thani, Thailand. The detailed description of this device is in Materials and Methods.
Figure 17 RRIM600 coagula from 2 replications of (a) 3 days and (b) 7 days of maturation.
3. Optimization of High Performance Thin Layer Chromatography (HPTLC) for NR
lipid composition analysis
Many modern chromatographic techniques for the analysis of lipid extracted from NR
samples, such as Gas Chromatography (GC) and Liquid Chromatography (LC) combined
with Mass Spectrometry (MS), have been reported (Liengprayoon, 2008). However, these
chromatographic techniques are time consuming and costly.
Among the modern analytical methods, High Performance Thin Layer
Chromatography (HPTLC) allows separation with a good resolution and provides qualitative
and quantitative results for a wide range of compounds. HPTLC can be applied for the
analysis of NR lipid extracts without any pre-treatment, which could avoid the possible
structure modification of compounds during sample treatment. Accordingly, the objective of
this present methodology development study was to validate a new HPTLC condition for the
analysis of lipid compositions obtained from maturated NR samples, especially γ-tocotrienol
and its esterified forms. The technical details of the HPTLC operations are indicated in
Materials and Methods.
b) a) 3-Day
Replication 2 Replication 3
b) 7-Day
Replication 2 Replication 3

65
3.1 Mobile phase optimization
For optimization, different mobile phases were employed to achieve a good
separation of target components which were sterols, free fatty acids (FFA), γ–tocotrienol,
triglycerides of furan fatty acid (TGF), two γ–tocotrienol esters (I and II), wax and sterol
esters (SE). Initially, a conventional mobile phase consisting of hexane/diethyl ether/acetic
acid 80:20:1 (v/v/v) was tried (Figure 18a) with reference standards and PB235 lipid samples
from different maturation times. Two other conditions were tested with the same sample:
-Successive elutions with 2 mobile phases consisting of hexane/diethyl
ether/acetic acid at ratio of 50:50:1 v/v/v (until 4 cm from the plate bottom, followed by a
drying cycle) and 90:10:1 v/v/v (until 8 cm) (Figure 18b)
-Elution of hexane/diethyl ether/acetic acid at ratio of 90:10:1 v/v/v (Figure 18c)
Figure 18 TLC pictures obtained from lipid extracts of PB235 rubber from maturated
coagula (D0: 0-day, D5: 5-day and D7: 7-day maturation) developed in (a) hexane/diethyl
ether/acetic acid 80:20:1 (v/v/v), (b) elution of 2 successive mobile phases, hexane/diethyl
ether/acetic acid 50:50:1 (v/v/v) and 90:10:1 (v/v/v), and (c) hexane/diethyl ether/acetic acid
90:10:1 (v/v/v).
1: Sterols, 2: Free fatty acids, 3: γ-tocotrienol, 4: Triacylglycerols of furan fatty acid, 5: Wax,
6: γ-tocotrienol esters (not separated), 6a and 6b: γ-tocotrienol esters (separated), and 7:
Sterol esters.
1 2 3
4
5
6 7
3 4
5
6
4
5 6a
7
1
2
7
1
6b
D0 D5 D7 D5 D7D0 D5 D7 D0
a) Mobile phase: 80:20:1 (v/v/v)
b) Two successive mobile phases: 50:50:1 and 90:10:1 (v/v/v)
c) Mobile phase: 90:10:1 (v/v/v)

66
With the classical hexane/diethyl ether/acetic acid 80:20:1 (v/v/v) mobile phase,
the two γ-tocotrienol esters could not be separated (Figure 18a, spot no. 6). The successive
elutions with of two different mobile phases (Figure 18b) separated well the compounds with
a low retention factor (Rf) but did not resolve the γ-tocotrienol esters (Figure 18b, spot no. 6).
A single elution with hexane/diethyl ether/acetic acid 90:10:1 (v/v/v) was found to be an
appropriate mobile phase to separate the two γ-tocotrienol esters bands, as presented in
Figure 18c, spot no. 6a and 6b.
Therefore, it was not possible to analyze all lipid components using a single TLC
condition even with a double migration. Lipid components analysis was thus divided into
2 target groups. The group of high Rf components, which are γ-tocotrienol esters (Figure 18c,
spot no. 6a and 6b), wax and SE were separated by hexane/diethyl ether/acetic acid 90:10:1,
v/v/v. The mix of hexane/diethyl ether/acetic acid 80:20:1, v/v/v was used for separation of
low Rf component composed of free sterols, FFA, free γ-tocotrienol and TGF.
Table 12 Lipid standards concentration levels for calibration curves.
Standards Concentration levels (mg.mL-1)
1 2 3 4 5 6 7 8 9 10 FFA
(oleic acid (C18:1)) 0.25 0.50 1.0 2.0 3.0 4.0 5.0 6.0 7.0 8.0
Sterol (stigma sterol)
0.2 0.4 0.8 1.6 2.4 3.2 4.0 4.8 5.4 6.2
γ-tocotrienol 0.1 0.2 0.4 0.6 0.8 1.0 1.2 1.4 1.6 1.8 TG 0.1 0.2 0.4 0.8 1.6 2.4 3.2 4.0 4.8 5.4
γ-tocotrienol esters (I and II) 0.2 0.4 0.8 1.6 3.2 4.8 - - - - Wax 0.2 0.4 0.8 1.6 3.2 4.8 - - - -SE
(cholesteryl stearate) 0.2 0.4 0.8 1.6 2.4 3.2 4.0 4.8 5.4 6.2
3.2 Standard calibration curve
The quantities of the compounds were calculated from the standard calibration
curve. In our study, the calibration curves of sterol, FFA, γ-tocotrienol, triacylglycerols (TG)
and SE commercial standard were first obtained with 10 different concentrations while only
6 concentration levels were used for two γ-tocotrienol esters and wax purified from RRIM600
lipid as shown in Table 12. The three dimension image of standard chromatograms obtained

67
by densitometry analysis of the HPTLC tracks corresponding to the concentration levels is
shown in Figure 19.
Figure 19 HPTLC three-dimensional image of the calibration curve of 8 standards (a and b),
(c) the example of calibration curve of γ-tocotrienol commercial standard and (d) γ-
tocotrienol ester (peak no. 6) purified from RRIM600 lipid extract.
1: Sterols, 2: Free fatty acids, 3: γ –tocotrienol, 4: Trioleylglycerols, 5: Sterol esters, 6 and 7:
γ-tocotrienol esters and 8: Wax.
The calibration curves were obtained using a 2nd degree polynomial model. The
developed HPTLC method allowed the simultaneous quantitative analysis of 21 samples.
R2 = 0.99952 R2 = 0.99967
a) b)
c) d)
6
7
8
1 2
3 4
5
68
3.3 Repeatability and reproducibility of the HPTLC method
The repeatability (3 plates performed within a same working day) and
reproducibility (3 plates performed on 3 working days) of the method were verified by the
average of peak area obtained from 4 concentration levels of γ-tocotrienol, sterol, TG and
FFA standards. After the 4 standards were applied on TLC plate, the plate was developed
with hexane/diethyl ether/acetic acid 80:20:1 v/v/v. The calculated coefficients of variation
(CV) of the standard peak areas are shown in Table 13 and Table 14. The low value of CV
(less than 9%) indicated that this technique can be considered as repeatable and reproducible.
3.4 Conclusion
No single mobile phase was found to separate all compounds so different mobile
phases were purposely used to obtain the successful separation of all components.
Hexane/diethyl ether/acetic acid 80:20:1, v/v/v was suitable for sterols, FFA, free form of
tocotrienols (γ- and α-form) and TGF separation. Meanwhile, using the same solvent with the
ratio of 90:10:1, v/v/v was appropriate for the separation of esterified forms of γ-tocotrienol
and sterols. The repeatability and reproducibility of the developed method were confirmed by
a dedicated study.
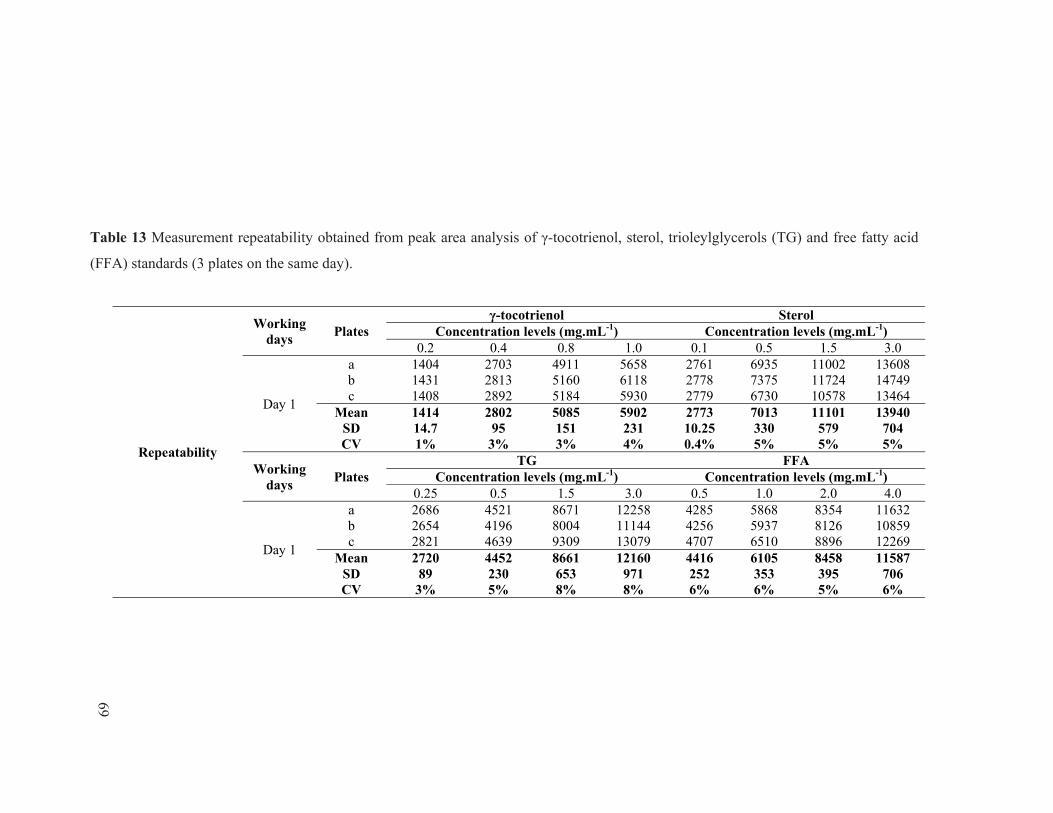
69
Table 13 Measurement repeatability obtained from peak area analysis of γ-tocotrienol, sterol, trioleylglycerols (TG) and free fatty acid
(FFA) standards (3 plates on the same day).
Repeatability
Working days
Plates γ-tocotrienol Sterol
Concentration levels (mg.mL-1) Concentration levels (mg.mL-1) 0.2 0.4 0.8 1.0 0.1 0.5 1.5 3.0
Day 1
a 1404 2703 4911 5658 2761 6935 11002 13608b 1431 2813 5160 6118 2778 7375 11724 14749 c 1408 2892 5184 5930 2779 6730 10578 13464
Mean 1414 2802 5085 5902 2773 7013 11101 13940 SD 14.7 95 151 231 10.25 330 579 704 CV 1% 3% 3% 4% 0.4% 5% 5% 5%
Working days
Plates TG FFA
Concentration levels (mg.mL-1) Concentration levels (mg.mL-1) 0.25 0.5 1.5 3.0 0.5 1.0 2.0 4.0
Day 1
a 2686 4521 8671 12258 4285 5868 8354 11632 b 2654 4196 8004 11144 4256 5937 8126 10859 c 2821 4639 9309 13079 4707 6510 8896 12269
Mean 2720 4452 8661 12160 4416 6105 8458 11587 SD 89 230 653 971 252 353 395 706 CV 3% 5% 8% 8% 6% 6% 5% 6%
69

70
Table 14 Measurement reproducibility obtained from peak area analysis of γ-tocotrienol, sterol, trioleylglycerols (TG) and free fatty acid
(FFA) standards (1 plate/day, 3 working days).
Reproducibility
Working days
Plates γ-tocotrienol Sterol
Concentration levels (mg.mL-1) Concentration levels (mg.mL-1) 0.2 0.4 0.8 1.0 0.1 0.5 1.5 3.0
Day 1 a 1404 2703 4911 5658 2761 6935 11002 13608 Day 2 d 1392 3015 5140 5984 2604 6855 10894 13877 Day 3 e 1424 2811 5371 6228 2663 7649 11475 14014
Mean 1406 2843 5141 5957 2676 7146 11124 13833 SD 16.07 158.29 230 286 80 437 309 207 CV 1% 6% 4% 5% 3% 6% 3% 1%
Working days
Plates TG FFA
Concentration levels (mg.mL-1) Concentration levels (mg.mL-1) 0.25 0.5 1.5 3.0 0.5 1.0 2.0 4.0
Day 1 a 2686 4521 8671 12258 4285 5868 8354 11632 Day 2 d 2768 4571 8737 12070 4337 6002 8325 11017 Day 3 e 2636 4447 8403 11734 4312 5905 7960 10239
Mean 2697 4513 8604 12021 4312 5925 8213 10963 SD 67 63 177 266 26 69 219 698 CV 2% 1% 2% 2% 1% 1% 3% 6%
70

71
4. Optimization of 2,2-di-phenyl-1-picrylhydrazyl (DPPH) antioxidant activity assay for
NR lipids
There are many techniques available for antioxidant activity assay. Among those
techniques, 2,2-diphenyl-1-picrylhydrazyl (DPPH) assay is commonly used to determine the
antioxidant activity of various plant extracts (Bendini et al., 2006).
The first optimization step was dedicated to the solvent system used for the reaction,
as our samples (NR lipid extracts) were not fully soluble in ethanol.
Generally, the measurement of DPPH antioxidant activity is done
spectrophotometrically using 1-4 mL cuvettes. This allows the analysis of only a very limited
number of samples at the same time and consumes an important amount of reactants and
samples. In this present study, DPPH assay using a 96-well microplate spectrophotometer
was developed and validated to assess the antioxidant activity of NR lipid extract in a rapid
and cost effective manner.
4.1 Solvent modification
The antioxidant activity of NR lipid extracts was measured using DPPH according
to the method of Fagali and Catalá (2008) with modification in order to increase the solubility
of lipid extract from NR, which is not soluble in polar organic solvent. Initially, the reaction
was carried out using 3 solvent systems: pure ethanol and mixtures of chloroform/ethanol
1:1 and 1:2, v/v. It was found that DDPH was soluble in all solvents at the tested
concentration of 0.1 mg.mL-1. Concerning lipid samples, at a concentration of 10 mg.mL-1, an
unclear solution was observed in ethanol and chloroform/ ethanol 1:2, v/v, while a clear
solution was observed with chloroform/ethanol 1:1, v/v. A lower concentration of lipid
sample (1 mg.mL-1 in chloroform/ethanol 1:2, v/v) was tested but unclear solution was still
observed. Therefore, the ratio of 1:1 v/v of chloroform/ethanol was chosen for further
analysis.

72
4.2 Comparison of a microplate spectrophotometer and cuvette
spectrophotometer measurements
The conventional DPPH assay (with chloroform/ethanol 1:1, v/v solvent) method
using 4-mL of cuvette volume spectrophotometer was compared with a downscaled method
using a 96-well microplate reader. Generally, for the cuvette spectrophotometer method,
1 mL of test sample is mixed with 1 mL of DPPH (0.1 mg.mL-1) using vortex for 5 s before
the first absorbance measurement. In our adapted method using microplates, reaction
volumes were scaled down from 1 mL to 125 µL for both test sample and 0.1 mg.mL-1
DPPH. The plate was shaken for 5 s between each measurement. Except for the size
difference, the analysis sequences were the same in both methods: the absorbance of
2 concentrations of α-tocopherol standard mixture (0.01 and 0.02 mg.mL-1) was measured at
517 nm every minute from 0 to 10 min and every 10 min later on until 60 min.
Table 15 The initial slope and %DPPHrem60 of α-tocopherol standard at 0.01 and 0.02
mg.mL-1 concentrations obtained from 2 spectrophotometer measurements. Concentrations
(mg.mL-1) Type of
spectrophotometer Initial slopes (%DPPH.min-1) SD %DPPHrem60 SD
0.01 96-well microplate -4.27a 0.09 83.2a 0.70
4-mL cuvette -3.93a 0.22 84.8a 0.98
0.02 96-well microplate -9.07α 0.21 64.9α 0.80
4-mL cuvette -8.03α 0.47 67.5α 0.99 Data were means from 3 replications. For each column and for each concentration, letters design group of means which are not significantly different (student t test), p ≤ 0.05, SD: Standard deviation.
Two indicators were analysed to test whether both methods gave the same results:
the initial slope of the curve %DPPH = f(time) and the value of the final plateau at 60 min
(%DPPHrem60). The initial slope indicates the rate of reaction and was determined in the time
range of 0 to 3 min.
No significant difference of either the initial slope or %DPPHrem60 was detected
between the 2 methods (Table 15), which validated the developed DPPH microassay
measurement.

73
4.3 Standard concentration range
In the DPPH measurement using microplate reader experiment, the first step was
to define the suitable concentration range of standard. Gamma-tocotrienol standard was used
as a reference compound for lipid antioxidant activity as it was reported that γ-tocotrienol is
the dominant native antioxidant in NR (Nadarajah et al., 1971). A preliminary test was
carried out using γ-tocotrienol at the concentrations of 0, 0.01, 0.02, 0.05, 0.1 and 0.2 mg.mL-
1. The obtained antioxidant activity of γ-tocotrienol is presented in Figure 20.
At every tested concentration, the decrease of DPPH was fast for the first 3 min
and reached a plateau state after 10 min. The DPPH drop rate increased with γ-tocotrienol
concentration (Table 16). However it was found that %DPPHrem60 of 0.05, 0.1 and
0.2 mg.mL-1 concentrations were not different. Therefore the concentrations of γ-tocotrienol
chosen for the experiment were 0.01, 0.02 and 0.05 mg.mL-1.
Figure 20 Variation of % DPPH remaining obtained from γ-tocotrienol standard at the
concentration of 0, 0.01, 0.02, 0.05, 0.1 and 0.2 mg.mL-1 (3 replications).

74
Table 16 Initial slope value and %DPPHrem60 obtained from γ-tocotrienol standard at the
concentration of 0, 0.01, 0.02, 0.05, 0.1 and 0.2 mg.mL-1 (3 replications).
Concentrations (mg.mL-1)
Initial slopes (%DPPH.min-1)
SD %DPPHrem60 SD
0.01 -4.45a 0.23 82.3a 0.52
0.02 -9.11b 0.20 64.4b 0.79
0.05 -17.95c 0.10 24.9c 0.55
0.10 -22.45d 0.11 23.0c 0.55
0.20 -23.58e 0.16 22.6c 0.31 Data were means from 3 replications. For each column, letters design group of means which are not significantly different (student t test), p ≤ 0.05, SD: Standard deviation.
4.4 Measurement repeatability and reproducibility
The repeatability and reproducibility of the measurement using the same
indicators: the initial slope of the curve %DPPH = f(time) and %DPPHrem60 obtained from
0.01, 0.02, and 0.05 mg.mL-1 concentrations of γ-tocotrienol, δ-tocotrienol, α-tocopherol and
γ-tocopherol standards. The DPPH assay was repeated 3 times within the same day for
method repeatability. For each assay and each component concentration, 3 wells were used
with 3 independently prepared solutions. The reproducibility was estimated by performing
3 assay replications in 3 different days using freshly prepared solutions each day.
As shown in Table 17, the CV values of the 2 indicators obtained during the
method repeatability study were less than 5%. A similar observation can be done in the
reproducibility study results presented in Table 18 where maximum CV of indicators was
5%. This low CV values indicated the good repeatability and reproducibility of the method
for the used standards in the tested concentrations.
4.5 Conclusion
The antioxidant activity of NR lipids could be assessed by a modified DPPH
method using chloroform/ethanol (1:1, v/v). The adaptation of the method to the use of
96-well microplates also allowed the simultaneous analysis of a large number of samples,
using a low amount of samples and reactants. The measurement repeatability and
reproducibility (CV less than 5%) was validated.
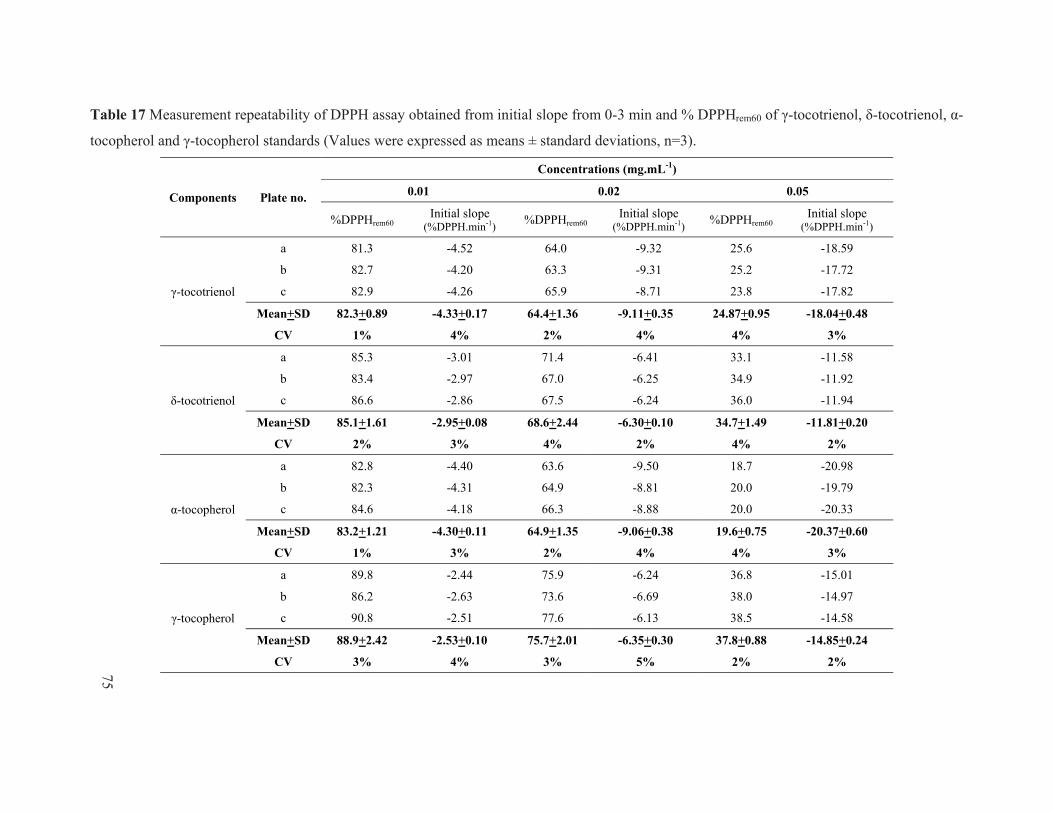
75
Table 17 Measurement repeatability of DPPH assay obtained from initial slope from 0-3 min and % DPPHrem60 of γ-tocotrienol, δ-tocotrienol, α-
tocopherol and γ-tocopherol standards (Values were expressed as means ± standard deviations, n=3).
Components Plate no.
Concentrations (mg.mL-1)
0.01 0.02 0.05
%DPPHrem60 Initial slope
(%DPPH.min-1)%DPPHrem60
Initial slope (%DPPH.min-1)
%DPPHrem60 Initial slope
(%DPPH.min-1)
γ-tocotrienol
a 81.3 -4.52 64.0 -9.32 25.6 -18.59
b 82.7 -4.20 63.3 -9.31 25.2 -17.72
c 82.9 -4.26 65.9 -8.71 23.8 -17.82
Mean+SD 82.3+0.89 -4.33+0.17 64.4+1.36 -9.11+0.35 24.87+0.95 -18.04+0.48
CV 1% 4% 2% 4% 4% 3%
δ-tocotrienol
a 85.3 -3.01 71.4 -6.41 33.1 -11.58
b 83.4 -2.97 67.0 -6.25 34.9 -11.92
c 86.6 -2.86 67.5 -6.24 36.0 -11.94
Mean+SD 85.1+1.61 -2.95+0.08 68.6+2.44 -6.30+0.10 34.7+1.49 -11.81+0.20
CV 2% 3% 4% 2% 4% 2%
α-tocopherol
a 82.8 -4.40 63.6 -9.50 18.7 -20.98
b 82.3 -4.31 64.9 -8.81 20.0 -19.79
c 84.6 -4.18 66.3 -8.88 20.0 -20.33
Mean+SD 83.2+1.21 -4.30+0.11 64.9+1.35 -9.06+0.38 19.6+0.75 -20.37+0.60
CV 1% 3% 2% 4% 4% 3%
γ-tocopherol
a 89.8 -2.44 75.9 -6.24 36.8 -15.01
b 86.2 -2.63 73.6 -6.69 38.0 -14.97
c 90.8 -2.51 77.6 -6.13 38.5 -14.58
Mean+SD 88.9+2.42 -2.53+0.10 75.7+2.01 -6.35+0.30 37.8+0.88 -14.85+0.24
CV 3% 4% 3% 5% 2% 2%
75

76
Table 18 Measurement reproducibility of DPPH assay obtained from initial slope from 0-3 min and %DPPHrem60 of γ-tocotrienol, δ-tocotrienol,
α-tocopherol and γ-tocopherol standards (Values were expressed as means ± standard deviations, n=3).
Components Working days
Concentrations (mg.mL-1)
0.01 0.02 0.05
%DPPHrem60 Initial slope
(%DPPH.min-1)%DPPHrem60
Initial slope (%DPPH.min-1)
%DPPHrem60 Initial slope
(%DPPH.min-1)
γ-tocotrienol
1 81.3 -4.52 64.0 -9.32 25.2 -18.59
2 84.8 -4.55 69.6 -8.66 23.1 -17.85
3 80.6 -4.76 64.9 -8.95 25.6 -18.34
Mean+SD 82.2+2.26 -4.61+0.13 66.2+3.00 -8.98+0.33 24.6+1.34 -18.26+0.38
CV 3% 3% 5% 4% 5% 2%
δ-tocotrienol
1 85.3 -3.01 71.4 -6.41 33.1 -11.58
2 88.1 -2.77 70.4 -6.90 32.3 -12.11
3 89.5 -2.88 71.4 -6.61 34.5 -11.70
Mean+SD 87.6+2.14 -2.89+0.12 70.0+0.52 -6.64+0.25 33.3+1.14 -11.80+0.28
CV 2% 4% 1% 4% 3% 2%
α-tocopherol
1 82.8 -4.40 63.6 -9.50 18.7 -20.98
2 84.2 -4.53 65.6 -8.75 19.6 -19.75
3 85.6 -4.09 67.2 -9.01 20.7 -18.96
Mean+SD 84.2+1.40 -4.34+0.23 65.5+1.80 -9.09+0.38 19.7+1.00 -19.90+1.02
CV 1.7% 5% 3% 4% 5% 5%
γ-tocopherol
1 89.8 -2.44 75.9 -6.24 36.8 -15.01
2 90.0 -2.65 77.0 -5.85 37.3 -15.16
3 84.2 -2.50 78.1 -6.48 35.7 -13.78
Mean+SD 88.0+3.29 -2.53+0.11 77.0+1.10 -6.19+0.32 36.6+0.82 -14.65+0.76
CV 4% 4% 1% 5% 2% 5%
76

77
5. Structural identification of γ-tocotrienol derivatives
The presence of unknown components was observed during NR lipid analysis by TLC
as shown in Figure 21. These unknowns had a similar Rf as one of the components observed
from γ-tocotrienol commercial standard. It is to be noted that the unknowns were not initially
found in standards but possibly appeared following a γ-tocotrienol oxidation during storage
after bottle opening.
Figure 21 TLC of lipids from RRIM600 lipid samples at 0 day (D0), 2 days (D2) and 7 days
(D7) of maturation and γ-tocotrienol standard (γ) developed in the mobile phase of
hexane/diethyl ether/acetic acid, 80:20:1 (v/v/v).
1: Sterols, 2: Free fatty acids, 3: γ-tocotrienol, 4: Triacylglycerol of furan fatty acid, 5: Wax,
6: Sterol esters.
5.1 γ-tocotrienol derivatives identification from γ-tocotrienol standard
In order to identify the unknown I and II, an injection to HPLC-MS using
γ-tocotrienol standard from a bottle that was kept open from several days was conducted.
The total ion count chromatogram (TIC) and mass spectra obtained after injection
of γ-tocotrienol standard kept in an open bottle are presented in Figure 22. Three main peaks
were identified at the retention time (Rt) of 4.3 min (peak 1), 8.3 min (peak 2) and 9.1 min
1
γ
2 3
4
6
D0 D2 D7
5
Unknown II
Unknown I

78
(peak 3), respectively. The detected mass m/z 411 of peak 1 corresponded to the structure of
γ-tocotrienol free form [M+H]+. Two same masses, m/z 819, were detected for peak 2 and 3.
Indeed m/z 819 is equivalent to twice that of γ-tocotrienol minus 2 hydrogens [2M-2H+H]+.
Also, literature reported the presence of γ-tocotrienol dimers from Hevea latex (Chow and
Draper, 1970) and dimers in tocotrienol oxidation products (Büsing and Ternes, 2011).
Moreover, a detailed analysis of fragments supported this assumption (see fragment weights
on Figure 22c and Figure 22d). For example, the presence of fragmented mass of m/z 599
corresponded to phytyl chain loss of these dimers. The fragmentation pattern was similar for
both suspected dimers, except the presence of m/z 425 in peak 3 (9.1 min). This difference
allows to attribute the two molecular chemical structures to each peak. This attribution is
confirmed by the order of elution. Indeed it is normal that the dimers with the two hydroxyl
groups (as called dihydroxy dimer by Büsing and Ternes (2011)) elute before on a reverse
HPLC phase due to a higher polarity.
5.2 Tocotrienol derivatives identification from NR lipid extract
5.2.1 Purification and HPLC-MS analysis
Unknown II component (Figure 21) obtained from RRIM600 lipid extract
was purified by liquid column chromatography (LC) in order to confirm its chemical
structure. The LC experiment was carried out by loading 867 mg of lipids dissolved in 1 mL
hexane into a 2.8 cm diameter x16 cm length column using 30 g of Florisil (Actived
Magnesium silicate, Restek, U.S.A.) as a packing material. The mobile phase used was
hexane/diethyl ether/acetic acid 80:20:1 (v/v/v). The flow rate was approximately
1.4 mL.min-1. Fifty mL of void volume was collected as a single first fraction then the
fraction volume was 9 mL. Twenty fractions were collected and their content checked by
TLC. The unknown II component spot appeared mainly in fractions 6 to 9 (Figure 23).
However it was observed that sterol esters co-eluted in the same fractions. Those fractions
(6-9) were grouped and deposited on a preparative TLC in order to get rid of sterol esters.
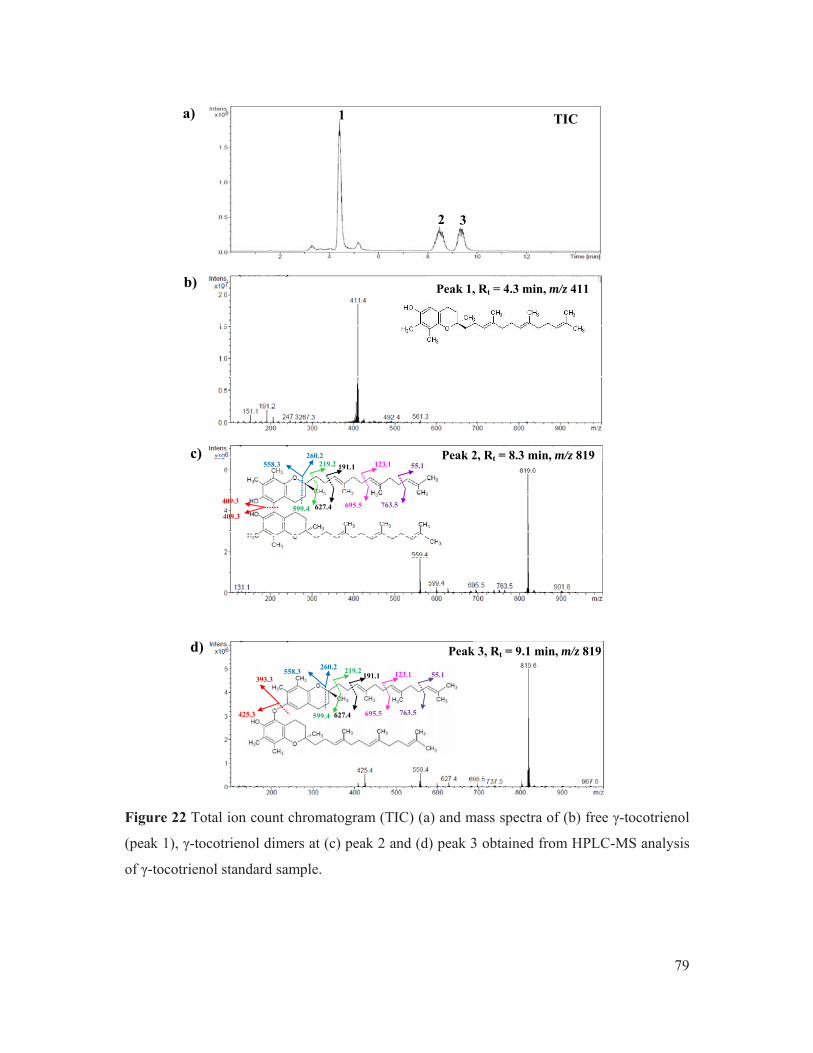
79
Figure 22 Total ion count chromatogram (TIC) (a) and mass spectra of (b) free γ-tocotrienol
(peak 1), γ-tocotrienol dimers at (c) peak 2 and (d) peak 3 obtained from HPLC-MS analysis
of γ-tocotrienol standard sample.
TIC
Peak 1, Rt = 4.3 min, m/z 411
1
2 3
a)
b)
c)
d)
425.3
393.3
260.2 558.3
Peak 3, Rt = 9.1 min, m/z 819
Peak 2, Rt = 8.3 min, m/z 819
219.2
599.4
55.1
763.5
123.1
695.5 627.4
191.1
409.3
409.3
558.3 260.2
219.2
599.4
191.1
627.4
123.1
695.5
55.1
763.5

80
Figure 23 TLC of the first 20 collected fractions from liquid column chromatography on
silica gel from RRIM600 lipid developed in the mobile phase of hexane/diethyl ether/acetic
acid, 80:20:1 (v/v/v).
1: Sterols, 2: Free fatty acids, 3: γ-tocotrienol, 4: Triacylglycerols, 5: Wax, 6: Fatty acid
methyl ester, 7: Unknown II and 8: Sterol esters.
The purified spot which has a similar Rf as Unknown II with 80:20:1 of
hexane: diethylether: acetic acid (v/v/v) mobile phase was analyzed by HPLC-MS (Ion Trap
Mass Spectrometer) with the same method as that used for γ-tocotrienol standard. The
obtained TIC chromatogram (Figure 24a) shows that this purified TLC spot contained
numerous components. The mass spectra of all peaks were analyzed and the mass spectrum
of the identified dimer (m/z 819) was observed only in peak 5 as shown in Figure 24b. This
suggested that the unknown II compound observed in lipid extract at the similar Rf of dimer
from γ-tocotrienol standard was not actually the same molecule.
To be able to distinguish this group of compounds, different mobile phases
were tried in HPTLC analysis on total lipids. The TLC analysis of lipid extract from
RRIM600 rubber with a mobile phase of hexane/diethyl ether/acetic acid 90:10:1 (v/v/v)
confirmed the chemical difference between unknown II band in NR lipids and dimers of
γ-tocotrienol from standard (Figure 25a, showing different Rf). It was also confirmed that the
single spot separated with 80:20:1 mobile phase, named unknown II, contained at least two
components (spot no. 5 and 6 in Figure 25). To confirm precisely the chemical structure of
the components of this 2 spots, a preparative TLC was done again using the 90:10:1 v/v/v
Fraction chosen for the unknown II analysis
3
4
6 5
2
1
1 2 3 4 5 6 7 8 9 10 11 12 13 14 15 16 17 18 19 20
Mix
34
γ- S
td.
Mix
34
7 8

81
mobile phase. The two purified components obtained from preparative TLC were analyzed
by HPLC-MS using another equipment (Single Quadrupole Mass Detection). The sample
purification procedure and HPLC-MS conditions are described in Materials and Methods
(§5.4.2).
Figure 24 Total ion count chromatogram (TIC) (a) and (b) mass spectrum of γ-tocotrienol
dimer obtained from HPLC-MS analysis of RRIM600 lipid extract.
a)
b)
3
2 1
4
5
6
7
8
Peak 5, Rt = 9.1 min, m/z 819 min 55.1
763.5 695.5 627.4
191.1 219.2
599.4
260.2 558.3
393.3
425.3
123.1

82
Figure 25 TLC of RRIM600 lipid samples at 0 day (D0), 2 days (D2) of maturation and
γ-tocotrienol oxidized standard (γ) developed in (a) mobile phase hexane/diethyl ether/acetic
acid, 90:10:1 (v/v/v) compared the same deposits developed with (b) mobile phase
hexane/diethyl ether/acetic acid, 80:20:1 (v/v/v).
1: γ-tocotrienol, 2, 4 and 7: γ-tocotrienol dimers, 3: Wax, 5 and 6: Unknown II and 8: Sterol
esters.
The TIC chromatogram and mass spectra of corresponding to spot no. 5 and
6 are presented in Figure 26 and Figure 27, respectively. The analysis of the mass spectra led
to the identification of several species of γ-tocotrienol esters present as molecular ions
[M+H]+, but also as adducts such as [M+NH4]+, [M+Na]+ and [M+K]+.
For spot no.5, two main peaks were identified at 18.1 and 23.3 min. At
18.1 min, the detected species corresponded to the γ-tocotrienol ester of linoleic acid (γ-T3-
C18:2; M = 672.5 g.mol-1: [M+H]+: m/z 674; [M+NH4]+: m/z 691; [M+Na]+: m/z 696 and
[M+K]+: m/z 712). At 23.3 min, the detected species corresponded to the γ-tocotrienol ester
of oleic acid (γ-T3-C18:1; M = 674.54 g.mol-1): [M+H]+: m/z 676; [M+NH4]: m/z 693;
[M+Na]+: m/z 698 and [M+K]+: m/z 714 (Figure 26).
For spot no. 6, two main peaks were also identified at 24.2 min and
31.5 min. The same analysis led to the identification of γ-tocotrienol esterified respectively
with palmitic acid (γ-T3-C16:0, M = 648.54 g.mol-1; [M+H]+: m/z 650; [M+NH4]+: m/z 667;
D0 D2 γ
b) 80/20/1 v/v/va) 90/10/1 v/v/v
3 4 5 6 7
8
1
2
Unknown II
Unknown I
γ D0 D2

83
[M+Na]+: m/z 672 and [M+K]+: m/z 688) and with stearic acid (γ-T3-C18:0, M = 676.57
g.mol-1; [M+H]+: m/z 678; [M+NH4]+: m/z 695; [M+Na]+: m/z 700 and [M+K]+: m/z 716) as
shown in Figure 27.
Concerning other fatty acids, trace of γ-tocotrienol esterified with C16:0
were detected in both spots at Rt of 9.5min (detailed data not shown). Meanwhile, γ-T3-
C20:0 ester was not detected most probably because the total run duration was not long
enough. Moreover, a small peak at 28.69 min in the TIC chromatogram from spot no. 6 gave
the mass spectrum of a possible γ-tocotrienol esterified with heptadecanoic acid (C17:0).
The two purified components from PB235 lipid sample were analyzed
similarly. The constituents of the two unknown components were not different from those
observed in RRIM600 lipid extract (data not shown).
5.2.2 Identification cross-checking by saponification
In order to confirm the previous finding, the scrapped components from spot
no. 5 and 6 obtained from PB235 lipid extract were submitted to saponification to check
whether the reaction products were made of fatty acids and free γ-tocotrienol.
After saponification, the free fatty acids and unsaponifiable fractions were
grouped, submitted to silylation and injected in GC-MS. Figure 28 presents the TIC
chromatogram and Figure 29 and Figure 30 present mass spectra of spots no. 5 and 6,
respectively. The fatty acid constituent of γ-tocotrienol esters obtained from spot no. 5 was
mainly unsaturated fatty acids (C18:1 and C18:2) but contained also palmitic acid (C16:0)
(peak 1, Figure 28a), which confirms the HPLC-MS results. It was confirmed also that the
fatty acid components of spot no. 6 were saturated fatty acids (C16:0, C18:0 and C20:0)
(Figure 28b). It is to be noted that furan fatty acid was not detected from both spot no. 5 and
6, which were isolated from PB235 lipid extract. The fatty acid constituents of the two types
of γ-tocotrienol esters from RRIM600 lipid extract were not different from those observed in
PB235 lipid extract (data not shown).

84
The presence of free γ-tocotrienol (Rt = 19.15 min) was observed only in the
case of spot no. 6. The absence of this component in the saponification products of spot no. 5
could be explained by an artifact (dimerization) that will be discussed in the following
paragraph
At this step, the presence of γ-tocotrienol esters in NR lipids could be
confirmed. The evolution of γ-tocotrienol esters followed by HPTLC during maturation will
be described in Chapter 2.
5.2.3 Effect of saponification on the integrity of the tocotrienols
As mentioned before, no peak of free γ-tocotrienol could be detected in the
composition analysis of spot no.5. There was thus an assumption that the saponification
reaction used for sample preparation prior to GC-MS analysis could alter the structure of
free-tocotrienol. Indeed, it was shown previously (§5.1) that γ- tocotrienol standard can be
altered by maintaining a bottle open for several days, leading to the formation of dimers.
Therefore we could assume that the saponification condition (85 °C, 1.5 h, aeration) could
favor this alteration.
To confirm this assumption, the fraction purified by LC, containing sterol
esters, γ-tocotrienol esters and wax (Figure 23), was submitted to saponification and the
obtained unsaponifiable fraction was spotted on TLC with 2 successive mobile phases in
order to optimize the components separation as shown in Figure 31.
After saponification, besides the expected presence of the free -tocotrienol,
free sterols, and free fatty alcohols, 3 important spots (spot no. 5, 7 and 8 on Figure 31)
corresponding to the Rf of -tocotrienol dimers were also observed. Those three spots were
scrapped off and injected to HPLC-MS for their chemical structural identification. The
obtained mass m/z 819 confirmed the partial dimerization of -tocotrienol structures due to
saponification reaction. Moreover m/z 833 corresponding to heterodimers of -tocotrienol and
α-tocotrienol were also detected (data not shown).
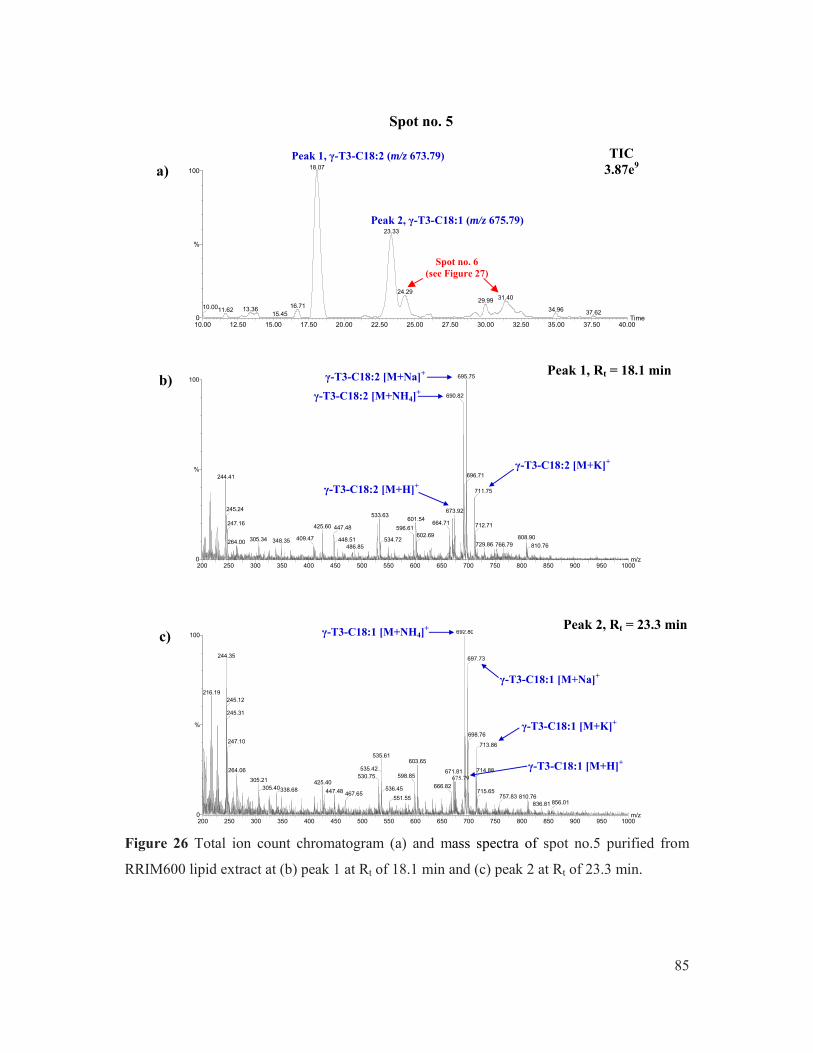
85
10.00 12.50 15.00 17.50 20.00 22.50 25.00 27.50 30.00 32.50 35.00 37.50 40.00Time0
100
%
TIC1.61e9
18.07
16.7113.3611.6210.0015.45
23.33
24.2931.4029.99
34.96 37.62
200 250 300 350 400 450 500 550 600 650 700 750 800 850 900 950 1000m/z0
100
%
2.99e7695.75
690.82
244.41
673.92245.24533.63
425.60247.16
305.34264.00 348.35 409.47
447.48
448.51486.85
601.54
596.61
534.72
664.71
602.69
696.71
711.75
712.71
808.90729.86 766.79 810.76
200 250 300 350 400 450 500 550 600 650 700 750 800 850 900 950 1000m/z0
100
%
1.53e7692.80
244.35
216.19245.12
245.31
247.10
535.61
535.42264.06530.75
305.21 425.40305.40338.68 447.48 467.65
603.65
598.85
536.45
551.55
671.81
666.82
697.73
698.76
713.86
714.88
715.65810.76757.83
836.81 856.01
Figure 26 Total ion count chromatogram (a) and mass spectra of spot no.5 purified from
RRIM600 lipid extract at (b) peak 1 at Rt of 18.1 min and (c) peak 2 at Rt of 23.3 min.
a) TIC
3.87e9
b) Peak 1, Rt = 18.1 min
Peak 1, γ-T3-C18:2 (m/z 673.79)
Spot no. 6 (see Figure 27)
Spot no. 5
c) Peak 2, Rt = 23.3 min
Peak 2, γ-T3-C18:1 (m/z 675.79)
γ-T3-C18:2 [M+Na]+
γ-T3-C18:2 [M+NH4]+
γ-T3-C18:2 [M+H]+
γ-T3-C18:2 [M+K]+
γ-T3-C18:1 [M+NH4]+
γ-T3-C18:1 [M+Na]+
γ-T3-C18:1 [M+K]+
γ-T3-C18:1 [M+H]+
675.79
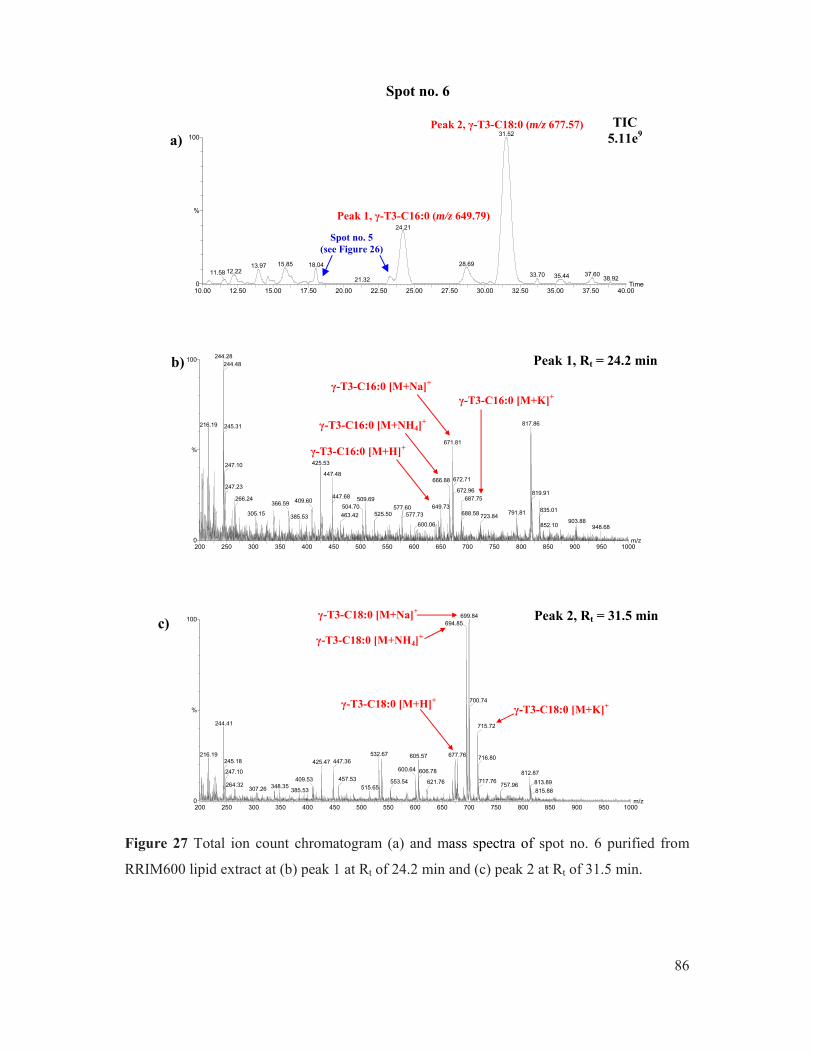
86
10.00 12.50 15.00 17.50 20.00 22.50 25.00 27.50 30.00 32.50 35.00 37.50 40.00Time0
100
%
TIC1.98e9
31.52
24.21
15.8513.9712.2211.58
18.04
21.32
28.69
37.6033.70 35.44 38.92
200 250 300 350 400 450 500 550 600 650 700 750 800 850 900 950 1000m/z0
100
%
1.14e7244.28
216.19
244.48
817.86245.31
671.81
425.53247.10
247.23
266.24 409.60366.59
305.15 385.53
447.48666.88
509.69447.68
504.70
463.42
649.73577.60525.50 577.73
600.06
672.71
672.96687.75
791.81688.58 723.84
819.91
835.01
903.88852.10 948.68
200 250 300 350 400 450 500 550 600 650 700 750 800 850 900 950 1000m/z0
100
%
3.30e7699.84694.85
244.41
216.19 532.67425.47245.18
247.10409.53
264.32 348.35307.26 385.53
447.36
457.53
515.65
677.76605.57
600.64
553.54
606.78
621.76
700.74
715.72
716.80
812.87
717.76757.96 813.89
815.88
Figure 27 Total ion count chromatogram (a) and mass spectra of spot no. 6 purified from
RRIM600 lipid extract at (b) peak 1 at Rt of 24.2 min and (c) peak 2 at Rt of 31.5 min.
b)
a)
c)
TIC 5.11e9
Spot no. 6
Peak 1, Rt = 24.2 min
Peak 2, Rt = 31.5 min
Peak 1, γ-T3-C16:0 (m/z 649.79)
Peak 2, γ-T3-C18:0 (m/z 677.57)
γ-T3-C16:0 [M+H]+
γ-T3-C16:0 [M+NH4]+
γ-T3-C16:0 [M+Na]+
γ-T3-C16:0 [M+K]+
γ-T3-C18:0 [M+H]+
γ-T3-C18:0 [M+NH4]+
γ-T3-C18:0 [M+Na]+
γ-T3-C18:0 [M+K]+
Spot no. 5 (see Figure 26)

87
Figure 28 Total ion count GC-MS chromatogram of (a) saponified and silylated spot no. 5
and (b) silylated spot no. 6 from PB235 lipid extract sample.
Peak 1: C16:0, Peak 2: C18:2, Peak 3; C18:1, Peaks 4: C18:0, Peak 5: C20:0 and Peak 6: γ-
tocotrienol
2.5 5.0 7.5 10.0 12.5 15.0 17.5
-5.0
-2.5
0.0
2.5
(x100,000)
Peak 3 Peak 2
Peak 1
b) Spot no. 6
a) Spot no. 5
Peak 1
Peak 4
Peak 5 Peak 6
Peak 4
5.00 5.05 5.10 5.15 5.20 5.25 5.30 5.35 5.40
0.0
0.5
1.0
1.5
2.0
(x100,000)
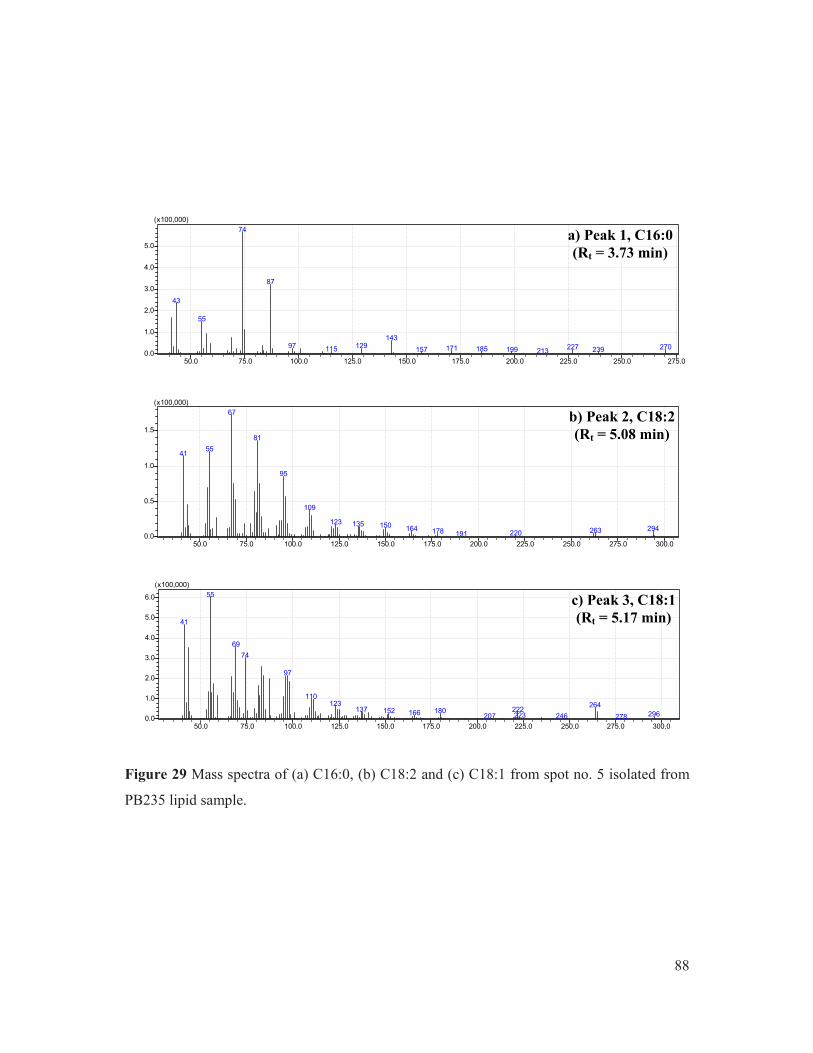
88
50.0 75.0 100.0 125.0 150.0 175.0 200.0 225.0 250.0 275.00.0
1.0
2.0
3.0
4.0
5.0
(x100,000)74
87
43
55
14312997 227 270171115 185 239199157 213
50.0 75.0 100.0 125.0 150.0 175.0 200.0 225.0 250.0 275.0 300.00.0
0.5
1.0
1.5
(x100,000)67
81
5541
95
109
123 135 150 294164 263178 220191
50.0 75.0 100.0 125.0 150.0 175.0 200.0 225.0 250.0 275.0 300.00.0
1.0
2.0
3.0
4.0
5.0
6.0
(x100,000)55
41
69
74
97
110123 264
137 222180152 166 296223207 246 278
Figure 29 Mass spectra of (a) C16:0, (b) C18:2 and (c) C18:1 from spot no. 5 isolated from
PB235 lipid sample.
a) Peak 1, C16:0(Rt = 3.73 min)
c) Peak 3, C18:1(Rt = 5.17 min)
b) Peak 2, C18:2(Rt = 5.08 min)

89
50.0 75.0 100.0 125.0 150.0 175.0 200.0 225.0 250.0 275.00.0
1.0
2.0
3.0
4.0
5.0
(x100,000)74
87
43
55
14312997 227 270171115 185 239199157 213
50.0 75.0 100.0 125.0 150.0 175.0 200.0 225.0 250.0 275.0 300.00.0
2.5
5.0
7.5(x100,000)
74
43
41
1436929897 255129 199157111 185 213 241 269171 227
50 100 150 200 250 300 350 400 4500.0
1.0
2.0
3.0
4.0
5.0
6.0
(x10,000)44
73
223
482
48381 261207107 135 278 309193149
50.0 75.0 100.0 125.0 150.0 175.0 200.0 225.0 250.0 275.0 300.0 325.00.0
1.0
2.0
3.0
4.0
5.0
(x100,000)74
87
43
55
14397 326129 283111 199 227185157 241 295213 255
Figure 30 Mass spectra of (a) C16:0, (b) C18:0, (c) C20:0 and (d) γ-tocotrienol from spot
no. 6 isolated from PB235 lipid sample.
a) Peak 1, C16:0(Rt = 3.73 min)
b) Peak 4, C18:0(Rt = 5.32 min)
c) Peak 5, C20:0(Rt = 7.55 min)
d) Peak 6, γ-tocotrienol (Rt = 19.15 min)

90
Figure 31 TLC of (a) γ-tocotrienol oxidized standard, (b) γ-tocotrienol esters fraction before
saponification and (c) fraction of γ-tocotrienol esters after saponification obtained from liquid
column chromatography of PB235 lipid extract. (2 elution times using mobile phase of
hexane/diethyl ether/acetic acid, 50:50:1 and 90:10:1, v/v/v).
1: Sterols, 2: Free fatty alcohols, 3: Free fatty acids, 4: γ-tocotrienol, 5, 7 and 8: γ-tocotrienol
dimers, 6: Wax, 9: γ-tocotrienol esters and 10: Sterol esters.
Back to Figure 28, it is interesting to observe that this dimerization
phenomena during saponification seemed to be total for spot no. 5, which contained mainly
unsaturated acids in the initial esters of tocotrienols (free γ-tocotrienol not detected at Rt of
19.15 min), while it seemed only partial for spot no. 6 containing mainly saturated fatty acids
(free γ-tocotrienol detected at Rt of 19.15 min but the peak area is low relatively to those of
fatty acids). This difference could be either due to chemical composition of the reaction
media (presence of saturated versus unsaturated fatty acids, with unsaturated fatty acids
favoring the dimerization) or due to limits of detection as the injected quantity for spot no. 5
was lower than that available for spot no. 6.
Therefore, saponification and GC-MS analysis may not be the appropriate
techniques to follow the evolution of total tocotrienols during maturation. Indeed, the
tocotrienols are alterated during saponification, leading to dimers that are not detectable in
our GC-MS conditions.
1 2 3
5
6 7 8 9
10
a) b) c)
7 8
5
9
4
6
1 2 3 4
91
5.3 Conclusion
In our study, it was observed that γ-tocotrienol dimerization could occur during
the storage of γ-tocotrienol standard and during the saponification reaction of lipid extract
samples. Therefore, the quantity of free tocotrienols assessed from unsaponifiable fraction
would most probably be underestimated.
The presence of γ-tocotrienol esters was confirmed in lipid extracts from rubber
issued from maturated coagulum. As esters of tocotrienols are supposed to have a lower
antioxidant activity that their free form (the phenol function being involved in ester bond), it
appears very interesting to follow the evolution of both components (free and esterified
forms) during maturation. This has been done using the HPTLC protocol optimized for the
separation of both group of γ-tocotrienol esters. In Chapter 2, they will be named γ-
tocotrienol ester I (spot no. 6 (Figure 25), containing mainly esters of saturated fatty acids),
and γ-tocotrienol ester II (spot no. 5 (Figure 25), containing mainly esters of unsaturated fatty
acids).

92
CHAPTER 2
Characterization of the structure, properties and biochemical composition
of natural rubber obtained from coagula maturated under uncontrolled
condition and treated using a USS or RSS like processing
As presented in Chapter 1, two maturation experimental conditions were studied. The
first involved natural conditions while the second was performed in a dedicated device
allowing full control of relative humidity, temperature and oxygen content. In the first case,
maturated coagula were laminated with a hand mangle and outdoor or smoke air dried (USS
or RSS like process). In the second case, maturated coagula were creped with a mini-creper
and dried in an oven (125°C, 2 h) (TSR like process). The sample preparation for two
maturation experiments and the environmental conditions set for this device are presented in
Materials and Methods (§3.2, §3.3 and §3.4).
The results from USS/RSS like process will be presented in the present Chapter 2
while those obtained after TSR like process will be exposed in the next Chapter 3. In those
chapters, figure presentation was preferred to table one. Anyway, tables containing numerical
values are provided in Appendices (p. 181).
The indicators that were followed during those experiments can be classified in
3 study levels: bulk properties, mesostructure and biochemical composition. The first study
level, bulk properties of NR, illustrates the global performances of rubber and is generally
described by rheological measurements assessing viscoelasticity and plasticity. Bulk
properties integrate the interactions occurring in the whole product. In this study, the NR
property were determined through standardized methods: initial plasticity (P0), plasticity after
ageing at 140°C for 30 min (P30) and plasticity retention index (PRI). The second level,
mesostructure of NR concerns the macromolecular structure and is assessed by number-
average molar mass (Mn), weight-average molar mass (Mw), molar mass distribution (MMD),
and gel content. For biochemical composition, lipid components which is the main non-
isoprene component remained in dry rubber was specifically studied. Moreover, the
antioxidant activity of lipid extracts was also investigated in vitro along maturation time. This

93
activity was assessed using DPPH test that was developed and reported in Chapter 1. The
purpose would be to see if the antioxidant activity of the lipid extract could be linked with the
thermo-oxidation resistance properties of rubber.
1. Initial pH of latex, and pHs of coagula and serum during maturation
After the tree is tapped, latex composition is susceptible to modifications by
microorganism contamination in the tapping cut or in the collecting cup. Though pH of latex
and coagula are not considered as NR properties, it is involved with the level of
microorganism activity which was reported to degrade physical properties of rubber during
maturation (Salomez et al., 2014). Latex pH at day 0 was recorded, and the evolution of the
pH of sera and coagula was followed regularly during 14 days of maturation just before
lamination (when the coagula were removed from the coagulation boxes).
Figure 32 pH evolutions of (a) RRIM600 and (b) PB235 coagula during 14 days of
maturation under uncontrolled conditions.
The pH evolutions observed from two clones in this study were similar, as shown in
Figure 32. The initial pH of PB235 and RRIM600 fresh latex was at the average value of
6.5+0.1. The pH of PB235 latex decreased to 4.9 and latex coagulated within 24 h after
tapping (Figure 32b) while longer time (between 25-48 h) was needed for RRIM600 latex to
coagulate completely (Figure 32a). Unfortunately, the pH of RRIM600 coagula was not
b) PB235 clone a) RRIM600 clone
pH of coagula pH of serum
Maturation time (days)
pH
Maturation time (days)

94
recorded before day 2. From day 2 to day 7, the pH increased up to a plateau at an
approximate value of 9. Those results are consistent with literature concerning pH of
naturally coagulated latex where a primary acidification followed by a strong alkalization is
described. The acidification is reported to be due to the release of volatile fatty acids (VFA)
such as formic acid, acetic acid and lactic acid produced during carbohydrate fermentation by
microorganism (Mathew and Claramma, 2000). After 1-day maturation, the increase of pH
during maturation time may result from both release of ammonia from the proteins
degradation and organic acid consumption by microorganism during maturation (Intapun et
al., 2010 ; Salomez et al., 2014).
Moreover, the pH of serum that exudated from coagula in the maturation box was also
monitored. For PB235 clone, the pH of serum (6.2) just after latex coagulation was higher
than the pH inside the coagulum (4.5). From 2 days of maturation and both clones, the pH of
sera were lower than the pH of coagula. It could be due to the release of VFA that could
solubilize into serum before evaporation. After 14 days of maturation, the same pH was
observed in both coagula and sera. Those assumptions should be confirmed by biochemical
analysis of serum (VFA, NH3) that were unfortunately not performed during this study.
2. Fresh and dry matter of laminated mini-sheets
The dry matter of fresh sheet was estimated by comparing the weight of fresh
laminated sheets and dry sheets. It can be seen in Figure 33 that whatever the clone, the water
content of laminated sheet increased with maturation time. As shown, this increase is
supported by that of the fresh weight, while the dry weight remained logically constant. As
the weight of the coagula before lamination (unfortunately not recorded) could not increase
over maturation time, this increase of fresh weight of laminated sheet could only be explained
by a lower amount of water removed by the process of lamination. This is most probably due
to a higher resistance of the maturated rubber to the force imposed by the mangle rolls. The
operators confirmed that this process was indeed more difficult with maturated coagula.
A slight difference could be observed between clones: the phenomenon of higher
water retention was indeed more important with the clone RRIM600 (water content of freshly

95
Figure 33 Fresh weight, dry weight and water content of laminated samples obtained from
(a) RRIM600 and (b) PB235 rubber clones during 14 days of maturation.
Dry weight (g) Fresh weight (g) Water content (%)
a) RRIM600 clone
b) PB235 clone
Maturation time (days)
Wat
er c
on
ten
t (%
) W
eig
ht
(g)
Maturation time (days)
Wa
ter
co
nte
nt
(%)
Wei
gh
t (g
)

96
laminated sheet from 15% (day 2) to 30% (day 14)) than with the clone PB235 (water content
of freshly laminated sheet from 15% (day 2) to 20% (day 14)).
3. Evolution of bulk properties of NR from matured coagula under uncontrolled
maturation conditions (USS/RSS like process)
The physical properties during 14 maturation days obtained from RRIM600 and
PB235 samples are shown in Figure 34 and Figure 35. Though smoke drying was selected as
an optimized drying method, it appeared interesting to show also results obtained from
outdoor air drying. No physical data was obtained from 1-day-old RRIM600 sample as latex
was not coagulated.
The values of P0 of rubber from RRIM600 of outdoor air and smoke dried samples
during 9 days maturation ranged from 41.8 to 60.0 and 38.2 to 58.2, respectively. The values
of P0 of maturated samples (day 2 and after) are superior to the non-maturated and acid
coagulated samples (day 0) for both drying conditions (Figure 34). However, P0 values for
14-day maturated samples from outdoor air drying could not be measured (Figure 34a) as the
sample were sticky and melted during preparation of the measurement. The condition of
maturation (aerated box with serum kept inside) and the long duration of outdoor air drying
after lamination (26 days in this case) may have created very degrading conditions. PRI
values of RRIM600 smoke dried samples significantly decreased from 102.2 to 50.9
(51.3 units decreased) with maturation duration. This decrease is due to a decrease of P30
(Figure 34).
It is known that the P0 of rubber made from maturated coagula (eg TSR10) is often
higher than that from non-maturated one (eg TSR5). This is most probably due to the increase
of gel (crosslinking) within the rubber in the first few days of maturation. However the
rubbers issued from maturated coagula are also known to be more sensitive to thermo-
oxidation. This could explain why 14 days outdoor air dried samples – the most maturated
ones – melt when submitted to 100 °C conditions of P0 measurement most probably due to
high chain scissions. This lower resistance to thermo-oxidation is illustrated by the decrease
of P30 which leads to a concomitant decrease of PRI.
97
Concerning outdoor air dried samples from PB235 clone, P0 values decrease from
51.3 (day 0) to 20.3 (day 7). P30 measurements were impossible on rubber samples made
from coagula maturated for 7 days or later, while last possible P0 measurement was done on
day 7 (Figure 35a). Meanwhile P0 of smoke dried sample was constant from 49.3 to 55.7
(Figure 35b) and all measurements could be performed until day 14. PRI of smoke dried
samples ranged from 84.8 of day 0 to 32.5 of day14 as shown in Figure 35. For outdoor air
dried samples, PRI was in a range of 84.9 (day 1) to 73.0 (day 3) but after day 3 the sample
was completely degraded and PRI could not be measured.
The bulk properties evolution of rubber sample from PB235 showed a similar
evolution as that from RRIM600 concerning P0 and PRI. What differentiated both clones in
terms of bulk properties were the initial values of P0 and their evolution along maturation
time. Indeed for PB235 clone, P0 was around 10 points higher at day 0 (P0 = 50) and did not
change significantly during maturation while P0 from RRIM600 samples started at around 40
and tended to increase along maturation. This is due to the difference of native molar mass
distribution (MMD0) between the two clones. Indeed, PB235 rubber is a unimodal clone the
rubber of which contains much less short chains than that of RRIM600 clone. Higher molar
masses in PB235 clone rubber explains the higher initial value of P0, while the presence of
short chains in RRIM600 clone rubber explained the apparent crosslinking phenomenon as
described by Ehabe et al. (2002). Moreover, our results confirm that outdoor air drying of
sheet made from maturated coagula provided rubbers very sensitive to thermal-oxidation and
high variable results in terms of bulk properties. It is most probably due to the fact that the
samples kept maturating under uncontrolled conditions after lamination. Indeed the drying
times were longer when the sheets were dried outdoor (around 10 days) than when they were
smoke dried (5-7 days).
This higher sensitivity of rubber to thermal oxidation increased in all cases during
maturation. It could be due to the decomposition of antioxidants naturally present in NR
(Hasma and Othman, 1990) and/or the apparition of pro-oxidant molecules such as free
metallic ions released by microorganism activity (Hasma and Othman, 1990 ; Tuampoemsab
and Sakdapipanich, 2007).

98
Figure 34 Evolution of physical properties of RRIM600 rubbers obtained from (a) outdoor
air drying and (b) smoke drying during 14 days of maturation.
a)
b)
a
c
aba
a
a
c
ab
a
b
b
a
c bc
a
b
c
b
ab ab
a
bc
bc
ca b b a
c abc
bc ab abc
Maturation time (days)
P0 (
Un
it)
P3
0 (U
nit
) P
RI
(%)
Maturation time (days)
P0 (
Un
it)
P3
0 (U
nit
) P
RI (
%)

99
Figure 35 The evolution of physical properties of PB235 rubbers obtained from (a) outdoor
air drying and (b) smoke drying during 14 days of maturation.
a)
b)
b
a
b b
a a
b b
b
a a a
b
c
a a a a
b b
c
b a ab
bc a a ab
c
d
ab ab a ab
Maturation time (days)
P0 (
Un
it)
P3
0 (
Un
it)
PR
I (%
)
Maturation time (days)
P0 (
Un
it)
P3
0 (U
nit
) P
RI
(%)
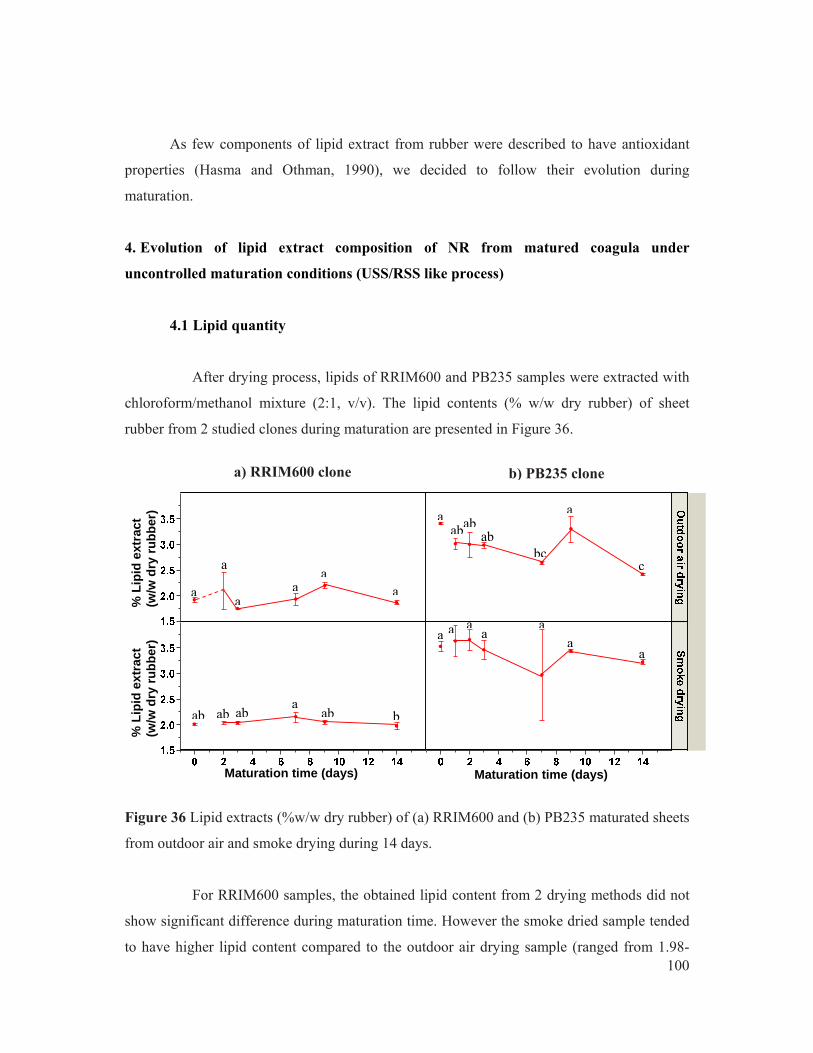
100
As few components of lipid extract from rubber were described to have antioxidant
properties (Hasma and Othman, 1990), we decided to follow their evolution during
maturation.
4. Evolution of lipid extract composition of NR from matured coagula under
uncontrolled maturation conditions (USS/RSS like process)
4.1 Lipid quantity
After drying process, lipids of RRIM600 and PB235 samples were extracted with
chloroform/methanol mixture (2:1, v/v). The lipid contents (% w/w dry rubber) of sheet
rubber from 2 studied clones during maturation are presented in Figure 36.
Figure 36 Lipid extracts (%w/w dry rubber) of (a) RRIM600 and (b) PB235 maturated sheets
from outdoor air and smoke drying during 14 days.
For RRIM600 samples, the obtained lipid content from 2 drying methods did not
show significant difference during maturation time. However the smoke dried sample tended
to have higher lipid content compared to the outdoor air drying sample (ranged from 1.98-
ab ab ab ba
aa
aa
aa a
ab
a
a
aa
aa
ab ab
a ab
bc
a
c
Maturation time (days)
% L
ipid
ext
ract
(w
/w d
ry r
ub
ber
)
Maturation time (days)
% L
ipid
ext
ract
(w
/w d
ry r
ub
ber
)
a) RRIM600 clone b) PB235 clone

101
2.15% and 1.84-2.10%, respectively). This confirmed already published results by
Rodphukdeekul et al. (2008). The lower lipid content of outdoor air dried sample may be due
to lipids degradation caused by microorganism activity, that is inhibited earlier in the case of
smoke drying. Indeed, as the drying duration from outdoor air drying was longer than that of
smoke drying, the higher water content that remained in the sheet allowed microbial growth.
In addition, due to the higher temperature (60°C) used in smoked sheet drying most of
microorganism activity was ended sooner than in outdoor air drying.
This difference was also observed in samples obtained from PB235 clone.
Moreover, the lipid content from this clone decreased during maturation from 3.41% to
2.42% for outdoor air dried mini-sheets.
Those lipid extract quantities were used further to express all the composition
results that will be presented in the following paragraphs versus dry rubber.
4.2 Qualitative analysis of lipid evolution during maturation
Lipid extract of PB235 and RRIM600 clones were analyzed for their global
components using TLC. Lipid samples were applied on TLC plates with the suitable mobile
phase composed of hexane/diethyl ether/acetic acid (80:20:1, v/v/v).
Figure 37 shows TLC plates of lipids extracts from mini-USS (or mini-RSS)
during 14 days of maturation. The common observed spots from both clones were identified
as sterols, free fatty acids (FFA), γ-tocotrienol, and esterified lipids such as triacylglycerol of
furan fatty acid (TGF), sterol esters (SE), wax and γ-tocotrienol esters (I and II, see Chapter 1
§5.2).
Similar evolutions of lipid components from both drying methods during
maturation of the two studied clones were observed and will be described below. However,
lipid composition seemed to evolve faster under outdoor air drying than under smoke drying
conditions. It is reminded that same lipid extract quantity was deposited for each track

102
(50 µg) without taking into account the lipid quantity extracted from rubber. Therefore
comparison between tracks should be done with caution.
For RRIM600 clone, it can be visually observed that the relative proportions of
FFA, γ-tocotrienol and SE decreased while γ-tocotrienol esters and free sterols increased with
maturation time. Therefore both esterification (γ-tocotrienol esters) and hydrolysis (sterol
esters) seem to occur concomitantly depending of the acyl acceptor. In outdoor drying
condition, the FFA proportion seems to be low after 14 days maturation, which could indicate
that esterification was more important or that FFA were degraded chemically (oxidation) or
biochemically (microbial catabolism). Wax and TGF spots were not obviously seen from
outdoor air dried samples but in the case of smoke dried sample, TGF disappeared after
2 days of maturation.
Same observation can be done for lipid extracts from PB235 clone (Figure 37b).
Hydrolysis of trifuranoyl glycerol (TGF) seemed faster in outdoor air drying conditions,
confirming that biochemical processes continue when the sheets are hung. For smoke dried
samples, only TGF and SE spots decreased during maturation. The other components (sterols,
FFA, γ-tocotrienol and its esters) seemed not to change with maturation time.
In order to get quantitative data, it was decided to perform HPTLC analysis using
the same samples.

103
Figure 37 TLC of total lipid extracts from (a) RRIM600 and (b) PB235 maturated rubbers
during 14 days of maturation, developed in hexane/diethyl ether/acetic acid (80:20:1, v/v/v)
and detected by 40% orthophosphoric acid and aqueous solution saturated with copper
acetate (1:1, v/v).
1: Sterols, 2: Free fatty acids, 3: γ-tocotrienol, 4: Triacylglycerol of furan fatty acid, 5: Wax,
6: γ-tocotrienol esters (I and II) and 7: Sterol esters.
0 2 3 7 9 14
Outdoor air drying
Maturation days 0 2 3 7 9 14
Smoke drying
Maturation days
2
1
4
3
5
67
a) Lipid extracts from RRIM600 clone
b) Lipid extracts from PB235 clone
Outdoor air drying Smoke drying
Maturation days 0 1 2 3 7 9 14 0 1 2 3 7 9 14
Maturation days
1
4
3
5
7
2
6

104
4.3 Quantitative analysis of lipid evolution during maturation
4.3.1 Neutral lipid composition
Lipid extracts from RRIM600 and PB235 maturated rubber were analyzed
for the quantity of each lipid component using HPTLC. Lipid components were identified
and quantified using the Rf and calibrations of different standards, respectively. Each extract
was deposited on two HPTLC plates and run with two appropriate mobile phases as
mentioned in Chapter 1.
4.3.1.1 Free fatty acids and TGs
For RRIM600 clone, FFA content of the lipid extract stayed around
the value of 1% versus dry rubber whatever the maturation time and the drying condition
(Figure 38). As reported before by Liengprayoon et al. (2013), these FFA originated from
polar lipids (glycolipids and phospholipids) hydrolysis that occurred after coagulation of
latex, which originally contains very low amounts of FFA. It is noted that the decrease of
FFA with maturation time which was visually observed previously (Figure 37), was not
confirmed in HPTLC analysis for RRIM600 lipid extracts.
For PB235 clone, the level of FFA after coagulation was the same
than the one measured with RRIM600 (around 1% vs dry rubber) (Figure 38). Under smoke
drying condition, FFA kept increasing significantly (from 1% to more than 2%) in the first
7 days. Under outdoor air drying the same increase was observed but seemed to occur faster
(within 2 days). Those results confirmed the previous observations on TLC: hydrolysis
reaction continued during the sheet hanging. For example, maximum FFA was reached in
samples obtained from 2 days maturation in the box followed by 11 days outdoor air drying
(13 days in total), while with smoke drying, the maximum was reached when maturation in
the box lasted 7 days followed by 7 days of smoke drying (14 days in total). The TGF
content, which evolved contrarily to that of FFA, showed that they were the main provider of
FFA for this “second increase” of FFA. After this “second increase”, FFA quantity decreased
as observed previously. It could be due to disappearance (chemical (oxidation) or biological

105
catabolic degradation) or esterification with alcohol presents in the latex (sterols, tocotrienols,
etc.). Therefore the evolution of these alcohols in their free and esterified forms follows.
4.3.1.2 γ-tocotrienol and its esters
For RRIM600 samples, γ-tocotrienol showed a tendency to decrease
with maturation time whatever the drying condition, while its ester form tended to increase
(Figure 39). Though it has to be confirmed considering the variance of the measured quantity,
this evolution shows that the decrease of tocotrienols during maturation could not be
exclusively associated with a degradation of the molecules (oxidation for example) but to an
esterification with fatty acids, mostly saturated (see Chapter 1, §5.2).
For PB235 samples, the free form of γ-tocotrienol was difficult to
detect under outdoor air drying condition (Figure 39). Nevertheless, the apparition of γ-
tocotrienol ester I was observed. Gamma-tocotrienol ester II was detected in much lower
quantity than in RRIM600 lipid extract. It can be explained by the fact that γ-tocotrienol ester
II contains mainly C18:2 fatty acid, that are present in much lower quantity in PB235 latex
(mainly containing furan fatty acid that was not detected in any of γ-tocotrienol ester
species).
4.3.1.3 Sterols and their esters
For RRIM600 clone, the quantities of free forms of sterols increased
with maturation time especially under outdoor air drying condition (0.08% at day1-3 to 0.5%)
(Figure 40). It seemed partly compensated by a decrease of sterol ester quantities. However,
such decrease is not sufficient to explain quantitatively the increase of free form, which
means that other sources of free sterols must have been mobilized. The sources could be
either indigenous sources such as esterified steryl glucosides (ESG) or steryl glucoside (SG)
that are known to be in the lipid extract of rubber, or exogenous, synthesized by
microorganism anabolism.
106
Same observation could be made for PB235 clone (Figure 40). In
outdoor air dried samples, the quantities of free sterol increased from 0.05% at day 2 to
0.63% at day 7. As for RRIM600, the decrease of ester form is not sufficient to justify the
quantitative increase of free form. Under smoke drying condition, evolutions of free and
esterified forms are less important and seemed to compensate each other, which could mean
that no other sources of sterols are mobilized.
Though the variance of the data was important and the quantitative
calculation approximate (only one sterol used as standard), the obtained value remains
consistent with published ones concerning total sterols which is reported to be in the range of
0.6% to 0.7% (w/w dry rubber) for same type of sample (Liengprayoon et al., 2013).
Figure 41 shows the evolution of FFA and total esterified compounds
(TGF, γ-tocotrienol esters and SE) during maturation. During the initial maturation period,
hydrolysis reaction seemed to dominate (increase of FFA and decrease of total esterified
compounds) while after 9 days of maturation esterification seemed to overcome hydrolysis
(slight decrease of FFA and increase of esterified compounds).
However, considering the difficulty to get data with variance level
that allowed statistical treatment it was decided to perform maturation under strictly
controlled condition in order to confirm or not the results obtained during this experiment.
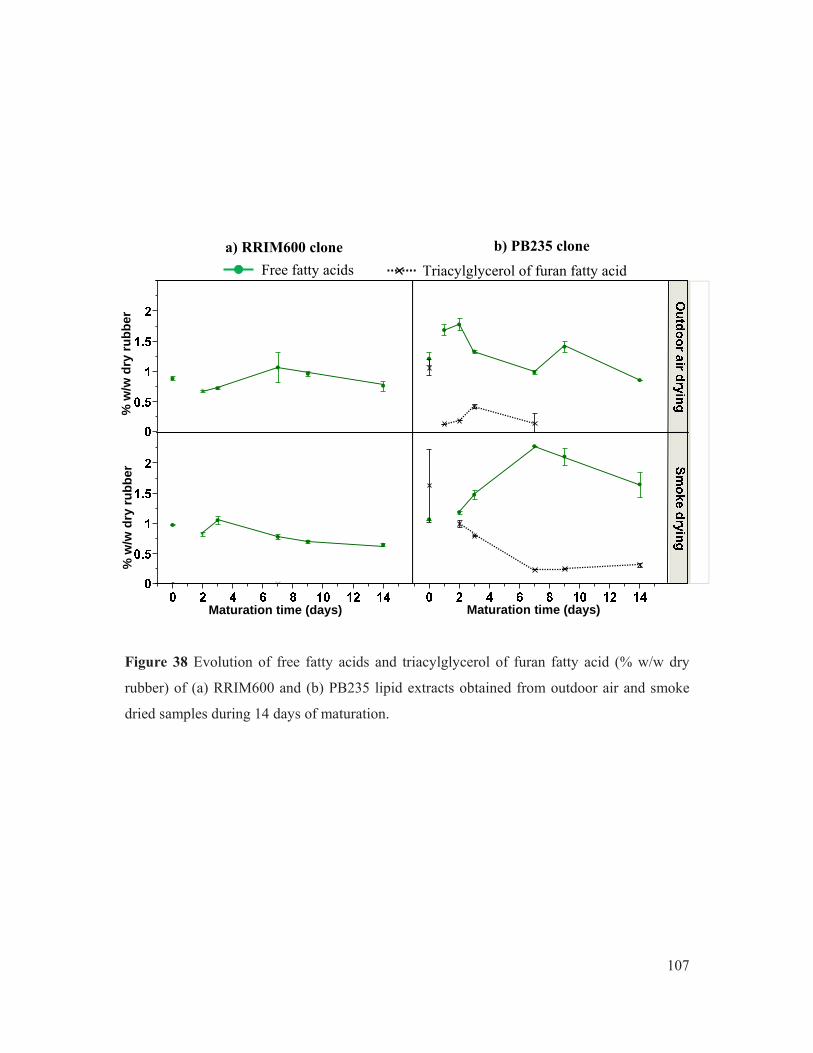
107
Figure 38 Evolution of free fatty acids and triacylglycerol of furan fatty acid (% w/w dry
rubber) of (a) RRIM600 and (b) PB235 lipid extracts obtained from outdoor air and smoke
dried samples during 14 days of maturation.
b) PB235 clone a) RRIM600 clone
Maturation time (days) Maturation time (days)
% w
/w d
ry r
ub
ber
%
w/w
dry
ru
bb
er
Triacylglycerol of furan fatty acid Free fatty acids

108
0.0
0.1
0.2
0.3
0.4
0.0
0.1
0.2
0.3
0.4
0 2 4 6 8 10 12 14 0 2 4 6 8 10 12 14
Figure 39 Evolution of γ-tocotrienol and its esters (% w/w dry rubber) of (a) RRIM600 and
(b) PB235 lipid extracts obtained from outdoor air and smoke dried samples during 14 days
of maturation.
b) PB235 clone a) RRIM600 clone
γ-tocotrienol γ-tocotrienol ester I γ-tocotrienol ester II
Maturation time (days) Maturation time (days)
% w
/w d
ry r
ub
ber
%
w/w
dry
ru
bb
er

109
Figure 40 Evolution of sterols and sterol esters (% w/w dry rubber) of (a) RRIM600 and (b)
PB235 lipid extracts obtained from outdoor air and smoke dried samples during 14 days of
maturation.
b) PB235 clone a) RRIM600 clone
Sterols Sterol esters
Maturation time (days) Maturation time (days)
% w
/w d
ry r
ub
ber
%
w/w
dry
ru
bb
er

110
Figure 41 Evolution of the neutral lipid composition evolution (% w/w dry rubber) of (a)
RRIM600 and (b) PB235 lipid extracts obtained from outdoor air and smoke dried samples
during 14 days of maturation.
γ-tocotrienol γ-tocotrienol ester I γ-tocotrienol ester II
Maturation time (days) Maturation time (days)
% w
/w d
ry r
ub
ber
%
w/w
dry
ru
bb
er
a) RRIM600 clone b) PB235 clone
Free fatty acids
Sterols Sterol esters
Triacylglycerol of furan fatty acid
Sm
oke d
rying
O
utd
oo
r air dryin
g

111
4.3.2 Total fatty acid composition
Lipid extract from RRIM600 and PB235 rubber samples obtained from
2 drying methods were analyzed for their total fatty acid composition using gas
chromatography (GC-FID) as described in Materials and Methods. The identified fatty acids
were palmitic acid (C16:0), palmitoleic acid (C16:1), stearic acid (C18:0), oleic acid (C18:1),
linoleic acid (C18:2), linolenic acid (C18:3), furan fatty acid and arachidic acid (C20:0). The
result would be presented in two ways: as a relative FA composition (versus the TFA weight)
and the absolute TFA quantity (versus dry rubber weight). The absolute quantities were
calculated taking into account determined concentrations in transesterified lipid,
transesterification yields and lipid extracts. Results obtained from RRIM600 and PB235
samples are presented in Figure 42 and Figure 43, respectively. Major fatty acids was linoleic
acid (18:2) and furan fatty acid for RRIM600 and PB235 clone lipid extract, respectively.
For RRIM600 clone, the relative content in the 2 main saturated fatty acids
palmitic acid and stearic acid increased during 14 days of maturation whatever the drying
condition (Figure 42, left). Concomitantly, there was an important decrease of linoleic fatty
acid (C18:2) relative proportion (45.1% (day 0) to 5.1% (day14) under outdoor air drying and
45.7% (day 0) to 13.1% (day 14)). Linolenic acid (C18:3; 4.1% at day 0) could be not
detected after 3 days of maturation (Figure 42a and Figure 42b). Observation of the absolute
calculated quantities shows that the relative enrichment of TFA composition in saturated
species is in fact mainly due to the fastest disappearance of the unsaturated ones. Moreover it
is observed that the total fatty acid content decreased sharply during maturation followed by
outdoor drying (from 0.65% (day 0) to 0.25% (day 14)). This decrease occurs at a lesser
extent when mini-sheet were dried under smoke drying ((from 0.71% (day 0) to 0.40% (day
14)). Most probably the fatty acids were submitted to oxidative conditions and it is well
known that unsaturated fatty acid are much more sensitive to oxidation that the saturated one,
which can explain the observed difference in the kinetic of disappearance (Sousa et al.,
2010).
For PB235, the same tendencies were observed (Figure 43). The TFA
composition from this clone distinguished itself by the presence of a high amount of furan

112
fatty acids and a lower initial amount of C18:2. Alike C18:2 in RRIM600 lipids, this fatty
acid quantity decreased faster with maturation time than that of saturated ones (from 1.68%
(day 0) to 0.1% (day 7) under outdoor air drying). As for RRIM600 clone, the decrease of
TFA quantities during maturation occurred at a lesser extent when the sheets were smoked
dried instead of outdoor air dried. This confirmed that the oxidative degradation of molecules
keeps going while the sheets are hung. Indeed outdoor air drying was much longer than
smoke drying, therefore it provides more “wet” time for the degradation to occur and result in
a final quantity of TFA. The difference between the two drying methods in terms of TFA
quantities is higher with maturation time. This could be explained by the fact that the
laminated sheet obtained from coagula that have been maturated very shortly (0 or 1 day) still
contained enough native antioxidant to protect the unsaturation of the acyl chains from
oxidation during drying time.
4.3.3 Unsaponifiable composition
Lipid extract from RRIM600 and PB235 rubber samples obtained from
2 drying methods were analyzed for their total unsaponifiable composition using Gas
Chromatography equipped with a Mass Spectrometer (GC-MS) as described in Materials and
Methods. The identified components were octadecanol, eicosanol, γ-tocotrienol, α-
tocotrienol, stigmasterol, β-sitosterol and ∆5-avenasterol. As for TFA, the results would be
presented in 2 ways: (i) the relative unsaponifiable composition (versus the total weight of
unsaponifiable identified components) and (ii) the absolute quantity of each unsaponifiable
component (versus dry rubber weight). The absolute quantities were calculated taking into
account determined concentrations in transesterified and silylated lipids, transesterification
yields and lipid extracts. Results obtained from RRIM600 and PB235 samples are presented
in Figure 44 and Figure 45, respectively.
As it was described before Liengprayoon et al. (2013) it is confirmed that
unsaponifiable fraction of lipid extracted from rubber (RRIM600 and PB235) is mainly made
of phytosterols, β-sitosterol constituting the major one (40-60% of unsaponifiable). In this
experiment the RRIM600 lipid extracts seemed richer in sterols than that of PB235.

113
Figure 42 Total fatty acid composition of RRIM600 lipid extracts lipid extracts obtained
from (a) outdoor air drying and (b) smoke dried samples during 14 days of maturation.
a) Outdoor air drying
b) Smoke drying
Maturation time (days) Maturation time (days)
Maturation time (days) Maturation time (days)
% T
ota
l fat
ty a
cid
s (w
/w d
ry r
ub
be
r)
%re
lati
ve
% T
ota
l fa
tty
aci
ds
(w/w
dry
ru
bb
er)
%re
lati
ve

114
Figure 43 Total fatty acid composition of PB235 lipid extracts obtained from (a) outdoor air
drying and (b) smoke dried samples during 14 days of maturation.
a) Outdoor air drying
b) Smoke drying
Maturation time (days) Maturation time (days)
% T
ota
l fat
ty a
cid
s (w
/w d
ry r
ub
ber
) Maturation time (days) Maturation time (days)
% T
ota
l fat
ty a
cid
s (w
/w d
ry r
ub
ber
)
% r
ela
tiv
e
% r
ela
tiv
e
115
It is reminded that samples were saponified, therefore the unsaponifiable
components (unsoluble alcohol) could either be free before transesterification or be esterified
to a fatty acid. It is also reminded that saponification may lead to alteration of tocotrienol.
Moreover, concerning γ-tocotrienol, it is reminded that some of them may have been
involved in a dimerization reaction results and it was proved that dimers of γ-tocotrienol are
not detected in this GC-MS analysis. Therefore the result concerning total tocotrienols could
be underestimated (see Chapter 1, §5.2.2).
For RRIM600 lipids, the composition and absolute quantities seemed not to
change significantly with maturation time whatever the drying conditions. Indeed the
standard deviation of the total absolute quantities (shown as an error bars on Figure 44) are
quite important. However some differences are observed between the two drying conditions:
(i) the measured quantities seemed lower with outdoor air drying method (around 0.4% vs
NR) than in lipid obtained from smoked dried rubber (around 0.7%); (ii) the tocotrienols
(α- and γ-form) content in lipids from smoked dried rubber was higher (around 0.1% w/w dry
rubber (smoked dried) versus 0.03% w/w dry rubber (outdoor air drying)). Moreover, no α-
tocotrienol was detected from outdoor air dried rubber. Unfortunately, some methodological
difficulties (incomplete silylation) were encountered with the samples from RRIM600 lipid
from outdoor air-dried samples which may explain partially or not the observed difference
between drying methods.
For PB235 lipids extracted from outdoor air dried rubber, the unsaponifiable
quantity seemed to decrease with maturation time (0.79% (day 0) and 0.25% (day 14)) with a
disappearance of α-tocotrienol after 9 days of maturation. This decrease was not observed
when the rubber was smoked dried. Same methodological difficulties and high variability of
data prevent from further interpretations. Instead, it was decided to perform the maturation
sample under strictly controlled conditions in the hope of getting less variable results.

116
Figure 44 Unsaponifiable composition of RRIM600 lipid extracts obtained from (a) outdoor
air drying and (b) smoke dried samples during 14 days of maturation.
b) Smoke drying
a) Outdoor air drying
% u
ns
apo
nif
iab
le c
om
po
sit
ion
(
w/w
dry
ru
bb
er)
Maturation time (days) Maturation time (days)
% r
ela
tiv
e
Maturation time (days) Maturation time (days)
% r
ela
tiv
e
% u
ns
apo
nif
iab
le c
om
po
siti
on
(
w/w
dry
ru
bb
er)
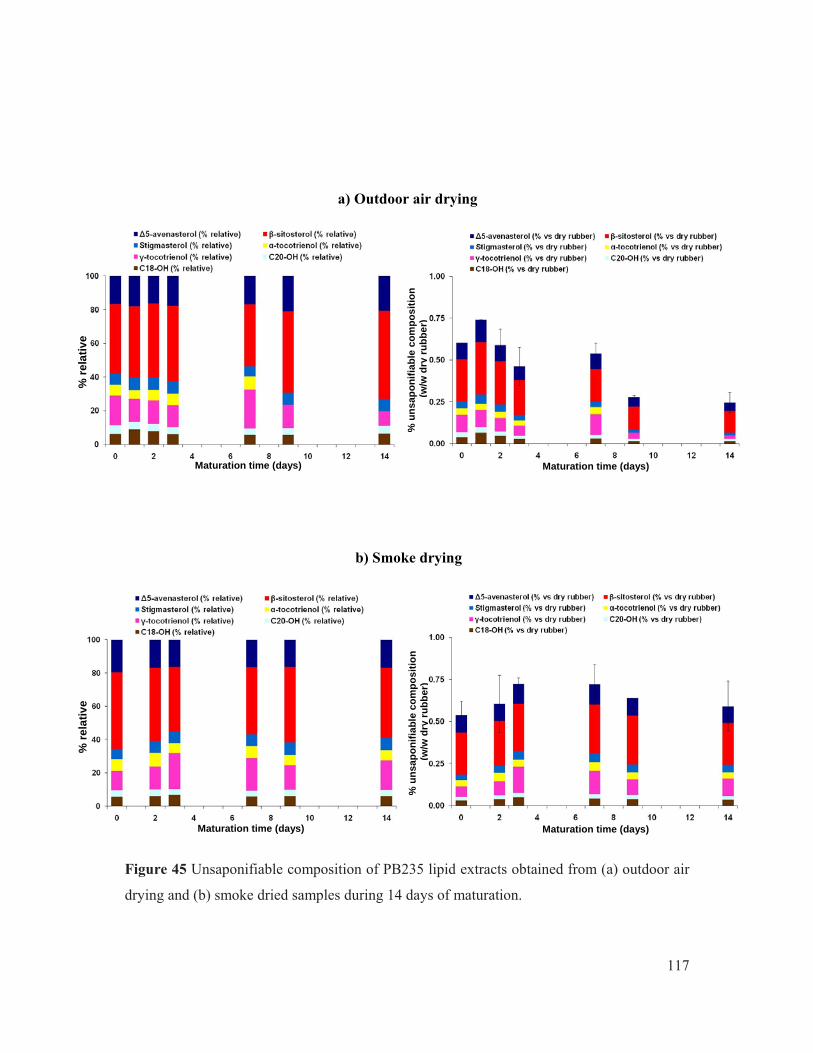
117
Figure 45 Unsaponifiable composition of PB235 lipid extracts obtained from (a) outdoor air
drying and (b) smoke dried samples during 14 days of maturation.
b) Smoke drying
a) Outdoor air drying
% r
ela
tiv
e
% u
ns
ap
on
ifia
ble
co
mp
os
itio
n
(w
/w d
ry r
ub
be
r)
Maturation time (days) Maturation time (days)
% u
ns
apo
nif
iab
le c
om
po
sit
ion
(
w/w
dry
ru
bb
er)
Maturation time (days) Maturation time (days)
% r
ela
tiv
e

118
5. In vitro antioxidant activity test of NR lipid extract by 2,2-di-phenyl-1-picrylhydrazyl
(DPPH) method
5.1 Antioxidant activity of lipid extracts from rubber obtained from maturated
coagula
The DPPH assay using a microplate reader spectrophotometer was developed and
validated as detailed in Chapter 1 (§4.2). A set of γ-tocotrienol standards with the
concentration ranging from 0, 10, 20 and 50 µg.mL-1 were used in parallel for comparison
purpose.
Lipid extracts from RRIM600 and PB235 maturated samples obtained from
outdoor air and smoke drying at the concentration of 1 mg.mL-1 were tested for their
antioxidant activity using the developed method. The result showed that every lipid sample
exhibited antioxidant power by lowering the absorbance of DPPH as shown in Figure 46 for
RRIM600 lipid samples and Figure 47 for PB235 lipid samples, respectively.
As the interpretation of the graphs is delicate, it was decided to focus on two
numerical indicators that are (i) initial slope (0-3 min) of the %DPPHrem = f(time) curve and
(ii) value of %DPPHrem at 60 min. During the preliminary experiments described in
Chapter 1, it was observed that the absolute values of these two indicators seemed to be
inversely correlated. Unfortunately at this stage, not enough data was available to conduct
any correlation study and it was subsequently decided to measure both indicators for all
tested samples. After 693 measurements (3 measurement replication of 160 samples and
71 tocotrienols standards), the two indicators were plotted versus each other and the
correlation was found to be very significant (Figure 48).
The slope value providing the same information as the %DPPH remaining after
60 min, using a single indicator is therefore sufficient. For practical reason, the initial slope is
the one to be chosen as its measurement can be done in 3 min instead of 1 h. Consequently,
only initial slope will be reported in this chapter.

119
Figure 46 %DPPHrem of RRIM600 lipid extracts obtained from (a) outdoor air drying and (b)
smoke drying compared with γ-tocotrienol at 0, 10, 20 and 50 µg.mL-1 concentrations (3
replications) from 0 to 60 min of measurement.
b) Smoke drying
a) Outdoor air drying
Control γ-tocotrienol (10 µg.mL-1) γ-tocotrienol (20 µg.mL-1)
γ-tocotrienol (50 µg.mL-1) Day 2 Day 3 Day 0
Day 14 Day 7 Day 9
% D
PP
Hre
m
% D
PP
Hre
m
Time (min)
Time (min)
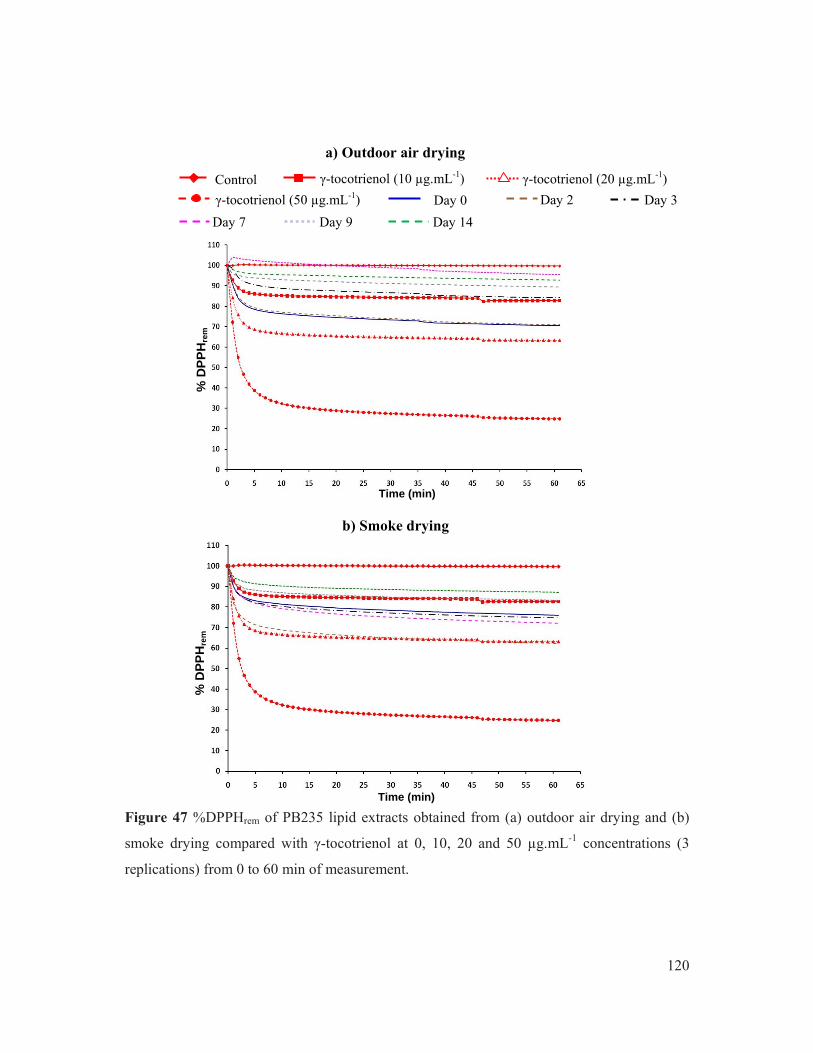
120
Figure 47 %DPPHrem of PB235 lipid extracts obtained from (a) outdoor air drying and (b)
smoke drying compared with γ-tocotrienol at 0, 10, 20 and 50 µg.mL-1 concentrations (3
replications) from 0 to 60 min of measurement.
b) Smoke drying
a) Outdoor air drying
% D
PP
Hre
m
Time (min)
% D
PP
Hre
m
Time (min)
Control γ-tocotrienol (10 µg.mL-1) γ-tocotrienol (20 µg.mL-1)
γ-tocotrienol (50 µg.mL-1) Day 2 Day 3 Day 0
Day 14 Day 7 Day 9

121
Figure 48 Correlation between absolute initial slope value and %DPPHrem60 obtained from
lipid extracts of RRIM600 and PB235 rubber clones and tocotrienols standards.
Based on this finding, Figure 49 that shows the absolute value of the slope plotted
against time summarized the same information as that contained in Figure 46a and Figure
46b, Figure 47a and Figure 47b. The obtained results are compared with three reference slope
absolute values obtained from standard solutions of γ-tocotrienol. Moreover, the green
numbers indicate the quantity of native γ-tocotrienol present in the tested lipid extracts as
determined by HPTLC analysis.
Antioxidant activity estimated with initial slope indicator was detected for every
lipid extracts whatever the clone, the maturation time and drying condition. It means that all
obtained lipid extract contain component(s) that can scavenge the DPPH free stable radical.
The absolute value of the slope allows the estimation of the effect of the tested parameters
(clones, the maturation times and drying conditions) on antioxidant activity.
The antioxidant activity of lipid extracts from RRIM600 rubber obtained from
smoke drying was comparable with that of γ-tocotrienol at the concentration of 20 µg.mL-1
whatever the maturation time. When the RRIM600 sheets were dried outdoor, the antioxidant
activity of the lipid extracts evolved between 20 and 50 µg.mL-1 γ-tocotrienol equivalents. In
y = -0.2089x + 20.481 r2 = 0.9727

122
Ou
tdo
or air d
rying
Sm
oke d
rying
that case this indicator seemed to increase for the first 4-6 days of maturation and decreased
from day 7 to day 14.
Figure 49 Absolute values of initial slope obtained from (a) RRIM600 and (b) PB235 lipid
samples during 14 days of maturation from outdoor air drying and smoke drying. The
numbers in green are the free γ-tocotrienol content in the lipid solution (µg.mL-1) calculated
from HPTLC results. N/D: not detected.
The first observation to be made concerning PB235 lipid antioxidant activity is
that its level was lower than that of the extracts from RRIM 600 whatever the maturation time
or the drying condition. Its level was comparable with that of γ-tocotrienol standard at a
concentration of 10 µg.mL-1. Under outdoor air drying, the decrease of antioxidant activity is
less marked than that observed with RRIM600 clone. This decrease was also observed when
the sheets were smoke dried, but at a lesser extent.
17.0
19.1
14.5 10.1 N/D
N/D
62.5
N/D N/D N/D N/D
N/D N/D
N/D
57.1
62.9 31.1
14.3
N/D
44.8
9.80 19.6 41.9
19.5
15.2
Reference level of γ-tocorienol standard 10 µg.mL-1
50 µg.mL-1
20 µg.mL-1
10 µg.mL-1
50 µg.mL-1
20 µg.mL-1
Maturation time (days)
Ab
solu
te v
alu
e o
f in
itia
l sl
op
e
Maturation time (days)
Ab
solu
te v
alu
e o
f in
itia
l sl
op
e
b) PB235 clone a) RRIM600 clone
γ-tocorienol standard 50 µg.mL-1 γ-tocorienol standard 10 µg.mL-1
γ-tocorienol standard 20 µg.mL-1 Lipid extracts (1 mg.mL-1)
50 µg.mL-1
20 µg.mL-1
10 µg.mL-1
50 µg.mL-1
20 µg.mL-1
10 µg.mL-1

123
As free γ-tocotrienol is often described as a main native antioxidant of Hevea
rubber and as this molecule was used as a reference standard in this assay, its content
measured by HPTLC in lipid extract (w/w) was added to Figure 49. No clear link between its
content and antioxidant activity was observed which suggested that this component does not
drive alone the antioxidant activity of the lipid extract. Anyway when the antioxidant activity
was low (less than 10 µg.mL-1 tocotrienol equivalent) no γ-tocotrienol was detected by
HPTLC.
In conclusion, it was observed that NR lipids obtained from 2 clones showed an
antioxidant activity. During maturation time, the antioxidant activity decreased with
maturation time however a clear evolution with time was not obtained. This could be caused
from the variation of the lipid components classes containing as observed from the
quantitative analysis by HPTLC.
5.2 Antioxidant activity of purified γ-tocotrienol derivatives
Two of γ-tocotrienol derivatives were identified in Chapter 1: γ-tocotrienol esters
that are formed during maturation and tocotrienol dimers that are appeared when the free
forms are exposed oxidizing conditions (for example during saponification reaction). It was
decided to assess the antioxidant activity of these two kinds of derivatives and to compare it
with the free form of γ-tocotrienol.
These comparative studies were conducted using the same DPPH test and are
presented in Table 19.
No antioxidant activity was observed for γ-tocotrienol esters (I and II) under
tested conditions (no slope could be measured). This could be explained by the fact that
antioxidant activities of free tocotrienols are attributed to the phenolic hydrogen donation to
the free radicals. In the case of esterification, this phenolic hydrogen was transferred to water.
The ester bond prevents any free radical scavenging activity which could logically not be
detected anymore. This means that this antioxidant “power” has been “silenced” by

124
Dimer I
Dimer II
Dimer III
Ester I Ester II
esterification but is potentially releasable by hydrolysis. If confirmed, this could lead to have
to value added applications.
Concerning dimers, though they were not detected in lipid extract from rubber, the
test was conducted to correlate their antioxidant activities with the chemical structures
identified in Chapter 1. As shown in Table 19, comparing the antioxidant activity of free and
dimer forms of γ-tocotrienol at the same concentration, it was observed that the free form had
higher antioxidant activity than the dimer forms at every concentration. Moreover, whatever
the tested concentration, γ-tocotrienol dimer III (suspected to contain only one phenolic
hydrogen, the other one being involved in the formation of ether bond) had a lower
antioxidant activity than the other dimer I and II (suspected to contain the two phenol
functions (dihydroxy dimers)). Those results confirm that the availability of phenolic
hydrogen is crucial in the antioxidant activity of tocotrienols:
i) When the phenolic hydrogen is free, the activity is maximum.
ii) When two phenolic hydrogens are contained in a dimer, the activity is lower
(relatively to the concentration) probably due to steric constraints.
iii) When one of the two phenolic hydrogens has been removed during
dimerization (formation of an ether bond), the activity is minimal.
Table 19 Absolute value of initial slope obtained from purified γ-tocotrienol dimers (I, II
and III) and esters (I and II) from PB235 lipid extract (Data were means from 3 replications
made from the same initial stock solution, N/D: not detected).
Concentrations(µg.mL-1)
γ-tocotrienol (free form)
γ-tocotrienol derivatives
Dimer I Dimer II Dimer III Ester I Ester II50 19.8 + 0.3 6.84 + 0.3 10.0 + 0.2 3.74 + 0.1 N/D N/D
100 23.6 + 0.6 12.3 + 0.2 14.7 + 0.2 7.19 + 0.2 N/D N/D
200 24.3 + 0.8 18.8 + 0.2 19.7 + 0.4 14.6 + 0.3 N/D N/D
125
6. Conclusion
As described in Chapter 1, the methodology used to prepare the maturated samples
was based on the strategy to modify the protocol of preparation of USS in order to obtained
degraded sample. Indeed, latex was naturally coagulated (instead of formic acid coagulation)
and the obtained coagula were maturated for a certain period of time (instead of laminating
the coagula after coagulation). Though interesting tendencies were observed in terms of
physical properties of rubber, of lipid composition, of antioxidant activity of lipid extract, the
variance of the obtained data made the interpretation of results very delicate. This variance
was most probably due to the environmental parameters that were not controlled during
maturation of coagula (temperature, humidity, presence of microorganisms in the
atmosphere, etc).
Therefore, it was decided to change the experimental strategy and perform the next
trials under strictly controlled maturation conditions (temperature, humidity, oxygen content
of the atmosphere) followed by a TSR like processing (creping and drying 125°C, 2 h). This
was done in PSU (Surat Thani campus, Surat Thani province, Thailand) where a dedicated
maturation device was developed as described in Materials and Methods. The obtained
results are shown in the next Chapter.

126
CHAPTER 3
Characterization of the structure, properties and biochemical composition
of natural rubber obtained from coagula maturated under controlled
condition and treated using a TSR like process
The results obtained when the maturation was not controlled and the coagula were
processed using USS/RSS like processing were presented in the previous Chapter 2. The
present Chapter 3 will deal with the results obtained from fully controlled maturation
conditions (relative humidity, temperature and oxygen content) and followed by a TSR like
process (creping and drying 125°C for 2h). The sample preparation methods are presented in
Materials and Methods (§3.3).
In this part, the data will be presented always following the same pattern: RRIM600
clone will be on the left while PB235 clone will be on the right. The three treatments will be
presented vertically: the first one, on the top, (Na+O-) is a control treatment where the latex
was added by a biocide (sodium azide, Na) in order to prevent the growth of most of the
microorganisms. The second (Na-O-, maturation atmosphere = nitrogen) and the third, on the
bottom, (Na-O+, maturation atmosphere = air) were performed to simulate anaerobic and
aerobic maturations, respectively.
1. Initial pH of latex, and pHs of coagula and serum during maturation
The evolutions of pH of coagula and sera obtained from 3 maturation conditions are
shown in Figure 50. The initial pH of latex is shown as a blue point at day 0.
1.1 Comparison with uncontrolled conditions
Contrary to uncontrolled condition, a similar evolution was observed for the pH of
sera and that of the corresponding coagula. Therefore only pH of coagula will be commented.
The absence of value concerning serum pH corresponded to the impossibility of measurement
due to complete evaporation of serum.

127
Moreover, same tendencies of pH evolution between uncontrolled conditions
(Figure 32) and the Na-O+ treatment were logically observed though the final high values of
pH seemed higher in uncontrolled condition (pH > 9) than in uncontrolled aerobic condition
(approx. pH 8).
1.2 pH follow-up of mini-coagula samples under controlled conditions
1.2.1 Control treatment (Na+O-, acid coagulated samples)
It is reminded that all samples in this treatment were acid coagulated. The
formic acid was added into latex in each mini-glass cup after 3 days of maturation in order to
make the complete coagulation of the latex before removal of all coagula from the mini-glass
cups and continuation of maturation in the maturation device as described in Materials and
Methods (§3.3)
Despite the biocide activity of sodium azide, it is interesting to see that the
initial decrease of pH is still present in the first 3 days for both clones (from 6.6 (day 0, fresh
latex) to 5.8 (day3, RRIM600) or 5.2 (day 3, PB235). This could be due to an incomplete
inhibition of microbial activity or to a biochemical or chemical reactions that would acidify
the latex and would be insensitive to azide. However, it is noted that with PB235 latex this
initial pH decrease, which is more important than with RRIM600 latex, is lower when sodium
azide is added than when it is not.
For both clones, after 5 days of maturation, and a forced coagulation by acid
addition at day 3, the pH stayed stable between 6 and 6.5 for the total duration of maturation
follow-up in the sodium azide added coagula.

128
1.2.2 Anaerobic (Na-O-) and aerobic (Na-O+) maturation condition (natural
coagulation)
It is reminded that all samples in this treatment were naturally coagulated
except for the day 0 sample, which was acid coagulated to allow the rubber sample making
from a fresh coagulum (Materials and Methods, §3.3).
For RRIM600 samples, an initial decrease of one point of pH (from 6.6 to
5.6) was observed in both conditions (aerobic and anaerobic maturations) and corresponded
to the coagulation. Then, the evolutions of pH were different depending on the maturation
condition. Indeed, pH of Na-O+ coagula increased significantly and continuously during
maturation and reached a maximum of 8.2 at day 28 while for Na-O-, the pH stayed in the
narrow range of 5.4 to 6.0. Therefore, the presence of oxygen seemed to be a major factor of
the pH evolution of rubber coagula over maturation time. This higher evolution of pH of
coagula maturated under aerobic condition could be linked with a higher protein degradation
and/or lower organic acid production by aerobic microorganism, leading to higher ammonia
and/or lower organic acid concentrations and resulting in a higher increase of pH. The same
phenomenon was also observed in the work of Intapun (2009) who reported a higher increase
of pH of RRIM600 maturated cup coagula under the presence of oxygen than in its absence
during 45 days of maturation.
Concerning the maturated coagula prepared from PB235 rubber clone latex,
the pH decreased from 6.6 (day 0, fresh latex) to 4.4 at day 3 which is 1 point lower that the
minimum value reached by RRIM600 latex. This higher decrease could be partially explained
with a higher FFA content, as FFA is known to be released by enzymatic hydrolysis in the
early stage of maturation. This enzymatic process being most likely not sensitive to sodium
azide addition, it can explain only partially this decrease to pH 4.4 (in the case of sodium
azide added coagula, the pH decreased to 5.2). After this lowest pH, the evolutions of pH
followed the same trend as those observed with RRIM600 (important increase in the presence
of oxygen, and plateau at pH 5.2-5.6 range in anaerobic conditions).

129
Na+O-: Sodium azide added latex and maturated under anaerobic condition. Na-O+: No sodium azide added latex and maturated under aerobic condition. Na-O-: No sodium azide added latex and maturated under anaerobic condition.
Figure 50 pH evolutions of mini-cup coagula obtained from (a) RRIM600 and (b) PB235
rubber clones.
2. Fresh and dry matter of mini-crepes
As for uncontrolled conditions, the fresh weight and dry weight of the laminated
coagula (called in the present case “mini-crepe” and “mini-laminated sheet” in uncontrolled
conditions) were followed during maturation and the water content was calculated as the
following ratio: (fresh weight minus dry weight)/fresh weight.
Figure 51 presents the evolutions of those indicators by treatment for RRIM600 and
PB235 clones. It is observed that the dry weight (17-18 g) is constant whatever the treatment,
a) RRIM600 clone b) PB235 clone
Maturation time (days)
pH
Maturation time (days)
pH
p
H
pH of coagula pH of serum
Na-O-
Na+O-
Na-O+
Na-O-
Na-O+
Na+O-

130
which means that the water content variation depends on those of the fresh weight of the
crepe and that the drying seemed complete for all samples.
2.1 Comparison with uncontrolled conditions
As shown in Table 20, in every cases (aerobic controlled or uncontrolled
maturation conditions) the water content increased with maturation time, but it is noted that
the absolute values are always higher with controlled conditions, especially at the early stages
(day 0, acid coagulated or day 3, natural coagulation). This difference is most probably due to
the difference of laminating processing; a hand mangle in the case of uncontrolled conditions
and a mini-creper in the case of controlled conditions. The difference in shape of coagula
could also be involved.
Table 20 The ratio of water contents of fresh laminated crepes and fresh laminated USS
sheets obtained from RRIM600 and PB235 coagula.
Clones Maturation
duration (days)
Water content (%) of Ratio of water
contents (controlled /uncontrolled
conditions)
fresh laminated USS sheets
(uncontrolled conditions)
fresh laminated crepes
(controlled aerobic conditions)
RRIM600 0 13 + 2.0 21 + 0.4 1.6 3 16 + 0.9 29 + 0.7 1.8 14 29 + 0.5 37 + 1.6 1.3
PB235 0 10 + 1.7 21 + 0.9 2.1 3 15 + 0.2 25 + 1.1 1.7 14 23 + 0.7 29 + 0.2 1.3
Values were expressed as means ± standard deviations (n=3.). The data of controlled condition were from aerobic maturation condition.
2.1 Evolutions of fresh and dry matter of maturated coagula under controlled
conditions
When sodium azide was added, the water content of the crepe stayed in the range
of 17-25% for both clones. A slight decrease in function of maturation time was observed
with PB235 crepes.

131
Na+O-: Sodium azide added latex and maturated under anaerobic condition. Na-O+: No sodium azide added latex and maturated under aerobic condition. Na-O-: No sodium azide added latex and maturated under anaerobic condition.
Figure 51 Fresh weight, dry weight and water content of mini-creped samples obtained from
RRIM600 and PB235 clones during 28 days of maturation.
Maturation time (days)
Wat
er c
on
ten
t (%
) W
eig
ht
(g)
Maturation time (days)
Wat
er c
on
ten
t (%
) W
eig
ht
(g)
Maturation time (days)
Wat
er c
on
ten
t (%
) W
eig
ht
(g)
Maturation time (days)
Wat
er c
on
ten
t (%
) W
eig
ht
(g)
Maturation time (days)
Wat
er c
on
ten
t (%
) W
eig
ht
(g)
Maturation time (days)
Wat
er c
on
ten
t (%
) W
eig
ht
(g)
Dry weight (g) Fresh weight (g) Water content (%)
a) RRIM600 clone b) PB235 clone
Na+O- Na+O-
Na-O-
Na-O+
Na-O-
Na-O+

132
Under aerobic maturation conditions (Na-O+), the water content of the crepe
increased significantly with maturation time reaching 35% for RRIM600 crepe obtained from
21 day-maturated coagula and 28% for PB235. This could be linked with microbial activity,
that is known to be correlated with water retention in the coagula (Intapun et al., 2010).
Under anaerobic conditions (Na-O-), the water content values stayed around 25%
and seemed not to depend on the maturation time, except for that of day 28 of RRIM600
crepe that decreased to 18%.
It is therefore worth noting that the materials that were put in the oven and that
were dried for the same time (2 h) at the same temperature (125 °C) were containing different
quantities of water to be evaporated by drying. Therefore, the phenomenon occurring during
drying could differ from one sample to another. Unfortunately, there was not enough
knowledge and appropriate equipment to adapt oven temperature and drying time to the
specific initial water content of each sample.
3. Evolution of bulk properties of NR from maturated coagula under controlled
maturation conditions (TSR like process)
The physical properties evolutions of RRIM600 and PB235 mini-crepes during
28 days of maturation are presented in Figure 52 and Figure 53, respectively.
3.1 Comparison with uncontrolled conditions
As expected, the variance of the obtained values and the number of outlier were
found to be much lower when the maturation conditions were controlled. The evolutions of
the bulk property indicator values over maturation time seemed easier to interpret especially
for RRIM600 clone.
Moreover the maturation was followed on a longer duration (28 days) which
provide information on a longer term.

133
3.2 Evolution of bulk properties of mini-crepes under controlled conditions
3.2.1 Control treatment (Na+O-, acid coagulated samples)
It is reminded that all samples in this treatment were acid coagulated.
Concerning RRIM600 clone, though the growth of microorganisms was inhibited (Na+O-),
the initial plasticity P0 increased during the first few days of maturation (from P0 39 at day 0
to P0 54 at day 7). Then, this value stayed still until 28 days of maturation. P30 value followed
the same evolution, which means that this hardening seems resistant to the thermo-oxidation
condition imposed in P30 measurement (140 °C, 30 min). Therefore PRI did not change much
and stayed at a high range of 73-93. Concerning PB235 clone, the hardening described for
RRIM600 clone was not observed and the values of P0, P30 and therefore PRI stayed constant
for all maturation durations (P0 50; P30 37; PRI 72).
3.2.2 Anaerobic maturation condition (Na-O-, natural coagulation day 3-28)
It is reminded that all samples in this treatment were naturally coagulated
except the one at day 0. Therefore the evolution of value will be commented from day 3 to
day 28 for RRIM600 and from day 5 to day 28 for PB235 clone due to a technical issue.
For RRIM600 clone, P0 values increased from 51 (day 3) to 60 (day 7) and
stayed still until day 28. Concerning P30, a slight decrease was observed from 46 (day 3) to 40
(day 28) which resulted in a decrease of PRI from 90 (day 3) to 64 (day 28).
For PB235 clone, from day 5 to day 28, the values of P0 stayed constant
around the value of 40 except for day 7 (P0 48). P30 values were low and decreased from day
7 (22) to day 21 (5). Therefore PRI decreased from 39 (day 5) to 4 (day 21).
Concerning non-maturated samples (day 0) which were obtained after acid
coagulation, the P0 value was higher for PB235 (P0 44) than from RRIM600 (P0 38) and
corresponded to the values measured in uncontrolled conditions (mini-sheets).

134
Under anaerobic maturation, two main differences were observed between
2 clones (i) The hardening of RRIM600 rubber during maturation was not observed for
PB235. This difference was already noted for sodium azide added treatment, which means
that it could be independent from microorganisms but more linked with the mesostructure of
rubber that is known to differ between 2 clones. Mesostructural characterization which will
be described later in this chapter would provide more information ; (ii) The rubber obtained
from PB235 clone seemed more sensitive to thermo-oxidation than that of RRIM600. This
difference was not noticed in sodium azide added treatment which means that it could be
linked with microbial activity.
3.2.3 Aerobic maturation condition (Na-O+, natural coagulation (day 3-28)
It is reminded that all samples in this treatment were naturally coagulated
except day 0. Therefore the evolution of values will be commented from day 3 to day 28 for
RRIM600 and from day 5 to day 28 for PB235 clone due to technical issue.
For RRIM600 clone, P0 values increased from 51 (day 3) to 55 (day 7) and
stayed still until day 28. A decrease of P30 values was observed from 44 (day 3) to 26 (day
28) which resulted in a significant decrease of PRI from 87 (day 3) to 46 (day 28). The main
difference with anaerobic condition is a faster and higher drop of P30 which is due most
probably to higher degradation of native antioxidant because of the presence of oxygen. The
values of P0 measured in this experiment are abnormally high for long maturation times.
Indeed, it was expected that P0 value should decrease after the initial hardening due to the
scission of polyisoprene chains. Mesostructural analysis will provide more information.
For PB235 clone, from day 5 to day 28, the values of P0 stayed constant
around the value of 36 except for day 7 (P0 43). P30 values were very low and decreased from
day 7 (P30=12) to day 28 (P30=5). PRI value was low in stayed in the range from 16 to 26. As
for RRIM600, the lack of decrease of P0 over maturation time is abnormal especially when
the P30 value are very low at early stage of maturation which should illustrate a lack of native
antioxidant power which should lead to the scission of the polymer chain during the drying
(125 °C, 2 h) and therefore a decrease of P0.

135
Figure 52 Evolutions of physical properties of (a) Na+O-, (b) Na-O- and (c) Na-O+ coagula
obtained from RRIM600 clone during 28 days of maturation.
P0
(Un
it)
P3
0 (U
nit
) P
RI (
%)
a) Na+O- condition
bcc abc a ab
d
abc e
d c
ab a ba
bc a ab
bc cdcd d
b) Na-O- condition
d
c b a ab ab a
cdab abc a bc
d cd
a a
bc b
cd cd d
c
a a ab
d e
c
ab ab a ab ba
c) Na-O+ condition
a a b b
c d
e
Maturation time (days)
P0
(Un
it)
P3
0 (U
nit
) P
RI (
%)
Maturation time (days)
P0
(Un
it)
P3
0 (U
nit
) P
RI (
%)
Maturation time (days)

136
Figure 53 Evolutions of physical properties of (a) Na+O-, (b) Na-O- and (c) Na-O+ coagula
obtained from PB235 clone during 28 days of maturation.
a) Na+O- condition
b) Na-O- condition
aabb b b
b
bc c ab
c bca
a a a a a a
a
bc b
cd c
a
c b bc
e
d
ab bc a
cc bc
c) Na-O+ condition
ab d
a
cd bcab
bcd cd b bc d
a
a
c
b bc
bc
Maturation time (days)
P0
(Un
it)
P30
(U
nit
) P
RI (
%)
Maturation time (days)
P0
(Un
it)
P3
0 (U
nit
) P
RI (
%)
Maturation time (days)
P0
(Un
it)
P3
0 (U
nit
) P
RI (
%)
137
4. Mesostructure analysis
Mesostructure of RRIM600 and PB235 maturated mini-cup coagula were analyzed by
Size Exclusion Chromatography (SEC) equipped with a Multi-Angular Light Scattering
(MALS) detector. The evolutions of the studied parameters: total gel content, weight-average
molar mass (Mw) and number-average molar mass (Mn) are described below. It is precised
that the mesostructural analyses were performed 6 months after the sample making and were
stored at room temperature for 4 months in Bangkok laboratory and for 2 months in
Montpellier laboratory. Therefore storage hardening may have occurred. Anyway, care was
taken to ensure strictly identical storage history for all samples.
Following the analysis of bulk properties, the mesotructural indicator should confirm
the main evolution over maturation time (initial hardening of the rubber for RRIM600 clone,
etc.).
4.1 Total gel content
Figure 54 presents the evolution of total gel content (macrogel + microgel) during
28 days of maturation obtained from RRIM600 and PB235 mini-cup coagula.
4.1.1 Control treatment (Na+O-, acid coagulated samples)
There was a significant increase of gel within the first few days of
maturation. This increase was much more significant for RRIM600 clone (from 34% (day 0)
to 52% (day 7)) than for PB235 clone (from 28% (day 0) to 36% (day 5)). This correlates
well with the observation of the evolution of P0 values under this treatment that inhibits
microorganism activity. This increase of gel content in presence of sodium azide was
reported before by Intapun et al. (2010) for RRIM600 clone. Concerning PB235 clone,
though the gel content increased also from day 0 (28%) to day 5 (36%), the extent of this
increase was lower and the gel contents of PB235 sample were always lower than those of
RRIM600 clone whatever maturation time and treatment. This lower variation and lower
level of gel during maturation of PB235 coagula fit well with the variation of P0.

138
This clonal difference could be explained by the different molar mass
distribution between RRIM600 and PB235 clones, RRIM600 rubber initially containing more
short chain polymer that are known to be involved in gel formation (Ehabe et al., 2002).
In addition, it is important to note that the acid coagulation had no
significant effect on the increase of the gel content with the maturation time. Indeed, all
samples were acid coagulated and the evolution of gel content followed the same trend as the
other treatments (Figure 54).
4.1.2 Anaerobic maturation condition (Na-O-, naturally coagulated samples)
For RRIM600 clone, an increase of gel content was observed as well at the
beginning of the kinetic (from 28.5% (day 0) to 50% (day 7). Concerning PB235 clone, the
gel content increased also at the beginning of the kinetic (from 31% (day 0) to 41% (day 7).
Again, the plateau for the gel content observed during the kinetic of maturation (7 < time <
28 days) is significantly lower for ADS from PB235 clone.
4.1.3 Aerobic maturation condition (Na-O+, naturally coagulated samples)
The evolutions of gel content for both clones in aerobic condition were very
similar to those observed under anaerobic ones.
The value of gel content at day 0 (acid coagulated, non-maturated sample)
whatever treatment and clone was significantly lower than the naturally coagulated and
maturated sample (for example for RRIM600 in anaerobic condition, the gel content of
day 0 sample was 29% while after 3 day of maturation it was 47%). As mentioned before, it
appeared that acid added for coagulation had no influence on the evolution of gel content. In
addition, in our conditions of experiments there were no significant difference between
treatments (Na+O-, Na-O-). At day 0, it can be noted that there is no clonal difference of gel
content. However, along maturation a large difference was observed for gel content for the
samples from the two clones (gel PB235 < gel RRIM600).

139
Na+O-: Sodium azide added latex and maturated under anaerobic condition. Na-O+: No sodium azide added latex and maturated under aerobic condition. Na-O-: No sodium azide added latex and maturated under anaerobic condition.
Figure 54 Evolutions of total gel content (%) obtained from (a) RRIM600 and (b) PB235
rubber clones during 28 days of maturation.
a) RRIM600 clone b) PB235 clone
Maturation time (days) Maturation time (days)
To
tal
ge
l co
nte
nt
(%)
To
tal
gel
co
nte
nt
(%)
To
tal
gel
co
nte
nt
(%) Na-O-
Na-O+
Na+O
Na-O-
Na-O+
Na+O-

140
4.2 Weight-average molar mass (Mw) and number-average molar mass (Mn)
4.2.1 Control treatment (Na+O-, acid coagulated samples)
As presented in Figure 55, at day 0, the molar masses of PB235 sample
(Mn 1083 kg.mol-1; Mw 1637 kg.mol-1) were significantly higher than those of RRIM600
(Mn 879 kg.mol-1; Mw 1497 kg.mol-1) which was expected from their known molar mass
distribution (MMD0 unimodal for PB235 and bimodal for RRIM600). After maturation (from
day 3 to day 28), the molar masses did not change for PB235 sample while those for
RRIM600 increased significantly and reached the value of 1347 kg.mol-1 for Mn and
1802 kg.mol-1 for Mw. This significant change is probably correlated with the high increase of
gel that is associated with a disappearance of short chain in the soluble fraction that is used to
assess molar masses.
4.2.2 Anaerobic maturation condition (Na-O-, natural coagulation day 3-28)
For RRIM600 clone, both molar masses decreased with maturation time
from day 3 (Mn 1237 kg.mol-1; Mw 1710 kg.mol-1) to day 28 (Mn 930 kg.mol-1;
Mw 1212 kg.mol-1). For PB235 rubber, the same tendency was observed with a higher
decrease of average molar masses for longer maturation times.
4.2.3 Aerobic maturation condition (Na-O+, natural coagulation day 3-28)
The evolutions of both Mn and Mw were similar than in anaerobic conditions
but the decrease of the values appeared less marked under aerobic condition.
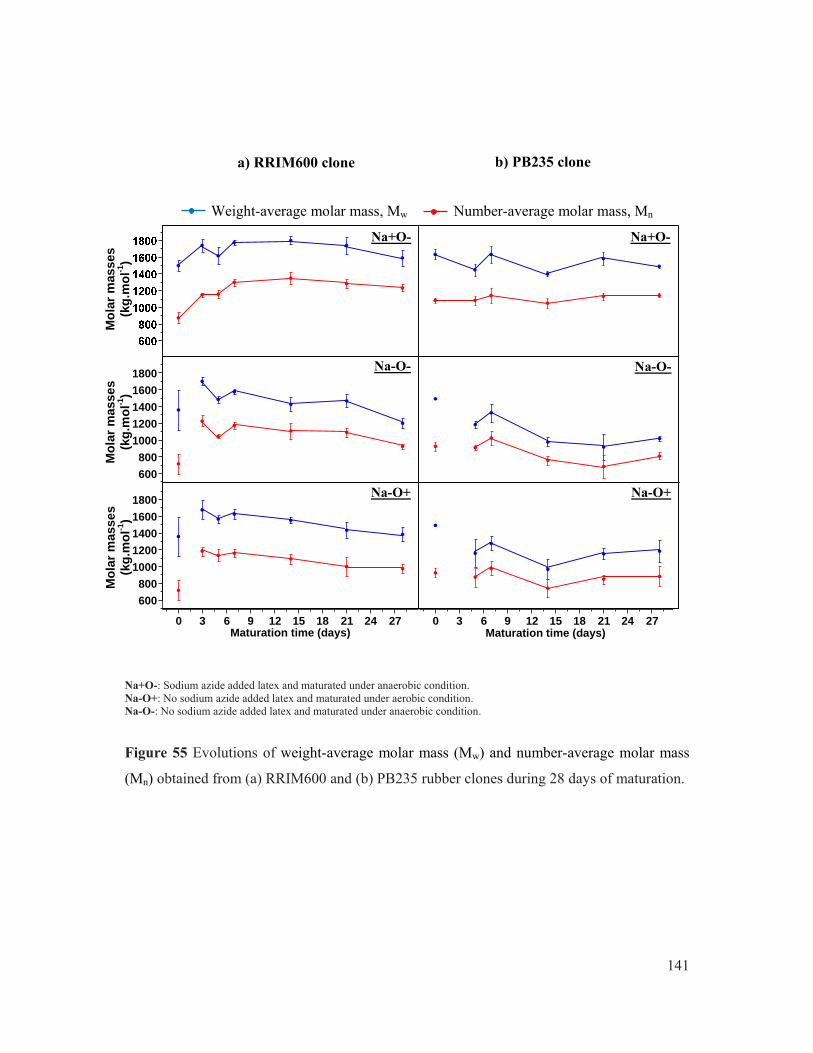
141
600
800
1000
1200
1400
1600
1800
600
800
1000
1200
1400
1600
1800
0 3 6 9 12 15 18 21 24 27 0 3 6 9 12 15 18 21 24 27
Na+O-: Sodium azide added latex and maturated under anaerobic condition. Na-O+: No sodium azide added latex and maturated under aerobic condition. Na-O-: No sodium azide added latex and maturated under anaerobic condition.
Figure 55 Evolutions of weight-average molar mass (Mw) and number-average molar mass
(Mn) obtained from (a) RRIM600 and (b) PB235 rubber clones during 28 days of maturation.
a) RRIM600 clone b) PB235 clone
Maturation time (days)
Mo
lar
mas
ses
(kg
.mo
l-1)
Maturation time (days)
Mo
lar
mas
ses
(kg
.mo
l-1)
Mo
lar
mas
ses
(kg
.mo
l-1)
Weight-average molar mass, Mw Number-average molar mass, Mn
Na-O-
Na-O+
Na+O-
Na-O-
Na-O+
Na+O-

142
5. Evolution of lipid extract composition from matured coagula under controlled
maturation conditions (TSR like process)
5.1 Lipid quantity
The lipid extract quantity obtained from RRIM600 and PB235 mini-cup coagula
during 28 days of maturation are presented in Figure 56.
5.1.1 Comparison with uncontrolled conditions
The lipid extract from unmaturated samples (day 0) from both clones were
found to be similar in both experimental conditions (Chantaburi fields, mini-sheet processing
versus Surat Thani fields, mini-crepe processing), with a marked clonal difference (RRIM600
2.01% (Chantaburi mini-RSS day 0) vs 2.04% (Surat Thani mini-crepe day 0) and PB235
3.53% (Chantaburi mini-RSS day 0) vs 3.38% (Surat Thani mini-crepe day 0)). This confirms
that lipid extract is a clonal character. Moreover the expected reduction of variance of values
was clearly obtained by controlling the maturation conditions (Figure 56 and Figure 36).
Concerning the evolution of this indicator during maturation same
tendencies were observed between the two maturation conditions but the decrease of the
amount of lipid extract during maturation from PB235 samples was more marked under
controlled maturation condition (aerobic treatment): 3.38% (day 0) to 2.51% (day 28).
5.1.2 Evolution of lipid quantity under controlled conditions
5.1.2.1 Control treatment (Na+O-, acid coagulated samples)
As shown in Figure 56, the lipid extract quantity obtained from both
clones did not change much during maturation (for RRIM600 clone, it ranged from 2.17%
(day 0) to 1.89% (day 28) and for PB235 clone ranged from 3.47% (day 0) to 3.16% (day
28). This is most probably due to the absence of catabolic lipid degradation because of an
inhibition of microorganism activity.

143
5.1.2.2 Anaerobic maturation condition (Na-O-, natural coagulation day 3-28)
For both clones, under anaerobic maturation condition, the lipid
extract did not change and stayed at it initial respective levels (for RRIM600 clone, the value
of lipid extract stayed still in the range 1.91%-1.95% and 3.26-3.37% for PB235 clone).
Therefore it seems that in absence of oxygen, the lipid extract quantity remained unchanged.
It does not mean that there is no biochemical change (such as hydrolysis and release of free
fatty acids) but it means that the products of this reaction remained not water soluble. For
example the β-oxidation of fatty acids leading to water soluble acetyl-CoA would lead to a
decrease of lipid extract if no mechanisms compensate this loss. Indeed, lipid anabolism by
anaerobic microorganisms could also occur and compensate a possible catabolic degradation
of native lipid extract.
5.1.2.3 Aerobic maturation condition (Na-O+, natural coagulation day 3-28)
Contrary to anaerobic maturation condition, a significant evolution of
lipid contents was observed from the samples which maturated under aerobic conditions from
both clones. For RRIM600 samples, the lipid contents decreased significantly from 1.94%
(day 3) to 1.61% (day 28) and for PB235, the lipid contents decreased significantly from
3.31% (day5) to 2.51% (day 28). The more important decrease for PB235 clone could be
linked with the higher fatty acids content of this clone. It could be therefore concluded that
the presence of oxygen is an important factor for lipid catabolic degradation caused from
microorganism activity during rubber maturation. The evolutions of each lipid component
will be described in details in the following pages.
5.2 Qualitative analysis of lipid evolution during maturation
Figure 57 shows the TLC plates of lipids extract from mini-cup coagula of two
rubber clones during 28 days of maturation.

144
1.0
1.5
2.0
2.5
3.0
3.5
1.0
1.5
2.0
2.5
3.0
3.5
0 3 6 9 12 15 18 21 24 27 0 3 6 9 12 15 18 21 24 27
Na+O-: Sodium azide added latex and maturated under anaerobic condition. Na-O+: No sodium azide added latex and maturated under aerobic condition. Na-O-: No sodium azide added latex and maturated under anaerobic condition.
Figure 56 Lipid extract (% w/w dry rubber) obtained from (a) RRIM600 and (b) PB235
rubber clones during 28 days of maturation.
Maturation time (days) Maturation time (days)
% L
ipid
ext
ract
(w
/w d
ry r
ub
be
r)
ab b b
b
ab
a a a a a a
a a abb
c d
b b b b b ba
a ab b b b b b
a ab ab ab bc c c
% L
ipid
ext
ract
(w
/w d
ry r
ub
ber
) %
Lip
id e
xtra
ct
(w/w
dry
ru
bb
er)
Na-O-
Na+O-
Na-O+
Na-O-
Na-O+
Na+O-
145
5.2.1 Comparison with uncontrolled conditions
For both clones, the relative proportion of FFA and TGF obtained from
aerobic controlled condition was similar to those of uncontrolled conditions in every drying
condition. However the degradation rate of those components seemed visually lower under
controlled conditions.
It is interesting to notice that when the sample were oven dried (125 °C,
controlled maturation conditions, Figure 57) and at a lesser extent smoked dried (60 °C,
uncontrolled maturation conditions, Figure 37), the esterified species (sterol esters and
tocotrienol esters) were present for all maturation times, while when the samples were
outdoor air dried the sterol esters tended to disappear while the tocotrienol esters appeared
with maturation. Therefore there could be an effect of drying method on the esterification
state of FA and alcohols in the lipid extract. This will be analyzed in the following
quantitative reports.
5.2.2 Evolution of lipid composition under controlled conditions
5.2.2.1 Control treatment (Na+O-, acid coagulated samples)
A similar evolution of lipid components during maturation was
observed between lipid extracts from 2 studied clones. The main change over maturation time
was FFA spot increase corresponding to a hydrolysis of esterified species, especially polar
lipids (Liengprayoon et al., 2013).
5.2.2.2 Anaerobic maturation condition (Na-O-, natural coagulation day 3-28)
The evolutions of lipid components of RRIM600 samples were
similar to the control treatment. However it was observed that the intensity of wax spot of
natural coagulated sample seemed to be higher than in the sodium azide added and acid
coagulated samples. Same observation could be made for lipid components evolution of
PB235 samples except for TGF spots. It was found that the hydrolysis of TGF seemed faster
146
in the case of naturally coagulated samples (Na-) than in that of sodium azide and acid
coagulated samples (Na+). Moreover the wax spot for PB235 samples seemed to be doubled.
It could be due to the presence of more polar furan fatty acid in wax species. It would be
interesting to analyze the fatty acid composition of waxes.
5.2.2.3 Aerobic maturation condition (Na-O+, natural coagulation day 3-28)
For both samples, the hydrolysis of TGF seemed to occur faster
under aerobic than anaerobic conditions. Moreover, free fatty acids spot intensity seemed to
decrease at long maturation time (day 14-28). HPTLC quantification would help to confirm
these visual observations.
5.3 Quantitative analysis of lipid evolution during maturation
5.3.1 Neutral lipid composition
Lipid extracts obtained from RRIM600 and PB235 maturated rubbers were
analyzed for each lipid component quantity using HPTLC. Compared with the previous
HPTLC results obtained with extracts issued from uncontrolled maturation conditions, the
variance of result was much lower, and the obtained tendencies easier to interpret.
5.3.1.1 Free fatty acids and TGs
Figure 58 shows the evolution of free fatty acids (FFA) and
trifuranoyl-glycerol (TGF) quantities over maturation time for the 3 treatments and 2 clones.
When sodium azide was added, an identical and limited release of
free fatty acids (till around 0.7 % rubber) was observed for both clones after 3-5 days of
maturation. For PB235 lipid extract which contains a lot of TGs it was observed that they
were partially hydrolyzed only by native latex lipases. Another source of fatty acids can also
be polar lipids (glyco- and phospholipids) that are known to be hydrolyzed during the process
of dry rubber sample making.
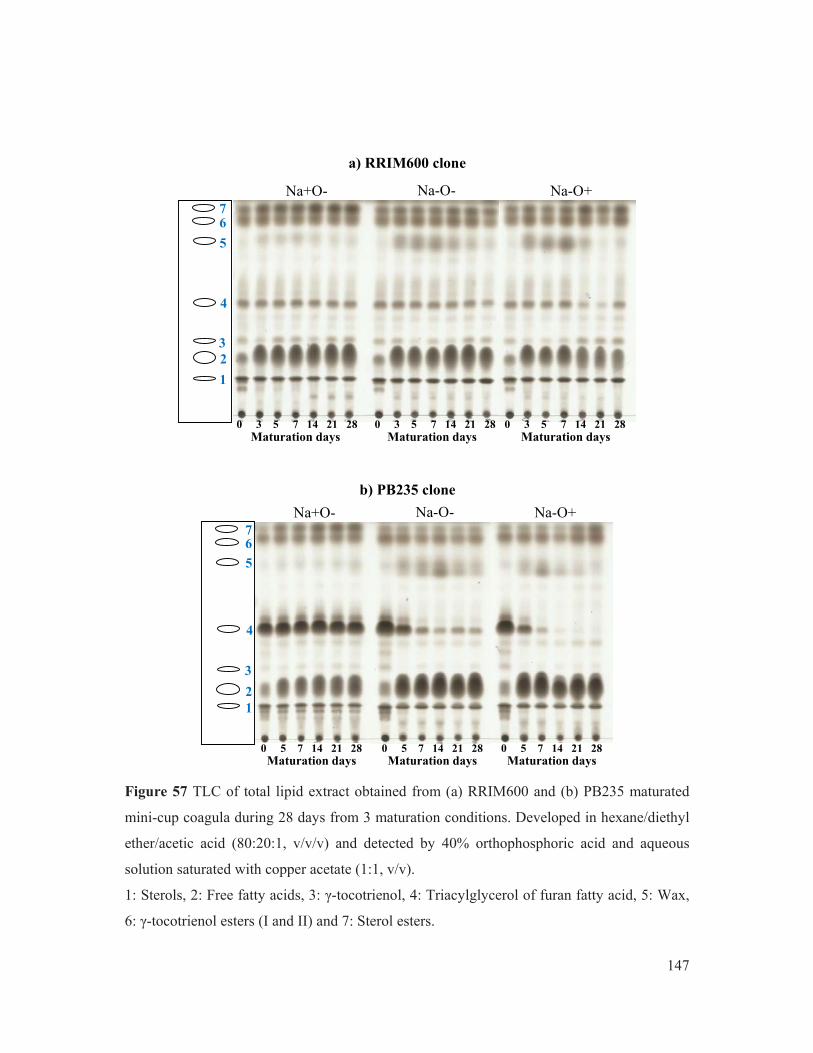
147
Figure 57 TLC of total lipid extract obtained from (a) RRIM600 and (b) PB235 maturated
mini-cup coagula during 28 days from 3 maturation conditions. Developed in hexane/diethyl
ether/acetic acid (80:20:1, v/v/v) and detected by 40% orthophosphoric acid and aqueous
solution saturated with copper acetate (1:1, v/v).
1: Sterols, 2: Free fatty acids, 3: γ-tocotrienol, 4: Triacylglycerol of furan fatty acid, 5: Wax,
6: γ-tocotrienol esters (I and II) and 7: Sterol esters.
0 3 5 7 14 21 28
Na+O- Na-O- Na-O+
a) RRIM600 clone
b) PB235 clone
Maturation days
1
4
3
5
7
2
6
1
4
3
5
7 6
2
Maturation days Maturation days 0 3 5 7 14 21 28 0 3 5 7 14 21 28
Maturation days 0 5 7 14 21 28
Maturation days 0 5 7 14 21 28
Maturation days 0 5 7 14 21 28
Na+O- Na-O- Na-O+

148
Under anaerobic maturation, same observation could be made for
RRIM600 clone. The evolution of TGF and FFA for PB235 clone was different compared
with sodium azide added treatment: indeed, the hydrolysis of TGF was almost complete after
14 days of maturation, which logically corresponded to a higher free fatty acids (mostly furan
fatty acid) release. Therefore the anaerobic microorganisms may have provided
supplementary lipase activity to perform this complete hydrolysis of TGF.
Under aerobic conditions, at the early stage of maturation (3-5 days)
the quantities of TGF were similar than in anaerobic conditions. But two differences can be
noted for the later stage of maturation: (i) the complete hydrolysis of TGF occurred earlier
and (ii) a decrease of FFA after 7 days of maturation replaced the plateau state observed
before. The decrease could be either due to an esterification with alcohol (sterols,
tocotrienols, fatty alcohols) or to a catabolic degradation.
5.3.1.2 γ-tocotrienol and its esters
Figure 59 shows the evolution of free γ-tocotrienol and its esters over
maturation time for the 3 treatments and 2 clones. It is reminded that γ-tocotrienol ester I
contains mainly saturated fatty acids while γ-tocotrienol ester II contains unsaturated fatty
acids. The very low level of ester II (around 0.02%) in PB235 sample compared with those
form RRIM600 (0.07-0.15 %) whatever the treatment or the maturation is consistent with the
facts that (i) PB235 clone is known to have a much lower quantity of C18:2 compared with
RRIM600 and (ii) no furan fatty acid was detected in both γ-tocotrienol esters.
When sodium azide was added in RRIM600 latex, the free form of
γ-tocotrienol initially present at 0.1% tended to decrease to 0.05% after day 7 and its quantity
remained stable after. At the same time γ-tocotrienol ester I decreased from 0.2% (day 0) to
0.15% (day3) and stayed stable. Concerning γ-tocotrienol ester II, a slight decrease over
maturation time was observed. For PB235 sample with the same biocide added treatment, no
clear change was observed for γ-tocotrienol free form. It is noted that the initial level (0.06%)
is lower than that of RRIM600 sample (0.1%). Contrarily, tocotrienol ester I initial amount in

149
PB235 sample (0.3%) was higher than that of RRIM600 (0.2%) and decreased in the first
5 days of maturation.
When the microorganism activity was not inhibited and the coagula
were naturally coagulated and maturated under anaerobic conditions, the evolutions of free
and esterified γ-tocotrienol were different. In the case of RRIM600 samples, the evolutions of
both esters I and II were symmetrical: the ester species got enriched in saturated fatty acids
after 14 days of maturation but their total amount did not change. Concerning PB235
samples, their content in ester I seemed to increase after 14 days of maturation as well, while
both free and ester II stayed steady at low levels.
When aerobic conditions were applied, same evolutions of esters
species were observed for both clones, but a slight increase of the free forms was also
observed. The enrichment of ester species by saturated fatty acids during maturation could be
linked to a parallel enrichment of saturated species in total fatty acids.
5.3.1.3 Sterols and their esters
The evolution of sterols and their esters quantities over maturation
time obtained from three treatments and two clones are presented in Figure 60.
For sodium azide added samples, an esterification of some of the
initially free sterols seems to occur at early stage, most probably catalyzed with endogenous
enzyme from latex. Anyway, the increase of esterified species did not balance fully the
decrease of free sterols that could be involved in other reactions (glucosylation?). The
increase of esterified sterols was not observed clearly when microorganism activity was not
inhibited whatever clone and treatment. For both clones, the free sterol content in rubber
samples remained stable for naturally coagulated samples (day 3-day 28) and stayed in the
range of 0.2-0.3% which is much lower than that of acid coagulated sample at day 0 (>0.5%).

150
5.3.1.4 Wax
Wax species appeared temporarily during maturation when
microorganism activity was not inhibited (Figure 61). The main period of appearance of wax
was from 3 to 14 days in RRIM600 samples and was more important under aerobic condition,
while this period was broader for PB235 samples. Unfortunately the corresponding fatty
alcohols were not quantified in this HPTLC experiment.
The scheme of neutral lipid composition evolutions of RRIM600 and
PB235 clones are shown in Figure 62.
5.3.2 Total fatty acid composition
Lipid extracts from RRIM600 and PB235 rubber samples obtained from
three maturation conditions were analyzed for their total fatty acids composition using gas
chromatography (GC-FID) as described in Materials and Methods. It is to be reminded that
the absolute quantities were calculated taking into account determined concentrations in
transesterified lipid, transesterification yields and lipid extracts. The results are shown
separately for RRIM600 and PB235 clones in Figure 63 and Figure 64, respectively.
For RRIM 600 samples, the initial TFA composition made mainly of C18:2,
C18:1 and C18:0 fatty acids did not change much with maturation time when sodium azide
was added (Na+O-) (Figure 63a, left), or when the naturally coagulated latex was kept under
anaerobic condition (Na-O-) (Figure 63b, left). Contrarily, when the maturation was
performed in the presence of oxygen, the TFA relative composition changed dramatically
after 7 days of maturation: the unsaturated C18 fatty acid proportion decreased while
proportion of saturated C16:0 and C14:0, as well as of furan fatty acid increased. The
absolute quantity graph (Figure 63c, right) suggests that the total quantity of TFA decreased
significantly from 14 days of maturation and is mainly due to a disappearance of unsaturated
FA. This confirms the decrease of intensity of FA spot on TLC (Figure 57).

151
Na+O-: Sodium azide added latex and maturated under anaerobic condition. Na-O+: No sodium azide added latex and maturated under aerobic condition. Na-O-: No sodium azide added latex and maturated under anaerobic condition.
Figure 58 Evolutions of free fatty acids (FFA) and triacylglycerol of furan fatty acid (TGF)
(% w/w dry rubber) obtained from (a) RRIM600 and (b) PB235 clones during 28 days of
maturation.
Maturation time (days) Maturation time (days)
% w
/w d
ry r
ub
be
r)
% w
/w d
ry r
ub
ber
) %
w/w
dry
ru
bb
er)
a) RRIM600 clone b) PB235 clone
Na-O-
Na+O-
Na-O+
Na-O-
Na-O+
Na+O-
Triacylglycerol of furan fatty acid Free fatty acids
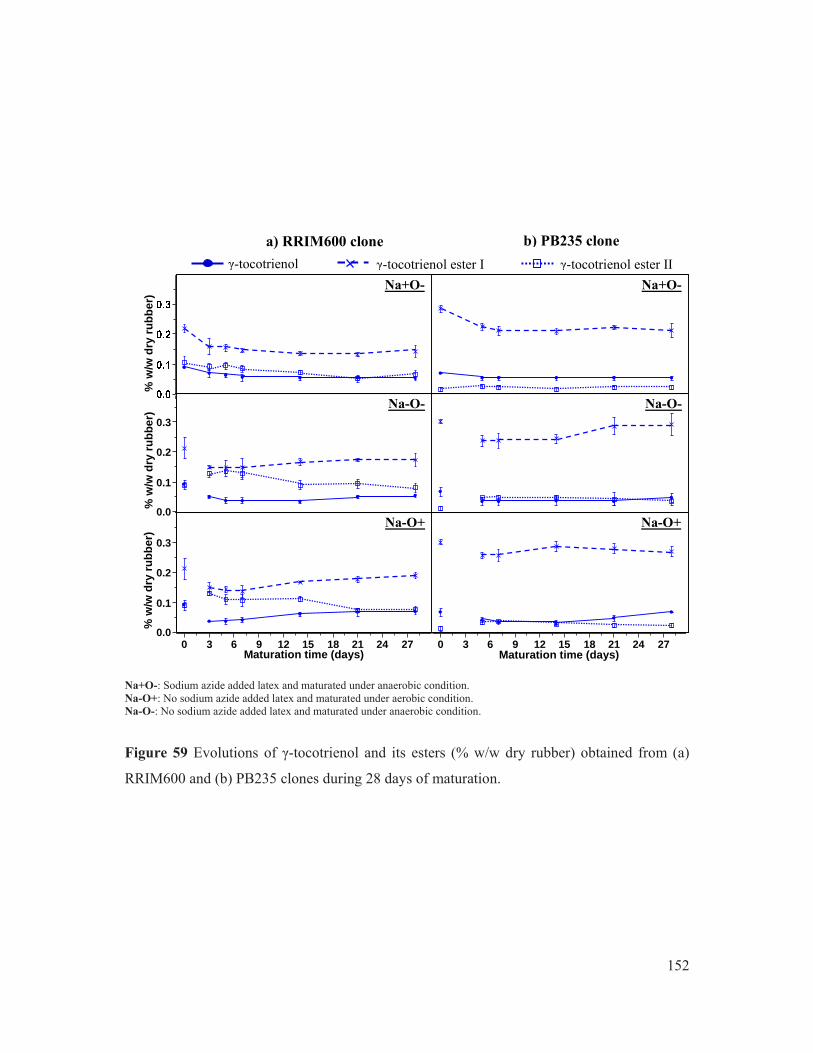
152
0.0
0.1
0.2
0.3
0.0
0.1
0.2
0.3
0 3 6 9 12 15 18 21 24 27 0 3 6 9 12 15 18 21 24 27
Na+O-: Sodium azide added latex and maturated under anaerobic condition. Na-O+: No sodium azide added latex and maturated under aerobic condition. Na-O-: No sodium azide added latex and maturated under anaerobic condition.
Figure 59 Evolutions of γ-tocotrienol and its esters (% w/w dry rubber) obtained from (a)
RRIM600 and (b) PB235 clones during 28 days of maturation.
γ-tocotrienol γ-tocotrienol ester I γ-tocotrienol ester II
Maturation time (days) Maturation time (days)
% w
/w d
ry r
ub
be
r)
% w
/w d
ry r
ub
ber
) %
w/w
dry
ru
bb
er)
a) RRIM600 clone b) PB235 clone
Na-O-
Na+O-
Na-O+
Na-O-
Na-O+
Na+O-

153
Na+O-: Sodium azide added latex and maturated under anaerobic condition. Na-O+: No sodium azide added latex and maturated under aerobic condition. Na-O-: No sodium azide added latex and maturated under anaerobic condition.
Figure 60 Evolutions of free sterols and sterol esters (SE) (% w/w dry rubber) obtained from
(a) RRIM600 and (b) PB235 clones during 28 days of maturation.
Sterols Sterol esters
Maturation time (days) Maturation time (days)
% w
/w d
ry r
ub
ber
) %
w/w
dry
ru
bb
er)
% w
/w d
ry r
ub
be
r)
a) RRIM600 clone b) PB235 clone
Na-O-
Na+O-
Na-O+
Na-O-
Na-O+
Na+O-

154
0.0
0.1
0.2
0.3
0.4
Na+O-: Sodium azide added latex and maturated under anaerobic condition. Na-O+: No sodium azide added latex and maturated under aerobic condition. Na-O-: No sodium azide added latex and maturated under anaerobic condition.
Figure 61 Evolutions of wax (% w/w dry rubber) obtained from lipid extracts of (a)
RRIM600 and (b) PB235 clones during 28 days of maturation.
Wax
Maturation time (days) Maturation time (days)
% w
/w d
ry r
ub
ber
) %
w/w
dry
ru
bb
er)
% w
/w d
ry r
ub
be
r)
a) RRIM600 clone b) PB235 clone
Na-O-
Na+O-
Na-O+
Na-O-
Na-O+
Na+O-

155
Na+O-: Sodium azide added latex and maturated under anaerobic condition. Na-O+: No sodium azide added latex and maturated under aerobic condition. Na-O-: No sodium azide added latex and maturated under anaerobic condition.
Figure 62 Neutral lipid component evolutions (% w/w dry rubber) obtained from lipid
extracts of (a) RRIM600 and (b) PB235 clones during 28 days of maturation.
Maturation time (days) Maturation time (days)
% w
/w d
ry r
ub
be
r)
% w
/w d
ry r
ub
ber
) %
w/w
dry
ru
bb
er)
Triacylglycerol of furan fatty acid Free fatty acids γ-tocotrienol γ-tocotrienol ester I γ-tocotrienol ester II
Wax Sterol esters Sterols
a) RRIM600 clone b) PB235 clone
Na-O-
Na+O-
Na-O+
Na-O-
Na-O+
Na+O-

156
For PB235 (Figure 64), though the presence of high quantities of furan fatty
acid makes the evolution of other species more difficult to observe, same comment as that
done for RRIM 600 clone could be made: the composition and quantity of TFA remained
constant during maturation time for sodium azide added and anaerobic treatments while
change could be observed when the maturation was conducted in presence of oxygen. The
unsaturated C18 FA proportion and quantities decreased significantly after 7 days of
maturation.
Therefore in the presence of oxygen, it is confirmed that microorganisms are
able to perform a catabolic degradation (e.g. FA β-oxidation) that leads to the quantitative
disappearance of fatty acids in the lipid extracts. The targeted FA to be degraded are the
unsaturated one (i.e. C18:1; C18:2). It is also interesting to note that this disappearance
coincide with the elevation of pH to high level ( >8 ) that is only observed in the presence of
oxygen. Therefore, fatty acids could participate to the pH of the coagula (together with other
organic acids and ammonia). However, care must be taken in the interpretation because this
result concerns TFA (total fatty acids) and not FFA (free fatty acids). Finally, this decrease of
TFA quantity under aerobic condition fits well with the lipid extract quantity decrease that
was discussed previously (§5.1.2).
5.3.3 Unsaponifiable composition
The total unsaponifiable composition of lipid extract from RRIM600 and
PB235 rubber samples obtained from 3 maturation conditions were analyzed using gas
chromatography equipped with a mass spectrometer (GC-MS). The obtained absolute
quantities were calculated in the same way as it was for total fatty acids composition analysis.
The unsaponifiable composition of RRIM600 samples did not change
significantly whatever the maturation duration or the treatment as shown in Figure 65. As

157
Figure 63 Total fatty acid composition of RRIM600 lipid extracts obtained from (a) Na+O-,
(b) Na-O- and (c) Na-O+ maturation conditions during 28 days of maturation.
a) Na+O-
b) Na-O-
c) Na-O+
Maturation time (days)
% r
ela
tiv
e
Maturation time (days)
% T
ota
l fat
ty a
cid
s (w
/w d
ry r
ub
ber
)
Maturation time (days)
% T
ota
l fa
tty
acid
s (w
/w d
ry r
ub
ber
)
Maturation time (days)
% r
ela
tiv
e
Maturation time (days)
% r
ela
tiv
e
Maturation time (days)
% T
ota
l fa
tty
aci
ds
(w/w
dry
ru
bb
er)

158
Figure 64 Total fatty acid composition of PB235 lipid extracts obtained from (a) Na+O-, (b)
Na-O- and (c) Na-O+ maturation conditions 28 days of maturation.
a) Na+O-
b) Na-O-
c) Na-O+
Maturation time (days)
% r
ela
tiv
e
Maturation time (days)
% T
ota
l fa
tty
acid
s (w
/w d
ry r
ub
ber
)
Maturation time (days)
% T
ota
l fa
tty
acid
s (w
/w d
ry r
ub
ber
)
Maturation time (days)
% r
ela
tiv
e
Maturation time (days)
% r
ela
tiv
e
Maturation time (days)
% T
ota
l fa
tty
acid
s (w
/w d
ry r
ub
ber
)

159
described previously by Liengprayoon et al. (2013) the main unsaponifiable was β-sitosterol
(range 0.39-0.65%) followed by γ-tocotrienol (range 0.07-0.18 %). Concerning the absolute
quantities, the unsaponifiable amounted for approximatively 0.85% of rubber dry weight at
day 0 for all treatments. The quantitative evolution during maturation time is difficult to
assess with the obtained results as no clear trend can be detected for sodium azide added and
anaerobic treatments. However, for aerobic treatment, the total quantity of unsaponifiable
seems to decrease after 14 days (down to approximatively 0.65%).
Concerning PB235 clone, the results could not be obtained due to
methodological difficulties (uncomplete silylation).
6. In vitro antioxidant activity test of NR lipid extract by 2,2-di-phenyl-1-picrylhydrazyl
(DPPH) method
Figure 66 present the antioxidant activity of lipid extract samples obtained from
RRIM600 and PB235 clones. As demonstrated previously in Chapter 2 (§5.1), this activity is
expressed as the absolute value of the initial slope of the curve %DPPH remaining = f(time).
The obtained results are compared with 3 reference slope absolute values obtained from
standard solutions of γ-tocotrienol. Moreover, the green number indicates the quantity of
native tocotrienol present in the tested lipid extracts as determined by HPTLC analysis.
6.1 Comparison with uncontrolled experiment
As expected, the variance of the obtained data was much lower when the lipid
extracts were obtained from controlled maturation conditions. Whatever the clone and
maturation time, the lipid extracts obtained from aerobic controlled condition had higher
antioxidant activities than those of lipid extracts obtained from uncontrolled conditions.
As for uncontrolled conditions, it was observed that the RRIM600 clone lipid
extract showed a higher antioxidant activity compared with those from PB235 clone.
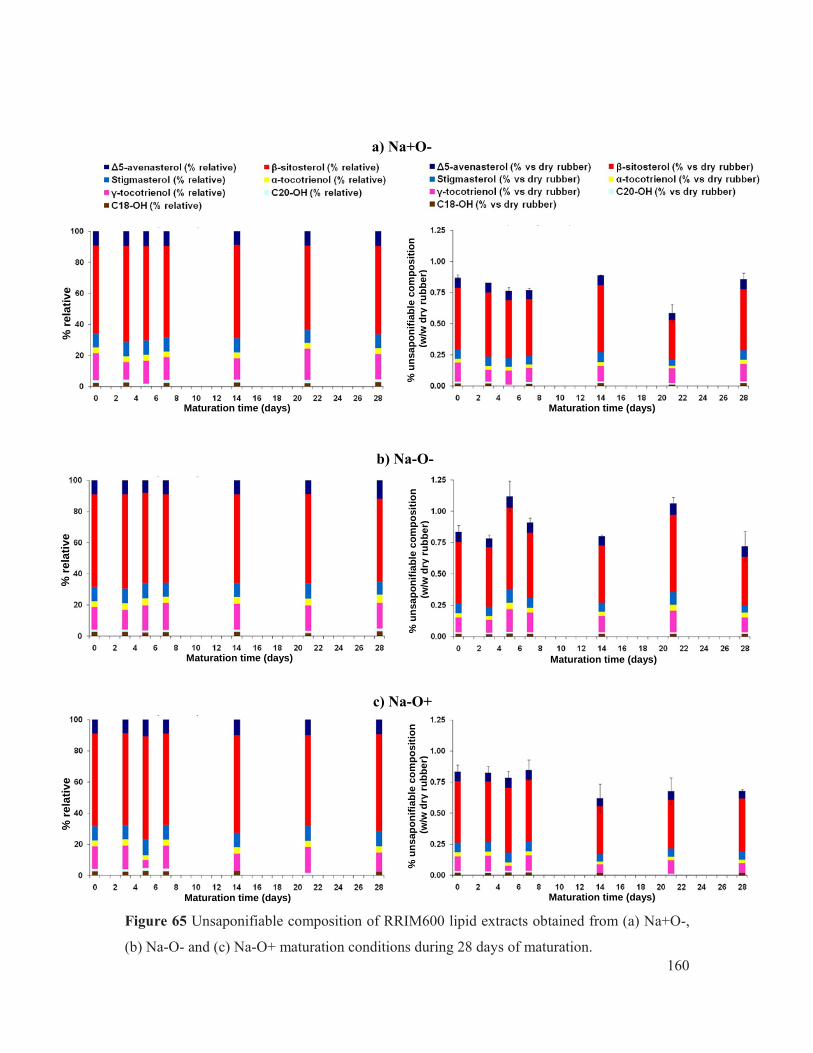
160
Figure 65 Unsaponifiable composition of RRIM600 lipid extracts obtained from (a) Na+O-,
(b) Na-O- and (c) Na-O+ maturation conditions during 28 days of maturation.
a) Na+O-
b) Na-O-
c) Na-O+
Maturation time (days) %
un
sap
on
ifia
ble
co
mp
osi
tio
n
(w
/w d
ry r
ub
be
r)
% r
ela
tiv
e
Maturation time (days)
% u
nsa
po
nif
iab
le c
om
po
siti
on
(
w/w
dry
ru
bb
er)
Maturation time (days)
% u
ns
apo
nif
iab
le c
om
po
sit
ion
(
w/w
dry
ru
bb
er)
Maturation time (days)
% r
ela
tiv
e
Maturation time (days)
% r
ela
tiv
e
Maturation time (days)

161
6.2 Evolution of lipids extract antioxidant activity under controlled conditions
6.2.1 Control treatment (Na+O-, acid coagulated samples)
During maturation time, the antioxidant activity of lipid extracts of sodium
azide added RRIM600 samples increased while that of PB235 lipid extracts seemed not to
change. For the latter, it is observed that the tested lipid extracts provided always
20 µg.mL-1 of native γ-tocotrienol, and that the level of activity remains slightly above the
level measured for 20 µg.mL-1 of γ-tocotrienol standard. It could mean that native γ-
tocotrienol makes most of the measured antioxidant activity. However, for RRIM600 the
evolution under this treatment is different. Indeed, while the quantity of native γ-tocotrienol
provided by the tested lipid extract remained at a level of 30 µg.mL-1 from day 3 to day 28,
the absolute value of the slope was abnormally low compared to standard at day 3 and
increased significantly until day 7. In this case, it seems that the antioxidant activity of the
extract is not driven by γ-tocotrienol alone. Other components that change in quantity during
the initial step of maturation under this sodium azide added treatment may also act as pro-
oxidants and antagonists of γ-tocotrienol antioxidant activity. Indeed it is well known that the
antioxidant activity of a mixture differs from the activity of the individual components (Choe
and Min, 2009 ; Wang et al., 2012). In this case, it could be noted that the quantity of free
sterols decreased significantly in the early stage of maturation (see Figure 60). However this
decrease was also observed for PB235 lipid extract.
6.2.2 Anaerobic maturation condition (Na-O-, natural coagulation day 3-28)
The lipid extract from RRIM60 sample maturated under anaerobic condition
tended to show an increasing trend of antioxidant activity during maturation time after an
initial decrease until day 5. However those variations are not significant.
Concerning PB235 extract, and except for day 21, the level of antioxidant
activity stayed constant at an equivalent of 20 µg.mL-1 γ-tocotrienol standard while
γ-tocotrienol provided by the tested lipid extract did not exceed 10 µg.mL-1. It means that

162
another components acted as an additional antioxidant or had a synergetic effect on
γ-tocotrienol antioxidant activity.
6.2.3 Aerobic maturation condition (Na-O+, natural coagulation day 3-28)
For both clones, and whatever maturation time, the evolution of antioxidant
activity of lipid extracts that were observed in absence of oxygen (Na-O-) are similar in the
presence of oxygen (Na-O+). However it noted that the real content of free γ-tocotrienol in
the tested lipid extracts were higher under aerobic conditions.
7. Conclusion
Under controlled maturation conditions followed by a TSR like process, the evolution
of every followed indicators (bulk properties, mesostructure and lipids components) were
studied and the variance of obtained data was much lower than that of the data obtained from
uncontrolled conditions (USS/RSS like process). The effect of presence of microorganisms
on NR structure and properties was studied by comparing control treatment where the growth
of most of microorganisms in latex was inhibited by a biocide addition (sodium azide, Na+)
and the other two other treatments conducted under anaerobic and aerobic conditions.
Generally, higher evolutions of the followed indicators were obtained on non-biocide added
treatments especially under aerobic maturation condition.
pH values of coagula increased during maturation, and the maximum increase was
under aerobic condition. The water content of the fresh crepe ready to be dried increased with
maturation. Initial plasticity (P0) and gel content increased at the beginning of the maturation
especially for RRIM600 clone which contains a higher amount of short chain of
polyisoprene. P30 values tended to decrease under aerobic maturation condition. This
decrease was absent when the microorganism was inhibited. Lipid quantity and quality
evolved during maturation. Those evolutions were maximal under aerobic condition. In these
conditions, the total quantity of lipid extract decreased, the free FA content increased at early
stage of maturation, later on the TFA content decreased (the unsaturated FA being the first to
disappear), the unsaponifiable quantity decreased at a lesser extent. Concerning extractable

163
free γ-tocotrienol, it was found that their quantity did not change much during maturation,
while their esterified form get enriched in saturated fatty acid during maturation. The
antioxidant activity measured by DPPH test correlated well with free γ-tocotrienol
concentration but not with the resistance of rubber to thermo-oxidation assessed by P30 or
PRI.

164
Na+O-: Sodium azide added latex and maturated under anaerobic condition. Na-O+: No sodium azide added latex and maturated under aerobic condition. Na-O-: No sodium azide added latex and maturated under anaerobic condition.
Figure 66 Absolute value of initial slope obtained from (a) RRIM600 and (b) PB235 lipid
extracts. The numbers in green are the free γ-tocotrienol content in the lipid solution
(µg.mL-1) calculated from HPTLC results.
44.1 30.3
31.1
32.3
31.6 31.7 31.1
49.0
49.0 20.6
20.7
25.9
34.7 43.243.5
25.6
20.5
20.9 20.4 25.8 31.3
20.2 18.218.5
18.8 18.1 19.0
20.7
20.7 18.1 27.9
15.1
12.413.1
12.012.3
12.0
11.9 14.8
Ab
so
lute
va
lue
of
in
itia
l slo
pe
(%
DP
PH
rem
.min
-1)
Ab
so
lute
va
lue
of
in
itia
l slo
pe
(%
DP
PH
rem
.min
-1)
Ab
so
lute
va
lue
of
in
itia
l slo
pe
(%
DP
PH
rem
.min
-1)
Maturation time (days) Maturation time (days)
a) RRIM600 clone b) PB235 clone
Na-O-
Na+O-
Na-O+
Na-O-
Na-O+
Na+O-
Lipid extracts 1 mg.mL-1 γ-tocorienol standard 10 µg.mL-1
γ-tocorienol standard 50 µg.mL-1 γ-tocorienol standard 20 µg.mL-1
Reference level of γ-tocorienol standard 10 µg.mL-1
50 µg.mL-1
20 µg.mL-1
50 µg.mL-1
20 µg.mL-1
10 µg.mL-1
50 µg.mL-1
20 µg.mL-1
10 µg.mL-1
50 µg.mL-1
20 µg.mL-1
10 µg.mL-1
50 µg.mL-1
20 µg.mL-1
10 µg.mL-1
50 µg.mL-1
20 µg.mL-1
10 µg.mL-1

165
GENERAL CONCLUSION
This present work aimed at better understanding the effects of NR native antioxidants
on the physical properties of rubber, especially against oxidative degradation. To do so, the
evolution of native antioxidants during natural rubber maturation was followed. Indeed,
maturation is known in industrial practice to alter the physical properties of NR. This
evolution was followed along two maturation conditions (USS/RSS like and TSR like
conditions) using different lipid characterization techniques including HPTLC, GC-FID/MS
and HPLC-MS, as well as by in vitro antioxidant activity assessment (DPPH test). In parallel,
the change of physical properties was followed the determination of standard parameters (P0,
P30 and PRI). Moreover, due to the inter relationships between structure and properties,
mesostructure characteristics (MMD, Mw, Mn and gel content) of maturated NR samples were
also studied.
Firstly, rubber samples were prepared following a USS/RSS-like process. All
parameters concerning sample preparation had to be developed in order to obtain degraded
NR samples with a wide range of physical properties that could allow the study of
correlations with the evolution of antioxidants and/or lipids molecules. Though following
industrial USS/RSS like conditions, samples were prepared in a mini-sheet form using
500 mL latex instead of 3 L as recommended by RRIT. Minimizing the latex quantity
allowed to study more parameters and to cope with all physical and chemical analyses. The
optimum protocol to prepare sheet samples corresponded to a dilution of 500 mL of latex
with 333 mL of water and a coagulation either with formic acid (control) or by natural
coagulation (maturation). A maturation period of 14 days was found to be sufficient to
generate different physical properties. Both control and maturated samples were dried under
outdoor air and smoke drying conditions. It was found that smoke drying allowed the full
sample drying even if a longer time was required for maturated samples. Concerning physical
properties, smoke drying improved P30 and therefore PRI and moreover, less variation of data
was obtained compared to outdoor air drying condition. Besides the optimization of sample
preparation, a lipid analysis technique to follow the change of composition of maturated
samples was also developed. HPLTC was chosen as it could provide both qualitative and
166
quantitative results. With two different mobile phases, hexane/diethyl ether/acetic acid at the
ratio of 90:10:1 (v/v/v) and 80:20:1 (v/v/v), both non-polars (wax and sterol esters) and more
polar lipids (free sterols, free fatty acids, free -tocotrienol and TGF) could be well separated.
Indeed, repeatability and reproducibility measurements confirmed the effectiveness of this
analysis method including its high throughput. It was thus chosen for rapid lipid qualification
and quantification. In addition, an HPLC-MS analysis method was specifically developed to
analyze antioxidant molecules, -tocotrienol and its derivatives. In the case of antioxidant
activity assays, different solvents for DDPH and lipid solubilization were also tested since
methanol, the conventional solvent, could not completely solubilize lipid samples.
Chloroform/ethanol (1:1, v/v) was found to be the most suitable solvent mixture for both
DPPH and lipids. Moreover, to reduce the analysis time and sample size compared to
conventional spectrophotometry, instead of using cuvettes the DPPH assay was performed in
microplates.
Accordingly, samples from RRIM600 and PB235 clones along 14 days of maturation
were prepared and analyzed under these optimized conditions. At the initial state of
coagulation, pH of both coagula and sera from two samples followed the general tendency
previously reported by displaying a decrease of pH from 6.5 to 4.9 during the first 24 h
reported to be due to carbohydrate fermentation, followed by an increase up to 9 which could
be due to protein degradation by microbial activity. No obvious clonal difference was
observed during the coagulation and laminated sheet preparation steps besides a higher water
content in PB235 laminated sheets (30%) than in that of RRIM600 (20%) in the latest days of
maturation. Finally, though smoke drying was found to be more effective, it appeared that
under outdoor air drying interesting results were evidenced. For bulk properties, P0 of
outdoor air and smoke dried samples from RRIM600 clone decreased similarly during 9 days
of maturation. However, P0 after 14 days of maturation could not be determined because of
an excessive degradation of rubber after the long drying time taken for outdoor drying.
Meanwhile, when using smoke drying, in which sample was dried in a shorter period, a
significant decrease of P0 and PRI could be observed. This implied that higher degradation
occurred in outdoor air drying than in smoke drying. The bulk properties of rubber samples
from PB235 clone showed a similar evolution as that from RRIM600 concerning P0 and PRI.

167
What differentiated both clones in terms of bulk properties were the initial values of P0 and
their evolution along maturation time. Indeed, P0 and PRI of PB235 samples during
maturation varied less compared to RRIM600 clone. PB235 is a unimodal clone the rubber of
which contains much less short polyisoprene chains than that of RRIM600 clone. Higher
molar masses in PB235 clone rubber explain the higher initial value of P0, while the presence
of short chains in RRIM600 clone rubber explained the apparent crosslinking phenomenon.
Concerning the evolution of lipid extract composition, lipid content was not found to be
dependent on maturation. Nevertheless, smoke dried samples tended to have a higher lipid
content compared to outdoor dried samples. This could be due to the shorter drying duration
of smoke drying that inhibited further degradation while the longer time as well as the higher
water activity in outdoor air drying allowed microbial degradation. For the composition,
lipids seemed to evolve faster under outdoor air drying. Esterification and hydrolysis seemed
to occur concomitantly as observed from the increase and decrease of certain esterified lipids
at different stages of maturation. Globally, the composition of lipids from the two clones
changed similarly along maturation, with only differences in the type of lipids according to
clonal origin. To relate the changes of bulk properties and lipids with antioxidant activity,
lipids extracts from both RRIM600 and PB235 maturated samples were measured for their
antioxidant activity using the DPPH test. The results indicated that obtained lipid extract
contained component(s) that can scavenge the DPPH free stable radical. In addition, at the
same concentration, the antioxidant activity of lipids from clone PB235 was lower than that
of the extracts from RRIM 600 whatever the maturation time or the drying condition. Though
a positive result was observed from DPPH, a clear evolution with time was not obtained,
which could possibly be due to the variation of the lipid components. Though interesting
tendencies were observed in terms of physical properties of rubber, lipid composition and
antioxidant activity of the lipid extracts, the variance of the obtained data made the
interpretation of results very delicate. Therefore, it was decided to change the experimental
strategy and to perform another trial under strictly controlled maturation conditions followed
by a TSR like processing.
In this trial, latex from two Hevea clones -RRIM600 and PB235- were coagulated and
maturated under 3 controlled conditions - control (sodium azide added, no oxygen, acid
coagulation), anaerobic (no sodium azide added, no oxygen) and aerobic (no sodium azide

168
added, oxygen). From the obtained dry NR, the evolutions of indicators from three study
levels - bulk properties, mesostructure and lipid composition - were followed along
maturation time. For all measured indicators, a lower variance of the value was obtained as
expected with the controlled samples compared to those obtained in uncontrolled maturation
conditions.
A marked clonal character was observed in the indicator values from every study
levels during 28 days of maturation. It confirmed that having contrasted material help to
interpret obtained results. Indeed previous maturation studies (Intapun, 2009 ; Intapun et al.,
2010) dealt only with RRIM600 clones.
Concerning pH, after a decrease from the initial value (pH of fresh latex) to the lowest
one at 3 days of maturation, pH increased with maturation time for both clones. The higher
increase of pH was observed when the coagula were maturated under aerobic condition
whatever the clone. This could be linked with the protein degradation (NH3 release) and/or
organic acids disappearance by aerobic microorganism metabolism. Moreover it was
observed that pH values of PB235 coagula after 3 days of maturation were lower than that of
RRIM600. This could be explained by a higher free fatty acids content in PB235 clone.
Indeed, these free fatty acids (mainly furan fatty acid) are released by native Hevea enzymes
during early stage of maturation.
The dry matter of laminated coagula was estimated by comparing the weight of fresh
and dry laminated coagula. The results showed that under anaerobic conditions and for both
Na+ and Na- samples, the water content of the crepes seemed not to depend on the
maturation time from two clones. Meanwhile, under aerobic maturation conditions (Na-O+),
the water content increased significantly with time. This could be linked with microbial
activity, especially from aerobic microorganisms, which is known to be correlated with water
retention in the coagula (Intapun et al., 2010).
Concerning the evolution of physical properties, when the microbial activities were
inhibited the properties (P0, P30 and PRI) did not change much during time whatever the
clone. When microorganism activities were not inhibited, especially under aerobic condition,

169
a higher and faster drop of P30 was observed and resulted in a decrease of PRI for both
clones. This is most probably due to a higher degradation level of native antioxidants because
of the presence of oxygen. A different evolution of physical properties between two clones
was observed. Whatever maturation condition, P0 value of RRIM600 samples increased
during the first few days of maturation while for PB235, P0 remained constant over time. This
could be explained by the fact that these two rubber clones have different molar mass
distributions (unimodal for PB235 and bimodal for RRIM600 clones) and that the short
polyisoprene chains are reported to be involved in rubber reticulation (formation of gel,
increase of P0). Concerning P30 and PRI, it was observed that the value of these properties in
samples obtained from PB235 were lower than that from RRIM600 rubber whatever the
condition and time.
Concerning mesostructural analysis, the total gel content of both clones was found to
increase during during first few days when the microorganism activities were inhibited.
Therefore gel formation could be due to a phenomenon occurring after coagulation and not
directly correlated to microbial activity. When the microbial activities were not inhibited, the
evolution of gel remained similar as with the sodium azide added treatment. This evolution of
gel was well correlated with the evolution of P0 values during time.
When microorganism activities were inhibited, Mw and Mn, for RRIM600 clone
increased significantly in the first days of maturation while when microorganism activities
were not inhibited, Mw and Mn decreased during maturation. Microorganisms could therefore
contribute to the chain scission phenomena during maturation. In the case of PB235 clone,
Mw and Mn did not change significantly during maturation whatever the treatment though a
non significant decreasing trend was observed for anaerobic treatment.
From this study, whatever maturation condition and time the lipid extract quantity of
samples from PB235, which was classified as a high lipids containing rubber clone
(Liengprayoon et al., 2013) was higher than that issuing from RRIM600 clone. Among
maturation conditions, it was observed that the lipids content decreased significantly in the
presence of oxygen for samples from both clones. For RRIM600, the lipid content decreased
from 1.94% (day3) to 1.61% (day 28) and for PB235 clone, decreased from 3.31% (day 3) to

170
2.51% (day 28). Therefore a major factor of NR lipids degradation could be linked to aerobic
microorganism activity and the presence of oxygen during maturation.
Neutral lipid evolution during 28 days of maturation was characterized both in quality
and quantity. Concerning neutral lipids quality, analyzed using TLC, the main observed
change during maturation concerned free fatty acids and TGF contents for both clones. The
hydrolysis of TGF to furan fatty acids was found to be the fastest under aerobic conditions.
HPTLC analyses of neutral lipids showed that the higher evolution of the amount of each
component during maturation was observed when the microorganism activities were not
inhibited. Gamma-tocotrienol and its derivatives were especially targeted during this study
because of their known antioxidant activity. They were found to be present in free or
esterified forms in rubber. Two γ-tocotrienol esters were identified: ester I, rich in saturated
fatty acids and ester II, rich in unsaturated fatty acid. Samples from PB235 clone had a lower
γ-tocotrienol content than that from RRIM600. This could explain the lower P30 value of
PB235 rubber. A different evolution of γ-tocotrienol and its esters was observed between
three treatments. When microorganism activities were inhibited, in the case of RRIM600
sample, the abundance of γ-tocotrienol and its esters seemed to decrease during the first
3 days and stayed constant after that until 28 days. Meanwhile, for PB235, the concentration
of γ-tocotrienol ester I showed a slight decrease during first 5 days. When microorganism
activities were not inhibited, a slight increase of free γ-tocotrienol content after 14 days and a
symmetrical evolution of γ-tocotrienol esters I and II were observed whatever the clone.
Regarding total fatty acid composition (TFA), linoleic acid (C18:2) was the major
fatty acid found in RRIM600 (40% w/w total fatty acids at day 0) while PB235 clone
contained mainly furan fatty acids (70% w/w total fatty acids at day 0). During maturation,
the composition and quantities of TFA remained constant under anaerobic condition from
both clones. Meanwhile, when the maturation was performed in the presence of oxygen, the
composition and quantities of TFA decreased significantly due to the disappearance of
unsaturated FA (especially C18:2).

171
For unsaponifiable composition, -sitosterol was the main unsaponifiable followed by
γ-tocotrienol whatever the clone, maturation condition and time. For RRIM600 samples no
clear evolution of the quantity of unsaponifiable was observed under anaerobic condition
while it seemed to decrease during time under aerobic condition (from 0.85% (day 3) to
0.65% (day 28) w/w dry rubber). Unfortunately, in the case of PB235 clone the results could
not be obtained due to methodological difficulties (uncomplete silylation).
Antioxidant activity of lipid extract was assessed by the optimized DPPH method.
The obtained results correlated well with free γ-tocotrienol content. The presence of this
molecule explains most of the antioxidant activity of the extract but not all. It can be assumed
that other molecules in the extract have antagonist or synergetic effect on this activity.
RRIM600 lipid extracts showed a higher antioxidant activity than that from PB235 whatever
the maturation condition and time. This could be linked to the known lower resistance to
thermo-oxidation of the rubber from PB235 clone. However, the evolution of antioxidant
activity along maturation time stayed stable (PB235) or even increased (RRIM600) while P30
and PRI values decreased. Therefore, no direct link was evidenced between the antioxidant
activity of the lipids extracted from rubber and the ability of the material to resist to thermo-
oxidation. Indeed, the in vitro conditions of measurement were far from those occurring
inside solid state rubber. Moreover, the localization of antioxidants in rubber and especially
their physical possibility to interact with the double bond of polyisoprene should be
investigated to understand more what drives the drop of P30 along maturation time. In
addition, the lipid analyses were conducted on extractable molecules only. Non extractable
lipids or other molecules belonging to more polar non-isoprene species (proteins,
polyphenols, etc…) could also influence the resistance to thermo-oxidation.
It is worth mentioning that all the informations from characterized lipids, especially
the potential antioxidant molecules as well as structure and properties, allowed us to
understand better their relationships. However, the possible synergistic effect of lipids during
maturation would be worth studying further. Developing a method to determine the
oxidation-antioxidation reactions with other approaches closer to the in vivo condition would
also be useful.

172
REFERENCES
Abad, L. V., L. S. Relleve, C. T. Aranilla, A. K. Aliganga, C. M. San Diego and A. M. dela Rosa. 2002. Natural antioxidants for radiation vulcanization of natural rubber latex. Polym. Degrad. Stab. 76(2): 275-279.
ASTM. 2000. D 3616-95: Standard test method for rubber, raw - determination of gel,
swelling index, and dilute solution viscosity. ASTM International standard worldwide, United states.
Audley, B. G. and C. H. Tan. 1968. The uptake of ergonthioneine fron the soil into the latex of Hevea brasilensis. Phythochemistry 7: 1999-2000.
Bendini, A., L. Cerretani, L. Pizzolante, T. G. Toschi, F. Guzzo, S. Ceoldo, A. M. Marconi,
F. Andreetta and M. Levi. 2006. Phenol content related to antioxidant and antimicrobial activities of Passiflora spp. extracts. Eur. Food Res. Technol. 223: 102-109.
Bonfils, F. and C. Char. 2005. Natural Rubber : GPC/SEC Analysis.In Encyclopedia of
chromatography. London, UK, CRC Press. 1: 541-542. Bonfils, F., C. Char, Y. Garnier, A. Sanago and J. Sainte-Beuve. 2000. Inherent molar mass
distribution of clones and properties of crumb natural rubber. J. Rubber. Res. 3(3): 164-168.
Boucher, M. and G. Carlier. 1964. Effect of non-rubber ingredients on ageing. Rev. gen.
Caoutch. 41(9): 1297-1308. Brewer, M. S. 2011. Natural Antioxidants: Sources, Compounds, Mechanisms of Action, and
Potential Applications. Compr. Rev. Food Sci. F. 10(4): 221-247. Büsing, A. and W. Ternes. 2011. Separation of α-tocotrienol oxidation products and eight
tocochromanols by HPLC with DAD and fluorescence detection and identification of unknown peaks by DAD, PBI-EIMS, FTIR and NMR. Anal. Bioanal. Chem. 401: 2843–2854.
Campbell, D. S. and K. N. G. Fuller. 1984. Factors Influencing the Mechanical Behavior of
Raw Unfilled Natural Rubber. Rubber Chem. Technol. 57(1): 104-117. Choe, E. and D. B. Min. 2009. Mechanisms of Antioxidants in the Oxidation of Foods.
CRFSFS 8: 345-358. Chow, C. K. and H. H. Draper. 1970. Isolation of γ-Tocotrienol Dimers from Hevea Latex.
Biochemistry 9(2): 445-450.

173
Cook, A. S. and B. C. Sekhar. 1954. Fractions from Hevea brasiliensis latex centrifugation at 59,000 g. Rubber Chem. Technol. 27(1): 297-301.
D'Auzac, J. and J. L. Jacob. 1989. The composition of latex from Hevea brasiliensis as a
laticiferous cytoplasm.In Physiology of rubber tree latex. Florida, USA, CRC Press 59-96.
De, S. K. and J. R. White. 2001. Rubber Technologist's Handbook. Rapra Technology
Limited, Shropshire, UK. Dogadkin, B. A. and V. N. Kuleznev. 1960. Gel formation in the mastication of natural
rubber and its influence of vulcanizate strength. Rubber Chem. Technol. 33: 940-941.
Dörmann, P. and C. Benning. 2002. Galactolipids rule in seed plants. Trends Plant Sci. 7(3):
112-118. Dubascoux, S., C. Thepchalerm, E. Dubreucq, S. Wisunthorn, L. Vaysse, S.
Kiatkamjornwong, C. Nakason and F. Bonfils. 2012. Comparative study of the mesostructure of natural and synthetic polyisoprene by size exclusion chromatography-multi-angle light scattering and asymmetrical flow field flow fractionation-multi-angle light scattering. J. Chromatogr. A 1224: 27-34.
Dupont, J., F. Moreau, C. Lance and J. L. Jacob. 1976. Phopholipid composition of the
membrane of lutoids from Hevea brasiliensis latex. Phythochemistry 15: 1215-1217.
Ehabe, E., Y. Le Roux, F. Ngolemasango, F. Bonfils, G. Nkeng, B. Nkouonkam, J. Sainte-
Beuve and M. S. Gobina. 2002. Effect of maturation on the bulk viscosity and molecular chain length of cuplump natural rubber. J. Appl. Polym. Sci. 86(3): 703-708.
Ehabe, E., G. E. Nkeng and F. Bonfils. 2006. Mechanistic proposals for variations in the
macrostructure of natural rubber. A review. Recent Res. Dev. Bioener. 4: 81-107. Ekpini, A., J. Sainte-Beuve, F. Bonfils, H. De Livonnière and B. Nkouonkam. 2001. Changes
in certain physico-chemical criteria of natural rubber depending on production conditions. 8th International Seminar on Elastomers, Université du maine, Le Mans, France. 142-146.
Eng, A. H. and Y. Tanaka. 1993. Structure of natural rubber. Trends. Polym. Sci. 3: 493-
513. Eng, A. H., J. Tangpakdee, S. Kawahara and Y. Tanaka. 1997. Distribution and origin of
abnormal groups in natural rubber. J. Nat. Rubber Res. 12(1): 11-20.

174
Fagali, N. and A. Catalá. 2008. Antioxidant activity of conjugated linoleic acid isomers, linoleic acid and its methyl ester determined by photoemission and DPPH• techniques. Biophys. Chem. 137: 56-62.
Flora, S. J. S. 2009. Structural, chemical and biological aspects of antioxidants for strategies
against metal and metalloid exposure. Oxid. Med. Cell. Longev. 2(4): 191-206.
Frey-Wyssling, A. 1929. Microscopic investigations on the occurrence of resins in Hevea latex. Arch. Rubber Cult. 13: 392-394.
Fri, P. S., G. E. Nkeng and E. Ehabe. 2007. Effects of natural coagula maturation on the
processability, cure, and mechanical properties of unfilled vulcaniztes of Hevea natural rubber. J. Appl. Polym. Sci. 103(4): 2359-2363.
Gan, S. N. 1996. Storage hardening of natural rubber. J. Macromol. Sci., Pure Appl. Chem.
33: 1939-1948. George, P. J. and C. Kuruvilla Jacob. 2000. Natural Rubber: Agromanagement and Crop
Processing. Rubber Research Institute of India, Kottayam. Hasma, H. 1984. Lipids in the latex and rubber of Hevea brasiliensis Muell Arg and their
effect on some properties of natural rubber. PhD. Ghent University. Hasma, H. and A. B. Othman. 1990. Role of some non rubber constituents on thermal
oxidative ageing of natural rubber. J. Nat. Rubber Res. 5(1): 1-8. Hasma, H. and A. Subramaniam. 1986. Composition of lipids in latex of Hevea brasiliensis
clone RRIM 501. J. Nat. Rubber Res. 1(1): 30-40. Hawkins, W. L. 1964. Thermal and oxidative degradation of polymers. Polym. Eng. Sci.
4(3): 187-192. Hayashi, M., S. Nakade, M. Sunagawa, T. Kano, K. Tsukamoto and Y. Tanaka. 1995. Highly
purified natural rubber : III. biological properties. IRC 1995, Kobe, Japan. 251-254. Ho, C. C., A. Subramaniam and W. M. Yong. 1975. Lipid associated with the particles in
Hevea latex. Proc. Int. Rubber Conf. 2: 441–456. Horvath, G., L. Wessjohann, J. Bigirimana, M. Jansen, Y. Guisez, R. Caubergs and N.
Horemans. 2006. Differential distribution of tocopherols and tocotrienols in photosynthetic and non-photosynthetic tissues. Phytochemistry 67: 1185-1195.
Huang, D., O. Boxin and R. L. Prior. 2005. The Chemistry behind Antioxidant Capacity
Assays. J. Agric. Food. Chem. 53(6): 1841-1856.

175
Intapun, J. 2009. Study of the effects of biological maturation of coagula of Hevea brasiliensis latex on dry rubber properties. PhD. Prince of Songkla University and Montpellier SupAgro.
Intapun, J., J. Sainte-Beuve, F. Bonfils, V. Tanrattanakul, E. Dubreucq and L. Vaysse. 2009.
Characterisation of natural rubber cup coagula maturation conditions and consequences on dry rubber properties. J. Rubber Res. 12(4): 171-1841
Intapun, J., J. Sainte-Beuve, F. Bonfils, V. Tanrattanakul, E. Dubreucq and L. Vaysse. 2010.
Effect of Microorganisms During the Initial Coagulum Maturation of Hevea Natural Rubber. J. Appl. Polym. Sci. 118: 1341-1348.
IRSG. 2014. Rubber Statistical Bulletin Oct-Dec 2014. The International Rubber Study
Group. 69:4-6 Jacob, J. L., J. D'Auzac and J. P. Prévot. 1993. The composition of natural latex from Hevea
brasiliensis. Clin. Rev. Allerg. 11(3): 325-337. Jaspers, P. and J. Kangasjärvi. 2010. Reactive oxygen species in abiotic stress signaling.
Physiol. Plant. 138(4): 405-413. John, C. K. 1966. Metabolism of quebrachitol and other carbohydrates by Hevea latex
bacteria. J. Rubber Res. Malaysia 19(4): 219-225. Kamal-Eldin, A. and L. A. Appelqvist. 1996. The chemistry and antioxidant properties of
tocopherols and tocotrienols. Lipids 31(7): 671-701. Kharrazi, H., A. Vaisi-Raygani, Z. Rahimi, H. Tavilani, M. Aminian and T. Pourmotabbed.
2008. Association between enzymatic and non-enzymatic antioxidant defense mechanism with apolipoprotein E genotypes in Alzheimer disease. Clin. Biochem. 41(12): 932-936.
Kuriakose, B. and K. M. George. 2000. Crepe rubbers.In Natural Rubber:
Agromanagement and crop processing. Kottayam, India, Rubber Research Institute of India 399-413.
Kuriakose, B. and K. T. Thomas. 2000. Ribbed sheets.In Natural Rubber: Agromanagement
and Crop Processing. Kottayam, Rubber Research Institute of India 386-398. Kush, A. 1994. Isoprenoid biosynthesis: the Hevea factory. Plant Physiol. Biochem. 32:
761-767. Laguerre, M., L. J. López-Giraldo, J. Lecomte, B. Baréa, E. Cambon, P. F. Tchobo, N.
Barouh and P. Villeneuve. 2008. Conjugated autoxidizable triene (CAT) assay: A novel spectrophotometric method for determination of antioxidant capacity using triacylglycerol as ultraviolet probe. Anal. Biochem. 380: 282-290.

176
Laguerre, M., L. J. López-Giraldo, J. Lecomte and P. Villeneuve. 2009. Widespread methods
and new analytical approaches in antioxidant evaluation. inform 20(5): 328-332. Le Roux, Y., E. Ehabe, J. Sainte-Beuve, J. Nkengafac, J. Nkeng, F. Ngolemasango and S.
Gobina. 2000. Seasonal and clonal variations In the latex and raw rubber of Hevea brasiliensis. J. Rubber Res. 3(3): 142-156.
Leclercq, J., F. Martin, C. Sanier, A. Clément-Vidal, D. Fabre, G. Oliver, L. Lardet, A. Ayar,
M. Peyramard and P. Montoro. 2012. Over-expression of a cytosolic isoform of the HbCuZnSOD gene in Hevea brasiliensis changes its response to a water deficit. Plant. Mol. Biol. 80(3): 255-272.
Lee, S. 1993. Determination of gel content in polymers. TRIP 1(10): 303-309. Liengprayoon, S. 2008. Characterization of lipid composition of sheet rubber from Hevea
brasiliensis and relations with its structure and properties. PhD. Kastesart University and Montpellier SupAgro.
Liengprayoon, S. 2008. Characterization of lipid composition of sheet rubber from Hevea
brasiliensis and relations with its structure and properties. Ph.D. Kasetsart uUniversity.
Liengprayoon, S., J. Chaiyut, K. Sriroth, F. Bonfils, J. Sainte-Beuve, E. Dubreucq and L.
Vaysse. 2013. Lipid compositions of latex and sheet rubber from Hevea brasiliensis depend on clonal origin. Eur. J. Lipid Sci. Technol. 115(9): 1021-1031.
Liengprayoon, S., K. Sriroth, E. Dubreucq and L. Vaysse. 2011. Glycolipid composition of
Hevea brasiliensis latex. Phytochemistry 72(14-15): 1902-1913. Lowe, J. S. 1959. Formation of volatile fatty acids in ammonia-preserved natural latex
concentrate. Trans. Inst. Rubb. Ind. 35(1): 10–18. Mathew, N. M. and N. M. Claramma. 2000. Latex preservation and concentration.In
Natural Rubber: Agromanagement and Crop Processing. Kottayam, India, Rubber Research Institute of India 415-433.
Moir, G. F. J. 1959. Ultracentrifugation and staining of Hevea latex. Nature 184: 1626-1628. Moreno, R. M. B., M. Ferreira, P. S. Goncalves and L. H. Mattoso. 2005. Technological
properties of latex and natural rubber of Hevea brasiliensis clones. Sci. Agric. 62(2): 122-126.
Morimoto, M. 1985. Effect of non-rubber ingradients in natural rubber on ageing properties.
Proceeding of the International Rubber Conference Kuala Lumpur. 61-72.

177
Nadarajah, M., A. S. L. Tirimanne, A. Coomarasamy and S. Kasinathan. 1971. Some naturally occuring antioxidants in Hevea brasiliensis latex. Q. Jl. Rubb. Ret. Inil. Ceylon 48: 202-211.
Nair, N. U. 2000. Biochemistry and physiology of latex production.In Natural Rubber:
Agromanagement and Crop Processing. Kottayam, India, Rubber Research Institute of India 249-260.
Nair, N. U., M. Thomas, S. Sreelatha, S. P. Simon, K. P. Vijayakumar and P. J. George.
1993. Clonal variation in lipid composition in the latex of Hevea brasiliensis and its implication in latex production. J. Nat .Rubber Res. Indian 6(1-2): 143-145.
Nawar, W. F. 1996. Lipids.In Food Chemistry. New York, U.S.A., Marcel Dekker, Inc. 250-
320. Ngolemasango, E. F., M. Bennett and J. Clarke. 2006. Kinetics of the effect of ageing on
tensile properties of a natural rubber compound. Journal of Applied Polymer Science 102: 3732–3740.
Ngolemasango, F., E. Ehabe, C. Aymard, J. Sainte-Beuve, B. Nkouonkam and F. Bonfils.
2003. Role of short polyisoprene chains in storage hardening of natural rubber. Polym. Int. 52(8): 1365-1369.
Nwanorh, K. O. 1998. Enhancement of resistance to oxidative degradation of natural rubber
through latex degradation. Chin. J. Polym. Sci. 16(2): 170-175. Ohya, N. and T. Koyama. 2001. Biosynthesis of natural rubber and natural
polyisoprenoids.In Biopolymers. Weinheim, Germany, John Wiley and Sons, Inc. 71-104.
Percival, M. 1998. Antioxidants. Clinical nutrition insight 31: 1-4. Premakumari, D. and A. O. N. Panikka. 1992. Anatomy and ultracytology of latex
vessels.In Natural Rubber: Biology, Cultivation and Technology. Amsterdam, Netherlands, Elsevier Science Publishers B.V. 67-87.
Rodphukdeekul, S., S. Liengprayoon, V. Santisopasri, K. Sriroth, F. Bonfils, E. Dubreucq
and L. Vaysse. 2008. Effects of Smoking on Lipid Content, Macromolecular Structureand Rheological Properties of Hevea brasiliensis Sheet Rubber. Kasetsart J. (Nat. Sci.) 42: 306-314.
Rodriguez, M. A. and M. A. De Paoli. 1985. The chemical effects of photo-oxidation on
isoprene rubber. Eur. Polym. J. 21(1): 15-23. Rojruthai, P., L. Tarachiwin, J. T. Sakdapipanich and Y. Tanaka. 2009. Phospholipids
associated with NR molecules inducing long-chain branching Part II. KGK 62(7-8): 399-404.
178
Rose, K. and A. Steinbuchel. 2005. Biodegradation of Natural Rubber and Related Compounds: Recent In Sights into a Hardly Understood Catabolic Capability of Microorganisms. Appl. Environ. Microbiol. 71(6): 2803–2812.
RRIT.2014.Thai Rubber Statistics: NR Export by Types. Available source: http://www.rubberthai.com/statistic/eng/eng_stat.htm. September
15th, 2014 Sakaki, T., Y. Hioki, M. Kojima, A. Kuga and Y. Tanaka. 1995. Highly purified natural
rubber : I. Physical properties. IRC 1995, Kobe, Japan. 243-246. Sakamoto, A. and N. Murata. 2002. The role of glycine betaine in the protection of plants
from stress: clues from transgenic plants. Plant Cell Environ. 25(2): 163-171. Salomez, M., M. Subileau, J. Intapun, F. Bonfis, J. Sainte-Beuve, L. Vaysse and E.
Dubreucq. 2014. Micro-organisms in latex and natural rubber coagula of Hevea brasiliensis and their impact on rubber composition, structure and properties. J. Appl. Microbiol. 117(4): 921-929.
Sekhar, B. C. 1962. Inhibition of hardening in natural rubber. Rubber Chem. Technol. 35:
889-895. Sen, C. K., S. Khanna and S. Roy. 2006. Tocotrienols: Vitamin E beyond tocopherols. Life
Sci. 78: 2088-2098. Silpi, U., P. Chantuma, P. Kasemsap, P. Thaler, S. Thanaisawanyangura, A. Lacointe, A.
Ameglio and E. Gohet. 2006. Sucrose metabolism distribution patterns in the lattices of three Hevea brasiliensis clones: effects of tapping and stimulation on the tree trunk. J. Rubber Res. 9: 115-131.
Sousa, D. Z., M. Balk, M. Alves, B. Schink, M. J. McInerney, H. Smidt, C. M. Plugge and A.
J. M. Stams. 2010. Degradation of long-chain fatty acids by sulfate-reducing and methanogenic communities.In Handbook of Hydrocarbon and Lipid Microbiology. Heidelberg, Germany, Springer 963-980.
Subramaniam, A. 1972. Gel permeation chromatography of natural rubber. Rubber Chem.
Technol. 45(1): 346-358. Subramaniam, A. 1987. Natural rubber.In Rubber Technology. New York, USA, Van
Nostrand Reinhold 179-208. Subramaniam, A. 1993. Characterisation of natural rubber. International Rubber
Technology Conference, Kuala Lumpur, Malaysia, Rubber Research Institute of Malaysia. 19-36.
Tan, B. 2005. Appropriate spectrum vitamin E and new perspectives on desmethyl
tocopherols and tocotrienols. JANA 8(1): 35-41.

179
Tan, C. H. and B. G. Audley. 1968. Ergothionine and hercynine in Hevea brasiliensis latex.
Phytochemistry 7: 109-118. Tangpakdee, J., N. Nishiyama, S. Kawahara and Y. Tanaka (1996). Molecular Weight
Distribution And Branching In Natural Rubber. IRC '96. International Rubber Conference. Conference proceedings, Manchester, 17th-21st June 1996, paper 41. 012; Institute of Materials.
Tobolsky, A. V. and A. Mercurio. 1959. Oxidative degradation of polydiene vulcanizates. J.
Appl. Polym. Sci. 11(5): 186-188 Tuampoemsab, S. and J. Sakdapipanich. 2007. Role of naturally occurring lipids and proteins
on thermal ageing behaviour of purified natural rubber. KGK 60: 678-684. Van Parijs, J., W. F. Broekaert, I. J. Goldstein and W. J. Peumans. 1991. Hevein: an
antifungal protein from rubber-tree (Hevea brasiliensis) latex. Planta 183: 258-264. Varghese, L., K. T. Thomas and N. M. Mathew. 2005. Impact of bactericidal treatment of
field coagulum on quality of Technically Specified Rubber. International Natural Rubber Conference, India. 418-421.
Vaysse, L., F. Bonfils, J. Sainte-Beuve and M. Cartault. 2012. Natural Rubber.In Polymer
Science: A Comprehensive Reference. Amsterdam, Netherlands, Elsevier BV. 10: 281-293.
Voet, D. and J. G. Voet. 1995. Biochemistry. John Wiley & Sons, Inc., New Jersy, USA. Wang, S., K. A. Meckling, M. F. Marcone, Y. Kakuda, A. Proulxa and R. Tsao. 2012. In
vitro antioxidant synergism and antagonism between food extracts can lead to similar activities in H2O2 induced cell death, caspase-3 and MMP-2 activities in H9c2 cells. J. Sci. Food Agric. 92(15): 2983–2993.
Webster, C. C. and W. J. Baulkwil. 1989. Rubber. Longman Scientific & Technical,
Singapore. Whitle, K. J., P. J. Dunphy and J. F. Pennock. 1966. The isolation and properties of delta-
tocotrienol from Hevea latex. Biochem. J. 100: 138-145. Wisunthorn, S., S. Liengprayoon, L. Vaysse, J. Sainte-Beuve and F. Bonfils. 2012. SEC-
MALS study of dynamic structuring of natural rubber: Comparative study of two Hevea brasiliensis genotypes. J. Appl. Polym. Sci. 124(2): 1570-1577.
Wititsuwannakul, D. and R. Wititsuwannakul. 2001. Biochemistry of natural rubber and
structure of latex.In Biopolymers. Weinheim, Germany, John Wiley & Sons, Inc. 2: 151-201.

180
Yeang, H. Y., S. A. M. Arif, F. Yusof and E. Sunderasan. 2002. Allergenic proteins of natural rubber latex. Methods 27: 32-45.
Yip, E. 1990. Clonal characterisation of latex and rubber properties. J Nat. Rubb. Res. 5(1):
52-80. Yip, E. and P. Cacioli. 2002. The manufacture of gloves from natural rubber latex. J. Allergy
Clin. Immunol. 110: 3-14. Zhong, J. P., C.P. Li, S.D. Li, L.X. Kong, L. Yang, S.Q. Liao and X. D. She. 2009. Study on
the Properties of Natural Rubber during Maturation. J. Polym. Mater. 26(3): 351-360.

181
APPENDICES

182
APPENDIX A
UNCONTROLLED CONDITIONS
(USS/RSS Like process)
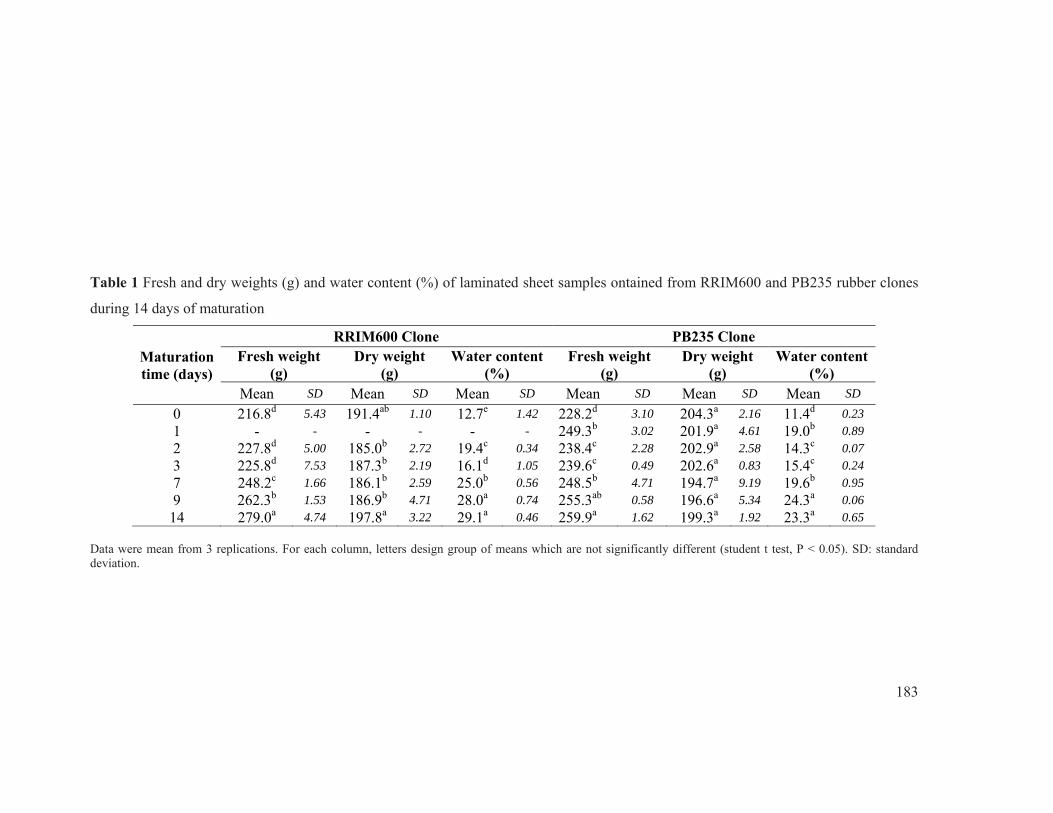
183
Table 1 Fresh and dry weights (g) and water content (%) of laminated sheet samples ontained from RRIM600 and PB235 rubber clones
during 14 days of maturation
Maturation time (days)
RRIM600 Clone PB235 Clone Fresh weight
(g) Dry weight
(g) Water content
(%) Fresh weight
(g) Dry weight
(g) Water content
(%) Mean SD Mean SD Mean SD Mean SD Mean SD Mean SD
0 216.8d 5.43 191.4ab 1.10 12.7e 1.42 228.2d 3.10 204.3a 2.16 11.4d 0.23 1 - - - - - - 249.3b 3.02 201.9a 4.61 19.0b 0.89 2 227.8d 5.00 185.0b 2.72 19.4c 0.34 238.4c 2.28 202.9a 2.58 14.3c 0.07 3 225.8d 7.53 187.3b 2.19 16.1d 1.05 239.6c 0.49 202.6a 0.83 15.4c 0.24 7 248.2c 1.66 186.1b 2.59 25.0b 0.56 248.5b 4.71 194.7a 9.19 19.6b 0.95 9 262.3b 1.53 186.9b 4.71 28.0a 0.74 255.3ab 0.58 196.6a 5.34 24.3a 0.06 14 279.0a 4.74 197.8a 3.22 29.1a 0.46 259.9a 1.62 199.3a 1.92 23.3a 0.65
Data were mean from 3 replications. For each column, letters design group of means which are not significantly different (student t test, P < 0.05). SD: standard deviation.

184
Table 2 Physical properties of RRIM600 maturated rubbers obtained from outdoor air and smoke drying during 14 days of maturation
Maturation
time (days)
Outdoor air drying Smoke drying
P0 (unit) P30 (unit) PRI (%) P0 (unit) P30 (unit) PRI (%)
Mean SD Mean SD Mean SD Mean SD Mean SD Mean SD 0 41.8c 0.76 34.5a 0.50 82.5a 2.48 38.2c 0.29 39.0abc 0.50 102.2a 0.75
2 47.7bc 0.58 28.2a 3.75 54.7b 5.16 51.7b 1.53 48.0ab 1.00 93.0ab 4.33
3 41.8c 3.18 36.6a 3.45 82.1a 3.43 54.5b 1.32 48.7a 0.76 89.4ab 3.21
7 60.0a 2.83 12.0b 4.36 15.1c 3.04 58.2a 0.58 37.8abc 0.35 65.1bc 1.41 9 56.0ab 5.65 31.0a 0.00 61.9ab 14.4 54.5b 1.32 27.7c 3.88 50.9c 4.03 14 - - - - - - 51.8b 1.76 35.0bc 12.2 69.0bc 25.5
Data were mean from 3 replications. For each column, letters design group of means which are not significantly different (student t test, P < 0.05). SD: standard deviation.
Table 3 Physical properties of PB235 maturated rubbers obtained from outdoor air and smoke drying during 14 days of maturation
Maturation time (days)
Outdoor air drying Smoke drying
P0 (unit) P30 (unit) PRI (%) P0 (unit) P30 (unit) PRI (%)
Mean SD Mean SD Mean SD Mean SD Mean SD Mean SD 0 51.3a 0.29 35.2b 1.61 68.5b 2.86 49.3b 1.52 41.8bc 0.76 84.8a 1.31 1 49.0a 0.87 42.0a 1.41 84.9a 2.90 55.5a 2.29 48.8a 0.76 88.1a 4.60 2 50.5a 0.50 33.8b 2.02 68.8b 2.55 53.5ab 0.50 46.3a 1.04 86.6a 1.22 3 46.2a 5.00 35.8b 0.35 73.0b 1.41 54.7ab 1.61 45.8ab 0.28 85.3a 1.06 7 20.3b 0.35 - - - - 54.3ab 2.89 39.0c 3.00 75.8b 1.06 9 - - - - - - 55.7a 2.02 39.2c 0.29 72.1b 0.64 14 - - - - - - 52.0ab 2.50 16.3d 0.58 32.5c 0.28
Data were mean from 3 replications. For each column, letters design group of means which are not significantly different (student t test, P < 0.05). SD: standard deviation.

185
Table 4 Lipid extracts (%w/w dry rubber) of RRIM600 and PB235 maturated sheets obtained
from outdoor air and smoke drying during 14 days of maturation
Maturation days
RRIM600 clone PB235 clone
Outdoor air drying
Smoke drying Outdoor air
drying Smoke drying
Mean SD Mean SD Mean SD Mean SD
0 1.92a 0.04 2.01b 0.02 3.41a 0.02 3.53a 0.10
1 - - - - 3.01ab 0.10 3.64a 0.30
2 2.10a 0.36 2.04b 0.02 3.00ab 0.25 3.66a 0.21
3 1.75a 0.01 2.04b 0.02 2.99ab 0.06 3.46a 0.19
7 1.93a 0.11 2.15a 0.10 2.65bc 0.03 2.98a 0.89
9 2.10a 0.06 2.05b 0.04 3.30a 0.26 3.44a 0.03
14 1.84a 0.04 1.98b 0.06 2.42c 0.01 3.22a 0.05
Data were mean from 3 replications. For each column, letters design group of means which are not significantly different (student t test, P < 0.05). SD: standard deviation.

186
Table 5 Neutral lipid composition (% w/w dry rubber) of RRIM600 lipid extracts obtained from outdoor air and smoke dried samples
during 14 days of maturation
Drying methods
Days
Neutral lipid composition
Sterols Free fatty
acids TGF γ-tocotrienol
γ-tocotrienol ester I
γ-tocotrienol ester II
Sterol esters
Mean SD Mean SD Mean SD Mean SD Mean SD Mean SD Mean SD
Outdoor air drying
0 0.08a 0.04 0.89a 0.04 N/D - 0.12a - 0.07b 0.01 N/D - 0.39a 0.03 2 0.12a 0.05 0.68a 0.01 N/D - 0.12a 0.06 0.16a 0.02 0.06a - 0.24a 0.13 3 0.08a 0.00 0.73a 0.02 N/D - 0.11a 0.00 0.17a 0.02 0.10a - 0.33a 0.01 7 0.43a 0.01 1.07a 0.25 N/D - 0.06a 0.04 0.17a 0.02 0.04a 0.04 0.31a 0.08 9 0.52a 0.01 0.96a 0.04 N/D - 0.03a - 0.13ab 0.01 0.06a - 0.18a 0.01 14 0.49a 0.30 0.76a 0.08 N/D - N/D - 0.15a 0.04 0.04a - 0.17a -
Smoke drying
0 0.07β 0.01 0.98α 0.01 N/D - 0.09α - 0.12α 0.02 0.01α - 0.32α 0.04 2 0.25α 0.01 0.83β 0.04 N/D - 0.02α - 0.14α 0.04 0.07α - 0.28α 0.09 3 0.21αβ 0.01 1.06α 0.06 N/D - 0.04α - 0.14α 0.11 0.07α 0.03 0.28α 0.01 7 0.30α 0.08 0.78βγ 0.04 N/D - 0.09α 0.08 0.26α 0.01 0.08α 0.01 0.13α 0.03 9 0.31α 0.05 0.70βγ 0.03 N/D - 0.04α 0.02 0.24α 0.01 0.09α 0.01 0.25α 0.06 14 0.32α 0.03 0.65γ 0.02 N/D - 0.03α 0.02 0.24α 0.03 0.08α 0.00 0.23α 0.04
Data were mean from 3 replications. For each column, letters design group of means which are not significantly different (student t test, P < 0.05). SD: standard deviation. N/D: not detected.

187
Table 6 Neutral lipid composition (% w/w dry rubber) of PB235 lipid extracts obtained from outdoor air and smoke dried samples during
14 days of maturation
Drying methods
Days
Neutral lipid composition
Sterols Free fatty
acids TGF γ-tocotrienol
γ-tocotrienol ester I
γ-tocotrienol ester II
Sterol esters
Mean SD Mean SD Mean SD Mean SD Mean SD Mean SD Mean SD
Outdoor air drying
0 0.10d 0.10 1.22bc 0.11 1.07a 0.13 N/D - 0.07b 0.01 N/D - 0.28ab 0.06 1 0.05d 0.01 1.69a 0.09 0.13b 0.00 N/D - 0.07b 0.01 N/D - 0.38a 0.09 2 0.16cd - 1.78a 0.10 0.19b - N/D - 0.07b 0.00 N/D - 0.31ab 0.14 3 0.31bc 0.01 1.33b 0.03 0.43b 0.04 N/D - 0.14ab 0.02 0.01a - 0.11ab 0.01 7 0.64a 0.01 0.99c 0.04 0.15b 0.16 N/D - 0.25a 0.05 0.02a 0.00 0.08ab 0.01 9 0.50ab 0.01 1.41b 0.10 N/D - N/D - 0.25a 0.08 0.05a 0.02 0.04b 0.02 14 0.60a - 0.86c - N/D - N/D - 0.33a - 0.03a - 0.07ab -
Smoke drying
0 0.21α 0.09 1.06β - 1.63α 0.60 0.06α 0.01 0.27α 0.20 0.01α 0.00 0.13α 0.09 1 - - - - - - - - - - - - - - 2 0.27α 0.02 1.18β 0.03 1.00αβ 0.06 0.07α 0.01 0.14α 0.02 0.02α 0.00 0.07α 0.01 3 0.31α 0.00 1.48β 0.07 0.80αβ 0.01 0.05α 0.01 0.14α 0.01 0.02α 0.01 0.05α 0.01 7 0.35α - 2.28α - 0.24αβ - 0.03α - 0.15α 0.06 0.02α - 0.08α 0.03 9 0.30α 0.03 2.11α 0.13 0.26β 0.01 N/D - 0.17α 0.00 0.02α 0.01 0.22α 0.06 14 0.25α 0.08 1.65αβ 0.21 0.31β 0.03 N/D - 0.25α 0.04 0.02α - 0.20α -
Data were mean from 3 replications. For each column, letters design group of means which are not significantly different (student t test, P < 0.05). SD: standard deviation. N/D: not detected.
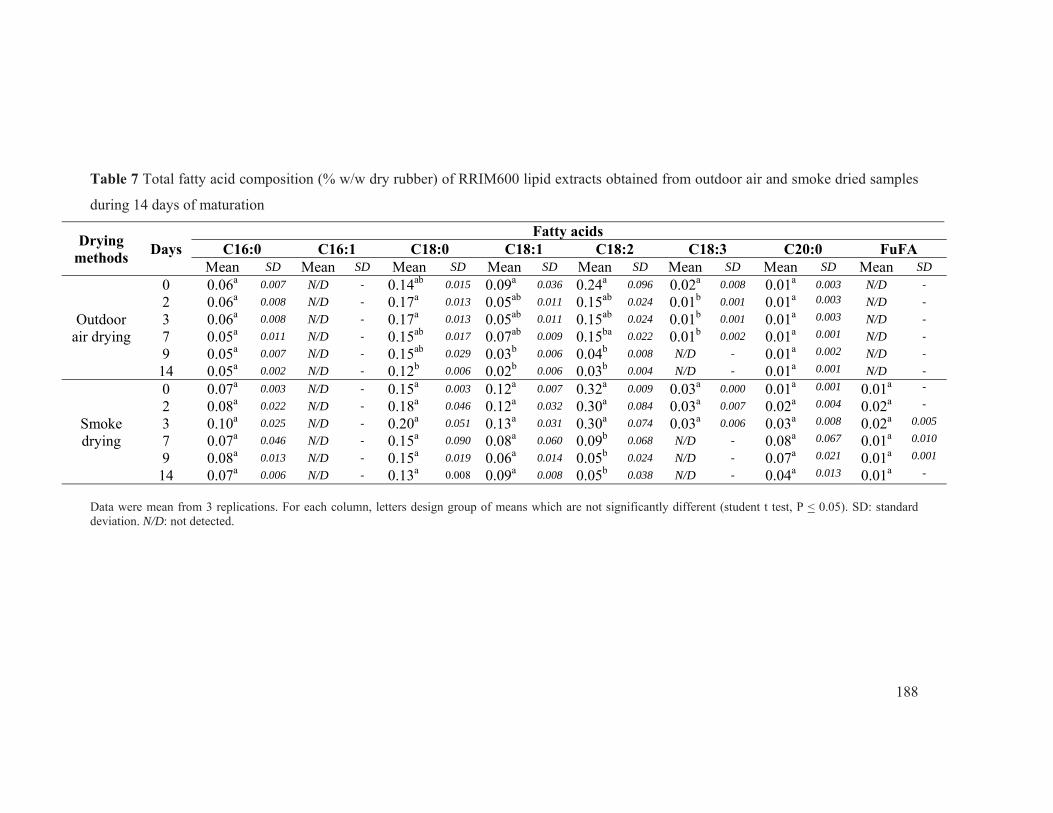
188
Table 7 Total fatty acid composition (% w/w dry rubber) of RRIM600 lipid extracts obtained from outdoor air and smoke dried samples
during 14 days of maturation
Drying methods
Days Fatty acids
C16:0 C16:1 C18:0 C18:1 C18:2 C18:3 C20:0 FuFA Mean SD Mean SD Mean SD Mean SD Mean SD Mean SD Mean SD Mean SD
Outdoor air drying
0 0.06a 0.007 N/D - 0.14ab 0.015 0.09a 0.036 0.24a 0.096 0.02a 0.008 0.01a 0.003 N/D -
2 0.06a 0.008 N/D - 0.17a 0.013 0.05ab 0.011 0.15ab 0.024 0.01b 0.001 0.01a 0.003 N/D -
3 0.06a 0.008 N/D - 0.17a 0.013 0.05ab 0.011 0.15ab 0.024 0.01b 0.001 0.01a 0.003 N/D -
7 0.05a 0.011 N/D - 0.15ab 0.017 0.07ab 0.009 0.15ba 0.022 0.01b 0.002 0.01a 0.001 N/D -
9 0.05a 0.007 N/D - 0.15ab 0.029 0.03b 0.006 0.04b 0.008 N/D - 0.01a 0.002 N/D -
14 0.05a 0.002 N/D - 0.12b 0.006 0.02b 0.006 0.03b 0.004 N/D - 0.01a 0.001 N/D -
Smoke drying
0 0.07a 0.003 N/D - 0.15a 0.003 0.12a 0.007 0.32a 0.009 0.03a 0.000 0.01a 0.001 0.01a -
2 0.08a 0.022 N/D - 0.18a 0.046 0.12a 0.032 0.30a 0.084 0.03a 0.007 0.02a 0.004 0.02a -
3 0.10a 0.025 N/D - 0.20a 0.051 0.13a 0.031 0.30a 0.074 0.03a 0.006 0.03a 0.008 0.02a 0.005
7 0.07a 0.046 N/D - 0.15a 0.090 0.08a 0.060 0.09b 0.068 N/D - 0.08a 0.067 0.01a 0.010
9 0.08a 0.013 N/D - 0.15a 0.019 0.06a 0.014 0.05b 0.024 N/D - 0.07a 0.021 0.01a 0.001
14 0.07a 0.006 N/D - 0.13a 0.008 0.09a 0.008 0.05b 0.038 N/D - 0.04a 0.013 0.01a -
Data were mean from 3 replications. For each column, letters design group of means which are not significantly different (student t test, P < 0.05). SD: standard deviation. N/D: not detected.

189
Table 8 Total fatty acid composition (% w/w dry rubber) of PB235 lipid extracts obtained from outdoor air and smoke dried samples
during 14 days of maturation
Drying methods
Days Fatty acids
C16:0 C16:1 C18:0 C18:1 C18:2 C18:3 C20:0 FuFA Mean SD Mean SD Mean SD Mean SD Mean SD Mean SD Mean SD Mean SD
Outdoor air drying
0 0.11ab 0.020 0.04a 0.007 0.22ab 0.042 0.09a 0.016 0.29a 0.057 0.03a 0.007 0.02ab 0.003 1.68a 0.331 1 0.07ab 0.018 0.01a 0.005 0.20ab 0.001 0.06bc 0.001 0.17b 0.049 0.01b 0.001 0.02abc 0.000 1.44a 0.171
2 0.07a 0.012 0.01a 0.001 0.18ab 0.033 0.05bcd 0.009 0.14bc 0.025 0.01b 0.002 0.02abc 0.004 0.99ab 0.351
3 0.14ab 0.049 0.03a 0.017 0.32a 0.100 0.07ab 0.003 0.15b 0.018 0.02b 0.001 0.02a 0.004 0.68ab 0.148
7 0.06ab 0.012 N/D - 0.21ab 0.037 0.02d 0.003 0.02d 0.003 N/D - 0.01abc 0.001 0.10b 0.119
9 0.05ab 0.013 N/D - 0.16ab 0.028 0.02d 0.002 0.02d 0.005 N/D - 0.01c 0.001 0.02b -
14 0.04b 0.015 N/D - 0.12b 0.042 0.02cd - 0.01cd - N/D - 0.01bc - N/D -
Smoke drying
0 0.09a 0.001 0.03a 0.003 0.19a 0.003 0.08a 0.001 0.25a 0.003 0.03a 0.001 0.02c 0.001 1.53a 0.062
1 - - - - - - - - - - - - - - - -
2 0.09a 0.008 0.02ab 0.002 0.18a 0.016 0.07ab 0.001 0.19b 0.006 0.02ab 0.001 0.02c 0.002 1.52a 0.134
3 0.10a 0.014 0.02ab 0.003 0.20a 0.023 0.07ab 0.011 0.17b 0.025 0.02b 0.003 0.02c 0.002 1.54a 0.182
7 0.06a 0.001 0.01c 0.001 0.12a 0.001 0.04b 0.001 0.05c 0.006 N/D - 0.04bc 0.006 0.72a 0.151
9 0.09a 0.022 0.02bc 0.004 0.21a 0.047 0.05b 0.017 0.04c 0.011 N/D - 0.06ab 0.014 1.30a 0.407
14 0.09a 0.023 0.02bc 0.003 0.19a 0.055 0.05b 0.004 0.02c 0.001 N/D - 0.06a 0.006 0.70a 0.294
Data were mean from 3 replications. For each column, letters design group of means which are not significantly different (student t test, P < 0.05). SD: standard deviation. N/D: not detected.

190
Table 9 Unsaponifiable composition (% w/w dry rubber) of RRIM600 lipid extracts obtained from outdoor air and smoke dried samples
during 14 days of maturation
Drying methods
Days Unsaponifiable composition
C18-OH C20-OH γ-tocotrienol α-tocotrienol Stigmasterol β-sitosterol Δ5-avenasterolMean SD Mean SD Mean SD Mean SD Mean SD Mean SD Mean SD
Outdoor air drying
0 0.01a 0.001 0.01a 0.010 0.03a - N/D - 0.04a 0.015 0.30a 0.063 0.08a 0.018
2 0.01a 0.005 0.01a 0.003 0.03a - N/D - 0.03a 0.001 0.23a 0.010 0.06a 0.011
3 0.01a 0.001 0.01a 0.000 0.04a 0.014 N/D - 0.02a 0.002 0.26a 0.004 0.07a 0.004
7 0.01a 0.006 N/D - 0.04a 0.026 N/D - 0.04a 0.004 0.24a 0.003 0.08a 0.020
9 0.01a 0.001 N/D - 0.02a - N/D - 0.03a 0.008 0.28a 0.039 0.07a 0.014
14 0.01a - N/D - 0.05a - N/D - 0.04a - 0.28a - 0.07a -
Smoke drying
0 0.02a 0.002 0.01a 0.002 0.04a 0.003 0.02a 0.002 0.05a 0.004 0.40a 0.050 0.08a 0.005
2 0.02a 0.002 0.01a 0.002 0.10a 0.022 0.03a 0.002 0.06a 0.004 0.41a 0.034 0.10a 0.013
3 0.02a 0.001 0.01a 0.000 0.14a 0.081 0.03a 0.005 0.07a 0.001 0.45a 0.026 0.12a 0.004
7 0.02a 0.000 0.01a 0.001 0.12a 0.076 0.03a - 0.06a 0.006 0.42a 0.018 0.10a 0.027
9 0.02a 0.008 0.01a 0.004 0.08a 0.018 0.03a 0.001 0.04a 0.016 0.29a 0.136 0.08a 0.011
14 0.01a 0.002 0.01a 0.000 0.09a - 0.03a - 0.07a 0.008 0.47a 0.050 0.11a 0.010
Data were mean from 3 replications. For each column, letters design group of means which are not significantly different (student t test, P < 0.05). SD: standard deviation. N/D: not detected.

191
Table 10 Unsaponifiable composition (% w/w dry rubber) of PB235 lipid extracts obtained from outdoor air and smoke dried samples
during 14 days of maturation
Drying methods
Days Unsaponifiable composition
C18-OH C20-OH γ-tocotrienol α-tocotrienol Stigmasterol β-sitosterol Δ5-avenasterolMean SD Mean SD Mean SD Mean SD Mean SD Mean SD Mean SD
Outdoor air drying
0 0.06a - 0.03ab - 0.11a - 0.04a - 0.06a - 0.36a - 0.13a -
1 0.06a 0.003 0.03a 0.001 0.10a 0.029 0.04a 0.001 0.05a 0.005 0.31a 0.044 0.13a 0.019
2 0.05ab 0.009 0.03abc 0.004 0.08a 0.009 0.04a 0.006 0.04ab 0.012 0.26ab 0.064 0.10ab 0.011
3 0.03bc 0.002 0.02bcd 0.002 0.06a 0.039 0.03a - 0.03ab 0.006 0.21ab 0.022 0.08ab 0.021
7 0.03bc 0.004 0.02bcd 0.003 0.13a 0.056 0.04a 0.001 0.03ab 0.001 0.20ab 0.009 0.09ab 0.007
9 0.02c 0.002 0.01cd - 0.04a 0.016 N/D - 0.02b 0.002 0.14b 0.004 0.06b 0.001
14 0.02c 0.004 0.01d 0.002 0.02a - N/D - 0.02b 0.008 0.13b 0.034 0.05b 0.002
Smoke drying
0 0.03a 0.005 0.02a 0.001 0.06a 0.021 0.04a - 0.03a 0.006 0.25a 0.058 0.11a 0.007
1 - - - - - - - - - - - - - -
2 0.04a 0.016 0.02a 0.007 0.08a 0.052 0.05a - 0.04a 0.018 0.27a 0.085 0.10a 0.023
3 0.05a 0.007 0.03a 0.001 0.16a 0.042 0.04a 0.002 0.05a 0.003 0.28a 0.038 0.12a 0.002
7 0.04a 0.021 0.03a 0.013 0.14a - 0.05a - 0.05a 0.021 0.29a 0.119 0.12a 0.045
9 0.04a 0.006 0.02a 0.004 0.09a 0.031 0.04a 0.008 0.05a 0.010 0.29a 0.058 0.10a 0.028
14 0.04a 0.006 0.02a 0.005 0.10a - 0.04a - 0.04a 0.005 0.25a 0.024 0.10a 0.011
Data were mean from 3 replications. For each column, letters design group of means which are not significantly different (student t test, P < 0.05). SD: standard deviation. N/D: not detected.

192
Table 11 Absolute initial slope value (%DPPHrem.min-1) of RRIM600 and PB235 lipid
extracts obtained from outdoor air dried and smoke dried samples during 14 days of
maturation
Maturation time (days)
RRIM600 clone PB235 clone
Outdoor air drying
Smoke dryingOutdoor air
drying Smoke drying
Mean SD Mean SD Mean SD Mean SD
0 12.8a 1.18 12.0a 1.10 6.32ab 3.21 4.97ab 0.05
1 - - - - 7.54a 0.76 - -
2 15.5a 5.57 8.28bc 0.78 5.99abc 0.66 8.32a 0.71
3 16.9a 0.56 8.28bc 0.30 2.72bcd 0.61 5.17ab 0.57
7 16.2a 1.61 8.24c 1.31 1.45cd 0.52 5.19ab 0.05
9 12.5a 1.17 11.8ab 0.98 1.71cd 0.51 3.38ab 2.24
14 7.06a 3.27 7.26c 0.40 1.20d 0.04 2.46b 2.04
Data were mean from 3 replications. For each column, letters design group of means which are not significantly different (student t test, P < 0.05). SD: standard deviation.

193
APPENDIX B
CONTROLLED CONDITIONS
(TSR Like process)

194
Table 12 Fresh and dry weight (g) and water content (%) of laminated crepe samples ontained from RRIM600 and PB235 rubber clones
from 3 conditions during 28 days of maturation
Conditions Days
RRIM600 clone PB235 clone Fresh weight
(g) Dry weight
(g) Water content
(%) Fresh weight
(g) Dry weight
(g) Water content
(%) Mean SD Mean SD Mean SD Mean SD Mean SD Mean SD
Na+O-
0 24.9a 0.59 19.6a 0.42 21.1c 0.37 22.7a 0.46 17.3a 0.46 25.7a 0.64 3 20.4c 0.17 16.0b 0.25 21.4c 0.57 20.6c 0.43 16.2b 0.31 21.3b 0.31 5 23.7ab 1.43 18.5a 0.42 23.8ab 0.76 22.2ab 0.23 17.4a 0.19 21.3b 0.35 7 24.7a 0.58 18.7a 0.45 24.3a 0.13 21.8ab 0.16 17.5a 0.05 19.8bc 0.44 14 24.5ab 0.35 19.2a 0.36 21.8bc 0.44 21.5bc 0.18 17.7a 0.19 18.9c 0.66 21 24.4ab 0.25 19.3a 0.31 20.8c 0.74 21.8ab 0.48 18.0a 0.31 19.6bc 0.46 28 22.4bc 1.26 18.4a 0.78 18.2d 1.09 21.6bc 0.21 17.5a 0.35 19.0c 1.66
Na-O-
0 23.9αβ 0.37 19.0α 0.20 20.8γ 0.44 21.8β 0.60 17.2α 0.30 21.3β 0.91 3 26.7α 0.08 19.1α 0.25 28.8α 0.97 22.8αβ 0.29 17.4α 0.04 23.7αβ 0.85 5 26.9α 1.60 18.9α 0.16 27.6αβ 0.42 23.7α 0.29 17.4α 0.15 26.6α 0.29 7 25.5αβ 1.54 18.2α 0.74 27.3αβ 0.13 22.9αβ 0.47 17.4α 0.05 24.1αβ 1.68 14 26.1αβ 0.38 18.5α 0.45 29.2α 1.27 23.3α 0.19 17.3α 0.06 25.8α 0.75 21 26.4α 2.39 18.8α 0.27 25.7β 0.99 23.1α 0.45 17.3α 0.09 25.0α 1.69 28 22.6β 0.41 18.6α 0.25 17.7δ 0.84 23.1α 0.13 17.3α 0.09 25.1α 0.81
Na-O+
0 23.9AD 0.37 19.0A 0.20 20.8C 0.44 21.8C 0.60 17.2A 0.30 21.3F 0.91 3 26.8C 0.13 19.0A 0.24 29.0B 0.68 23.1BC 0.51 17.2A 0.15 25.3E 1.08 5 26.6CD 0.25 19.0A 0.14 28.7B 0.31 23.2AB 0.46 17.1A 0.23 26.5DE 0.61 7 27.3C 1.32 18.9A 0.02 28.7B 0.14 23.9AB 0.11 17.3A 0.18 27.5CD 0.40 14 30.1AB 0.81 19.0A 0.04 36.0A 1.03 24.1AB 0.48 17.1A 0.28 29.1BC 0.23 21 31.6A 1.73 19.0A 0.57 36.7A 2.14 24.5A 0.25 17.0A 0.28 30.5AB 0.42 28 28.0BC 1.01 18.5A 0.44 34.1A 0.89 24.2AB 0.68 16.7A 0.31 31.1A 0.71
Data were mean from 3 replications. For each column, letters design group of means which are not significantly different (student t test, P < 0.05). SD: standard deviation.

195
Table 13 Physical properties of RRIM600 and PB235 maturated mini-cup coagula obtained from 3 conditions during 28 days of
maturation
Conditions Days RRIM600 clone PB235 clone
P0 (unit) P30 (unit) PRI (%) P0 (unit) P30 (unit) PRI (%) Mean SD Mean SD Mean SD Mean SD Mean SD Mean SD
Na+O-
0 38.8e 0.29 32.5d 0.69 83.4bc 1.77 49.2a 0.76 40.3a 0.58 82.0a 0.45 3 43.8d 0.76 41.0c 0.02 92.7a 0.78 - - - - - - 5 49.0c 1.00 44.0abc 0.00 88.9ab 1.27 49.7a 1.61 33.8c 1.03 72.5b 1.91 7 54.3ab 0.58 46.0a 0.20 84.4bc 1.13 51.5a 0.50 38.3ab 1.76 75.9ab 1.48 14 55.5a 0.71 44.3ab 0.37 82.0cd 2.83 50.0a 1.41 33.5c 0.02 71.1b 0.78 21 52.2b 1.04 41.5bc 0.51 78.7cd 0.85 51.5a 2.12 35.5bc 1.41 69.1b 5.59 28 55.5a 2.12 42.8abc 2.50 77.0d 1.56 50.3a 0.35 35.0bc 0.00 70.0b 0.49
Na-O-
0 37.7δ 1.04 32.8δ 1.06 88.0α 0.35 43.5αβ 0.50 37.0α 0.01 85.1α 1.00 3 50.7γ 0.76 46.0αβ 0.00 91.6α 0.64 - - - - - - 5 55.5β 2.83 41.5αβγ 3.53 74.7βγ 2.55 40.8βγ 0.35 16.0βγ 0.70 39.3γ 2.05 7 60.8α 0.35 46.5α 0.99 79.7β 1.70 47.8α 1.26 21.7β 0.35 46.0β 0.28 14 58.8αβ 0.76 41.0βγ 0.87 69.7 γδ 1.55 37.3γ 1.15 14.5γ 1.33 41.3βγ 0.64 21 59.5αβ 2.12 36.0γδ 1.42 68.5 γδ 1.70 34.5γ 5.66 3.33δ 4.04 3.75µ 0.64 28 61.3α 1.76 37.8γδ 1.77 67.0δ 1.91 37.0βγ 1.41 11.3γ 0.33 30.5δ 2.05
Na-O+
0 37.7C 1.04 32.8C 1.06 88.0A 0.35 43.5AB 0.50 37.0A 0.01 85.1A 1.00 3 52.5AB 0.71 45.5A 0.50 87.2A 1.84 - - - - - - 5 54.0AB 0.87 43.5A 0.49 81.4B 0.99 35.5D 0.00 6.25CD 0.35 17.6C 0.99 7 55.3A 0.35 44.0A 0.01 79.7B 0.49 47.5A 0.71 11.5B 0.69 25.6B 0.07 14 54.5Ab 0.71 37.0B 1.39 64.3C 1.77 36.8CD 1.06 9.25BC 1.07 25.2B 2.19 21 51.8B 1.26 29.3D 1.06 56.6D 0.92 41.0BC 0.00 5.33D 1.15 16.2C 2.19 28 55.8A 0.35 25.8E 1.10 46.2E 2.26 42.8AB 3.18 8.50BCD 2.11 19.8BC 3.46
Data were mean from 3 replications. For each column, letters design group of means which are not significantly different (student t test, P < 0.05). SD: standard deviation.

196
Table 14 Total gel content and molar masses (weight-average molar mass, Mw and number-average molar mass, Mn) of RRIM600 and
PB235 maturated mini-cup coagula obtained from 3 conditions during 28 days of maturation
Conditions Days RRIM600 clone PB235 clone
Gel (%) Mw (kg.mol-1) Mn (kg.mol-1) Gel (%) Mw (kg.mol-1) Mn (kg.mol-1) Mean SD Mean SD Mean SD Mean SD Mean SD Mean SD
Na+O-
0 34.4c 3.15 1497b 61.9 878.7d 64.9 28.0b 1.53 1637a 58.4 1083a 30.2
3 41.2bc 1.61 1738a 82.8 1149c 25.0 - - - - - -
5 48.2ab 1.07 1617ab 103 1158bc 49.4 35.9a 2.65 1449bc 69.5 1081a 57.7
7 51.7a 1.31 1773a 27.0 1298ab 45.8 35.7a 1.04 1630a 99.3 1139a 87.0
14 51.8a 4.57 1802a 49.0 1347a 69.5 36.1a 3.45 1399c 30.6 1048a 60.3
21 50.7a 2.35 1741a 103 1284abc 54.3 32.0ab 3.75 1583ab 78.7 1131a 39.3
28 51.1a 2.17 1589ab 98.3 1233abc 42.2 38.8a 2.15 1488abc 19.9 1143a 22.3
Na-O-
0 28.5γ 2.66 1365βγ 237 723.3γ 120 30.7β 0.81 1502α 12.1 933.7αβ 54.0
3 46.4β 3.37 1710α 44.8 1237α 62.7 - - - - - -
5 49.8αβ 0.45 1492αβγ 43.7 1050αβ 23.9 38.4α 5.13 1191βγ 45.7 918.0αβ 34.1
7 50.2αβ 3.46 1583αβ 33.2 1180α 39.3 40.9α 3.54 1330αβ 109 1029α 83.2
14 53.0αβ 1.57 1434αβγ 84.5 1118αβ 94.6 38.1αβ 0.56 987.3γδ 54.4 764.7βγ 57.0
21 53.5α 2.06 1473αβγ 78.0 1096αβ 55.8 39.8α 1.85 921.7δ 153 691.3γ 140
28 54.9α 1.69 1212γ 56.5 930.3β 32.5 40.7α 1.76 1029γδ 30.5 817.0βγ 40.9
Na-O+
0 28.5B 2.66 1365A 237 723.3B 120 30.7B 0.81 1502A 12.1 933.7A 54.1
3 46.6A 1.31 1685A 112 1188A 50.5 - - - - - -
5 47.7A 3.45 1574A 48.5 1144A 74.3 39.0A 2.78 1165BC 169 879.7A 114
7 46.7A 3.29 1632A 63.7 1171A 47.8 39.9A 5.00 1283AB 85.3 986.0A 85.0
14 51.1A 1.03 1562A 33.3 1099A 57.6 40.3A 0.89 972.0C 119 748.3A 109
21 50.9A 3.52 1438A 96.3 1005A 114 35.4AB 2.11 1160BC 66.1 854.7A 54.4
28 48.5AC 0.95 1391A 84.1 979.3A 53.9 34.6AB 1.40 1195BC 134 893.0A 122
Data were mean from 3 replications. For each column, letters design group of means which are not significantly different (student t test, P < 0.05). SD: standard deviation.

197
Table 15 Lipid extract (% w/w dry rubber) of RRIM600 and PB235 mini-cup coagula samples from 3 conditions during 28 days of
maturation
Maturation time (days)
RRIM600 Clone PB235 Clone Conditions Conditions
Na+O- Na-O+ Na-O- Na+O- Na-O+ Na-O- Mean SD Mean SD Mean SD Mean SD Mean SD Mean SD
0 2.04b 0.03 2.04a 0.02 2.04a 0.02 3.47a 0.04 3.38a 0.00 3.38a 0.00 3 2.17a 0.05 1.94ab 0.03 1.95b 0.06 - - - - - - 5 1.98b 0.05 1.93ab 0.02 1.95b 0.03 3.29b 0.04 3.31a 0.06 3.33a 0.03 7 1.93b 0.01 1.93ab 0.02 1.91b 0.01 3.25b 0.06 3.22ab 0.09 3.26a 0.01 14 1.90b 0.03 1.73bc 0.11 1.96ab 0.03 3.19b 0.03 3.06b 0.06 3.33a 0.16 21 1.89b 0.01 1.61c 0.03 1.94b 0.02 3.31ab 0.12 2.76c 0.15 3.36a 0.04 28 1.93b 0.08 1.62c 0.18 1.92b 0.04 3.16b 0.02 2.51d 0.05 3.37a 0.10
Data were mean from 3 replications. For each column, letters design group of means which are not significantly different (student t test, P < 0.05). SD: standard deviation.

198
Table 16 Neutral lipid composition (% w/w dry rubber) of RRIM600 lipid extracts obtained from 3 conditions during 28 days of
maturation
Conditions Days
Components
Sterols Free fatty
acids TGF γ-tocotrienol Wax
γ-tocotrienol ester I
γ-tocotrienol ester II
Sterol esters
Mean SD Mean SD Mean SD Mean SD Mean SD Mean SD Mean SD Mean SD
Na+O-
0 0.54a 0.021 0.30a 0.060 0.30a 0.100 0.09a 0.000 0.012a 0.012 0.22a 0.014 0.11ab 0.021 0.15b 0.035 3 0.31b 0.014 0.64b 0.021 0.18a 0.076 0.07ab 0.014 0.008a 0.006 0.16b 0.026 0.09ab 0.012 0.23ab 0.035 5 0.25c 0.020 0.64b 0.074 0.16a 0.032 0.06ab 0.006 0.006a 0.004 0.16b 0.011 0.10ab 0.012 0.20ab 0.014 7 0.22cd 0.020 0.64b 0.081 0.16a 0.035 0.06b 0.012 0.006a 0.005 0.15b 0.006 0.09abc 0.012 0.19ab 0.028
14 0.18d 0.010 0.65b 0.044 0.15a 0.046 0.06b 0.007 0.005a 0.004 0.14b 0.006 0.07abc 0.006 0.26a 0.014 21 0.18d 0.007 0.63b 0.014 0.13a 0.061 0.06b 0.007 0.005a 0.003 0.14b 0.007 0.05c 0.012 0.29a 0.014 28 0.17d 0.023 0.65b 0.075 0.18a 0.089 0.06b 0.007 0.005a 0.003 0.14b 0.021 0.07bc 0.015 0.25ab 0.035
Na-O-
0 0.50α 0.007 0.25β 0.067 0.29α 0.121 0.10α 0.007 0.008γ 0.001 0.22α 0.035 0.09αβ 0.015 0.14α 0.010 3 0.25β 0.017 0.66α 0.070 0.16αβ 0.035 0.05β 0.006 0.047β 0.008 0.15β 0.006 0.13α 0.010 0.11αβ 0.012 5 0.23β 0.015 0.65α 0.031 0.14αβ 0.045 0.04β 0.010 0.098α 0.007 0.15β 0.023 0.14α 0.015 0.10β 0.017 7 0.22β 0.010 0.64α 0.015 0.14αβ 0.040 0.04β 0.010 0.108α 0.007 0.15β 0.030 0.13α 0.021 0.10β 0.017
14 0.22β 0.015 0.74α 0.047 0.14αβ 0.040 0.04β 0.006 0.046β 0.004 0.17αβ 0.010 0.09αβ 0.015 0.11αβ 0.012 21 0.22β 0.006 0.73α 0.062 0.12β 0.031 0.05β 0.006 0.035β γ 0.018 0.18αβ 0.006 0.10αβ 0.015 0.12αβ 0.010 28 0.23β 0.012 0.72α 0.031 0.12β 0.040 0.06β 0.006 0.016γ 0.001 0.18αβ 0.021 0.08β 0.015 0.13αβ 0.012
Na-O+
0 0.50A 0.007 0.25D 0.067 0.29A 0.121 0.10A 0.007 0.008C 0.001 0.22A 0.035 0.09BC 0.015 0.14ABC 0.010 3 0.26C 0.006 0.63A 0.069 0.15AB 0.035 0.04C 0.000 0.065B 0.007 0.15BC 0.015 0.13A 0.006 0.11BC 0.025 5 0.24C 0.023 0.58AB 0.072 0.15AB 0.030 0.04C 0.010 0.168A 0.018 0.15BC 0.011 0.11AB 0.015 0.11C 0.021 7 0.23C 0.010 0.56AB 0.056 0.14AB 0.031 0.05BC 0.007 0.195A 0.019 0.14C 0.020 0.11ABC 0.020 0.11C 0.021
14 0.27C 0.021 0.44BC 0.026 0.13AB 0.050 0.06BC 0.006 0.031BC 0.016 0.17ABC 0.000 0.12ABC 0.007 0.17AB 0.015 21 0.25C 0.000 0.37CD 0.061 0.11B 0.058 0.07ABC 0.014 0.014C 0.006 0.18ABC 0.010 0.08C 0.006 0.18A 0.012 28 0.34B 0.007 0.34CD 0.023 0.14AB 0.066 0.07ABC 0.012 0.003C 0.000 0.19AB 0.012 0.08BC 0.010 0.16ABC 0.032
Data were mean from 3 replications. For each column, letters design group of means which are not significantly different (student t test, P < 0.05). SD: standard deviation.

199
Table 17 Neutral lipid composition (% w/w dry rubber) of PB235 lipid extracts obtained from 3 conditions during 28 days of maturation
Conditions Days
Components
Sterols Free fatty
acids TGF γ-tocotrienol Wax
γ-tocotrienol ester I
γ-tocotrienol ester II
Sterol esters
Mean SD Mean SD Mean SD Mean SD Mean SD Mean SD Mean SD Mean SD
Na+O-
0 0.46a 0.028 0.30c 0.046 1.80a 0.134 0.07a 0.000 0.005b 0.004 0.29a 0.012 0.02a 0.006 0.08c 0.007 3 - - - - - - - - - - - - - - - - 5 0.27b 0.021 0.69b 0.012 1.29b 0.093 0.06a 0.007 0.013b 0.002 0.23b 0.012 0.03a 0.006 0.16ab 0.014 7 0.25b 0.035 0.73ab 0.029 1.25b 0.055 0.06a 0.007 0.012b 0.002 0.21b 0.015 0.02a 0.006 0.12bc 0.021
14 0.23b 0.035 0.73ab 0.020 1.16b 0.038 0.06a 0.007 0.012b 0.005 0.21b 0.010 0.02a 0.006 0.17ab 0.007 21 0.21b 0.035 0.74ab 0.032 1.19b 0.115 0.06a 0.007 0.017ab 0.001 0.22b 0.006 0.02a 0.006 0.21a 0.007 28 0.20b 0.057 0.78a 0.046 1.06b 0.130 0.06a 0.007 0.031a 0.006 0.21b 0.023 0.02a 0.006 0.19a 0.014
Na-O-
0 0.50α - 0.30β 0.014 1.60α 0.276 0.07α 0.014 0.01δ 0.005 0.31α 0.007 0.02β 0.007 0.07α 0.042 3 - - - - - - - - - - - - - - - - 5 0.21β 0.070 1.32α 0.075 0.64β 0.006 0.04α 0.012 0.13γ 0.014 0.24α 0.017 0.05α 0.000 0.06α 0.028 7 0.18β 0.021 1.55α 0.053 0.28γ 0.062 0.04α 0.012 0.19β 0.031 0.24α 0.026 0.05α 0.006 0.06α 0.028
14 0.21β 0.065 1.52α 0.028 0.14γ 0.025 0.04α 0.014 0.30α 0.022 0.25α 0.015 0.05α 0.006 0.08α 0.007
21 0.24αβ 0.042 1.64α 0.212 0.13γ 0.070 0.04α 0.012 0.20β 0.029 0.29α 0.028 0.05α 0.021 0.09α 0.028
28 0.25αβ 0.028 1.75α 0.297 0.13γ 0.060 0.05α 0.014 0.12γ 0.011 0.30α 0.035 0.04α 0.012 0.07α 0.060
Na-O+
0 0.50A - 0.30C 0.014 1.60A 0.276 0.07A 0.006 0.01E 0.005 0.31A 0.007 0.02C 0.007 0.07A 0.042 3 - - - - - - - - - - - - - - - - 5 0.29AB 0.042 1.51AB 0.115 0.41B 0.091 0.05AB 0.006 0.11BC 0.011 0.26A 0.010 0.04AB 0.006 0.07A 0.028 7 0.27AB 0.042 1.70A 0.103 0.06B 0.042 0.04B 0.005 0.22A 0.020 0.26A 0.020 0.04A 0.000 0.08A 0.042
14 0.31AB 0.042 1.61AB 0.115 0.06B - 0.04B 0.006 0.12B 0.022 0.29A 0.017 0.03AB 0.000 0.09A 0.042 21 0.30AB 0.049 1.39B 0.044 0.06B - 0.05AB 0.005 0.07CD 0.013 0.28A 0.015 0.03BC 0.006 0.10A 0.021 28 0.26B 0.035 1.40B 0.028 0.05B - 0.07AB 0.009 0.03DE 0.007 0.27A 0.015 0.03BC 0.006 0.13A 0.035
Data were mean from 3 replications. For each column, letters design group of means which are not significantly different (student t test, P < 0.05). SD: standard deviation.

200
Table 18 Total fatty acids composition (% w/w dry rubber) of RRIM600 lipid extracts obtained from 3 conditions during 28 days of
maturation
Conditions Days Components
C14:0 C16:0 C16:1 C18:0 C18:1 C18:2 C18:3 C20:0 FuFA Mean SD Mean SD Mean SD Mean SD Mean SD Mean SD Mean SD Mean SD Mean SD
Na+O-
0 N/D - 0.06a 0.005 N/D - 0.14a 0.012 0.15a 0.013 0.34a 0.024 0.03a 0.002 0.01b 0.001 0.11ab 0.004
3 N/D - 0.08a - 0.01a - 0.18a - 0.19a - 0.43a - 0.04a - 0.01ab - 0.12ab -
5 N/D - 0.07a 0.002 N/D - 0.15a 0.004 0.16a 0.005 0.37a 0.011 0.03a 0.002 0.01b 0.000 0.11ab 0.005
7 N/D - 0.06a 0.006 N/D - 0.13a 0.013 0.15a 0.016 0.34a 0.038 0.03a 0.003 0.01b 0.001 0.09ab 0.013
14 N/D - 0.07a 0.015 N/D - 0.16a 0.033 0.16a 0.038 0.37a 0.101 0.03a 0.010 0.01ab 0.001 0.11ab 0.032
21 N/D - 0.05a 0.028 0.01a 0.001 0.13a 0.065 0.12a 0.064 0.27a 0.143 0.02a 0.012 0.01b 0.005 0.07b 0.039
28 N/D - 0.08a 0.008 0.01a 0.001 0.18a 0.014 0.18a 0.017 0.38a 0.024 0.03a 0.002 0.02a 0.005 0.14a 0.015
Na-O-
0 N/D - 0.07αβ 0.013 0.01α - 0.16αβγ 0.028 0.17αβ 0.031 0.39αβ 0.067 0.03α 0.006 0.01αβγ 0.002 0.13αβ 0.022
3 N/D - 0.07β 0.001 N/D - 0.15βγ 0.003 0.15β 0.003 0.36αβ 0.010 0.03α 0.001 0.01βγ 0.000 0.11αβ 0.002
5 N/D - 0.07β 0.004 N/D - 0.15βγ 0.007 0.15β 0.007 0.36αβ 0.011 0.03αβ 0.001 0.01βγ 0.001 0.10β 0.098
7 N/D - 0.05β 0.001 N/D - 0.12γ 0.008 0.12β 0.001 0.30β 0.007 0.02αβ 0.001 0.01γ 0.000 0.09β 0.094
14 N/D - 0.07αβ 0.004 0.01α 0.000 0.18αβ 0.018 0.16αβ 0.005 0.39αβ 0.011 0.03αβ 0.001 0.01αβ 0.001 0.11αβ 0.114
21 N/D - 0.07αβ 0.006 0.01α 0.001 0.16βγ 0.017 0.16αβ 0.019 0.38αβ 0.050 0.02β 0.004 0.01αβ 0.001 0.12αβ 0.123
28 N/D - 0.09α 0.011 0.01α 0.003 0.21α 0.027 0.21α 0.037 0.48α 0.092 0.03αβ 0.006 0.02α 0.002 0.16α 0.157
Na-O+
0 N/D - 0.07C 0.013 0.01A - 0.16A 0.028 0.17A 0.031 0.39A 0.067 0.03A 0.006 0.01AB 0.002 0.13A 0.022
3 N/D - 0.07C 0.003 N/D - 0.15A 0.006 0.15A 0.006 0.36A 0.015 0.04A 0.002 0.01AB 0.001 0.10A 0.001
5 N/D - 0.07C 0.009 0.01A - 0.16A 0.019 0.16A 0.018 0.37A 0.043 0.03A 0.002 0.01AB 0.001 0.12A 0.019
7 N/D - 0.07C 0.001 0.01A 0.002 0.16A 0.005 0.15A 0.006 0.34A 0.012 0.03A 0.002 0.01AB 0.001 0.09A 0.004
14 0.03A 0.001 0.18A 0.026 N/D - 0.13A 0.010 0.07B 0.008 0.09B 0.001 0.03A 0.002 0.02A 0.005 0.07A 0.026
21 0.03A 0.003 0.13B 0.013 N/D - 0.08B 0.013 0.04B 0.006 0.06B 0.009 N/D - 0.01B 0.001 0.08A 0.031
28 0.03A 0.004 0.13B 0.028 N/D - 0.08B 0.016 0.04B 0.011 0.05B 0.009 N/D - 0.01B 0.002 0.09A 0.016
Data were mean from 3 replications. For each column, letters design group of means which are not significantly different (student t test, P < 0.05). SD: standard deviation. N/D: not detected.

201
Table 19 Total fatty acids composition (% w/w dry rubber) of PB235 lipid extracts obtained from 3 conditions during 28 days of
maturation.
Conditions Days Components
C14:0 C16:0 C16:1 C18:0 C18:1 C18:2 C18:3 C20:0 FuFA Mean SD Mean SD Mean SD Mean SD Mean SD Mean SD Mean SD Mean SD Mean SD
Na+O-
0 N/D - 0.08a 0.001 0.02a 0.002 0.16a 0.010 0.07a 0.052 0.24a 0.015 0.02a 0.002 0.02a 0.001 1.55a 0.089
3 - - - - - - - - - - - - - - - - - -
5 N/D - 0.08a 0.004 0.02a 0.001 0.16a 0.009 0.10a 0.005 0.24a 0.012 0.02a 0.002 0.01a 0.001 1.47a 0.111
7 N/D - 0.08a 0.002 0.02a 0.001 0.16a 0.002 0.10a 0.002 0.24a 0.005 0.02a 0.001 0.01a 0.001 1.43a 0.044
14 N/D - 0.09a 0.006 0.02a 0.002 0.16a 0.011 0.09a 0.007 0.19b 0.018 0.02b 0.002 0.02a 0.000 1.42a 0.111
21 N/D - 0.09a 0.006 0.02a 0.001 0.17a 0.013 0.07a 0.050 0.17bc 0.008 0.02b 0.001 0.03a 0.011 1.42a 0.097
28 N/D - 0.09a 0.002 0.02a 0.001 0.16a 0.002 0.09a 0.002 0.16c 0.006 0.01b 0.002 0.03a 0.003 1.38a 0.096
Na-O-
0 N/D - 0.07α 0.002 0.02α 0.001 0.15α 0.006 0.09α 0.004 0.22α 0.009 0.02β 0.001 0.01α 0.001 1.28α 0.111
3 - - - - - - - - - - - - - - - - - -
5 N/D - 0.08α 0.002 0.02α 0.001 0.16α 0.008 0.09α 0.003 0.24α 0.006 0.02β 0.001 0.02α 0.001 1.41α 0.085
7 N/D - 0.09α 0.003 0.02α 0.001 0.17α 0.003 0.10α 0.003 0.25α 0.007 0.03αβ 0.001 0.02α 0.002 1.50α 0.041
14 N/D - 0.10α 0.006 0.02α 0.001 0.18α 0.013 0.10α 0.006 0.25α 0.023 0.02γ 0.001 0.02α 0.002 1.59α 0.099
21 N/D - 0.10α 0.015 0.02α 0.003 0.19α 0.026 0.10α 0.015 0.23α 0.029 N/D - 0.03α 0.010 1.65α 0.260
28 N/D - 0.09α 0.026 0.02α 0.007 0.16α 0.047 0.09α 0.026 0.22α 0.083 0.03α - 0.02α 0.003 1.46α 0.449
Na-O+
0 N/D - 0.07C 0.002 0.02A 0.001 0.15A 0.006 0.09A 0.004 0.22A 0.009 0.02A 0.001 0.01A 0.001 1.28AB 0.111
3 - - - - - - - - - - - - - - - - - -
5 N/D - 0.08C 0.004 0.02A 0.001 0.17AB 0.008 0.09A 0.004 0.23A 0.010 0.02A 0.001 0.01A 0.001 1.42A 0.072
7 N/D - 0.09C 0.003 0.02A 0.001 0.17A 0.006 0.09A 0.004 0.24A 0.011 0.02A 0.001 0.02A 0.001 1.47A 0.037
14 0.03A 0.003 0.18A 0.010 N/D - 0.14A 0.010 0.03B 0.003 0.04B 0.004 N/D - 0.01A 0.001 1.25AB 0.109
21 0.03A 0.004 0.15B 0.025 N/D - 0.10C 0.015 0.02B 0.005 0.03B 0.003 N/D - 0.01A 0.002 1.10B 0.137
28 0.02A 0.002 0.15B 0.013 N/D - 0.10C 0.010 0.02B 0.003 0.02B 0.002 N/D - 0.01A 0.001 1.00B 0.078
Data were mean from 3 replications. For each column, letters design group of means which are not significantly different (student t test, P < 0.05). SD: standard deviation. N/D: not detected.

202
Table 20 Unsaponifiable composition (% w/w dry rubber) of RRIM600 lipid extracts obtained from 3 conditions during 28 days of
maturation.
Conditions Days Components
C18-OH C20-OH γ-tocotrienol α-tocotrienol Stigmasterol β-sitosterol Δ5-avenasterolMean SD Mean SD Mean SD Mean SD Mean SD Mean SD Mean SD
Na+O-
0 0.02a 0.002 0.01a 0.001 0.15a 0.021 0.03a 0.001 0.08a 0.001 0.49a 0.003 0.08a 0.003
3 0.02a - 0.01a - 0.09a - 0.03a - 0.08ab - 0.52ab - 0.08a -
5 N/D - 0.01a 0.001 0.11a 0.022 0.03a 0.001 0.07ab 0.007 0.46ab 0.043 0.07a 0.002
7 0.02a 0.003 0.01a 0.001 0.11a 0.025 0.03a 0.003 0.07ab 0.004 0.45ab 0.018 0.07a 0.005
14 0.02a 0.002 0.01a 0.001 0.12a 0.065 0.03a 0.006 0.08a 0.004 0.53a 0.025 0.08a 0.012
21 0.01a 0.002 0.01a 0.001 0.12a 0.049 0.02a 0.009 0.05b 0.017 0.32b 0.118 0.05a 0.021
28 0.02a 0.002 0.01a 0.002 0.14a 0.039 0.03a 0.005 0.08a 0.005 0.49a 0.023 0.08a 0.008
Na-O-
0 0.02α 0.001 0.01α 0.000 0.12α 0.029 0.03β 0.002 0.08αβ 0.003 0.65α 0.016 0.08α 0.006
3 0.02α 0.001 0.01α 0.001 0.10α 0.006 0.03β 0.002 0.07αβ 0.003 0.61α 0.028 0.07α 0.005
5 0.02α 0.003 0.01α 0.002 0.18α 0.066 0.05α 0.008 0.11α 0.008 0.52α 0.037 0.09α 0.011
7 0.02α 0.002 0.01α 0.001 0.16α 0.029 0.04αβ 0.004 0.08αβ 0.009 0.49α 0.064 0.08α 0.011
14 0.02α 0.001 0.01α 0.001 0.13α 0.053 0.04αβ 0.009 0.07αβ 0.007 0.48α 0.034 0.07α 0.009
21 0.02α 0.002 0.01α 0.000 0.17α 0.034 0.05αβ 0.003 0.10αβ 0.005 0.46α 0.024 0.09α 0.006
28 0.02α 0.004 0.01α 0.003 0.12α 0.076 0.04αβ 0.005 0.06β 0.041 0.38α 0.253 0.09α 0.008
Na-O+
0 0.02A 0.001 0.02A 0.0001 0.12A 0.029 0.03A 0.002 0.08A 0.003 0.49AB 0.016 0.08AB 0.006
3 0.02A 0.001 0.01B 0.0002 0.13A 0.025 0.03A 0.002 0.07AB 0.003 0.49Ab 0.020 0.07AB 0.006
5 0.02A 0.001 0.01B 0.0002 0.04A 0.015 0.03A - 0.08A 0.006 0.52A 0.039 0.08A 0.006
7 0.02A 0.001 0.01b 0.0005 0.13A 0.034 0.03A 0.006 0.08A 0.010 0.49Ab 0.061 0.08AB 0.009
14 0.02A - N/D - 0.07A 0.045 0.02A 0.009 0.06B 0.007 0.39B 0.047 0.06B 0.003
21 N/D - 0.01B - 0.11A 0.070 0.03A 0.007 0.07AB 0.005 0.39B 0.017 0.07AB 0.000
28 0.02A 0.000 N/D - 0.08A 0.032 0.03A 0.006 0.07AB 0.004 0.42AB 0.033 0.06B 0.008
Data were mean from 3 replications. For each column, letters design group of means which are not significantly different (student t test, P < 0.05). SD: standard deviation. N/D: not detected.

203
Table 21 Unsaponifiable composition (% w/w dry rubber) of PB235 lipid extracts obtained from 3 conditions during 28 days of
maturation
Conditions Days Components
C18-OH C20-OH γ-tocotrienol α-tocotrienol Stigmasterol β-sitosterol Δ5-avenasterolMean SD Mean SD Mean SD Mean SD Mean SD Mean SD Mean SD
Na+O-
0 0.03a 0.003 0.02a 0.001 0.09a 0.007 0.04a - 0.03a 0.002 0.23a 0.012 0.07ab 0.004
3 - - - - - - - - - - - - - -
5 0.03a 0.002 0.02a 0.001 0.10a 0.003 0.04a - 0.02a 0.004 0.21a 0.028 0.07ab 0.004
7 0.01a 0.000 0.02a 0.000 0.07a 0.006 N/D - N/D - 0.10a 0.006 0.06b 0.000
14 0.02a 0.002 0.02a 0.003 0.04a 0.003 N/D - 0.02a 0.004 0.22a 0.018 0.07ab 0.005
21 0.04a 0.013 0.02a 0.004 0.12a 0.072 0.06a 0.008 0.04a 0.019 0.32a 0.184 0.09a 0.023
28 0.03a 0.009 0.02a 0.002 0.11a 0.033 0.04a 0.002 0.04a 0.006 0.28a 0.049 0.07ab 0.002
Na-O-
0 0.03αβ 0.004 0.02α 0.000 0.11αβ 0.003 N/D - 0.03α 0.001 0.22αβ 0.003 0.07αβ 0.002
3 - - - - - - - - - - - - - -
5 0.01β 0.004 0.02α 0.001 0.05β 0.002 N/D - N/D - 0.09β 0.003 0.06β 0.003
7 0.02αβ 0.004 0.02α 0.001 0.05αβ 0.015 N/D - 0.02α 0.002 0.24αβ 0.009 0.08αβ 0.004
14 0.04α 0.004 0.02α 0.001 0.09αβ 0.045 0.05α 0.006 0.04α 0.009 0.38α 0.102 0.09αβ 0.009
21 0.04α 0.004 0.02α 0.000 0.15α 0.043 0.04α 0.006 0.05α 0.004 0.40α 0.034 0.10α 0.011
28 0.03αβ 0.003 0.02α 0.004 0.09αβ 0.039 0.04α 0.005 0.04α 0.008 0.34α 0.102 0.08αβ 0.024
Na-O+
0 0.03A 0.000 0.02A 0.001 0.11A 0.003 N/D - 0.03A 0.001 0.22AB 0.003 0.07A 0.002
3 - - - - - - - - - - - - - -
5 0.02A 0.012 0.02A - 0.07A 0.036 N/D - 0.03A - 0.15B 0.106 0.07A 0.015
7 0.03A 0.004 0.02A 0.003 0.07A 0.039 0.04A - 0.03A 0.003 0.20AB 0.101 0.07A 0.014
14 0.02A 0.010 0.02A 0.001 0.06A 0.031 0.04A - 0.03A 0.015 0.25AB 0.085 0.07A 0.005
21 0.03A 0.003 0.02A 0.002 0.13A 0.078 0.04A 0.012 0.04A 0.005 0.39A 0.021 0.08A 0.018
28 0.03A 0.001 0.02A 0.001 0.11A 0.042 0.03A 0.002 0.04A 0.001 0.30AB 0.024 0.07A 0.008
Data were mean from 3 replications. For each column, letters design group of means which are not significantly different (student t test, P < 0.05). SD: standard deviation. N/D:not detected.

204
Table 22 Absolute initial slope value of RRIM600 and PB235 lipid extracts obtained from 3 conditions during 28 days of maturation.
Maturation time (days)
RRIM600 clone PB235 clone Conditions Conditions
Na+O- Na-O- Na-O+ Na+O- Na-O- Na-O+ Mean SD Mean SD Mean SD Mean SD Mean SD Mean SD
0 10.9c 0.17 13.4abc 0.07 13.4abc 0.07 11.3a 0.23 11.0a 1.41 11.0a 1.41 3 11.2bc 1.03 12.7abc 0.05 11.1bc 1.22 - - - - - - 5 12.7b 0.16 10.2d 0.51 10.5c 0.52 10.5bc 0.16 8.94a 1.13 6.92b 0.35 7 14.8a 0.26 12.0bcd 1.46 12.0bc 0.23 11.2ab 0.12 8.29a 0.03 8.48ab 0.71 14 15.1a 0.25 11.9cd 0.88 15.9a 0.81 9.60d 0.21 9.23a 1.07 9.70ab 0.70 21 14.9a 0.39 14.5ab 0.38 15.4a 0.96 10.3cd 0.25 4.14b 1.32 10.8a 0.78 28 15.1a 0.09 14.8a 0.47 13.9ab 1.06 10.6abc 0.09 9.13a 0.26 10.4a 0.52
Data were mean from 3 replications. For each column, letters design group of means which are not significantly different (student t test, P < 0.05). SD: standard deviation.