Embed Size (px)
Citation preview

Ph.D dissertation
Economic Analysis of Suicide Problem
Saki Sugano([email protected])
University of TokyoJapan Society of Promotion of Science
January 16, 2012
1

Outline
Chapter 1. Introduction
Chapter 2. Socio-Economic Studies on Suicide: A Survey
Chapter 3. An Analysis of Suicide in Japan, 1997-2007: Changes in Incidence, Persistence, and Age Profiles
Chapter 4. Economic Recession, Unemployment and Suicide
Chapter 5. Those Who are Left Behind: An Estimation of the Number of Family Members of Suicide Victims in Japan
2

Chapter 1. IntroductionIncrease of suicide since 1990s is one of most serious issue faced in Japan and other countries.
Worldwide
• Every year, about 1,000,000 people commit suicide. everyday.
• Suicide rates have increased by 60% in last 45 years.
Japan
• One of highest suicide rate country
3

Source: WHO, 2002
Evolution of Global Suicide Rates 1950-2000
Suicide rates have increased by 60% in last 45 years.
suicide rate(per 100,000)
4

Suicide Rate Top10 in OECD
Source: WHO, http://www.who.int/mental_health/prevention/suicide/country_reports/en/index.html
country total male female1 Hungary 26 42.3 11.22 Japan 24.4 35.8 13.73 Korea 21.9 29.6 14.14 Finland 18.8 28.9 95 Belgium 18.2 27.2 9.56 Switzerland 17.5 23.5 11.77 France 17 25.5 98 Austria 15.4 23.8 7.49 Poland 15.2 26.8 4.410 Czech Republic 13.3 22.7 4.3
5
(per 100,000)
5

Map of Suicide Rates
Source: WHO, Suicide prevention programhttp://www.who.int/mental_health/prevention/suicide/suicideprevent/en/
per 100,000. most recent year available as of 2011
6

Time-series of Suicide Rate
suicide rate(per 100,000)
source: WHO, Mortality Database, Chen, Choi and Sawada (2009)
7

Why Address Suicide through Economics? (1)
• Economists examine individual decision problems.
• From traditional economics issues - consumption, investment, etc. - to broader issues - marriage, politics, education and suicide.
• Economists uncover mechanism and motivations for individual decision behaviors.
• Suicidal behavior is also individual choice and it economic analysis can shed new light on human decision-making behavior.
8

Japan has
• “Tradition of suicide”
• Religious origin (↔ Islam, Catholicism)
Suicide is act of free will.
However, these reasons do not explain recent rise in suicide in Japan. (This thesis does not examine cultural reason. )
Why Address Suicide through Economics? (2)
9

Why do we need to study this issue?
1. Suicide brings emotional burden to family and friends.
2. Enough support may be able to overcome personal crisis and prevent suicide.
3. Negative external effects and social costs.
4. Suicide may be driven by economic incentives. i.e.) life insurance
Why Address Suicide through Economics? (3)
10

Chapter 2
Socio-Economic Studies on Suicide: A Survey
(co-authored with Chen, Choi, Mori and Sawada)
Journal of Economic Surveys, forthcoming, published online first in 2010
1. Introduction
2. Economic Theories on Suicide
3. Empirical Perspectives
4. Meta-Regression Analysis
5. Recent Developments in Economic Studies on Suicide
6. Concluding Remarks
11

• Harmermesh and Soss (1974) is first economic theory of suicide and applies utility maximization framework.
• Individual chooses to suicide when discounted lifetime utility falls below threshold.
• Lower income, higher unemployment and aging increase suicide rate.
2.2 Suicide Research: Economic Theory (1)
PsychologistsPhysicians ⇔
Economist
irrational behavior⇔
rational behavior
12

• Koo and Cox (2008) extend Harmermesh and Soss and include human capital as another primary determinant of expected utility.
• Human capital depreciates during unemployment and middle-aged group suffer most when unemployed because they take longer to adjust to new labor market conditions.
• Dicit and Pindyck (1994), Cutler et al. (2001), Suzuki (2008) use real option approach. Suicide is irreversible decision. There is option of staying alive and waiting to see if situation will improve.
2.2 Suicide Research: Economic Theory (2)
13

Suicide Attempts : as signals of needs for help.
Rosenthal (1993), Cutler (2001) Marcotte (2003)
Accessibility and Instrumentality
1. Easy access to lethal means lowers costs of suicide. No published economic study.
2. Limiting means of suicide drive people to use different means and hence does not prevent suicide (Whiteman, 2000).
Contagion Theory no economic theory
2.2 Suicide Research: Economic Theory (3)
14

• Explain relationship between socio-economic factors and suicide.
• Regression method
• Aggregate data at country, regional or group level.
• Most studies use suicide rate as dependent var. ex) total suicide rate, gender- or age-specific suicide rate, natural logarithm of suicide rate
• Indep. var is income, education, income inequality, unemployment, female labor participation, divorce, birth rate, household size, religion, climate, health.
2.2 Suicide Research: Empirical Perspectives
15

• Explain relationship between socio-economic factors and suicide.
• Regression method
• Aggregate data at country, regional or group level.
• Most studies use suicide rate as dependent var. ex) total suicide rate, gender- or age-specific suicide rate, natural logarithm of suicide rate
• Indep. var is income, education, income inequality, unemployment, female labor participation, divorce, birth rate, household size, religion, climate, health.
2.3 Suicide Research: Empirical Perspectives
16

Income
• Real GDP per capita, economic growth, average growth rate of real income, median family income
• Since data are not individual but country or group average data, direct causality between individual economic situation and decision to suicide are not necessarily explained.
• Most studies find that countries with low income or low GDP per capita have higher suicide rates. However, some point out impact of income is asymmetric across age-gender groups and urbanization. (Chen et al. 2008, Huang 1996, Rodrigues, 2006)
Economic Variables
17

Education
• Existing studies showed mixed results(Barnes, 1975,
Faupel et al., 1987, Klick and Markowitz, 2003).
Income Inequality
• Empirical evidence is mixed. Some studies find significantly positive on suicide rate (Daly and Wilson,
2006, Chen et al., 2008 ), while others do not (Neumayer, 2004, Rodriguez, 2005).
Unemployment
• High unemployment rate have positive association with high suicide rate (Platt and Howton, 2000).
Economic Variables
18

Female Labor Force Participation
• Many studies show that high suicide rate is associated with high female labor participation rates (Rodriguez, 2005, 2006, Chen et al, 2008, Koo and Cox,
2008). Some shows increasing female labor participation results in lowering suicide rates (Faupel et al, 1987, Burr et al, 1994).
Divorce
• Male suicide rate is more sensitive to divorce(Neumayer, 2003, Watanabe et al., 2006, Chen et al., 2008).
Demography: Birth rate, Migration, Population
Social Variables
19

Religion
• Some studies find that countries or areas with high levels of religiosty (Catholic, Protestant and Muslim) tend to have lower suicide rates.(Faupel et al, 1987, Burr et al, 1994).
Homicide
Geographical and Climate Conditions
• Sunlight exposure time has mixed results(Helliwell, 2007, Neumayer, 2003).
Health Care and Alcohol Consumption
Other Variables
20

Empirical studies shows wide difference in results.
Meta-regression analysis investigates whether impact of major economic variables on suicide rates can be attributed to specific characteristics of individual studies (Stanley et al, 2008).
Estimation equation:
where we regress t-stat of variable of interest on inverse of s.e., explanatory var. divided by s.e. β0: publication bias, β: true effect of variable of interest, α: biasing effect of particular study characteristics, v: disturbance term.
we choose following socio-economic factors: income, income inequality, unemployment, female labor participation, divorce rate and alcohol consumption.
2.4 Meta-Regression Analysis
tj = β0 + β(1/sej) +K�
k=1
αkzjk/sej + vj
21

Data
• 189 regression results from 24 papers.
Results
• For income, there exist publication bias toward larger negative impact on suicide rate.
• For unemployment, there exist publication bias toward larger positive impact on suicide rate.
• For divorce, there exist publication bias toward larger positive impact on suicide rate.
2.4 Meta-Regression Analysis
22

26C
HE
NE
TA
L.Table 4. Meta-Regression Analysis.
(1) (2) (3) (4) (5) (6) (7) (8) (9) (10)
1. Income!0 !2.461""" !2.383""" !2.385""" !2.351""" !2.253""" !2.077""" !2.161""" !2.441""" !2.468""" !2.564"""
[0.366] [0.358] [0.359] [0.364] [0.377] [0.376] [0.386] [0.454] [0.465] [0.475]1/se 5.70E-09 3.1E-05""" 3.1E-05""" !6.70E-05 !9.60E-05 !2.90E-05 !0.016 !0.057 !0.056 !0.043
[5.023E-09] [1.036E-05] [1.037E-05] [1.203E-04] [1.219E-04] [3.990E-05] [0.016] [0.126] [0.127] [0.128]GMM/se 0 !0.001 0 !0.005""" !0.005""" !0.005"""
[0.000] [0.000] [0.000] [0.002] [0.002] [0.002]random/se !0.359""" !0.354"" !0.291 !0.292 !0.289
[0.137] [0.137] [0.176] [0.178] [0.179]Observations 170 170 170 170 170 170 170 166 166 166R2 0.01 0.06 0.06 0.07 0.08 0.12 0.13 0.2 0.2 0.212. Income inequality!0 !0.395 !0.253 !0.241 !0.256 !0.546 !0.254 !0.254 !0.071 0.268 0.197
[0.295] [0.308] [0.310] [0.313] [0.362] [0.299] [0.299] [0.292] [0.297] [0.309]1/se 0.003""" 0.005""" 0.002 0.002 !0.003 !0.040""" !0.040""" !0.020" !0.018" !0.019"
[0.001] [0.002] [0.004] [0.005] [0.006] [0.008] [0.008] [0.011] [0.010] [0.010]AR1/se 0.006 0.005 0.005 0.007"" 0.007"" 0.007""
[0.004] [0.003] [0.003] [0.003] [0.003] [0.003]fixed/se 0.039""" 0.039""" 0.041""" 0.042""" 0.042"""
[0.007] [0.007] [0.006] [0.006] [0.006]unstandardized/se !0.013""" !0.015""" !0.014"""
[0.005] [0.004] [0.005]Observations 70 70 70 70 70 70 70 70 70 70R2 0.09 0.12 0.13 0.13 0.19 0.47 0.47 0.53 0.6 0.633 Unemployment!0 1.048""" 0.986""" 0.998""" 0.935""" 1.038""" 1.083""" 0.934""" 0.941""" 0.938""" 0.960"""
[0.201] [0.210] [0.209] [0.219] [0.220] [0.209] [0.225] [0.227] [0.230] [0.230]1/se !0.005" !0.003 0.009 0.007 !0.009 !0.044""" !0.037""" !0.031" !0.030" !0.039"
[0.003] [0.006] [0.010] [0.010] [0.010] [0.012] [0.012] [0.017] [0.018] [0.022](time series)/se 0.179""" 0.191""" 0.225""" 0.190""" 0.183""" 0.183""" 0.195"""
[0.060] [0.063] [0.058] [0.061] [0.063] [0.064] [0.065]
JournalofEconom
icSurveys
(2010)C #
2010B
lackwell
PublishingL
td
SOC
IO-E
CO
NO
MIC
STU
DIE
SO
NSU
ICID
E27
Table 4. Continued
(1) (2) (3) (4) (5) (6) (7) (8) (9) (10)
(time series reg)/se 1.271!!! 1.249!!! 1.317!!! 1.312!!! 1.315!!! 1.307!!!
[0.370] [0.341] [0.341] [0.342] [0.345] [0.344]fixed/se 0.080!!! 0.066!!! 0.061!!! 0.061!!! 0.065!!!
[0.017] [0.019] [0.022] [0.022] [0.023]rate/se 0.033! 0.037! 0.037! 0.03
[0.020] [0.022] [0.022] [0.024]Observations 134 128 128 128 128 128 128 128 128 128R2 0.03 0.02 0.04 0.11 0.29 0.41 0.42 0.43 0.43 0.454. Female labour force participation!0 0.487! 0.484! 0.664!! 1.059!!! 0.555! 0.636!! 0.242 0.237 0.277 0.392
[0.263] [0.266] [0.298] [0.349] [0.307] [0.305] [0.260] [0.256] [0.266] [0.269]1/se 0.009!!! 0.008 0.023 0.033!! "0.013 0.025 0.023 0.042!! 0.044!! 0.018
[0.003] [0.010] [0.014] [0.015] [0.013] [0.019] [0.016] [0.019] [0.019] [0.022](cross section)/se "0.213!!! "0.142!! "0.188!!! "0.147!!! "0.167!!! "0.173!!! "0.156!!!
[0.068] [0.055] [0.057] [0.047] [0.048] [0.049] [0.049](time series)/se 0.093 0.197!! 0.148 0.234!!! 0.216!!! 0.210!! 0.219!!!
[0.124] [0.097] [0.097] [0.082] [0.081] [0.082] [0.080]AR1/se 0.060!!! 0.060!!! 0.053!!! 0.056!!! 0.056!!! 0.054!!!
[0.007] [0.007] [0.006] [0.006] [0.006] [0.006]fixed/se "0.035!!! "0.041!!! "0.040!!! "0.040!!! "0.034!!!
[0.013] [0.011] [0.011] [0.011] [0.012]rate/se "0.041!!! "0.039!!! "0.039!!! "0.040!!!
[0.006] [0.006] [0.006] [0.006]unstandardized/se "0.014! "0.014! "0.008
[0.007] [0.008] [0.008]Observations 104 104 104 104 104 104 104 104 104 104R2 0.07 0.07 0.08 0.18 0.53 0.56 0.7 0.71 0.71 0.745. Divorce!0 2.853!!! 3.336!!! 3.159!!! 2.967!!! 3.092!!! 2.827!!! 2.717!!! 2.741!!! 2.723!!! 2.511!!!
[0.254] [0.235] [0.241] [0.237] [0.244] [0.237] [0.243] [0.245] [0.250] [0.267]1/se "0.017!! "0.116!!! "0.009 "0.062 "0.034 0.073 0.101 0.142 0.139 0.190!
[0.007] [0.017] [0.046] [0.047] [0.059] [0.074] [0.075] [0.090] [0.091] [0.100]
JournalofEconom
icSurveys
(2010)C #
2010B
lackwell
PublishingL
td
23

Chapter3
An Analysis of Suicides in Japan, 1997-2007: Changes in Incidence, Persistence, and Age Profiles
(co-authored with Chen, Choi, Mori and Sawada)
1. Introduction
2. Decomposition of Japanese Suicides
3. Regression Analysis
4. Concluding Remarks
24

Typical Causes of Death in Japan (2008)
• Cancer 342,963
• Cerebrovascular disease 127,023
• Cardiac disease 181,928
• Old age 35,975
• Suicide 30,229
• Traffic accident 7,499
(Source) Vital Statistics, Ministry of Health, Labour and Welfare
cf) Great East Japan Earthquake 20,000~
25
25

26
age 1 2 3
20~39 Suicide7690
Cancer3057
Freak accident
2343
40~59Cancer35674
Suicide10976
Cardiac disease10931
60-79 Cancer177029
Cardiac disease54376
Cerebrovasc-ular disease
38852
Typical Causes of Death in Japan (2008)
26

15,000
20,000
25,000
30,000
35,000
90 91 92 93 94 95 96 97 98 99 00 01 02 03 04 05 06 07 08
Source: MHLW, The Vital Statistics and The Population Estimates
27
Number of Suicides in Japan 1990-2008 suicides
27

15,000
20,000
25,000
30,000
35,000
90 91 92 93 94 95 96 97 98 99 00 01 02 03 04 05 06 07 08
JUMP
23,494
31,755
Source: MHLW, The Vital Statistics and The Population Estimates
28
suicides
Number of Suicides in Japan 1990-2008
28

15,000
20,000
25,000
30,000
35,000
90 91 92 93 94 95 96 97 98 99 00 01 02 03 04 05 06 07 08
PERSISTENCY
30,229
Source: MHLW, The Vital Statistics and The Population Estimates
29
31,755
Number of Suicides in Japan 1990-2008 suicides
29

15,000
20,000
25,000
30,000
35,000
90 91 92 93 94 95 96 97 98 99 00 01 02 03 04 05 06 07 08
PERSISTENCY
30,229
Source: MHLW, The Vital Statistics and The Population Estimates
30
Number of Suicide in Japan, 1990-2008
JUMP
23,494
31,755
Number of Suicides in Japan 1990-2008 suicides
30

Chapter3. Research Question
1. Why has the number of suicides in Japan increased so dramatically in 1998?
2. Why has the number of suicides remained at an all-time high since the late 1990s?
31
31

What happened in Japan from 1997 to 1998?
• Economic recession followed collapse of the bubble economy.
• Collapse of mega-banks
- Yamaichi Securities (1997)
- Long-Term Credit Bank of Japan (1998)
• Credit crunch
32
32

1. By Age and Gender
2. By Age, Gender, and Reason
3. By Occupation and Reason
4. By Means of suicide
15,000
20,000
25,000
30,000
35,000
90 91 92 93 94 95 96 97 98 99 00 01 02 03 04 05 06 07 08
Decompose this jump35% JUMP
Source: MHLW, Vital Statistics and Population Estimates
33
3.2. Decomposition of Japanese Suicidesuicides
33

Main Results
Abrupt increase in the number of suicides was mainly attributable to...
• Males aged 40-59 (38%, the largest group)
• Economic and health problems
• Unemployed people and business owners
→ Credit crunch in financial crisis affected them.
34
3.2. Decomposition of Japanese Suicide
34

• The Ministry of Health, Labour and Welfare(MHLW)
• The National Police Agency (NPA)
• We use both data set.
• None of two datasets published the individual records of suicide.
35
3.2. Decomposition of Japanese Suicide
- Data Set-
35

• “Vital Statistics” 1997-2007
• The Ministry of Health, Labour and Welfare(MHLW)
• Based on the death certificates submitted to the local office where the one had lived.
• The annual number of suicide by age, gender and method of committing suicide.
36
3.2. Decomposition of Japanese Suicide
- Data Set (1) -
36

• “The Annual Report on Suicide”
• The National Police Agency (NPA)
• Constructed from investigation records of the local police office.
• The annual aggregate number of suicides by occupation and reasons of committed suicide which don’t collect by MHLW data.
• The reasons are interpreted by wills.
37
3.2. Decomposition of Japanese Suicide
- Data Set (2) -
37

• Suppose y(t) is the function of variables x(t) where x(t)={xj, k(t)} is a J ×K matrix.
- j represents an individual or group- k is a variable of interest.
• Example : y=SCD, K=2, xj,1=SRj, xj,2=POPj
- SCD : The number of suicide - SRj : The suicide rate of group j
- POPj : The population of group j
• Group j is by Age and Gender and summing them over J groups.
y =J�
j=1
K�
k=1
xj,k
SCD =J�
j=1
SRj · POPj
38
3.2. Decomposition of Japanese Suicide
- Decomposition Formula-
38

• Decomposition of its change over time can be conducted by taking derivatives of the logarithm of y(t) with respect to t.
• cdj,k(t) is the effect (degree of contribution) of changes in xj,k(t) on changes in y(t)
(log(y(t)))� =∆y(t)y(t)
∼=J�
j=1
K�
k=1
��l �=k xj,l(t)
y(t)∆xj,k(t)
�
=J�
j=1
K�
k=1
cdj,k(t)
39
3.2. Decomposition of Japanese Suicide
- Decomposition Formula-
39

• Decompose the suicide number change by suicide rate and population.
• The degree of contribution of changes in each variables on change in suicide number.
SCD =J�
j=1
SRj · POPj
∆SCD
SCD=
J�
j=1
(cdj,1 + cdj,2)
=J�
j=1
(POPj
SCD∆SRj +
SRj
SCD∆POPj)
40
3.2. Decomposition of Japanese Suicide
- Decomposition Formula-
40

1. By Age and Gender
2. By Age, Gender, and Reason
3. By Occupation and Reason
4. By Means of suicide
15,000
20,000
25,000
30,000
35,000
90 91 92 93 94 95 96 97 98 99 00 01 02 03 04 05 06 07 08
Decompose this jump35% JUMP
Source: MHLW, The Vital Statistics and The Population Estimates
41
suicides
3.2.1 Decomposition of 1997-1998 Suicide Growth Rate
41

1. By Age and Gender
2. By Age, Gender, and Reason
3. By Occupation and Reason
4. By Means of suicide
15,000
20,000
25,000
30,000
35,000
90 91 92 93 94 95 96 97 98 99 00 01 02 03 04 05 06 07 08
Decompose this jump35% JUMP
Source: MHLW, The Vital Statistics and The Population Estimates
42
suicides
3.2.1 Decomposition of 1997-1998 Suicide Growth Rate
42

3.2.1 Decomposition from 1997 to 1998 by Age and Gender
AgeSum of the Degree of Contribution
MaleMale FemaleFemaleAge
Sum of the Degree of Contribution SR POP SR POP
00–19 1.1 0.8 –0.03 0.4 –0.0120–39 7.1 5.3 0.12 1.7 0.04
40–59 15.1 13.1 0.11 1.9 0.0660–79 9.8 6.4 0.47 2.7 0.26
80- 1.5 0.76 0.14 0.4 0.23Total 34.8 26.4 0.8 7.1 0.57
Source: MHLW, The Vital Statistics and The Population Estimates43
43

1. By Age and Gender
2. By Age, Gender, and Reason
3. By Occupation and Reason
4. By Means of suicide
15,000
20,000
25,000
30,000
35,000
90 91 92 93 94 95 96 97 98 99 00 01 02 03 04 05 06 07 08
Decompose this jump35% JUMP
Source: MHLW, The Vital Statistics and The Population Estimates
44
Number of Suicide in Japan, 1990-2008
3.2.1 Decomposition of 1997-1998 Suicide Growth Rate
suicides
44

• Decomposition by Gender-Age-Reasons
• Apply the decomposition formula to:
• SCDj counts the number of suicide in the jth cell of Gender-Age-Reasons(2×4×7=56)
SCD =J�
j=1
SCDj
45
3.2.1 Decomposition of 1997-1998 Suicide Growth Rate
45

5. Decomposition from 1997 to 1998
by Age-Gender-Reason (Male)
Age SumEconomic Health Work Family
Relationship School Others
00-19 0.58 0.03 0.22 0 0.05 0.04 0.09 0.15
20-39 5.43 1.72 1.22 0.93 0.45 0.29 0.11 0.71
40-59 12.9 6.49 3.37 1.44 0.92 0.11 0.00 0.55
60- 7.61 2.15 4.05 0.20 0.68 0.02 0.00 0.52
Sub-total
26.5 10.39 8.85 2.57 2.09 0.46 0.21 1.93
Source : NPA, the Annual Report on Suicide
46
46

5. Decomposition from 1997 to 1998
by Age-Gender-Reason (Female)
Age Sum Health FamilyEcono
mic WorkRelations
hip School Others
00-19 0.36 0.03 0.07 -0.004 0.01 0.05 0.10 0.12
20-39 1.82 0.95 0.34 0.00 0.16 0.23 0.03 0.11
40-59 1.91 0.87 0.48 0.37 0.09 -0.03 0.00 0.14
60- 3.87 2.95 0.57 0.21 0.01 0.02 0.00 0.11
Sub-total
7.97 4.80 1.45 0.58 0.27 0.26 0.13 0.48
Source : NPA, the Annual Report on Suicide
47
47

1. By Age and Gender
2. By Age, Gender, and Reason
3. By Occupation and Reason
4. By Means of suicide
15,000
20,000
25,000
30,000
35,000
90 91 92 93 94 95 96 97 98 99 00 01 02 03 04 05 06 07 08
Decompose this jump35% JUMP
Source: MHLW, The Vital Statistics and The Population Estimates
48
Number of Suicide in Japan, 1990-2008
3.2.1 Decomposition of 1997-1998 Suicide Growth Rate
suicides
48

5. Decomposition from 1997 to 1998
by Occupation-Reason
Occupation Sum HealthEconomic Family Work
Relationship School Others
Unemployed 15.6 8.47 3.74 1.43 0.30 0.21 0.05 1.36
Employed 9.4 2.26 3.0 1.12 2.1 0.42 0 0.51Self-
employed5.7 1.20 3.63 0.47 0.15 0.02 0 0.23
Housewife or husband
2.2 1.31 0.18 0.59 0.02 0.02 0 0.05
Supervisory 0.8 0.16 0.43 -0.03 0.26 0.01 0 -0.00Student 0.8 0.23 0.02 0.03 0.01 0.03 0.27 0.15
Total 34.4 13.6 11.0 3.61 2.84 0.72 0.33 2.31
Source : NPA, the Annual Report on Suicide
49
49

• Middle aged men contributed most to the jump in suicide number.
• Unemployed with health problem and self-employed with economic problem who committed suicide push up the suicides.
• Note that health problem is often linked to other problems.
50
3.2.1 Decomposition of 1997-1998 Suicide Growth Rate -Results-
50

Chapter3. Research Question
1. Why has the number of suicides in Japan increased so dramatically in 1998?
2. Why has the number of suicides remained at an all-time high since the late 1990s?
51
51

15,000
20,000
25,000
30,000
35,000
90 91 92 93 94 95 96 97 98 99 00 01 02 03 04 05 06 07 08
PERSISTENCY(-1.92%)
Source: MHLW, The Vital Statistics and The Population Estimates
52
Number of Suicide in Japan, 1990-2008
3.2.2 Decomposition of 1998-2007 Suicide Growth Rate
suicides
52

15,000
20,000
25,000
30,000
35,000
90 91 92 93 94 95 96 97 98 99 00 01 02 03 04 05 06 07 08
PERSISTENCY(-1.92%)
• By Age and Gender
• By Age, Gender, and Reason
• By Occupation and Reason
• By Means of suicide
Decompose the persistency
Source: MHLW, The Vital Statistics and The Population Estimates
53
suicides
3.2.2 Decomposition of 1998-2007 Suicide Growth Rate
53

15,000
20,000
25,000
30,000
35,000
90 91 92 93 94 95 96 97 98 99 00 01 02 03 04 05 06 07 08
PERSISTENCY(-1.92%)
• By Age and Gender
• By Age, Gender, and Reason
• By Occupation and Reason
• By Means of suicide
Decompose the persistency
Source: MHLW, The Vital Statistics and The Population Estimates
54
suicides
3.2.2 Decomposition of 1998-2007 Suicide Growth Rate
54

Age Group
Sum of cd
MaleMale FemaleFemaleAge Group
Sum of cd SR POP SR POP
00–19 –0.66 –0.3 –0.26 0.06 –0.13
20–39 2.6 2.1 –0.3 1.0 –0.26
40–59 –4.4 –2.5 –0.9 –0.75 –0.22
60–79 0.8 –2.3 3.9 –2.5 1.6
80– 0.17 –1.1 1.7 –2.2 1.7
Total –1.5 –4.1 4.1 –4.3 2.7
Source: MHLW, The Vital Statistics and The Population Estimates55
3.2.2 Decomposition of 1998-2007 Suicide Growth Rate by age and gender
55

The inertia or persistency of high suicide rates is mostly caused by increase in the suicide rates of young generation (age 20-39).
56
3.2.1 Decomposition of 1997-1998 Suicide Growth Rate -Results-
56

15,000
20,000
25,000
30,000
35,000
90 91 92 93 94 95 96 97 98 99 00 01 02 03 04 05 06 07 08
PERSISTENCY(-1.92%)
• By Age and Gender
• By Age, Gender, and Reason
• By Occupation and Reason
• By Means of suicide
Decompose the persistency
Source: MHLW, The Vital Statistics and The Population Estimates
57
Number of Suicide in Japan, 1990-2008
suicides
3.2.2 Decomposition of 1998-2007 Suicide Growth Rate
57

Age Sum Health Economic
Family Work Relationship
School Others
00-19 -0.1 -0.01 -0.01 0.1 0.01 -0.1 -0.1 0.03
20-39 4.3 1.5 1.0 0.6 0.6 0.1 0.2 0.3
40-59 0.5 -0.3 0.01 0.9 0.2 0.1 0.0 -0.4
60- 3.9 1.6 1.4 0.6 0.1 0.1 0.0 0.2
Sub-total 8.7 2.8 2.3 2.2 0.9 0.2 0.1 0.1
Note: The sample is limited to those who left a will. The overall suicide numbers have been slightly declining within this period.
Source: MHLW, The Vital Statistics and The Population Estimates58
3.2.2 Decomposition from 1998 to 2006
by Age-Reasons (Male)
58

15,000
20,000
25,000
30,000
35,000
90 91 92 93 94 95 96 97 98 99 00 01 02 03 04 05 06 07 08
PERSISTENCY(-1.92%)
• By Age and Gender
• By Age, Gender, and Reason
• By Occupation and Reason
• By Means of suicide
Decompose the persistency
Source: MHLW, The Vital Statistics and The Population Estimates
59
Number of Suicide in Japan, 1990-2008
suicides
3.2.2 Decomposition of 1998-2007 Suicide Growth Rate
59

Occupation Sum Health Economic
Family Work Relationship
School
Others
Unemployed 7.77 3.54 2.87 0.88 0.25 0.03 -0.01 0.21
Employed 4.99 0.89 2.15 1.18 0.79 0.17 -0.01 -0.17
Housewife or husband 1.34 0.96 0.37 0.05 -0.02 -0.05 0.00 0.04
Student 0.58 0.29 0.07 0.05 0.01 -0.09 0.20 0.05
Supervisory -0.42 -0.29 -0.38 0.05 0.21 0.04 0.00 -0.05
Self-employed -1.54 0.19 -1.82 0.15 -0.02 -0.02 0.00 -0.02
Total 12.72 5.58 3.25 2.35 1.22 0.08 0.19 0.05Source: MHLW, The Vital Statistics and The Population Estimates
60
3.2.2 Decomposition from 1998 to 2006
by Occupations-Reasons
60

Decomposition of Changes by Occupation
YearSuicide Growth
Rate
Unemployed
EmployedSelf-employed
Housewife or husband
Supervisory
Student
1997-1998 34.4 15.6 9.4 5.7 2.2 0.8 0.8
1998-2007 -1.177 0.119 1.074 -2.224 -0.04 -0.299 0.192
Source: MHLW, The Vital Statistics and The Population Estimates
61
3.2.2 Decomposition by Occupations
1997-1998 vs 1998-2007
61

• Suicide growth for those employed people contributes the most in 1999-2006.
• Self-employed contributes to decline suicide growth rate in 1999-2006, contrary to jump in 1997 and 1998.
62
3.2.2 Decomposition of 1998-2007 Suicide Growth Rate -Results-
62

15,000
20,000
25,000
30,000
35,000
90 91 92 93 94 95 96 97 98 99 00 01 02 03 04 05 06 07 08
PERSISTENCY(-1.92%)
• By Age and Gender
• By Age, Gender, and Reason
• By Occupation and Reason
• By Means of suicide
Decompose the persistency
Source: MHLW, The Vital Statistics and The Population Estimates
63
Number of Suicide in Japan, 1990-2008
3.2.2 Decomposition of 1998-2007 Suicide Growth Rate
63

Male Female
Hanging -0.74 -0.828
Gas poisoning 4.15 0.852
Drug overdosing -0.769 -0.334
Drowning -0.583 -0.692
Jumping from high place -1.036 -0.144
Jumping to moving object -0.276 -0.141
Others -1.354 -0.465
-0.608 -1.751
Source : NPA, the Annual Report on Suicide
64
3.2.2 Decomposition from 1998 to 2007
by Means of Suicides
64

Male Female
Hanging 24.083 6.619
Gas poisoning 1.349 0.085
Drug overdosing -0.136 -0.226
Drowning 0.26 0.136
Jumping from high place 1.328 0.817
Jumping to moving object 0.094 0.051
Others 0.468 0.145
Total 27.445 7.627
Source : NPA, the Annual Report on Suicide
65
3.2.2 Decomposition from 1997 to 1998
by Means of Suicides
65

• Hamermesh and Soss(1974) says that people commit suicide when their expected utility falls below the living costs.
• If people come to get the suicide method more easily, their cost or barrier of suicide becomes lower.
• Gas poisoning is increasing dramatically in number after1998.
• It is often considered that internet enable us to share the information on how to suicide.
• We can, therefore, say that through internet people share the suicide methods and lower the cost or barrier of suicide.
66
3.2.2 Decomposition by Means of Suicides
66

Decomposition results shows:
1. Males aged 40-59 with financial problems contributed most to upsurge of suicides in 1998.
2. Self-employed had been affected by 1997 credit crunch.
3. Persistency of high suicide rate after 1998 has been attributed to young males aged 20-39 and employed.
⇒Link between economic hardship and suicide.
67
3.3 Regression Analysis
67

We use prefectural-level panel regressions to examine link, in particular, credit crunch and unemployment to male suicides aged 40-59 and 20-39.
Regression Model
where i: prefectures, t: years, αi: prefecture fixed effect, , αt: year fixed effects.
SR is suicide rate of all males, males aged 40-59, or males aged 20-39.
Independent var. is unemployment rate, firm bankruptcy rate, and individual bankruptcy rate.
68
3.3 Regression Analysis
SRi,t = β1Unempi,t + β2Fbankrupti,t + β3Ibankrupti,t + αi + αt + �
68

Data
• 47 Japanese prefectures, yearly in 1997-2005
• Instrumental variables:
(1) Lending attitude of financial institution DI
(2) Financial position DI
• Both DIs were collected from each BOJ branch.
69
3.3 Regression Analysis
69

-30
-20
-10
0
10
20
30
40
Mar-95 Mar-96 Mar-97 Mar-98 Mar-99 Mar-00 Mar-01 Mar-02 Mar-03 Mar-04 Mar-05 Mar-06 Mar-07 Mar-08 Mar-09
Large enterprises Medium-sized enterprisesSmall enterprises
70
DI
Lending Attitude of Financial Institutions DI, quarterly in 1995-2009
70

71
3.3 Estimation Result: Male aged 40-59Suicide rate (1)Suicide rate (1) Suicide rate (2)Suicide rate (2)
Unemployment rate
0.01 0.072 –0.006 0.091**Unemployment rate [0.037] [0.047] [0.026] [0.045]
Firm bankruptcy rate
–1.915 1.115 –1.6 0.91Firm bankruptcy rate [1.923] [1.757] [1.274] [1.487]
Individual bankruptcy rate
3.321*** 0.522 3.360*** 0.182Individual bankruptcy rate [0.890] [1.084] [0.598] [1.047]
Constant0.413** 0.418***
Constant[0.195] [0.136]
Year dummy YES YES YES YES
Prefecture fixed effect
NO YES NO YES
Observations 363 363 363 363
N of prefectures 42 42
Sargan statistic 5.09 1.488 10.772 3.122
[P-val] [0.165] [0.685] [0.096] [0.793]
71

72
3.3 Estimation Result: Male aged 20-39Suicide rate (1)Suicide rate (1) Suicide rate (2)Suicide rate (2)
Unemployment rate
0.006 0.059 –0.007 0.079**Unemployment rate [0.020] [0.037] [0.014] [0.037]
Firm bankruptcy rate
–1.656 0.505 –1.243* 0.367Firm bankruptcy rate [1.028] [1.386] [0.690] [1.230]
Individual bankruptcy rate
1.229*** –0.811 1.401*** –1.2781Individual bankruptcy rate [0.476] [0.855] [0.324] [0.866]
Constant0.329*** 0.307***
Constant[0.104] [0.074]
Year dummy YES YES YES YES
Prefecture fixed effect
NO YES NO YES
Observations 363 363 363 363
N of prefectures 42 42
Sargan statistic 5.09 1.488 10.772 3.122
[P-val] [0.165] [0.685] [0.096] [0.793]
72

Chapter 4Economic Recession, Unemployment and Suicide
[不況・失業と自殺の関係についての一考察]
(co-authored with Sawada and Choi)
Japanese Journal of Labor Studies [日本労働研究雑誌] , May 2010.
1. Introduction
2. Socio-Economic Characteristics of Japanese Suicide
3. Suicide and Unemployment in Japan: OECD Comparison
4. Suicide and Unemployment in Japan after the Financial Crisis
5. Concluding Remarks
73

After WWII, unemployment rate in Japan was stable and lower than other developed countries.
However, it dramatically jumped in 1997.
74
4.1 Introduction (1)
suicide rate unemployment rate
74

• Many studies investigate determinants of unemployment in Japan (Genda, 2004; Imai et al., 2007 etc.)
• However, there are no studies on damage that unemployment caused for individuals.
• When individual loses her job, cost of unemployment will not be high if public safety nets work effectively.
• Safety nets do not work properly and costs of unemployment imposes burden on individual that exceeds her capacity for endurance.
• This can lead to worst end - suicide.
75
4.1 Introduction (2)
75

• Harmermesh and Soss (1974)’ model predicts higher unemployment rates induce higher suicide rate.
• Because if agent lose her job, she faces difficult time today and tomorrow, and moreover faces income uncertainty for future.
• Physical and mental illness are accompanied.
• These factors can be risk factor of suicide.
76
4.1 Introduction (3)
76

• Depression is immediate cause of suicide in many cases, but it is last stage of suicide.
• NPA reported reason for suicide was identified for 23,572 out of 31,690 in 2010.
4.2 Japanese Suicide
『自殺実態白書2008』より
七十二話, 「御読経の僧が平茸にあたる話」
今昔物語, 平安末期(12世紀初頭)
*東北大学 北川章臣教授のご教示による
御堂関白の枇杷殿に住んでいた僧が宗像神
社の境内で見つけた平茸を童といっしょに
食べて中毒死した。関白殿はご同情になり葬
式を出してやった。それを聞いた東大寺の僧
は同じように平茸を食って平然としている。
先ほどの僧が茸を食って死んだばかりなの
で、皆が不思議がって何故そんな危険なこと
をすると問うと、僧は「自分は死んでも道端
に捨てられるだけですので、殿の同情にすが
って葬式を出していただきたくて平茸を食
いましたが死ねませんでした」と云う話。も
ともとこの僧は毒キノコを食っても当らな
い体だったと云う噂で持ちきり。
Health problems(Depression)
15,802(7,020)
Economic problems 7,438
Family 4,497
Work 2,590 Source: White Paper on Suicide Reality 2008
77

• Chen, Choi, and Sawada (2009) “How is Suicide Different in Japan”
• Results show suicide rate in Japan is more responsive to economic condition (real GDP per capita, per capita GDP growth rate,
unemployment rate, female labor participation rate, Inequality index).
• Positive association between high suicide rate and high unemployment rate.
• Female labor participation rate is positively associated with suicide rate.⇒ it represents economic necessity?
• Suicide prevention policy must target unemployment policy.
4.3 Suicide and Unemployment in Japan
78

Panel regression analysis
• 47 Japanese prefectures
I) Quarterly in 1998-1999 , II) Yearly in 1997-2005
• Dependent var: Number of male suicides per 1,000 persons
• Independent var: Unemployment rate, Number of firm bankruptcy
• Instrumental variables for firm bankruptcy: (1) Lending attitude of financial institution DI, (2) Financial position DI
79
4.4 Suicide and Unemployment in Japan After Financial Crisis
79

80
4.4 Estimation Result
Number of male suicides per 1,000 personsNumber of male suicides per 1,000 personsNumber of male suicides per 1,000 personsNumber of male suicides per 1,000 persons
OLS Prefecture FE
IV-Prefecture FE
IV-Prefecture FE
lending attitude DI
Financial DI
lending attitude DI
Financial DI
Unemployment rate0.00106*** 0.00424*** -0.00093 -0.00131
Unemployment rate [0.00035] [0.00106] [0.0018] [0.00191]
N. of Firm bankruptcy
0.00075*** 0.00081***N. of Firm bankruptcy [0.00013] [0.00015]
Constant0.02326*** 0.01273*** -0.01759** -0.02043**
Constant[0.00182] [0.00362] [0.0081] [0.00879]
Observations 376 376 301 301
N of prefectures 47 47
Positive association between unemployment and credit crunch or firm bankruptcy
80

• For example, if person with debts loses her job, was forced out of her home, and suffered from depression, she need to treat at psychiatric hospital, see lawyer for legal liquidation, visit Hello-Work for job seeking.
• Effective suicide prevention policy
• For unemployed persons, comprehensive treatment and one-window point is necessary.
81
4.5 Concluding Remarks
81

Chapter 5
Those Who are Left Behind: An Estimate of the Number of Suicide Victims in Japan
(co-authored with Chen, Choi, Mori and Sawada)
Social Indicators Research, 2009.
1. Introduction
2. Estimation Procedures
3. Results
4. Concluding Remarks
82

5. I Introduction
Suicide causes negative externality and social costs.
Suicide prevention program
‣ identify high suicide-risk groups
‣ help those who lost family to suicide
However, little published information on number of family members of suicide victims and social costs of suicide.
This chapter presents procedures and its estimates
of number of family members who lost family to suicide.
83

• Estimating Number of People Who Became Bereaved in 1993-2006
• Family members : spouses, parents, siblings, and children
• Data : Number of suicide victims by gender and 5 year age group in 1993-2006, taken from “Vital Statistics” by Japan Ministry of Health, Labour and Welfare (MHLW) (1997, 2002, 2006).
• For each relationship, gender, age group and year, number of bereaved family are estimated.
5. 2 Estimation Procedures
84
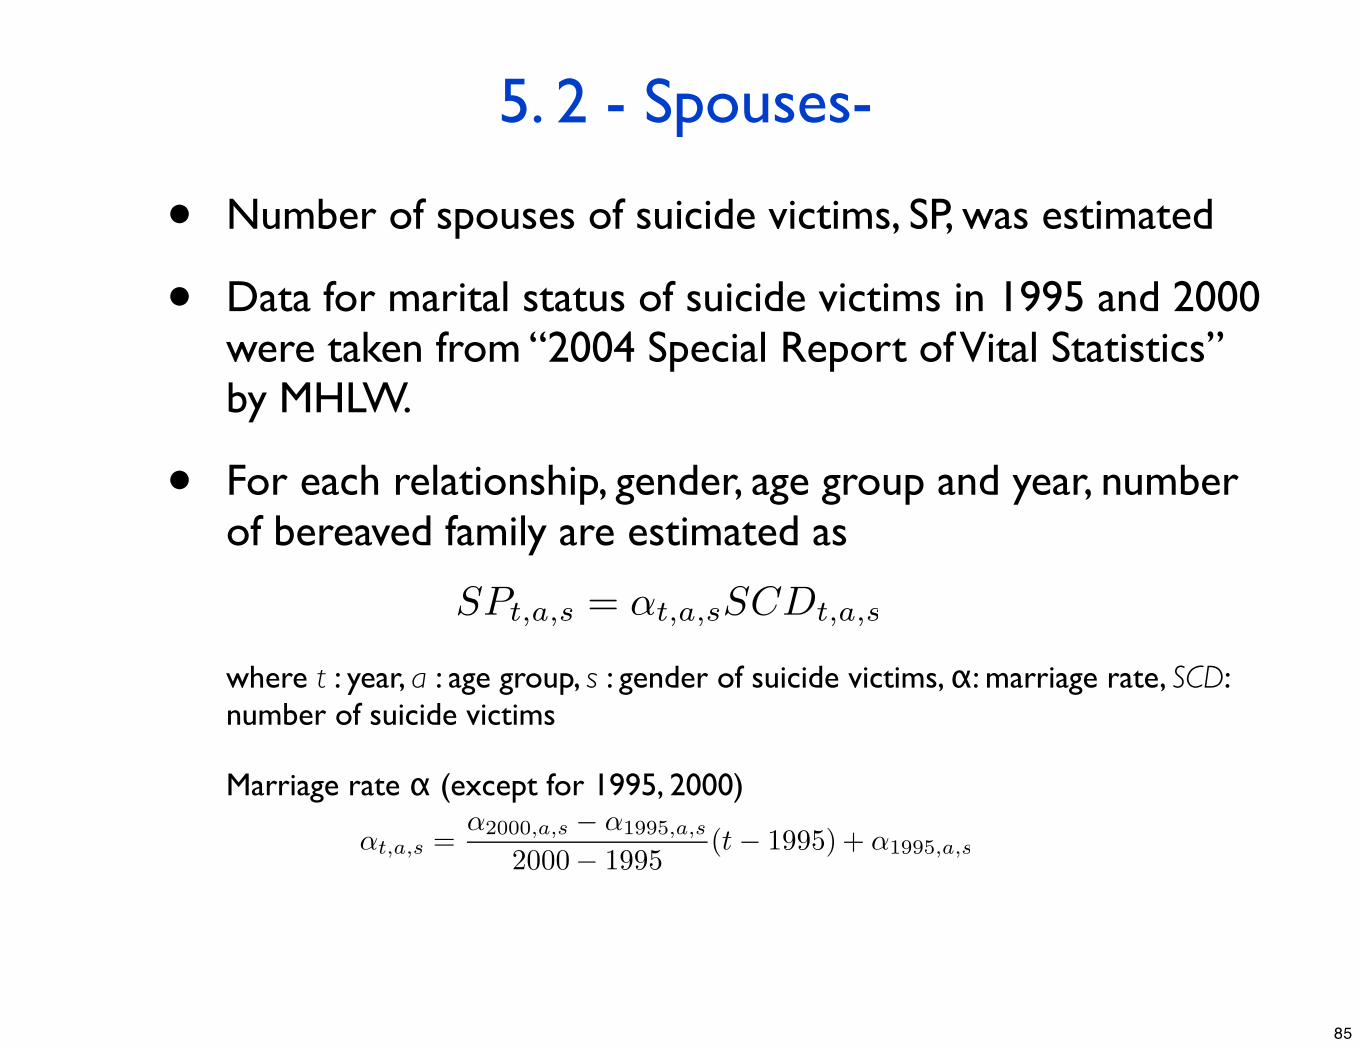
• Number of spouses of suicide victims, SP, was estimated
• Data for marital status of suicide victims in 1995 and 2000 were taken from “2004 Special Report of Vital Statistics” by MHLW.
• For each relationship, gender, age group and year, number of bereaved family are estimated as
where t : year, a : age group, s : gender of suicide victims, α: marriage rate, SCD: number of suicide victims
Marriage rate α (except for 1995, 2000)
5. 2 - Spouses-
SPt,a,s = αt,a,sSCDt,a,s
αt,a,s =α2000,a,s − α1995,a,s
2000− 1995(t− 1995) + α1995,a,s
85

• Number of bereaved siblings (BS) was estimated by total fertility rate in year in which suicide victims were born and take into account siblings’ survival rate.
• Probability γt1,t2 : a person who was born in t1 was alive in t2
where POPt,a: number of people of a years of age in year t, Bt: number of births in year t.
where β: total fertility rate, SCD: number of suicide victims.
Assume that victims and siblings belong to same age groups.
5. 2 - Siblings-
γt1,t2 =POPt2,t2−t1
Bt1
BSt,a = γt−a,t(βt−a − 1)SCDt,a
86

• Average age of women who give birth to median birth order children is about 30 years old (National Institute of Population and
Social Security Research, “Population Statistics of Japan 2008”).
• Probability δt1,t2 : a person who was 30 years old in t1 was still alive in t2,
where POPt,a: number of people of a years of age in year t
• Number of bereaved parents was
where SCD: number of suicide victims.
Assume that victims and siblings belong to same age groups.
5. 2 - Parents-
δt1,t2 =POPt2,t2−t1+30
POPt1,30
PRt,a = 2δt−a,tSCDt,a
87

• Number of bereaved children (CH) was estimated by fertility rate of women by 5-year age group.
• Average number of children of mother in age group i that committed suicide in year t was calculated as:
where Δa=5: width of age group interval, ai : midpoint of age group i
• Assume that average number of children of father in age group i that committed suicide in year t is same as that of mother because their average age difference was about 3 years during sample periods.
5. 2 - Children(1)-
ξt,aI =I−1�
i=0
∆aFRt−aI+i∆a,i +∆a
2FRt−aI+I∆a,I
88

• Average marital status is different b/w suicide victims and general population.
• Estimated number of children was adjusted by ratio of unmarried percentage of suicide victims (NMS) to that of general population (NM):
• Number of minor children less than 20 years of age
• Index function for minor children whose parent committed suicide in year t and age a:
• Number of minor children is
5. 2 - Children(2)-
ηt,a =NMSt,a
NMt,a
CHt,a = ηt,aξt,aγt−a+ac,tSCDt,a
θt,a = 1[a− ac < 20]
CHJt,a = θt,aCHt,a
89

• Calculate survival rate in 2006, that is, probability of bereaved person being alive in 2006.
• Data: “2000 Prefectural Life Tables”
• Probability that person who was a1 years old at time of suicide becoming a2 was calculated as:
• where qk is prob. of survival from k-1 to k years of age.
• This is applied to estimation results on number of family who became bereaved from 1993 to 2006. (Next page)
5. 2 Number of Family Member Who Became Bereaved (1993-2006)
Pa1,a2 =a2�
k=a1+1
qk
90

Table1. Estimated Number of Bereaved Family Member(1993-2006)
YearSuicide victims
Spouses WivesHusbands
Siblings ParentsChildre
nMinor
childrenTotal
1993 20,516 10,070 6,896 3,174 35,970 16,990 35,583 9,284 98,612
1994 20,923 10,050 6,993 3,057 39,020 17,745 36,350 9,005 103,165
1995 21,420 10,350 7,127 3,223 39,429 18,189 37,441 9,304 105,409
1996 22,138 10,747 7,488 3,259 41,495 18,672 38,815 9,717 109,728
... ... ... ... ... ... ... ... ... ...
2004 30,247 14,345 10,758 3,587 49,951 27,623 46,839 11,757 138,759
2005 30,553 14,338 10,780 3,558 48,813 28,730 46,745 12,345 138,626
2006 29,921 13,973 10,349 3,624 47,769 27,796 45,899 11,954 135,436
Total 384,064 185,062 135,074 49,988 660,386 337,604 629,067 156,300 1,812,119
91

Table2. Estimated Number of Bereaved Family per Suicide (1993-2006)
Year Spouses WivesHusba
ndsSiblings Parents Children
Minor children
Total
1993 0.49 0.34 0.16 1.77 0.83 1.75 0.46 4.85
1994 0.48 0.34 0.15 1.88 0.86 1.75 0.43 4.97
1995 0.49 0.34 0.15 1.86 0.86 1.76 0.44 4.96
1996 0.49 0.34 0.15 1.89 0.85 1.77 0.44 5.00
... ... ... ... ... ... ... ... ...
2004 0.48 0.36 0.12 1.66 0.92 1.56 0.39 4.62
2005 0.47 0.36 0.12 1.61 0.95 1.54 0.41 4.57
2006 0.47 0.35 0.12 1.60 0.93 1.54 0.40 4.55
Average 0.49 0.35 0.13 1.74 0.88 1.66 0.41 4.78
92

• Due to data limitation, only total number of bereaved family member was estimated, not relationship-by-relationship estimates above.
• Average number of bereaved family members per suicide(“bereavement coefficients”) decline gradually over time.
• Based on results for 1993-2006, coefficients were assumed to be 5 in 1992 and to increase by 0.5 for each 15 years into past.
• Multiply coefficients with number of suicide before 1992 and take into account for survival rate of family member.
5. 2 Number of Family Member Who Became Bereaved(before 1992)
93

• Estimates of total and average numbers of family members of suicide victims in 1993-2006 are presented in Table 1&2.
• Average number of bereaved family members per suicide(“bereavement coefficients”) are 4~5 and decline gradually.
• Bereavement coefficients for siblings and children both decline gradually. ←reflect declining birth rate.
• Bereavement coefficients for parents increase gradually.←reflect prolonged life span.
5. 3 Results (1)
94

• Estimate of number of bereaved family member who were living in 2006 (Table3).
• There were 1.7 million family members who became bereaved in 1993-2006.
• Among them, number of minor children who lost parent to suicide is 86,000. (cf. Soeda (2000, 2001) estimate about 92,000 in 1980-1990 and 77,000 in 1986-1999.)
• Combining results of number of family who became bereaved before 1992 and that of 1993-2006.
• Number of bereaved family alive in 2006 is 2.92-3.46 million.(2.3-2.7% of Japanese are bereaved family member)
5. 3 Results (2)
95

Table3. Estimated Number of Living Family Member in 2006(1993-2006)
YearSuicide victims
Spouses WivesHusbands
Siblings ParentsChildre
nMinor
childrenTotal
1993 20,516 8,420 5,923 2,497 30,234 10,366 34,566 892 83,586
1994 20,923 8,522 6,065 2,457 33,625 11,532 35,396 2,559 89,074
1995 21,420 8,908 6,263 2,645 34,504 12,136 36,588 2,622 92,136
1996 22,138 9,396 6,678 2,717 36,869 12,889 38,077 2,746 97,230
... ... ... ... ... ... ... ... ... ...
2004 30,247 14,042 10,565 3,477 48,952 25,988 46,722 11,757 135,704
2005 30,553 14,188 10,684 3,504 48,342 27,912 46,689 12,345 137,131
2006 29,921 13,973 10,349 3,624 47,769 27,796 45,899 11,954 135,436
Total 384,064 171,761 126,911 44,850 615,301 276,570 622,182 86,230 1,685,815
96

• Cost of suicide in Japan.
• There were 123,482 (=135,436-11,954) Japanese working-age family members who were affected by suicide in 2006.
• Assume that working-age bereaved family member is absent from work for 1 week.
• Japanese GNP per working-age population in 2006 was 7,655,963 JPY, divided by 48 weeks, average weekly income of 159,270 JPY (1600 USD).
• Total direct cost was then 1600 USD×number of adult bereaved family member = 197 million USD.
5. 3 Results (3)
97

• Method requires only aggregate data and provide estimation of relationship-by-relationship number of family members.
• Estimation results are valuable in evaluating cost-effectiveness of suicide prevention programs and in designing appropriate policy instruments.
1. About 5 bereaved family members for each suicide victim
2. About 90,000 minor children who have lost parent to suicide in 2006.
3. 2.92-3.46 million bereaved family members in 2006.
5. 4 Conclusion
98