Embed Size (px)
Citation preview

153
Chapter 6
Phase transitions in Liquid crystals under negative
pressures6.1 Introduction
In the previous chapter we have described the effect of compression i.e.
positive pressure on liquid crystals. We also reported that in room temperature liquid
crystal samples mounted in the high pressure (HP) cell if the volume is fixed an
excess pressure gets generated at high temperatures. In an analogous manner, if a
given volume of liquid is cooled from high temperatures, a negative pressure can be
generated in the medium. In this chapter we describe the first experiments on the
effect of tensile stress on liquid crystals.
Condensed matter can sustain negative pressures because of attractive
interactions between molecules. Under negative pressures the intermolecular distance
r increases, and the medium which is under tension is in a metastable state [1]. Indeed
at a sufficiently high negative pressure, the medium goes over to the equilibrium high
density state by cavitation [1]. Several natural phenomena crucially depend on such a
state: for example, sap-ascent in tall trees [2] and the initial inflationary phase in the
expansion of the universe [3]. The latter is analogous to the cavitation phenomenon
which occurs in a liquid under tension, usually due to thermal fluctuations. Maris and
Balibar [4] have shown that quantum fluctuations induce cavitation in the superfluid
phase of Helium-4. Ice I has a lower density than water, and the phase transition
between them has been studied under negative pressures [5]. Liquid crystals exhibit
several phase transitions involving changes in appropriate symmetries [6,7] and are
ideally suited for investigating such transitions between phases in both of which the
medium is under tension. To achieve large negative pressures small drops have to be
cooled under constant volume (i.e. isochoric) conditions. We have developed a
technique of subjecting liquid crystals to negative pressures by embedding small
droplets (of diameter ~ 100 µm) of mesogens in a matrix of a glass-forming material.
We have carried out the first measurements of birefringence ∆µ, a measure of
orientational order parameter S, on such samples. An isochoric cooling of the sample
is used to locate transitions under negative pressures, from the isotropic to nematic as

154
well as from nematic to smectic A phases. We present the temperature variations of
Freedericks threshold voltage [7] Vth which is a measure of a curvature elastic
constant for both isochoric as well as isobaric conditions.
The structures adopted by soft condensed materials depend on a balance
between repulsive and attractive interactions. Onsager [8] demonstrated in a seminal
paper over half a century ago that colloidal suspensions of hard rods can undergo a
transition from the isotropic to the nematic phase due to packing effects alone, as the
density is increased. The anisotropic attractive interactions are quite important for
rod-like organic molecules of low molecular weight and the nematic to isotropic (NI)
transition occurs at relatively high densities.
It is known that the NI transition is of first order nature [7]. The Landau –de
Gennes (LdG) theory describes the NI transition quite well (see section 1.6). The free
energy density is given by
432
432S
CS
BS*)TT(
aF LdG +−−= 6.1
where the third order term with coefficient B is nonzero in view of the second rank
tensor nature of the orientational order parameter S. This term leads to a first order NI
transition in which the orientational order parameter S jumps from zero to a finite
value (usually ~ 0.3) at TNI. T* is a hypothetical second order transition point which is
slightly below TNI. Experiments show that the density ρ also jumps by ~0.2% at TNI,
clearly indicating that the order parameter is coupled to density. The LdG model has
been extended by Mukherjee and co-workers [9] to incorporate density –order
parameter coupling, by assuming the relevant term to be S2∂ρ2. The term ∂ρ = ρN-ρI is
the difference in density between nematic and isotropic phases. But this term would
not discriminate between the positive and negative signs of ∂ρ, which is
inappropriate. We have extended the LdG model by adding the appropriate coupling
terms. By comparing the isobaric as well as isochoric measurements of ∆µ we have
estimated the coefficients coupling S and density ρ of an extended LdG model of the
nematic phase.

155
Experimentally TNI - T* is about 1 to 2 0C, while the molecular mean field
theory of Maier and Saupe would give a much larger value [6,7]. Indeed it has been
shown by Tao et al [10] that the inclusion of a density dependent intermolecular
interaction can reduce this discrepancy. The relative importance of density and
temperature in determining the variation of order parameter has been investigated by
measurements of both the order parameter and the density as functions of pressure
above 1 bar in a couple of cases [11]. Experiments under constant volume (ie.,
isochoric) conditions are ideally suited for such an investigation. As the temperature
is lowered, such a medium will have a density which is lower than in equilibrium and
hence it will be in a metastable state. The medium experiences a tensile stress, i.e.,
negative pressure, which increases in magnitude as the temperature is lowered. The
medium can go over to the stable state by cavitation, i.e., by developing a vapour
bubble, which grows to the required size if at nucleation it has a radius r beyond a
critical value r∗. A vapour embryo of radius r has an energy σππ 23 434
rPrEr +−=
where P is the magnitude of the negative pressure and σ the surface tension. Er has a
maximum with a potential barrier height of 16πσ3/3P2 at r∗ = 2σ /P.
Figure 6.1: A schematic representation of the energy Er of a vapour bubble as a
function of the radius r.
A schematic representation of the energy of a vapour bubble as a function of
its radius r is shown in Figure 6.1. The barrier height is lowered at larger negative
Er
r *
( 4 / 3 ) ππ r 3 P
4 ππ r 2 σσ
r

156
pressures. Extraneous influences like surface non-uniformities can lower the barrier
considerably and lead to heterogenous nucleation of bubbles.
A technique for creating very large negative pressures (~ −1kbar) by isochoric
cooling of small water drops embedded in quartz crystals was developed some years
ago by Zheng et al [12]. It has been used to approach the homogeneous nucleation
limit for cavitation [12], which corresponds to a first order transition from the (low
density) metastable to the (normal density) stable state of the medium.
It would be of obvious interest to extend such studies to liquid crystals and
other soft materials to explore their properties under tensile stress under which the
effect of attractive interactions is relatively enhanced. Organic compounds cannot
withstand high temperatures used to encapsulate water droplets. Several techniques
have been developed during the past couple of decades for embedding relatively small
(~ a few µm) spherical liquid crystal droplets in polymer matrices [13]. The polymer
dispersed liquid crystals (PDLCs) exhibit very interesting electro-optic responses and
have been used in commercial display devices which do not require polarisers. The
liquid crystals partially dissolve in the polymer matrix. In view of the visco-elasticity
of the polymer and the small size of nematic drops, cavitation phenomena have not
been noticed in PDLCs.
Our strategy to overcome the above problems was to embed the liquid crystal
drops in a matrix made of a glass-forming material. The glass transition point Tg has
to be moderately high, but not above 200 0C to prevent thermal decomposition of the
liquid crystal molecules. Another requirement is that the liquid crystal compounds
should not dissolve in the glass forming material.
6.2 Experimental
6.21 Preparation of sampleAfter testing a few different materials, we found sucrose, a carbohydrate to be
suitable for embedding liquid crystalline drops. The melting point of sucrose
Tmû180 0C and the glass transition temperature, Tgû78 0C [14]. As it is a
carbohydrate, it does not dissolve in most of the mesogenic compounds whose

157
molecules have phenyl rings. Spherical drops are not suited for measurements of
optical anisotropy of the liquid crystal. In order to be able to apply an electric field to
the sample, we prepare it between ITO (Indium tin oxide) coated glass plates. The
ITO plates were coated with a thin layer of polyimide, cured and subsequently
unidirectionally rubbed using a soft tissue. This ensures that the nematic director
aligns along the rubbing direction. One of the plates is kept on an aluminium block
which is heated to about 185 0C. A small quantity of sucrose mixed with some glass
spacers of thickness ~ 10 µm is placed on the glass plate. Liquid crystal is added
when the sucrose melts and starts to flow. The second ITO plate is placed on the melt
such that the rubbing directions of the two plates are parallel to each other allowing
for homogeneous alignment of the liquid crystal molecules. The top plate is pressed
against the bottom one, and the sandwich is suddenly cooled to room temperature.
Care is taken to ensure that the sandwiched sample is present only in the center of the
cell leaving an air gap all around. The thickness of the sample t is estimated by
measuring the thickness of the air gap present in the cell using an Ocean Optics
interference spectrometer (see section 1.7). Cells with uniform thickness are chosen
for the optical path difference measurement. A typical sandwich of sucrose with
embedded liquid crystalline drops is shown in Figure 6.2. Note that all the liquid
crystal drops are aligned homogeneously indicating that the liquid crystal molecules
touch the confining glass plates and are confined in the glassy matrix of sucrose.
Figure 6.2: Photomicrograph of aligned nematic drops of CBCC embedded in a glass
matrix of sucrose, between crossed polarisers set at 450 to the rubbing direction. Note
the cavities in all the drops. Scale bar corresponds to 270 µm.
158
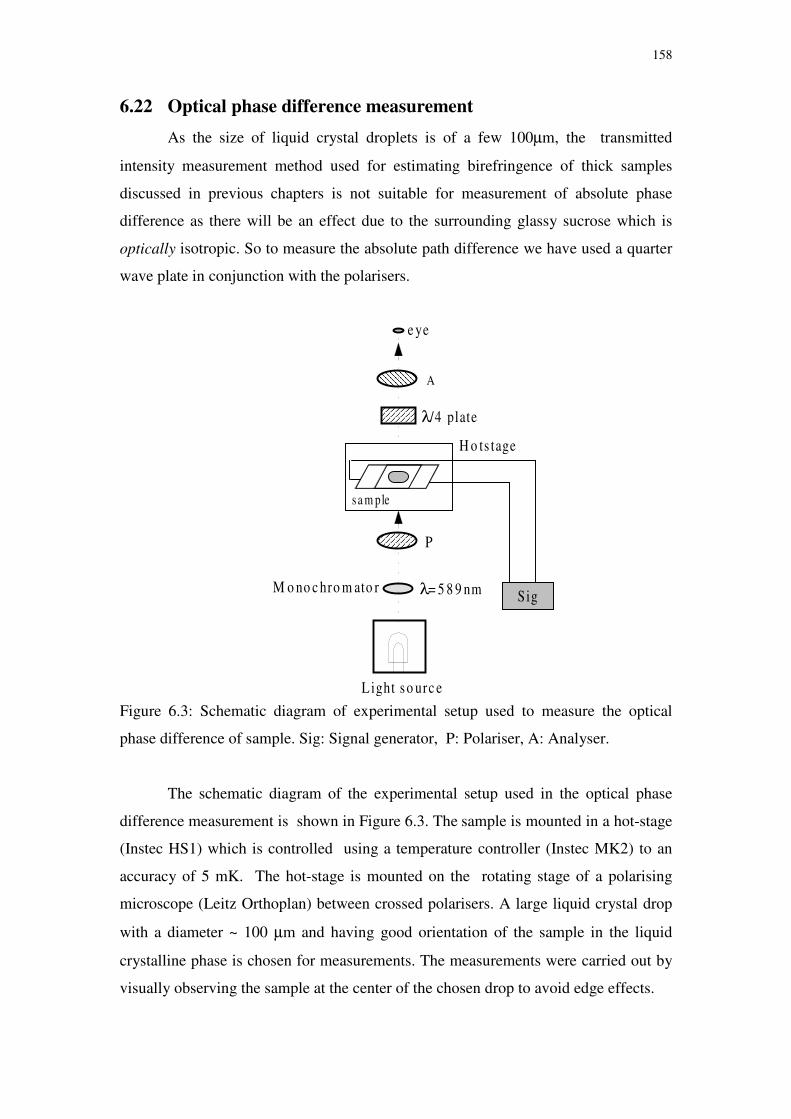
6.22 Optical phase difference measurementAs the size of liquid crystal droplets is of a few 100µm, the transmitted
intensity measurement method used for estimating birefringence of thick samples
discussed in previous chapters is not suitable for measurement of absolute phase
difference as there will be an effect due to the surrounding glassy sucrose which is
optically isotropic. So to measure the absolute path difference we have used a quarter
wave plate in conjunction with the polarisers.
Figure 6.3: Schematic diagram of experimental setup used to measure the optical
phase difference of sample. Sig: Signal generator, P: Polariser, A: Analyser.
The schematic diagram of the experimental setup used in the optical phase
difference measurement is shown in Figure 6.3. The sample is mounted in a hot-stage
(Instec HS1) which is controlled using a temperature controller (Instec MK2) to an
accuracy of 5 mK. The hot-stage is mounted on the rotating stage of a polarising
microscope (Leitz Orthoplan) between crossed polarisers. A large liquid crystal drop
with a diameter ~ 100 µm and having good orientation of the sample in the liquid
crystalline phase is chosen for measurements. The measurements were carried out by
visually observing the sample at the center of the chosen drop to avoid edge effects.
L ight so urc e
P
A
λ/4 plate
λ= 5 8 9 nmM o no c hro m ato r
H o ts tage
s a m ple
Sig
e ye

159
The optical phase difference measurements were carried out using the quarter
wave plate compensation technique described in section 4.23. As mentioned in
chapter 4, when the polarised light beam passes through a birefringent liquid crystal
whose principal axes are at 450 to the electric vector of the light beam, the emergent
beam consists of two linearly polarised components of equal amplitudes, one
component being phase shifted by 2πt∆µ/λ with respect to the other, where λ is the
wavelength of incident beam and t the sample thickness. When these two orthogonal
components pass through a quarter wave plate arranged as described in section 4.2
(Figure 6.3), they are converted into two circularly polarized beams of opposite sense.
Superposition of these beams yields a linearly polarised light beam with its direction
of vibration rotated by πt∆µ/λ with respect to the direction of vibration of the light
beam incident on the liquid crystal. The analyser is rotated by an angle ϑ to get the
dark field of view. This angle ϑ is a measure of the optical phase difference ∆φ and is
given by ϑ = πt∆µ/λ. The measurements were made at temperature steps of 40mK
between TNI and TNI –3 0C as the variation of ∆µ is quite steep in that range. At lower
temperatures the measurements are carried out at temperature steps of 0.1 OC or larger
steps depending on the rate of the variation of ∆µ with temperature. The absolute
value of optical phase difference ∆φ (=2πt∆µ/λ) is determined using Freedericks
transition technique (see section 1.25, chapter 1). The voltage for Freedericks
transition experiment was applied using a signal generator (Sig: Wavetek model 395)
at a frequency of 2.1KHz. We have also measured the Freedericks threshold voltage
Vth as a function of temperature. The temperature variation of ∆µ is calculated using
the measured values of ϑ.
The liquid crystal systems used in the study are (i) p-cyanophenyl carboxylate
(CBCC) with the phase transition sequence: crystal 54.8 0C - N - 68.3 0C - I, (ii) a
mixture (MCB) of 30 wt% of 4-octyl-4′-cyanobiphenyl (8CB) with 4-octyloxy 4′ -
cyanobiphenyl (8OCB) with the phase transition sequence: SmAd - 57.8 0C - N -70 0C -
I (iii) mixtures of 8OCB with 4-hexyloxy 4′ -cyanobiphenyl (6OCB) which exhibits N-
SmAd-Nr phase sequence in a narrow range of concentration of 6OCB. All the
compounds were obtained from Messrs Roche. The chemical structures of compounds
along with their transition temperatures are given in Figure 6.4.

160
Cr - 54.8 0C - N - 68.3 0C - I
Cr - 21 0C - SmAd - 32.5 0C - N - 40 0C - I
Cr - 54 0C - SmAd - 66.5 0C - N - 79.8 0C - I
Cr - 58 0C - N - 76.5 0C - I
Figure 6.4: Chemical structures of compounds used in the experiments and their
transition temperatures.
6.3 Results and Discussion
6.31 Estimation of birefringence under isochoric and isobaric
conditions(i) CBCC
On isochoric (constant volume) cooling of the liquid crystal drops embedded
in the sucrose glass matrix the negative pressure steadily increases and finally at a
sufficiently high negative pressure the low density metastable liquid crystal goes over
to the higher density stable liquid crystal by spontaneous cavitation (formation of
vapour bubble). Indeed in a given sample all the liquid crystal droplets cavitate
practically at the same temperature indicating that the cavity is nucleated
homogeneously (Figure 6.2). On heating a sample of CBCC with cavity to
temperatures well above the isotropic phase the cavity vanishes around 74 0C. The
isochoric measurement of optical phase difference is then carried out on cooling the
H9C4
O
O
CN(a) CBCC
H17C8 CN(b) 8CB
H17C8
O CN(c) 8OCB
H13C6
O CN(d) 6OCB

161
sample from the isotropic phase. The nematic phase supercools below the melting
point and cavitation occurs around 35 0C. The optical phase difference measurements
are continued down to room temperature. The photograph of a nematic drop of CBCC
embedded in glassy sucrose matrix before the formation of cavity and after formation
of cavity are shown in Figure 6.5.
Figure 6.5: Photograph of a large drop of CBCC embedded in a glass matrix of
sucrose between crossed polarisers set at 450 to the rubbing direction. The scale bar
corresponds to 160 µm. (a) appearance of the drop before the formation of cavity and
(b) after cavitation.
Figure 6.6: Temperature dependence of the birefringence ∆µ, measured in the nematic
phase of an embedded drop of CBCC. A jump in ∆µ can be noticed after the
formation of cavity in the cooling mode.
The measurements of optical phase difference are then made in the heating
mode, right upto the NI transition point. The temperature variations of ∆µ of samples
both in the absence of cavity i.e., isochoric measurement, as well as in the presence of
cavity (essentially isobaric condition) are calculated using the measured value of ϑ.
40 600.04
0.06
0.08
0.10
with cavity
without cavity
cooling
CBCC
∆∆µµ
heating
Temperature in0C

162
The results are shown in Figure 6.6. It may be noted from Figure 6.6 that at any
temperature, ∆µ is lower for the drop without a cavity, i.e., in the metastable nematic
under negative pressure, compared to that for the drop with the cavity, in which the
density is higher. The increase in ∆µ with decreasing temperature under isochoric
condition i.e. sample without cavity is due to the variation of temperature alone. It
may be noted that there is a sudden increase in ∆µ of ~ 7% in a first order phase
transition at cavitation. The variation of ∆µ in the sample with cavity is associated
with variations of both temperature and density. Independent ∆µ measurements were
also made on CBCC at atmospheric pressure using a sample taken between two ITO
coated glass plates, without sucrose matrix. These values compare well with the data
obtained for the drops with cavity as shown in Figure 6.7. Further the data agree with
the measurements of Takahashi et al [15] (see Figure 6.7).
Figure 6.7: The temperature variations of birefringence ∆µ of CBCC measured using
a sample with cavity for a liquid crystal drop embedded in glassy matrix and a sample
taken between ITO coated plates (without sucrose matrix) at atmospheric pressure.
The data from Takahashi et al [15] are also shown for comparison.
The orientational order parameter S≈∆µ/∆µ0, where ∆µ0 is the value of
birefringence in the fully aligned state. The isochoric order parameter is significantly
smaller than the isobaric value, the difference between the two increasing at lower
temperatures (Figure 6.6). CBCC has a cyclohexane ring (Figure 6.4a), and thus has a
30 40 50 60 700.04
0.06
0.08
0.10
∆∆µµ
Temperature in 0C
LC droplet embedded in glassy matrix without glassy matrix Takahashi et al (reference [15])

163
smaller value of ∆µ compared to a nematogen with two phenyl rings. For the drops
without cavity TNI is 0.9 0C lower than that in the presence of cavity. Using the
dP/dTNI value of CBCC (chapter 5), the negative pressure is estimated to be ~ 22 bars
at TNI.
(ii) MCB
A photograph of aligned drop of MCB embedded in glass matrix of sucrose is
shown in Figure 6.8. On heating a sample of MCB with cavity to temperatures well
above the isotropic phase the cavity vanishes around ~76 0C.
Figure 6.8: Photomicrographs of an aligned drop of MCB (a) in the nematic phase at
63 0C, (b) in the smectic phase (note the focal conic defects at the boundary) at 53 0C
before the formation of cavity and (c) in the smectic phase at 40 0C after cavitation.
Note that the cavitation has occurred in both the large and small drops. (Scale bar
corresponds to 70 µm.)
(c)
(a)
(b)

164
The measurements were carried out on this sample using the procedure
described above for CBCC. The temperature variations of ∆µ of the samples both
in the absence of cavity i.e. isochoric measurement, as well as in the presence of
cavity (essentially isobaric condition) are shown in Figure 6.9. In MCB the
cavitation occurs at 40 0C in the SmAd phase and the value of ∆µ suddenly increases
by ~6% at the first order transition.
Figure 6.9: Temperature dependence of the birefringence ∆µ, measured in the nematic
as well as smectic phases of an embedded drop of MCB. The thick arrow indicates
SmAd-N transition. A jump in ∆µ can be noticed after the formation of cavity in the
smectic phase in cooling mode.
We have carried out independent measurement of ∆µ on a sample taken
between two ITO coated glass plates without sucrose matrix. And the result of this
matches with the temperature variation of ∆µ of the sample with cavity (Figure 6.10).
In MCB isochorically measured TNI and TAN are lower by 0.6 0C and 1.8 0C
respectively compared to the measurements in drops with cavity. Using the dP/dT
values for MCB reported in chapter 5 the estimated negative pressures are ~25 bars at
TNI and ~129 bars at TSmAN. Extrapolating this the cavitation in MCB occurs at a
negative pressure of ~ 230 bars. The smallness of magnitude of negative pressure at
cavitation compared to that in water is related with the low surface tension which is ~
25 dynes/cm for 8CB [16] compared to ~ 80 dynes/cm for water.
0 .0 8
0 .1 2
0 .1 6
4 0 6 0
∆∆µµ
M C B
T e m p e ra tu re in 0C
h ea tin g
∆∆µµ
w ith o u t ca v ity
w ith ca v ity
co o lin g

165
Figure 6.10: The temperature variations of birefringence ∆µ of MCB measured using
a sample with cavity for a liquid crystal drop embedded in glassy matrix and a sample
taken between ITO coated plates (without sucrose matrix) at atmospheric pressure.
6.32 An extended Landau de Gennes theory to take into account
density- order parameter coupling
As mentioned in section 4.42, the limitation of LdG theory is that it is a mean
field theory valid near the NI transition point. Hence we use the data points within ~10
below TNI for analysis.
The density jumps at the NI transition indicating that the order parameter S is
coupled to density (see section 6.1).We write the density dependent terms of the free
energy as
22
22ρρρ ∂Λ+∂−= S
MF 6.2
in which the first term ensures that the density increases with increase in order
parameter, which has a positive sign for rod like molecules for better packing. The
second term is the energy cost of changing the density from its equilibrium value in
the isotropic liquid.
20 30 40 50 60 70 80
0.08
0.12
0.16
MCB
Lc droplet embedded in glassy matrix∆∆
µµ
Temperature in oC
without glassy matrix

166
At a fixed pressure, the density adjusts itself to minimize Fρ, yielding
Λ=∂
2
2MSρ 6.3
The total free energy is ρFFF LdG += 6.4
Substituting for the ∂ρ in the equation for total free energy, we get
432
432S
CS
BS*)TT(
aF
′+−−= 6.5
where Λ−=′
2
2MCC 6.6
On heating the sample with the cavity, the latter reduces in size and finally
disappears at a temperature To in the isotropic phase. In the isochoric case, the
density ρ is fixed and ∂ρ is given by
)(Tiso ρρρ −=∂ 6.7
where ρo is the density at temperature To, and
( )( )TTT oois −+= αρρ 1)( 6.8
with α being the co-efficient of thermal expansion.
Using this value of ∂ρ, and minimising the total free energy (equation 6.4) with
respect to S, we get
( ) ooo TMCSBSaTTMa αραρ +−+=+ 2* 6.10
The orientational order parameter S ≈ ∆µ/∆µ0, but we do not know ∆µ0. Using the
density data available in the literature for CBCC [15], ∆µ values within ~1 0C of TNI
in both isobaric and isochoric samples have been least square fitted to the appropriate
equations. The density data on 8CB and 8OCB are reported by Karat et al and Sen
et al respectively [17]. Using these values, the density of the mixture MCB at any
relative temperature (TNI-T) is estimated as an appropriate average over the mole
fractions of 8CB and 8OCB [17]. The results of the fit for both CBCC and MCB are
shown in Figure 6.11a and Figure 6.11b respectively. We write β = B/∆µ03 and
χ = C′/∆µ04 and m = M/∆µ0
2. The order parameter at the NI transition point at
constant pressure, SNI =2B/3C′ [7] (see section 1.8) can be written as
SNI = 2β/(3χ′∆µ0). Also SNI ≈ ∆µNI/∆µ0, hence ∆µNI=2β/3χ′.
167
From equation 6.3 Λ
=∂2
2NI
NI
MSρ , which can be rewritten as Λ
∆=∂
2
2NI
NI
m µρ
in terms of ∆µNI, the birefringence at the NI transition point. The list of fit parameters
is presented in Table 1.
Figure 6.11: The birefringence data within about 10 of TNI in both constant pressure
and constant volume conditions fitted to the phenomenological model described in the
text for (a) CBCC and (b) MCB.
Table 1: List of parameters corresponding to the least square fit of the data shown in
Figure 6.11.
CBCC MCB
TNI = 339.5KT*=338 Kα = 8.5×10⁻⁴ cgs unitsa/(∆µo)2 = 3.2×10⁷ cgs unitsB/(∆µo)3 =1.08×10¹⁰ cgs unitsC/(∆µo)4 =1.49 ×10¹¹ cgs unitsC′/(∆µo)4 =1.369 ×10¹¹ cgs unitsM/(∆µo)2 = 3.8 ×10¹⁰ cgs unitsΛ= 6.1×10¹⁰ cgs units
TNI = 342.9KT*=339.9 Kα = 10×10-4 cgs unitsa/(∆µo)2 = 2.9×10⁷ cgs unitsB/(∆µo)3 =2.98×10⁹ cgs unitsC/(∆µo)4 =2.345 ×10¹⁰ cgs unitsC′/(∆µo)4 =2.29 ×10¹⁰ cgs unitsM/(∆µo)2 =7.0 ×10⁹ cgs unitsΛ= 4×10¹⁰ cgs units
0.048
0.052
0.056
0.060
65 66Temperature in oC
Constant Pressure Constant Volume
CBCC
(a)
∆∆µµ
68.4 69.3
0.080
0.088
0.096
0.104
(b)
MCB
Constant Pressure Constant Volume
Temperature in oC

168
The estimated values of ∆µNI for CBCC and MCB are 0.052 and 0.086
respectively which are higher compared to those observed experimentally
(Figure 6.11). The jump in density at the NI transition point ∂ρNI calculated using
these values of ∆µNI are 8.6 ×10⁻⁴ g/cc and 6.6 ×10⁻⁴ g/cc for CBCC and MCB
respectively. The density data on CBCC reported by Takahashi et al [15] is not
accurate near TNI. From Vuk’s model MN A αρπ
µµ
34
2
12
2
=+−
, where
( ) 32 222oe µµµ += , AN is the Avogadro number, ρ the density, M the molecular
weight, α is the average polarizability. Using the reported value of α and the
measured values of µe and µo [15] the density ρ as a function of temperature is
estimated. The value of ∂ρNI (at constant pressure) estimated using the above method
is = 20×10-4 g/cc. This value of ∂ρNI is larger compared to that estimated using the
theoretical fit. Using an appropriate average mole fractions of 8CB and 8OCB the
value of ∂ρNI for the mixture MCB is estimated and is =18×10-4 g/cc. Again this
value is larger compared to that got from the theoretical fit. The discrepancy in the
estimated values of ∆µNI and ∂ρNI using LdG theory compared to those measured
experimentally shows the inadequacy of the theory even near the transition point. It
may be noted that for both CBCC and MCB the value of Λ reported in Table 1 is of
the order of inverse compressibility for typical mesogens [6].
6.33 Freedericks transition experimentsAs a consequence of the apolar nature of nematic director n̂ an external
electric field E&
couples to the medium through its dielectric anisotropy ∆ε and the
orientational part of the dielectric energy density is given by -ε0∆ε ( n̂ . E&
)2/2, where
ε0 is the vacuum dielectric constant. If n̂ is strongly anchored at the two glass plates
(which is the usual case), n̂ reorients in the center of the cell at a threshold voltage
εεπ ∆= 011KVth (independent of the sample thickness t) where K11 is the splay
elastic constant relevant to the initial distortion of the director [7]. In the highly polar
compounds the dielectric anisotropy ∆ε mainly depends on the dipolar contribution.

169
According to Maier and Meier’s theory the expression for the dielectric anisotropy is
given by
( ) ( ) STk
pF
MhFN
B
A
−
−∆=−=∆ ⊥ βα
ρπεεε 2
2
|| cos312
4
where )( tl ααα −=∆ , is the anisotropy of polarizability of a perfectly oriented
medium, AN is the Avogadro number, ρ the density, M the molecular weight,
( )123
+= εεh , is the cavity field factor and ( )αf
F −=1
1 where
( )( )[ ]122
13 +
−= επε
af is the reaction field factor for spherical cavity and α , is the
average polarizability, p is the molecular dipole moment. Hence for cyano
compounds, ∆ε is ∝ ρS/T. In the mean field approximation [7], K11 is proportional to
S2. As such Vth2/T ∝ S. Indeed, as shown in Figure 6.12, for both the systems the
value of Vth2 is higher for the nematic sample with the cavity compared to that without
cavity.
Figure 6.12: Temperature variations of the square of the threshold voltage for splay
distortion of the nematic phase of (a) CBCC and (b) MCB.
Again, Vth2 values measured in ordinary cells at atmospheric pressure for both
the systems compare well with the values obtained for the drops with cavities (Figure
6.12). In CBCC, which exhibits only the nematic phase Vth2/T ∝ S. The
proportionality constant Vth2/T∆µ ≈ 0.0063 ( to within ±1.5%) for the drops both with
and without cavity. In MCB, smectic like short-range order grows as the SmA-N
30 40 50 60 70
0.12
0.16
0.20
C B C C
(a)
Vth
2 in
sq
ua
re v
olt
s
Tem perature in oC
w ithout glassy m atrixLC droplet embedded in glassy matrix:
C onstant V olum e (w ithout cavity) W ith C avity
55 60 65 700.08
0.12
0.16
0.20
0.24
0.28
M C B
(b )
Vth
2 in
sq
ua
re v
olt
s
Tem perature in oC
w ith ou t g lassy m atrix
LC droplet embedded in glassy matrix:C on stan t V olu m e(w ith ou t cav ity )W ith C av ity

170
transition is approached. As such the mean field theory is no longer valid and
Vth2/T∆µ varies from 0.003 to 0.0055 for the drop both with and without cavity as the
temperature is lowered.
6.34 Phase diagram of a binary mixture exhibiting reentrant
nematic transitionThe binary mixtures of 6OCB and 8OCB exhibit N-SmAd-Nr phase sequence
in a narrow range of concentrations of 6OCB (see Figure 5.6). We have constructed
the P-T phase diagram for a mixture with 27.5 mol% of 6OCB, and as expected, the
SmAd phase gets suppressed beyond ~75bars as shown in Figure 5.7. The value of Pm,
the maximum pressure up to which the SmAd phase is stable decreases with
increasing concentration of 6OCB [18]. The concentration-temperature phase diagram
of the mixtures studied in droplets embedded in a sucrose glass matrix is shown in
Figure 6.13. The transition temperatures of samples with cavity, which were measured
while heating the samples, match with those measured at atmospheric pressure on
samples without the sucrose matrix.
Figure 6.13: The concentration-temperature phase diagram of binary mixtures of
6OCB with 8OCB. S corresponds to samples with cavity (isobaric condition). The
N-SmAd transition points of isochorically cooled samples fall on a smooth curve
(upper circles). The lower circles represent the cavitation temperatures, at which
transition from SmAd phase under tension to Nr phase at normal pressure takes place.
28 29 30
24
32
40
48
Mol% of 8OCB72 71 70
Nr
N
SmAd
Tem
per
atu
re in
OC
Mol% of 6OCB
171
On isochoric cooling of the samples, the thermal range of SmAd widens. In all
the samples cooled isochorically, the N-SmAd transition temperature is higher than
that at atmospheric pressure, and the cavitation occurs in the SmAd phase. With the
sudden increase in density, the sample immediately goes over to the reentrant nematic
phase. Thus the lower circles in Figure 6.13 represent the cavitation temperatures
rather than the SmAd-Nr transition temperatures under isochoric condition. The latter
would have occurred at much lower temperatures, but are preempted by the
cavitation. In the mixture with 27.8 mol% of 6OCB, the cavitation occurs at a
temperature close to the SmAd-Nr transition point of the sample with cavity. Thus
negative pressures expand the thermal range of SmAd phase substantially. The sample
with 30.5 mol% of 6OCB does not exhibit the SmAd phase at atmospheric pressure.
This phase is induced on isochoric cooling of the medium. The SmAd phase of course
disappears once the cavitation occurs in the embedded drop (Figure 6.13).
6.4 ConclusionsWe have shown that using a simple technique of embedding liquid crystal
drops in a glassy matrix of sucrose, the liquid crystals can be subjected to negative
pressures. We have made the first measurements of birefringence, a measure of
orientational order parameter S of nematic and smectic liquid crystals under isochoric
condition. The data should be compared with the predictions of molecular theories
which take into account both the hard-rod and attractive intermolecular interactions.
For this purpose, it would be better to choose compounds without flexible end chains
or the highly polar cyano groups in which the dipolar interactions lead to strong short
range order effects. Such materials will have TNI ~ 100 0C, and it would be very useful
if suitable glass forming materials with Tg ~ 200 0C are identified. Indeed, the
technique developed in this work is suitable for many other studies.
References1. P.G. Debenedetti, Metastable Liquids, Princeton University Press, Princeton,
1996.
2. N.M. Holbrook, M.J. Burns and C.B. Field, “Negative xylem pressures in plants:
a test of the balancing pressure technique”, Science 270, 1193-1194, 1995.

172
3. A.H. Guth, The inflationary universe, Addision-Wesley Publishing Co., Reading,
1997.
4. H. Maris and S. Balibar, “Negative pressures and cavitation in liquid helium”,
Physics Today 53, 29-34, 2000.
5. S.J. Henderson and R. J. Speedy, “Melting temperature of ice at positive and
negative pressures”, J.Phys.Chem 91, 3069-3072, 1987.
6. S. Chandrasekhar, Liquid Crystals, Cambridge University Press, Cambridge,
1992.
7. P.G. de Gennes and J. Prost, The physics of liquid crystals, Clarendon press,
Oxford, 1993.
8. L. Onsager, “The effect of shape on the interaction of colloidal particles”, Ann.
NY Acad. Sci 51, 627-659, 1949.
9. P.K. Mukherjee, T.R. Bose, D. Ghose and M. Saha, “Inclusion of density
variation in the Landau-de Gennes theory of the nematic-isotropic phase
transition”, Phys. Rev. E 51, 4570-4573, 1995.
10. R. Tao, P. Sheng and Z.F. Lin, “Nematic- Isotropic phase transition: An extended
mean field theory”, Phys. Rev. Lett. 70, 1271-1274, 1993.
11. R. G. Horn and T.E. Faber, “Molecular alignment in nematic liquid crystals: a
comparison between the results of experiments at high pressure and predictions
based on mean field theories”, Proc.R.Soc.Lond. A368, 199-223, 1979.
12. Q. Zheng, D.J. Durben, G.H. Wolf and C.A. Angell, “Liquids at large negative
pressures: water at the homogeneous nucleation limit”, Science 254, 829-832,
1991.
13. P.S. Drzaic, Liquid crystal dispersions, World Scientific, Singapore, 1995.

173
14. S.L. Shamblin, X. Tang., L. Chang, B.C. Hancock and M.J. Pikal,
“Characterization of the time scales of molecular motion in pharmaceutically
important glasses”, J. Phys. Chem. B103, 4113-4121, 1999.
15. M. Takahashi, S. Mita and S. Kondo, “Study on Molecular Polarizabilities of
Cyclohexane Derivatives”, Mol. Cryst. Liq. Cryst. 132, 53-64, 1986.
16. V. A. Korjenevsky and M.G. Tomilin, “Experimental investigation of the surface
energy of a nematic liquid crystal”, Liq. Cryst. 15, 643-649, 1993.
17. P.P. Karat and N.V. Madhusudana, “Elastic and Optical Properties of some 4 ′-n-
Alkyl-4-cyanobiphenyls”, Mol. Cryst. Liq. Cryst. 36, 51-64, 1976. (for 8CB);
S.Sen, P. Brahma, S.K. Roy, D.K. Mukherjee and S.B. Roy, “Birefringence and
Order Parameter of Some Alkyl and Alkoxycyanobiphenyl Liquid Crystals”, Mol.
Cryst. Liq. Cryst. 100, 327-340, 1983 (for 8OCB). (The density of MCB is
estimated as an appropriate average, using the mole fractions of 8CB and 8OCB).
18. P. E. Cladis, D. Guillon, F. R. Bouchet and P. L. Finn, “Reentrant nematic
transitions in cyano- octyloxybiphenyl (8OCB)”, Phys. Rev. A. 23, 2594-2601,
1981.


![Polymorphic Phase Transitions: Macroscopic Theory and Molecular …€¦ · Phase transitions in crystals of drugs and excipients have been studied extensively [10,11], with the focus](https://img.dokumen.tips/doc/110x75/5f0d24a97e708231d438e3b1/polymorphic-phase-transitions-macroscopic-theory-and-molecular-phase-transitions.jpg)

![TiO2(B) microvoids Sanati(2) · facetted microvoids, sometimes referred to as "negative crystals", or "mosaic" crystals [3], through-out the bulk of the material (Fig. 5). The microvoids](https://img.dokumen.tips/doc/110x75/5e492b8e1de594077e4612c5/tio2b-microvoids-sanati2-facetted-microvoids-sometimes-referred-to-as-negative.jpg)