Embed Size (px)
Citation preview

PHASE TRANSFORMATIONS
DURING COOLING OF
AUTOMOTIVE STEELS
by
MATTHEW C. PADGETT
LUKE N. BREWER, COMMITTEE CHAIR MARK E. BARKEY MARK L. WEAVER
A THESIS
Submitted in partial fulfillment of the requirements for the degree of Master of Science in the
Department of Metallurgical and Materials Engineering in the Graduate School of
The University of Alabama
TUSCALOOSA, ALABAMA
2017

Copyright Matthew Chase Padgett 2017 ALL RIGHTS RESERVED

ii
ABSTRACT
This thesis explores the effect of cooling rate on the microstructure and phases in
advanced high strength steels (AHSS). In the manufacturing of automobiles, the primary joining
mechanism for steel is resistance spot welding (RSW), a process that produces a high heat input
and rapid cooling in the welded metal. The effect of RSW on the microstructure of these
material systems is critical to understanding their mechanical properties. A dual phase steel, DP-
600, and a transformation induced plasticity bainitic-ferritic steel, TBF-1180, were studied to
assess the changes to their microstructure that take place in controlled cooling environments and
in uncontrolled cooling environments, i.e. resistance spot welding. Continuous cooling
transformation (CCT) diagrams were developed using strip specimens of DP-600 and TBF-1180
to determine the phase transformations that occur as a function of cooling rate. The resulting
phases were determined using a thermal-mechanical simulator and dilatometry, combined with
light optical microscopy and hardness measurements. The resulting phases were compared with
RSW specimens where cooling rate was controlled by varying the welding time for two-plate
welds. Comparisons were drawn between experimental welds of DP-600 and simulations
performed using a commercial welding software. The type and quantity of phases present after
RSW were examined using a variety of techniques, including light optical microscopy using
several etchants, hardness measurements, and x-ray diffraction (XRD).

iii
LIST OF ABBREVIATIONS AND SYMBOLS
°C Degrees Celsius
Å Angstrom
AHSS Advanced high strength steels
BCC Body centered cubic
Bs Bainite start
C Carbon
CCT Continuous Cooling Transformation
cm Centimeter
Co Cobalt
CP Complex phase
Cr Chromium
Cu Copper
DP Dual phase
DSI Dynamic Systems Inc.
EBSD Electron backscatter diffraction
EDM Electro-discharge machining
ESI Engineering Systems International
Fs Ferrite start
FCC Face centered cubic
FZ Fusion zone

iv
gR Retained austenite
H Heat input
HAZ Heat affected zone
He Helium
Hz Hertz
I Current
l Wavelength
Ka K-alpha emission line
kA Kiloampere
keV Kiloelectron volt
kgf Kilogram-force
kV Kilovolt
LOM Light optical microscopy
µm Micrometer
Ms Martensite start
Mf Martensite finish
mA Milliampere
mm Millimeter
Mn Manganese
Mo Molybdenum
MPa Mega pascal
Na2S2O5 Sodium metabisulfite
Nb Niobium

v
Q&P Quench & partition
SEM Scanning electron microscope
Si Silicon
RWP R weighted pattern
RSW Resistance spot welding
t Time
Ti Titanium
TRIP Transformation induced plasticity
TWIP Twinning induced plasticity
wt. % Weight percent
V Vanadium
XRD X-ray diffraction

vi
ACKNOWLEDGMENTS
The author gratefully acknowledges the counsel, critiques, and encouragement from his
advisor, Dr. Luke N. Brewer. The author would like to thank Tian Liu for her support and
assistance in all aspects of this work, and more specifically for performing the quantitative
analysis of the welds. The author gratefully acknowledges the collaboration of Brett Hunter for
his guidance regarding all things Gleeble. The author would like to express his gratitude to
Nathaniel Briant for sharing his expertise in thermocouple welding and resistance spot welding.
The author would like to thank Dr. Mark E. Barkey and Brian Fay for their assistance in
performing and interpreting the data generated from the SYSWELD simulations. The author
appreciates the assistance of William Story, Chase Smith and John Bohling (University of
Tennessee) in designing a quenching system for strip specimen.
This research is financially supported by Daimler-Benz and MBUSI. We are very
grateful for the support and collaboration of H. Schubert and B. Hilpert at TecFabrik, and J.
Cousineau, K. Doyle, and M. Seale of MBUSI.

vii
CONTENTS
ABSTRACT ........................................................................................................................ ii
LIST OF ABBREVIATIONS AND SYMBOLS ............................................................... iii
ACKNOWLEDGMENTS ................................................................................................. vi
LIST OF TABLES ............................................................................................................. ix
LIST OF FIGURES ............................................................................................................ x
BACKGROUND AND MOTIVATION ............................................................................. 1
Thesis Objectives .........................................................................................................................8
EXPERIMENTAL METHODS .......................................................................................... 9
Materials & Processing ................................................................................................................9
Continuous Cooling Transformation (CCT) Diagrams ................................................................9
Thermal-mechanical testing ...................................................................................................10
Resistance Spot Welding ............................................................................................................14
SYSWELD Welding Simulation ................................................................................................15
Metallography ............................................................................................................................16
X-ray Diffraction ........................................................................................................................17
Electron Backscatter Diffraction ................................................................................................17
RESULTS .......................................................................................................................... 19
CCT Diagrams ............................................................................................................................19
4140 CCT Diagram ................................................................................................................19

viii
DP-600 CCT Diagram ...........................................................................................................24
TBF-1180 CCT Diagram .......................................................................................................25
Microstructure Characterization .................................................................................................26
Continuously Cooled Specimens ...........................................................................................26
Resistance Spot Welded Specimens ......................................................................................29
Hardness .....................................................................................................................................39
SYSWELD Analysis ..................................................................................................................42
XRD ............................................................................................................................................43
EBSD Characterization ..............................................................................................................45
DISCUSSION ................................................................................................................... 46
CONCLUSIONS .............................................................................................................. 53
REFERENCES ................................................................................................................. 55
APPENDIX: Strip Specimen and CCT diagrams ............................................................. 59

ix
LIST OF TABLES
Table I. Chemical Compositions (wt. %) of 4140, TBF-1180 and DP-600 .................................... 9
Table II. RSW conditions for standard condition two-plate welds varying weld time ................. 15
Table III. Rietveld refinement parameters used to quantify XRD results ..................................... 17
Table IV. Cooling rates associated with 183, 350, and 500 ms welding times of DP-600 center of weld nugget edge of fusion zone ........................................................................... 43 Table V. DP-600 molten zone and HAZ diameters associated with 183, 350, and 500 ms welding times ........................................................................................................................ 43 Table VI. Rietveld refinement quantification of phases present in welded samples of TBF-1180 .......................................................................................................................... 44 Table VII. Maximum cooling rates for various quenching methods for two steel thicknesses .... 46

x
LIST OF FIGURES
Figure 1. Mechanical properties of AHSS plotted as Total elongation (%) vs. Tensile strength (MPa) ........................................................................................................................ 2 Figure 2. Behavior of the volume fraction of retained austenite during a tensile test for hot rolled and cold rolled steel .......................................................................................... 4 Figure 3. Schematic heating and quenching processing cycle for TBF steels ................................ 6
Figure 4. Geometry of Gleeble samples as prepared for CCT curve experiments ....................... 11
Figure 5. Dilatometer as positioned for CCT experiment with strip specimen ............................ 12
Figure 6. Isothermal plane generated on a strip specimen during testing ..................................... 13
Figure 7. Dilatometer data from 4°C/s cooling rate for 4140 steel ............................................... 14 Figure 8. Photograph of three welds on TBF-1180 with 225 ms weld time ................................. 15
Figure 9. Finite element mesh in SYSWELD, showing two plates between the electrodes ........ 15
Figure 10. (a) Cooling curve and (b) Dilatometer curve corresponding to 50°C/s cooling rate showing the martensite start transformation temperature at 320°C ...................................... 20
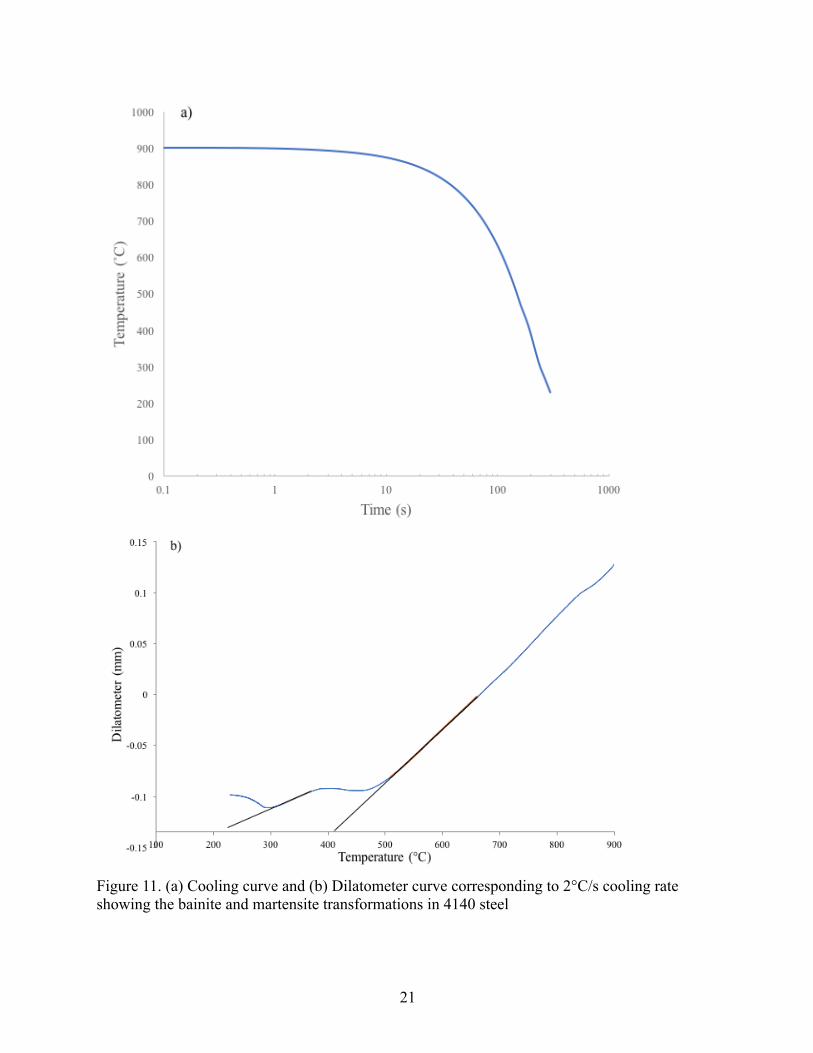
Figure 11. (a) Cooling curve and (b) Dilatometer curve corresponding to 2°C/s cooling rate
showing the bainite and martensite transformations in 4140 steel ....................................... 21 Figure 12. Continuous Cooling curves tested for 4140 steel ........................................................ 22
Figure 13. Transformation curves and cooling rates for 4140 steel .............................................. 22
Figure 14. Cooling rates tested for DP-600 and TBF-1180 .......................................................... 23
Figure 15. Transformation curves and cooling rates for DP-600 .................................................. 24
Figure 16. Transformation curves and cooling rates for TBF-1180 ............................................. 25
Figure 17. Optical micrographs of 4140 etched with nital showing ferrite and martensite for cooling rates of (a) 5°C/s (b) 50°C/s and (c) 85°C/s ............................................................ 26

xi
Figure 18. High magnification optical micrographs of 4140 etched with nital showing ferrite and martensite for cooling rates of (a) 5°C/s (b) 50°C/s and (c) 85°C/s.................... 27 Figure 19. Optical micrographs of DP-600 etched with nital showing ferrite and martensite
showing detailed structure for cooling rates of (a) 5°C/s (b) 50°C/s and (c) 175°C/s .......... 28 Figure 20. Optical micrographs of TBF-1180 etched with lepera showing detailed structure for cooling rates of (a) 5°C/s (b) 50°C/s and (c) 175°C/s ..................................................... 29 Figure 21. Optical macrographs of DP-600 welds (a) 170 ms (b) 340 ms (c) 510 ms ................. 30
Figure 22. Optical micrographs of fusion zone microstructure of DP-600 welds (a) 170 ms (b) 340 ms (c) 510 ms; etched with nital, light phase is ferrite, dark is martensite .............. 31 Figure 23. Higher magnification optical micrographs of fusion zone microstructure of DP-600 welds (a) 170 ms (b) 340 ms (c) 510 ms ................................................................. 32 Figure 24. Optical micrographs of fusion zone and HAZ microstructures of DP-600 welds (a) 170 ms (b) 340 ms (c) 510 ms ......................................................................................... 33 Figure 25. Higher magnification optical micrographs of fusion zone to HAZ microstructure of DP-600 welds (a) 170 ms (b) 340 ms (c) 510 ms ............................................................. 34 Figure 26. Optical micrographs of HAZ microstructure of DP-600 welds (a) 170 ms (b) 340 ms (c) 510 ms ........................................................................................................... 35 Figure 27. SEM secondary electron image of nital-etched DP-600 showing ferrite, martensite and defects from standard welding time ............................................................................... 36 Figure 28. Optical macrographs of TBF-1180 welds (a) 225 ms (b) 450 ms (c) 675 ms etched
with nital ............................................................................................................................... 37 Figure 29. Optical micrographs of fusion zone microstructure in TBF-1180 welds etched with picral (a) 225 ms (b) 450 ms (c) 675 ms ....................................................................... 38 Figure 30. Optical micrograph of fusion zone to HAZ transition microstructure in TBF-1180
welded for 225 ms etched with picral ................................................................................... 38 Figure 31. Hardness measurements for 4140 as a function of cooling rate .................................. 39
Figure 32. Hardness measurements for DP-600 as a function of cooling rate ............................. 40
Figure 33. Hardness measurements for TBF-1180 as a function of cooling rate ......................... 40
Figure 34. Hardness measurements for welded DP-600 as a function of weld time .................... 41

xii
Figure 35. Hardness measurements for welded TBF-1180 as a function of weld time ................ 41
Figure 36. SYSWELD analysis for (a) 183ms (b) 350 (c) 500 ms weld time showing phase distribution as percentage austenite ...................................................................................... 42
Figure 37. X-ray intensity peaks identifying the phases present in uncoated TBF-1180 ............. 43
Figure 38. X-ray intensity peaks identifying the phases present in welded TBF-1180 ................ 44
Figure 39. (a) EBSD phase map of uncoated TBF-1180 showing a ferrite matrix with pockets of retained austenite and (b) band contrast map ........................................................................ 45
Figure 40. Comparison of experimental transitions for 4140 to reference CCT diagram ............ 47
1
BACKGROUND AND MOTIVATION
Life-cycle assessment, manufacturability, safety, and cost are key issues concerning
materials selection in the automotive industry. Life-cycle assessments analyze the total amount
of energy required to manufacture, use, and recycle a material. As the need for sustainable
transportation grows, the research and development of lightweight materials has increased. The
process of replacing automotive components with lightweight parts is known as
“lightweighting”. Lightweight metals, composite materials, and advanced high strength steels
have all been proven to reduce life-cycle energy use and greenhouse gas emissions, compared to
the production methods for conventional steels (Kim, Y., Kim, I., Kim, J., Chung, & Choi, 2014).
While composite materials (e.g. carbon fiber) and lightweight metals (e.g. aluminum) offer more
significant weight savings than high strength steels, the production costs are higher (Motavalli,
2012). Advanced high strength steels (AHSS) have been shown to be the best choice in terms of
functionality, cost and manufacturability, as well as producing less greenhouse gas emissions
during its lifetime (Mayyas, Qattawi, Omar, & Shan, 2012). AHSS are generally classified with
a yield strength greater than 300 MPa and a tensile strength greater than 600 MPa (De Cooman,
2004). This work will investigate the advanced high strength steels used in the process of
lightweighting automobiles.
Maintaining the strength of automotive components while using lighter materials is
imperative. The safety concerns involved in lightweighting relate to the use of less, yet stronger
materials that allow the manufacturer to reduce weight while maintaining—or improving—the
strength of a component. The use of advanced high strength steels is an excellent example.

2
Designing a stronger grade or alloy of steel will allow less total steel to be used in the
manufacturing process; the result is a reduction in weight for the component. The development
of stronger steels is dependent on controlling the mechanical properties of the steel. As
automobile manufacturers endeavor to reduce the weight of vehicle components, new
generations of high strength steels will offer an excellent combination of strength and ductility.
Three generations of advanced high strength steels (AHSS) have been identified in the
literature: the first generation of high strength steels included dual phase (DP) steels, complex
phase (CP) steels, and transformation induced plasticity (TRIP) steels; the second generation
added high manganese levels and are known as twinning induced plasticity (TWIP) steels; the
third and current generation consists of quench and partition (Q&P) and medium manganese
steels (Figure 1) (Lee & Han, 2015).
Figure 1. Mechanical properties of AHSS plotted as Total elongation (%) vs. Tensile strength (MPa). Figure from (Lee & Han, 2015).
3
DP steels consist of a ferrite matrix with secondary martensite. These steels combine
good strength with low initial yield stress and formability. Other mechanical properties, such as
high tensile strength, fatigue resistance, hole expansion, good drawing and welding properties,
make DP steels good candidates for application in automotive manufacturing (Cai, Liu, & Liu,
2014). CP steels typically have a fine ferritic or bainitic matrix with a high-volume fraction of
martensite (Kuziak, Kawalla, & Waengler, 2008). Additions of Nb, Ti, or V cause a precipitation
hardening effect in CP steels, giving them a tensile strength greater than 800 MPa. Their
mechanical properties are characterized by continuous yielding and high uniform elongation
(Kuziak et al., 2008).
TRIP steels are primarily a ferrite matrix with retained austenite with some bainite and
martensite as well. The transformation of retained austenite to martensite is the transformation
induced plasticity effect that results in improved ductility for these steels. Retained austenite in
the ferrite matrix creates a work hardening effect as the retained austenite transforms into
martensite with increasing strain. Figure 2 shows the volume fraction of retained austenite (open
circles) for cold rolled (blue) and hot rolled (red) as a function of strain during tensile testing. In
the solid curves, we see the stress-strain response for cold rolled (blue) and hot rolled material.
After the steel reaches its yield stress, the metastable retained austenite begins to transform into
martensite. The first generation of AHSS steels offered higher strength than mild steels and
other conventional automotive sheet steel, but were still limited in their ductility, thus creating
room for innovation and giving way to the second generation of AHSS.

4
Figure 2. Behavior of the volume fraction (open circles) of retained austenite during a tensile test for hot rolled and cold rolled steel. The solid curves represent the engineering stress-strain behavior during tensile testing. Figure from (Lee & Han, 2015).
The second generation of AHSS is characterized by the increase in manganese content to
promote a fully austenitic microstructure at room temperature. This modification allows the
steels to deform by mechanical twinning, which provides excellent ductility while maintaining
very high strength levels (800-1600 MPa) and total elongation (35-55%) (Bouaziz, Allain, Scott,
Cugy, & Barbier, 2011). Despite the promising mechanical characteristics of TWIP steels, issues
during the assembly and welding of these steels prohibited their implementation in production
lines (Bouaziz et al., 2011). Additionally, the high cost of the alloying elements is prohibitively
expensive for use in high volume production (Lee & Han, 2015). Areas for improvement were
identified and the third generation of AHSS was created, now offering excellent mechanical
properties at a more reasonable cost.
Third generation AHSS are formed by complex heating and cooling processes. TRIP-
assisted bainitic ferritic (TBF) and quench and partitioning (Q&P) steels are two examples of the
third and current generation of AHSS steels. Q&P steels are processed to increase the stability of

5
the retained austenite phase at room temperature. This is achieved by quenching below the
martensite start temperature followed by aging at or above the initial quench temperature
(Edmonds et al., 2006).
TBF steels are processed to retain austenite in a bainitic matrix. The harder bainitic
matrix compared to other TRIP steels produces higher yield strengths in TBF steels (Hausmann,
2014). The amount of retained austenite is also controlled by the alloying elements (e.g. carbon,
silicon and manganese) and the heat treatment during processing. This microstructure is achieved
by heating the steel above its austenization temperature and quenching between the bainite start
temperature and the martensite start temperature and holding the steel there for some time before
quenching to room temperature (Figure 3). This approach provides time for the development of
a bainitic matrix, and also enables the carbon to distribute throughout and stabilize the austenite
phase (Hausmann, 2014; Kuziak et al., 2008). Carbon partitioning enriches the retained
austenite and prevents the transformation to martensite during further cooling to room
temperature (Zaefferer, Ohlert, & Bleck, 2004).
The retained austenite facilitates the TRIP effect that provides the desired mechanical
properties. Improvements in the formability of the steel were made possible because of the
uniform structure of bainite with stable retained austenite (Sugimoto, Sakaguchi, Iida, &
Kashima, 2000). This combination of processing at various temperatures allows different phases
of the steel to form, creating a complex microstructure with advanced mechanical properties.
TRIP steels are generally characterized by a tensile strength of greater than 700 MPa and
uniform ductility over 50% (Lee & Han, 2015). Unfortunately, in sheet steels these carefully
tailored microstructures can be altered and disrupted by the joining processes used to fabricate
components for vehicles.
6
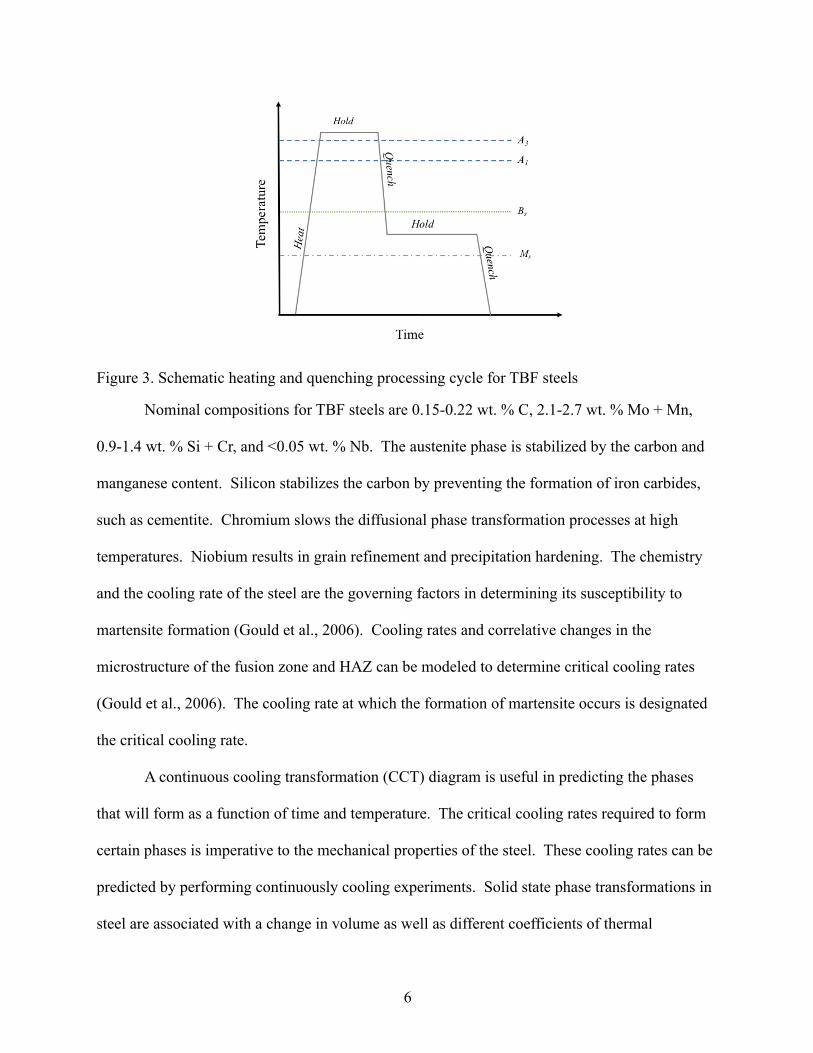
Figure 3. Schematic heating and quenching processing cycle for TBF steels
Nominal compositions for TBF steels are 0.15-0.22 wt. % C, 2.1-2.7 wt. % Mo + Mn,
0.9-1.4 wt. % Si + Cr, and <0.05 wt. % Nb. The austenite phase is stabilized by the carbon and
manganese content. Silicon stabilizes the carbon by preventing the formation of iron carbides,
such as cementite. Chromium slows the diffusional phase transformation processes at high
temperatures. Niobium results in grain refinement and precipitation hardening. The chemistry
and the cooling rate of the steel are the governing factors in determining its susceptibility to
martensite formation (Gould et al., 2006). Cooling rates and correlative changes in the
microstructure of the fusion zone and HAZ can be modeled to determine critical cooling rates
(Gould et al., 2006). The cooling rate at which the formation of martensite occurs is designated
the critical cooling rate.
A continuous cooling transformation (CCT) diagram is useful in predicting the phases
that will form as a function of time and temperature. The critical cooling rates required to form
certain phases is imperative to the mechanical properties of the steel. These cooling rates can be
predicted by performing continuously cooling experiments. Solid state phase transformations in
steel are associated with a change in volume as well as different coefficients of thermal

7
expansion. These changes in physical parameter can be linked to a specific time and temperature
using dilatometry (Mittemeijer, 1992).
Resistance spot welding (RSW) is a critical and ubiquitous joining process in the
automotive industry that allows thin sheets of steel to be joined together in a rapid automated
process (Pouranvari & Marashi, 2013). RSW consists of two copper electrodes that are placed in
contact with two or more sheets of material. A force is applied to squeeze the sheets together,
then a large electrical current (3 – 7 kA) is applied for an interval of time (0.5 – 1 second)
through the copper electrodes, which have a lower resistivity than the sheet material, causing
heat to build up in the sheets squeezed between the electrodes. The resistivity is highest at the
interface between the two sheets, and the heat generated creates a molten zone in the steel sheets.
As the current is removed the electrodes continue to squeeze the weld for a brief period as the
material between the two sheets solidifies. Finally, the force from the electrodes is removed, and
the weld is completed.
RSW inputs a high amount of heat in a short period of time; this is quantified by Joule’s
law
𝐻 = 𝐼$𝑅𝑡
where H is the weld heat input in joules, I is the current in amperes, R is the resistance in ohms
and t is the time in seconds (Williams & Parker, 2004). The resistance is determined by the
materials system; current and time are independent variables in the RSW process. The high heat
input characteristic of RSW produces melting of steel sheets followed by high cooling rates after
solidification. This process substantially alters the microstructure of the weld and the heat
affected zone (HAZ) (Gould et al., 2006; Pouranvari, Alizadeh-Sh, & Marashi, 2015). This work
will focus on the phase transformation behavior as a function of cooling rate on TBF-1180.

8
Thesis Objectives
• Modify the Gleeble thermal-mechanical simulator to perform CCT curve
measurements on a strip steel sample. This work on sheet steels for automotive
applications required the use of strip specimens. The strip steel geometry (thickness
less than 3 mm) can be used to measure CCT curves, but achieving a sufficiently high
cooling rate requires modification of the standard CCT curve measurement in the
Gleeble thermal-mechanical simulator. Directed flows of helium gas were used to
increase the cooling rate.
• Measure the CCT curves for 4140, DP-600 and TBF-1180 strip steels. Using
dilatometry and a directed flow of helium gas the critical phase transformations in
three different steels were determined. Multiple cooling rates were tested to produce
a CCT diagram for each steel.
• Quantify and map the presence of ferrite, austenite, and martensite phases in
DP-600 and TBF-1180 strip steels. The phase fractions and distributions in
advanced high strength steels were a function of the exact processing used to form the
material. The amounts of component phases in two AHSS strip steels were quantified
and visualized using a combination of characterization methods including x-ray
diffraction, electron backscatter diffraction, and light optical microscopy.
• Measure and compare the phase content in resistance spot welded DP-600 and
TBF-1180 with the CCT curves for these steels. The cooling rates in resistance
spot welded samples may be similar to the cooling rates achieved during CCT testing.
The CCT diagram may help to predict the resulting phases in the fusion zone and heat
affected zone that are formed after resistance spot welding.

9
EXPERIMENTAL METHODS
Materials & Processing
The materials systems investigated in these experiments were 4140 steel, DP-600, and
TBF-1180, a TRIP assisted bainitic-ferritic steel. The base chemical compositions for these
steels are shown in Table I.
Table I. Chemical Compositions (wt. %) of 4140 (Li, Niebuhr, Meekisho, & Atteridge, 1998), TBF-1180 (Hausmann, 2014) and DP-600 (Hausmann, 2014)
Steel C Si + Cr Mn + Mo Nb P S N 4140 0.38 1.26 1.03 -- 0.035 0.040 -- TBF-1180 0.17 - 0.22 1.0 - 1.4 2.3 – 2.7 < 0.05 <0.01 <0.01 <0.007 DP-600 0.08 0.04 1.91 -- 0.018 0.006 0.005
4140 steel was purchased from McMaster-Carr as two 30 cm x 30 cm sheets and
machined into smaller samples. DP-600 and TBF-1180 were rolled plate with a thickness of 1.5
mm that had been cut into 150 mm x 50 mm sheets. For continuous cooling experiments DP-600
was galvanized, and TBF-1180 was uncoated. Both steels were welded in the galvanized
condition to match industrial practices.
Continuous Cooling Transformation (CCT) Diagrams
The aim of this work was to characterize these materials and their microstructures as a
function of cooling rate. CCT diagrams were obtained using a thermal-mechanical simulator in
combination with a dilatometer to determine the phase transformations as a function of cooling
rate. Linear cooling rates were programmed into the thermal-mechanical simulator by
designating a change in temperature for a specified amount of time.

10
Thermal-mechanical testing
The Gleeble 1500D thermal-mechanical simulator from Dynamic Systems Inc. (DSI) was
used to generate CCT curves for 4140, TBF-1180 and DP-600. Each strip specimen was heated
from room temperature to 900°C at a rate of 5°C/s, and held there for 60 s to form an isothermal
plane before cooling down to room temperature. While resistive heating was used to heat the
specimens, various methods were required to achieve high cooling rates during testing; phase
transformations for specific cooling rates were detected when coupled with a dilatometer. The
dilatometer measured thermal expansion during heating and cooling. Multiple specimens were
tested at various cooling rates to provide a sufficient range of data to form a CCT curve.
Specimen Geometry
A strip specimen geometry was used in these experiments (Figure 4). This geometry
created an isothermal plane in the center of the specimen to ensure accurate temperature
measurement using a thermocouple. The initial dimensions of the plates were 150 mm x 50 mm
x 3 mm for 4140; and 150 mm x 50 mm x 1.5 mm for TBF-1180 and DP-600. Holes were
machined out of each test specimen by wire-cut electro-discharge machining (EDM) to provide
compatibility with the grips and dilatometer. All Gleeble samples had two 8 mm diameter
circular holes, one at each end horizontally, and two 6 mm x 13 mm elliptical holes, which were
25 mm apart along the center axis of the sample as loaded vertically (Figure 4).
The circular holes allowed the sample to be secured between the copper blocks when
loaded in the testing chamber. Attached to the dilatometer were two L-shaped quartz rods.
These quartz rods were placed through each of the elliptical holes (Figure 5). The thermocouple
was spot welded vertically between the ellipses in the center of the sample 3 mm apart on one

11
side of the sample. A ceramic sleeve was used to prevent accidental shorting between the
thermocouple wires during each test.
To verify the feasibility of this geometry and the maximum cooling rate achievable, strip
specimens of 4140 steel were produced and tested to generate a CCT curve, which was compared
to its known CCT curve from the Atlas of Time-Temperature Diagrams for Irons and Steels
(Vander Voort, 1991).
Figure 4. Geometry of Gleeble samples as prepared for CCT curve experiments

12
Figure 5. Dilatometer as positioned for CCT experiment with strip specimen
Dilatometry
The Gleeble thermal-mechanical simulator was programmed using QuikSim 2 software
to heat the sample at a rate of 5°C/s from ambient temperature to 900°C and held there for one
minute under a vacuum. Zero-force control was used to prevent compression or tension of the
strip specimen during heating and cooling. An isothermal plane was generated using the strip
specimen geometry with an error of less than 3°C after 60 s at 900°C, as seen from above during
testing in Figure 6. The samples were cooled at various cooling rates, from 2°C/s to 175°C/s.
By flowing helium gas onto the surface of the sample cooling rates of up to 175°C/s were
obtained. When helium gas was used to improve the cooling rate, the vacuum was broken and
13
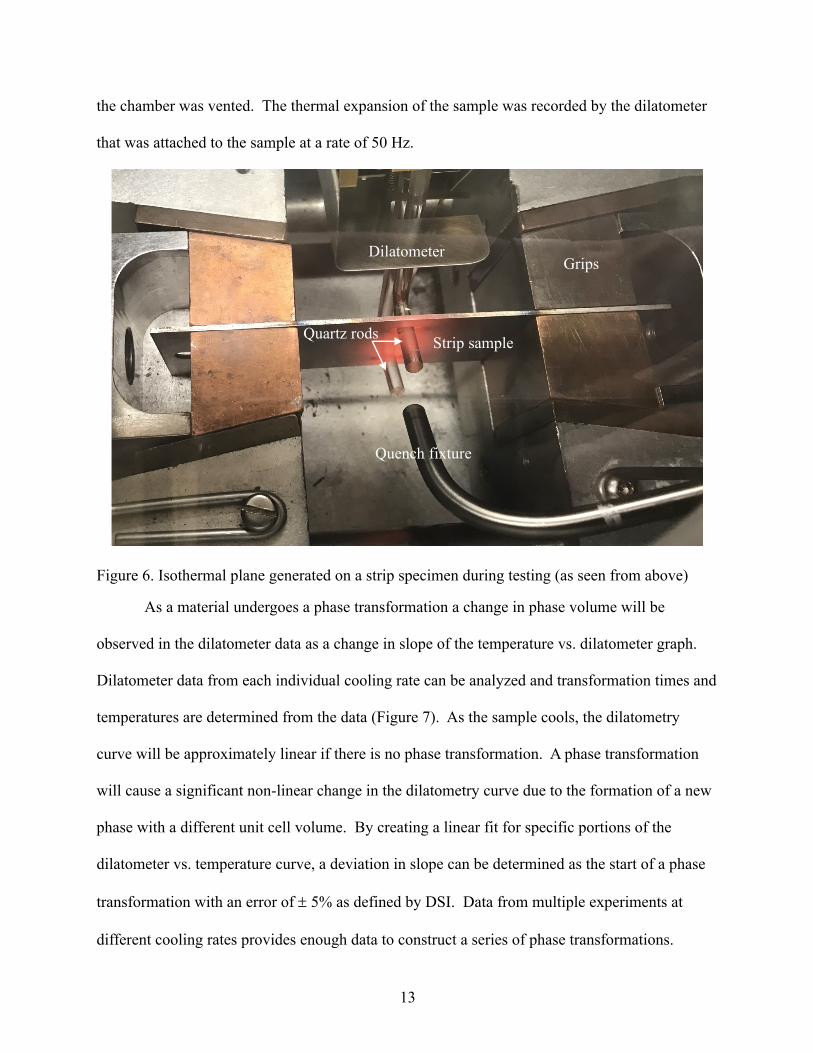
the chamber was vented. The thermal expansion of the sample was recorded by the dilatometer
that was attached to the sample at a rate of 50 Hz.
Figure 6. Isothermal plane generated on a strip specimen during testing (as seen from above)
As a material undergoes a phase transformation a change in phase volume will be
observed in the dilatometer data as a change in slope of the temperature vs. dilatometer graph.
Dilatometer data from each individual cooling rate can be analyzed and transformation times and
temperatures are determined from the data (Figure 7). As the sample cools, the dilatometry
curve will be approximately linear if there is no phase transformation. A phase transformation
will cause a significant non-linear change in the dilatometry curve due to the formation of a new
phase with a different unit cell volume. By creating a linear fit for specific portions of the
dilatometer vs. temperature curve, a deviation in slope can be determined as the start of a phase
transformation with an error of ± 5% as defined by DSI. Data from multiple experiments at
different cooling rates provides enough data to construct a series of phase transformations.
Grips Dilatometer
Quartz rods
Quench fixture
Strip sample

14
These phases can be confirmed using optical microscopy, scanning electron microscopy and
hardness measurements. This information can be complied and a CCT diagram showing the
phase transformations that occur as a function of cooling rate may be constructed.
Figure 7. Dilatometer data from 4°C/s cooling rate for 4140 steel. The orange line show the linear slope during cooling. The deviation of the blue curve away from this line indicates the start of a phase transformation.
Resistance Spot Welding
Resistance spot welding (RSW) was performed on galvanized coupons of DP-600 and
TBF-1180 material using a robotic RSW system. For both steels, welds were made between two
sheets of material with dimensions 150 mm x 50 mm x 1.5 mm. The welding was performed
using a Centerline X-welding gun and F-style Cu-Cr caps with an 8 mm diameter. The welding
was controlled with a Bosch weld controller (model 6000). Three welds were made on each of
plate as shown in the photograph in Figure 8. This process was repeated three times; the only
parameter that was varied was the welding time, because the heat input for welding is directly
proportional to the welding time. The welding parameters for each steel are shown in Table II.

15
Figure 8. Photograph of three welds on TBF-1180 with 225 ms weld time
Table II. RSW conditions for standard condition two-plate welds varying weld time
Welding Force (kN)
Welding current (kA)
Squeeze time (ms)
Welding time (ms)
Hold Time (ms)
TBF-1180 3.8 7.5 400 225, 450, 675 400 DP-600 3.1 7.8 400 170, 340, 510 400
SYSWELD Welding Simulation
Resistance spot welding simulations were performed using the ESI SYSWELD to model
phase transformations in DP-600. An axisymmetric model for the electrodes and the plates was
used, along with a finite element mesh (Figure 9). Two sheet welds were modeled using specific
material properties. Phase proportions were used to calculate the diameter of the fusion zone and
the heat affected zone as a function of time.
Figure 9. Finite element mesh in SYSWELD, showing two plates between the electrodes

16
Metallography
Samples were prepared for optical microscopy using metallographic techniques. Samples
were sectioned using a cut-off saw with cooling water. All samples were mounted in a phenolic
powder mounting compound. The strip specimens were mounted in cross-section parallel to the
rolling direction. The welded samples were mounted in cross-section perpendicular to the rolling
direction. Mechanical grinding was performed using silicon carbide grit paper in the following
order: 240, 320, 400, 600, and finished with 2000 grit paper. To polish the samples, a 3 µm
diamond suspension in water was used on a nylon polishing cloth, then followed by a 1 µm
diamond suspension in water for etching and optical microscopy. Samples were washed with
water, followed by ethanol and dried using cool air. EBSD samples were finished using a 0.05
µm colloidal silica suspension.
For light optical microscopy (LOM), several etchants were used depending upon the steel
and the features of interest. For the TBF-1180 welds, the surface layer etchant, LePera, was
selected to highlight the martensite, ferrite and bainite phases. The LePera etchant was made
from equal parts 4 % picric acid in ethanol and 1 % Na2S2O5 in aqueous dilution. For LOM of
DP-600, nital was used as the etchant to view the phases present after RSW. All strip specimens
tested for phase transformations were etched with nital.
Hardness measurements were taken on strip specimens using the Rockwell C test with
Brale indenter using a 150 kgf load for 10 seconds. Because DP-600 is a softer alloy, both the
Rockwell C and Rockwell B hardness scales were used to quantify the hardness values.
Rockwell B measurements were made using a 1.6 mm diameter steel sphere with a 100 kgf load
for 10 seconds. Both scales were calibrated using a standard before measuring the hardness of
the alloys of interest. All Rockwell B values were later converted to Rockwell C values.

17
X-ray Diffraction
To confirm the presence of retained austenite, x-ray diffraction (XRD) was performed on
the bulk material of TBF-1180. The composition of phases was determined using Bruker D8
Discover XRD with GADDS using a Co Kα source (λ = 1.78896 Å) operated at 40 kV and 35
mA using a step size of 0.005° with a collection time of 15 minutes. Displacement error and
peak shape were calibrated using a pure Si powder standard. An estimation of the volume
fraction of each phase was determined by integrating the relative intensities of the peaks.
Rietveld refinement was applied using TOPAS software for TBF-1180. The background was
fitted using the sixth order Chebyshev polynomial. The parameters used for the Rietveld
refinement are listed in Table III. The rolled steel plate and welded samples were likely textured,
although the sample was neither oscillated nor rotated during data collection. Rather, microstrain
and preferred orientation were taken into consideration during Rietveld refinement.
Table III. Rietveld refinement parameters used to quantify XRD results
Receiving slit width (mm)
FDS shape angle (°)
Simple axial model (mm)
Sample displacement (mm)
Spherical harmonics
RWP
0.8175 2.341 12 Refined value Order 8 10.803
Electron Backscatter Diffraction
The SEM technique of electron backscatter diffraction (EBSD) was chosen to examine
the crystallographic texture and to identify the phases in the steel before and after welding. The
phases and composition present after welding were examined and compared in the weld nugget,
the heat affected zone, and the base metal.
A field emission scanning electron microscope (FEG-SEM), JEOL 7000, with the Oxford
Nordlys detector and AZtec software was used for EBSD. Nominal scanning parameters were

18
20 keV accelerating beam voltage, 80 µA probe current, probe size 13, specimen tilt of 70°, and
working distance of 15 mm. Scanned areas were in one of two categories: either small scans or
large scans. Small scans were defined by an area of 25 µm x 25 µm with 0.1 µm step size; large
scans were defined as any larger area with a step size of 0.5 µm. All scans collected EBSD
patterns with 4 x 4 binning and no frame averaging. Phases added for acquisition were iron (bcc)
and iron (fcc).

19
RESULTS
CCT Diagrams
The CCT curves clearly showed the austenite to ferrite, austenite to bainite, and austenite
to martensite phase transformations. The specific times and temperatures identifying the phase
transformations were determined by analyzing both the cooling curve and the dilatometer data
for each cooling rate. All alloys tested in this work produced reasonable CCT diagrams using
strip specimens.
4140 CCT Diagram
These transformations were particularly clear for the 4140 steel samples. Figures 10 &
11 show both the cooling curve and the dilatometer curve for a fast and slow cooling rate,
respectively. By directing helium gas directly at the center of the CCT specimen, a maximum
cooling rate of 85°C/s was obtained. Cooling rates of 2°C/s to 85°C/s were achieved for the
4140 steel (Figure 12). The combination of the transition times and temperatures for all cooling
rates produces the CCT diagram for 4140 steel (Figure 13). Compared to the published CCT
diagram for AISI 4140 steel, the experimental CCT using a strip sample geometry showed an
earlier transition time for the austenite to ferrite transition and austenite to bainite transition
(Vander Voort, 1991). The martensite start temperature was determined to be between 300-340°C
for these cooling rates, compared to 350°C for the same cooling rates in the literature (Vander
Voort, 1991). When combined with the results from hardness testing and optical microscopy, it is
apparent that cooling rates faster than 20°C/s will be sufficient to form martensite.

20
Figure 10. (a) Cooling curve and (b) Dilatometer curve corresponding to 50°C/s cooling rate showing the martensite start transformation temperature at 320°C
21
Figure 11. (a) Cooling curve and (b) Dilatometer curve corresponding to 2°C/s cooling rate showing the bainite and martensite transformations in 4140 steel

22
Figure 12. Continuous Cooling curves tested for 4140 steel
Figure 13. Transformation curves and cooling rates for 4140 steel

23
The maximum cooling rate obtained for the thinner steels was higher compared to the
maximum cooling rate for the thicker 4140 steel. The maximum cooling rate obtained for DP-
600 and TBF-1180 was 175°C/s, with the assistance of a helium flow. Cooling rates ranged from
5°C/s to 175°C/s for these steels (Figure 14).
Figure 14. Cooling rates tested for DP-600 and TBF-1180

24
DP-600 CCT Diagram
The phase transitions were determined from the dilatometer data and cooling curves for
DP-600. The austenite to ferrite transition start was between 600-750°C for slower cooling rates,
and the bainite transition start was between 530-550°C. The martensite transition temperature
was determined to be between 430-460°C for the cooling rates tested. The transformations are
shown in the CCT diagram (Figure 15).
Figure 15. Transformation curves and cooling rates for DP-600

25
TBF-1180 CCT Diagram
The time and temperature describing the formation of phases were evident from the
cooling curves and dilatometer data. Cooling rates faster than 100°C/s will avoid the formation
of ferrite or bainite and only form martensite. The ferrite start temperature was not observed for
these cooling rates. The bainite start temperature ranged from 450-520°C. The martensite
temperature was determined to be between 360-375°C for the cooling rates tested. The
transformations are shown in the CCT diagram (Figure 16).
Figure 16. Transformation curves and cooling rates for TBF-1180
26
Microstructure Characterization
Phase transformations were confirmed using optical microscopy with a variety of
etchants.
Continuously Cooled Specimens
4140 Steel
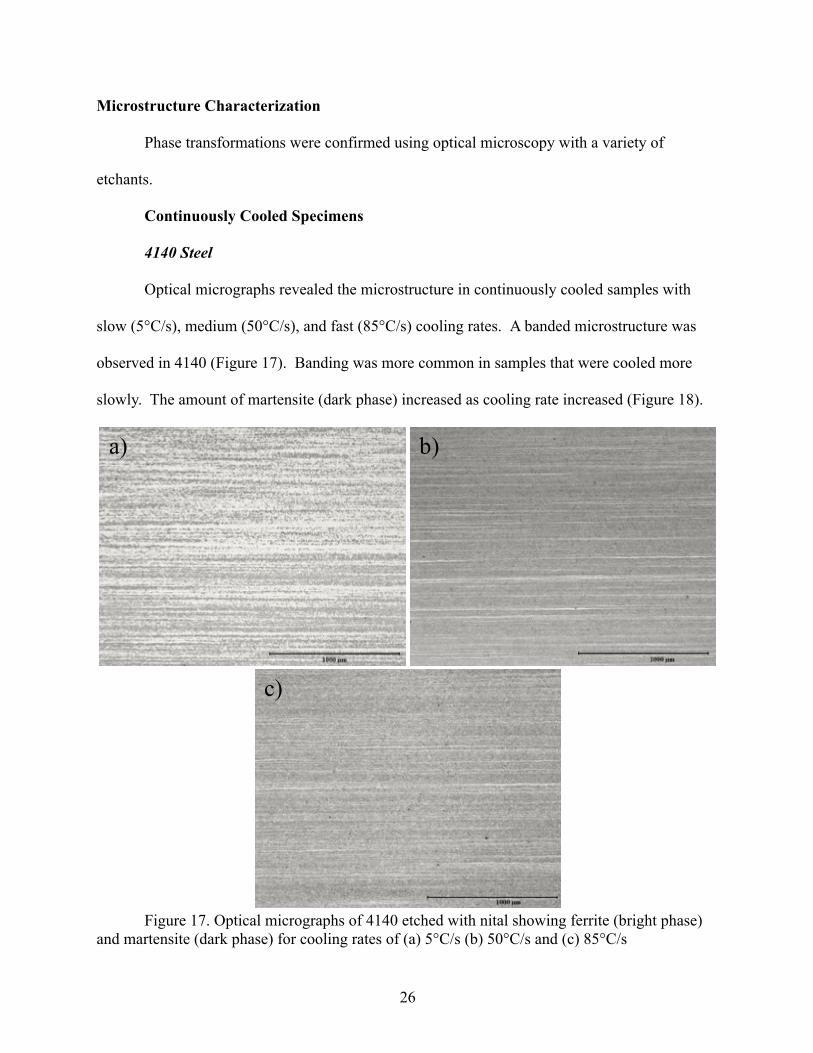
Optical micrographs revealed the microstructure in continuously cooled samples with
slow (5°C/s), medium (50°C/s), and fast (85°C/s) cooling rates. A banded microstructure was
observed in 4140 (Figure 17). Banding was more common in samples that were cooled more
slowly. The amount of martensite (dark phase) increased as cooling rate increased (Figure 18).
Figure 17. Optical micrographs of 4140 etched with nital showing ferrite (bright phase)
and martensite (dark phase) for cooling rates of (a) 5°C/s (b) 50°C/s and (c) 85°C/s
a) b)
c)
27
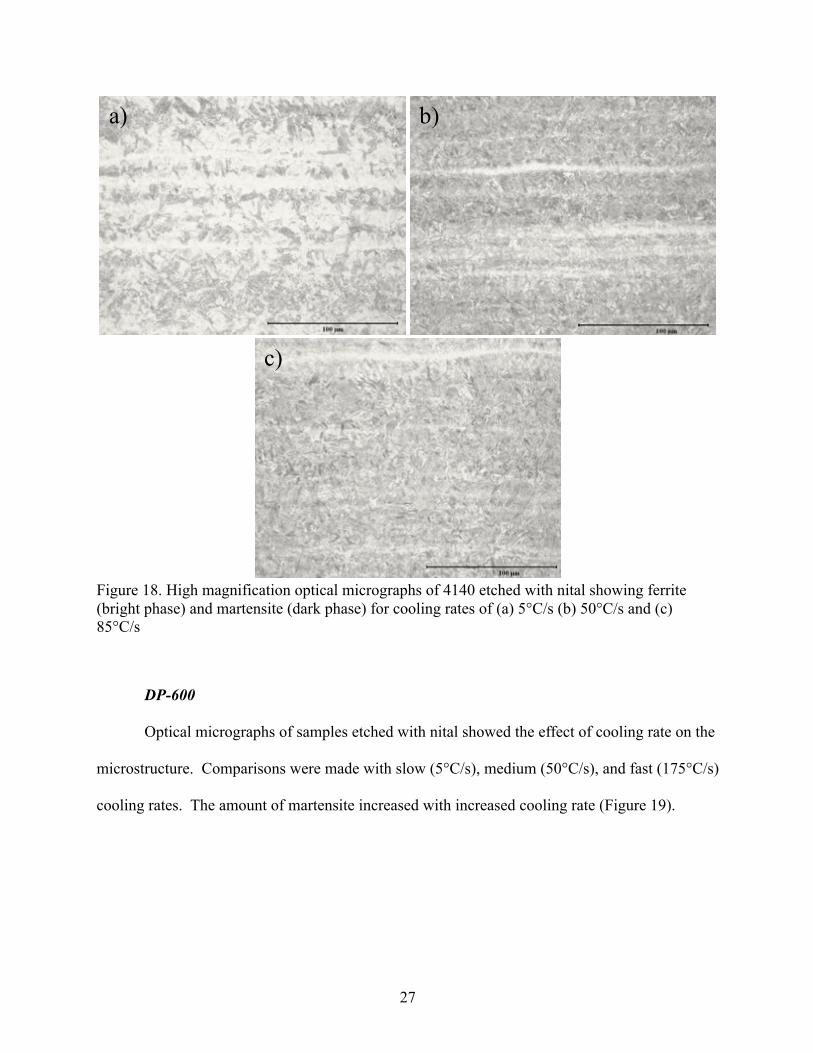
Figure 18. High magnification optical micrographs of 4140 etched with nital showing ferrite (bright phase) and martensite (dark phase) for cooling rates of (a) 5°C/s (b) 50°C/s and (c) 85°C/s
DP-600
Optical micrographs of samples etched with nital showed the effect of cooling rate on the
microstructure. Comparisons were made with slow (5°C/s), medium (50°C/s), and fast (175°C/s)
cooling rates. The amount of martensite increased with increased cooling rate (Figure 19).
a) b)
c)

28
Figure 19. Optical micrographs of DP-600 etched with nital showing ferrite (bright phase) and martensite (dark phase) showing detailed structure for cooling rates of (a) 5°C/s (b) 50°C/s and (c) 175°C/s
TBF-1180
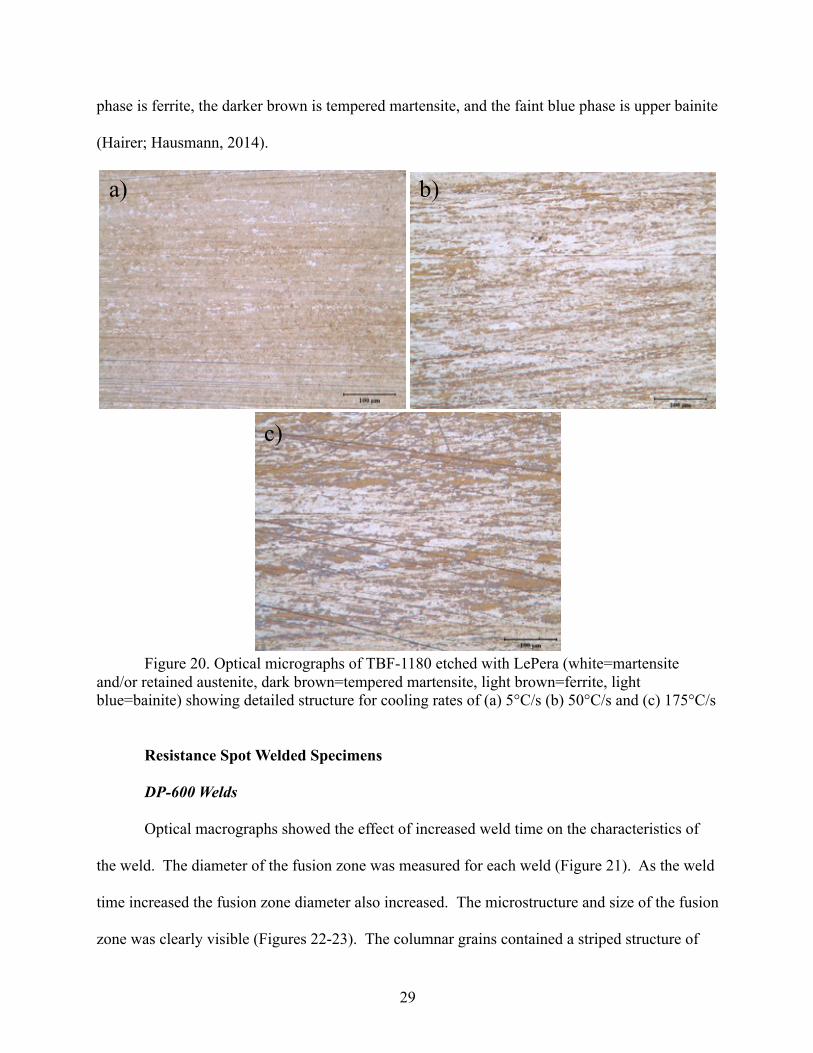
Optical micrographs of continuously cooled samples etched with LePera revealed the
resulting phases and qualitatively confirmed the results of the CCT diagram. For slower cooling
rates a bainitic-ferritic matrix with pockets of retained austenite and/or martensite was observed
(Figure 20a). The amount and size of retained austenite and/or martensite dramatically increased
for faster cooling rates (Figure 20b&c). The LePera etchant was used to highlight the different
phases in TBF-1180. The white phase is martensite and/or retained austenite, the light brown
a) b)
c)
29
phase is ferrite, the darker brown is tempered martensite, and the faint blue phase is upper bainite
(Hairer; Hausmann, 2014).
Figure 20. Optical micrographs of TBF-1180 etched with LePera (white=martensite
and/or retained austenite, dark brown=tempered martensite, light brown=ferrite, light blue=bainite) showing detailed structure for cooling rates of (a) 5°C/s (b) 50°C/s and (c) 175°C/s
Resistance Spot Welded Specimens
DP-600 Welds
Optical macrographs showed the effect of increased weld time on the characteristics of
the weld. The diameter of the fusion zone was measured for each weld (Figure 21). As the weld
time increased the fusion zone diameter also increased. The microstructure and size of the fusion
zone was clearly visible (Figures 22-23). The columnar grains contained a striped structure of
a) b)
c)

30
ferrite and martensite. The microstructure of the fusion zone was much coarser than that of the
HAZ (Figures 24-26). Large columnar grains were observed in the fusion zone compared to the
very fine microstructure of the HAZ. The fusion zone contained mostly martensite with some
ferrite. SEM images were taken to identify the small, dark, dispersed particles seen in the
microstructure of the fusion zone and heat affected zone (Figure 27).
Figure 21. Optical macrographs of DP-600 welds (a) 170 ms (b) 340 ms (c) 510 ms

31
Figure 22. Optical micrographs of fusion zone microstructure of DP-600 welds (a) 170
ms (b) 340 ms (c) 510 ms; etched with nital, light phase is ferrite, dark is martensite
a) b)
c)

32
Figure 23. Higher magnification optical micrographs of fusion zone microstructure of DP-600 welds (a) 170 ms (b) 340 ms (c) 510 ms
a) b)
c)

33
Figure 24. Optical micrographs of fusion zone and HAZ microstructures of DP-600
welds (a) 170 ms (b) 340 ms (c) 510 ms
a b
c

34
Figure 25. Higher magnification optical micrographs of fusion zone to HAZ
microstructure of DP-600 welds (a) 170 ms (b) 340 ms (c) 510 ms

35
Figure 26. Optical micrographs of HAZ microstructure of DP-600 welds (a) 170 ms (b) 340 ms (c) 510 ms
a) b)
c)

36
Figure 27. SEM secondary electron image of nital-etched DP-600 showing ferrite, martensite and defects from standard welding time
TBF-1180 Welds
Optical macrographs showed the effect of increased weld time on the characteristics of
the weld. The diameter of the fusion zone was measured for each weld (Figure 28). As the weld
time increased the fusion zone diameter also increased. This material was not responsive to the
LePera etchant, so instead a picral etch was used to highlight the microstructure of the welds in
TBF-1180 (Figure 29). Dendritic ferrite grains were observed in the fusion zone, with martensite
at the grain boundaries (Pouranvari et al., 2015). The size of the dendrites decreased with
increased weld time. The microstructure abruptly changed from the fusion zone to the HAZ
(Figure 30).

37
Figure 28. Optical macrographs of TBF-1180 welds (a) 225 ms (b) 450 ms (c) 675 ms etched with nital

38
Figure 29. Optical micrographs of fusion zone microstructure in TBF-1180 welds etched
with picral (a) 225 ms (b) 450 ms (c) 675 ms
Figure 30. Optical micrograph of fusion zone to HAZ transition microstructure in TBF-1180 welded for 225 ms etched with picral
a) b)
c)
39
Hardness
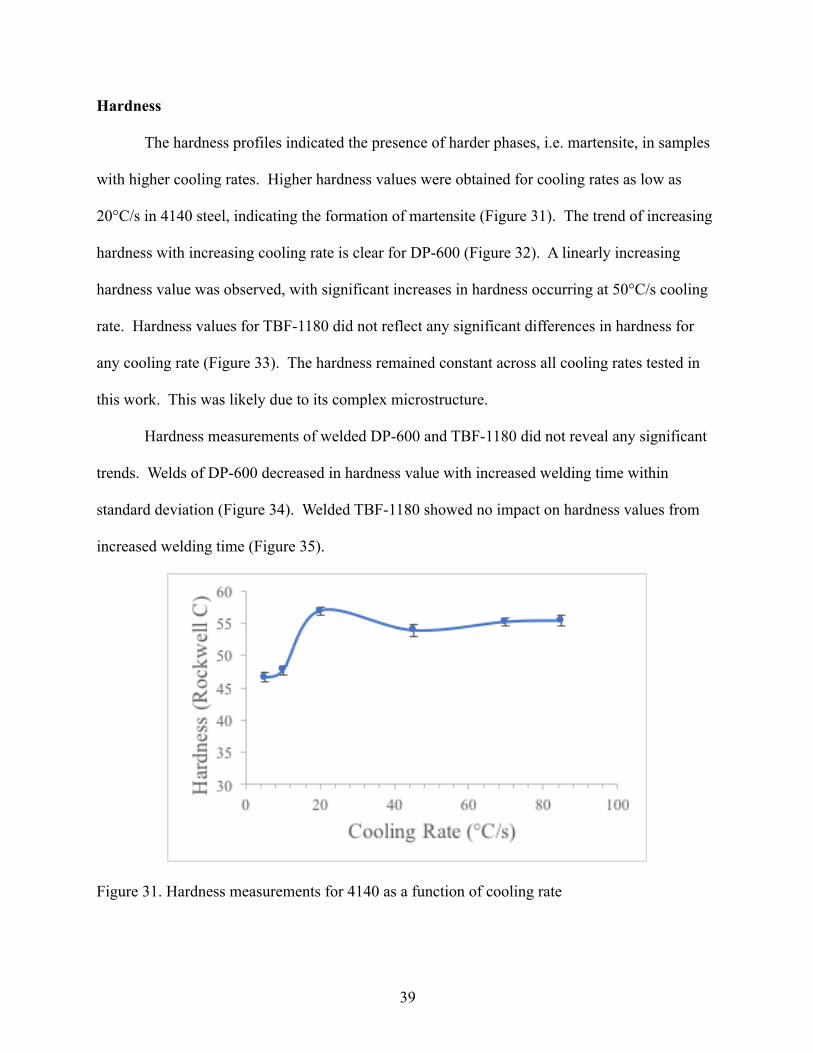
The hardness profiles indicated the presence of harder phases, i.e. martensite, in samples
with higher cooling rates. Higher hardness values were obtained for cooling rates as low as
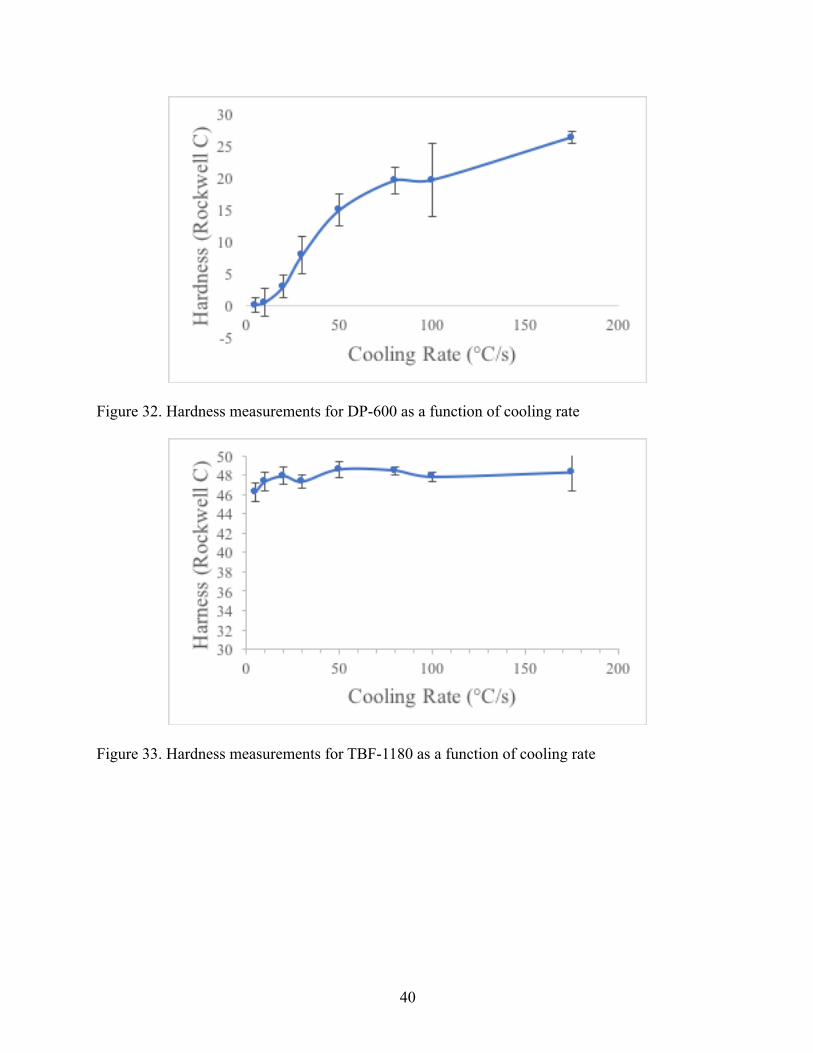
20°C/s in 4140 steel, indicating the formation of martensite (Figure 31). The trend of increasing
hardness with increasing cooling rate is clear for DP-600 (Figure 32). A linearly increasing
hardness value was observed, with significant increases in hardness occurring at 50°C/s cooling
rate. Hardness values for TBF-1180 did not reflect any significant differences in hardness for
any cooling rate (Figure 33). The hardness remained constant across all cooling rates tested in
this work. This was likely due to its complex microstructure.
Hardness measurements of welded DP-600 and TBF-1180 did not reveal any significant
trends. Welds of DP-600 decreased in hardness value with increased welding time within
standard deviation (Figure 34). Welded TBF-1180 showed no impact on hardness values from
increased welding time (Figure 35).
Figure 31. Hardness measurements for 4140 as a function of cooling rate
40
Figure 32. Hardness measurements for DP-600 as a function of cooling rate
Figure 33. Hardness measurements for TBF-1180 as a function of cooling rate

41
Figure 34. Hardness measurements for welded DP-600 as a function of weld time
Figure 35. Hardness measurements for welded TBF-1180 as a function of weld time

42
SYSWELD Analysis
The commercial software SYSWELD was able to simulate the welding of DP-600 and
the phase distribution after welding for three different welding times (Figure 36). The cooling
rate in the center of the fusion zone and the edge of the fusion zone were calculated as the
cooling rate from 900°C to 300°C as extracted from the simulation and are listed in Table IV.
The distance from the center of the fusion zone to the edge of the fusion zone increased with
increasing weld time, so the cooling rates are more varied at the edge of the fusion zone. The
shortest weld time resulted in the fastest simulated cooling rates in the fusion zone, while the
standard and longer weld times had comparable cooling rates. The diameter of the molten zone
and HAZ were recorded at the end of the welding process in SYSWELD. The diameter of the
molten zone and the HAZ increased with increased weld time; these values are listed in Table V.
Figure 36. SYSWELD analysis for (a) 183ms (b) 350 (c) 500 ms weld time showing phase distribution as percentage austenite (pink=100% ferrite, blue=0% ferrite). Open circles reflect the approximate location of the thermal profiles extracted for all three conditions
a) b) c) a) 100% Ferrite
0% Ferrite
Electrode
Electrode
Two sheets Weld

43
Table IV. Cooling rates associated with 183, 350, and 500 ms welding times of DP-600 center of weld nugget edge of fusion zone
Weld Time (ms) 183 350 500 Center FZ Cooling Rate (°C/s) 4000 3000 2800 Edge FZ Cooling Rate (°C/s) 2100 1600 1700
Table V. DP-600 molten zone and HAZ diameters associated with 183, 350, and 500 ms welding times
Weld Time (ms) 183 350 500 Molten Zone diameter (mm) 4.02 4.48 5.19 Heat Affected Zone diameter (mm) 6.4 6.86 7.56
XRD
The phases in uncoated TBF-1180 were successfully detected and analyzed using XRD.
Ferrite and austenite were the main constituents in uncoated TBF-1180 (Figure 37). The
quantitative results from the Rietveld refinement found 79.1 % ferrite and 20.9 % retained
austenite in the uncoated TBF-1180 sheet steel.
Figure 37. X-ray intensity peaks identifying the phases present in uncoated TBF-1180

44
After welding the types and amounts of phases present changed (Figure 38). Retained
austenite was detected in all three welding conditions. The additional phases detected in the
welded plate introduced uncertainty in the Rietveld refinement and quantification of retained
austenite in the welds. The approximate compositions of the phases present in welded TBF-1180
are listed in Table VI. A significant reduction in both the percentage of ferrite and austenite
phases in the welds was observed. The galvanized coating on welded TBF-1180 explains the
iron zinc phase.
Figure 38. X-ray intensity peaks identifying the phases present in welded TBF-1180
Table VI. Rietveld refinement quantification of phases present in welded samples of TBF-1180
Phase (%) 225 ms 450 ms 675 ms Ferrite 66.43 53.25 62.7 Austenite 2.42 3.87 3.69 Iron Zinc 9.7 16.55 15.08 Iron Carbide 21.45 26.33 18.53
45
EBSD Characterization
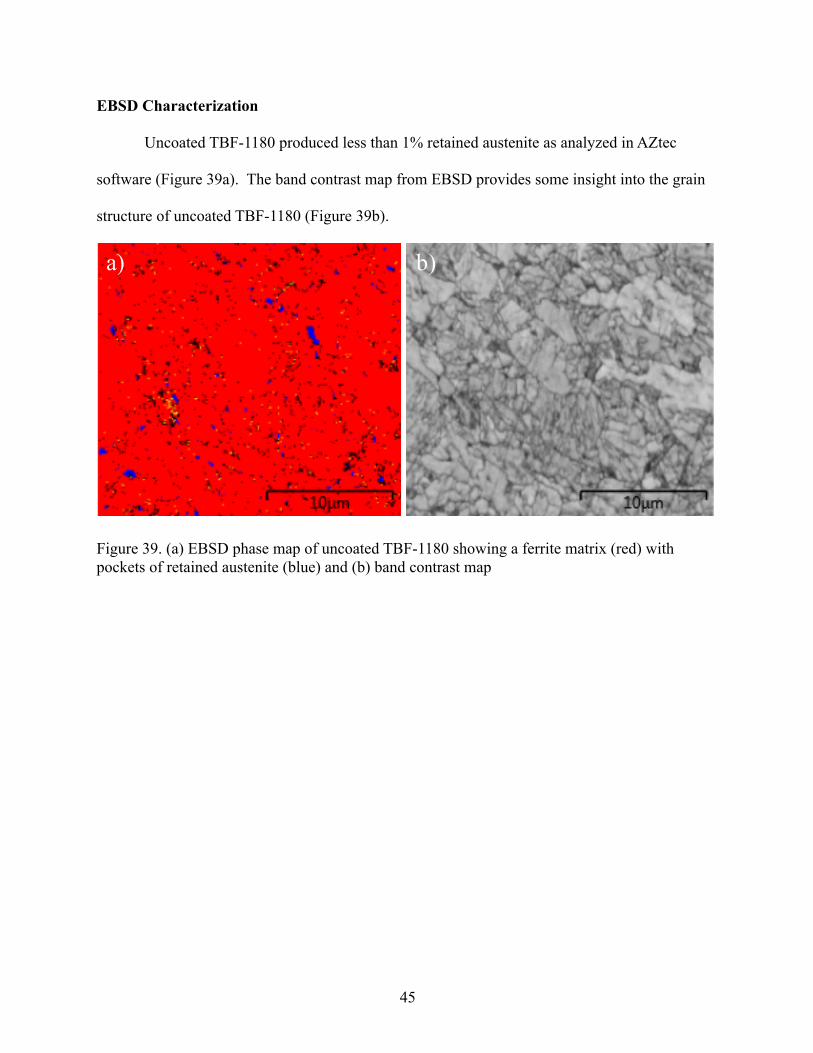
Uncoated TBF-1180 produced less than 1% retained austenite as analyzed in AZtec
software (Figure 39a). The band contrast map from EBSD provides some insight into the grain
structure of uncoated TBF-1180 (Figure 39b).
Figure 39. (a) EBSD phase map of uncoated TBF-1180 showing a ferrite matrix (red) with pockets of retained austenite (blue) and (b) band contrast map
a) b)
46
DISCUSSION
Generating CCT curves from sheet steel is possible using a strip sample geometry. The
resulting CCT diagrams clearly showed the phase transformations for 4140, DP-600 and TBF-
1180, but deviation from the literature was also observed (Gould et al., 2006; Li et al., 1998;
Grajcar, Kuziak, & Zalecki, 2012). Transformations appeared to occur at earlier times compared
with standard and predicted CCT diagrams for the steels studied in this work. The cooling rates
achieved using the strip sample geometry were similar to those used in most other work on the
generation of CCT diagrams for AHSS’s (Colla, Desanctis, Dimatteo, Lovicu, & Valentini, 2011;
Kang, Park, Jang, Jang, & Lee, 2016). The maximum cooling rates obtained from this work are
listed in Table VII. However, the isothermal cooling obtained by using the more common hollow
cylindrical samples was difficult to reproduce with the current method of quenching strip
samples in the Gleeble.
Table VII. Maximum cooling rates for various quenching methods for two steel thicknesses
Cooling Type Helium Flow Air Flow Atmosphere 3 mm Max Cooling Rates (°C/s) 85 50 10 1.5 mm Max Cooling Rates (°C/s) 175 100 20
The transition times and temperatures for 4140 steel compared well with the standard
CCT from the literature. The martensite start temperature agreed particularly well with the
previous measurements (Vander Voort, 1991). However, the ferrite and bainite start temperatures
were shifted to earlier times than expected. This may be a result of the difference in testing
method, i.e. the Jominy end quench test, compared with physical simulation of cooling

47
on strip specimen. Figure 40 overlays the experimental data for phase transformations (marked
lines) with the transformations from the Atlas of CCT diagrams (dark lines). The range in
martensite start temperatures is reasonable and has been observed in other work on developing
experimental CCT diagrams (Kang et al., 2016). Non-uniform cooling of the sample may also
have produced some error. The location of the thermocouple and the geometry of the sample
were designed to create an isothermal plane during heating. To maximize the cooling rate the
flow of pressurized gas likely did not cool the sample evenly, thus the isothermal plane was
likely not maintained during cooling. The difference in temperature between the location of the
thermocouple and the dilatometer quartz rods may account for some error.
Figure 40. Comparison of experimental transitions for 4140 to reference CCT diagram

48
Transitions occurred at earlier times than expected for high cooling rates compared to the
reference material. This is reflected in the difficulty in predicting the minimum cooling rate to
form martensite in 4140 steel from the CCT diagram, whereas the hardness profile for 4140 more
accurately predicts this cooling rate at around 20°C/s, which agrees with the existing literature
(Li et al., 1998). This discrepancy in high cooling rate and phase transformation behavior may
be a result of the difficulty in achieving an isothermally cooled specimen during testing. The
strip specimen geometry was more accurate in predicting phase transformations at slower
cooling rates.
Another consideration in the generation of CCT curves are the conditions of the prior
austenite grains. The amount of deformation of prior austenite grains can shift the CCT to higher
temperatures and earlier times than expected. It has been observed that deformed austenite will
transform more rapidly than undeformed austenite because of the increased volume fraction of
nucleation sites (Olasolo, Uranga, Rodriguez-Ibabe, & Lopez, 2011).
Agreement was observed between simulated CCT diagrams for DP-600 in the literature
and the experimental CCT diagram generated from this work. The simulated and experimental
data both placed the martensite start temperature around 450°C (Gould et al., 2006). The critical
cooling rate to form a fully martensitic microstructure was 80°C/s for both CCT diagrams. The
ferrite start temperature for faster cooling rates was higher than predicted.
Detecting of all the phase transformations in TBF-1180 proved difficult. Cooling rates
for were not sufficiently slow to detect the ferrite transformation in this alloy. The chemical
composition of TBF-1180 was designed to form a bainitic-ferritic matrix, so it is understandable
that the formation of ferrite would occur at slower cooling rates than tested in this work. This is
likely a result of the manganese and chromium content suppressing the ferrite formation during

49
cooling from austenitization (Grajcar, Zalecki, Burian, & Kozlowska, 2016). The addition of
manganese is also known to lower the martensite start temperature (Hausmann, 2014).
Hardness measurements distinctly showed an increase in hardness value for increasing
cooling rate for all samples. Significant increases in hardness values were noted for the critical
transformation of ferrite to martensite. For 4140 this increase occurred at approximately the
20°C/s cooling rate, for DP-600 the shift occurred at 50°C/s cooling rate. TBF-1180 presented
no clear trend in hardness values as a function of cooling rate. This is likely due to its complex
microstructure. The hardness values for DP-600 were near the lower limits of the Rockwell C
test, and near the upper limit of the Rockwell B scale. The two scales overlap at HRC 0 and
HRB 81; DP-600 produced several results around this overlap, necessitating the use of both
scales. HRB values were converted to HRC using a conversion table to plot all hardness values
on the Rockwell C scale.
Comparison between the hardness values of continuously cooled samples and RSW
samples revealed differences in DP-600 and TBF-1180. Hardness values for continuously cooled
specimen of DP-600 were all lower than the hardness values from all welding times. This was
the expected trend as the cooling rates for all welding conditions were much higher than those
achieved during continuously cooled experiments. Hardness values for continuously cooled
specimen of TBF-1180 produced hardness values approximately the same as the hardness values
from all welding times. Welded TBF-1180 may have had slightly lower hardness values, but
within one standard of deviation of the hardness values for continuously cooled specimen.
The ability to successfully reveal the microstructure using multiple etchants depended
upon the type of steel and how it was processed. Selection of the etchants was important to
reveal specific characteristics about each type of steel and its microstructure. Nital, picral and

50
LePera etchants had different results for each of the three steels. While nital primarily etches the
ferrite, microstructures containing both retained austenite and martensite require the use of more
sophisticated etchants, such as LePera (Girault et al., 1998). Nital worked the best, and most
consistently for all three steel types in this work. A picral etch worked particularly well for
examining the microstructure of the TBF-1180 welds, while LePera worked best for the
comparison on the effect of cooling rate on TBF-1180 samples. Various methods of etching were
attempted as well, including immersion and swabbing with cotton tip. For all three etchants
swabbing using a cotton tip produced the best results. All welded samples required special care
after etching to completely remove any excess etchant, or ethanol, that may have accumulated in
the gap between the two plates.
The microstructure of welded DP-600 produced unexpected features. As seen in Figures
22-26, what appear to be holes in the microstructure were formed and dispersed throughout the
microstructure, particularly in the fusion zone and heat affected zone. These features largely
disappeared for the longest welding time. The SEM image in Figure 27 clearly shows the ferrite
and martensite along with the defects present in the welded sample. It has been observed that
lower welding forces will lead to a higher quantity of micro-voids (Ma et al., 2008). The
welding force may not be sufficient to press the molten material together and allow time for
solidification, resulting in micro-voids. The effect of welding time—essentially the total heat
input—increased the molten zone for longer welding times, which may explain why far fewer
defects are observed for the longest weld time. This type of defect has also been related to
asymmetric weld nugget formation and non-homogenous melting (Aktas, Ozsarac, & Aslanlar,
2012). X-ray spectra and mapping indicated an enriched oxygen content at these defects.
51
The size of the fusion zone in experimental welds of DP-600 compares well with the
simulated fusion zones generated in SYSWELD for all weld times. FZ and HAZ diameters were
calculated at the transition from 100% martensite to another phase, and at the transition to 100%
base metal, respectively. The cooling rates extracted from SYSWELD were calculated as the
cooling rate from 900°C to 300°C to directly compare the cooling rates in the welds with those
from the CCT diagram. Cooling rates were calculated at the center and edge of the molten zone.
The highest cooling rate was observed for the condition with the shortest welding time. The
faster dissipation of heat due to less total material heated for this sample likely led to its higher
cooling rate (Pouranvari et al., 2015). Experimentally, weld time was directly related to the
fusion zone diameter, and therefore the cooling rate.
A ratio of four times the square root of the thickness of the plate has been quoted as a
minimum diameter required for a successful weld, expressed as
d = 4 𝑡
where d is the critical nugget diameter and t is the thickness of the plate in millimeters (Triyono,
2013). For DP-600 the critical nugget diameter was calculated to be 4.5 mm. The shortest weld
time produced weld diameters above this value, while the longer weld times produced weld
diameters much greater than the critical diameter. The critical nugget diameter for TBF-1180
was calculated to be 5.0 mm; all weld times produced a nugget diameter that exceeded the
critical nugget diameter.
The cooling rates in resistance spot welding are much faster than those obtained in this
work, however, the Gleeble 1500D boasts a capability of cooling samples up to 10,000°C/s using
the ISO-Q method of quenching. It may be possible to thermally simulate the cooling rates of
RSW, but a different sample geometry than tested in this work would be required.

52
Accurately detecting the amount of retained austenite in TBF-1180 was complicated by
sample preparation artifacts. Due to the highly metastable nature of retained austenite it was
possible to transform the retained austenite during mechanical polishing and sample preparation,
which resulted in much lower values than expected when observed in the SEM/EBSD. Non-
destructive XRD analysis was performed to avoid transforming any of the retained austenite on
uncoated sheet steel. XRD proved to be more capable of accurately mapping the phases, and in
combination with Rietveld refinement, provided a much more reasonable quantitative analysis of
the percentage of retained austenite in TBF-1180.

53
CONCLUSIONS
This thesis explored the effect of cooling rate on the microstructure and phases in
advanced high strength steels used in the automotive industry. CCT diagrams for 4140, DP-600
and TBF-1180 were constructed and phases were confirmed using continuous cooling,
dilatometry, light optical microscopy and hardness tests. The effect of the high cooling rates
characteristic of resistance spot welding was examined in welds of DP-600 and TBF-1180. The
amount of retained austenite in TBF-1180 after welding was studied using XRD.
• Modified the Gleeble thermal-mechanical simulator to successfully perform
CCT curve measurements on strip steel specimens.
Maximum cooling rates up to 175°C/s on thin (1.5 mm) specimens were achieved
with the assistance of a pressurized helium gas flow onto the surface of the sample.
Sample thickness and helium gas flow were the key variables for achieving rapid
cooling rates.
• Successfully measured the CCT curves for 4140, DP-600 and TBF-1180 strip
specimens.
Close agreement was observed between the experimental CCT diagram and those
found in the literature for 4140 and DP-600. The CCT diagram for TBF-1180 has
received limited attention due to its relative novelty. An original CCT diagram for
TBF-1180 was constructed. The martensite start temperature ranges for DP-600 and
TBF-1180 were 430-460°C and 355-375°C, respectively.

54
• Quantified and mapped the presence of ferrite, austenite, and martensite phases
in DP-600 and TBF-1180 strip steels.
Optical microscopy and hardness were used to confirm the phases present in
continuously cooled specimens. Ferrite was observed for slower cooling rates in DP-
600, while bainite and martensite were primarily formed in TBF-1180.
• Measured and compared the phase content in resistance spot welded TBF-1180
and DP-600 with the CCT curves for these steels.
The types and percentages of phases changed after RSW. SYSWELD simulations
were used to predict the phase content and cooling rates in DP-600. Agreement was
shown between each experimental weld and its simulated fusion zone size and phases
present after welding. XRD and EBSD quantified the amount of retained austenite in
TBF-1180 before and after welding. The amount of retained austenite decreased
significantly after welding for all welding conditions.

55
REFERENCES
Aktas, S., Ozsarac, U., & Aslanlar, S. (2012). Effect of Spot Welding Parameters on Tensile Properties of DP 600 Steel Sheet Joints. Materials and Manufacturing Processes, 27(7), 756-764. doi:10.1080/10426914.2011.647940
Bouaziz, O., Allain, S., Scott, C. P., Cugy, P., & Barbier, D. (2011). High manganese austenitic twinning induced plasticity steels: A review of the microstructure properties relationships. Current Opinion in Solid State & Materials Science, 15(4), 141-168. doi:10.1016/j.cossms.2011.04.002
Cai, X. H., Liu, C. B., & Liu, Z. Y. (2014). Process design and prediction of mechanical properties of dual phase steels with prepositional ultra fast cooling. Materials & Design, 53, 998-1004. doi:10.1016/j.matdes.2013.07.071
Colla, V., Desanctis, M., Dimatteo, A., Lovicu, G., & Valentini, R. (2011). Prediction of Continuous Cooling Transformation Diagrams for Dual-Phase Steels from the Intercritical Region. Metallurgical and Materials Transactions a-Physical Metallurgy and Materials Science, 42A(9), 2781-2793. doi:10.1007/s11661-011-0702-3
De Cooman, B. C. (2004). Structure-properties relationship in TRIP steels containing carbide-free bainite. Current Opinion in Solid State & Materials Science, 8(3-4), 285-303. doi:10.1016/j.cossms.2004.10.002
Edmonds, D. V., He, K., Rizzo, F. C., De Cooman, B. C., Matlock, D. K., & Speer, J. G. (2006). Quenching and partitioning martensite - A novel steel heat treatment. Materials Science and Engineering a-Structural Materials Properties Microstructure and Processing, 438, 25-34. doi:10.1016/j.msea.2006.02.133
Girault, E., Jacques, P., Harlet, P., Mols, K., Van Humbeeck, J., Aernoudt, E., & Delannay, F. (1998). Metallographic methods for revealing the multiphase microstructure of TRIP-assisted steels. Materials Characterization, 40(2), 111-118. doi:10.1016/s1044-5803(97)00154-x

56
Gould, J. E., Khurana, S. P., & Li, T. (2006). Predictions of microstructures when welding automotive advanced high-strength steels - A combination of thermal and microstructural modeling can be used to estimate performance of welds in advanced high-strength steels. Welding Journal, 85(5), 111S-116S.
Grajcar, A., Kuziak, R., & Zalecki, W. (2012). Third generation of AHSS with increased fraction of retained austenite for the automotive industry. Archives of Civil and Mechanical Engineering, 12(3), 334-341. doi:10.1016/j.acme.2012.06.011
Grajcar, A., Zalecki, W., Burian, W., & Kozlowska, A. (2016). Phase Equilibrium and Austenite Decomposition in Advanced High-Strength Medium-Mn Bainitic Steels. Metals, 6(10), 14. doi:10.3390/met6100248
Hairer, F. ETCHING TECHNIQUES FOR THE MICROSTRUCTURAL CHARACTERIZATION OF COMPLEX PHASE STEELS BY LIGHT MICROSCOPY.
Hausmann, K. M. A. (2014). TRIP-assisted Thin Sheet Steel with a Bainitic and/or Martensitic Matrix: Effects of Alloying Elements and Heat Treatment on Phase Transformations, Microstructures, and Mechanical Properties. (Dr. Ing. Dissertation), TECHNISCHE UNIVERSITÄT MÜNCHEN.
Kang, H. C., Park, B. J., Jang, J. H., Jang, K. S., & Lee, K. J. (2016). Determination of the
continuous cooling transformation diagram of a high strength low alloyed steel. Metals and Materials International, 22(6), 949-955. doi:10.1007/s12540-016-6269-1
Kim, Y. G., Kim, I. J., Kim, J. S., Chung, Y. I., & Choi, D. Y. (2014). Evaluation of Surface Crack in Resistance Spot Welds of Zn-Coated Steel. Materials Transactions, 55(1), 171-175. doi:10.2320/matertrans.M2013244
Kuziak, R., Kawalla, R., & Waengler, S. (2008). Advanced high strength steels for automotive industry: a review. Archives of Civil and Mechanical Engineering, 8(2), 103-117.
Lee, Y. K., & Han, J. (2015). Current opinion in medium manganese steel. Materials Science and Technology, 31(7), 843-856. doi:10.1179/1743284714y.0000000722
Li, M. V., Niebuhr, D. V., Meekisho, L. L., & Atteridge, D. G. (1998). A computational model for the prediction of steel hardenability. Metallurgical and Materials Transactions B-Process Metallurgy and Materials Processing Science, 29(3), 661-672. doi:10.1007/s11663-998-0101-3

57
Ma, C., Chen, D. L., Bhole, S. D., Boudreau, G., Lee, A., & Biro, E. (2008). Microstructure and fracture characteristics of spot-welded DP600 steel. Materials Science and Engineering a-Structural Materials Properties Microstructure and Processing, 485(1-2), 334-346. doi:10.1016/j.msea.2007.08.010
Mayyas, A., Qattawi, A., Omar, M., & Shan, D. R. (2012). Design for sustainability in automotive industry: A comprehensive review. Renewable & Sustainable Energy Reviews, 16(4), 1845-1862. doi:10.1016/j.rser.2012.01.012
Mittemeijer, E. J. (1992). ANALYSIS OF THE KINETICS OF PHASE-TRANSFORMATIONS. Journal of Materials Science, 27(15), 3977-3987. doi:10.1007/bf01105093
Motavalli, J. (2012). For lightweight cars, a materials race, p. 10. Retrieved from http://libdata.lib.ua.edu/login?url=http://search.ebscohost.com/login.aspx?direct=true&db=edsgao&AN=edsgcl.305121791&site=eds-live&scope=site
Olasolo, M., Uranga, P., Rodriguez-Ibabe, J. M., & Lopez, B. (2011). Effect of austenite microstructure and cooling rate on transformation characteristics in a low carbon Nb-V microalloyed steel. Materials Science and Engineering a-Structural Materials Properties Microstructure and Processing, 528(6), 2559-2569. doi:10.1016/j.msea.2010.11.078
Pouranvari, M., Alizadeh-Sh, M., & Marashi, S. P. H. (2015). Welding metallurgy of stainless steels during resistance spot welding Part I: fusion zone. Science and Technology of Welding and Joining, 20(6), 502-511. doi:10.1179/1362171815y.0000000015
Pouranvari, M., & Marashi, S. P. H. (2013). Critical review of automotive steels spot welding: process, structure and properties. Science and Technology of Welding and Joining, 18(5), 361-403. doi:10.1179/1362171813y.0000000120
Sugimoto, K., Sakaguchi, J., Iida, T., & Kashima, T. (2000). Stretch-flangeability of a high-strength TRIP type bainitic sheet steel. Isij International, 40(9), 920-926. doi:10.2355/isijinternational.40.920
Triyono. (2013). Critical Nugget Diameter of Resistance Spot Welded Stiffened Thin Plate Structure. Modern Applied Science, 7(7).
Vander Voort, G. F. (1991). Atlas of time-temperature diagrams for irons and steels. [electronic
resource]: [United States] : ASM International, c1991.

58
Williams, N. T., & Parker, J. D. (2004). Review of resistance spot welding of steel sheets Part 1 Modelling and control of weld nugget formation. International Materials Reviews, 49(2), 45-75. doi:10.1179/095066004225010523
Zaefferer, S., Ohlert, J., & Bleck, W. (2004). A study of microstructure, transformation mechanisms and correlation between microstructure and mechanical properties of a low alloyed TRIP steel. Acta Materialia, 52(9), 2765-2778. doi:10.1016/j.actamat.2004.02.044

59
APPENDIX: Strip Specimen and CCT diagrams
This appendix highlights some of the findings and achievements from the development of
successful continuous cooling experiments using strip specimens. Firstly, consideration should
be given to optimizing the amount of material between the grips. The thickness of the sample is
important to control, as thicker samples will cool more slowly. Faster cooling rates can be
achieved by using thinner samples, or by designing a shorter free span of material. As the free
span increases, the amount of heat in the sample will also increase, which in turn generates more
radiant heat that may damage the thermocouple and lead to errors in temperature measurement.
Ceramic covers were used as a precaution to avoid damage to the thermocouple from radiant
heat. An experiment designed with a smaller free span will require less power to heat to a target
temperature and radiate less heat, allowing for faster cooling rates to be achieved.
Variation between the programmed cooling rates and the actual cooling rates was
observed. The thermal-mechanical simulator attempted to maintain a constant cooling rate, and
would attempt to increase the heat if the sample began cooling faster than programmed. To
maximize the cooling rate with strip specimen the resistive heat would need to be completely
shut off during cooling. Nominal cooling rates were determined after testing by measuring the
difference in both time and temperature during the period that cooling data was recorded. Zero
force control was programmed, but not always maintained due to the thermal gradient between
the hot middle of the sample and the much cooler ends. Some samples experienced compression
during testing due to the localized heating in the middle of the sample as the material.

60
Care was taken to ensure the dilatometer was secure during testing and not effected by
the helium flow. The two L-shaped quartz rods were placed on an angle through the sample as
the geometry of the testing chamber did not allow for a vertically stabilized position. The
dilatometer was placed on the opposite side of the quench apparatus to avoid flowing helium on
the quartz rods and producing any error in the dilatometer data.
To detect the nose of the ferrite start transformation, fast cooling rates must be achieved.
Conventional high quench rate tests are performed using an isothermal quench system (ISO-Q),
which utilizes a hollow cylindrical sample with a solid free span of a reduced diameter. Fast
cooling rates are achieved by flowing pressurized water through the ends of the cylinder and
generating an isothermal quench of the free span. Due to the nature of the strip geometry
flowing a coolant through the sample is not feasible. To achieve cooling rates similar to the ISO-
Q system a steel pipe was fitted to the testing chamber and pressurized helium gas was flown
onto the surface of the sample. This method increased the maximum cooling rate of the sample
to 175°C/s for the 1.5 mm thick specimen with a 50 mm free span. The maximum cooling rate
for each method of cooling is listed in Table VII.
It is important to cool the samples uniformly, one way to improve upon the method used
in this work would be to flow helium across the entire surface of the sample, rather than in a
single stream that cools only a small area of the sample relative to its free span. In this work, the
thermocouple wires were attached on the opposite side of the sample from the quench apparatus
to avoid any damage to the wires. The helium flow method of quenching used in this work could
be improved by flowing helium on both sides of the sample. This work used a pressure of 45 psi
(300 kPa) to achieve the cooling rates listed. Increasing the pressure of the helium may further
improve the cooling rates possible. Varying the pressure to achieve different cooling rates may
allow for better consistency in dilatometer data across the range of cooling rates.