Embed Size (px)
Citation preview

Phase Diagrams—Understanding the BasicsF.C. Campbell, editor
Copyright © 2012 ASM International®
All rights reservedwww.asminternational.org
Chapter 12Phase Diagram Determination
The vAST ColleCTIon of phase diagrams is the product of the painstaking labor of a very large number of skillful investigators working in all parts of the world. It is a constantly growing body of information, improving both in the extent of its coverage and in the precision of its con-tent. Few, if any, diagrams may be considered complete and final. Repeated investigations, with refinements in apparatus and techniques, lead to their frequent revision. The development of new analytical techniques leads to ever more precise measurements that allow continual refinement of phase diagrams.
Accurate chemical analysis is of extreme importance in the determina-tion of phase diagrams. Wherever possible, it is best to put this part of the work in the hands of a skilled analytical chemist. Regardless of the analytical method or the skill with which it is employed, the result can be no more representative of the composition of the alloy investigated than is the sample taken for analysis. Segregation can easily cause a variation of several percent from point to point in castings of some materials. The analytical sample should be taken in such a way as to obtain an average (or representative) analysis. Drastic working of the metal, alternating with homogenizing heat treatments, will sometimes eliminate composition dif-ferences and simplify the problem of sampling. It is sometimes found that the composition of the alloy changes in the course of remelting or during heat treatment, owing to the selective oxidation or vaporization of one or more of its components. Measures should be taken to avoid composi-tion variations by the adjustment of the conditions of the experiment, but when this cannot be done, repeated sampling and analysis throughout the course of the constitutional study become necessary. Of equal importance is the maintenance of purity and initial composition of the material that is being investigated. only the purest obtainable metals should be used in constitutional studies. Just what limits of impurity are tolerable can be
5342_ch12_6111.indd 239 3/2/12 12:28:31 PM

240 / Phase Diagrams—Understanding the Basics
ascertained only by experience with the specific alloy system; sometimes, as little as 0.001% of a certain impurity becomes significant, while much larger quantities of other impurities produce no detectable effects.
The use of high-purity metals is of little avail unless the purity is main-tained in the production and manipulation of the experimental alloys. Any apparatus that comes in contact with the research sample must be inert at the temperature concerned, so that no substantial contamination will occur to vitiate the observations. This requirement becomes difficult to meet when the temperatures are very high or the metals are highly reac-tive and accounts for much of the uncertainty concerning the constitution of high-melting-point alloy systems. In addition, it is important that the temperature-measuring element be in good thermal contact with the speci-men and that it be not so large in comparison with the sample that it carries away a significant quantity of heat.
Anything that comes in contact with the samples, particularly when the metals are molten, is a possible source of contamination. Crucibles should be selected with great care, using only materials that are insoluble and nonreactive with the alloy. evidence of attack of the crucible by the alloy is usually grounds for rejecting the experimental results, but the absence of such evidence does not guarantee the absence of contamination. When suitable crucibles are unobtainable, it is often possible to coat ordinary crucibles with an inert material. Failing this, it is sometimes possible, as a last resort, to use the experimental alloy as its own “crucible” by melting a pool in its top surface with a fine torch or other concentrated source of radiated heat. For constitutional studies at temperatures below the melting point, alloys that cannot be maintained in a satisfactory state of purity, if made by melting, or that cannot be melted to a homogeneous liquid can sometimes be produced by powder metallurgy techniques.
Contamination from the atmosphere is often very damaging. In extreme cases, the liquidus temperature has been observed to be depressed several hundred degrees simply as a result of the absorption of the constituents of air. Usually, the effects are much smaller and are confined to the selective oxidation of one or more of the components of the alloy, thereby altering its composition. Protection from gaseous contamination may sometimes be achieved by the use of flux covers or by the use of inert gas atmospheres, argon and helium usually being satisfactory. vacuum melting and heat treatment are hazardous from the standpoint of maintenance of composi-tion unless the vapor pressures of all components concerned are very low. vapor losses can be minimized by the use of positive pressures of inert gases or suitable flux covers.
no phase diagram can be considered fully reliable until corroborating observations have been made by at least two independent methods. even so, the diagram cannot be accepted if its construction violates the phase rule or any of the other rules of construction that have been derived by thermodynamic reasoning. If violations of these rules are encountered, it
5342_ch12_6111.indd 240 3/2/12 12:28:31 PM

Chapter 12: Phase Diagram Determination / 241
may be concluded with assurance that the experimental observations or their interpretation are at fault.
Cooling curves using simple thermocouple arrangements or other pyro-metric methods were originally used to determine phase diagrams. These methods have largely been replaced by the more modern methods of equil-ibrated alloys and diffusion couples. All of these methods are supported by both conventional methods and newer advanced analytical methods.
12.1 Cooling Curves
one of the most widely used early methods for the determination of phase boundaries is cooling curves. The temperature of a sample is moni-tored while allowed to cool naturally from an elevated temperature in the liquid field. The shape of the resulting curves of temperature versus time are then analyzed for deviations from the smooth curve found for materials undergoing no phase changes (Fig. 12.1).
When a pure element is cooled through its freezing temperature, its temperature is maintained near that temperature until freezing is complete (Fig. 12.2). However, the true freezing/melting temperature is difficult to determine from a cooling curve because of the nonequilibrium conditions inherent in such a dynamic test. This is illustrated in the cooling and heat-
Fig. 12.1 Ideal cooling curve with no phase change. Source: ref 12.1
5342_ch12_6111.indd 241 3/2/12 12:28:31 PM

242 / Phase Diagrams—Understanding the Basics
ing curves shown in Fig. 12.3, where the effects of both supercooling and superheating can be seen. The dip in the cooling curve often found at the start of freezing is caused by a delay in the start of crystallization.
The continual freezing that occurs during cooling through a two-phase liquid-plus-solid field results in a reduced slope to the curve between the liquidus and solidus temperatures, as shown in Fig. 12.4. By preparing samples having compositions across the diagram, the shape of the liquidus
Fig. 12.2 Ideal freezing curve of a pure metal. Source: ref 12.1
Fig. 12.3 Natural freezing and melting curves of a pure metal. Source: ref 12.2 as published in ref 12.1
5342_ch12_6111.indd 242 3/2/12 12:28:31 PM

Chapter 12: Phase Diagram Determination / 243
curves and the eutectic temperature of the system can be determined (Fig. 12.5). Cooling curves can be similarly used to investigate all other types of phase boundaries.
Fig. 12.4 Ideal freezing curve of a solid-solution alloy. Source: ref 12.3 as published in ref 12.1
Fig. 12.5 Ideal freezing curves of (1) a hypoeutectic alloy, (2) a eutectic alloy, and (3) a hypereutectic alloy superimposed on a portion of
a eutectic phase diagram. Source: ref 12.3 as published in ref 12.1
5342_ch12_6111.indd 243 3/2/12 12:28:32 PM

244 / Phase Diagrams—Understanding the Basics
12.2 Equilibrated Alloys
A phase diagram can be constructed by preparing alloys of the required constituents, heat treating them at high temperatures to reach equilibria, and then identifying the phases to determine liquidus temperatures, soli-dus temperatures, solubility lines, and other phase transition lines. Along with equilibrated alloys, several techniques are used to determine phase diagrams. These include thermal analysis (TA), metallography, X-ray diffraction (XRD), dilatometry, electrical resistance measurement, and magnetic analysis methods, among others. All of these methods are based on the principle that when a phase transition in an alloy occurs, its physical and chemical properties, phase composition, and/or structure will vary. By analyzing the temperature, composition, and property changes associated with phase transitions, phase boundaries can be constructed according to the phase rule.
Equilibrated alloys are made from extremely pure constituent metals that are prepared using techniques such as arc melting, induction melting, or by powder metallurgy. Strict atmospheric control is maintained by using inert gases or vacuum. homogenization heat treatments are conducted by putting the samples into a furnace at high temperatures, below the solidus temperature of the alloys, for an extended period of time. The samples are then quenched from elevated temperatures to room temperature. The quenching process is used to freeze the phases to room temperature for analysis. Alternatively, the samples may be slowly cooled to room tem-perature. This process generates less thermal stress in the samples, making lattice parameter measurements more accurate.
homogenization is achieved through diffusion, thus the annealing time and temperature are two important factors. Because the diffusion coef-ficient increases greatly with temperature, the heat treatment temperature should be as high as possible to accelerate the homogenization process. The homogenization temperature can be as high as approximately 50 °C (90 °F) below the solidus temperature. The homogenization process is carried out in vacuum or an inert gas atmosphere in order to avoid/reduce oxidization and unwanted environmental interaction.
Equilibrium can be approached from two directions: (1) slow cooling and heating, or (2) long-term isothermal heat treatment. In general, the longer the time to approach equilibrium, the closer to equilibrium one can get. For the cooling and heating process, the liquidus temperature mea-sured from cooling using differential thermal analysis (DTA) is usually lower than the equilibrium liquidus line. When the heating and cooling rates are reduced, the degree of overheating and overcooling could be reduced, thus approaching equilibrium more closely; however, the DTA peak-to-background ratio is degraded.
To investigate phase equilibria at elevated temperatures, two approaches can be used. The first one is to study the phase equilibria directly at the
5342_ch12_6111.indd 244 3/2/12 12:28:32 PM

Chapter 12: Phase Diagram Determination / 245
temperature of interest using a hot-stage microscope or high-temperature in situ XRD. This method has the advantages of (1) having no complica-tions from quenching, (2) allowing more straightforward interpretation of the results, and (3) allowing a study in a continuous temperature range, which is impractical for quenching experiments. Its disadvantages include less availability of equipment, more difficult experiments, and potentially greater preferential evaporation, oxidation, or other environmental inter-actions. Sometimes in situ high-temperature experiments are essential to study complex phase equilibria in narrow temperature and composition ranges.
The other approach is to retain the high-temperature phase equilibria to room temperature by quenching. This requires that the quenching/cooling rate is high enough to preserve the high-temperature phases and their structures to room temperature. Liquid nitrogen, water, iced water, saltwater solutions (brine), and oil are common quenching media. Occa-sionally, some phase transitions take place very fast, and it is not possible to retain the high-temperature phase to room temperature even by a fast quench. One example is the γ-iron (face-centered cubic, fcc) to α-iron (body-centered cubic, bcc) allotropic transition in pure iron and dilute iron alloys. In such cases, care needs to be exercised in interpreting the result.
To determine a phase diagram with equilibrated alloys, two methods are used: (1) the static method or analysis of quenched samples to construct isothermal sections, and (2) the dynamic method or analysis of samples by heating and cooling experiments to construct vertical sections and liquid projections.
Analysis of Quenched Samples to Construct Isothermal Sections (Static Method). Metallographic analysis is one of the key tools for deter-mining phase diagrams. Microstructure examinations are routinely used to investigate the number of phases (single phase or multiphase) and invariant reaction types (such as the eutectic or peritectic). In particular, the char-acteristics of each phase, such as composition, size, shape, distribution, color, orientation, and hardness can be examined. Metallographic analysis is based on the assumption that the observed microstructure represents the true structure of the samples.
Metallography has an advantage over measurements that involve changes in physical properties in that the microstructures can offer clues concerning invariant reactions. For example, a lamellar structure is indicative of the presence in the system of a eutectic reaction, and rimming is indicative of a peritectic reaction. Quantitative metallography can be used with the lever rule to determine phase boundaries. optical metallography is still widely used but has now been expanded to include results from electron micros-copy. Electron microscopy offers the capability of greater magnification and, in addition, allows quantitative determination of the compositions of
5342_ch12_6111.indd 245 3/2/12 12:28:32 PM

246 / Phase Diagrams—Understanding the Basics
individual grains, provided that the microscope is equipped with suitable attachments for composition analysis.
Optical microscopy (OM) is a basic technique for phase identification. There is tremendous value in examining a sample optically because many phases can be easily differentiated by light microscopy. Scanning electron microscopy (SeM) is another widely used tool for phase diagram determi-nation. In SeM, a focused and collimated electron beam impinges on the surface of a sample, creating backscattered electrons, secondary electrons, characteristic X-rays, and Auger electrons, among other signals. Scan-ning electron microscopes are often coupled with energy-dispersive X-ray microanalysis (EDX), a microanalytical technique that uses the character-istic spectrum of X-rays emitted by the different elements in a specimen after excitation by high-energy electrons to obtain quantitative or quali-tative compositional information about the samples. When employed to measure a phase diagram, eDX can provide information on compositions of individual phases and the distribution of alloying elements and micro-inhomogeneity.
The major shortcoming of the metallographic method in phase diagram determination is its difficulty in detecting fine precipitates. Many terminal solid solutions have decreasing solubility with decreasing temperature. After an alloy is homogenized, annealed at a lower temperature, and sub-sequently quenched, precipitates may be so small that even SEM cannot detect them. only careful transmission electron microscopy (TeM) exam-ination can clearly identify them. Ample annealing time should be given to make sure the precipitation takes place.
Electron probe microanalysis (EPMA) is another important technique for phase diagram determination. It is essentially a dedicated SeM with wavelength dispersive spectrometers (WDS) attached. As an elemental analysis technique, it uses a focused beam of high-energy electrons (5 to 30 Kev) in the SeM to impinge on a sample to induce emission of characteristic X-rays from each element. Its spatial resolution for X-ray microanalysis depends mainly on the accelerating voltage of the electron beam and the average atomic weight of a phase in a specimen, and usually ranges from one to several microns.
Another powerful tool for the determination of phase diagrams is dif-fraction. Initially this was XRD, but during the past century electron and neutron diffraction have been developed. each of the three has its own advantages and limitations. X-ray diffraction is the least costly and can be used in a variety of ways in the establishment of phase diagrams. A simple XRD pattern can be used for phase identification. X-ray diffraction can also be used for the establishment of the loci of phase boundaries. For instance, in a two-component system, lattice parameters can vary with composition within a single-phase region but are invariant in a two-phase region. Additionally, with measurement of precision lattice parameters, XRD can be used to determine atomic volumes.
5342_ch12_6111.indd 246 3/2/12 12:28:32 PM

Chapter 12: Phase Diagram Determination / 247
Electron diffraction requires operation in a vacuum atmosphere and can do the same things that XRD does. Its advantage is that it can focus on a small area so that it can be used to examine individual grains within a microstructure and, as noted previously, with the proper attachments can quantitatively determine grain compositions. While X-rays and electrons are scattered by the electron distribution in a solid, neutrons are scattered by nuclei and by magnetic dipoles. Thus, neutrons can be used to deter-mine magnetic structures and can distinguish other structures that are difficult or impossible to see with either X-ray or electron diffraction. For instance, with X-ray or electron diffraction patterns from systems involv-ing very light elements with heavy elements (e.g., hydrogen in niobium), the scattering power of hydrogen atoms with 1 electron is so much less than that of niobium with 41 electrons that the niobium masks the hydro-gen contribution in the diffraction pattern. This is not true for neutron diffraction patterns. A similar difficulty arises when the components of a system are closely comparable in atomic number, so that it is difficult to distinguish one species from the other with X-ray or electron diffraction but not with neutron diffraction.
X-ray diffraction is widely used to determine the presence of different phases in a sample and thus place the alloy in the right phase region, with known composition of the alloy either from the nominal compositions, chemical analysis, or EPMA. The other essential application of XRD is the determination of the crystal structure of a new phase. Based on the XRD results, two methods—peak intensity method and lattice parameter method—are typically used for the determination of phase boundaries. The peak intensity method is widely used in phase diagram determination.
Different phases have different crystal structures that are characterized by their distinctive XRD peaks. The phases in an alloy can be determined by its XRD patterns to have either a single phase or multiple phases. In a single-phase region, there is only one type of XRD spectrum observed. If the crystal structure is known, the diffraction intensity of each peak can be calibrated by its position. In this case, the position of diffraction peaks may vary with alloying composition, but additional peaks should not appear.
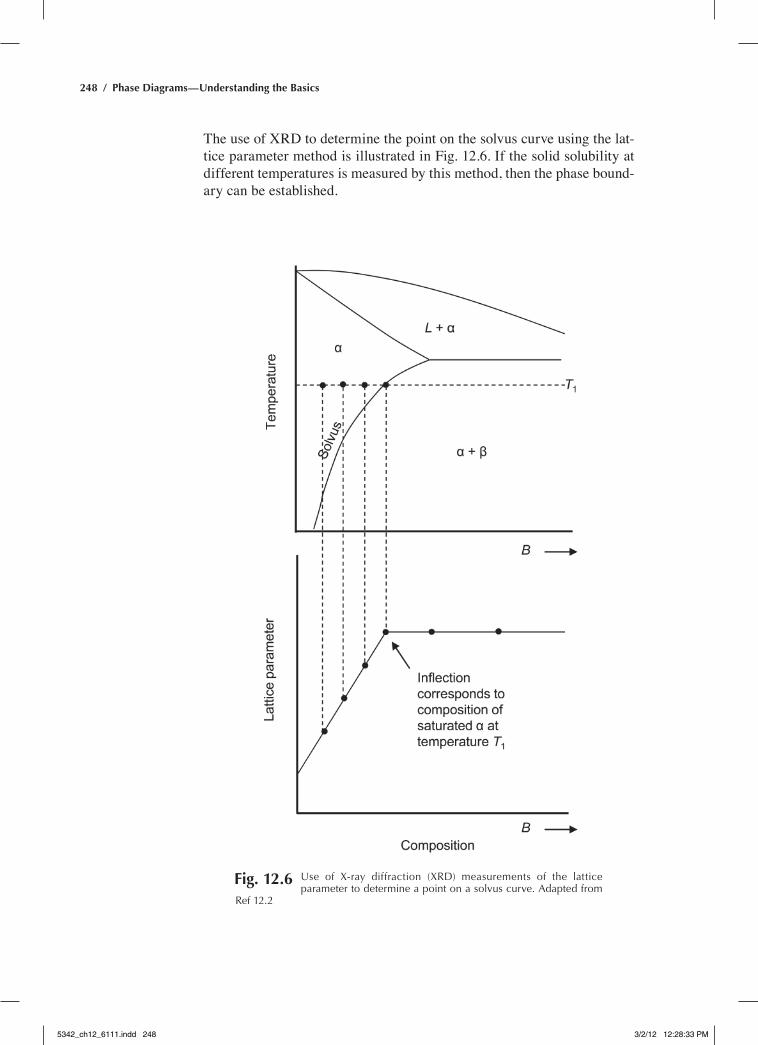
The lattice parameter method for the determination of the phase bound-ary of a solid solution is straightforward. The lattice parameter is plotted against the compositions of the alloys, and the composition at which the lattice parameter first becomes constant is located. When solute element B is added to solvent A, the lattice parameter of A phase may decrease or increase due to the difference in their atomic sizes. In the single-phase region, lattice parameter changes continuously with the composition of B. However, in a two-phase field, because the composition of each phase remains constant at a given temperature, the lattice parameter does not vary with the alloying composition. Thus, the lattice parameter can be plotted against composition. The composition at which the lattice parameter first becomes constant corresponds to the solid solubility at this temperature.
5342_ch12_6111.indd 247 3/2/12 12:28:32 PM
248 / Phase Diagrams—Understanding the Basics
The use of XRD to determine the point on the solvus curve using the lat-tice parameter method is illustrated in Fig. 12.6. If the solid solubility at different temperatures is measured by this method, then the phase bound-ary can be established.
Fig. 12.6 Use of X-ray diffraction (XrD) measurements of the lattice parameter to determine a point on a solvus curve. adapted from
ref 12.2
5342_ch12_6111.indd 248 3/2/12 12:28:33 PM

Chapter 12: Phase Diagram Determination / 249
Analysis of Samples by Heating and Cooling Experiments to Con-struct Vertical Sections and Liquid Projections (Dynamic Method). In the dynamic method, phase equilibrium is determined when an alloy is heated and/or cooled while a certain property, such as heat flow or electri-cal resistance, is monitored continuously to detect the temperature at which a phase transition takes place. There are two advantages over the static methods: (1) it is possible to quickly explore the limits of phase stability because quenching is not involved, and (2) the possibility of a phase change occurring during quenching is avoided. However, the dynamic method is not suitable for investigation of systems with slow phase transitions. Any physical or chemical property that changes with composition and tempera-ture may be used as a parameter for the dynamic method to determine a phase diagram. Analysis methods include high-temperature (hot-stage) metallography, high-temperature in situ XRD analysis, dilatometry, elec-trical resistance, and TA including both DTA and differential scanning calorimetry (DSC).
A phase transition usually involves an enthalpy change (evolution or absorption of heat); therefore, thermal properties are commonly monitored to detect phase changes. When a specimen is heated or cooled under uni-form conditions, a structural change will be identified with a temperature anomaly by plotting time versus temperature. Two major techniques to detect phase transitions are developed based on enthalpy change. The first one is TA, where temperature versus time curve shows a thermal arrest at a phase transition point. The second technique is DTA, in which a test sample and an inert reference sample are heated and cooled under identical condi-tions, and a temperature difference between the test sample and reference sample are recorded. Because the signal is differential, it can be amplified with a suitable diffusion couple (DC) amplifier to increase sensitivity. As a result, DTA is more sensitive than TA. The differential temperature is then plotted either against time or against temperature. The DTA signal versus temperature for a pure metal is shown in Fig. 12.7. When a phase transi-tion takes place in a sample that involves release of heat, the test sample temperature rises temporarily above that of the reference sample, resulting in an exothermic peak. Conversely, a transition accompanied by absorp-tion of heat reduces the temperature of the test sample compared to that of the reference sample, leading to an endothermic peak. For example, in the case of a binary system, if the overall specimen composition does not vary during a heating process, a phase transition results in a slope change on the TA curve and a thermal spike on the corresponding DTA curve. A schematic of enthalpy versus temperature and the associated DTA curves for melting and freezing of a pure metal are shown in Fig. 12.8.
Differential scanning calorimetry (DSC) is a TA technique that measures the energy absorbed or emitted by a sample as a function of temperature or time. When a phase transition occurs, DSC provides a direct calorimetric measurement of the transition energy at the transition temperature by sub-
5342_ch12_6111.indd 249 3/2/12 12:28:33 PM

250 / Phase Diagrams—Understanding the Basics
Fig. 12.7 Differential thermal analysis (Dta) responses to melting and freez-ing of a pure metal under ideal conditions. a, onset temperature;
b, peak signal; c, peak temperature. adapted from ref 12.4
jecting the sample and an inert reference material to identical temperature regimes in an environment heated or cooled at a controlled rate. Differ-ential scanning calorimetry equipment can be used not only to determine the liquidus line, solidus line, and other phase transition points on a phase diagram, but also to measure some thermodynamic parameters such as enthalpy, entropy, and specific heat, which are important for investigation of second-order phase transitions. One deficiency of DSC is that its usage temperature is usually in the range of 175 to 1100 °C (350 to 2010 °F), much lower than that of DTA. There are two types of DSC systems in com-mon usage. In power-compensation DSC, the temperatures of the sample and reference are controlled independently using separate but identical fur-naces. The temperatures of the sample and the reference are made identical by varying the power input to the two furnaces. The energy required to do so is a measure of the enthalpy or heat capacity changes in the sample compared to the reference. In heat-flux DSC, the sample and reference are connected with a low-resistance heat flow path (a metal disk). The assem-bly is enclosed in a single furnace. enthalpy or heat capacity changes in the sample cause a difference in its temperature relative to the reference.
5342_ch12_6111.indd 250 3/2/12 12:28:33 PM

Chapter 12: Phase Diagram Determination / 251
Fig. 12.8 Schematic diagram showing (a) enthalpy vs. temperature for a pure metal, and (b) Dta signal for melting (bottom) and freezing (top).
adapted from ref 12.4
The resulting heat flow is smaller compared to that in DTA because the sample and the reference are in good thermal contact. The temperature difference is recorded and related to enthalpy change in the sample using calibration experiments.
Dilatometry is another technique used to study phase transitions in alloys. This technique uses the change in volume associated with nearly all transitions and measures the change of length of a specimen as it is heated and cooled at a fixed rate. The relationships of length versus time
5342_ch12_6111.indd 251 3/2/12 12:28:33 PM

252 / Phase Diagrams—Understanding the Basics
and temperature versus time are measured simultaneously, so as to plot the length-versus-temperature curve. The dilatometry curve is similar to the cooling curve in the TA, and the phase transition temperature can be determined. The use of dilatometry to determine solid-state phase bound-aries is shown in Fig. 12.9. A dilatometer consists of a sensing element such as a transducer, variable capacitor, and dial gage that is activated by the specimen positioned in the furnace. Changes in length are transmitted to the sensor by means of a push rod. The specimen is enclosed in a thermal mantle, which is heated or cooled by passage of gas. Temperatures are measured by a thermocouple and plotted on one axis of an x-y recorder, and changes in length are recorded simultaneously.
Measurement of electrical resistance is a useful auxiliary technique for the determination of alloy phase diagrams. The basic procedure to determine phase regions is to plot the electrical resistance against com-position or to plot the electrical resistance against temperature for a fixed composition. To investigate subsolidus equilibria, this method appears to have advantages over DTA. The measurements do not require spontaneous heat effects and can therefore be observed during arbitrarily slow rates of temperature change or on allowance of sufficient time for equilibrium. At subsolidus temperatures, formation of a new phase will, in most cases, be evidenced by a change of slope in the conductivity-versus-temperature curve. The use of electrical resistance measurements to determine points on the solvus, solidus, and lines of three-phase equilibrium is shown in Fig. 12.10.
Magnetic analysis is another technique for the determination of an alloy phase diagram. Curie temperature, Tc, and saturation magnetization, σ, are
Fig. 12.9 Use of dilatometric measurements to determine points on phase boundaries in the solid state. adapted from ref 12.2
5342_ch12_6111.indd 252 3/2/12 12:28:34 PM

Chapter 12: Phase Diagram Determination / 253
two important parameters typically used for this method. Because both Tc and σ are only affected by the atomic arrangement but not by the imper-fection of crystal lattice, their values depend essentially only on an alloy composition and the corresponding phase compositions. By measuring these magnetic properties, phase relationships of alloy systems that include ferromagnetic components or compounds can be determined.
12.3 Diffusion Couples
The use of diffusion couples in phase diagram studies is based on the assumption of local equilibria at the phase interfaces in the diffusion zone. The latter implies that an infinitesimally thick layer adjacent to the inter-face in such a diffusion zone is effectively in thermodynamic equilibrium with its neighboring layer on the other side of the interface. In other words, the chemical potential (activity) of species varies continuously through the product layers of the reaction zone and has the same value at both sides of an interphase interface.
A diffusion-controlled interaction in a multiphase binary system will invariably result in a diffusion zone with single-phase product layers sepa-rated by parallel interfaces in a sequence dictated by the corresponding phase diagram. The reason for the development of only straight interfaces with fixed composition gaps follows directly from the phase rule. Three
Fig. 12.10 Use of electrical resistivity measurements, as a function of tem-perature, to determine points on the solvus, solidus, and lines of
three-phase equilibrium. adapted from ref 12.2
5342_ch12_6111.indd 253 3/2/12 12:28:34 PM

254 / Phase Diagrams—Understanding the Basics
degrees of freedom are required to fix temperature and pressure and to vary the composition. Reaction morphologies consisting of two-phase structures (i.e., precipitates or wavy interfaces) are, therefore, thermodynamically forbidden for binary systems, assuming that only volume diffusion takes place. In a ternary system, on the other hand, it is possible to develop two-phase areas in the diffusion zone because of the extra degree of freedom. The diffusion zone morphology, which develops during solid-state interac-tion in a ternary couple, is defined by type, structure, number, shape, and topological arrangement of the newly formed phases.
Several techniques are available to make solid-state diffusion couples, that is, to bring two (or more) materials in such intimate contact that one diffuses into the other. Most commonly, the bonding faces of the couple components are ground and polished flat, clamped together, and annealed at the temperature of interest. Depending on the initial materials, various protective atmospheres can be used (e.g., vacuum and inert gas). After the heat treatment, quenching of the sample is desirable in order to freeze the high-temperature equilibrium.
Sometimes phases present in the reaction zone of diffusion couples can be detected simply using an optical microscope. Different measurement techniques can be used to determine the chemical compositions on both sides of the interfaces. These are Auger electron spectroscopy (AeS), secondary ion mass spectrometry (SIMS), Rutherford backscattering spec-trometry (RBS), EPMA, and analytical electron microscopy (AEM).
In EPMA, high-energy electrons are focused to a fine probe and directed at the point of interest in the diffusion couple. The incident electrons interact with the atoms in the sample and generate, among other sig-nals, characteristic X-rays. These X-rays are detected and identified for qualitative analysis, and with the use of suitable standards, they can be corrected for matrix effects in order to perform quantitative analysis. Elec-tron probe microanalysis is used to investigate bulk solid samples, while AEM is dealing with electron transparent thin films. The procedures used for X-ray quantification are quite different for both techniques. Presently, two different techniques, wavelength dispersive spectrometry (WDS) and energy-dispersive spectrometry (eDS) can be used to collect X-ray spectra from samples being analyzed.
As an example, magnesium-aluminum diffusion couples were prepared using pure magnesium (99.9%) and pure aluminum (99.99%). Small pieces of each were cut and shaped into discs approximately 1.3 cm (0.5 in.) in diameter and 0.32 to 0.64 cm (0.125 to 0.25 in.) thick. One side of each disc was polished down to 0.05 mm. For each temperature, one aluminum disc and one magnesium disc were placed inside a stainless steel tubular clamp, with the polished faces of the discs facing each other. each clamp was individually sealed in a Pyrex tube filled with helium at one-third atmosphere pressure to prevent oxidation during the heat treatment. each tube was placed in a furnace and isothermally heat treated for a period
5342_ch12_6111.indd 254 3/2/12 12:28:34 PM

Chapter 12: Phase Diagram Determination / 255
of 6 to 24 days at temperatures ranging from 360 to 420 °C (680 to 790 °F). Several different methods were used to characterize the intermedi-ate phases, including light microscopy, microhardness measurements, and ePMA. A light micrograph of a diffusion couple made at 367 °C (693 °F) is shown in Fig. 12.11. electron probe microanalysis was used to identify the β, ε, and γ phases.
A diffusion multiple is an assembly of three or more different metal blocks in intimate interfacial contact and subjected to a high temperature to promote thermal interdiffusion to form solid solutions and intermetallic compounds. For the purpose of phase diagram determination, a diffusion multiple is nothing more than a sample with multiple diffusion couples and diffusion triples in it. An example is schematically shown in Fig. 12.12, which contains a five-metal diffusion multiple. The local equilib-rium at the phase interfaces allows the extraction of phase equilibrium information from diffusion multiples in the same way as that from diffu-sion couples.
The biggest advantage of the diffusion multiple approach in phase dia-gram determination is its high efficiency in both time and raw materials usage. An entire ternary phase diagram can be obtained from a tri-junction region of a diffusion multiple. By creating several tri-junctions in one sample, isothermal sections of multiple ternary systems can be determined without making dozens or even hundreds of individual alloys, thus saving the usage of raw materials. The diffusion multiple approach can also save ePMA examination time, because there is no need to exchange many alloy samples in and out of the EPMA system, which is very time consuming; that is, one needs to wait for a good vacuum to start the analysis each time.
Fig. 12.11 Light micrograph of 367 °C (693 °F) diffusion couple between pure aluminum and pure magnesium. electron probe microanal-
ysis (epMa) was used to identify the β, ε, and γ phases. Source: ref 12.5
5342_ch12_6111.indd 255 3/2/12 12:28:34 PM

256 / Phase Diagrams—Understanding the Basics
Fig. 12.12 Fabrication procedure for five-metal diffusion multiple. adapted from ref 12.4
Simple optical microscopy is usually used first to examine the phase formation and the integrity of a diffusion multiple. Most phases can usu-ally be seen with an optical microscope, although sometimes it is difficult to identify each when many phases are present. optical examination from low magnifications to high magnifications, along with information on the existing binary phase diagrams, can give clues to the phases present. After optical examination, SeM is often performed to obtain backscattered elec-tron (BSe) images. The atomic number contrast, along with some eDS analysis, which is often available with SEM, can help to further define some or most of the phases. Sometimes the contrast from different grain orientations can confound the atomic number contrast. A high-quality and high-contrast BSe image provides good information about the phases and related equilibria.
electron backscatter diffraction (eBSD) is a very useful tool to per-form crystal structure analysis to aid phase identification. It can be used to identify crystal structures of micron-size phases in a regularly pol-ished sample without going through the trouble of making TeM thin-foil specimens. Commercial eBSD systems are available as an attachment to regular SeMs. As a focused electron backscatter impinges on a phase, it generates BSes in addition to secondary electrons. Sophisticated algo-rithms have been developed to automatically capture and index the eBSD patterns.
The best way to check the reliability of the diffusion multiple approach is to compare the phase diagrams obtained from diffusion multiples to those obtained from equilibrated alloys and diffusion couples.
5342_ch12_6111.indd 256 3/2/12 12:28:35 PM

Chapter 12: Phase Diagram Determination / 257
12.4 Phase Diagram Construction Errors
hiroaki okamoto and Thaddeus Massalski have prepared the hypo-thetical binary shown in Fig. 12.13, which exhibits many typical errors of construction (marked as points 1 to 23). The explanation for each error is given in the accompanying text; one possible error-free version of the same diagram is shown in Fig. 12.14. Typical phase-rule violations in Fig. 12.13 include:
A two-phase field cannot be extended to become part of a pure-element 1. side of a phase diagram at zero solute. In example 1, the liquidus and the solidus must meet at the melting point of the pure element.Two liquidus curves must meet at one composition at a eutectic 2. temperature.A tie line must terminate at a phase boundary.3. Two solvus boundaries (or two liquidus, or two solidus, or a solidus and 4. a solvus) of the same phase must meet (i.e., intersect) at one composi-tion at an invariant temperature. (There should not be two solubility values for a phase boundary at one temperature.)A phase boundary must extrapolate into a two-phase field after cross-5. ing an invariant point. The validity of this feature, and similar features related to invariant temperatures, is easily demonstrated by construct-ing hypothetical free-energy diagrams slightly below and slightly above the invariant temperature and by observing the relative positions of the relevant tangent points to the free-energy curves. After intersec-tion, such boundaries can also be extrapolated into metastable regions of the phase diagram. Such extrapolations are sometimes indicated by dashed or dotted lines.
Fig. 12.13 hypothetical binary phase diagram showing many typical errors of construction. See accompanying text for discussion of the
errors at points 1 to 23. Source: ref 12.6 as published in ref 12.1
5342_ch12_6111.indd 257 3/2/12 12:28:35 PM

258 / Phase Diagrams—Understanding the Basics
Two single-phase fields (6. α and β) should not be in contact along a horizontal line. (An invariant temperature line separates two-phase fields in contacts.)A single-phase field (7. α, in this instance) should not be apportioned into subdivisions by a single line. having created a horizontal (invariant) line at point 6 (which is an error), there may be a temptation to extend this line into a single-phase field, α, creating an additional error.In a binary system, an invariant-temperature line should involve equi-8. librium among three phases.There should be a two-phase field between two single-phase fields (Two 9. single phases cannot touch except at a point. however, second-order and higher-order transformations may be exceptions to this rule.)When two phase boundaries touch at a point, they should touch at an 10. extremity of temperature.A touching liquidus and solidus (or any two touching boundaries) 11. must have a horizontal common tangent at the congruent point. In this instance, the solidus at the melting point is too “sharp” and appears to be discontinuous.A local minimum point in the lower part of a single-phase field (in this 12. instance, the liquid) cannot be drawn without additional boundary in contact with it. (In this instance, a horizontal monotectic line is most likely missing.)A local maximum point in the lower part of a single-phase field cannot 13. be drawn without a monotectic, monotectoid, systectic, and sintectoid reaction occurring below it at a lower temperature. Alternatively, a solidus curve must be drawn to touch the liquidus at point 13.A local maximum point in the upper part of a single-phase field cannot 14. be drawn without the phase boundary touching a reversed monotectic,
Fig. 12.14 error-free version of the phase diagram shown in Fig. 12.13. Source: ref 12.6 as published in ref 12.1
5342_ch12_6111.indd 258 3/2/12 12:28:35 PM

Chapter 12: Phase Diagram Determination / 259
or a monotectoid, horizontal reaction line coinciding with the tempera-ture of the maximum. When a point 14 type of error is introduced, a minimum may be created on either side (or on one side) of point 14. This introduces an additional error, which is the opposite of point 13, but equivalent to point 13 in kind.A phase boundary cannot terminate within a phase field. (Termination 15. due to lack of data is, of course, often shown in phase diagrams, but this is recognized to be artificial.The temperature of an invariant reaction in a binary system must be 16. constant. (The reaction line must be horizontal.)The liquidus should not have a discontinuous sharp peak at the melting 17. point of a compound. (This rule is not applicable if the liquid retains the molecular state of the compound, i.e., in the situation of an ideal association.)The compositions of all three phases at an invariant reaction must be 18. different.A four-phase equilibrium is not allowed in a binary system.19. Two separate phase boundaries that create a two-phase field between 20. two phases in equilibrium should not cross each other.Two inflection points are located too closely to each other.21. The boundary direction reverses abruptly (more abrupt than a typical 22. smooth “retro-grade”). This particular change can occur only if there is an accompanying abrupt change in the temperature dependence of the thermodynamic properties of either of the two phases involved (in this instance, δ or λ in relation to the boundary). The boundary turn at point 22 is very unlikely to be explained by a realistic change in the composition dependence of the Gibbs energy functions.An abrupt change in the slope of a single-phase boundary. This 23. particular change can occur only by an abrupt change in the com-position dependence of the thermodynamic properties of the single phase involved (in this instance, the δ phase). It cannot be explained by any possible abrupt change in the temperature dependence of the Gibbs energy function of the phase. (If the temperature dependence was involved, there would also be a change in the boundary of the ε phase.)
Problems Connected with Phase-Boundary Curvatures. Although phase rules are not violated, their additional unusual situations (points 21, 22, and 23 in Fig. 12.13) have also been included in Fig. 12.15. In each instance, a more subtle thermodynamic problem may exist related to these situations. examples are discussed in which several thermodynamically unlikely diagrams are considered. The problems with each of these situ-ations involve an indicated rapid change of slope of a phase boundary. If such situations are to be associated with realistic thermodynamics, the tem-perature (or the composition) dependence of the thermodynamic functions of the phase (or phases) involved would be expected to show corresponding
5342_ch12_6111.indd 259 3/2/12 12:28:35 PM

260 / Phase Diagrams—Understanding the Basics
abrupt and unrealistic variations in the phase diagram regions where such abrupt phase-boundary changes are proposed, without any clear reason for them. even the onset of ferromagnetism in a phase does not normally cause an abrupt change of slope of the related phase boundaries.
Congruent Transformations. The congruent point on a phase dia-gram is where different phases of the same composition are equilibrium. The Gibbs-Konovalov Rule for congruent points, which was developed by Dmitry Konovalov from a thermodynamic expression given by J. Willard Gibbs, states that the slope of phase boundaries at congruent transformations must be zero (horizontal). examples of correct slope at the maximum and minimum points on liquidus and solidus curves can be seen in Fig. 12.16.
Fig. 12.15 examples of acceptable intersection angles for boundaries of two-phase fields. Source: ref 12.2 as published in ref 12.1
Fig. 12.16 Schematic binary phase diagrams with solid-state miscibility where the liquidus shows (a) a maximum and (b) a minimum. Source: ref 12.1
5342_ch12_6111.indd 260 3/2/12 12:28:35 PM

Chapter 12: Phase Diagram Determination / 261
Fig. 12.17 example of a binary phase diagram with a minimum in the liquidus that violates the Gibbs-Konovalov rule. Source: ref 12.7 as published in ref 12.1
often, the inner curve on a diagram such as that shown in Fig. 12.16 is erroneously drawn with a sharp inflection (Fig. 12.17).
A similar common construction error is found in the diagrams of systems containing congruently melting compounds (such as the line compounds shown in Fig. 12.18) but having little or no association of the component
Fig. 12.18 Schematic diagrams of binary systems containing congruent melting compounds but having no association of the component atoms in the melt common. the diagram in (a)
is consistent with the Gibbs-Konovalov rule, whereas that in (b) violates the rule. Source: ref 12.7 as published in ref 12.1
5342_ch12_6111.indd 261 3/2/12 12:28:36 PM

262 / Phase Diagrams—Understanding the Basics
atoms in the melt (as with most metallic systems). This type of error is especially common in partial diagrams, where one or more system com-ponents is a compound instead of an element. However, the slope of liquids and solidus curves must not be zero when they terminate at an element or at a compound having complete association in the melt.
ACKNOWLEDGMENT
Portions of this chapter came from “Introduction to Alloy Phase Dia-grams,” by h. Baker in Alloy Phase Diagrams, vol 3, ASM Handbook, ASM International, 1992, reprinted in Desk Handbook: Phase Diagrams for Binary Alloys, 2nd ed., h. okamoto, ed., ASM International, 2010.
REFERENCES
12.1 h. Baker, Introduction to Alloy Phase Diagrams, Alloy Phase Dia-grams, vol 3, ASM Handbook, ASM International, 1992, reprinted in Desk Handbook: Phase Diagrams for Binary Alloys, 2nd ed., h. okamoto, ed., ASM International, 2010
12.2 F.N. Rhines, Phase Diagrams in Metallurgy, McGraw-hill, 1956 12.3 A. Prince, Alloy Phase Equilibria, elsevier, 1966 12.4 J.-C. Zhao, Methods for Phase Diagram Determination, elsevier,
2007 12.5 C. Brubaker and Z.-K. Liu, Diffusion Couple Study of the Mg-Al
System, Magnesium Technology 2004, TMS, 2004 12.6 h. okamoto and T.B. Massalski, Thermodynamically Improb-
able Phase Diagrams, J. Phase Equilibria, vol 12 (no. 2), 1991, p 148–168
12.7 D.A. Goodman, J.W. Cahn, and l.h. Bennett, The Centennial of the Gibbs-Konovalov Rule for Congruent Points, Bull. Alloy Phase Diagrams, Vol 2 (No. 1), 1981, p 29–34
5342_ch12_6111.indd 262 3/2/12 12:28:36 PM