Embed Size (px)
Citation preview

18th International Symposium on the Application of Laser and Imaging Techniques to Fluid Mechanics・LISBON | PORTUGAL ・JULY 4 – 7, 2016
Phase-Averaged MRV Measurements of the von Kármán Vortex
of a Confined Cylinder
D. Freudenhammer1,*, G. Rehs1, W. B. Buchenberg2, J. Hennig2, C. Tropea1 ,S. Grundmann3
1: Strömungslehre und Aerodynamik, Center of Smart Interfaces, TU Darmstadt 2: Medical Physics, Department of Radiology, University Medical Center Freiburg
3: Lehrstuhl Strömungsmechanik, Universität Rostock * Corresponding author: [email protected]
Keywords: Kármán Vortex Street, Phase averaged MRV, 4D-MRV
ABSTRACT
A von Kármán Vortex street (KVS) was established in a water-channel behind a confined, slotted cylinder and measured by means of Magnetic Resonance Velocimetry (MRV). A Reynolds number of Re D = 1272, based on the cylinder diameter (D = 20mm) was established in the flow. A Strouhal number of St = 0.242 resulted in a vortex shedding frequency of 0.41 Hz for the inflow velocity of ubulk = 0.0325 m/s. The measurements were performed with a measurement sequence that allows the acquisition of phase-averaged measurements, commonly also denoted as 4D-MRV. A temperature difference, present in the wake of the cylinder-flow, was created by a heated (55 °C) main flow, while the hollow, slotted cylinder (slot width s/D = 0.15) was cooled by a secondary flow with a temperature of 10 °C. The shedding vortices of the KVS were cooled slightly below the main flow temperature and registered by a type “K” thermocouple (TC) situated downstream (1 D) and off—center from the cylinder. From the acquired temperature signal, a triggering mechanism, necessary for performing 4D-MRV measurements, was extracted. Analysis of the entire cycle of a periodic flow is usually not feasible with the 4D-MRV technique, due to the existence of the dead time (Td), a technically required pause during the acquisition process. The dead time within this study (43 Phases, TD=2440 ms) was Td = 195.4 ms which is 8% of the cycle duration TD. A procedure for the elimination of Td through the combination of two consecutively acquired and subsequently mated MR measurements is presented, thus enabling the analysis of the entire periodic cycle.
1. Introduction Vortex shedding from a circular cylinder is well-known and well documented. An overview about important effects and parameters over a large Reynolds number range is given in Zdravkovich (1997, 2003). The uniform shedding frequency, made dimensionless by using the Strouhal number is exploited in technical devices, such as vortex flow meters. To improve the performance of vortex shedders, different geometries can be applied. Popiel et al. (1992,1993) conducted measurements with a short circular slotted cylinder with a concave rear surface to create stronger vortices.

18th International Symposium on the Application of Laser and Imaging Techniques to Fluid Mechanics・LISBON | PORTUGAL ・JULY 4 – 7, 2016
Igarashi (1999) and Peng (2011) investigated vortex shedding from a cylinder slotted normal to the flow direction. By adding a slot to the cylinder, the shedding process can be improved in terms of a more uniform shedding frequency. Moreover, an improved two-dimensional character of the shedding process can be achieved. Nevertheless, three-dimensional phenomena cannot be entirely suppressed. However, also for other applications of the periodic cylinder wake, such as for cooling of electronic components (Kieft et al. 1999 ,2002, 2007), the three-dimensional character of the cylinder flow can be of importance and this aspect has been much less studied. One obstacle to experimentally investigating this flow situation is the necessity of capturing the entire time resolved, three-dimensional, three-component velocity field, which. This has only recently become possible, with the advent of new measurement techniques. One of the measurement techniques offering this capability is Magnetic Resonance Velocimetry (MRV). MRV acquires three velocity vector components at each spatial location within the three dimensional object (Elkins et al. 2003). The MRV technique itself is not fast in acquisition; however, if the data acquisition is phase-averaged, a quasi time-resolved field can be obtained, and is then known as 4D-MRV (Markl et al. 2003). The challenge to realize such data acquisition with MRV is to have a suitable trigger signal available, with which the phase averaging can be synchronized. This is not difficult if the flow is periodically excited, since the excitation signal can then serve as a trigger signal. Much more difficult is the extraction of a suitable trigger signal from an inherently periodic flow structure, as is the case in the wake of a circular cylinder. This becomes even more complicated when used in conjunction with the MRV technique, since no ferromagnetic metal components can be employed in the experimental facility. In the context of the present study about the vortex wake of a confined circular cylinder at a Reynolds number of ReD =1272, an innovative approach to derive a suitable trigger signal for phase averaging of MRV data is described and assessed. However, the direct application of this approach could not be achieved due to issues arising from the MR-environmental conditions that are described below. Therefore, the approach was modified in such a way, that it was possible to identify the cycle length of the periodic vortex shedding downstream of the slotted cylinder from the flow signal and use this information to feed into an external trigger. Phase-resolved MRV measurements of the 2D2C flow field of the von Kármán vortices were thus acquired and analyzed.
2. Experimental setup
18th International Symposium on the Application of Laser and Imaging Techniques to Fluid Mechanics・LISBON | PORTUGAL ・JULY 4 – 7, 2016
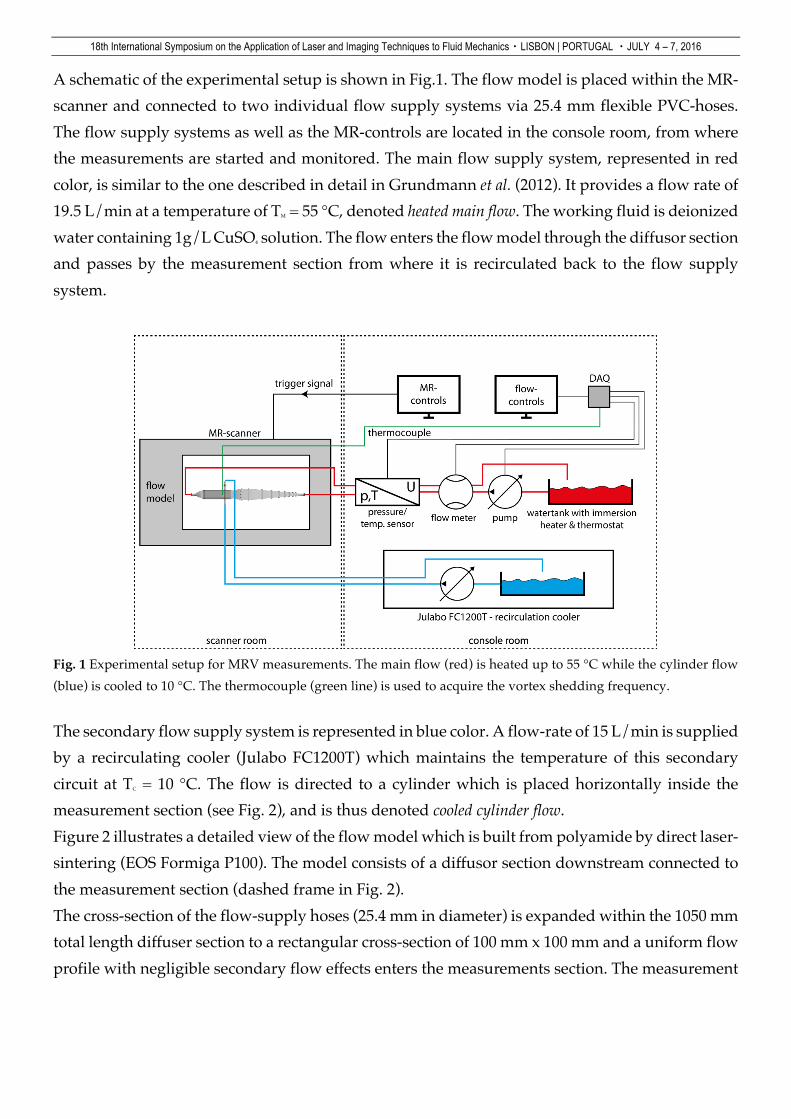
A schematic of the experimental setup is shown in Fig.1. The flow model is placed within the MR-scanner and connected to two individual flow supply systems via 25.4 mm flexible PVC-hoses. The flow supply systems as well as the MR-controls are located in the console room, from where the measurements are started and monitored. The main flow supply system, represented in red color, is similar to the one described in detail in Grundmann et al. (2012). It provides a flow rate of 19.5 L/min at a temperature of TM = 55 °C, denoted heated main flow. The working fluid is deionized water containing 1g/L CuSO4 solution. The flow enters the flow model through the diffusor section and passes by the measurement section from where it is recirculated back to the flow supply system.
Fig. 1 Experimental setup for MRV measurements. The main flow (red) is heated up to 55 °C while the cylinder flow (blue) is cooled to 10 °C. The thermocouple (green line) is used to acquire the vortex shedding frequency.
The secondary flow supply system is represented in blue color. A flow-rate of 15 L/min is supplied by a recirculating cooler (Julabo FC1200T) which maintains the temperature of this secondary circuit at TC = 10 °C. The flow is directed to a cylinder which is placed horizontally inside the measurement section (see Fig. 2), and is thus denoted cooled cylinder flow. Figure 2 illustrates a detailed view of the flow model which is built from polyamide by direct laser-sintering (EOS Formiga P100). The model consists of a diffusor section downstream connected to the measurement section (dashed frame in Fig. 2). The cross-section of the flow-supply hoses (25.4 mm in diameter) is expanded within the 1050 mm total length diffuser section to a rectangular cross-section of 100 mm x 100 mm and a uniform flow profile with negligible secondary flow effects enters the measurements section. The measurement

18th International Symposium on the Application of Laser and Imaging Techniques to Fluid Mechanics・LISBON | PORTUGAL ・JULY 4 – 7, 2016
section itself consists of a rectangular channel (100 mm x 100 mm, 450 mm length in flow direction) made from acrylic glass. Acrylic glass offers optical access and allows the detection of any air residing in the measurement section after de-aeration. Air bubbles result in measurement artifacts using the MRV technique and therefore have to be completely removed. In addition, acrylic glass as well as polyamide is not ferromagnetic, which suits the limitations of the MR scanner. A cylinder (diameter D = 20 mm) made from polyamide is placed horizontally inside the measurement section as indicated in Figure 2. Moreover, the cylinder is slotted (slot-width s/D=0.15) ensuring a uniform vortex detachment frequency (Peng 2011, Igarashi 1999). The Reynolds number, calculated with the main flow bulk velocity, ubulk =0.0325 m/s, the kinematic
viscosity of water at 55 °C (νwater,55 °C = 0,5109x10⁻⁶ m2/s) and with respect to the cylinder diameter D is ReD = 1272. The Strouhal number is calculated to St = 0.242 (Williamson, 1998), vortex shedding is thus expected at a frequency of 0.39 Hz. A coordinate system, made dimensionless by the cylinder diameter D, is defined with the origin being the central axis of the cylinder and the x-axis in the direction of the heated main flow (see Fig. 2 bottom right). The z-origin of the coordinate system lies in the central x-y-plane of the 100 mm wide measurement section. This corresponds to the position, where the measurements were acquired. The Field of View (FOV) of the MRV-measurements is marked with a frame in Fig.2 (bottom right). The cylinder is hollow and the cooled cylinder current flows through. Hence, a temperature difference of roughly 45 K between the heated main flow and the flow inside the cylinder is created, resulting in a temperature difference between vortices created in the wake and the main flow in the test section.
Fig. 2 Sectional view of the flow model. The main flow is heated to 55 °C and enters the measurement section through the diffuser (flow direction from left to right). A slotted cylinder is placed horizontally inside the measurement section. The cylinder is cooled to 10 °C by a secondary flow supply system. The vortices created by the slotted cylinder are cooler than the main flow. The “cold” vortices can be identified by a thermocouple which is situated downstream of the slotted cylinder, as shown in the detail view of the measurement section. The position of the thermocouple is x/D = 1.1; y/D = -0.4; z/D = 1.2.
The “cooler” vortices in the wake of the cylinder can be detected by a thermocouple (TC) of type “K” which is placed downstream (x/D= 1.1) and off-center (y/D = -0.4) of the cylinder (Fig.2 bottom right). The z-position of the TC is z/D = 1.2, this way keeping the TC out of the measured

18th International Symposium on the Application of Laser and Imaging Techniques to Fluid Mechanics・LISBON | PORTUGAL ・JULY 4 – 7, 2016
FOV while at the same time maintaining a central position inside the flow-channel in order to minimize potential wall-effects. Important flow parameters and settings are listed in Table 1.
Table 1: Experimental settings and operating conditions
Flow parameters Imaging parameters Main flow rate (VM) 19.5 L/min Encoding velocity (VENC) 0.1 m/s Main flow temperature (TM) 55 °C Echo Time (TE) 5.935 ms Main flow bulk velocity (u bulk) 0.0325 m/s Repetition time (TR) 17.4ms Cylinder flow rate (VC) 15 L/min Flip angle 7° Cylinder flow temperature (TC) 10 °C Matrix size 128 x 128 x 1 Cylinder diameter (D) 20 mm Voxel size 1.25 x 1.25 x 5 mm³ Cylinder slot width (s/D) 0.15 Phases per trigger cycle 43 Reynolds number (Re D) 1272 Temporal resolution (Tres) 52.2 ms Strouhal number (St) 0.242 Average cycle duration (TD) 2440 Time of data acquisition (TA) 2 min 30 sec Number of acquisitions (N) 2
3. Generation of the 4D-MRV trigger signal The measured temperature signal of the TC is used to identify the periodic behavior of the flow and is, moreover, intended to be used for the creation of a trigger signal. Due to the selected position slightly off-center of the cylinder-axis, the TC is placed within the pathline of the cold vortices shedding from the cylinder bottom and is thus capable of identifying the vortices from the varying temperature signal.

18th International Symposium on the Application of Laser and Imaging Techniques to Fluid Mechanics・LISBON | PORTUGAL ・JULY 4 – 7, 2016
Fig. 3 The temperature-signal of the
main flow as measured by the
thermocouple over a period of 20 s
clearly indicates the periodic
behavior of the cold vortices passing
by (blue line). The falling edge of the
temperature signal is used to produce
the trigger-signal (red line).
Figure 3 shows an example of the temperature signal, acquired with the settings described in Table 1. The blue line shows the temperature signal measured by the TC over a duration of 20 seconds. The line clearly indicates the periodic behavior of the “cold” vortices passing by. The uniform, constant vortex detachment frequency is demonstrated from the temperature signal which was
acquired over ≈100 min. A standard deviation of 4.77% of the average cycle length was calculated. This low standard deviation is beneficial for the phase averaging, resulting in low smearing of the velocity data due to phase jitter. A trigger signal can be generated using a simple amplitude threshold on the falling edge of the temperature trace (red line, Fig.3), which is then fed into the MR-scanner as trigger-signal to be used for subsequent phase averaging of the MRV measurements. Note the relatively low temperature drop provoked by the bypass of the cold vortices that lies in the order of < 1 °C. Long-term temperature changes in the heated main flow arise and cause temperature variations in the order of ±1 °C. The simple amplitude threshold is therefore extended by a moving average mean value to account for these temperature-changes. Application of the triggering mechanism in MR-environment

18th International Symposium on the Application of Laser and Imaging Techniques to Fluid Mechanics・LISBON | PORTUGAL ・JULY 4 – 7, 2016
Fig.4 The temperature signal acquired by the TC is highly degraded during the measure-ment procedure.
Figure 4 graphically illustrates the above mentioned difficulties that arose during the application of the trigger mechanism in the MR-environment during the data acquisition. The temperature signal is highly degraded as soon as the MRV measurement procedure starts. The cause of this complete signal failure is lies in the fast development of temporary magnetic field gradients and the RF excitation pulses, that are an inherent component of the MR data acquisition procedure. The TC thereby acts as an antenna, and the magnetic field gradients induce faulty voltages, which are superimposed onto the TC temperature signal, provoked by electromagnetic induction. As depicted in Fig.1, the TC (green line) is located in the center of the MR-scanner bore, where the gradient amplitudes are the strongest. A TC location outside of the scanner bore would decrease the effect of the changing magnetic fields and thus improve the temperature measurements. Due
to the fast decay of the shedding vortices (and simultaneously the decay in ∆T), the temperature signal must be acquired in direct proximity of the cylinder. It is presumed, that a shielded TC would not be affected to this extent by the magnetic field gradients; however, this could not be tested in the scope of the present study. Instead, the TC was replaced by a gallium arsenide based fiber-optic temperature sensor (Optocon, TS2 sensor and Optocon Fotemp-19” signal conditioner). The probe sensor does not contain any ferrite metal parts and is completely non-conductive. Yet,
the generated temperature difference ∆T could not be adequately resolved due to insufficient temperature-resolution of the sensor. As a workaround to this issue, the temperature signal, provided by the TC, was used to determine the average cycle duration (TD) of the periodic vortex shedding. The cycle duration was calculated to be TD = 2440 ms, corresponding to a shedding frequency f = 0.41 Hz. The slight increase with respect to the estimated shedding frequency (f = 0.39 Hz) is expected to originate from the slotted cylinder geometry, which is known to provoke slightly higher shedding frequencies. An external trigger, included in any medical MR-scanner, is set to TD and the phase-averaged measurements are started. Even though the standard deviation of the cycle length (<5%) is low, and the slotted cylinder in combination with the flow settings enables a very constant shedding frequency,

18th International Symposium on the Application of Laser and Imaging Techniques to Fluid Mechanics・LISBON | PORTUGAL ・JULY 4 – 7, 2016
potential outliers in cycle length can’t be excluded. Herein lies the drawback of the external trigger mechanism compared to the proposed approach of generating the trigger directly off the measured temperature signal, where outliers in cycle length will be identified and omitted. Outliers in cycle length will cause phase-blending and velocity smearing. In order to minimize the probability of occurring outliers, the time of data acquisition (TA) was kept as short as possible. The phase-resolved 2D2C velocity field of this setup was acquired in TA=2 min 30 seconds.
4. Experimental Results
A 2D-slice was acquired in the central xy-plane using the 4D-MRV sequence. The covered FoV measured 160 mm x 160 mm with an imaging matrix of 128 x 128 pixels, resulting in an in-plane resolution of 1.25 mm x 1.25 mm. The slice-thickness was 5 mm. A phase-resolution of 43 phases per trigger cycle was realized. Two k-space lines per phase were filled at once, resulting in a total time of data acquisition TA=2min 30 seconds per measurement. The important MR imaging parameters are also listed in Tab.1.
Fig.5 Schematic of the 4D-MRV sequence that enable
phase-resolved measurements. The periodic flow
(cycle duration TD) is divided into 43 phases per
trigger cycle. The flow is not acquired during the
dead time Td, which remains at the end of each cycle.
Figure 5 schematically illustrates the 4D-MRV measurement principle for the phase-resolved acquisition of a periodic flow. Between the trigger signals that indicate the onset of a new cycle (cycle duration TD), the phases are partially acquired. This procedure is repeated until the data set is entirely acquired. Due to measurement restrictions, the periodic flow cannot be thoroughly resolved. A remaining dead time (Td) is always present. The periodic flow (TD = 2440 ms) is resolved into 43 phases per trigger cycle, which were acquired with a temporal resolution of Tres=52.2 ms, yielding a dead time Td = (2440 – 43x52.2)ms = 195.4 ms, equivalent to 3.74 phases. Two identical measurements (N=2) were acquired. Combining the measurements improves the
signal-to-noise ratio (SNR) according to 𝑆𝑁𝑅~√𝑁 (Haacke, 1999). Moreover, the two measurements can be combined such that the dead time Td is removed.

18th International Symposium on the Application of Laser and Imaging Techniques to Fluid Mechanics・LISBON | PORTUGAL ・JULY 4 – 7, 2016
Fig.6 Streamwise u-velocity
component (dotted line) and
cross-streamwise v-velocity
component (continuous line) of
the flow, extracted for
measurements 1 and 2 at the
location (x/D = 1.1, y/D = 0.4,
z/D = 0). A distinct offset
between both measurements is
visible.
Figure 6 depicts the u- and v-velocities extracted from both independent MRV-measurements at the location (x/D = 1.1, y/D = -0.4, z/D = 0). Dotted and continuous lines depict the u-velocity and the v-velocity component, respectively. The red and black lines indicate measurement no.1 (M1) and no.2 (M2), respectively. An apparent offset in phase between M1 and M2 is visible in both velocities. A cross-correlation was employed to detect the phase-shift and enable averaging of M1 and M2. The result is visualized in Fig.7, where the average of M1 and M2 is represented in blue. Again, dotted and continuous lines represent the u- and v-velocities. Note, that in the two shaded areas, measurement data was only available from measurement M1 (first shaded area, Phases 22-25) or from measurement M2 (second shaded area, Phases 33-36), respectively, due to the dead time Td of each individual measurement. The such composed dataset then consists of a total of 47 phase s, without any dead time present, adding up to an artificial cycle duration TD* =
47 x 52.2 ms = 2453.4ms. The difference in cycle duration TD* - TD = 13.4ms ≈ 0.25 Tres is assumed
to be reasonably small. Moreover, the maximum error due to phase-offset between the individual
measurements will not exceed Tres / 2.

18th International Symposium on the Application of Laser and Imaging Techniques to Fluid Mechanics・LISBON | PORTUGAL ・JULY 4 – 7, 2016
Fig.7 Combination of both
measurements enables the
representation of the entire
periodic cycle within 47
phases. Dotted and
continuous lines indicate the
u- and v-velocity components,
respectively. Due to the dead
times Td, flow data from only
one measurement is available
in the shaded regions.
The z-vorticity of the flow regime at 6 selected phases is visualized in Fig. 8 a-f. The phases are approximately evenly distributed over the cycle duration TD, the corresponding times in the vortex shedding cycle are plotted in the bottom right corner. The flow direction is from left to right, as indicated in 8a. The u-v-vector layer – every 10th vector displayed - is superimposed onto the z-vorticity contour and is displayed with a uniform vector length in order to better represent the flow direction. The creation of the KVS can be clarified: The onset of a vortex with negative vorticity (vortex A) at the beginning of the cycle is displayed in Fig. 8a, where a layer of fluid with negative vorticity is spread over nearly half the slotted cylinder circumference (A1). The thickness of the layer increases with time, until the emergence of a new vortex (vortex B) of positive vorticity (upper white arrow, B1). The emergence of this new vorticity region results in a partial detachment of vortex A from the cylinder surface (A2). The further growth of the vorticity region eventually leads to complete detachment from the cylinder surface. The vortex is shed from the cylinder top and flows off (A3-A4). The negative vorticity of the fluid still connected to vortex A (wide arrow in Fig.8e) rapidly dissipates. As a result of the detached vortex A, both regions of positive vorticity (white arrows Fig.8b) unite (B2) and develop a continuous layer, which grows in size (B3-B4). The onset of yet another vortex C is visualized in Fig.8e (C1). The same mechanism as before leads to the detachment of vortex B and the growth of the vortex region C (C2, Fig.8f) and the cycle is repeated.

18th International Symposium on the Application of Laser and Imaging Techniques to Fluid Mechanics・LISBON | PORTUGAL ・JULY 4 – 7, 2016
5. Conclusions Phase-averaged, time-resolved measurements of a KVS were acquired using the 4D-MRV measurement technique. Measurements were conducted inside a water-channel, featuring a confined, slotted cylinder. The in-situ trigger generation, necessary for acquiring 4D-MRV measurements from an established temperature difference between the heated main flow and the cooled vortices was not possible during this study due to a total signal loss during the MR data acquisition when using a conventional TC. The replacement of the conventional TC by a gallium arsenide based fiber-optic temperature sensor improved the temperature signal acquisition during the measurements. However, this temperature signal did not sufficiently resolve the relatively small temperature difference between the heated main flow and the cooled vortices. Data acquisition of the KVS was thus enabled by using the built-in trigger generator of the MR scanner, which provided the cycle duration determined beforehand. Due to the constant shedding frequency, ensured by the cylinder-geometry (diameter D = 20mm, slot width s/D = 0.15), as well as the flow settings (ReD = 1272, St = 0.242) phase-shifts during the measurements, caused by non-uniform vortex shedding, could be prevented. The chance of phase-drifts arising due to outliers in cycle length was reduced by minimizing the time of data acquisition. A 2D flow field with 2 velocity components was acquired with a phase resolution of 43 phases in a total time of data acquisition TA=2min 30sec per measurement. A combination of two subsequently acquired measurements allowed the elimination of the dead time, characteristic for the 4D-MRV measurements, and thus the analysis of the entire periodic cycle resolved in 47 phases. As a result, the vortex shedding process is descriptively analyzed in this case, assuming two-dimensional flow around the cylinder and neglecting potential three-dimensional flow effects in the vortex generation process. It is emphasized that the acquisition of a phase-averaged, time-resolved 3D3C dataset is possible with the described triggering procedure, yet the increasing risk of an emerging phase offset due to longer acquisition times must be considered. Concerning this matter, a MR-compatible temperature sensor with good temporal and temperature resolution would be highly desireable to monitor the periodic temperature changes and allow for accurate triggering of the MR measurements.

18th International Symposium on the Application of Laser and Imaging Techniques to Fluid Mechanics・LISBON | PORTUGAL ・JULY 4 – 7, 2016
Fig.8 The vortex shedding procedure of the KVS, displayed at 6 distinct points during the cylcle (cycle duration
TD=2440ms). Displayed is the z-vorticity ζ of the flow. Flow direction is from left to right. The superimposed vector-
layer, every 10th vector visualized, has a uniform length to better visualize the flow direction. The blue region of
negative vorticity (A1) grows in size up to a point, when a region of opposite vorticity emerges (B1), causing the
total detachment (A3) and the shedding (A4) of the vortex from the upper edge of the cylinder.
References

18th International Symposium on the Application of Laser and Imaging Techniques to Fluid Mechanics・LISBON | PORTUGAL ・JULY 4 – 7, 2016
Elkins CJ, Markl M, Pelc N, Eaton JK. 4D (2003) Magnetic Resonance Velocimetry for Mean Velocity Measurements in Complex Turbulent Flows. Experiments in Fluids, 34: 494–503 DOI 10.1007/s00348-003-0587- Grundmann S, Wassermann F, Lorenz R, Jung B, Tropea C (2012) Experimental Investigation of Helical Structures in Swirling Flows. International Journal for Heat and Fluid Flow, 37(1):51–63 Haacke, M et al. (1999). Magnetic resonance imaging: physical principles and sequence design. New York: Wiley-Liss
Igarashi T (1999) Flow Resistance and Strouhal Number of a Vortex Shedder in a Circular Pipe. JSME International
Journal Series B, 42: 586-595 Kieft RN, Rindt CCM and van Steenhoven AA (2007) Near-Wake Effects of a Heat Input on the Vortex-Shedding Mechanism. International Journal of Heat and Fluid Flow, 28: 938-947 Kieft, R. N., C. C. M. Rindt, and A. A. Van Steenhoven (1999) "The wake behaviour behind a heated horizontal cylinder." Experimental thermal and fluid science, 19.4: 183-193. Kieft, R. N., C. C. M. Rindt, and A. A. Van Steenhoven (2002) "Heat induced transition of a stable vortex street." International journal of heat and mass transfer, 45.13: 2739-2753. Markl M, Chan FP, Alley MT, et al. Time-resolved three-dimensional phase-contrast MRI. J Magn Reson Imaging 2003;17:499–506. Peng, B. H., et al. (2012) "Performance of vortex shedding from a circular cylinder with a slit normal to the stream." Flow Measurement and Instrumentation, 25: 54-62. Popiel, C. O., D. I. Robinson, and J. T. Turner (1992) "Vortex shedding from specially shaped cylinders." Proc. of 11th Australasian Fluid Mechanics Conference. Popiel, C. O., D. I. Robinson, and J. T. Turner (1993) "Vortex shedding from a circular cylinder with a slit and concave rear surface." Applied Scientific Research, 51.1-2: 209-215. Venugopal, Agrawal, and Prabhu (2011) Review on Vortex Flowmeter - Designer Perspective. Sensors and Actuators A: Physical, 170: 8–23 Williamson, C. H. K., and G. L. Brown (1998) "A series in 1/√ Re to represent the Strouhal–Reynolds number relationship of the cylinder wake." Journal of Fluids and Structures, 12.8: 1073-1085. Zdravkovich MM (1997) Flow Around Circular Cylinders: Vol 1: Fundamentals. Oxford University Press, Oxford Zdravkovich MM (2003) Flow Around Circular Cylinders: Vol 2: Applications. Fundamentals. Oxford University Press, Oxford