Embed Size (px)
Citation preview
Phase 1 Clinical Studies First-In-Human (FIH)
Chapter 31 Pharmacologically-Guided
Dose Escalation
Jerry M. Collins, Ph.D. Developmental Therapeutics Program
Division of Cancer Treatment and Diagnosis, NCI April 2, 2009
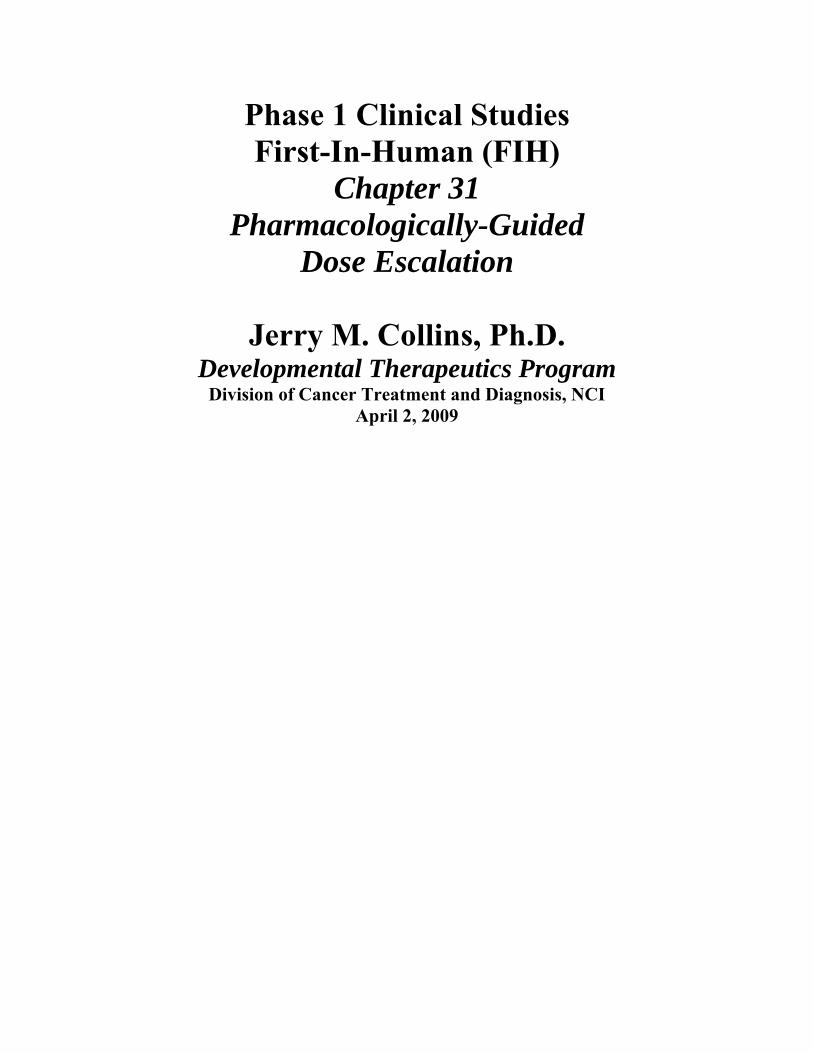
Pre-Clinical Screening
Pre-Clinical Toxicology ______↓___________ Clinical Phase 1 ↓ Phase 2 ↓ Phase 3 ↓ Phase 4
2

Flow Chart
Traditional Clinical IND NDA Pre-Clinical → Phase 1 →2→3→ Phase 4
In vitro Post-Approval
Subcellular Clinical testing
Cellular ← and Non-Clinical
In Vivo Rodents Non-Rodents
3

Copy of the homepage of the website
//nihroadmap.nih.gov
Title at top of website reads as follows: NIH Roadmap. Accelerating medical discovery
to improve health The following is highlighted on this page: Re-engineering the Clinical Research Enterprise
4

Re-Engineering Phase I (FIH) Trials 1. Pipeline/Funnel Pressure: combinatorial/HTS, new Sponsors 2. To Phase I Faster, Less Preclinical Work 3. Fewer patients, homeopathic doses 4. More patients “near-Phase 2” doses 5. “Value-Added” factors PK only: variability, metabolism/pharmacogenetics PD: Decisions to Drop/Continue
5

Design of Phase 1 (FIH) Trial Starting Dose Escalation Scheme For Both Elements, Conflict Between Caution/Safety vs. Efficiency/Efficacy
6

Modified Fibonacci Escalation Ratio: Human Dose/Mouse LD10 First dose (entry) in human is 1/10 of mouse LD10. The second dose is 2/10 of mouse LD10. Dose escalation then proceeds cautiously at smaller increments (67%, 50%, 40%, 30%).
7

BIBLIOGRAPHY / COLLINS / PHASE 1 J.M.Collins, D.S.Zaharko, R.L.Dedrick, B.A.Chabner. Potential roles for preclinical pharmacology in Phase I trials. Cancer Treat. Rep. 70:73 80, 1986. ** Message: we do a lot of preclinical pharm studies; what do we learn? how is it used? ** Initial proposal for customized dose escalation. J.M. Collins, C.K. Grieshaber, B.A. Chabner. Pharmacologically-guided Phase I trials based upon preclinical development. J. Natl. Cancer Inst. 82:1321-1326, 1990. ** Note that title does not say “PK” Intended as an overall platform Summarizes mostly retrospectively
8

PK-PD Hypothesis:
When Comparing
Animal and Human Doses, Expect Equal Toxicity for Equal Drug Exposure
Concentration of Drug as a Biomarker or Endpoint
9
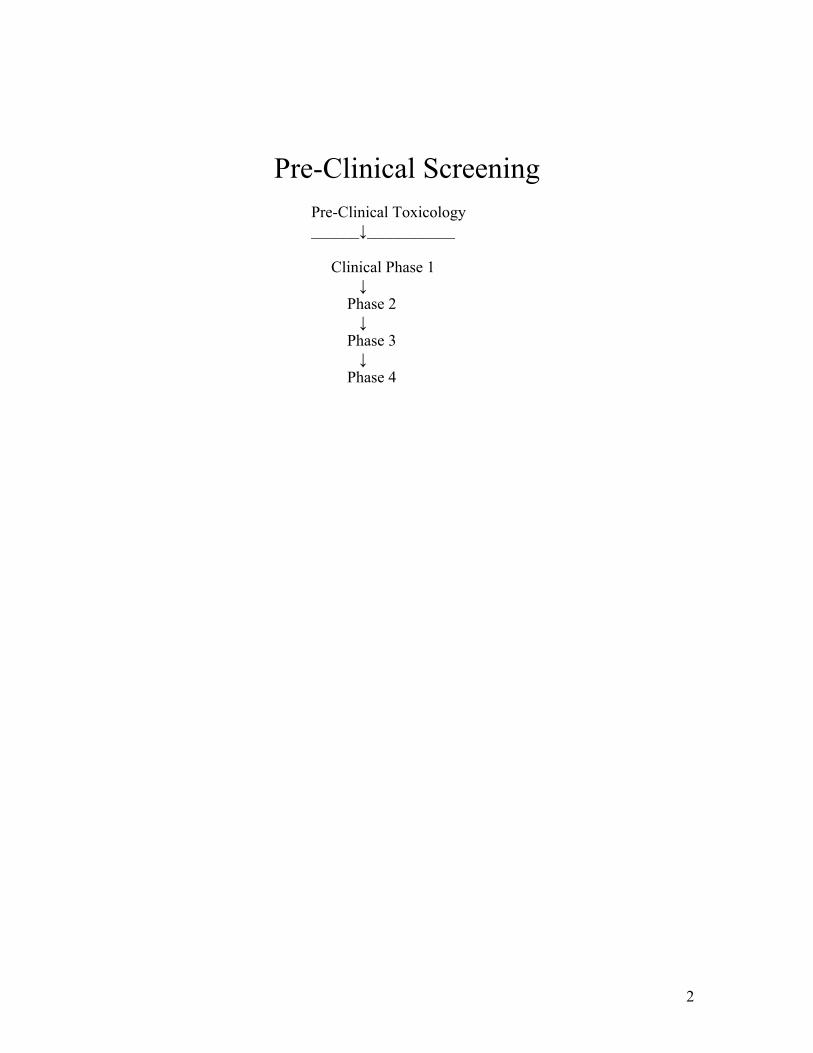
Bridges Between Preclinical and Clinical Development
Preclinical Clinical
Pharm/Tox Phase 1 Trials --------------- -------------------
Mouse MTD Starting Dose
↓ ↓ Blood Levels Blood Levels
↓ ↓ Escalation Strategy
10
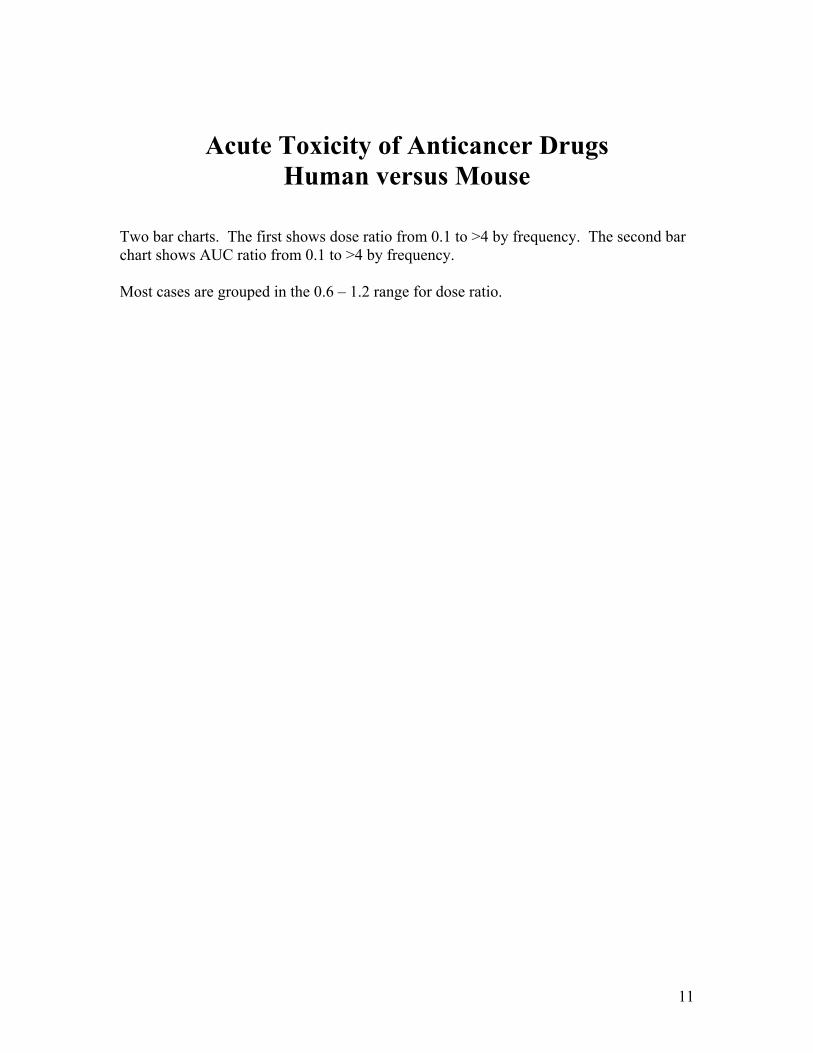
Acute Toxicity of Anticancer Drugs
Human versus Mouse Two bar charts. The first shows dose ratio from 0.1 to >4 by frequency. The second bar chart shows AUC ratio from 0.1 to >4 by frequency. Most cases are grouped in the 0.6 – 1.2 range for dose ratio.
11

Conclusion:
Hypothesis has merit.
Follow-Up: What is underlying reason for interspecies
differences?
12
S.Markey, 8-Nov-01, <not in current year’s examples> Additional Effects on Drug Metabolism Species Differences Major differences in drug metabolism in different species have been recognized for many years both in gut microflora and CYP proteins
Example: phenylbutazone half-life is: 3 h in rabbit 6 h in rat, guinea pig, dog 3 days in humans
13

Metabolism as the
Principal Confounding Factor for First-in-Human Trials
14

paclitaxel
Chromatography tracing for metabolites in rats and humans.
15

In Addition to Explaining Interspecies Differences,
Other Applications for Metabolism Studies in Phase 1:
Learn/Confirm Major Pathways
Learn/Confirm Active/Toxic Molecules
16
terfenadine/SELDANE®
Chemical structure for terfenadine/Seldane® Chemical structure for fexofenadine/ALLERGRA®
17

Target-Guided Dose Escalation
Preclinical Pharm/Tox Clinical Phase 1 Trials --------------------------- ---------------------------
Safety Factor
Reference Animal Dose ↔ Starting Human Dose
Define Target Goal Assess Target Impact ↓ ↓ Stop or Escalate?
18

Guidance for Industry, Investigators, Reviewers
Exploratory IND Studies FDA January 2006
Categories of Studies Include:
[1] Molecular Proof-of-Concept
(pharmacologic concentrations) [2] Functional Imaging FDA’s Exploratory IND enables NCI’s Phase Zero
19
“Historical” Phases of Human Evaluation
Phase 0: Mechanism of Action Phase 1: Safety, early signs of activity Phase 2: Is activity promising? Phase 3: Improve current therapy? NCI is working to re-engineer its pipeline of new candidate molecules in the context of Exploratory IND
20

Chronology of First-in-Human Study Designs Era Primary Secondary Correlative 1960s Toxicity Activity (None) 1980s Toxicity Activity PK 1980s Toxicity Activity PK-guided 1990s Toxicity Activity PK-PD/Biomarkers 2000s PD PK Toxicity, Activity Phase Zero (not expected)
Role Reversal as Discovery Continues
21

Articulate and Answer the Key Question
Key question can be as simple as whether drug candidate is absorbed from GI tract
→ Readily Answered Key Question for Phase Zero PARP Project: Can DNA Repair Enzyme Be Inhibited? (Need Tumor Sample and Suitable Assay!)
22

ABT-888 Phase Zero Plasma PK
Plot showing plasma concentration (uM) of 10mg (N=3), 25 mg (N=3), 50 mg (N= 7), and 0.21 μM target (horizontal line on graph) over time (hours). The 10 mg dose resulted in plasma concentrations above target for almost 12 hours. S.Kummar, ASCO 2007
23

First NCI Phase Zero Project PARP enzyme inhibitor
Goals Outcomes
Can Target Plasma Concentration Be YES Achieved Orally?
Can Tumor Biopsy Provide Definitive Results?
24

PAR Inhibition in Tumor Biopsies 3-6 Hours Post Dose Bar chart that shows percent of baseline over baseline and post-dose in tumor biopsies 3-6 hours post dose. Post-dose shows percent of baseline at greatly reduced levels for Pt 4, Pt 5, Pt 6, Pt 7, and Pt 10. Pt 11 shows a lower percent of baseline but not a greatly reduced level as with the others. S.Kummar, T.A.T. 2008
25

First NCI Phase Zero Project PARP enzyme inhibitor
Goals Outcomes Can Target Plasma PK Concentration Be YES Achieved Orally? - - - - - - - - - - - - - - - - - - Can Tumor Biopsy PD Provide Definitive YES Results? Inhibition by dose and time
26
Functional Imaging via PET: Biomarkers for Treatment Evaluation Does treatment impact the desired target? What is the minimum/maximum dose? How to select interval between courses? CONTEXT: Individual Patient, or New Agent Development
27

MAO-B Inhibition by Lazabamide J.Fowler,BNL Neurology(93)
Four brain scans are shown. One is at baseline, the second is at 25 mg bid, the third is 50 mg bid, and the fourth is 36 hrs later. The brain scan at 25 mg bid shows partial MAO-B inhibition whereas the brain scan at 50 mg bid shows almost complete inhibition. The brain scan at 36 hrs later looks much like the baseline scan showing that Lazabamide has passed out of the system.
28

First-In-Human Trials
Identity Crisis?
29
What is Inherent in
First-In-Human Trials?
<surprise!>
30

Translational Research
Graphic illustration of a man on the left side of the page with a light bulb over his head showing that he has an idea. There is an arrow from the man to the graphic illustration on the right side of the paper of a young girl in a hospital bed with a physician attending to her. There is another arrow from the drawing on the right to the drawing on the left completing the circular motion of this drawing.
31

A map of the Bethesda/Rockville area and surrounding area showing where NIH and the FDA are located. Also, around the edges of the map are the names of some of the remote sites for the “Principles of Clinical Pharmacology” course in the direction where they are located.
32


![Synthesis of Pharmacologically Relevant Arenes by [3+3] …rosdok.uni-rostock.de/file/rosdok_derivate_0000003442/... · 2018. 6. 29. · 1 Synthesis of Pharmacologically Relevant](https://img.dokumen.tips/doc/110x75/6111034e6db963717470da95/synthesis-of-pharmacologically-relevant-arenes-by-33-2018-6-29-1-synthesis.jpg)