Embed Size (px)
Citation preview
Pharmacokinetics of Desflurane in Clinical Setting: At Two Different Flow Rate
Research & Innovation in Anesthesia, July-December 2018;3(2):41-53 41
RIA
Pharmacokinetics of Desflurane in Clinical Setting: At Two Different Flow Rate1Meenoti P Potdar, 2Laxmi L Kamat, 3Zakera Mahevi
RIA
RESEARCH ARTICLE10.5005/jp-journals-10049-0049
ABSTRACT
Introduction: Desflurane due to its favorable quality of quick wash in and wash out has gained popularity as a preferred inhalational anesthetic agent for low flow anesthesia (LFA) which can be costeffective, minimizing the operation theatre pollution. This study was conducted to assess the pharmacokinetic effects and safety of desflurane in lower flow rates.
Aim: To compare the pharmacokinetics of desflurane by assess-ing its inspired and end tidal concentrations at fresh gas flow (FGF) of 1 and 1.5 L/min.
To compare the inspired and end tidal concentrations of oxygen, nitrous oxide at 1 and 1.5 L/min FGF, to assess the safety as per adequate oxygenation and depth of anesthesia, haemodynamic stability, consumption of gases, MAC values and incidence of awareness.
Materials and methods: One hundred patients were included and divided into two groups of 50 each of ASA grades I and II undergoing general anesthesia for laparoscopic abdominal surgeries. They were maintained with FGF of group A–1 L/min, group B–1.5 L/min
All patients were monitored for hemodynamics, entropy, inspired and expired concentration of desflurane, oxygen, nitrous oxide, MAC values at FGF depending on the group with O2:N2O 50:50 and 5% desflurane. The recovery parameters, side effects and awareness were noted.
Results: We found that Inspired and end tidal concentrations of desflurane were significantly different for both groups, but the difference between inspired and end tidal concentrations and ratio of end tidal to vaporizer setting were comparable as the duration of anesthesia increases suggesting saturation being achieved. The inspired and end tidal concentrations of oxygen were significantly different but were maintained at adequately safe levels. Hemodynamics were maintained and comparable in both the groups. The MAC values and requirements of desflurane, oxygen and nitrous oxide were higher in group B and recovery took significantly longer time. The incidence of side effects were comparable and none of the patients experienced awareness.
Conclusion: The pharmacokinetics of desflurane favour the use of LFA. Conducting anaesthesia at a FGF 1 L/min was equally safe and there was no added advantage of using 1.5 L/min FGF. In today’s modern era low flow anesthesia can be safely practiced and reduces the cost and environmental pollution.
Clinical significance: Desflurane can be used efficiently at lower rates with the advantage of reducing the cost and not jeopardising the safety as per the oxygenation, hemodynamic stability and depth of anesthesia.
Keywords: Desflurane, Expired, Inspired, Pharmacokinetics.
How to cite this article: Potdar MP, Kamat LL, Mahevi Z. Pharmacokinetics of Desflurane in Clinical Setting: At Two Different Flow Rate. Res Inno in Anesth 2018;3(2):41-53.
Source of support: Nil
Conflict of interest: None
INTRODUCTION
Desflurane1,2 is a polyfluorinated methyl ethyl ether com-pound that is identical in chemical structure to isoflurane except for the substitution of fluoride for chloride ion at the a ethyl carbon. This substitution of single atom radically alters its physical properties in comparison to the other ether anesthetics. The extensive fluorination and molecular symmetry of this anesthetic renders it resistant to microsomal enzyme systems and hydrolysis in soda-lime absorbers. It has very low blood and tissue solubility. These characteristics distinguish desflurane from the remainder of the halogenated ether inhalational anesthetics. It has low blood/gas (0.42) and oil/gas (18.7) partition coefficients1 as compared to the other potent inhalational agents. These indicate that it will undergo rapid wash in and washout (and hence, rapid induction and recovery from anesthesia) and have a MAC value of about 6.6%.1,3
The low flow anesthesia (LFA) has gained popularity over the years, due to economic concerns, environmental factors, advances in monitoring and introduction of new expensive anesthetics. LFA is carried out with a fresh gas flow (FGF) rate which is significantly lower than the minute volume. When such low FGF are used, the anes-thetic gases must be conducted to the patient via closed rebreathing systems. The rebreathing fraction increases with the reduction of the fresh gas flow whereas the volume of excess gas decreases.
1Consultant Anesthesiologist, 2Ex-HOD, 3Senior Resident 1-3Department of Anesthesia, Dr. LH Hiranandani Hospital, Mumbai, Maharashtra, India
Corresponding Author: Meenoti P Potdar, Consultant Anesthesiologist, Department of Anesthesia, Dr. LH Hiranandani Hospital, Mumbai, Maharashtra, India, e-mail: [email protected]
Meenoti P Potdar et al.
42
Lower FGF rates provide more cost saving, effica-cious and ecologically improved method of anesthesia. Besides, it also improves temperature and humidity of anesthetic gases.
This study was conducted to assess the pharmacoki-netic effects and safety of desflurane in lower flow rates.
AIMS AND OBJECTIVES
• To study and compare the pharmacokinetics of desflu-rane by assessing the inspired and end tidal concentra-tions of desflurane at FGF of 1.5 L/min and 1 L/min.
• To compare the inspired and end tidal concentrations of oxygen, nitrous oxide and carbon dioxide at FGF of 1.5 L/min and 1 L/min and to assess the safety as per adequate oxygenation and depth of anesthesia.
• To assess the hemodynamic stability with different flow rates.
• To assess the consumption of desflurane with both flow rates
• To compare the MAC values achieved at different flow rates.
• To assess the incidence of postoperative sedation, pain, nausea, vomiting and awareness with use of desflurane at 1 and 1.5 L/min
MATERIALS AND METHODS
It was hospital based prospective randomized single blinded comparative study. The study was carried out on the 100 patients of Dr LH Hiranandani Hospital, Powai, Mumbai undergoing laparoscopic abdominal and pelvic surgeries over the period of 1 year (April 2012–2013).
Inclusion Criteria
Patients with ASA 1 and 2 with age of 18–60 years, weight <80 kgs, height 145–165 cms undergoing general anesthe-sia (GA) for abdominal and pelvic laparoscopic surgeries, lasting approximately 60 minutes till 180 minutes, with valid consent were included in the study.
Exclusion Criteria
Patients undergoing emergency surgeries, allergic to anesthetics agents, on medications with hemodynamic effect, pregnant women, with neuromuscular diseases, having epidural analgesia catheter and posted for day care surgeries were excluded out of the study.
The sample size was calculated as per pilot study conducted on 25 patients in each group. Considering significance level (alpha level) of 0.05, assuming the arithmetic mean difference of end tidal concentrations of desflurane in both groups as 0.15 and standard deviation of 0.22, with a power of 95%, 2 sample T test was applied
using Minitab. The sample size calculated was 48 per group. Hence we decided to do 50 patients per group
Methods
After institutional ethics committee approval and written informed consent, 100 patients of either sex posted for various abdominal surgical procedures were included in the study. After reviewing the pre-anesthetic check-up, airway assessment, baseline investigations, the patients were divided into two groups in a randomized manner. Randomization was done by chit system. Chits numbered from 1-100 were kept in opaque envelopes. All the odd numbers were included in group A, i.e., 1 L/min FGF and all even numbers in group B, i.e., 1.5 L/min FGF. For each patient fulfilling the inclusion criteria, one enve-lope was picked and depending upon the odd or even number picked, they were grouped in either groups A or B. Patients, surgeons, and other residents involved in patient assessment and treatment were kept blinded to group assignment.
After checking the consent and confirming the NBM status, patients were wheeled in to operation theatre. They were monitored for heart rate (HR), mean arterial pressure (MAP), peripheral oxygen saturation (SpO2), respiratory rate (RR) and entropy. Patients were premedi-cated with injection glycopyrolate 0.2 mg IV and injection ondansetron 4 mg IV. All the patients were preoxygenated with 100% O2 for 3 min. Each patient was given injection fentanyl 2 mcg/kg with injection midazolam 0.02–0.03 mg/kg IV bolus. GA was induced with inj. propofol 2 mg/kg followed by injection rocuronium 0.6 mg/kg, patients were intubated with cuffed endotracheal tube and connected to closed breathing system. Post intuba-tion FGF was kept at 4 L/min with O2:N2O as 50:50. Desflurane vaporizer was set at 5% in both groups. This initial phase of high FGF lasted till end expiratory con-centration of desflurane is equal to 0.8 × MAC. After this, flow rates were reduced to 1 L/min in group A and to 1.5 L/min in group B. Desflurane dial setting is maintained at 5% throughout the surgery. At the end of surgery, vaporizer was switched off and patient was given 100% O2. The FGF was increased to 4 lit/min.
During intraoperative period, patients were monitored for HR, SBP, DBP, MAP, and SpO2. Inspired and expired concentrations of O2, CO2, N2O and desflurane are noted along with entropy, MAC, tidal volume, minute volume. Time required to achieve entropy of 40–60 and MAC of 0.8 was noted. Time needed to achieve decrease in end expiratory concentration of desflurane (EtDes) by <50% was noted at the end of surgery. Rescue anlgesia is pro-vided with bolus of Inj.Fentanyl 25 mcg IV with increase in HR/BP >20%. Any episode of hypotension was treated
Pharmacokinetics of Desflurane in Clinical Setting: At Two Different Flow Rate
Research & Innovation in Anesthesia, July-December 2018;3(2):41-53 43
RIA
with adequate IV fluids. In case of any hemodynamic instability, case was excluded from the study. The total amount of N2O, desflurane and O2 consumption was noted at the end of surgery which was calculated by the software of the anaesthesia machine. Also, time required for spontaneous eye opening, time required to respond to verbal commands, time to achieve entropy of 80–90 and time for extubation was noted. In presence of pain (VAS >3) in recovery room, patients were given injec-tion paracetamol 1 gm IV. Postoperatively patients were assessed for sedation by Ramsay sedation score (RSS).
Ramsay Sedation Scale
1. Patient is anxious and agitated or restless, or both 2. Patient is cooperative, oriented and tranquil 3. Patient responds to commands only 4. Patient exhibits brisk response to light glabellar tap or
loud auditory stimulus 5. Patient exhibits a sluggish response to light glabellar
tap or loud auditory stimulus 6. Patient exhibits no response
Postoperative incidence of nausea, vomiting and pain was also noted. Pain was assessed by using visual analog pain scale (VAS) where score of zero corresponded with no pain and score of 10 means intense unbearable pain. Intraoperative awareness will be evaluated postoperatively by questioning the patient on the morning after surgery.
Awareness Assessment Questionnaire
• What was the last thing you remembered happening before you went to sleep?
• What was the first thing you remembered happening on waking?
• Did you dream or have any other experiences whilst you were sleep?
• What was the worst thing about your operation?• What was the next worst thing?
OBSERVATIONS AND RESULTS
The study included 100 patients, 50 in each group. No patient was excluded out of the study.
Statistical Analysis
The data was managed in Microsoft excel spreadsheet. Demographics and general information like count, average and percentage for various parameters with all permutations and combinations were calculated in Microsoft excel. Demographics are described with average, standard deviation, median. Analysis of variance (ANOVA) one way was used to investigate the impact of various parameters like pulse, SBP, DBP, MAP, MAC, and inspired and end-tidal concentrations of desflurane, oxygen, nitrous oxide and carbon dioxide. A p value <0.05 was considered statistically significant. Two sample t test was used to observe the effect of groups on the total amount of desflurane, N2O, O2 and fentanyl and the time required for extubation. All statistical analysis was done using Minitab 16.
DEMOGRAPHIC CHARACTERISTIC
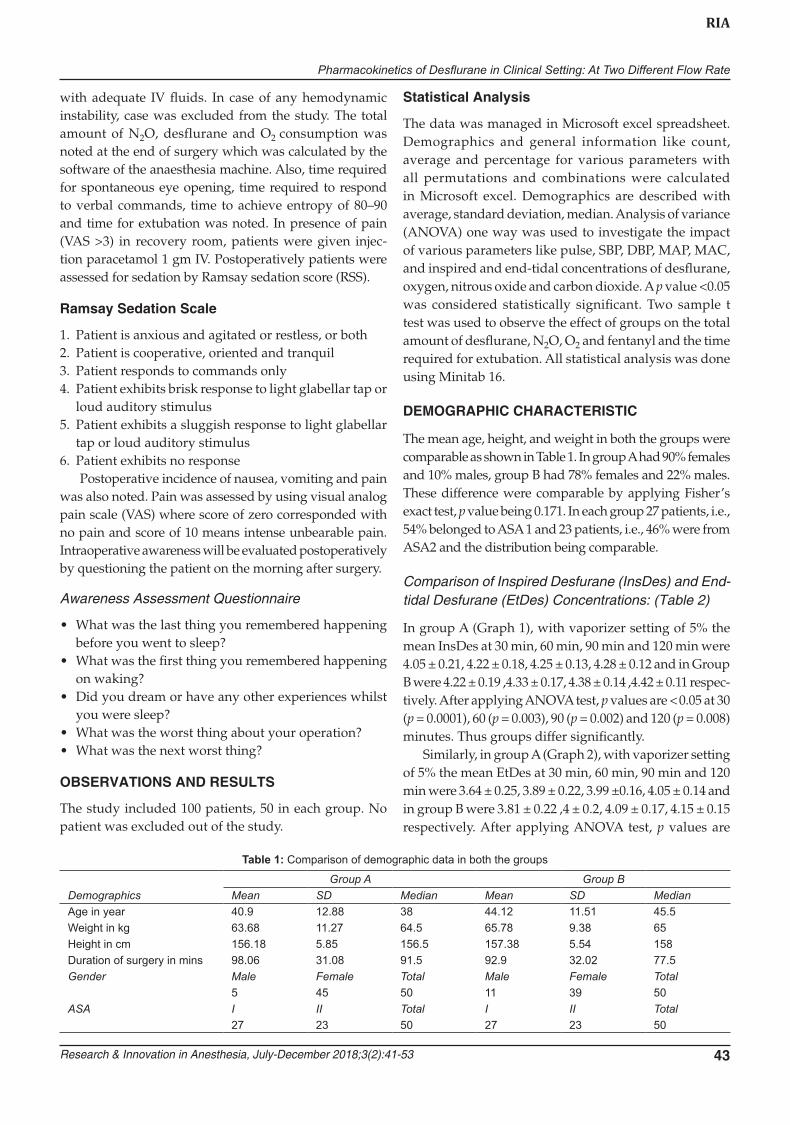
The mean age, height, and weight in both the groups were comparable as shown in Table 1. In group A had 90% females and 10% males, group B had 78% females and 22% males. These difference were comparable by applying Fisher’s exact test, p value being 0.171. In each group 27 patients, i.e., 54% belonged to ASA 1 and 23 patients, i.e., 46% were from ASA2 and the distribution being comparable.
Comparison of Inspired Desfurane (InsDes) and End-tidal Desfurane (EtDes) Concentrations: (Table 2)
In group A (Graph 1), with vaporizer setting of 5% the mean InsDes at 30 min, 60 min, 90 min and 120 min were 4.05 ± 0.21, 4.22 ± 0.18, 4.25 ± 0.13, 4.28 ± 0.12 and in Group B were 4.22 ± 0.19 ,4.33 ± 0.17, 4.38 ± 0.14 ,4.42 ± 0.11 respec-tively. After applying ANOVA test, p values are < 0.05 at 30 (p = 0.0001), 60 (p = 0.003), 90 (p = 0.002) and 120 (p = 0.008) minutes. Thus groups differ significantly.
Similarly, in group A (Graph 2), with vaporizer setting of 5% the mean EtDes at 30 min, 60 min, 90 min and 120 min were 3.64 ± 0.25, 3.89 ± 0.22, 3.99 ±0.16, 4.05 ± 0.14 and in group B were 3.81 ± 0.22 ,4 ± 0.2, 4.09 ± 0.17, 4.15 ± 0.15 respectively. After applying ANOVA test, p values are
Table 1: Comparison of demographic data in both the groups
DemographicsGroup A Group B
Mean SD Median Mean SD MedianAge in year 40.9 12.88 38 44.12 11.51 45.5Weight in kg 63.68 11.27 64.5 65.78 9.38 65Height in cm 156.18 5.85 156.5 157.38 5.54 158Duration of surgery in mins 98.06 31.08 91.5 92.9 32.02 77.5Gender Male Female Total Male Female Total 5 45 50 11 39 50ASA I II Total I II Total 27 23 50 27 23 50

Meenoti P Potdar et al.
44
Graph 1: Inspired desflurane concentrations in two groups
< 0.05 at 30, 60 and 90 minutes (0.0001, 0.011, 0.05, respec-tively), but is > 0.05 (0.09) at 120 minutes. Thus it was found that both the groups differ significantly at 30, 60 and 90 minutes but not at 120 minutes.
Comparison of Difference between Inspired and End-tidal Concentrations of Desflurane
The difference between InDes and EtDes (Table 2) in group A at 30, 60, 90 and 120 min were 0.41, 0.33, 0.26 and 0.23.Same for group B were 0.41, 0.33, 0.29 and 0.27. As per one-way ANOVA test p values at 30, 60 and 90 minutes are 0.822, 0.803, 0.069. At 120 minutes (2 sample T test) p value is 0.54, thus is comparable between both the groups.
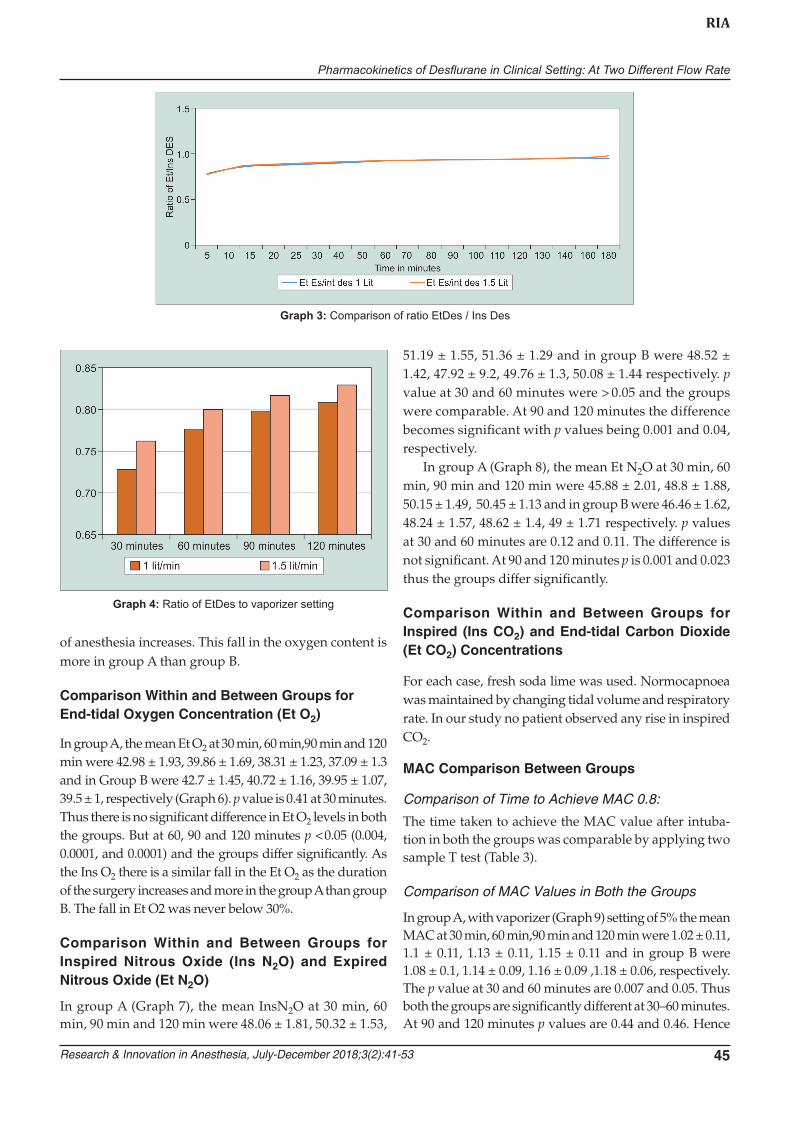
Comparison of Ratio of EtDes/InsDes
Mean value for both the groups is 0.91 at all point times in both the groups is comparable (Graph 3).
Comparison of EtDes at 5% at 30–60–90–120 min between the groups.
Mean values (Graph 4) for group A at 30, 60, 90 and 120 min is 0.7284, 0.7772, 0.7984 and 0.809. For group B, mean values are 0.7628, 0.7992, 0.818, and 0.83, which are comparable.
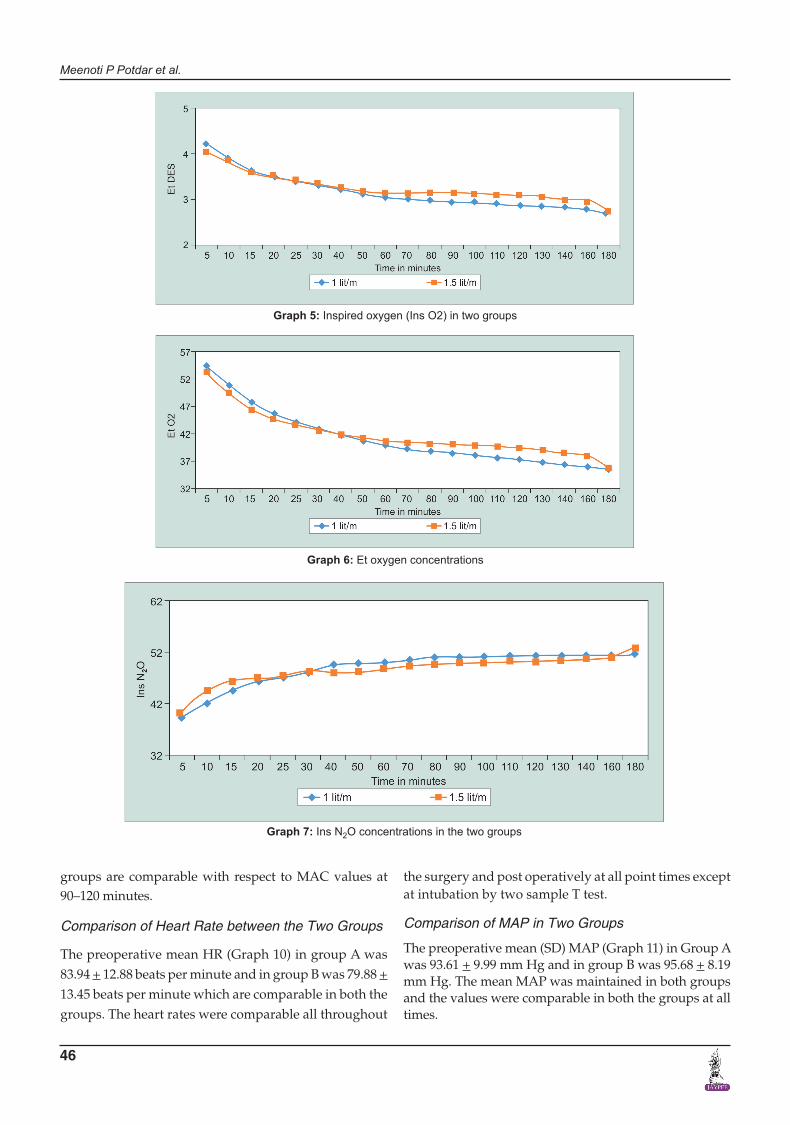
Comparison Within and Between Groups for Inspired Oxygen Concentration (InsO2)
In group A, the mean Ins O2 at 30 min, 60 min,90 min and 120 min were 45.24 ± 1.49, 43 ± 1.21, 41.77 ± 0.99, 40.91 ± 1.14 and in Group B were 45.36 ± 1.03, 43.8 ± 0.99, 43.33 ± 1.15, 43.08 ± 1, respectively (Graph 5). At 30 minutes, p = 0.64 and the groups are comparable. At 60, 90 and 120 minutes p values are < 0.05 (0.0001). Thus groups differ significantly in inspired O2 levels and there is a fall in the inspired oxygen concentration as the duration
Table 2: Difference between inspired and end tidal concentrations of desflurane
FGF
Group A Group B
30 min 60 min 90 min 120 min 30 min 60 min 90 min 120 min
InDes 4.05 ± 0.21 4.22 ± 0.18 4.25 ± 0.13 4.28 ± 0.12 4.22 ± 0.19 4.33 ± 0.17 4.38 ± 0.14 4.42 ± 0.11
EtDes 3.64 ± 0.25 3.89 ± 0.22 3.99 ± 0.16 4.05 ± 0.14 3.81 ± 0.22 4.0 ± 0.2 4.09 ± 0.17 4.15 ± 0.15
InsDes–EtDes 0.41 0.33 0.26 0.23 0.41 0.33 0.29 0.27
Graph 2: End tidal desflurane concentrations in two groups
Pharmacokinetics of Desflurane in Clinical Setting: At Two Different Flow Rate
Research & Innovation in Anesthesia, July-December 2018;3(2):41-53 45
RIA
Graph 3: Comparison of ratio EtDes / Ins Des
Graph 4: Ratio of EtDes to vaporizer setting
of anesthesia increases. This fall in the oxygen content is more in group A than group B.
Comparison Within and Between Groups for End-tidal Oxygen Concentration (Et O2)
In group A, the mean Et O2 at 30 min, 60 min,90 min and 120 min were 42.98 ± 1.93, 39.86 ± 1.69, 38.31 ± 1.23, 37.09 ± 1.3 and in Group B were 42.7 ± 1.45, 40.72 ± 1.16, 39.95 ± 1.07, 39.5 ± 1, respectively (Graph 6). p value is 0.41 at 30 minutes. Thus there is no significant difference in Et O2 levels in both the groups. But at 60, 90 and 120 minutes p < 0.05 (0.004, 0.0001, and 0.0001) and the groups differ significantly. As the Ins O2 there is a similar fall in the Et O2 as the duration of the surgery increases and more in the group A than group B. The fall in Et O2 was never below 30%.
Comparison Within and Between Groups for Inspired Nitrous Oxide (Ins N2O) and Expired Nitrous Oxide (Et N2O)
In group A (Graph 7), the mean InsN2O at 30 min, 60 min, 90 min and 120 min were 48.06 ± 1.81, 50.32 ± 1.53,
51.19 ± 1.55, 51.36 ± 1.29 and in group B were 48.52 ± 1.42, 47.92 ± 9.2, 49.76 ± 1.3, 50.08 ± 1.44 respectively. p value at 30 and 60 minutes were > 0.05 and the groups were comparable. At 90 and 120 minutes the difference becomes significant with p values being 0.001 and 0.04, respectively.
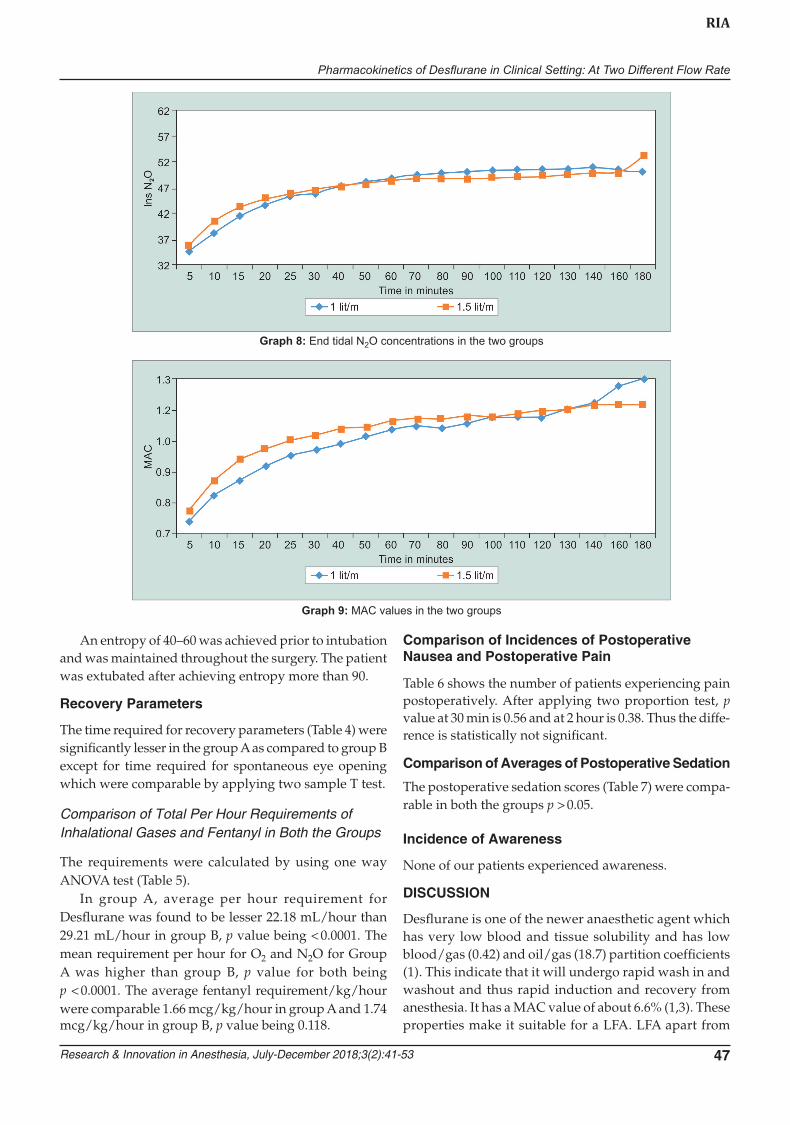
In group A (Graph 8), the mean Et N2O at 30 min, 60 min, 90 min and 120 min were 45.88 ± 2.01, 48.8 ± 1.88, 50.15 ± 1.49, 50.45 ± 1.13 and in group B were 46.46 ± 1.62, 48.24 ± 1.57, 48.62 ± 1.4, 49 ± 1.71 respectively. p values at 30 and 60 minutes are 0.12 and 0.11. The difference is not significant. At 90 and 120 minutes p is 0.001 and 0.023 thus the groups differ significantly.
Comparison Within and Between Groups for Inspired (Ins CO2) and End-tidal Carbon Dioxide (Et CO2) Concentrations
For each case, fresh soda lime was used. Normocapnoea was maintained by changing tidal volume and respiratory rate. In our study no patient observed any rise in inspired CO2.
MAC Comparison Between Groups
Comparison of Time to Achieve MAC 0.8:
The time taken to achieve the MAC value after intuba-tion in both the groups was comparable by applying two sample T test (Table 3).
Comparison of MAC Values in Both the Groups
In group A, with vaporizer (Graph 9) setting of 5% the mean MAC at 30 min, 60 min,90 min and 120 min were 1.02 ± 0.11, 1.1 ± 0.11, 1.13 ± 0.11, 1.15 ± 0.11 and in group B were 1.08 ± 0.1, 1.14 ± 0.09, 1.16 ± 0.09 ,1.18 ± 0.06, respectively. The p value at 30 and 60 minutes are 0.007 and 0.05. Thus both the groups are significantly different at 30–60 minutes. At 90 and 120 minutes p values are 0.44 and 0.46. Hence
Meenoti P Potdar et al.
46
Graph 5: Inspired oxygen (Ins O2) in two groups
Graph 6: Et oxygen concentrations
groups are comparable with respect to MAC values at 90–120 minutes.
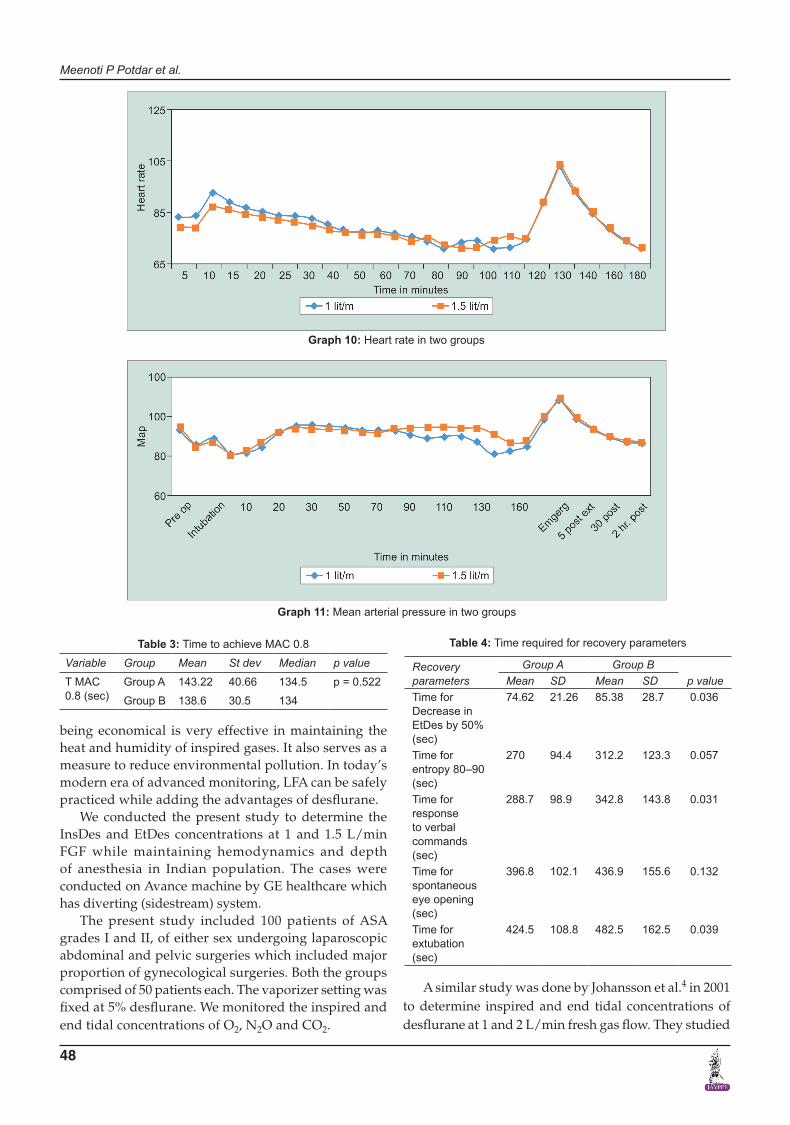
Comparison of Heart Rate between the Two Groups
The preoperative mean HR (Graph 10) in group A was 83.94 + 12.88 beats per minute and in group B was 79.88 + 13.45 beats per minute which are comparable in both the groups. The heart rates were comparable all throughout
the surgery and post operatively at all point times except at intubation by two sample T test.
Comparison of MAP in Two Groups
The preoperative mean (SD) MAP (Graph 11) in Group A was 93.61 + 9.99 mm Hg and in group B was 95.68 + 8.19 mm Hg. The mean MAP was maintained in both groups and the values were comparable in both the groups at all times.
Graph 7: Ins N2O concentrations in the two groups
Pharmacokinetics of Desflurane in Clinical Setting: At Two Different Flow Rate
Research & Innovation in Anesthesia, July-December 2018;3(2):41-53 47
RIA
Graph 8: End tidal N2O concentrations in the two groups
Graph 9: MAC values in the two groups
An entropy of 40–60 was achieved prior to intubation and was maintained throughout the surgery. The patient was extubated after achieving entropy more than 90.
Recovery Parameters
The time required for recovery parameters (Table 4) were significantly lesser in the group A as compared to group B except for time required for spontaneous eye opening which were comparable by applying two sample T test.
Comparison of Total Per Hour Requirements of Inhalational Gases and Fentanyl in Both the Groups
The requirements were calculated by using one way ANOVA test (Table 5).
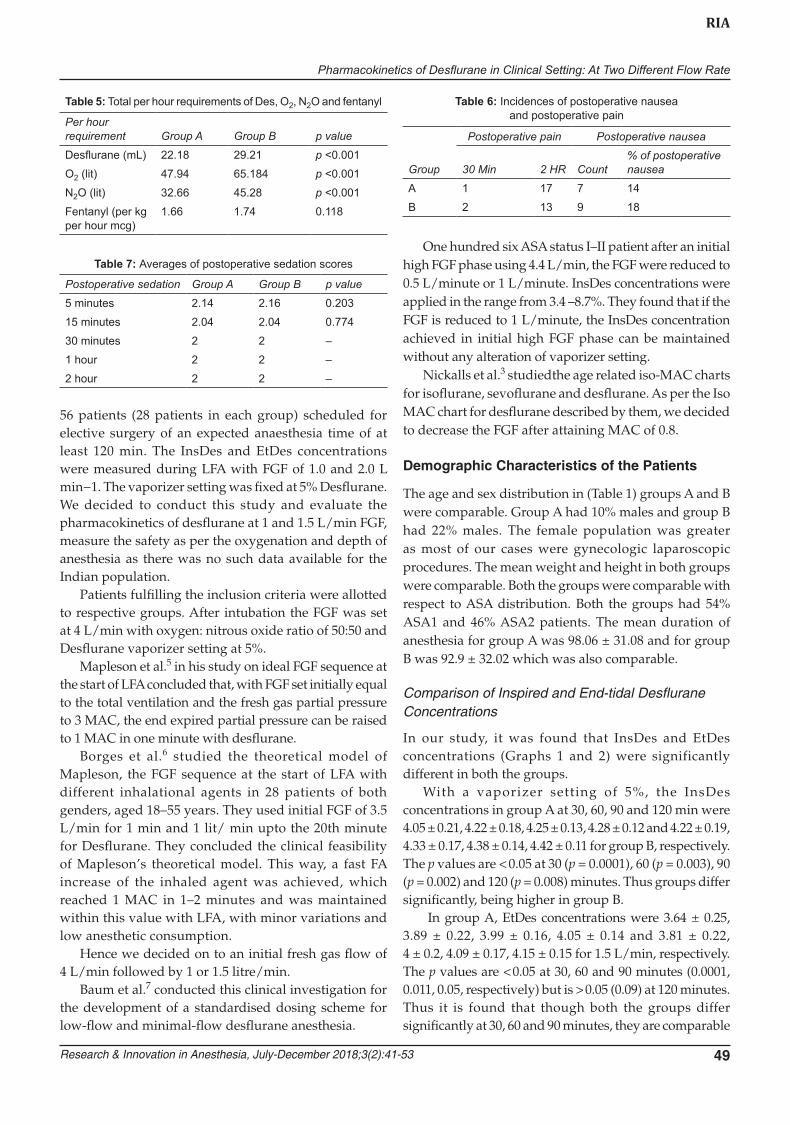
In group A, average per hour requirement for Desflurane was found to be lesser 22.18 mL/hour than 29.21 mL/hour in group B, p value being < 0.0001. The mean requirement per hour for O2 and N2O for Group A was higher than group B, p value for both being p < 0.0001. The average fentanyl requirement/kg/hour were comparable 1.66 mcg/kg/hour in group A and 1.74 mcg/kg/hour in group B, p value being 0.118.
Comparison of Incidences of Postoperative Nausea and Postoperative Pain
Table 6 shows the number of patients experiencing pain postoperatively. After applying two proportion test, p value at 30 min is 0.56 and at 2 hour is 0.38. Thus the diffe- rence is statistically not significant.
Comparison of Averages of Postoperative Sedation
The postoperative sedation scores (Table 7) were compa-rable in both the groups p > 0.05.
Incidence of Awareness
None of our patients experienced awareness.
DISCUSSION
Desflurane is one of the newer anaesthetic agent which has very low blood and tissue solubility and has low blood/gas (0.42) and oil/gas (18.7) partition coefficients (1). This indicate that it will undergo rapid wash in and washout and thus rapid induction and recovery from anesthesia. It has a MAC value of about 6.6% (1,3). These properties make it suitable for a LFA. LFA apart from
Meenoti P Potdar et al.
48
being economical is very effective in maintaining the heat and humidity of inspired gases. It also serves as a measure to reduce environmental pollution. In today’s modern era of advanced monitoring, LFA can be safely practiced while adding the advantages of desflurane.
We conducted the present study to determine the InsDes and EtDes concentrations at 1 and 1.5 L/min FGF while maintaining hemodynamics and depth of anesthesia in Indian population. The cases were conducted on Avance machine by GE healthcare which has diverting (sidestream) system.
The present study included 100 patients of ASA grades I and II, of either sex undergoing laparoscopic abdominal and pelvic surgeries which included major proportion of gynecological surgeries. Both the groups comprised of 50 patients each. The vaporizer setting was fixed at 5% desflurane. We monitored the inspired and end tidal concentrations of O2, N2O and CO2.
Graph 10: Heart rate in two groups
Graph 11: Mean arterial pressure in two groups
Table 3: Time to achieve MAC 0.8
Variable Group Mean St dev Median p value
T MAC 0.8 (sec)
Group A 143.22 40.66 134.5 p = 0.522
Group B 138.6 30.5 134
Table 4: Time required for recovery parameters
Recovery parameters
Group A Group Bp valueMean SD Mean SD
Time for Decrease in EtDes by 50% (sec)
74.62 21.26 85.38 28.7 0.036
Time for entropy 80–90 (sec)
270 94.4 312.2 123.3 0.057
Time for response to verbal commands (sec)
288.7 98.9 342.8 143.8 0.031
Time for spontaneous eye opening (sec)
396.8 102.1 436.9 155.6 0.132
Time for extubation (sec)
424.5 108.8 482.5 162.5 0.039
A similar study was done by Johansson et al.4 in 2001 to determine inspired and end tidal concentrations of desflurane at 1 and 2 L/min fresh gas flow. They studied
Pharmacokinetics of Desflurane in Clinical Setting: At Two Different Flow Rate
Research & Innovation in Anesthesia, July-December 2018;3(2):41-53 49
RIA
56 patients (28 patients in each group) scheduled for elective surgery of an expected anaesthesia time of at least 120 min. The InsDes and EtDes concentrations were measured during LFA with FGF of 1.0 and 2.0 L min−1. The vaporizer setting was fixed at 5% Desflurane. We decided to conduct this study and evaluate the pharmacokinetics of desflurane at 1 and 1.5 L/min FGF, measure the safety as per the oxygenation and depth of anesthesia as there was no such data available for the Indian population.
Patients fulfilling the inclusion criteria were allotted to respective groups. After intubation the FGF was set at 4 L/min with oxygen: nitrous oxide ratio of 50:50 and Desflurane vaporizer setting at 5%.
Mapleson et al.5 in his study on ideal FGF sequence at the start of LFA concluded that, with FGF set initially equal to the total ventilation and the fresh gas partial pressure to 3 MAC, the end expired partial pressure can be raised to 1 MAC in one minute with desflurane.
Borges et al.6 studied the theoretical model of Mapleson, the FGF sequence at the start of LFA with different inhalational agents in 28 patients of both genders, aged 18–55 years. They used initial FGF of 3.5 L/min for 1 min and 1 lit/ min upto the 20th minute for Desflurane. They concluded the clinical feasibility of Mapleson’s theoretical model. This way, a fast FA increase of the inhaled agent was achieved, which reached 1 MAC in 1–2 minutes and was maintained within this value with LFA, with minor variations and low anesthetic consumption.
Hence we decided on to an initial fresh gas flow of 4 L/min followed by 1 or 1.5 litre/min.
Baum et al.7 conducted this clinical investigation for the development of a standardised dosing scheme for low-flow and minimal-flow desflurane anesthesia.
One hundred six ASA status I–II patient after an initial high FGF phase using 4.4 L/min, the FGF were reduced to 0.5 L/minute or 1 L/minute. InsDes concentrations were applied in the range from 3.4 –8.7%. They found that if the FGF is reduced to 1 L/minute, the InsDes concentration achieved in initial high FGF phase can be maintained without any alteration of vaporizer setting.
Nickalls et al.3 studiedthe age related iso-MAC charts for isoflurane, sevoflurane and desflurane. As per the Iso MAC chart for desflurane described by them, we decided to decrease the FGF after attaining MAC of 0.8.
Demographic Characteristics of the Patients
The age and sex distribution in (Table 1) groups A and B were comparable. Group A had 10% males and group B had 22% males. The female population was greater as most of our cases were gynecologic laparoscopic procedures. The mean weight and height in both groups were comparable. Both the groups were comparable with respect to ASA distribution. Both the groups had 54% ASA1 and 46% ASA2 patients. The mean duration of anesthesia for group A was 98.06 ± 31.08 and for group B was 92.9 ± 32.02 which was also comparable.
Comparison of Inspired and End-tidal Desflurane Concentrations
In our study, it was found that InsDes and EtDes concentrations (Graphs 1 and 2) were significantly different in both the groups.
With a vaporizer setting of 5%, the InsDes concentrations in group A at 30, 60, 90 and 120 min were 4.05 ± 0.21, 4.22 ± 0.18, 4.25 ± 0.13, 4.28 ± 0.12 and 4.22 ± 0.19, 4.33 ± 0.17, 4.38 ± 0.14, 4.42 ± 0.11 for group B, respectively. The p values are < 0.05 at 30 (p = 0.0001), 60 (p = 0.003), 90 (p = 0.002) and 120 (p = 0.008) minutes. Thus groups differ significantly, being higher in group B.
In group A, EtDes concentrations were 3.64 ± 0.25, 3.89 ± 0.22, 3.99 ± 0.16, 4.05 ± 0.14 and 3.81 ± 0.22, 4 ± 0.2, 4.09 ± 0.17, 4.15 ± 0.15 for 1.5 L/min, respectively. The p values are < 0.05 at 30, 60 and 90 minutes (0.0001, 0.011, 0.05, respectively) but is > 0.05 (0.09) at 120 minutes. Thus it is found that though both the groups differ significantly at 30, 60 and 90 minutes, they are comparable
Table 5: Total per hour requirements of Des, O2, N2O and fentanyl
Per hour requirement Group A Group B p value
Desflurane (mL) 22.18 29.21 p <0.001
O2 (lit) 47.94 65.184 p <0.001
N2O (lit) 32.66 45.28 p <0.001
Fentanyl (per kg per hour mcg)
1.66 1.74 0.118
Table 6: Incidences of postoperative nausea and postoperative pain
Group
Postoperative pain Postoperative nausea
30 Min 2 HR Count% of postoperative nausea
A 1 17 7 14
B 2 13 9 18
Table 7: Averages of postoperative sedation scores
Postoperative sedation Group A Group B p value
5 minutes 2.14 2.16 0.203
15 minutes 2.04 2.04 0.774
30 minutes 2 2 –
1 hour 2 2 –
2 hour 2 2 –
Meenoti P Potdar et al.
50
at 120 minutes which means that as time increases there is equilibrium achieved between InsDes and EtDes concentrations.
As per Johansson et al.,4 with a vaporizer setting of 5%, the InsDes and EtDes concentrations in the 1.0 L/ min group after 120 min were 4.54% vs. 4.37%. In the 2.0 L/min group, the InsDes and EtDes concentrations were 4.76% vs. 4.58%. p was <0.001 for both the groups.
Comparison of Difference between InsDesflurane and End-tidal Desurane and End-tidal to Inspired Concentration Ratio
The differences in the InsDes and EtDes concentration (Table 2) and the ratio of EtDes concentration to InsDes concentration (Graph 3) represent the degree of uptake and saturation of desflurane with a fixed inspired con-centration. In the present study, with dial concentration of 5% the difference between InsDes and EtDes in group A at 30, 60, 90 and 120 min were 0.41, 0.33, 0.26 and 0.23.Same for group B were 0.41, 0.33, 0.29 and 0.27. The dif-ference in two groups is not found to be significant at 120 minutes (p = 0.54). The difference goes on decreasing with increasing level of saturation.
Johansson et al.4 found that the estimated difference between inspired and end-tidal values, at 120 min of anaesthesia, were 0.17% in the 1.0 L/minute group as compared to 0.18% in the 2.0 L/minute group which was not significant.
On calculation of the mean end tidal/ inspired con-centration ratio, it was found to be 0.91 in both group A and group B in our patients. The EtDes/InsDes con-centration ratio increased from 0.78 in both groups at 5 mins to 0.95 in group A and 0.98 in group B, the values being comparable. It means as the duration of anaesthesia progresses the equilibrium is achieved.
While Johansson et al.4 found that in their study population, ratio of end-tidal/inspired concentration was 0.96 in both groups. Jones et al.8 also conducted a similar study where the ratio was 0.82.Yasuda et al.9 found that ratio of inspired to end tidal concentrations for Desflurane increases more rapidly than for isoflurane and halothane. At 30 minute it was 0.9 ± 0.01.
Comparison of Ratio of End-tidal Concentration/Vaporizer Setting
We found that mean values for ratio of EtDes concentration to vaporizer setting at 5% (Graph 4) in group A at 30 min was 0.7284 and 0.81 at 180 minutes. For group B, the ratios at 30 mins was 0.7628 and 0.86 at 180 mins, the difference between both the groups was not significant. It was observed that the ratio is increasing with increasing duration of anesthesia. This indicates that saturation
level goes on increasing with time and by increasing the fresh gas flow from 1–1.5 litres the increase in end tidal concentration is just 0.05 after 180 mins.
Johansson et al.4 found that at 120 min the ratio end-tidal concentration/vaporizer setting was 0.87 in the 1.0 L/min group vs. 0.92 in the 2.0 L/minute group.
Thus it was found that, though there was a significant difference between InsDes and EtDes concentrations at 1 and 1.5 L/minute FGF, the ratio of InsDes to EtDes was same in both the groups. Similarly Johansson et al.4 found that there was a significant difference between 1.0 and 2.0 L/minute for InsDes and EtDes but not for the ratio of inspired to end tidal concentration.
Comparison of Inspired and End Tidal Oxygen Concentrations
We found that there was a significant difference in InsO2
(Graph 5) as well as EtO2 (Graph 6) concentrations in both the groups. For InsO2 concentration at 30 minutes, p value was 0.64 and the groups are comparable. At 60, 90 and 120 minutes p values are < 0.05 (0.0001). Thus groups differ significantly in InsO2 levels.
Inspite of this significant decrease in inspired concentrations of O2, the mean values in Group A at 30 min, 60 min,90 min and 120 min were 45.24 ± 1.49, 43 ± 1.21, 41.77 ± 0.99, 40.91 ± 1.14 and in Group B were 45.36 ± 1.03, 43.8 ± 0.99, 43.33 ± 1.15, 43.08 ± 1 respectively.
In group A, the mean EtO2 concentration at 30 min, 60 min, 90 min and 120 min were 42.98 ± 1.93, 39.86 ± 1.69, 38.31 ±1.23 ,37.09 ± 1.3 and in group B were 42.7 ± 1.45, 40.72 ± 1.16, 39.95 ± 1.07, 39.5 ± 1, respectively. p value is 0.41 at 30 minutes. Thus there is no significant difference in end tidal oxygen levels in both the groups. But at 60, 90 and 120 minutes p < 0.05 (0.004, 0.0001 and 0.0001) and the groups differ significantly. Inspite of this significant difference in inspired and end-tidal oxygen concentrations, adequately safe levels oxygen concentrations were maintained during the anesthesia.
Comparison of Inspired and End-tidal Nitrous Oxide Concentrations
It was found that InsN2O (Graph 7) varies with respect to time in both the groups but when we compare the InsN2O in both the groups, it was found that the mean InsN2O concentration in group A at 30 min, 60 min, 90 min and 120 min were 48.06 ± 1.81, 50.32 ± 1.53, 51.19 ± 1.55, 51.36 ± 1.29 and in group B were 48.52 ± 1.42, 47.92 ± 9.2, 49.76 ± 1.3, 50.08 ± 1.44 respectively. p values at 30 and 60 minutes are > 0.05 and the groups are comparable. At 90 and 120 minutes the difference becomes significant with p values being 0.001 and 0.04, respectively.
Pharmacokinetics of Desflurane in Clinical Setting: At Two Different Flow Rate
Research & Innovation in Anesthesia, July-December 2018;3(2):41-53 51
RIA
Similarly, in group A, the mean EtN2O concentration (Graph 8) at 30 min, 60 min, 90 min and 120 min were 45.88 ± 2.01, 48.8 ± 1.88, 50.15 ± 1.49 ,50.45 ± 1.13 and in group B were 46.46 ± 1.62, 48.24 ± 1.57, 48.62 ± 1.4, 49 ± 1.71 respectively. p values at 30 and 60 minutes are 0.12 and 0.11. The difference is not significant. At 90 and 120 minutes p value is 0.001 and 0.023 respectively, thus the groups differ significantly.
Yasuda et al.9 found that the mean value for ratio of end tidal to inspired concentration of N2O at 30 min was 0.99 ± 0.01.
Comparison of Inspired and End-tidal Carbon Dioxide Concentrations
For each case, fresh soda lime was used. Normocapnoea was maintained by changing tidal volume and respiratory rate. In our study no patient observed any rise in inspired CO2. Et CO2 values for two groups were comparable.
Comparison of MAC
We assessed the time required to achieve MAC of 0.8 (Table 3) was 143.22 ± 40.66 seconds after starting Desflurane in group A and 138.6 ± 30.5 seconds in group B. As p = 0.522, there is no significant difference between the groups. Borges et al.7 foundthat in seven patients studied for EtDes con-centrations reached 0.94 MAC in 1 minute and varied from 1.07–1.14 until the 20th min. Quenet et al.10 found that they could achieve EtDes concentrations required to get 1 MAC within 2.1 ± 0.9 min with low FGF (1 litre) with delivered concentration at maximal value on vaporizer and then set to 20% above target end tidal value.
In group A, with vaporizer setting of 5% (Graph 9), the mean MAC at 30 min, 60 min,90 min and 120 min were 1.02 ± 0.11, 1.1 ± 0.11, 1.13 ± 0.11,1.15 ± 0.11 and in group B were 1.08 ± 0.1, 1.14 ± 0.09, 1.16 ± 0.09, 1.18 ± 0.06, respectively. p values at 30 and 60 minutes are 0.007 and 0.05 .Thus groups are statistically significantly till 60 minutes. It means as the duration of anesthesia increases at different flow rates, MAC values become comparable as saturation is achieved.
Hemodynamic Parameters
Heart Rate
The mean preoperative HR (Graph 10) in group A was 83.94 ± 12.88 per minute and in group B was 79.88 ± 13.45 per minute, p = 0.13. Thus the two groups were compara-ble. The HR were comparable at all time points during the surgery, during emergence and post operatively except during the time of intubation.
At the time of intubation mean HR in group A was 94 ± 11.74 per minute and in group B was 88.54 ± 14.48 beats per minute p = 0.04. Thus the difference was significant.
Blood Pressure
The preoperative mean SBP (Graph 11) in group A was 129.84 ± 15.47 mm Hg and in group B was 130.68 ± 12.87 mm Hg. p value was 0.77. The preoperative mean DBP in group A was 75.5 ± 8.27 mm Hg and in group B was 78.18 ± 7.3 mm Hg, p value being 0.09). The mean MAP in group A was 93.61 ± 9.99 mm Hg and in group B was 95.68 ± 8.19 mm Hg, p value 0.26. The mean SBP, DBP and MAP were comparable at all time points during the surgery, during emergence and postoperatively.
The higher values were found at the time of induction, intubation, emergence and extubation. There is also a rise in MAP values around 20 mins of starting Desflurane which coincides with CO2 insufflations.
Additional doses of 25 mcg of fentanyl were administered if MAP increased more than 20% of baseline and a similar decrease in pressure was set to be treated with iv fluids and then Inj ephedrine though none of our patients required ephedrine.
Xie et al.11 compared the hemodynamic effects during low flow anesthesia with Desflurane, sevoflurane and Enflurane. They found that desflurane caused least cardiovascular depression with MAP maintained significantly better than other two agents and HR was stabilized earlier post incision.
Comparison of Entropy in Both the Groups
Entropy levels were monitored in each patient to ensure the depth of anesthesia. The entropy was maintained between 40–60 all throughout the surgery.
Comparison of Time Required for Decrease in EtDes by 50%
The mean time required for decrease in EtDes by 50% (Table 4) in group A was 74.62 ± 21.26 seconds as compared to 85.38 ± 28.7 seconds in group B. These values are found to be statistically significant (p = 0.036).
Jones et al.8 studied desflurane for induction and recovery time in 10 ASA 1 patients. As per him, 10 min after discontinuing administration of desflurane , the end tidal concentration relative to the last concentration during administration of anaesthetic was 0.11 and alve- olar concentrations (determined by end tidal concentra-tion) decreased by 90% after 10–15 min of wash out.
Ghouri et al.12 studied the recovery profile of desflurane which shows that time required for the end-tidal concentra-tion to decrease by 50% was 2.5 ± 0.8 minute.
Comparison of Time to Achieve Entropy of 80–90
The mean time required for entropy to reach 80–90 after stopping desflurane was 270 ± 94.4 sec for group A and 312.2 ± 123.3 seconds for group B which was statistically
Meenoti P Potdar et al.
52
comparable p value being 0.057. It signifies that the time at which patient became arousable were similar in both the groups.
Comparison of Time Required for Recovery After Stopping Desflurane
The mean time required for response to verbal commands was found to be 288.7 ± 98.9 sec in group A as compared to 342.8 ± 143.8 seconds for group B. This difference was statistically significant (p = 0.031). Jones et al.8 found in their study that volunteers responded to commands at an average of 2.7 min after discontinuing anesthetic admin-istration. Ghouri et al.12 found that time for awakening and ability to follow simple commands were significantly shorter for desflurane than for isoflurane. For desflurane average time was 5.1 ± 2.4 and 6.5 ± 2.3 minutes.
The mean time required for spontaneous eye opening was 396.8 ± 102.1 and 436.9 ± 155.6 seconds for group A and group B, respectively and the difference was not significant (p = 0.132).
The mean time for extubation was 424.5 ± 108.8 seconds for group A and 482.5 ± 162.5 seconds for group B and the difference was statistically significant with p value being 0.039.
Comparison of Total Desflurane, Oxygen and Nitrous Oxide Requirement
The mean total desflurane per hour requirement was 22.18 mL for group A and 29.21 mL for group B. This difference was statistically significant (p ≤0.0001). and thus requirement of desflurane is significantly reduced with 1 liter flow rate. Quenet et al.10 observed that volatile consumption was reduced by 75% in low fresh gas flows.
The mean nitrous oxide requirement per hour was 32.66 litre/hour for group A and 45.28 litre/hour for group B. This difference was statistically significant (p ≤ 0.0001).
The mean oxygen requirement per hour was 47.94 lit for group A and 65.184 lit for group B. This difference was statistically significant (p ≤ 0.0001).
Comparison of Total Fentanyl per Hour per kilogram Requirement in Both the Groups
The mean fentanyl requirement per kg per hour (Table 5) was 1.66 mcg for group A and 1.74 mcg for group B. This difference was statistically not significant (p = 0.118).
Comparison of Postoperative Pain in both Groups
It was assessed as per visual analogue scale from 0–10 where 0 being no pain at all and 10 being the intense unbearable pain. At 30 min postoperatively (Table 7), in group A 2% patients experienced pain, and 4% in
group B. The difference was statistically not significant (p = 0.56). At 120 min postoperatively, in group A 34% patients experienced pain and 26% in group B. The dif-ference was statistically not significant (p = 0.38).
Ghouri et al.12 observed that patients receiving Desflurane experienced significantly less discomfort as compared to isoflurane.
Comparison of Postoperative Nausea and Sedation
In group A 14% patients and in group B 18% patients experienced nausea (Table 6) and the differences are comparable (p = 0.38)
The postoperative sedation was assessed by Ramsay sedation score (Table 6). The differences in postoperative sedation levels were not significant. Ghouri et al.12 also found that desflurane is associated with less postopera-tive drowsiness, fatigue, clumsiness and confusion.
Comparison of Awareness in Both Groups
None of the patients experienced awareness during anesthesia. They were questioned regarding awareness on the morning after the surgery.
CLINICAL SIGNIFICANCE
Desflurane can be used efficiently at lower rates with the advantage of reducing the cost and not jeopardising the safety as per the oxygenation, haemodynamic stability and depth of anesthesia.
CONCLUSION
After conducting this study, we conclude that pharmacokinetics of desflurane favour the use of low flow anesthesia. Safe administration of low flow anesthesia can be ensured by current practice of anesthesia and integrated monitoring with continuous and comprehensive analysis of inspiratory and expiratory gases. Conducting anesthesia at a FGF 1 L/min was equally safe and there was no added advantage of using 1.5 L/min FGF. In today’s modern era low flow anesthesia can be safely practiced and reduces the cost and environmental pollution.
REFERENCES
1. Stoelting RK, Hillier SC. Pharmacology & Physiology in Anaesthesia Practice. 4th edition. Philadelphia: Lippincott Williams & Wilkins; 2006. Chapter 2, Inhaled Anesthetics, 42-82.
2. Editorial: Desflurane- the dawn of new era? Can J Anaesth1991; 38: 954-957.
3. Nickalls RW, Mapleson WW. Age-related iso-MAC charts for isoflurane, sevoflurane and Desflurane in man. Br J Anaesth. 2003;91:170-174.
Pharmacokinetics of Desflurane in Clinical Setting: At Two Different Flow Rate
Research & Innovation in Anesthesia, July-December 2018;3(2):41-53 53
RIA
4. Johansson A, Lundberg D, Luttropp HH. Low flow anaesthe-sia with Desflurane: Kinetics during clinical procedures. Eur J Anaesthesiol 2001;18:499-504.
5. Mapleson WW. The theoretical ideal fresh gas flow sequence at the start of low flow anaesthesia. Anaesthesia 1998;53:264-272.
6. Borges MM, Saraiva RA. Fresh-gas flow sequence at the start of low-flow anesthesia: clinical application of Maplesons theoretical study. Rev Bras Anestesiol 2002;52:146-155.
7. Baum J, Berghoff M, Stanke HG, et al. Low-flow anesthesia with Desflurane. Anaesthesist 1997;46:287-293.
8. Jones RM, Cashman JN, Eger EI. II, et al. Kinetics and potency of Desflurane in volunteers. Anesth Analg 1990;70:3-7.
9. Yasuda N, Lockhart SH, Weiskopf RB, et al. Kinetics of desflurane, isoflurane, and halothane in humans. Anesthesiology 1991;74:489-498.
10. Quénet E, Weil G. Which settings to optimize anaesthetics delivery: fresh gas flow or delivered fraction? Ann Fr Anesth Reanim 2008;27:900-908.
11. Xie G. Clinical study of Desflurane on low flow anesthesia compared with sevoflurane and Enflurane. Chin Med J (Engl) 1997;110:707-710.
12. Ghouri AF, Bodner M, White PF. Recovery profile after Desflurane-nitrous oxide versus isoflurane-nitrous oxide in outpatients. Anesthesiology 1991;74:419-424.