Embed Size (px)
Citation preview

DMD#84897
1
Title page
Pharmacokinetics, Metabolism, and Excretion of [14C]Esaxerenone, a Novel Mineralocorticoid
Receptor Blocker in Humans
Makiko Yamada, Jeanne Mendell, Hideo Takakusa, Takako Shimizu, Osamu Ando
Drug Metabolism and Pharmacokinetics Research Laboratories (M.Y., H.S., O.A.) and Clinical
Pharmacology Department (T.S.), Daiichi Sankyo Co., Ltd., Tokyo, Japan; and Daiichi Sankyo Pharma
Development, Basking Ridge, NJ, USA (J.M.)
This article has not been copyedited and formatted. The final version may differ from this version.DMD Fast Forward. Published on December 12, 2018 as DOI: 10.1124/dmd.118.084897
at ASPE
T Journals on June 1, 2020
dmd.aspetjournals.org
Dow
nloaded from

DMD#84897
2
Running title page
Running title: Esaxerenone ADME in Humans and In Vitro
*Corresponding author: Makiko Yamada, Drug Metabolism and Pharmacokinetics Research Laboratories,
Daiichi Sankyo Co., Ltd., 1-2-58, Hiromachi, Shinagawa-ku, Tokyo 140-8710, Japan. Phone:
+81-3-3492-3131; Fax: +81-3-5436-8567. E-mail: [email protected]
Number of text pages: 25
Number of tables: 3
Number of figures: 7
Number of references: 27
Number of words in the Abstract: 250
Number of words in the Introduction: 747
Number of words in the Discussion: 1494
Abbreviations: AUC, area under the blood or plasma concentration-time curve; BCRP, breast cancer resistance
protein; CLt, total body clearance; CL/F, apparent total body clearance; CYP, cytochrome P450; DDI,
drug-drug interaction; LC-MS/MS, liquid chromatography-tandem mass spectrometry; HPLC,
high-performance liquid chromatography; P450, cytochrome P450; P-gp, P-glycoprotein; t1/2, elimination
half-life in the terminal phase; Tmax, time to reach the maximum plasma concentration; UGT,
UDP-glucuronosyltransferase; and Vz/F, apparent volume of distribution based on the terminal phase.
This article has not been copyedited and formatted. The final version may differ from this version.DMD Fast Forward. Published on December 12, 2018 as DOI: 10.1124/dmd.118.084897
at ASPE
T Journals on June 1, 2020
dmd.aspetjournals.org
Dow
nloaded from

DMD#84897
3
Abstract
Esaxerenone (CS-3150) is a novel, non-steroidal, selective mineralocorticoid receptor blocker. The absorption,
metabolism, distribution, and excretion (ADME) of esaxerenone were assessed in in vitro studies and in a
clinical study, where [14C]esaxerenone (150 μCi/20 mg) was administered orally to six healthy male subjects.
The plasma concentrations of esaxerenone and its metabolites, M4, M11, and M1, were measured using
LC-MS/MS. The recovery of radioactivity was 92.5%, with 38.5% and 54.0% excreted in the urine and feces,
respectively. The half-life of radioactivity in blood and plasma was approximately 30 h, similar to that of the
unchanged form in plasma. The blood-to-plasma ratio was 0.69, demonstrating low partitioning to blood
components. In plasma, esaxerenone was the most abundant moiety (40.8%), followed by O-glucuronide
(21.4%; M4), acyl-glucuronide of amide-bond hydrolysate (8.0%; M11) and the deshydroxyethyl form (1.7%;
M1). In vitro studies showed that esaxerenone was a substrate of CYP3A and multiple UGT isoforms.
Oxidation contributed approximately 30% to its clearance, as indicated by the excretion ratio of oxidized
metabolites into urine and feces. Caco-2 studies showed that esaxerenone was a substrate of P-gp and BCRP;
however, the excretion ratio of the unchanged form in the feces and urine was 18.5% and 1.6%, respectively,
indicating that these transporters were not important for the absorption and elimination of esaxerenone. Low
urinary excretion of esaxerenone suggested that the plasma exposure of esaxerenone was not affected by renal
dysfunction. Multiple elimination pathways, including oxidation, glucuronidation, and hydrolysis, and the low
contribution of transporters, indicated limited drug-drug interaction potential.
Introduction
Mineralocorticoid receptors (MR) that are present in the epithelial cells of the distal tubule and collecting duct
in the kidney have been reported to play a role in the regulation of electrolyte homeostasis, body fluids, and
blood pressure via activation by aldosterone (Funder, 1996). In addition, MRs have been reported to be
expressed in non-epithelial tissues such as podocytes (Shibata et al., 2007), mesangial cells (Nishiyama et al.,
This article has not been copyedited and formatted. The final version may differ from this version.DMD Fast Forward. Published on December 12, 2018 as DOI: 10.1124/dmd.118.084897
at ASPE
T Journals on June 1, 2020
dmd.aspetjournals.org
Dow
nloaded from

DMD#84897
4
2005), fibroblasts (Nagai et al., 2005), and the heart (Lombès et al., 1995). Excessive MR activation by
endogenous ligands (e.g., aldosterone) is involved in the pathogenesis of renal disorders, which may be caused
by direct enhancement of fibrosis (Brem et al., 2011), inflammation (Siragy and Xue, 2008), and oxidative
stress (Patni et al., 2007). Multiple clinical studies using steroidal MR blockers, such as spironolactone and
eplerenone, have shown that MR blockade is a favorable strategy for the treatment of hypertension (Saruta et
al., 2004), heart failure (Pitt et al., 1999, 2003), and chronic kidney disease (Rossing et al., 2005; Epstein et al.,
2006). However, the clinical use of existing MR antagonists is limited by their safety and efficacy profiles
(Rose et al., 1977; Weinberger et al., 2002).
Esaxerenone (CS-3150) is a novel, non-steroidal, selective MR blocker. An in vitro study showed that
esaxerenone inhibited the binding of aldosterone to the MR, with no agonistic or antagonistic effects on
glucocorticoid, androgen, or progesterone receptors, even at high concentrations (Arai et al., 2015a). In
pharmacology studies using rat models, esaxerenone was demonstrated to have potent and long-lasting
antihypertensive and cardio-renal protective effects (Arai et al., 2015a; Arai et al., 2015b; Arai et al., 2016). In
clinical studies, esaxerenone dose-dependently reduced blood pressure in patients with hypertension
(submitted for publication); further, the reduction of urinary albumin in patients with type 2 diabetes with
microalbuminuria underscores its renal protective effects (submitted for publication). In pharmacokinetic
studies, the absolute oral bioavailability of esaxerenone was high in rats and monkeys (Yamada et al., 2017).
The half-life (t1/2) of esaxerenone in plasma is longer than that of spironolactone and eplerenone in rats, and is
considered to contribute to its long-lasting pharmacological effects. In rats, orally administered
[14C]esaxerenone was distributed widely to tissues, with the exception of a low distribution to the central
nervous system (Yamada et al., 2017). After the oral administration of [14C]esaxerenone, the major elimination
pathway was oxidation in rats, and oxidation and glucuronidation in monkeys, and the radioactivity was
excreted mainly in the feces (Yamada et al., 2017). In Phase 1 studies, the exposure of esaxerenone after single
(5 to 200 mg/day) and multiple (10 to 100 mg/day) doses was generally proportional to the dose (Kato et al.,
This article has not been copyedited and formatted. The final version may differ from this version.DMD Fast Forward. Published on December 12, 2018 as DOI: 10.1124/dmd.118.084897
at ASPE
T Journals on June 1, 2020
dmd.aspetjournals.org
Dow
nloaded from

DMD#84897
5
2018). The time to reach the maximum plasma concentration (Tmax) and t1/2 after single oral administration
were approximately 3 h and 20 h, respectively, and did not change across dose levels (Kato et al., 2018). The
t1/2 appears to be suitable for once-daily dosing because efficacy is expected to be sustained throughout the day.
The total apparent clearance of drug and apparent volume of distribution also remained constant, regardless of
dose. The exposure to esaxerenone in the multiple-dose treatment was greater on Day 10 than on Day 1, and
the accumulation ratio was in the range 1.36–1.98 (Kato et al., 2018).
Absorption, distribution, metabolism, and excretion (ADME) studies are an essential part of drug development
as the ADME properties of a drug candidate are associated with its efficacy and safety. The use of radioactive
tracers in ADME studies, such as 14C-labeled compounds, enables us to determine the major metabolic and
excretory routes of elimination of a drug candidate. Such information is necessary to determine the drug-drug
interaction (DDI) potential and the influence of renal or hepatic dysfunction. The guidance on metabolites in
safety testing (MIST guidance) from the Food and Drug Administration (FDA) states that the exposure of
metabolites should be determined to evaluate the necessity of additional safety assessment of metabolites
(FDA, 2016). Owing to the evolution of analytical techniques, in most cases, metabolites in plasma can be
detected without using labeled compounds. However, to prove that no metabolite that requires evaluation has
been overlooked, studies using radiolabeled compounds are still necessary. In this study, [14C]esaxerenone was
administered to healthy male subjects and the pharmacokinetics, metabolism, and excretion were evaluated. In
addition, the enzymes involved in the metabolism, cytochrome P450 (P450) and UDP-glucuronosyltransferase
(UGT), and the transporters involved in the absorption of esaxerenone, P-glycoprotein (P-gp) and breast
cancer resistance protein (BCRP), were evaluated.
Materials and Methods
Compounds and Reagents
[14C]esaxerenone,
This article has not been copyedited and formatted. The final version may differ from this version.DMD Fast Forward. Published on December 12, 2018 as DOI: 10.1124/dmd.118.084897
at ASPE
T Journals on June 1, 2020
dmd.aspetjournals.org
Dow
nloaded from
DMD#84897
6
(5P)-1-(2-hydroxyethyl)-N-[4-(methanesulfonyl)phenyl]-4-methyl-5-[2-(trifluoromethyl)phenyl]-[4-14C]-1H-
pyrrole-3-carboxamide was supplied by ABC Laboratories Inc. (Columbia, MO); the structure is shown in
Figure 1. Non-radiolabeled esaxerenone, ((S)-1-(2-hydroxyethyl)-4-methyl-N-[4-(methylsulfonyl)
phenyl]-5-[2-(trifluoromethyl) phenyl]-1H-pyrrole-3-carboxamide) and deuterium-labeled esaxerenone
(Figure 1) were synthesized at Daiichi Sankyo (Tokyo, Japan). The metabolites of esaxerenone,
4-methyl-N-[4-(methylsulfonyl)phenyl]-5-[2-(trifluoromethyl)phenyl]-1H-pyrrole-3-carboxamide (M1),
(S)-(3-methyl-4-{[4-(methylsulfonyl)phenyl]carbamoyl}-2-[2-(trifluoromethyl)phenyl]-1H-pyrrol-1-yl)acetic
acid (M2),
(S)-1-(2-hydroxyethyl)-4-(hydroxymethyl)-N-[4-(methylsulfonyl)phenyl]-5-[2-(trifluoromethyl)phenyl]-1H-p
yrrole-3-carboxamide (M3),
2-[(S)-(3-methyl-4-{[4-(methylsulfonyl)phenyl]carbamoyl}-2-[2-(trifluoromethyl)phenyl]-1H-pyrrol-1-yl)]eth
yl β-D-glucopyranosiduronic acid (M4),
((S)-3-(hydroxymethyl)-4-{[4-(methylsulfonyl)phenyl]carbamoyl}-2-[2-(trifluoromethyl)phenyl]-1H-pyrrol-1
-yl)acetic acid (M5), and deuterium-labeled M1 were also synthesized at Daiichi Sankyo. The metabolite M11,
1-O-({(5P)-1-(2-hydroxyethyl)-4-methyl-5-[2-(trifluoromethyl)phenyl]-1H-pyrrol-3-yl}carbonyl)-β-D-glucop
yranuronic acid was synthesized at Daiichi Sankyo RD Novare (Tokyo, Japan). [14C]4-(methylsulfonyl)
aniline (4MSA), a metabolite generated by the hydrolysis of esaxerenone, was synthesized at Curachem, Inc.
(Chungcheongbuk, Korea). Esaxerenone and M1 were synthesized by using the method described in the
patent applications (Canne Bannen et al., 2006; Aoki et al., 2008). M2 and M3 were prepared in a similar
manner as that mentioned in the patent applications described above. M4 was synthesized via conventional
O-glycosidation of the alcohol in esaxerenone, followed by the removal of the protective group. M11 was
prepared biosynthetically by using microorganisms from
1-(2-Hydroxyethyl)-4-methyl-5-[2-(trifluoromethyl)phenyl]-1H-pyrrole-3-carboxylic acid (HMCA).
Microsomes from baculovirus-infected insect cells expressing human P450 or UGT isoforms were purchased
This article has not been copyedited and formatted. The final version may differ from this version.DMD Fast Forward. Published on December 12, 2018 as DOI: 10.1124/dmd.118.084897
at ASPE
T Journals on June 1, 2020
dmd.aspetjournals.org
Dow
nloaded from

DMD#84897
7
from BD Biosciences (San Jose, CA) and Corning (Corning, NY). A Reaction Phenotyping Kit (version 8)
containing human liver microsomes from 16 individual donors was purchased from XenoTech (Kansas City,
KS). NADPH regeneration system solution A, NADPH regeneration system solution B, UGT reaction mix
solution A, and UGT reaction mix solution B were purchased from Corning Inc. Caco-2 cells were obtained
from American Type Culture Collection (Manassas, VA). [3H]Digoxin, [3H]estrone sulfate ammonium salt,
and [14C]mannitol were purchased from PerkinElmer (Waltham, MA). [14C]Theophylline was purchased from
American Radiolabeled Chemicals (St. Louis, MO). Verapamil hydrochloride and novobiocin sodium salt
were purchased from Sigma-Aldrich (St. Louis, MO). GF120918 was purchased from Toronto Research
Chemicals (North York, Canada). Antibiotic-antimycotic (100×) liquid, L-glutamine-200 mM liquid,
Dulbecco’s modified Eagle’s medium (DMEM), fetal bovine serum (FBS), and 10× Hanks’ balanced salt
solution (HBSS) were purchased from Thermo Fisher Scientific (Waltham, MA). Other reagents were
commercially available and of special reagent grade, HPLC grade, LC-MS grade, or equivalent.
Clinical Study Design and Sample Collection
The study was conducted at Worldwide Clinical Trials (San Antonio, TX) in six healthy male subjects between
18 and 60 years of age. The study was conducted in compliance with ethical principles that have their origin in
the Declaration of Helsinki and was approved by the institutional review board (IntegReview) on August 26,
2015. All participants provided written informed consent prior to commencement of the study. Each of the six
subjects received a single oral dose of [14C]esaxerenone (150 μCi/20 mg) as a solution after fasting for at least
8 h. Subjects continued to fast for an additional 4 h after dosing. Whole blood and plasma samples were
collected at the following times: 0 (pre-dose), 0.5, 1, 1.5, 2, 2.5, 3, 3.5, 4, 6, 8, 12, 16, 24, 36, 48, 60, 72, 96,
120, 132, 144, 156, 168, 180, 192, 216, 240, 264, and 288 h post dose. Urine samples were collected over the
following intervals: −2 to 0 h (pre-dose), 0 to 4, 4 to 8, 8 to 12, 12 to 24, 24 to 36, 36 to 48, 48 to 72, 72 to 96,
96 to 120, 120 to 144, 144 to 168, 168 to 192, 192 to 216, 216 to 240, 240 to 264, and 264 to 288 h post dose.
This article has not been copyedited and formatted. The final version may differ from this version.DMD Fast Forward. Published on December 12, 2018 as DOI: 10.1124/dmd.118.084897
at ASPE
T Journals on June 1, 2020
dmd.aspetjournals.org
Dow
nloaded from

DMD#84897
8
The fecal samples were collected at the following times: 0, 0 to 24, 24 to 48, 48 to 72, 72 to 96, 96 to 120, 120
to 144, 144 to 168, 168 to 192, 192 to 216, 216 to 240, 240 to 264, and 264 to 288 h post dose; mixed with
water, and homogenized. The samples were stored at approximately −80°C until analysis.
Analysis of Total Radioactivity, Esaxerenone, and Metabolite Concentration
The total radioactivity in blood, plasma, urine, and feces was measured by using a liquid scintillation counter
(LSC) at Worldwide Clinical Trials. Plasma esaxerenone and metabolite concentrations were measured by a
validated liquid chromatography-tandem mass spectrometry (LC-MS/MS) assay at Celerion (Lincoln, NE)
using an electrospray ionization (ESI) interface in the positive ion mode. The detailed method of analysis is
shown in the supplemental data (Supplemental Method).
Pharmacokinetic Analysis
Plasma concentration-time data for esaxerenone and metabolites, and total radioactivity concentration-time
data for [14C]esaxerenone equivalents in plasma and whole blood were analyzed by using non-compartmental
methods in Phoenix WinNonlin (version 6.3, Pharsight Corporation, Mountain View, CA). The following
parameters were calculated: area under the plasma concentration versus time curve up to the last measurable
time point (AUClast), area under the plasma concentration versus time curve to infinity (AUCinf), maximum
plasma concentration (Cmax), time to reach the maximum plasma concentration (Tmax), and elimination
half-life at terminal phase (t1/2). For esaxerenone, the apparent total body clearance (CL/F) and apparent
volume of distribution based on the terminal phase (Vz/F) were also calculated. AUCinf and t1/2 were not
calculated unless at least three time points (of which the first time point must be greater than Tmax) with
quantifiable concentrations were obtained. The blood-to-plasma AUClast ratio was calculated by dividing
AUClast of total radioactivity in blood by AUClast of total radioactivity in plasma. The AUC ratio of
esaxerenone and metabolites to total radioactivity (AUCR, %) was calculated by dividing AUCinf of
This article has not been copyedited and formatted. The final version may differ from this version.DMD Fast Forward. Published on December 12, 2018 as DOI: 10.1124/dmd.118.084897
at ASPE
T Journals on June 1, 2020
dmd.aspetjournals.org
Dow
nloaded from

DMD#84897
9
esaxerenone or metabolite by AUCinf of total radioactivity. AUClast was used for M1 instead of AUCinf because
AUCinf was not calculated for M1. When calculating AUCR, AUC was converted into the molar amounts
using the molecular weights of 466.47 for esaxerenone, 422.42 for M1, 642.60 for M4, and 489.40 for M11;
AUC for total radioactivity in molar amounts was determined by using the specific activity of
[14C]esaxerenone. The excretion of radioactivity in urine and feces (% of dose) was calculated by dividing
excreted radioactivity by administered radioactivity.
Metabolite Profiling of Human Plasma, Urine, and Feces
The plasma samples collected at 1 h post dose were pooled by mixing an equal volume from each subject, and
qualitatively analyzed. The pooled urine (0 to 24 h for qualitative analysis; and 0 to 24, 24 to 48, and 48 to 72
h for quantitative analysis) and feces (24 to 48 h for qualitative analysis; and 0 to 24, 24 to 48, 48 to 72, 72 to
96, and 96 to 168 h for quantitative analysis) samples were prepared by proportional mixing from each subject
based on the amount, and combining a proportionally excreted amount from each time point, and then used for
analysis. The plasma, urine, or fecal samples were extracted with acetonitrile and analyzed by using
radio-HPLC and MS detector, qualitatively and quantitatively. The detailed analysis method is shown in the
supplemental data (Supplemental Method). For the quantitative analysis, the percentage area of each
radioactive peak on the radiochromatogram was calculated with analysis software (FLO-ONE, PerkinElmer).
The excretion ratios of esaxerenone and metabolites in urine and feces were calculated by multiplying the total
excretion ratios of radioactivity in the urine and feces (% of dose) by the composition ratio of each radioactive
peak, and shown as a cumulative value.
In vitro Identification of P450 Isoform
Two studies were conducted to identify the P450 isoforms involved in the oxidative metabolism of
esaxerenone. For the recombinant study, esaxerenone was incubated with the microsomes from
This article has not been copyedited and formatted. The final version may differ from this version.DMD Fast Forward. Published on December 12, 2018 as DOI: 10.1124/dmd.118.084897
at ASPE
T Journals on June 1, 2020
dmd.aspetjournals.org
Dow
nloaded from

DMD#84897
10
baculovirus-infected insect cells expressing human cytochrome P450 (P450) isoforms (CYP1A2, CYP2B6,
CYP2C8, CYP2C9, CYP2C19, CYP2D6, CYP3A4, and CYP3A5; final concentration: 30 pmol P450/mL).
For the correlation analysis, esaxerenone was incubated with each individual type of human liver microsomes
(final concentration: 1 mg protein/mL). The concentrations of M1, M2, and M3 were measured by using an
LC-MS/MS method. The detailed method is shown in the supplemental data (Supplemental Method). The
formation rates of the metabolites were calculated by dividing the concentration of the metabolites by the
incubation time and the P450 (nmol P450/mL) or protein (mg protein/mL) concentration in microsomes. For
the correlation analysis, the coefficient of determination (R2) was calculated from the plot of each P450
isoform activity based on the specific marker reactions in individual human liver microsomes and the
formation rates of the metabolites. The P450 isoform activities based on the specific marker reactions in
individual human liver microsomes were cited from the data sheet provided by XenoTech, LLC.
In vitro UGT Isoform Identification
Esaxerenone was incubated with the microsomes from baculovirus-infected insect cells expressing human
UDP-glucuronosyltransferase (UGT) isoforms (UGT1A1, UGT1A3, UGT1A4, UGT1A6, UTG1A9,
UGT2B7, and UGT2B15; final concentration: 0.5 mg protein/mL), and the concentrations of M4 were
measured by using an LC-MS/MS method. The detailed method is shown in the supplemental data
(Supplemental Method). The formation rates of M4 were calculated by dividing the concentration of M4 by
the incubation time and the protein concentration of the microsomes (mg protein/mL).
Transcellular Transport Across Caco-2 Cells via P-gp and BCRP
To evaluate the transcellular transport via P-gp and BCRP, Caco-2 cells were seeded at a density of 1×10⁵
cells/cm2 in 24 well plates. For the bidirectional transport assay, the medium at the apical side and basal side
of the plate was removed by aspiration and replaced with HBSS or HBSS containing 100 μM verapamil
This article has not been copyedited and formatted. The final version may differ from this version.DMD Fast Forward. Published on December 12, 2018 as DOI: 10.1124/dmd.118.084897
at ASPE
T Journals on June 1, 2020
dmd.aspetjournals.org
Dow
nloaded from

DMD#84897
11
(typical P-gp inhibitor, Rautio et al., 2006), 10 μM novobiocin (typical BCRP inhibitor, Xia et al., 2005), or 10
μM GF120918 (P-gp and BCRP inhibitor, Xia et al., 2005), and the plate was preincubated at 37°C for 1 h.
After the preincubation, the solution in the donor side was replaced with HBSS buffer containing 1 μM
[14C]esaxerenone (with or without inhibitors), 1 μM [3H]digoxin (typical P-gp substrate, with or without
inhibitors), 0.1 μM [3H]estrone sulfate (typical BCRP substrate, with or without inhibitors), 10 μM
[14C]theophylline (high-permeability marker), or 10 μM [14C]mannitol (low permeability marker). After
incubation for a designated period at 37°C, the receiver side solution was collected into a glass vial. The assay
solution (10 μL) was collected from the donor side after 1 h and the radioactivity was counted by using LSC.
Incubation was performed in triplicate. The detailed method is shown in the supplemental data (Supplemental
Method).
The permeability coefficient (Papp) and the Papp ratio of the test compounds were calculated using the following
equations:
Papp (cm/sec) = [dQ/dt]/A/Cdonor
where dQ/dt is the transport rate (dpm/sec), A is the surface area of the monolayer (cm2), and Cdonor is the
observed concentration in donor sample collected after incubation for 1 h (dpm/mL).
Papp ratio = Papp, A to B / Papp, B to A
where Papp,A to B is the Papp value from the apical-to-basal direction and Papp,B to A is the Papp value from the
basal-to-apical direction.
Metabolism and Excretion of Esaxerenone Hydrolysate in Rats
In the course of the metabolite profiling, the hydrolysis of the central amide bond of esaxerenone was
observed. Only methyl-(trifluoromethyl)phenyl-hydroxyethyl-pyrrole carboxylate side was radiolabeled and
detected; however, the complementary part, 4-(methylsulfonyl)aniline (4MSA), must also be produced in the
body. As the hydrolyzed metabolite was not observed in rats and monkeys, further non-clinical evaluation was
This article has not been copyedited and formatted. The final version may differ from this version.DMD Fast Forward. Published on December 12, 2018 as DOI: 10.1124/dmd.118.084897
at ASPE
T Journals on June 1, 2020
dmd.aspetjournals.org
Dow
nloaded from

DMD#84897
12
difficult, even if another [14C]esaxerenone with labeled 4MSA was synthesized. Therefore, [14C]4MSA was
synthesized to investigate its fate and administered intravenously to fasted male F344 rats (Charles River
Laboratories Japan, Shiga, Japan) at 1 mg/kg. All animal experiments were conducted in accordance with the
guidelines of the Institutional Animal Care and Use Committee of Daiichi Sankyo Co., Ltd. For the
pharmacokinetic study (n=3), the blood was collected from the jugular vein at the designated sample
collection times and the plasma was obtained by centrifugation. The concentration of radioactivity in blood
and plasma was measured by LSC. For the mass balance study (n=3), the rats were housed individually in the
glass metabolic cages (Metabolica, Sugiyama-Gen Iriki, Tokyo, Japan after the drug administration, and the
urine and feces were collected for the designated periods. The concentration of radioactivity in the urine and
feces was measured by LSC and excretion ratio of radioactivity (% of dose) was calculated by dividing the
excreted radioactivity by the administered radioactivity. For metabolite profiling, the blood was collected from
the abdominal aorta at 1 and 6 h after administration and the plasma was obtained by centrifugation. The
structure of metabolites was elucidated using LC-MS/MS coupled with a radioactivity detector. The detailed
conditions of the analysis are shown in the supplemental data (Supplemental Figure 3).
Results
Pharmacokinetics and Excretion of [14C]Esaxerenone
The radioactivity concentration-time profiles in blood and plasma after a single oral administration of 20 mg
[14C]esaxerenone to healthy volunteers are shown in Figure 2A, and the pharmacokinetic parameters for
radioactivity are shown in Table 1. Mean Cmax of radioactivity in plasma and blood was 430 and 281
ng-eq./mL respectively; mean AUClast was 12,600 and 7880 ng-eq.·h/mL, and mean AUCinf was 12,900 and
8180 ng-eq.·h/mL, respectively. Median Tmax and mean t1/2 were approximately 4 and 30 h both in blood and
plasma, respectively. The blood-to-plasma AUClast ratio of the radioactivity was 0.628. Mean plasma
concentrations of esaxerenone and its metabolites are shown in Figure 2B. The pharmacokinetic parameters of
This article has not been copyedited and formatted. The final version may differ from this version.DMD Fast Forward. Published on December 12, 2018 as DOI: 10.1124/dmd.118.084897
at ASPE
T Journals on June 1, 2020
dmd.aspetjournals.org
Dow
nloaded from

DMD#84897
13
esaxerenone and metabolites are presented in Table 1. The mean t1/2 values of esaxerenone, M4, and M11 were
34.0, 27.8, and 26.4 h, respectively. The t1/2 of M1 was not determined owing to its slow elimination; however,
the exposure was very low. Mean Cmax was 237 ng/mL for esaxerenone, followed by 165 ng/mL (M4), 39.0
ng/mL (M11), and 1.00 ng/mL (M1). Mean exposure (AUClast for M1 and AUCinf for others) was 5320
ng·h/mL for esaxerenone, followed by 3860 ng·h/mL (M4), 1070 ng·h/mL (M11), and 198 ng·h/mL (M1),
respectively. Based on AUCinf total radioactivity ratios, esaxerenone was the most abundant moiety in plasma
(40.8%), followed by M4 (21.4%) and M11 (8.0%). Based on AUClast, the abundance of M1 was 1.7% of the
total radioactivity. The total recovery of radioactivity in urine and feces over the 288 h sampling period was
92.5%, with 76.6% recovered by 96 h and 86.7% recovered by 144 h, as shown in Figure 3. The cumulative
percentage of radioactivity recovered in urine and feces was 38.5% and 54.0%, respectively.
Structure Elucidation of Metabolites
Structural elucidation of the metabolites in plasma, urine, and feces collected after the oral administration of
[14C]esaxerenone was conducted by using LC-MS/MS combined with a radioactivity detector; representative
radiochromatograms are shown in Figure 4. Structural assignment and mass spectrometry data were
summarized in Table 2. The fragmentation schemes of esaxerenone and metabolites are shown in the
supplemental data (Supplemental Figure 1).
Plasma
In plasma, unchanged esaxerenone was detected as the largest peak. Two radioactive peaks of the metabolites
M4 and M11 were detected. M4 was identified to the O-glucuronide of esaxerenone, similar to that found in
monkey plasma (Yamada et al., 2017). The structure of M4 is shown in Figure 5. The deprotonated molecule
[M-H]- ion of M11 was detected at m/z 488. One of the major product ions of M11 was detected at m/z 312,
which corresponded to the loss of the glucuronic acid group (176 Da). The product ion at m/z 312 also
This article has not been copyedited and formatted. The final version may differ from this version.DMD Fast Forward. Published on December 12, 2018 as DOI: 10.1124/dmd.118.084897
at ASPE
T Journals on June 1, 2020
dmd.aspetjournals.org
Dow
nloaded from

DMD#84897
14
corresponded to the methyl-(trifluoromethyl)phenyl-hydroxyethyl-pyrrole carboxylate, suggesting that M11
was a glucuronide of the esaxerenone amide-bond hydrolysate. By comparing the retention time and
LC-MS/MS spectra with those of the authentic standard, M11 was identified as the acyl-glucuronide of
esaxerenone amide-bond hydrolysate. M1, which was identified in rat plasma (Yamada et al., 2017) was
detected only by mass spectrometry and was not detected by radiochromatography.
Urine
In urine, the unchanged forms, M2, M3, M4, M5, M8, M11, M12, and M13 were detected. M2, M3, and M5
were also detected in rat and monkey samples (Yamada et al., 2017), and identified as the carboxylic acid
form in the N-alkyl side chain, the hydroxymethyl form of esaxerenone, and the hydroxymethyl form of M2
(or the carboxylic acid form of M3), respectively (Figure 5).
The deprotonated molecule [M-H]- ion of M8 and M13 was detected at m/z 657, which was 192 Da larger
than the m/z 465 of esaxerenone. The mass shift from esaxerenone corresponded to C6H8O7, which was
attributable to the combination of monooxygenation (+O) and glucuronidation (+C6H8O6). In addition, the
major fragment ions at m/z 481 and 463 were attributable to the loss of the glucuronic acid moiety and its
dehydration product. As the fragment ion at m/z 170 indicated no changes in the methylsulfonylphenyl group
and the structure analysis of M3 demonstrated that the major oxidation site for esaxerenone was the methyl
group on the pyrrole moiety as described below, M8 and M13 were proposed to be glucuronides of M3;
however, the conjugated position has not yet been determined.
The deprotonated molecule [M-H]- ion of M12 was detected at m/z 488. In the same way as M11, one of the
major product ions at m/z 312 corresponded to the loss of the glucuronic acid group (176 Da) from the
glucuronide of the esaxerenone amide-bond hydrolysate. As M11 was identified to be the acyl-glucuronide by
using an authentic standard, M12 was estimated to be an O-glucuronide of esaxerenone amide-bond
hydrolysate.
This article has not been copyedited and formatted. The final version may differ from this version.DMD Fast Forward. Published on December 12, 2018 as DOI: 10.1124/dmd.118.084897
at ASPE
T Journals on June 1, 2020
dmd.aspetjournals.org
Dow
nloaded from

DMD#84897
15
Feces
In feces, the unchanged forms, M2, M3, M5, M15, M16, and M17 were detected. The deprotonated molecule
[M-H]- ion of M15 was detected at m/z 467, and its molecular composition was estimated to be
C21H19F3N2O5S based on the accurate mass detected, which indicated that M15 was the demethylated (−CH2)
and monooxygenated (+O) form of esaxerenone. Together with mass fragmentation analysis, M15 was
estimated as the sulfonic acid form of esaxerenone; assignment of the fragment ions is shown in Supplemental
Figure 1.
At the elution times of M16 and M17, m/z 497 was detected in the mass spectrum, and its accurate mass
corresponded to C22H21F3N2O6S, indicating that M16 and M17 were the dioxygenated (+2O) forms of
esaxerenone. The site of oxidation for M16 was not identified because the product ion scan data were not
obtained owing to the low intensity of the precursor ion. In the case of M17, the fragment ion m/z values of
170, 300, and 351 were detected as key fragment ions in the CID/HCD product ion scan. From these data, the
oxidation position for M17 was estimated to be on the pyrrole moiety containing the methyl and hydroxyethyl
groups; assignment of the fragment ions is shown in Supplemental Figure 1.
Quantitative Metabolite Profiling
To assess the urinary and fecal excretion of the unchanged form and major metabolites, the urine collected
from 0 to 72 h and the feces collected from 0 to 168 h were analyzed, and the results are shown in Table 3.
After the oral administration of [14C]esaxerenone to humans, the excretion of unchanged esaxerenone in urine
was only 1.6%. M11 was excreted in urine at 10.5% of the dose as a major metabolite, followed by M4 (7.2%).
In feces, esaxerenone was excreted at 18.7% of the dose and the major metabolites excreted were M3 and M5
(10.1%, sum of both metabolites) and M2 (9%). The total excretion ratio of the oxidized metabolites (M2, M3,
M5, M16, and M17) and the conjugated forms of the oxidized metabolites (M8 and M13) was 28.9%.
This article has not been copyedited and formatted. The final version may differ from this version.DMD Fast Forward. Published on December 12, 2018 as DOI: 10.1124/dmd.118.084897
at ASPE
T Journals on June 1, 2020
dmd.aspetjournals.org
Dow
nloaded from

DMD#84897
16
P450 and UGT Isoform Identification
Esaxerenone was incubated with microsomes from baculovirus-infected insect cells expressing human
CYP1A2, CYP2B6, CYP2C8, CYP2C19, CYP2D6, CYP3A4, and CYP3A5, and the production of the
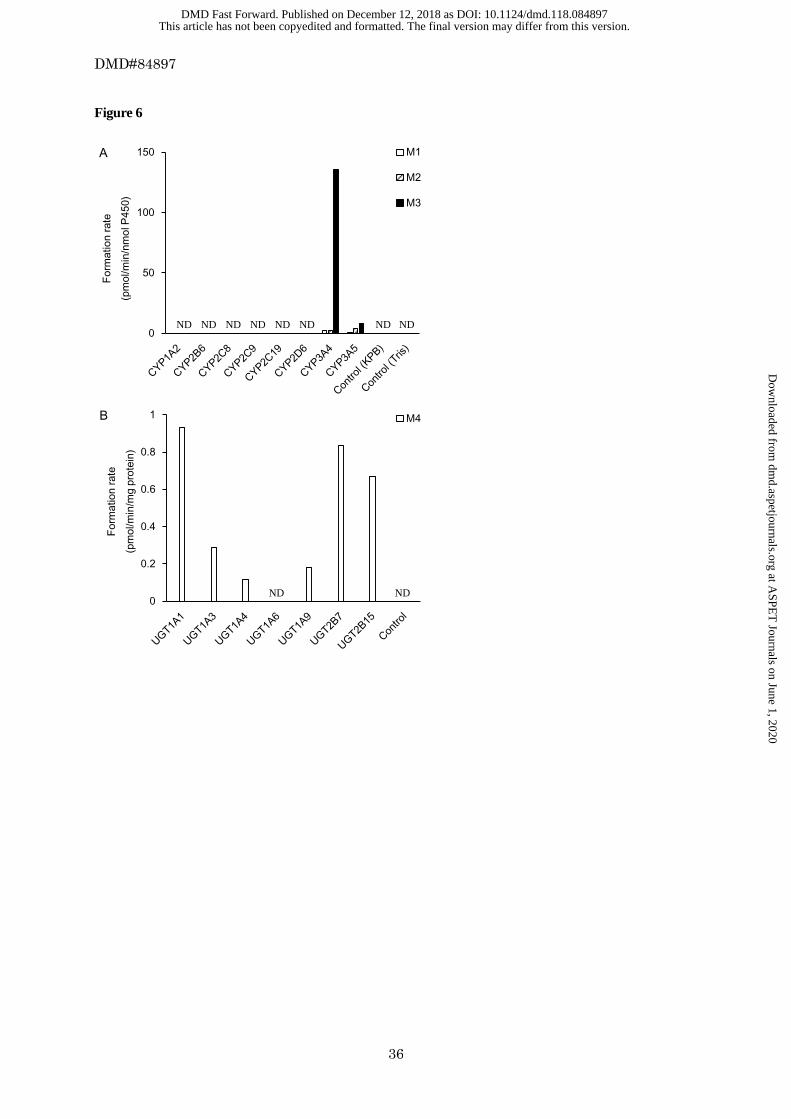
oxidized metabolites (M1, M2, and M3) was determined by LC-MS/MS. The results are shown in Figure 6A.
The mean formation rates of M1, M2, and M3 in the microsomes expressing human P450 isoforms were 2.08,
2.06, and 136 pmol/min/nmol P450 for CYP3A4; and 0.647, 4.30, and 8.23 pmol/min/nmol P450 for
CYP3A5, respectively. No metabolites were produced by other P450 isoforms. Esaxerenone was also
incubated with human liver microsomes from 16 individual donors. The formation rates of metabolites by
human liver microsomes were highly correlated with testosterone 6β-hydroxylation and midazolam
1'-hydroxylation, which are markers of CYP3A4/5 activity, with correlation coefficients (r2) of 0.813, 0.842,
and 0.807 for M1, M2, and M3, respectively (testosterone 6β-hydroxylation) and 0.707, 0.693, and 0.794, for
M1, M2, and M3, respectively (midazolam 1'-hydroxylation). For the other P450 isoform activities, no
apparent correlation was observed (Supplemental Figure 2). These results indicated that CYP3A4 and
CYP3A5 were the main isoforms involved in the oxidative metabolism of esaxerenone by P450 in the human
liver. For UGT isoform identification, esaxerenone was incubated with microsomes from baculovirus-infected
insect cells expressing human UGT1A1, UGT1A3, UGT1A4, UGT1A6, UTG1A9, UGT2B7, and UGT2B15;
subsequently, the production of its metabolite, M4, was determined by LC-MS/MS. The results are shown in
Figure 6B. The formation rates of M4 for UGT1A1, UGT1A3, UGT1A4, UTG1A9, UGT2B7, and UGT2B15
were 0.932, 0.289, 0.115, 0.182, 0.837, and 0.668 pmol/min/mg protein, respectively. These results indicated
that multiple UGT isoforms were involved in the O-glucuronidation of esaxerenone.
Transcellular Transport Across Caco-2 Cell Via P-gp and BCRP
The transcellular transport of [14C]esaxerenone and the effects of P-gp and BCRP inhibitors investigated using
This article has not been copyedited and formatted. The final version may differ from this version.DMD Fast Forward. Published on December 12, 2018 as DOI: 10.1124/dmd.118.084897
at ASPE
T Journals on June 1, 2020
dmd.aspetjournals.org
Dow
nloaded from

DMD#84897
17
Caco-2 cell monolayers are shown in Figure 7. The electrical resistance was between 0.468 and 0.510 kΩ∙cm2.
The P-gp and BCRP activities in Caco-2 cell monolayers were confirmed by vectorial transport of [3H]digoxin
(a P-gp substrate) and [3H]estrone sulfate (a BCRP substrate), which was inhibited in the presence of
verapamil (a P-gp inhibitor) and novobiocin (a BCRP inhibitor), respectively (Figure 7A). The vectorial
transport of the two substrates was absent in the presence of GF120918 (an inhibitor of both P-gp and BCRP)
as well (Figure 7A). In the absence of the inhibitors, the apparent permeability coefficient (Papp) for the
apical-to-basal (Papp,A to B) and basal-to-apical directions (Papp,B to A) of [14C]esaxerenone at 1 μM was 16.8 ×
10−6 and 43.5 × 10⁻⁶ cm/s, respectively (Figure 7B), and the Papp ratio (Papp,B to A / Papp,A to B) was calculated as
2.59. Verapamil, novobiocin, and GF120918 affected the permeability of [14C]esaxerenone (Figure 7B). These
results suggested that esaxerenone was a substrate of both P-gp and BCRP. The low Papp of mannitol, a low
permeability marker drug, suggested the integrity of the Caco-2 cell monolayers during the study (Figure 7B).
Theophylline, of which 100% of the dose is absorbed in humans (Li et al., 2007), was evaluated as a highly
membrane-permeable marker, and its Papp,A to B was 22.4 × 10⁻⁶ cm/s (Figure 7B).
Metabolism and Excretion of Esaxerenone Hydrolysate in Rats
14C-Labeled 4-(methylsulfonyl)aniline ([14C]4MSA), a metabolite generated by the hydrolysis of esaxerenone,
was synthesized and administered to F344 rats to investigate the fate of the metabolite. After intravenous
administration, the t1/2 of the radioactivity in blood and plasma was 6.6 and 6.5 h, respectively. By 24 h after a
single intravenous administration, 73.6% and 6.5% of the dosed radioactivity was excreted in urine and feces,
respectively. By 96 h after a single intravenous administration, 83.8% and 9.1% of the dosed radioactivity was
excreted in the urine and feces, respectively, giving a total excretion of 92.9%. In the metabolite analysis of rat
plasma, the acetylated form of 4MSA was mainly observed, and the hydroxylated form of the acetylated
4MSA was also identified. The detailed results are shown in the supplemental data (Supplemental Figure 3).
This article has not been copyedited and formatted. The final version may differ from this version.DMD Fast Forward. Published on December 12, 2018 as DOI: 10.1124/dmd.118.084897
at ASPE
T Journals on June 1, 2020
dmd.aspetjournals.org
Dow
nloaded from

DMD#84897
18
Discussion
In this study, [14C]esaxerenone was administered orally to six healthy male volunteers. The maximum dose of
esaxerenone administered in a Phase 3 study was 5 mg (https://clinicaltrials.gov/ct2/show/NCT02890173);
however, 20 mg was administered in this study to ensure the feasibility of metabolite detection. The safety and
dose proportionality after single doses of between 5 and 200 mg esaxerenone were confirmed in a Phase 1
study (Kato et al., 2018); therefore, ADME profiles following administration of 20 mg were considered to be
comparable with those following administration of 5 mg. Following oral administration, more than 90% of the
dosed radioactivity was recovered in urine and feces by 288 h post dose. The half-lives of the radioactivity in
blood and plasma were similar to that of the unchanged form, and the value obtained by dividing blood
AUClast by plasma AUClast was 0.628, suggesting low partitioning of esaxerenone and its major metabolites
into blood components.
The fecal excretion of the unchanged esaxerenone was 18.7%. Assuming that all metabolism occurs after
absorption, the absorption ratio (Fa) was considered to be at least 80%. Some drugs are metabolized by
intestinal microbiota; however, this is unlikely for esaxerenone because the major metabolites observed in
feces were oxidized forms. In monkeys, O-glucuronide (M4), a major metabolite in bile, was not detected in
feces, suggesting that the glucuronide was hydrolyzed back to the unchanged form by the intestinal flora
(Yamada et al., 2017). Because a similar phenomenon is likely to occur in humans, Fa was expected to be over
80%, and a high bioavailability, similar to rats (ca. 100%) and monkeys (ca. 70%), was expected. The high Fa
of esaxerenone was also suggested by the experiments using a Caco-2 cell monolayer (Figure 7). When P-gp
and BCRP inhibitors were added, the membrane permeability of esaxerenone was similar to that of
theophylline, the Fa of which is 100% of the dose in humans (Li et al., 2007). Given the high Fa, the DDI risk
of esaxerenone and P-gp/BCRP inhibitors was expected to be low, although in vitro experiments indicated that
esaxerenone was a substrate for these transporters.
The low excretion ratio of unchanged form in urine and feces suggested that esaxerenone was mainly cleared
This article has not been copyedited and formatted. The final version may differ from this version.DMD Fast Forward. Published on December 12, 2018 as DOI: 10.1124/dmd.118.084897
at ASPE
T Journals on June 1, 2020
dmd.aspetjournals.org
Dow
nloaded from

DMD#84897
19
by metabolism. Metabolite profiling detected several oxidized forms, O-glucuronide, and glucuronides of
amide-bond hydrolysate, which suggested esaxerenone has multiple metabolic pathways: oxidation,
glucuronidation, and hydrolysis. To estimate the contribution of oxidative metabolism, the excretion ratio of
the oxidized metabolites (M2, M3, M5, M16, and M17), and the metabolites for which the initial reaction is
oxidation (M8 and M13) was summed. Approximately 30% of total body clearance (CLt) was considered to
result from oxidation. Among the oxidized metabolites, production of M1, M2, and M3 with CYP3A4 and
CYP3A5 was confirmed in in vitro studies (Figure 5A and Supplemental Figure 2). However, even assuming
that esaxerenone was completely oxidized only by CYP3A, the decrease in CLt by a strong CYP3A inhibitor
was estimated to be approximately 30%. In contrast, eplerenone, a marketed MR blocker, is mostly
metabolized by CYP3A, and the strong CYP3A inhibitor ketoconazole and the moderate inhibitors
erythromycin and fluconazole increased its AUC by 5.39, 2.87, and 2.24 times, respectively (Cook et al.,
2004). For this reason, eplerenone is contraindicated with strong CYP3A inhibitors; and dose reduction is
required when used concomitantly with moderate CYP3A inhibitors, as written in the INSPRA product label
(https://www.accessdata.fda.gov/drugsatfda_docs/label/2002/21437lbl.pdf). Esaxerenone is less susceptible to
interactions with CYP3A inhibitor than eplerenone, making it favorable as a drug for the treatment of chronic
diseases such as hypertension and diabetes.
M11 and M12 were glucuronides of amide-bond hydrolysate of esaxerenone. Further in vitro studies indicated
that the hydrolysis occurred independent of NADPH in human liver microsomes, and did not occur in human
plasma and liver cytosols (data not shown). The hydrolysis in human liver microsomes was inhibited by
several esterase inhibitors: bis-p-nitrophenyl phosphate, phenylmethylsulfonyl fluoride, eserine,
diisopropylfluoro phosphate, and p-chloromercuribenzoate (data not shown). The involved enzyme is still
unknown, however, the possibility of interaction via hydrolysis was low because the sum of the excretion ratio
of M11 and M12 was approximately 13%. The calculation of the contribution of O-glucuronic acid is difficult
because O-glucuronide (M4) is returned to the unchanged form in the intestinal lumen after biliary excretion.
This article has not been copyedited and formatted. The final version may differ from this version.DMD Fast Forward. Published on December 12, 2018 as DOI: 10.1124/dmd.118.084897
at ASPE
T Journals on June 1, 2020
dmd.aspetjournals.org
Dow
nloaded from

DMD#84897
20
Nevertheless, the DDI risk via UGT was considered to be low, as multiple UGT isoforms were involved in the
glucuronidation of esaxerenone (Figure 6B), and the complete inhibition of all isoforms is unlikely. Multiple
UGT isoforms were also involved in the glucuronidation of HMCA, a hydrolyzed form of esaxerenone (data
not shown). The formation of M15, a sulfonic acid form, can be explained by initial oxidative demethylation
of the methylsulfonyl moiety to generate a sulfinic acid intermediate, followed by oxidative conversion to
sulfonic acid. This unusual metabolic pathway from methyl sulfone to sulfonic acid has been reported
previously for odanacatib (Kassahun et al., 2011).
The urinary excretion of the unchanged esaxerenone in human was as low as 1.6%, suggesting the low
contribution of renal clearance to the CLt of esaxerenone. Therefore, the DDI potential via inhibition of renal
transporters, such as organic anion transporters, organic cation transporters, and multidrug and toxin extrusion
transporters, is considered to be low. Furthermore, low urinary excretion suggested that the plasma exposure
of esaxerenone was not affected by renal dysfunction. This property was preferable as esaxerenone is expected
to be administered to patients with renal impairment, such as hypertension, chronic kidney disease, and type 2
diabetes with microalbuminuria.
Quantification of circulating metabolites is necessary to evaluate their potential toxicity risk. The results of the
radio-HPLC analysis showed that unchanged esaxerenone was the major component in plasma, and that the
O-glucuronide of esaxerenone (M4) and the acyl-glucuronide of amide-bond hydrolysate (M11) were detected
as circulating metabolites. The metabolite/radioactivity AUC ratio (AUCR) of M4 was slightly high (21.4%);
however, according to the MIST guidance, conjugated metabolites such as O-glucuronide are usually less
pharmacologically active, so no additional evaluation is required (FDA, 2016). Furthermore, M4 was also a
major metabolite in monkey plasma (Yamada et al., 2017), and its concentration in the toxicity study was
considered to be higher than that in humans (data not shown). Although the deshydroxyethyl form (M1) was
not observed on the radiochromatogram, its plasma concentration was measured by LC-MS/MS because it
showed a weak antagonistic effect on MR and its half-life was much longer than that of unchanged form in
This article has not been copyedited and formatted. The final version may differ from this version.DMD Fast Forward. Published on December 12, 2018 as DOI: 10.1124/dmd.118.084897
at ASPE
T Journals on June 1, 2020
dmd.aspetjournals.org
Dow
nloaded from

DMD#84897
21
non-clinical studies (data not shown). As predicted, M1 was eliminated very slowly from human plasma;
therefore, its AUCR (1.7%) was calculated by using AUClast instead of AUCinf. Owing to its long t1/2, the
steady-state AUCR of M1 was undetermined; however, it was considered to be less than 10% of total
radioactivity exposure as the metabolite-to-parent trough concentration ratio was less than 10% at steady state
after 6 weeks’ administration of esaxerenone to hypertension patients (data on file).
The AUCR of M11 was not very high (8.0%). Although M11 was not detected in rat and monkey plasma in a
previous study (Yamada et al., 2017), it was detected in the toxicity study samples (100 mg/kg for rats and
1000 mg/kg for monkeys) by quantitative LC-MS/MS analysis. The AUC of M11 in rat and monkey plasma
was approximately half of that observed in human plasma in the current study (data on file). Considering the
dosing amount in the current study was higher than the clinical dose, the exposures in animals are suggested to
support those in humans.
The existence of M11 and M12 suggests the exposure of the complementary part, 4MSA, in the human body;
however, 4MSA and its metabolites were not detected on the radiochromatogram as this moiety was not
radiolabeled. As the hydrolyzed metabolite was not observed in rats and monkeys, further non-clinical
evaluation is difficult, even if another [14C]esaxerenone with labeled 4MSA was synthesized. Therefore,
[14C]4MSA was synthesized and administered intravenously to rats to investigate its fate. The results indicated
that 4MSA was metabolized to the acetylated form, and the radioactivity was excreted mainly into urine
(Supplemental Figure 2). The t1/2 of the radioactivity after the administration of [14C]4MSA was
approximately 6.5 h and similar to that of esaxerenone administered to rats (Yamada et al., 2017), suggesting a
low possibility of accumulation of 4MSA and its metabolites. Furthermore, when the concentrations of 4MSA
and its metabolites were measured in plasma from healthy volunteers after administration of 5 mg
esaxerenone for 14 days, their AUC was less than 3% of that of the unchanged esaxerenone (data not shown).
In conclusion, because of the high absorption ratio and various metabolic pathways involved, the DDI
potential of esaxerenone with enzyme inhibitors was considered to be limited. The low urinary excretion of
This article has not been copyedited and formatted. The final version may differ from this version.DMD Fast Forward. Published on December 12, 2018 as DOI: 10.1124/dmd.118.084897
at ASPE
T Journals on June 1, 2020
dmd.aspetjournals.org
Dow
nloaded from

DMD#84897
22
unchanged esaxerenone suggested that contribution of renal clearance was limited and that renal impairment
did not significantly affect esaxerenone exposure. The exposure of the metabolites of esaxerenone in human
plasma was evaluated and was confirmed that they were covered with non-clinical toxicity studies. These
characteristics are considered to demonstrate its favorability for clinical use.
Acknowledgments
The authors thank Worldwide Clinical Trials for conducting the clinical study, Celerion for conducting the
bioanalysis, and LSI Medience Corporation for conducting the metabolite analysis. The authors also thank Drs.
M. Honzumi, Y. Asoh, H. Tsuruoka, and K. Aoki from Daiichi Sankyo for the preparation of authentic
standard of the metabolites, and Dr. M. Kotsuma from Daiichi Sankyo Pharma Development for his kind
support.
Authorship Contributions
Participated in research design: Yamada, Mendell, Takakusa, Shimizu
Conducted experiments: Yamada, Takakusa
Performed data analysis: Yamada, Mendell, Takakusa
Wrote or contributed to the writing of the manuscript: Yamada, Takakusa, Mendell, Shimizu, Ando
References
Aoki K, Tsuruoka H, Hayashi N, Yoshida J, and Asoh Y (2008) Atropisomer of pyrrole derivative. International
Publication No. WO2008126831A1.
Arai K, Homma T, Morikawa Y, Ubukata N, Tsuruoka H, Aoki K, Ishikawa H, Mizuno M, and Sada T (2015)
Pharmacological profile of CS-3150, a novel, highly potent and selective non-steroidal mineralocorticoid
receptor antagonist. Eur J Pharmacol 761:226–234.
This article has not been copyedited and formatted. The final version may differ from this version.DMD Fast Forward. Published on December 12, 2018 as DOI: 10.1124/dmd.118.084897
at ASPE
T Journals on June 1, 2020
dmd.aspetjournals.org
Dow
nloaded from

DMD#84897
23
Arai K, Morikawa Y, Ubukata N, Tsuruoka H, and Homma T (2016) CS-3150, a novel nonsteroidal
mineralocorticoid receptor antagonist, shows preventive and therapeutic effects on renal injury in
deoxycorticosterone acetate/salt-induced hypertensive rats. J Pharmacol Exp Ther 358:548–557.
Arai K, Tsuruoka H, and Homma T (2015) CS-3150, a novel non-steroidal mineralocorticoid receptor antagonist,
prevents hypertension and cardiorenal injury in Dahl salt-sensitive hypertensive rats. Eur J Pharmacol
769:266–273.
Brem AS, Morris DJ, and Gong R (2011) Aldosterone-induced fibrosis in the kidney: questions and controversies.
Am J Kidney Dis 58:471–479.
Canne Bannen L, Chen J, Dalrymple, Lisa E, Flatt, Breton T, Forsyth, Timothy, Patrick Gu X-H, Mac, Morrison B,
Mann, Larry W, Mann G, Martin R, Mohan R, Murphy B, Nyman, Michael C, Stevens, William, C. J, Wang
T-L, Wong Y, and Wu, Jason H (2006) Pyrrole derivatives as pharmaceutical agents. International Publication
No. WO2006012642A2.
Cook CS, Berry LM, and Burton E (2004) Prediction of in vivo drug interactions with eplerenone in man from in
vitro metabolic inhibition data. Xenobiotica 34:215–228.
Epstein M, Williams GH, Weinberger M, Lewin A, Krause S, Mukherjee R, Patni R, and Beckerman B (2006)
Selective aldosterone blockade with eplerenone reduces albuminuria in patients with type 2 diabetes. Clin J Am
Soc Nephrol 1:940–951.
FDA (2016) Guidance for Industry: Safety Testing of Drug Metabolites, US Department of Health and Human
Services FaDA, Center for Drug Evaluation and Research.
Funder JW (1996) Mineralocorticoid Receptors and Hypertension. J Steroid Biochem Mol Biol 53:53–55.
Kassahun K, Black WC, Nicoll-Griffith D, McIntosh I, Chauret N, Day S, Rosenberg E, and Koeplinger K (2011)
Pharmacokinetics and metabolism in rats, dogs, and monkeys of the cathepsin k inhibitor odanacatib:
Demethylation of a methylsulfonyl moiety as a major metabolic pathway. Drug Metab Dispos 39:1079–1087.
Kato M, Furuie H, Shimizu T, Miyazaki A, Kobayashi F, and Ishizuka H (2018) Single‐and multiple‐dose
This article has not been copyedited and formatted. The final version may differ from this version.DMD Fast Forward. Published on December 12, 2018 as DOI: 10.1124/dmd.118.084897
at ASPE
T Journals on June 1, 2020
dmd.aspetjournals.org
Dow
nloaded from

DMD#84897
24
escalation study to assess pharmacokinetics, pharmacodynamics, and safety of oral esaxerenone in healthy
Japanese subjects. Br J Clin Pharmacol 84:1821–1829, in press.
Lombès M, Alfaidy N, Eugene E, Lessana A, Farman N, and Bonvalet J-P (1995) Prerequisite for cardiac aldosterone
action: mineralocorticoid receptor and 11β-hydroxysteroid dehydrogenase in the human heart. Circulation
92:175–182.
Nagai Y, Miyata K, Sun G-P, Rahman M, Kimura S, Miyatake A, Kiyomoto H, Kohno M, Abe Y, Yoshizumi M,
and Nishiyama A (2005) Aldosterone stimulates collagen gene expression and synthesis via activation of
ERK1/2 in rat renal fibroblasts. Hypertension 46:1039–1045.
Nishiyama A, Yao L, Fan Y, Kyaw M, Kataoka N, Hashimoto K, Nagai Y, Nakamura E, Yoshizumi M, Shokoji T,
Kimura S, Kiyomoto H, Tsujioka K, Kohno M, Tamaki T, Kajiya F, and Abe Y (2005) Involvement of
aldosterone and mineralocorticoid receptors in rat mesangial cell proliferation and deformability. Hypertension
45:710–716.
Patni H, Mathew JT, Luan L, Franki N, Chander PN, and Singhal PC (2007) Aldosterone promotes proximal tubular
cell apoptosis: role of oxidative stress. Am J Physiol Physiol 293:F1065–F1071.
Pitt B, Remme W, Zannad F, Neaton J, Martinez F, Roniker B, Bittman R, Hurley S, Kleiman J, and Gatlin M (2003)
Eplerenone, a selective aldosterone blocker, in patients with left ventricular dysfunction after myocardial
infarction. N Engl J Med 348:1309–1321.
Pitt B, Zannad F, Remme WJ, Cody R, Castaigne A, Perez A, Palensky J, and Wittes J (1999) The effect of
spironolactone on morbidity and mortality in patients with severe heart failure. N Engl J Med 341:709–717.
Rautio J, Humphreys JE, Webster LO, Balakrishnan A, Keogh JP, Kunta JR, Serabjit-Singh CJ, and Polli JW (2006)
In vitro P-glycoprotein inhibition assays for assessment of clinical drug interaction potential of new drug
candidates: A recommendation for probe substrates. Drug Metab Dispos 34:786–792.
Rose LI, Underwood RH, Newmark SR, Kisch ES, and Williams GH (1977) Pathophysiology of
spironolactone-induced gynecomastia. Ann Intern Med 87:398–403.
This article has not been copyedited and formatted. The final version may differ from this version.DMD Fast Forward. Published on December 12, 2018 as DOI: 10.1124/dmd.118.084897
at ASPE
T Journals on June 1, 2020
dmd.aspetjournals.org
Dow
nloaded from

DMD#84897
25
Rossing K, Schjoedt KJ, Smidt UM, Boomsma F, and Parving HH (2005) Beneficial effects of adding spironolactone
to recommended antihypertensive treatment in diabetic nephropathy: A randomized, double-masked, cross-over
study. Diabetes Care 28:2106–2112.
Saruta T, Kageyama S, Ogihara T, Hiwada K, Ogawa M, Tawara K, Gatlin M, Garthwaite S, Bittman R, and Patrick
J (2004) Efficacy and safety of the selective aldosterone blocker eplerenone in Japanese patients with
hypertension: a randomized, double-blind, placebo-controlled, dose-ranging study. J Clin Hypertens 6:175–
183.
Shibata S, Nagase M, Yoshida S, Kawachi H, and Fujita T (2007) Podocyte as the target for aldosterone: roles of
oxidative stress and Sgk1. Hypertension 49:355–364.
Siragy HM, and Xue C (2008) Local renal aldosterone production induces inflammation and matrix formation in
kidneys of diabetic rats. Exp Physiol 93:817–824.
Weinberger MH, Roniker B, Krause SL, and Weiss RJ (2002) Eplerenone, a selective aldosterone blocker, in
mild-to-moderate hypertension. Am J Hypertens 15:709–716.
Xia CQ, Yang JJ, and Gan LS (2005) Breast cancer resistance protein in pharmacokinetics and drug-drug interactions.
Expert Opin Drug Metab Toxicol 1:595–611.
Yamada M, Takei M, Suzuki E, Takakusa H, Kotsuma M, Washio T, Murayama N, Inoue S, and Izumi T (2017)
Pharmacokinetics, distribution, and disposition of esaxerenone, a novel, highly potent and selective
non-steroidal mineralocorticoid receptor antagonist, in rats and monkeys. Xenobiotica 47:1090–1103.
This article has not been copyedited and formatted. The final version may differ from this version.DMD Fast Forward. Published on December 12, 2018 as DOI: 10.1124/dmd.118.084897
at ASPE
T Journals on June 1, 2020
dmd.aspetjournals.org
Dow
nloaded from

DMD#84897
26
Legends for Figures
Figure 1 Chemical structures of [14C]esaxerenone (A) and deuterium-labeled-esaxerenone (B)
Figure 2 Mean concentrations of radioactivity in blood and plasma (A), and esaxerenone and its metabolites
M1, M4, and M11 in plasma (B) following a single oral administration of [14C]esaxerenone. Each
point represents the mean±SD of six subjects.
Figure 3 Mean cumulative excretion of total radioactivity in urine and feces following a single oral
administration of [14C]esaxerenone. Each point represents the mean±SD of six subjects.
Figure 4 Representative radiochromatograms of the metabolites in human plasma (1 h), urine (0–24 h), and
feces (24–48 h) following oral administration of [14C]esaxerenone at a dose of 20 mg.
Figure 5 Proposed major metabolic pathway of esaxerenone in humans. The structures of M1, M2, M3, M4,
M5, and M11 were validated against authentic standards. The structures of other metabolites were
proposed based on MS/MS fragmentation and consistency with the validated metabolite structures.
Some metabolites of which structures have not been identified are not included.
Figure 6 Formation rates of the metabolites from esaxerenone in microsomes expressing human P450
isoforms (A) and UGT isoforms (B). Control (KPB) indicates control microsomes in potassium
phosphate buffer and Control (Tris) indicates control microsomes in Tris buffer. ND indicates not
detected.
Figure 7 Transcellular transport across Caco-2 cell monolayers and the effect of verapamil (VPM, P-gp
inhibitor), novobiocin (NVB, BCRP inhibitor), and GF120918 (GF, P-gp and BCRP inhibitor) of
digoxin and estrone sulfate (A); esaxerenone, theophylline (TPL), and mannitol (MAN) (B). A
This article has not been copyedited and formatted. The final version may differ from this version.DMD Fast Forward. Published on December 12, 2018 as DOI: 10.1124/dmd.118.084897
at ASPE
T Journals on June 1, 2020
dmd.aspetjournals.org
Dow
nloaded from

DMD#84897
27
minus sign indicates no inhibitor.
This article has not been copyedited and formatted. The final version may differ from this version.DMD Fast Forward. Published on December 12, 2018 as DOI: 10.1124/dmd.118.084897
at ASPE
T Journals on June 1, 2020
dmd.aspetjournals.org
Dow
nloaded from

DMD#84897
28
Tables
Table 1 Pharmacokinetic parameters of radioactivity in blood and plasma, and esaxerenone and its metabolites
in plasma after a single oral administration of [14C]esaxerenone to healthy volunteers.
Parameter Unit 14C Plasma 14C Blood
Cmax ng-eq./mL 430 (65) 281 (39)
AUClast ng-eq.·h/mL 12600 (2100) 7880 (1210)
AUCinf ng-eq.·h/mL 12900 (2100) 8180 (1240)
t1/2 h 30.8 (3.9) 29.6 (4.9)
Tmax h 3.75 (2.00, 6.02) 3.25 (2.00, 6.02)
Blood-to-plasma AUClast ratio 0.628 (0.014)
Parameter Unit Esaxerenone M4 M11 M1
Cmax ng/mL 237 (60) 165 (40) 39.0 (2.9) 1.00 (0.30)
AUClast ng·h/mL 5310 (1390) 3860 (1190) 1060 (70) 198 (57)
AUCinf ng·h/mL 5320 (1390) 3860 (1190) 1070 (70) NC
t1/2 h 34.0 (9.8) 27.8 (12.9) 26.4 (10.2) NC
Tmax h 2.25 (1.50, 4.00) 4.00 (2.00, 6.02) 3.75 (3.00, 6.02) 48.0 (48.0, 96.0)
CL/F L/h 3.96 (0.94) NC NC NC
Vz/F L 187 (36) NC NC NC
AUCRa % 40.8 (5.7) 21.4 (4.2) 8.0 (0.8) 1.7 (0.6)
a Metabolite/14C plasma AUCinf ratio corrected for molecular weight. AUClast was used for M1.
Arithmetic means (standard deviations) of six subjects, with the exception of Tmax, for which the medians
(minimum, maximum) are shown.
This article has not been copyedited and formatted. The final version may differ from this version.DMD Fast Forward. Published on December 12, 2018 as DOI: 10.1124/dmd.118.084897
at ASPE
T Journals on June 1, 2020
dmd.aspetjournals.org
Dow
nloaded from

DMD#84897
29
Table 2 Mass spectral analysis of esaxerenone metabolites detected in human plasma, urine, and feces
Metabolite
No. Biotransformation
[M-H]-
(m/z)
Elemental
composition
Characteristic fragment
ions (m/z)
Esaxerenone 465 C22H21F3N2O4S 365, 224, 170
M1 Deshydroxyethyl form 421 C20H17F3N2O3S 224, 184, 170
M2 Carboxylic acid form 479 C22CH19F3N2O5S 365, 170
M3 Oxygenation 481 C22CH21F3N2O5S 419, 381, 363, 351, 170
M4 O-Glucuronide 641 C28H29F3N2O10S 465, 447, 365, 224, 170
M5 Hydroxymethyl-carboxylic acid form 495 C22H19F3N2O6S 381, 363, 351, 196, 170
M8 Glucuronide of monooxygenated form 657 C28H29F3N2O11S 481, 419, 381, 170
M11 Acyl-glucuronide of amide-bond hydrolysate 488 C21H22F3NO9 312, 268, 238, 175
M12 O-Glucuronide of amide-bond hydrolysate 488 C21H22F3NO9 312, 294, 268
M13 Glucuronide of monooxygenated form 657 C28H29F3N2O11S 481, 419, 363, 170
M15 Sulfonic acid form 467 C21H19F3N2O5S 343, 287, 198, 172
M16 Dioxygenated form 497 C22H21F3N2O6S not detected
M17 Dioxygenated form 497 C22H21F3N2O6S 351, 300, 170
This article has not been copyedited and formatted. The final version may differ from this version.DMD Fast Forward. Published on December 12, 2018 as DOI: 10.1124/dmd.118.084897
at ASPE
T Journals on June 1, 2020
dmd.aspetjournals.org
Dow
nloaded from

DMD#84897
30
Table 3 Excretion of esaxerenone and its metabolites in urine and feces after oral administration of
[14C]esaxerenone
Metabolite
No.
Identification
Excretion ratio (% of dose)
Urine Feces
0 to 72 h 0 to 168 h
- Esaxerenone 1.6 18.7
M2 Carboxylic acid form 2.6 9.0
M3+M5
Hydroxymethyl form
+ Hydroxymethyl-carboxylic acid form
1.7 10.1
M4 O-Glucuronide 7.2 -
M8 Glucuronide of monooxygenated form 1.6 -
M11 Glucuronide of amide-bond hydrolysate 10.5 -
M12 O-Glucuronide of amide-bond hydrolysate 2.5 -
M13 Glucuronide of monooxygenated form 1.3 -
M15 Sulfonic acid form - 0.9
M16 Dioxygenated form - 1.6
M17 Dioxygenated form - 1.0
Others (Sum of other unknown small peaks) 4.8 9.8
Total radioactivity 33.8 51.0
This article has not been copyedited and formatted. The final version may differ from this version.DMD Fast Forward. Published on December 12, 2018 as DOI: 10.1124/dmd.118.084897
at ASPE
T Journals on June 1, 2020
dmd.aspetjournals.org
Dow
nloaded from

DMD#84897
31
Figure 1
(A)
(B)
N
O
NHCH3
S C2H3
OO
CF3
OH
2H2H2H
2H
This article has not been copyedited and formatted. The final version may differ from this version.DMD Fast Forward. Published on December 12, 2018 as DOI: 10.1124/dmd.118.084897
at ASPE
T Journals on June 1, 2020
dmd.aspetjournals.org
Dow
nloaded from

DMD#84897
32
Figure 2
1
10
100
1000
0 48 96 144 192 240
Concentr
ation (
ng
-eq./
mL)
Time (h)
A Plasma
Blood
0.01
0.1
1
10
100
1000
0 48 96 144 192 240 288
Concentr
ation (
ng/m
L)
Time (h)
B Esaxerenone
M4
M11
M1
This article has not been copyedited and formatted. The final version may differ from this version.DMD Fast Forward. Published on December 12, 2018 as DOI: 10.1124/dmd.118.084897
at ASPE
T Journals on June 1, 2020
dmd.aspetjournals.org
Dow
nloaded from

DMD#84897
33
Figure 3
0
20
40
60
80
100
120
0 48 96 144 192 240 288
Excre
tion (
% o
f dose)
Time (h)
Urine
Feces
Total
This article has not been copyedited and formatted. The final version may differ from this version.DMD Fast Forward. Published on December 12, 2018 as DOI: 10.1124/dmd.118.084897
at ASPE
T Journals on June 1, 2020
dmd.aspetjournals.org
Dow
nloaded from

DMD#84897
34
Figure 4
Urine at 0 - 24 h post-dose
Rad
ioac
tivit
y (
cpm
)
hUM-1hUM-7
hUM-8
hUM-6
hUM-5hUM-4
hUM-3hUM-2
Time (min)
RID
hUM-1
hUM-2
hUM-3
hUM-4
Pooled feces at 48 - 72 h post-dose
Rad
ioac
tivit
y (
cpm
)
Time (min)
RID
hFM-1
hFM-7hFM-8
hFM-4
hFM-3hFM-2 hFM-6hFM-5
hFM-2
hFM-3
hFM-4
Rad
ioac
tivit
y (
cpm
)
Time (min)
hPM-1
hPM-2
hPM-3RID
Plasma at 1h post-dose
hPM-1
hPM-2
hPM-3
Time (min)
Plasma
Feces
M11
M4
esaxerenone
M13
M12
M11
M8 M3+M5
M4
M2
Unknown M15 M16M17
M3+M5
Unknown
M2
Radio
activity (
cpm
)
Urine
esaxerenone
esaxerenone
Radio
activity (
cpm
)R
adio
activity (
cpm
)
Rad
ioac
tivit
y (
cpm
)
Time (min)
hPM-1
hPM-2
hPM-3RID
Plasma at 1h post-dose
hPM-1
hPM-2
hPM-3
M1
This article has not been copyedited and formatted. The final version may differ from this version.DMD Fast Forward. Published on December 12, 2018 as DOI: 10.1124/dmd.118.084897
at ASPE
T Journals on June 1, 2020
dmd.aspetjournals.org
Dow
nloaded from

DMD#84897
35
Figure 5
(glucuronide of M3)
(glucuronide of M3)
multiple
UGT isoforms
GlcA: glucuronic acid
M1 M4
M12
M11
M2 M5 M3
M8
M13
esaxerenone
Amide-bond
hydrolysate
4-(methylsulfonyl)aniline
This article has not been copyedited and formatted. The final version may differ from this version.DMD Fast Forward. Published on December 12, 2018 as DOI: 10.1124/dmd.118.084897
at ASPE
T Journals on June 1, 2020
dmd.aspetjournals.org
Dow
nloaded from
DMD#84897
36
Figure 6
0
50
100
150
Fo
rmatio
n r
ate
(pm
ol/m
in/n
mo
l P450)
A M1
M2
M3
ND ND ND ND ND ND ND ND
0
0.2
0.4
0.6
0.8
1
Form
ation r
ate
(pm
ol/m
in/m
g p
rote
in)
B M4
ND ND
This article has not been copyedited and formatted. The final version may differ from this version.DMD Fast Forward. Published on December 12, 2018 as DOI: 10.1124/dmd.118.084897
at ASPE
T Journals on June 1, 2020
dmd.aspetjournals.org
Dow
nloaded from

DMD#84897
37
Figure 7
0
10
20
30
40
50
60
- VPM GF - NVB GF
Digoxin Estrone sulfate
Papp
(×10
-6cm
/s)
A Apical to basal
Basal to apical
0
10
20
30
40
50
- VPM NVB GF - -
Esaxerenone TPL MAN
Papp
(×10
-6cm
/s)
B Apical to basal
Basal to apical
This article has not been copyedited and formatted. The final version may differ from this version.DMD Fast Forward. Published on December 12, 2018 as DOI: 10.1124/dmd.118.084897
at ASPE
T Journals on June 1, 2020
dmd.aspetjournals.org
Dow
nloaded from