Embed Size (px)
Citation preview
Pharmacogenomic testing for selected conditions
Draft evidence report
October 20, 2016
Health Technology Assessment Program (HTA) Washington State Health Care Authority
PO Box 42712 Olympia, WA 98504-2712
(360) 725-5126 www.hca.wa.gov/about-hca/health-technology-assessment
Pharmacogenomic Testing for Selected Conditions
A Health Technology Assessment
Prepared for Washington State Healthcare Authority
DRAFT REPORT
October 20, 2016
Acknowledgement
This report was prepared by: Hayes, Inc. 157 S. Broad Street Suite 200 Lansdale, PA 19446 P: 215.855.0615 F: 215.855.5218
This report is intended to provide research assistance and general information only. It is not intended to be used as the sole basis for determining coverage policy or defining treatment protocols or medical modalities, nor should it be construed as providing medical advice regarding treatment of an individual’s specific case. Any decision regarding claims eligibility or benefits, or acquisition or use of a health technology is solely within the discretion of your organization. Hayes, Inc. assumes no responsibility or liability for such decisions. Hayes employees and contractors do not have material, professional, familial, or financial affiliations that create actual or potential conflicts of interest related to the preparation of this report.
WA – Health Technology Assessment October 20, 2016
Pharmacogenomic testing for selected conditions: Draft report Page i
Table of Contents EVIDENCE SUMMARY .................................................................................................................................... 1
Summary of Clinical Background .............................................................................................................. 1
Pharmacogenomics ............................................................................................................................................... 3
Clinical Validity of Pharmacogenomic Testing for Pharmacotherapy of Selected Psychiatric Disorders ............. 4
Analytic Validity of Pharmacogenomic Testing for Pharmacotherapy of Selected Psychiatric
Disorders ............................................................................................................................................................... 5
Policy Context ........................................................................................................................................... 6
Summary of Review Objectives and Methods .......................................................................................... 6
Review Objectives ................................................................................................................................................. 6
Key Questions ....................................................................................................................................................... 6
Analytic Framework .............................................................................................................................................. 7
Methods .................................................................................................................................................... 8
Search Strategy and Selection Criteria .................................................................................................................. 8
Inclusion Criteria ................................................................................................................................................... 8
Exclusion Criteria ................................................................................................................................................... 8
Quality Assessment ............................................................................................................................................... 9
Summary of Search Results....................................................................................................................... 9
Findings ................................................................................................................................................... 10
Key Question #1: Effectiveness: What is the clinical utility of genetic testing to inform the selection
or dose of medications for individuals diagnosed with depression, mood disorders, psychosis,
anxiety, attention deficit/hyperactivity disorder (ADHD), or substance use disorder? ..................................... 10
a. Does genetic testing to inform the selection or dose of medications change the drug or dose
selected by physicians and/or patients compared with usual care/no genetic testing? ............... 10
b. Do decisions about selection or dose of medications guided by genetic testing result in
clinically meaningful improvement in patient response to treatment or reduction in adverse
events as a result of treatment compared with decisions based on usual care/no genetic testing?
11
Key Question #2: What direct harms are associated with conducting genetic testing when it is used
to inform the selection or dose of medications? ................................................................................................ 17
Key Question #3: Compared with usual care/no genetic testing, do decision-making, patient
outcomes, or harms following genetic testing to inform the selection or dose of medications vary
by:........................................................................................................................................................................ 17
WA – Health Technology Assessment October 20, 2016
Pharmacogenomic testing for selected conditions: Draft report Page ii
a. Clinical history (e.g., prior treatments, whether the diagnosis is initial or recurrent, duration
of diagnosis, severity of illness, or concurrent medications); or .................................................... 17
b. Patient characteristics (e.g., such as age, sex, or comorbidities)?.......................................... 17
Key Question #4: What are the costs and cost-effectiveness of genetic testing to guide the selection
or dose of medications? ...................................................................................................................................... 18
Practice Guidelines.................................................................................................................................. 20
Selected Payer Policies ............................................................................................................................ 22
Overall Summary and Discussion ............................................................................................................ 22
Evidence-Based Summary Statement ................................................................................................................. 22
Gaps in the Evidence ........................................................................................................................................... 23
TECHNICAL REPORT .................................................................................................................................... 24
Clinical Background ................................................................................................................................. 24
Depressive Disorders .......................................................................................................................................... 24
Schizophrenia Spectrum and Other Psychotic Disorders ................................................................................... 25
Anxiety Disorders ................................................................................................................................................ 25
Bipolar and Related Disorders ............................................................................................................................ 26
Attention Deficit/Hyperactivity Disorder ............................................................................................................ 27
Substance Use Disorders ..................................................................................................................................... 28
Pharmacogenomics ............................................................................................................................................. 29
Clinical Validity of Pharmacogenomic Testing for Pharmacotherapy of Selected Psychiatric Disorders ........... 32
Analytic Validity of Pharmacogenomic Testing for Pharmacotherapy of Selected Psychiatric
Disorders ............................................................................................................................................................. 34
Washington State Agency Utilization and Costs ..................................................................................... 36
Related Medical Codes........................................................................................................................................ 36
Review Objectives and Analytic Framework ........................................................................................... 37
Scope ................................................................................................................................................................... 37
Key Questions ..................................................................................................................................................... 37
Analytic Framework ............................................................................................................................................ 38
Methods .................................................................................................................................................. 39
Search Strategy and Selection Criteria ................................................................................................................ 39
Quality Assessment ............................................................................................................................................. 41
Search Results ......................................................................................................................................... 42
WA – Health Technology Assessment October 20, 2016
Pharmacogenomic testing for selected conditions: Draft report Page iii
Included Studies .................................................................................................................................................. 42
Excluded Studies ................................................................................................................................................. 42
Literature Review .................................................................................................................................... 43
Key Question #1: Effectiveness: What is the clinical utility of genetic testing to inform the selection
or dose of medications for individuals diagnosed with depression, mood disorders, psychosis,
anxiety, attention deficit/hyperactivity disorder (ADHD), or substance use disorder? ..................................... 43
a. Does genetic testing to inform the selection or dose of medications change the drug or dose
selected by physicians and/or patients compared with usual care/no genetic testing? ............... 43
b. Do decisions about selection or dose of medications guided by genetic testing result in
clinically meaningful improvement in patient response to treatment or reduction in adverse
events as a result of treatment compared with decisions based on usual care/no genetic testing?
45
Key Question #2: What direct harms are associated with conducting genetic testing when it is used
to inform the selection or dose of medications? ................................................................................................ 50
Key Question #3: Compared with usual care/no genetic testing, do decision-making, patient
outcomes, or harms following genetic testing to inform the selection or dose of medications vary
by:........................................................................................................................................................................ 50
a. Clinical history (e.g., prior treatments, whether the diagnosis is initial or recurrent, duration
of diagnosis, severity of illness, or concurrent medications); or .................................................... 50
b. Patient characteristics (e.g., such as age, sex, or comorbidities)?.......................................... 50
Key Question #4: What are the costs and cost-effectiveness of genetic testing to guide the selection
or dose of medications? ...................................................................................................................................... 51
Cost-Comparison Studies .................................................................................................................................... 51
Cost-Effectiveness Studies .................................................................................................................................. 53
Cost-Utility Study ................................................................................................................................................ 54
Summary of Economic Studies............................................................................................................................ 54
Practice Guidelines.................................................................................................................................. 55
Selected Payer Policies ............................................................................................................................ 55
Centers for Medicare & Medicaid Services (CMS) .............................................................................................. 55
Aetna ................................................................................................................................................................... 56
GroupHealth ........................................................................................................................................................ 57
Oregon Health Evidence Review Commission (HERC) ........................................................................................ 58
Regence ............................................................................................................................................................... 58
References .............................................................................................................................................. 59

WA – Health Technology Assessment October 20, 2016
Pharmacogenomic testing for selected conditions: Draft report Page iv
APPENDIXES ................................................................................................................................................ 71
APPENDIX I. Meta-analyses of Clinical Validity – Schizophrenia ............................................................ 71
Systematic Reviews with Meta-analyses for Clinical Validity – Schizophrenia ................................................... 71
Meta-analyses for Clinical Validity – Schizophrenia ........................................................................................... 71
APPENDIX II. Search Strategy .................................................................................................................. 75
APPENDIX III. Overview of Evidence Quality Assessment Methods ....................................................... 79
APPENDIX IV. Excluded Studies ............................................................................................................... 82
APPENDIX V. Evidence Tables ................................................................................................................. 84
APPENDIX Va. Studies Assessing the Impact of Pharmacogenomic Testing on Clinical Decision-
Making (KQ1a) and Patient Outcomes (KQ1b) ................................................................................................... 84
APPENDIX Vb. Summary of Subgroup Results for Clinical Utility Studies of Pharmacogenomic Testing
(KQ3) ................................................................................................................................................................... 90
APPENDIX VI. Summary of Practice Guidelines ...................................................................................... 93
APPENDIX VIa. Detailed Summary of Practice Guidelines that Mention Pharmacogenomic Testing ................ 93
APPENDIX VIb. Listing of Reviewed Practice Guidelines that Do not Mention Pharmacogenomic
Testing ............................................................................................................................................................... 100
List of Figures
Figure 1. Analytic Framework: Pharmacogenomic Testing for Selected Conditions
Figure 2. Interpretation of Cohen’s d
Figure 3. Summary of Search Results
List of Tables
Table 1. Summary of Findings, Key Question #1a: Impact of Pharmacogenomic Testing on Clinical
Decision-Making
Table 2. Summary of Findings, Key Question #1b: Impact of Pharmacogenomic Testing on Patient
Outcomes
Table 3. Summary of Findings, Key Question #4: Cost-Effectiveness of Pharmacogenomic Testing
Table 4. Summary of Practice Guidelines with Any Mention of Pharmacogenomic Testing
Table 5. Inclusion/Exclusion Criteria
WA – Health Technology Assessment October 20, 2016
Pharmacogenomic testing for selected conditions: Draft report Page v
List of Abbreviations:
CGI-S, Clinical Global Impression of Severity
CYP450, Cytochrome P450 family of metabolic enzymes
HAM-D, Hamilton Depression Rating Scale
PGx, pharmacogenomics or pharmacogenomic testing
PHQ-9, Patient Health Questionnaire
QIDS-C16, Quick Inventory of Depressive Symptomatology-Clinician Rated
Definitions:
Allele, one of a number of alternative forms of the same gene or same genetic locus; every person has 2
alleles of each gene
Analytic validity, the technical performance of the test i.e., how accurately, precisely, and robustly the
test detects what it is intended to detect
Clinical validity, the strength of association that determines the test's ability to accurately and reliably
identify or predict the disorder of interest
Clinical utility, the balance of benefits and harms when the test is used to influence patient management
Pharmacogenetics: The study of variability in drug response due to heredity, largely used in relation to
genes determining drug metabolism
Pharmacogenomics: A broad-based term that encompasses all genes in the genome that may determine
drug response; the distinction, however, is arbitrary and both pharmacogenetics and
pharmacogenomics can be used interchangeably
Polymorphism, see Variant, a version of a gene that varies at a particular region in its base-pair DNA
sequence
WA – Health Technology Assessment October 20, 2016
Pharmacogenomic testing for selected conditions: Draft report Page 1
EVIDENCE SUMMARY
Summary of Clinical Background
In 2014, there were an estimated 43.6 million (18.1%) adults in the United States with a mental illness in
the previous year. This includes approximately 9.8 million (4.2%) adults with serious mental illness.
Based on data from 2002, the National Institute of Mental Health (NIMH) estimates that the total direct
and indirect costs of serious mental illness exceeds $300 billion per year. In 2010, neuropsychiatric
disorders, which include mental and behavioral disorders, accounted for the largest proportion of
health-related disability in the United States. In 2008, 13.4% of adults in the United States received
treatment for a mental health problem. This includes all adults who received care in inpatient or
outpatient settings and/or used prescription medication for mental or emotional problems. Therefore,
the societal burden of mental and behavioral disorders is high. Pharmacotherapy is an important part of
treatment but is considered effective for only 30% to 60% of patients (Pouget et al., 2014). Adverse
events in small proportions of patients results in poor medication adherence. For many drugs, treatment
selection is empirical and multiple failed trials occur before obtaining an acceptable response without
any, or with tolerable, side effects. The following mental and behavioral illnesses are the focus of this
report: depression, psychosis, anxiety, mood disorders, attention deficit/hyperactivity disorder (ADHD),
and substance use disorder. Substance abuse will focus specifically on opioid and alcohol abuse.
Depressive disorders include disruptive mood dysregulation disorder, major depressive disorder
(including major depressive episode), persistent depressive disorder (dysthymia), premenstrual
dysphoric disorder, substance/medication-induced depressive disorder, depressive disorder due
to another medical condition, other specified depressive disorder, and unspecified depressive
disorder. In 2014, an estimated 10.2 million adults aged 18 years or older in the United States
(4.3% of all adults) had at least one major depressive episode with severe impairment limiting
the ability to carry out major life activities. Depression is usually treated with medications,
psychotherapy, or a combination of these treatments. Patients who do not respond after 4 to 8
weeks of treatment, dose adjustment, and additional monitoring may be changed to an
antidepressant from the same pharmacological class or to one from a different class.
The EVIDENCE SUMMARY summarizes background information, the methods and search results for
this report, findings with respect to the Key Questions, and payer policies and practice guidelines.
The EVIDENCE SUMMARY also includes conclusions and an assessment of the quality of the evidence
for each Key Question. In general, references are not cited in the EVIDENCE SUMMARY. The
EVIDENCE SUMMARY ends with an Overall Summary and Discussion. The TECHNICAL REPORT
provides additional detail, with full citation, regarding background information, study results, and
payer policies and guidelines, but does not include conclusions or quality assessment.
WA – Health Technology Assessment October 20, 2016
Pharmacogenomic testing for selected conditions: Draft report Page 2
Schizophrenia spectrum and other psychotic disorders include schizophrenia, other psychotic
disorders, and schizotypal (personality) disorder. Schizophrenia affects approximately 1% of the
U.S. population and is ranked among the top 20 leading causes of global disability. Schizophrenia
is typically treated with a combination of antipsychotic medication and psychosocial treatment.
Most medications are only effective in 30% to 60% of patients, with 7% of patients experiencing
a serious adverse event. Antipsychotic medication nonadherence in schizophrenia patients is
prevalent.
Anxiety disorders are characterized by excessive and persistent fear or worry that is difficult to
control and substantially interferes with daily functioning. Anxiety disorders include: panic
disorder, generalized anxiety disorder (GAD), phobias, and separation anxiety disorder. Anxiety
disorders are the most common class of mental disorder in the United States, affecting
approximately 40 million adults, or 18% of the population. Treatments for anxiety may involve a
combination of both medication and counseling but only 34.3% of patients with an anxiety
disorder receive minimally adequate healthcare treatment.
Bipolar disorder is a chronic mood disorder that causes recurrent, dramatic shifts in mood,
energy, and activity levels. There are 4 basic types, each defined by the pattern of episodes a
patient commonly experiences. In the United States, the combined prevalence of bipolar I
disorder, bipolar II disorder, and cyclothymic disorder for adolescents (ages 13 to 18) and adults
are 11.2% and 2.6%, respectively. Bipolar disorder ranks among the top 20 leading causes of
global disability and is associated with a high rate of suicide attempts. Bipolar disorder is
typically treated with a combination of medication and psychotherapies, but 20% and 60% of
patients with bipolar disorder are nonadherent to medication, leading to increased
hospitalization.
Attention-deficit/hyperactivity disorder (ADHD) is characterized by symptoms of inattention
and/or hyperactivity with impulsivity that manifest as poor concentration, overall
disorganization, propensity to not complete tasks or projects, poor school/work performance,
and issues with time management and mood control. ADHD is one of the most common
childhood-onset neurobehavioral, psychiatric disorders, affecting approximately 9% of children
aged 13 to 18 years in the United States. For 60% to 85% of affected children, ADHD persists
into adulthood. ADHD symptoms can negatively impact a person’s ability to function in more
than one domain. Treatments include medication, psychotherapy, education or training, or a
combination of treatments. Approximately 70% to 80% of children with ADHD respond to
stimulant medications with improvement in at least some domains. Patients may need to try
more than one medication or dose to find the treatment with the highest efficacy and fewest
side effects.
Substance use disorders involve excessive use of drugs that directly activate the brain’s reward
system, which is involved in behavior reinforcement and memory production.
Alcohol use disorder (AUD) is characterized by an excessive use of alcohol that increases an
individual’s risk of developing serious health problems associated with intoxication
behaviors and withdrawal symptoms. In the United States, AUDs affect approximately 16.3

WA – Health Technology Assessment October 20, 2016
Pharmacogenomic testing for selected conditions: Draft report Page 3
million adults and 679,000 adolescents (aged 12 to 17 years). Alcohol use increases the risk
of acute injury and traffic-related injuries and deaths, as well as the risk for liver disease,
cardiovascular disease, neurological deficits, several types of cancer, and psychiatric
illnesses. A number of service components, including medication, are often used in
combination as a multimodal approach for the treatment of substance use disorders.
Several medications have shown efficacy in adults for the treatment of AUD, helping to
maintain abstinence. Despite success, only 25% of people seek treatment for AUDs.
Opioid use disorder (OUD) involves the excessive use of opioids, which increase a person’s
risk for serious medical complications, including overdose. In 2014, an estimated 1.9 million
people in the United States had an OUD involving prescription pain relievers and 568,000
people had an OUD involving heroin; opioid overdose deaths hit a record high, reaching 9.0
per 100,000 people. Several medications are used for the treatment of OUDs in order to
reduce cravings and withdrawal symptoms. Limitations include the availability of treatment
programs.
Pharmacogenomics
Pharmacogenomics aims to identify relationships between base sequence variants in genes that
ultimately identify patients likely to respond to treatment or experience adverse events from specific
medications. The products of such genes are most likely to be involved in drug uptake and metabolism
(pharmacokinetics) or may have specific function at the target of drug action (pharmacodynamics).
Sequence variants of these genes may result in products with altered function.
For example the CYP2D6 cytochrome P450 (CYP450) enzyme plays a role in the metabolism of 80% of
antidepressant and antipsychotic drugs and the CYP2C19 CYP450 enzyme plays a role in the metabolism
of certain antidepressants such as citalopram, escitalopram, amitriptyline, and sertraline. Variants in
each of these genes may result in phenotypes of normal metabolizers (fully functional enzyme activity),
poor metabolizers (little to no activity), intermediate metabolizers (decreased activity, between normal
and poor), and rapid/ultrarapid metabolizers (increased enzyme activity) (Caudle et al., 2016). A patient
who is a poor metabolizer treated with an antidepressant may have greater-than-expected drug
exposure with more potential for side effects whereas an ultrarapid metabolizer given the same drug
may experience insufficient exposure and poor response. Note that these predicted results apply to an
active drug and would be opposite for a prodrug (a version of a drug that must first be metabolized into
its pharmacologically active form).
The dopaminergic and serotonergic neurotransmitter systems are central to antipsychotic drug efficacy;
therefore, much research has centered on the impact of genetic variants in the dopamine D2 receptor
(DRD2), the dopamine D3 receptor (DRD3), the serotonin 1A receptor (HTR1A), and the serotonin 2A
receptor (HTR2A) genes (Pouget et al., 2014), all examples of pharmacodynamic gene products. Variants
in these genes, and many others, are hypothesized to alter response to and clinical efficacy of
psychotropic drug treatment as well as likelihood of adverse effects.
WA – Health Technology Assessment October 20, 2016
Pharmacogenomic testing for selected conditions: Draft report Page 4
In order to personalize individual patient prescribing and improve pharmacotherapy outcomes, a
number of clinical pharmacogenomic laboratories are available, many of which offer testing services
that purport to address a range of psychotropic drugs. The primary evidence supporting the
development of these tests is evidence associating gene variants with treatment outcomes, which is just
one aspect of the clinical validity of a test. Measures of association are often reported as odds ratios
(OR), the value indicating the relative strength of association. ORs can also be converted to the
standardized mean difference, or Cohen’s d, a common measure of effect size that can be compared
across studies. For example, an OR of 2 equates to a Cohen’s d of approximately 0.2. At this value, 92%
of the gene variant–positive and gene variant–negative groups are predicted to overlap, and the number
needed to treat to have one more favorable outcome in the treatment group compared with control is
predicted to be 16.5. Using general guidelines, a Cohen’s d of 0.2 is small, 0.5 is medium, and 0.8 is
large, although these cutoff values are arbitrary and should not replace consideration of specific study
details. Predictors of small effect size are likely to perform poorly as clinical laboratory tests. Where
possible and biologic plausibility and/or statistical analysis suggests, several predictors of small effect
size may be combined in test panels to generate larger effect sizes.
Clinical Validity of Pharmacogenomic Testing for Pharmacotherapy of Selected Psychiatric Disorders
The vast majority of the published literature supporting and promoting the uptake of clinical
pharmacogenomic testing does not report on clinical utility data but rather reports associational or
clinical validity data. Clinical validity data was not included as evidence in the systematic Literature
Review section of this report. However, as important context to the key question of clinical utility, a
search for high-level evidence of clinical validity of pharmacogenomic gene-outcome associations was
conducted for inclusion in this background section and 38 systematic reviews were identified as
pertinent to the indications of interest for this report. Of 38, 12 reported only descriptive results and 26
reported meta-analysis of association results where sufficient studies were available. In the latter case,
this means that for each gene variant (or in some cases, all variants combined for a single gene) and a
selected outcome, a meta-analysis across all published studies reporting that combination was reported.
In addition, several inheritance models may be reported depending on what is and is not known about
the variant. Across all meta-analysis publications, and considering only the indication of schizophrenia,
many genes were examined for gene-outcome associations, highlighting the complexity in the biological
models used to choose candidate genes for this psychiatric condition. Therefore, we elected to
summarize genes that were reported in more than one publication, and for each gene-outcome
association we selected only the model with the most significant OR, whether or not it was statistically
significant. The selections cover a range of models and give an indication of a range of ORs that have
been reported as relevant to the selected indication. A full description of the genes reported for the
chosen example of schizophrenia can be found in APPENDIX I.
For schizophrenia, the highest OR reported is for the TNFa gene and weight gain at a protective value of
0.23 (P=0.34). Inverted, this corresponds to an OR of 4.3 and a Cohen’s d of approximately 0.35. The
highest statistically significant OR greater than 1 is 2.08 (P=0.008; Cohen’s d, 0.18), reported for CYP2D6
WA – Health Technology Assessment October 20, 2016
Pharmacogenomic testing for selected conditions: Draft report Page 5
(all variants combined) and tardive dyskinesia. The highest statistically significant OR less than 1 is for
the association of MnSOD Ala-9Val and tardive dyskinesia, OR equals 0.37 (P=0.009), inverted equals 2.7,
Cohen’s d 0.24. Therefore, despite a large number of association studies and several meta-analyses
combining results across studies, effect sizes for relevant gene-outcome associations tend to be
relatively small. These results can be compared with an opposite extreme, those for genetic variants
predicting high-risk adverse events. For example, in Han Chinese, presence of HLA-B*15:02 predicts life-
threatening Steven-Johnson syndrome at a highly statistically significant OR of 97.6, Cohen’s d 1.1.
No meta-analyses combined results for more than one gene for the same outcome to show improved
effect size. Published examples describe the selection of a group of genes with the strongest effect sizes
and briefly summarize algorithms that “prioritize and apply differential weight to potential clinical
outcomes” in order to arrive at overall treatment recommendations. Commercial pharmacogenomic
panels use patented or otherwise proprietary algorithms to synthesize the results from individual gene
variants and arrive at treatment recommendations, see examples in the Literature Review of this report.
Additional confounders of gene-outcome association studies include variation in race/ethnicity, multiple
metabolic and effector pathways that may influence outcomes, and concomitant medication and
patient comorbidity interactions with psychotropic drugs. Study designs may lack corrections for
multiple testing, large and representative populations, and may introduce additional confounders of
clinical history when enrolling chronically treated instead of psychotropic drug-naïve patients.
Taken together, information regarding the clinical validity of pharmacogenomic testing for the
indications of interest for this report is limited to associational evidence of small effect size for single
genes/gene variants and selected outcomes, lacks information on how these gene variants are
combined to make treatment recommendations, and may not take full account of common potential
confounders of these relationships. For these reasons, a report focusing on the preponderance of
available association studies would be limited in its usefulness and evidence regarding the use of
pharmacogenomic testing to prospectively guide the selection of treatment drug or dosing, compared
with treatment as usual, with measured impact on appropriate outcomes is of greater use and is the
focus of the Literature Review section of this report.
Analytic Validity of Pharmacogenomic Testing for Pharmacotherapy of Selected Psychiatric Disorders
Analytic validity for laboratory tests refers to the technical performance of the test, how accurately,
precisely, and robustly the test detects what it is intended to detect. For additional context, we searched
for information on the analytic validity of pharmacogenomic tests used in the clinical validity studies
outlined above and in those studies included in the Literature Review. One systematic review, published
in 2010, assessed 46 studies that reported on the analytic validity of genotyping 11 different CYP450
gene variants, almost half of which were related to CYP2D6. All studies reported concordance of 95% or
more, regardless of the CYP gene tested or the methods used. Few studies reported on quality control
or assay robustness. In most studies, both sensitivity and specificity were 100%. Testing for CYP450 gene
WA – Health Technology Assessment October 20, 2016
Pharmacogenomic testing for selected conditions: Draft report Page 6
variants appears highly accurate but not all aspects of analytic validity have been reported. The current
search found no analytic validity evidence for genotyping non-CYP450 genes or for commercially
available gene panels.
Policy Context A growing number of new laboratory tests and computer-based predictive algorithms are available to
assess an individual patient’s potential metabolic response to various drugs. Potential benefits include
better application of the drugs or chemotherapy choices that will work for a specific individual. Concerns
relate to whether specific tests result in improved treatment decisions and health outcomes, as well as
rapid emergence and uptake of pharmacogenomic tests generally. Concerns are considered low for
safety of these tests, high for efficacy, and medium/high for cost-effectiveness.
Summary of Review Objectives and Methods
Review Objectives
Population: People any age who are being prescribed medications for treatment of depression,
mood disorder, psychosis, anxiety, attention deficit/hyperactivity disorder (ADHD), substance
use disorder
Interventions: Clinical laboratory tests for genetic variants in targeted genes or in panels of
genes to inform the selection or dose of psychotropic medications relevant to the conditions of
interest
Comparisons: Usual care/no genetic testing
Outcomes: Patient Management: physician and patient decision-making regarding drug choice
and/or dose; improved patient adherence to treatment regimen; clinically meaningful
improvement in patient response to informed treatment and reduction in adverse events as a
result of informed treatment;
Costs: cost-effectiveness or cost
Key Questions
1. Effectiveness: What is the clinical utility of genetic testing to inform the selection or dose of
medications for individuals diagnosed with depression, mood disorders, psychosis, anxiety,
attention deficit/hyperactivity disorder (ADHD), or substance use disorder?
a. Does genetic testing to inform the selection or dose of medications change the drug or
dose selected by physicians and/or patients compared with usual care/no genetic
testing?
b. Do decisions about selection or dose of medications guided by genetic testing result in
clinically meaningful improvement in patient response to treatment or reduction in
adverse events as a result of treatment compared with decisions based on usual care/no
genetic testing?
WA – Health Technology Assessment October 20, 2016
Pharmacogenomic testing for selected conditions: Draft report Page 7
2. Harms: What direct harms are associated with conducting genetic testing when it is used to
inform the selection or dose of medications?
3. Special populations: Compared with usual care/no genetic testing, do decision-making, patient
outcomes, or harms following genetic testing to inform the selection or dose of medications
vary by:
a. Clinical history (e.g., prior treatments, whether the diagnosis is initial or recurrent,
duration of diagnosis, severity of illness, or concurrent medications); or
b. Patient characteristics (e.g., such as age, sex, or comorbidities)?
4. Costs: What are the costs and cost-effectiveness of genetic testing to guide the selection or dose
of medications?
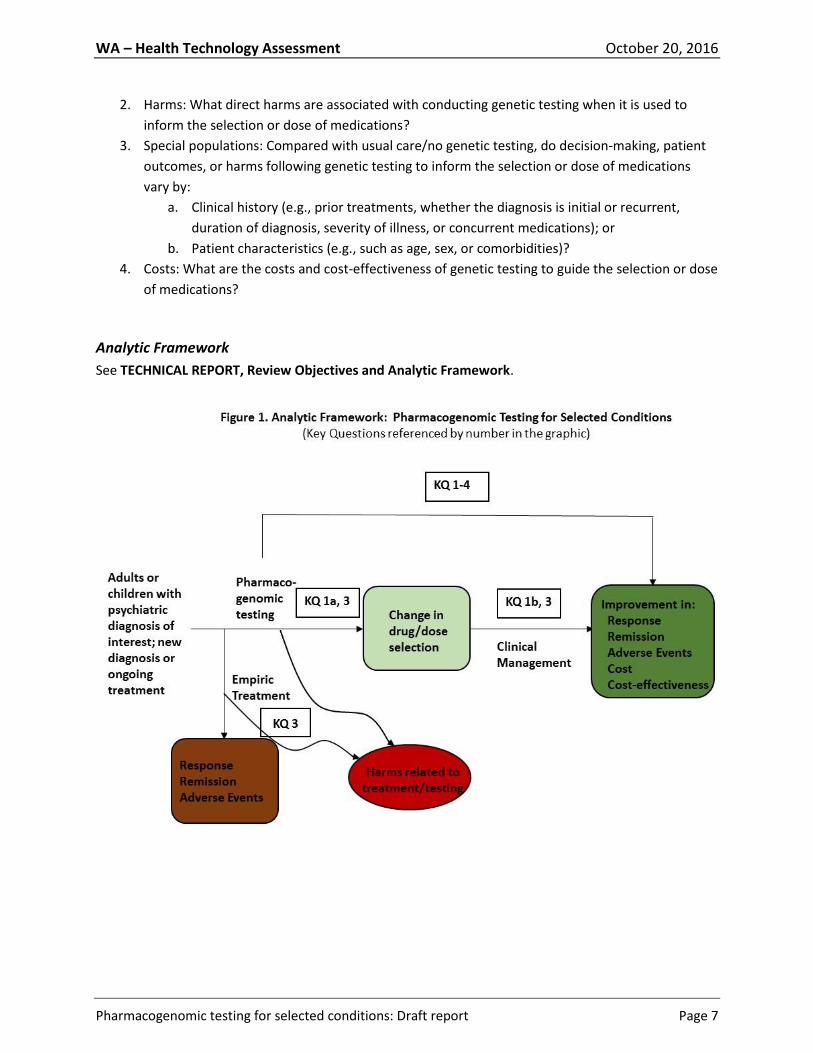
Analytic Framework
See TECHNICAL REPORT, Review Objectives and Analytic Framework.
WA – Health Technology Assessment October 20, 2016
Pharmacogenomic testing for selected conditions: Draft report Page 8
Methods See the Methods section of the TECHNICAL REPORT, APPENDIX II, and APPENDIX III for additional
detail.
Search Strategy and Selection Criteria
Before conducting a search for primary data to answer the key questions of interest, core databases,
PubMed, and the websites of relevant specialty societies were searched for systematic reviews, meta-
analyses, economic evaluations, and practice guidelines published in the last 10 years. Systematic
reviews were to be selected if they reviewed studies considered eligible for answering the Key
Questions or if they provided useful background information. The PubMed (January 1, 2000 to August
15, 2016), OVID-Embase (1996 to 2016, week 33) and PsycINFO (1987 to July, week 4, 2016) databases
were searched for primary studies and economic evaluations designed to answer the Key Questions.
Inclusion Criteria
Population
People any age who are being prescribed medications for treatment of any of the conditions
of interest
Interventions
Clinical laboratory tests for genetic variants in targeted genes or in panels of genes to inform
the selection or dose of psychotropic medications relevant to the conditions of interest
Comparators
Usual care/no genetic testing
Outcomes
Patient Management (KQ1)
Physician and patient decision-making regarding drug choice and/or dose
Improved patient adherence to treatment regimen
Clinically meaningful improvement in patient response to treatment and reduction in
adverse events as a result of treatment
Costs (KQ2)
Cost
Cost-effectiveness
More detailed aspects of these criteria and the rationale for these criteria are presented in the
METHODS section of the TECHNICAL REPORT.
Exclusion Criteria
Population
WA – Health Technology Assessment October 20, 2016
Pharmacogenomic testing for selected conditions: Draft report Page 9
Patients being treated for any other condition for which pharmacogenomics testing may be
considered
Interventions
Non-DNA–based laboratory tests
Comparators
Treatment decisions based on other stipulated patient characteristics in addition to clinical
laboratory tests for genetic variants
Outcomes
Outcomes other than those measuring treatment response, adverse events or related
outcomes; cost outcomes not related to genetic testing
More detailed aspects of these criteria and the rationale for these criteria are presented in the
METHODS section of the TECHNICAL REPORT.
Quality Assessment
The process used by Hayes for assessing the quality of primary studies and bodies of evidence is in
alignment with the methods recommended by the Grading of Recommendations, Assessment,
Development and Evaluation (GRADE) Working Group. Like the GRADE Working Group, Hayes uses the
phrase quality of evidence to describe bodies of evidence in the same manner that other groups, such as
the Agency for Healthcare Research and Quality (AHRQ), use the phrase strength of evidence. A tool
created for internal use at Hayes was used to guide interpretation and critical appraisal of economic
evaluations. The tool for economic evaluations was based on best practices as identified in the literature
and addresses issues such as the reliability of effectiveness estimates, transparency of the report,
quality of analysis (e.g., the inclusion of all relevant costs, benefits, and harms),
generalizability/applicability, and conflicts of interest. The Rigor of Development domain of the
Appraisal of Guidelines Research and Evaluation (AGREE) tool, along with a consideration of commercial
funding and conflicts of interest among the guideline authors, was used to assess the quality of practice
guidelines. See the Methods section of the TECHNICAL REPORT and APPENDIX III for details on quality
assessment methods.
Summary of Search Results Fourteen studies were selected for detailed analysis as evidence pertaining to the Key Questions. These
include 4 studies addressing Key Question 1a (clinical utility, medical decision-making), 9 studies
addressing Key Question 1b (clinical utility, patient outcomes), which were also assessed for Key
Question 3 (subgroups), and 7 studies addressing Key Question 4 (economic outcomes). No unique
studies were identified for Key Question 2 (harms of testing).
See APPENDIX IV for a list of the 19 studies that were excluded from analysis after full-text review.
WA – Health Technology Assessment October 20, 2016
Pharmacogenomic testing for selected conditions: Draft report Page 10
Twelve practice guidelines, that had any language regarding pharmacogenomic testing and were
published in the last 10 years, were identified. Several other guidelines, from prominent professional
organizations, that had no such language are also listed.
Findings Summary of Findings tables follow each Key Question. See EVIDENCE SUMMARY, Methods, Quality
Assessment and the corresponding section in the TECHNICAL REPORT, as well as APPENDIX III, for
further details regarding the assessment of bodies of evidence. See APPENDIX V for full evidence tables.
Key Question #1: Effectiveness: What is the clinical utility of genetic testing to inform the selection or dose of medications for individuals diagnosed with depression, mood disorders, psychosis, anxiety, attention deficit/hyperactivity disorder (ADHD), or substance use disorder?
a. Does genetic testing to inform the selection or dose of medications change the drug or dose selected by physicians and/or patients compared with usual care/no genetic testing?
Four studies reported results of using pharmacogenomic genotyping to aid in clinical decision-making.
All studies enrolled patients diagnosed with depressive disorder.
See Table 1 for a summary of findings.
Two prospective double-blind randomized controlled trials of fair quality, 1 prospective open-label
cohort study of poor quality, and 1 retrospective comparative study of poor quality reported that
pharmacogenomic test results, either single-gene or multiple-gene panels, consistently led medication
treatment prescribers to change their treatment compared with treatment as usual. Sample sizes were
small and some study populations were limited by race/ethnicity, which reduces the risk for
confounding but limits generalizability of the results. Outcomes were measured differently across
studies, so the amount of change and precision of the result is unknown. The overall quality of the body
of evidence to answer Key Question 1a was considered to be of low quality. The limited results
regarding clinical decision-making suggest that pharmacogenomic test results, whether derived from
single-gene tests or interpretive panels, may change prescribing patterns in favor of pharmacogenomic
recommendations compared with treatment as usual. Evidence that pharmacogenomic testing informs
the selection and/or dose of medications is an intermediate outcome of clinical utility and does not in
itself demonstrate improved patient outcomes. This is addressed in Key Question 1b.
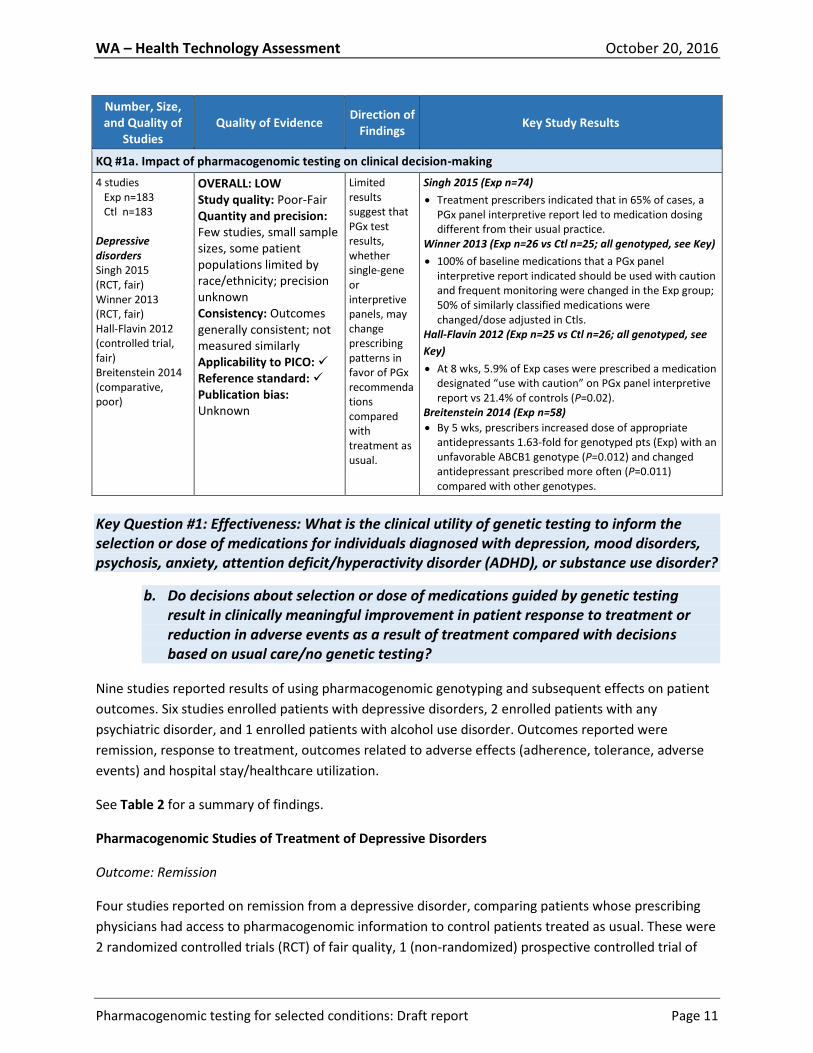
Table 1. Impact of Pharmacogenomic Testing on Clinical Decision-Making
Key: Ctl, control group for which genotyping results were available to the prescribing physician at the end of the treatment period or not available at all, depending on study design; Exp, experimental or genotyped treatment group for which results were immediately available to prescribing physicians; PGx, pharmacogenomic; PICO, population, intervention, comparator, outcome; RCT, randomized controlled trial
WA – Health Technology Assessment October 20, 2016
Pharmacogenomic testing for selected conditions: Draft report Page 11
Number, Size, and Quality of
Studies Quality of Evidence
Direction of Findings
Key Study Results
KQ #1a. Impact of pharmacogenomic testing on clinical decision-making
4 studies Exp n=183 Ctl n=183 Depressive disorders Singh 2015 (RCT, fair) Winner 2013 (RCT, fair) Hall-Flavin 2012 (controlled trial, fair) Breitenstein 2014 (comparative, poor)
OVERALL: LOW Study quality: Poor-Fair Quantity and precision: Few studies, small sample sizes, some patient populations limited by race/ethnicity; precision unknown Consistency: Outcomes generally consistent; not measured similarly Applicability to PICO: Reference standard: Publication bias: Unknown
Limited results suggest that PGx test results, whether single-gene or interpretive panels, may change prescribing patterns in favor of PGx recommendations compared with treatment as usual.
Singh 2015 (Exp n=74)
Treatment prescribers indicated that in 65% of cases, a PGx panel interpretive report led to medication dosing different from their usual practice.
Winner 2013 (Exp n=26 vs Ctl n=25; all genotyped, see Key)
100% of baseline medications that a PGx panel interpretive report indicated should be used with caution and frequent monitoring were changed in the Exp group; 50% of similarly classified medications were changed/dose adjusted in Ctls.
Hall-Flavin 2012 (Exp n=25 vs Ctl n=26; all genotyped, see
Key)
At 8 wks, 5.9% of Exp cases were prescribed a medication designated “use with caution” on PGx panel interpretive report vs 21.4% of controls (P=0.02).
Breitenstein 2014 (Exp n=58)
By 5 wks, prescribers increased dose of appropriate antidepressants 1.63-fold for genotyped pts (Exp) with an unfavorable ABCB1 genotype (P=0.012) and changed antidepressant prescribed more often (P=0.011) compared with other genotypes.
Key Question #1: Effectiveness: What is the clinical utility of genetic testing to inform the selection or dose of medications for individuals diagnosed with depression, mood disorders, psychosis, anxiety, attention deficit/hyperactivity disorder (ADHD), or substance use disorder?
b. Do decisions about selection or dose of medications guided by genetic testing result in clinically meaningful improvement in patient response to treatment or reduction in adverse events as a result of treatment compared with decisions based on usual care/no genetic testing?
Nine studies reported results of using pharmacogenomic genotyping and subsequent effects on patient
outcomes. Six studies enrolled patients with depressive disorders, 2 enrolled patients with any
psychiatric disorder, and 1 enrolled patients with alcohol use disorder. Outcomes reported were
remission, response to treatment, outcomes related to adverse effects (adherence, tolerance, adverse
events) and hospital stay/healthcare utilization.
See Table 2 for a summary of findings.
Pharmacogenomic Studies of Treatment of Depressive Disorders
Outcome: Remission
Four studies reported on remission from a depressive disorder, comparing patients whose prescribing
physicians had access to pharmacogenomic information to control patients treated as usual. These were
2 randomized controlled trials (RCT) of fair quality, 1 (non-randomized) prospective controlled trial of

WA – Health Technology Assessment October 20, 2016
Pharmacogenomic testing for selected conditions: Draft report Page 12
fair quality, and 1 retrospective comparative study of poor quality. Follow-up times were reasonable for
all studies. All studies used generally accepted definitions of minimal clinically important differences
(MCID) for outcomes reported, although 1 study may fall short of validated definitions.
Results suggest improved remission rates as a result of genotyping but there were several limitations to
the body of evidence. The results of the comparative study may lack clinical relevance due to the MCID
used. The prospective controlled trial had a high risk for bias due to high losses to follow-up (27%) and
reliance on data imputation for statistical significance for 2 of 3 depression scores, reducing our
confidence that the groups were comparable. One RCT was underpowered to discriminate between
groups. The other RCT reports the most statistically significant results for the outcome of remission
using a commercial pharmacogenomic panel test that is not currently available in the United States. In
summary, despite consistency of results favoring improved remission rates as a result of genotyping, the
quality of the evidence is low and our confidence that the results represent a true effect is therefore
also low. Notably, because the methods used to generate interpretations of the individual genetic
variant results and the methods used to derive overall clinical recommendations for drug selection and
dose are not known, the clinical utility performance of one specific panel test is not generalizable to that
of any other pharmacogenomic test.
Outcome: Response to Treatment
Four studies reported on response to treatment of depressive disorders. These were 2 RCTs of fair
quality, 1 prospective controlled trial of fair quality, and 1 comparative study of very poor quality.
Response to treatment of depression is typically measured as a reduction in score of 50% or more for
well-validated instruments. Overall, the results for response to treatment, comparing pharmacogenomic
testing–informed prescribing with treatment as usual, lack consistency, are limited in some cases by lack
of acceptable measures of response, or were underpowered. The overall quality of the evidence is low.
Best results are reported by a fair-quality prospective controlled trial that used 3 such measures of
response and showed that patients whose prescribing physicians had access to results from a U.S.-based
pharmacogenomic genotyping panel were statistically significantly more likely to respond than control
patients who were prescribed treatment as usual for 8 weeks. These results were obtained both for
remaining patients after 27% loss to follow-up and for imputed data, except for one imputed instrument
score. As already noted, pharmacogenomic panel test results are not generalizable to other
pharmacogenomic tests, as the methods used to generate interpretations of the individual genetic
variant results are not known.
The same U.S.-based assay was used in a second fair-quality prospective controlled trial and obtained
statistically significant reductions in depression severity scores, but did not use a criterion to define
response, rendering results less clinically interpretable. Power analyses assumed only 20% to 25%
reductions in scores. A poor-quality retrospective comparative study also did not use usual criteria for
defining response to treatment; did not define the clinical relevance of measures used to compare
response; and in most comparisons, did not obtain statistically significant results. The RCT was
WA – Health Technology Assessment October 20, 2016
Pharmacogenomic testing for selected conditions: Draft report Page 13
underpowered and results favoring improved response of genotyped patients were not statistically
significant.
Outcome: Adherence, Tolerance, Adverse Events; Hospital Stay
One fair-quality RCT reported on tolerance of medications, finding that non-genotyped control patients
were less tolerant of medications, statistically significantly more often requiring dose reduction or
cessation. In addition, genotyped patients took sick leave less often, and took leave times of shorter
duration when needed, compared with non-genotyped patients.
In a poor-quality retrospective comparative study, patients who were prescribed dose increases for
genotype-appropriate antidepressants had statistically significantly shorter hospital stays, which were
reduced by an average of 4.7 weeks if the antidepressant dose was increased by more than 1.5-fold.
While favoring pharmacogenomic genotyping, the evidence supporting pharmacogenomic impact on
outcomes related to adverse events and to duration of hospital stay is of very low quality, limited to 1
trial each and, as such, is insufficient for conclusions.
Pharmacogenomic Studies of Treatment of Any Psychiatric Disorder
Two retrospective comparative studies of poor quality (overall, very-low-quality body of evidence)
enrolled patients diagnosed with any psychiatric disorder. In both studies, one group was selected
because attending physicians had ordered pharmacogenomic testing. Similar control groups were
selected from the same source of patients. One study used propensity score matching to choose an
equivalent control group.
One study, using a large commercial pharmacogenomic assay panel developed in Spain and not available
in the U.S., reported global severity scores statistically significantly lower than baseline when
pharmacogenomic testing results informed treatment compared with treatment as usual. The other
study used a U.S.-based panel assay to provide interpretations to prescribing physicians compared with
treatment as usual, and reported a statistically significant average increase in drug treatment adherence
with pharmacogenomic testing.
Pharmacogenomic Studies of Treatment of Alcohol Use Disorder
One fair-quality prospective observational study of patients with alcohol use disorder and treated in an
RCT with naltrexone versus placebo was stratified by OPRM1 gene variants asp40 (predicted to improve
naltrexone response) and asn40. While results were not statistically significant, their direction was
opposite to that expected in that the naltrexone-asp40 group was more likely to drink heavily.
Therefore, very-low-quality evidence from 1 fair-quality study is insufficient evidence to draw
conclusions.

WA – Health Technology Assessment October 20, 2016
Pharmacogenomic testing for selected conditions: Draft report Page 14
Overall Summary of Key Question #1 Evidence
Only 9 studies were included for Key Question #1 and these do not address all the indications of interest
for this report. In some cases, populations were limited by race and ethnicity, which reduces potential
genotype confounders, but also reduces generalizability of results. Four studies were rated fair quality, 4
poor quality, and 1 very poor quality. Only the fair-quality studies were prospectively designed. Of these,
1 RCT was seriously underpowered, as evidenced by a power analysis, which concluded that 92 to 115
patients were needed in each trial arm whereas 25 and 26 were enrolled. Therefore, all results had no
statistical significance. One reasonably well-designed RCT, with statistically significant treatment
response and remission results supporting pharmacogenomic testing for patients with major depressive
disorder, used a commercial interpretive panel assay that is not available in the United States. As noted,
pharmacogenomic panel tests are not generalizable to other pharmacogenomic tests, as the methods
used to generate clinical interpretations and treatment recommendations from the individual genetic
variant results are not known.
Two prospective controlled (nonrandomized) trials conducted using the same U.S.-based commercial
interpretive pharmacogenomic panel both reported statistically significant remission and/or response to
treatment results. Only one of these appropriately defined clinical measures of remission and response
but lacked some consistency of results between those calculated from the remaining patients (27% lost
to follow-up) and those calculated using imputed data. Among poor-quality studies, all were
retrospective and some did not define the clinical relevance of treatment response measures. For the 2
studies that enrolled patients with any psychiatric disorder and the pharmacogenomic assays used in
these studies, patient numbers were too few, study quality poor, and results too sparse for conclusions
regarding the impact of pharmacogenomic testing on treatment response or adverse event–related
outcomes. The authors of the single study on pharmacogenomic variant testing to improve response to
naltrexone for alcohol use disorder concluded that the variant in question likely did not moderate the
response.
In summary, the evidence base for pharmacogenomic testing for the psychiatric disorders of interest for
this report is extremely limited and compromised and considered to be of low to very low quality,
depending on the outcome measured. As such, the evidence is insufficient for conclusions regarding
clinical use.
Table 2. Impact of Pharmacogenomic Testing on Patient Outcomes
Key: asp40 and asn40, genetic variants of the OPRM1 gene; CGI-S, Clinical Global Impression of Severity; Ctl, control group for which genotyping results were available at the end of the treatment period or not available at all, depending on study design; Exp, experimental or genotyped treatment group for which results were immediately available to prescribing physicians; HAM-D, Hamilton Depression Rating Scale (21 items unless otherwise specified); PGx, pharmacogenomic; PHQ-9, Patient Health Questionnaire (9 items); PICO, population, intervention, comparator, outcome; pt(s), patient(s); QIDS-C1 6, Quick Inventory of Depressive Symptomatology-Clinician Rated (16 items); RCT, randomized controlled trial

WA – Health Technology Assessment October 20, 2016
Pharmacogenomic testing for selected conditions: Draft report Page 15
Number, Size, and Quality of
Studies Quality of Evidence
Direction of Findings
Key Study Results (statistically significant results bolded)
KQ #1b. Impact of pharmacogenomic testing on patient outcomes
KQ #1b. Outcome: Remission
4 studies Exp n=272 Ctl n=270 Depressive disorders Winner 2013 (RCT, fair) Singh 2015 (RCT, fair) Hall-Flavin 2013 (controlled trial, fair) Breitenstein 2014 (comparative, poor)
OVERALL: LOW Study quality: Poor-Fair Quantity and precision: Few studies, small sample sizes, studies do not address all indications of interest, some pt populations limited by race/ethnicity; precision unknown Consistency: Remission outcomes range from highly statistically significant to not significant, may be related to study size; not all measured similarly Applicability to PICO: Reference standard: Publication bias: Unknown
In all studies, the direction of results suggests that genotyped pts are more likely to obtain remission. But results are not consistently statistically significant and in 1 study may not be clinically relevant.
Winner 2013 (Exp n=26 vs Ctl n=25, see Key)
At 10 wks 20% of Exp pts vs, 8.3% of Ctl pts achieved remission (Ham-D17 <7) (OR=2.75; 95% CI, 0.48-15.8; P=NS).
Singh 2015 (Exp n=74 vs Ctl n=74, see Key)
At 12 wks, Exp pts more often obtained remission (HAM-
D17 <7) (OR=2.52; 95% CI, 1.71-3.73; P<0.0001). Number needed to test for remission=3 (95% CI, 1.7-3.5).
Hall-Flavin 2013 (Exp n=114 vs Ctl n=113, see Key)
At 8 wks, more Exp pts obtained remission (QIDS-C16<6) compared with Ctl pts (OR=2.42; 95% CI, 1.09-5.39; P=0.03).
HAM-D17 and PHQ-9 results were not significantly different except for results using data imputation to account for 27% lost to follow-up.
Breitenstein 2014 (Exp n=58 vs Ctl n=58, see Key)
Exp pts more often in remission (HAM-D <10) at treatment wk 4 compared with Ctl pts (83.6% vs 62.1%; P=0.005). HAM-D at admission >14. Required change in score may not be clinically relevant.
KQ #1b. Outcome: response to treatment
6 studies Exp n=365 Ctl n=413 Depressive disorders Winner 2013 (RCT, fair) Hall-Flavin 2013 (controlled trial, fair) Hall-Flavin 2012 (controlled trial, fair) Rundell 2011 (comparative, very poor) Any psychiatric diagnosis Espadaler 2016 (comparative, poor) Alcohol use Oslin 2015
OVERALL: LOW Study quality: Very poor-Fair Quantity and precision: Studies limited in quantity and size, studies do not address all indications of interest, some pt populations limited by race/ethnicity; precision unknown Consistency: Response outcomes range from highly statistically significant to not significant; not all measured similarly; studies may not define clinically significant response; better study designs tend to obtain statistically significant results, depending on size
Results are in the direction of improved response for genotyped patients. Only 1 study used defined measures of response and obtained statistically significant results. In the naltrexone trial for alcohol use, results were opposite those of prior studies, although not statistically significant.
Winner 2013 (Exp n=26 vs Ctl n=25, all genotyped, see Key)
At 10 wks, 36% of Exp pts responded (>50% reduction in HAM-D17) vs 20.8% of Ctl pts (OR=2.14; 95% CI, 0.59-7.69; P=NS).
Hall-Flavin 2013 (Exp n=114 vs Ctl n=113, all genotyped, see Key)
At 8 wks more Exp pts responded (>50% reduction in score from baseline) vs Ctl pts as measured by:
QIDS-C16 (OR=2.58; 95% CI, 1.33-5.03; P=0.005),
HAM-D17 (OR=2.06; 95% CI, 1.07-3.95; P=0.03), and
PHQ-9 (OR=2.27; 95% CI 1.20-4.30; P=0.01).
Results using data imputation to account for 27% loss to follow-up were statistically significant except for QIDS-C16.
Hall-Flavin 2012 (Exp n=25 vs Ctl n=26; all genotyped, see
Key)
8-wk score reductions:
QIDS-C16: 31.2% for Exp pts vs 7.2% for controls (P=0.002).
HAM-D17: 30.8% for Exp pts vs 18.2% for controls (P=0.04).
Rundell 2011 (Exp n=29 vs Ctl n=17, see Key)
CYP450 categories: No significant differences in serial PHQ-9 scores over time.
WA – Health Technology Assessment October 20, 2016
Pharmacogenomic testing for selected conditions: Draft report Page 16
Number, Size, and Quality of
Studies Quality of Evidence
Direction of Findings
Key Study Results (statistically significant results bolded)
(observational within RCT, fair)
Applicability to PICO: Reference standard: Publication bias: Unknown
5-HTTLPR categories: L/L genotype pts had greater PHQ-9 score improvement than other genotypes at times 4 and 5 (P=0.02 to P=0.05).
Adjusted post-day 14 PHQ-9 scale slopes and differences in pre- to post-baseline scale slopes were not significantly different among genotype categories.
Espadaler 2016 (Exp n=89 vs Ctl n=93, see Key)
At 3 months, 93% (Exp) vs 82% (Ctl) had CGI-S scores lower than baseline (adjusted OR=3.86; 95% CI, 1.36-10.95; P=0.011).
Oslin 2015 (Exp n=38 naltrexone + 44 placebo, all asp40 see Key) (Ctl n=73 naltrexone + 66 placebo, all asn40 see Key)
Exp (asp40, favorable genotype) pts: OR for heavy drinking in the naltrexone group was 1.10 (95% CI, 0.52-2.31; P=0.80) compared with placebo.
Ctl (asn40, unfavorable genotype) pts: OR for heavy drinking in the naltrexone group was 0.69 (95% CI, 0.41-1.18; P=0.17) compared with placebo.
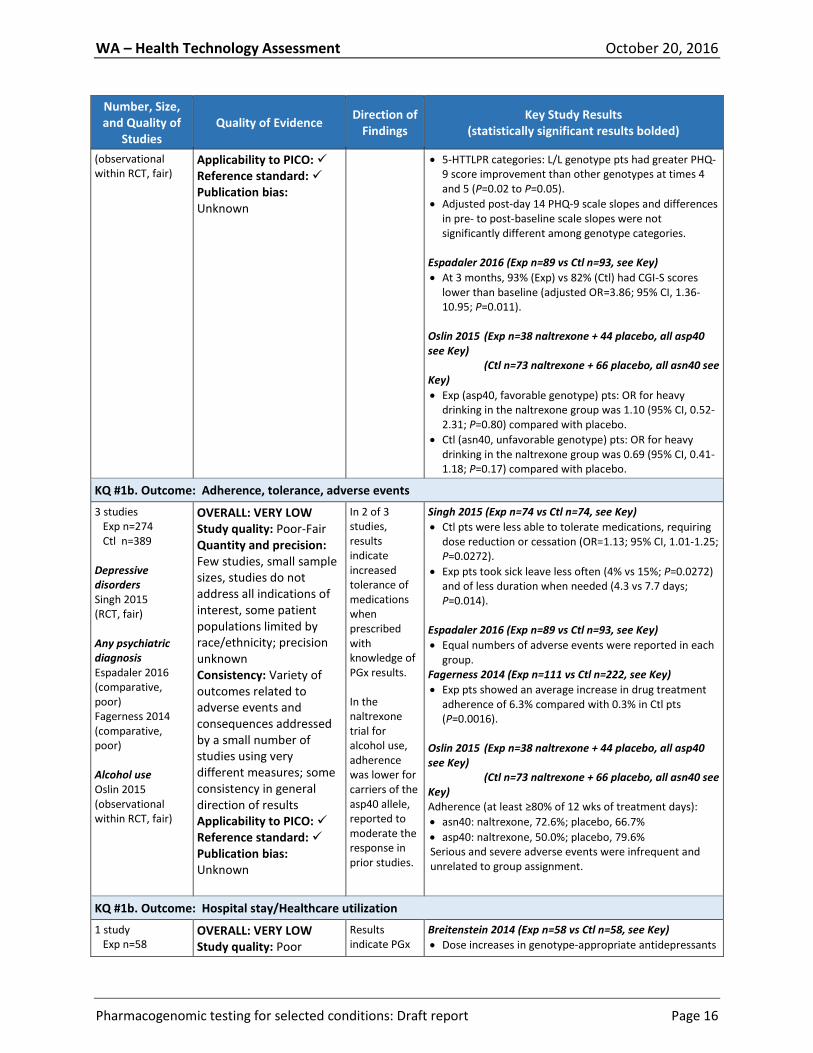
KQ #1b. Outcome: Adherence, tolerance, adverse events
3 studies Exp n=274 Ctl n=389 Depressive disorders Singh 2015 (RCT, fair) Any psychiatric diagnosis Espadaler 2016 (comparative, poor) Fagerness 2014 (comparative, poor) Alcohol use Oslin 2015 (observational within RCT, fair)
OVERALL: VERY LOW Study quality: Poor-Fair Quantity and precision: Few studies, small sample sizes, studies do not address all indications of interest, some patient populations limited by race/ethnicity; precision unknown Consistency: Variety of outcomes related to adverse events and consequences addressed by a small number of studies using very different measures; some consistency in general direction of results Applicability to PICO: Reference standard: Publication bias: Unknown
In 2 of 3 studies, results indicate increased tolerance of medications when prescribed with knowledge of PGx results. In the naltrexone trial for alcohol use, adherence was lower for carriers of the asp40 allele, reported to moderate the response in prior studies.
Singh 2015 (Exp n=74 vs Ctl n=74, see Key)
Ctl pts were less able to tolerate medications, requiring dose reduction or cessation (OR=1.13; 95% CI, 1.01-1.25; P=0.0272).
Exp pts took sick leave less often (4% vs 15%; P=0.0272) and of less duration when needed (4.3 vs 7.7 days; P=0.014).
Espadaler 2016 (Exp n=89 vs Ctl n=93, see Key)
Equal numbers of adverse events were reported in each group.
Fagerness 2014 (Exp n=111 vs Ctl n=222, see Key)
Exp pts showed an average increase in drug treatment adherence of 6.3% compared with 0.3% in Ctl pts (P=0.0016).
Oslin 2015 (Exp n=38 naltrexone + 44 placebo, all asp40 see Key) (Ctl n=73 naltrexone + 66 placebo, all asn40 see Key) Adherence (at least ≥80% of 12 wks of treatment days):
asn40: naltrexone, 72.6%; placebo, 66.7%
asp40: naltrexone, 50.0%; placebo, 79.6% Serious and severe adverse events were infrequent and unrelated to group assignment.
KQ #1b. Outcome: Hospital stay/Healthcare utilization
1 study Exp n=58
OVERALL: VERY LOW Study quality: Poor
Results indicate PGx
Breitenstein 2014 (Exp n=58 vs Ctl n=58, see Key)
Dose increases in genotype-appropriate antidepressants
WA – Health Technology Assessment October 20, 2016
Pharmacogenomic testing for selected conditions: Draft report Page 17
Number, Size, and Quality of
Studies Quality of Evidence
Direction of Findings
Key Study Results (statistically significant results bolded)
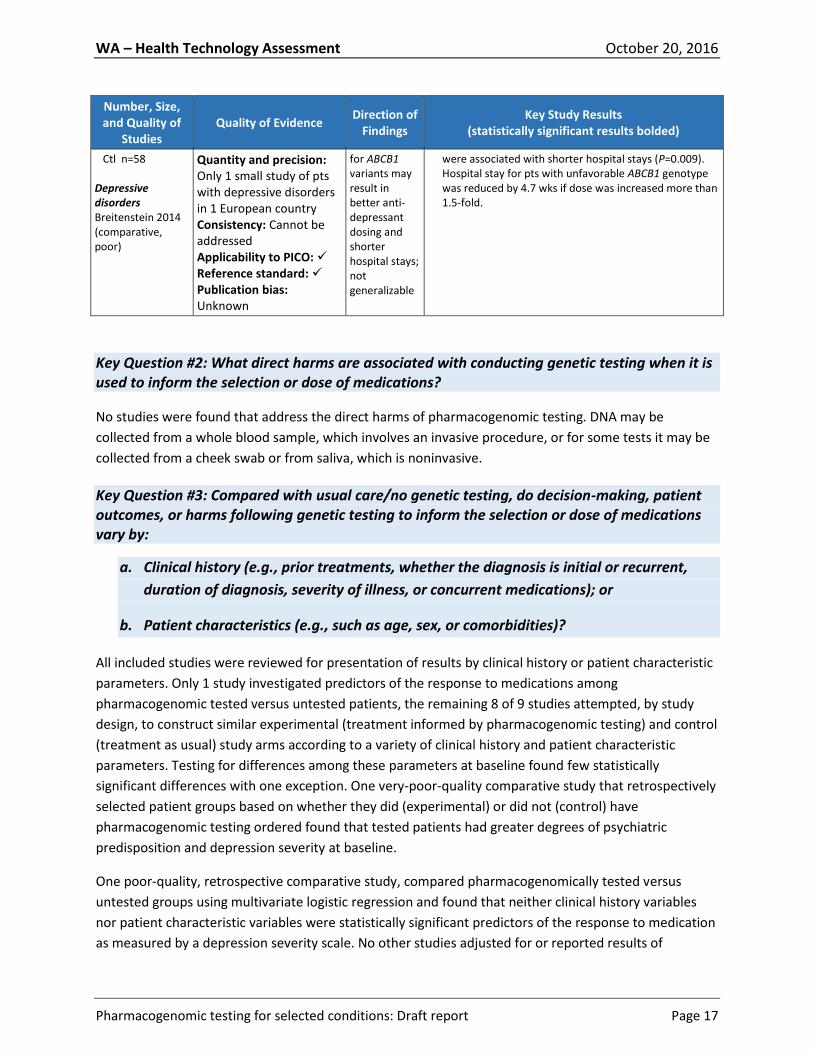
Ctl n=58 Depressive disorders Breitenstein 2014 (comparative, poor)
Quantity and precision: Only 1 small study of pts with depressive disorders in 1 European country Consistency: Cannot be addressed Applicability to PICO: Reference standard: Publication bias: Unknown
for ABCB1 variants may result in better anti-depressant dosing and shorter hospital stays; not generalizable
were associated with shorter hospital stays (P=0.009). Hospital stay for pts with unfavorable ABCB1 genotype was reduced by 4.7 wks if dose was increased more than 1.5-fold.
Key Question #2: What direct harms are associated with conducting genetic testing when it is used to inform the selection or dose of medications?
No studies were found that address the direct harms of pharmacogenomic testing. DNA may be
collected from a whole blood sample, which involves an invasive procedure, or for some tests it may be
collected from a cheek swab or from saliva, which is noninvasive.
Key Question #3: Compared with usual care/no genetic testing, do decision-making, patient outcomes, or harms following genetic testing to inform the selection or dose of medications vary by:
a. Clinical history (e.g., prior treatments, whether the diagnosis is initial or recurrent,
duration of diagnosis, severity of illness, or concurrent medications); or
b. Patient characteristics (e.g., such as age, sex, or comorbidities)?
All included studies were reviewed for presentation of results by clinical history or patient characteristic
parameters. Only 1 study investigated predictors of the response to medications among
pharmacogenomic tested versus untested patients, the remaining 8 of 9 studies attempted, by study
design, to construct similar experimental (treatment informed by pharmacogenomic testing) and control
(treatment as usual) study arms according to a variety of clinical history and patient characteristic
parameters. Testing for differences among these parameters at baseline found few statistically
significant differences with one exception. One very-poor-quality comparative study that retrospectively
selected patient groups based on whether they did (experimental) or did not (control) have
pharmacogenomic testing ordered found that tested patients had greater degrees of psychiatric
predisposition and depression severity at baseline.
One poor-quality, retrospective comparative study, compared pharmacogenomically tested versus
untested groups using multivariate logistic regression and found that neither clinical history variables
nor patient characteristic variables were statistically significant predictors of the response to medication
as measured by a depression severity scale. No other studies adjusted for or reported results of

WA – Health Technology Assessment October 20, 2016
Pharmacogenomic testing for selected conditions: Draft report Page 18
subgroups analyses according to clinical history or patient characteristic variables. Taken together, the
evidence is insufficient for forming conclusions.
Key Question #4: What are the costs and cost-effectiveness of genetic testing to guide the selection or dose of medications?
The literature search identified 7 economic assessments that compared the cost of pharmacogenomic
testing versus usual care for psychiatric conditions. The results of 3 cost-comparison studies suggest that
employment of pharmacogenomic testing is associated with reduced total costs for healthcare.
Medication costs in tested patients were greater than non-tested patients in 1 study and less in another
study. Two studies reported that medication adherence was higher in patients who were tested versus
those who were not tested. Of the 2 cost-effectiveness studies, 1 reported that pharmacogenomics
testing was not cost-effective and the other found that it was moderately cost-effective. One additional
study found that patients were willing to pay for pharmacogenomic testing if it reduced the number of
medication trials or the amount of time for correct dosing to be achieved. The studies are summarized in
the following paragraphs.
See Table 3 for a summary of findings.
The economic evidence base includes studies of different designs and study populations each
incorporating different pharmacogenomic tests that were compared with no-test treatment regimens.
Results in some cases suggested cost-effectiveness but lacked consistency overall. There were
indications that results may depend at least partly on test cost and on the effect size of the clinical
validity evidence supporting the pharmacogenomic test. In a survey of non-patients, the utility of testing
increases with decreases in the number of changes in medications or reduced times for dosage
adjustments.
Table 3. Cost-Effectiveness of Pharmacogenomic Testing
Key: ↑, increase(d); ↓, reduce(d); avg, average; Ctl, control; ICER, incremental cost-effectiveness ratio; k, 1000; med, medication; PGx, pharmacogenomic; pts, patients; QALW, quality-adjusted life-weeks; QALY, quality-adjusted life-years; STAR*D, Sequenced Treatment Alternatives to Relieve Depression study; tx, treatment; W, western
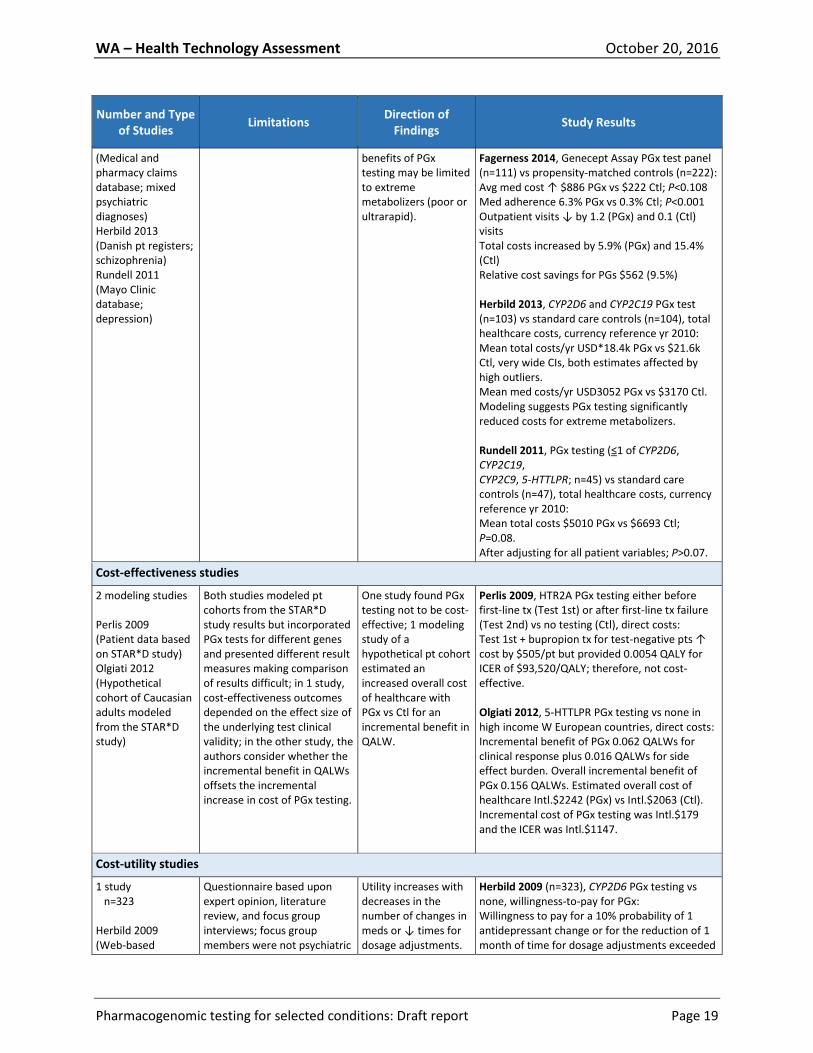
Number and Type of Studies
Limitations Direction of
Findings Study Results
Cost-comparison studies
4 studies Exp n=1921 Ctl n=11253 Winner 2015 (Pharmacy benefits provider database; mixed psychiatric diagnoses) Fagerness 2014
Results are not comparable across studies. Each used different types of sources, enrolled pts with different indications, and used different measures for cost comparison.
Results of 3 of 4 cost-comparison studies suggest that employment of PGx testing is associated with reduced total costs for healthcare; however, results in 1 study suggested that significant cost
Winner 2015, GeneSight PGx test panel (n=1662) vs propensity-matched Ctl (n=10,880): Avg med cost ↑ $690 PGx vs $1725 Ctl; P<0.0001 Med adherence rate +0.11 PGx vs -0.01 Ctl; P<0.0001 Meds congruent with PGx test results had net annual cost savings of $2775 vs incongruent meds; P<0.0001
WA – Health Technology Assessment October 20, 2016
Pharmacogenomic testing for selected conditions: Draft report Page 19
Number and Type of Studies
Limitations Direction of
Findings Study Results
(Medical and pharmacy claims database; mixed psychiatric diagnoses) Herbild 2013 (Danish pt registers; schizophrenia) Rundell 2011 (Mayo Clinic database; depression)
benefits of PGx testing may be limited to extreme metabolizers (poor or ultrarapid).
Fagerness 2014, Genecept Assay PGx test panel (n=111) vs propensity-matched controls (n=222): Avg med cost ↑ $886 PGx vs $222 Ctl; P<0.108 Med adherence 6.3% PGx vs 0.3% Ctl; P<0.001 Outpatient visits ↓ by 1.2 (PGx) and 0.1 (Ctl) visits Total costs increased by 5.9% (PGx) and 15.4% (Ctl) Relative cost savings for PGs $562 (9.5%) Herbild 2013, CYP2D6 and CYP2C19 PGx test (n=103) vs standard care controls (n=104), total healthcare costs, currency reference yr 2010: Mean total costs/yr USD*18.4k PGx vs $21.6k Ctl, very wide CIs, both estimates affected by high outliers. Mean med costs/yr USD3052 PGx vs $3170 Ctl. Modeling suggests PGx testing significantly reduced costs for extreme metabolizers. Rundell 2011, PGx testing (≤1 of CYP2D6, CYP2C19, CYP2C9, 5-HTTLPR; n=45) vs standard care controls (n=47), total healthcare costs, currency reference yr 2010: Mean total costs $5010 PGx vs $6693 Ctl; P=0.08. After adjusting for all patient variables; P>0.07.
Cost-effectiveness studies
2 modeling studies Perlis 2009 (Patient data based on STAR*D study) Olgiati 2012 (Hypothetical cohort of Caucasian adults modeled from the STAR*D study)
Both studies modeled pt cohorts from the STAR*D study results but incorporated PGx tests for different genes and presented different result measures making comparison of results difficult; in 1 study, cost-effectiveness outcomes depended on the effect size of the underlying test clinical validity; in the other study, the authors consider whether the incremental benefit in QALWs offsets the incremental increase in cost of PGx testing.
One study found PGx testing not to be cost-effective; 1 modeling study of a hypothetical pt cohort estimated an increased overall cost of healthcare with PGx vs Ctl for an incremental benefit in QALW.
Perlis 2009, HTR2A PGx testing either before first-line tx (Test 1st) or after first-line tx failure (Test 2nd) vs no testing (Ctl), direct costs: Test 1st + bupropion tx for test-negative pts ↑ cost by $505/pt but provided 0.0054 QALY for ICER of $93,520/QALY; therefore, not cost-effective. Olgiati 2012, 5-HTTLPR PGx testing vs none in high income W European countries, direct costs: Incremental benefit of PGx 0.062 QALWs for clinical response plus 0.016 QALWs for side effect burden. Overall incremental benefit of PGx 0.156 QALWs. Estimated overall cost of healthcare Intl.$2242 (PGx) vs Intl.$2063 (Ctl). Incremental cost of PGx testing was Intl.$179 and the ICER was Intl.$1147.
Cost-utility studies
1 study n=323 Herbild 2009 (Web-based
Questionnaire based upon expert opinion, literature review, and focus group interviews; focus group members were not psychiatric
Utility increases with decreases in the number of changes in meds or ↓ times for dosage adjustments.
Herbild 2009 (n=323), CYP2D6 PGx testing vs none, willingness-to-pay for PGx: Willingness to pay for a 10% probability of 1 antidepressant change or for the reduction of 1 month of time for dosage adjustments exceeded
WA – Health Technology Assessment October 20, 2016
Pharmacogenomic testing for selected conditions: Draft report Page 20
Number and Type of Studies
Limitations Direction of
Findings Study Results
discrete choice questionnaire administered to Danes)
pts. test cost in Denmark.
*Costs were converted from the value of the Danish krone in 2010 to USD 2016.
Practice Guidelines
The search of the core sources and relevant specialty groups identified 12 guidelines that mention
pharmacogenomic testing published within the past 10 years. The general recommendations provided
by the guidelines are summarized in Table 4. Additional details, by guideline, are presented in APPENDIX
VIa.
Most guidelines make no formal recommendations for use of pharmacogenomic testing. Those that
mention pharmacogenomic testing indicate a need for future research to help determine the optimal
choice of pharmacotherapy based on the gene or genes involved in the etiology of treatment
responsiveness. Pharmacogenomic testing may help guide identification of particular patient
populations that will benefit from specific therapeutic options. In addition, some guidelines suggest that
pharmacogenomic testing in combination with therapeutic drug monitoring may be beneficial in certain
circumstances.
The goal of the Clinical Pharmacogenetics Implementation Consortium (CPIC) of the National Institutes
of Health’s Pharmacogenomics Research Network and the Pharmacogenomics Knowledge Base is to
provide peer-reviewed, evidence-based, accessible guidelines for gene-drug associations in order to
facilitate the translation of pharmacogenomic knowledge from bench to bedside. CPIC guidelines
include dosing recommendations for tricyclic antidepressants and selective serotonin reuptake
inhibitors based on CYP2D6 and CYP2D6 gene phenotypes (e.g., ultrarapid metabolizer, extensive
metabolizer, intermediate metabolizer, or poor metabolizer). However, these guidelines state that
recommendations are based on clinical validity evidence, most of which relies on drug plasma
concentration outcomes and includes case reports and pharmacokinetic studies of healthy individuals.
No evidence is presented linking plasma concentration to clinical outcomes in these guidelines.
A number of other guidelines from authoritative organizations are listed in APPENDIX VIb. None of these
guidelines made any reference to pharmacogenomic testing.
Table 4. Summary of Practice Guidelines with Any Mention of Pharmacogenomic Testing
Key: AGNP, Arbeitsgemeinschaft für Neuropsychopharmakologie und Pharmakopsychiatrie; APA, American Psychiatric Association; BAP, British Association for Psychopharmacology; CPIC, Clinical Pharmacogenetics Implementation Consortium; DoD, Department of Defense; EPA, European Psychiatric Association; GL(s), guideline(s); ICSI, Institute for Clinical Systems Improvement; PGx,
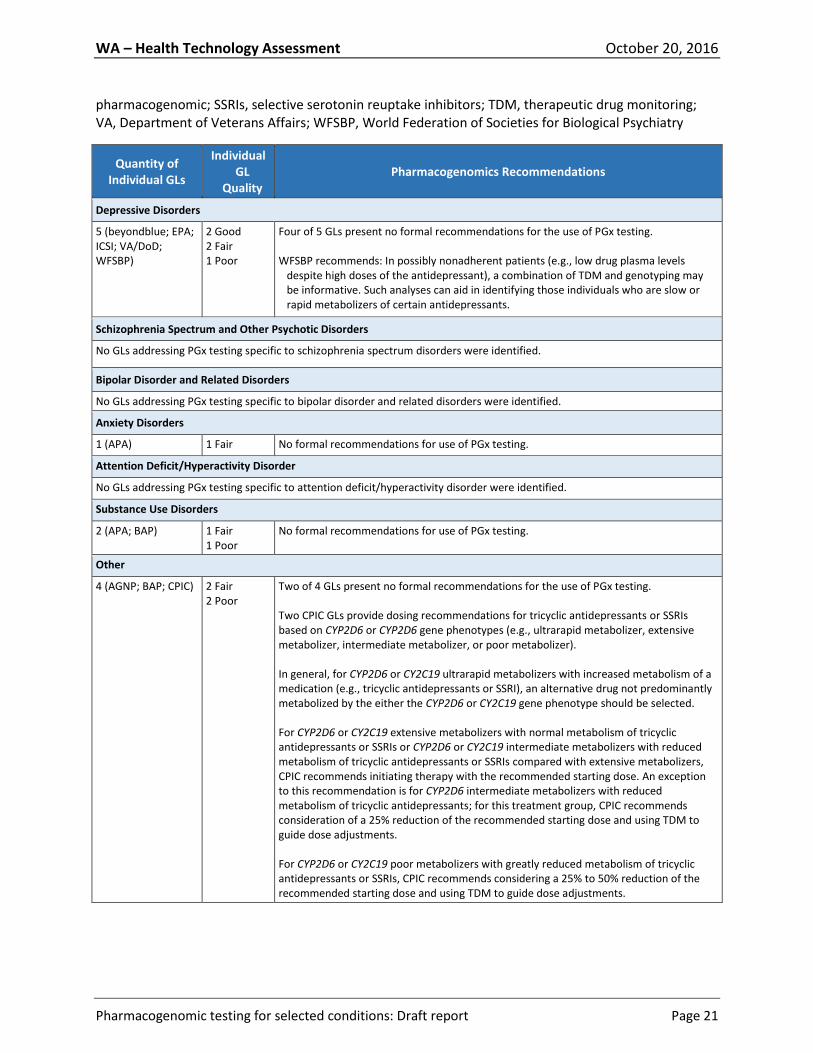
WA – Health Technology Assessment October 20, 2016
Pharmacogenomic testing for selected conditions: Draft report Page 21
pharmacogenomic; SSRIs, selective serotonin reuptake inhibitors; TDM, therapeutic drug monitoring; VA, Department of Veterans Affairs; WFSBP, World Federation of Societies for Biological Psychiatry
Quantity of Individual GLs
Individual GL
Quality Pharmacogenomics Recommendations
Depressive Disorders
5 (beyondblue; EPA; ICSI; VA/DoD; WFSBP)
2 Good 2 Fair 1 Poor
Four of 5 GLs present no formal recommendations for the use of PGx testing. WFSBP recommends: In possibly nonadherent patients (e.g., low drug plasma levels
despite high doses of the antidepressant), a combination of TDM and genotyping may be informative. Such analyses can aid in identifying those individuals who are slow or rapid metabolizers of certain antidepressants.
Schizophrenia Spectrum and Other Psychotic Disorders
No GLs addressing PGx testing specific to schizophrenia spectrum disorders were identified.
Bipolar Disorder and Related Disorders
No GLs addressing PGx testing specific to bipolar disorder and related disorders were identified.
Anxiety Disorders
1 (APA) 1 Fair No formal recommendations for use of PGx testing.
Attention Deficit/Hyperactivity Disorder
No GLs addressing PGx testing specific to attention deficit/hyperactivity disorder were identified.
Substance Use Disorders
2 (APA; BAP) 1 Fair 1 Poor
No formal recommendations for use of PGx testing.
Other
4 (AGNP; BAP; CPIC) 2 Fair 2 Poor
Two of 4 GLs present no formal recommendations for the use of PGx testing. Two CPIC GLs provide dosing recommendations for tricyclic antidepressants or SSRIs based on CYP2D6 or CYP2D6 gene phenotypes (e.g., ultrarapid metabolizer, extensive metabolizer, intermediate metabolizer, or poor metabolizer). In general, for CYP2D6 or CY2C19 ultrarapid metabolizers with increased metabolism of a medication (e.g., tricyclic antidepressants or SSRI), an alternative drug not predominantly metabolized by the either the CYP2D6 or CY2C19 gene phenotype should be selected. For CYP2D6 or CY2C19 extensive metabolizers with normal metabolism of tricyclic antidepressants or SSRIs or CYP2D6 or CY2C19 intermediate metabolizers with reduced metabolism of tricyclic antidepressants or SSRIs compared with extensive metabolizers, CPIC recommends initiating therapy with the recommended starting dose. An exception to this recommendation is for CYP2D6 intermediate metabolizers with reduced metabolism of tricyclic antidepressants; for this treatment group, CPIC recommends consideration of a 25% reduction of the recommended starting dose and using TDM to guide dose adjustments. For CYP2D6 or CY2C19 poor metabolizers with greatly reduced metabolism of tricyclic antidepressants or SSRIs, CPIC recommends considering a 25% to 50% reduction of the recommended starting dose and using TDM to guide dose adjustments.
WA – Health Technology Assessment October 20, 2016
Pharmacogenomic testing for selected conditions: Draft report Page 22
Selected Payer Policies
At the direction of WA State HCA, the coverage policies for the following organizations were reviewed:
Aetna, Centers for Medicare & Medicaid Services (CMS), Oregon Health Evidence Review Commission
(HERC), GroupHealth, and Regence Blue Cross/Blue Shield.
Commercial pharmacogenomic gene panels such as GeneSight and Genecept Assay, which test for
several genes and gene polymorphisms to deliver an interpretive report, are considered experimental,
investigational, and/or not medically necessary for managing psychiatric conditions by Aetna, Group
Health Cooperative, and Regence Group due to insufficient evidence that these genetic testing panels
result in improved patient health outcomes. The Oregon HERC does not yet have guidance in this area
but plans it for the near future. The CMS have no National Coverage Determinations in this topic area.
Noridian Healthcare Solutions LLC, a Medicare contractor in the State of Washington, issued a Local
Coverage Decision on October 1, 2015, for GeneSight Psychotropic, providing limited coverage when
licensed psychiatrists or neuropsychiatrists contemplating an alteration in neuropsychiatric medication
for patients diagnosed with major depressive disorder (MDD) who are suffering with refractory
moderate to severe depression after at least one prior neuropsychiatric medication failure.
Specific gene tests are covered in certain cases. Noridian Healthcare Solutions LLC, a Medicare
contractor in the state of Washington, issued a Local Coverage Decision effective July 8, 2016 in which
genetic testing for the CYP2D6 gene is considered medically necessary to guide medical treatment
and/or dosing for individuals for whom initial therapy is planned with amitriptyline or nortriptyline for
treatment of depressive disorders.
A CMS Local Coverage Decision provides limited coverage for patients of Asian and Oceanian ancestry
prior to initial treatment with carbamazepine, an antiepileptic drug. This class of drugs was excluded
from this report. Carbamazepine is sometimes used in conjunction with other medications to treat
schizophrenia and is a secondary treatment in bipolar disorder. Our literature search did not specify
drug names, and only 1 study of the potential clinical utility of HLA-B*15:02 genetic testing for
carbamazepine was found in our literature search. The patients in that study were being newly treated
with antiepileptic drugs; therefore, the study was excluded as not enrolling patients with an indication
of interest.
See Selected Payer Policies in the TECHNICAL REPORT for additional details and links to policy
documents.
Overall Summary and Discussion
Evidence-Based Summary Statement
In general, the evidence base is of low to very low quality and is insufficient to support
recommendations regarding the clinical use of pharmacogenomic testing to aid in the treatment of the
psychiatric disorders of interest for this report. Key summary points of interest are as follows:

WA – Health Technology Assessment October 20, 2016
Pharmacogenomic testing for selected conditions: Draft report Page 23
As described in the Background, a wealth of data have been generated associating many genetic
variants with treatment outcomes; most, if not all, are of low effect size. Such data are
important and hypothesis-generating, but incompletely represent clinical validity, and are
insufficient to support clinical use. Moreover, few data are available to show how a combination
of gene variant tests may be interpreted and how the results are used to categorize drug and
dose recommendations for individual patients.
Pharmacogenomic test results consistently led medication treatment prescribers to change their
treatment decisions compared with treatment as usual but the overall quality of evidence was
low. While management change is a necessary step toward improving patient outcomes, it is not
sufficient to support a conclusion of clinical benefit.
The evidence supporting the use pharmacogenomic test results for patient management and
their impact on patient outcomes is extremely limited and compromised and is considered to be
of low to very low quality, depending on the outcome measured. As such, the evidence is
insufficient for conclusions regarding clinical use.
Economic study results in some cases suggested cost-effectiveness but lacked consistency
overall. Furthermore, economic analyses are limited by the low quality of the available evidence
base and the applicability of the evidence selected to create the various models employed.
Of the practice guidelines that mention pharmacogenomic testing at all, most make no formal
recommendations for use, but rather indicate a need for future research. Some guidelines
suggest that pharmacogenomic testing in combination with therapeutic drug monitoring may be
beneficial in certain circumstances.
Few payer policies provide general coverage for pharmacogenomic testing; specific gene tests
may be covered in certain cases.
Gaps in the Evidence
The following evidence is needed to better answer the Key Questions of this report:
The populations of patients affected with the disorders of interest is large; answering questions
about pharmacogenomic testing in such large and potentially diverse populations is difficult in
very small trials of little more than 100 per treatment arm and often much less. For the
indications examined in this report, large, well-designed (e.g., retrospective-prospective designs
based on already-completed clinical trials) are needed to answer the following questions:
Which genes/variants or combinations of genes/variants best address specific clinical
indications and outcomes of interest?
Selecting the most promising genes/variants and/or combinations, which potential
confounders must be addressed and how in the testing process, considering, for example:
Race/ethnicity
Common and potentially interacting concomitant medications
Relevant comorbidities
Prior treatment history
WA – Health Technology Assessment October 20, 2016
Pharmacogenomic testing for selected conditions: Draft report Page 24
TECHNICAL REPORT
Clinical Background
In 2014, there were an estimated 43.6 million (18.1%) adults in the United States with a mental illness in
the previous year. This includes approximately 9.8 million (4.2%) adults with serious mental illness.
Based on data from 2002, the National Institute of Mental Health estimates that the total direct and
indirect costs of serious mental illness exceeds $300 billion per year (NIMH, 2002). In 2010,
neuropsychiatric disorders, which include mental and behavioral disorders, accounted for the largest
proportion of health-related disability in the United States. In 2008, 13.4% of adults in the United States
received treatment for a mental health problem (NIMH, 2008). This includes all adults who received care
in inpatient or outpatient settings and/or used prescription medication for mental or emotional
problems. Therefore, the societal burden of mental and behavioral disorders is high. Pharmacotherapy
is an important part of treatment but is considered effective for only 30% to 60% of patients (Pouget et
al., 2014). Adverse events in small proportions of patients result in lack of adherence. For many drugs,
treatment selection is empirical and multiple failed trials occur before obtaining an acceptable response
without any or with tolerable side effects. The following mental and behavioral illnesses are the focus of
this report: depression, psychosis, anxiety, mood disorders, attention deficit/hyperactivity disorder
(ADHD), and substance use disorder. Substance abuse will focus specifically on opioid and alcohol abuse.
Depressive Disorders
Definition. Depressive disorders include disruptive mood dysregulation disorder, major depressive
disorder (including major depressive episode), persistent depressive disorder (dysthymia), premenstrual
dysphoric disorder, substance/medication-induced depressive disorder, depressive disorder due to
another medical condition, other specified depressive disorder, and unspecified depressive disorder. A
major depressive episode is defined as a period of 2 weeks or longer during which there is either
depressed mood, or loss of interest or pleasure, and at least 4 other symptoms that reflect a change in
functioning, such as problems with sleep, eating, energy, concentration, and self-image (APA, 2013).
Burden. Of the various types of depression, major depression carries the heaviest burden of disability
among mental and behavioral disorders (Murray et al., 2013). In 2014, an estimated 10.2 million adults
aged 18 years or older in the United States had at least one major depressive episode with severe
impairment limiting ability to carry out major life activities (SAMHSA, 2015a). This number represented
4.3% of all U.S. adults.
Initial treatment and results. Depression is usually treated with medications, psychotherapy, or a
combination of these treatments. A selective serotonin reuptake inhibitor, serotonin norepinephrine
reuptake inhibitor, mirtazapine, or bupropion is recommended first-line medication (APA, 2000
[Reaffirmed 2015]). Full therapeutic dose depends on the patient's age, the treatment setting, and the
presence of co-occurring illnesses, concomitant pharmacotherapy, or medication side effects. Patients
WA – Health Technology Assessment October 20, 2016
Pharmacogenomic testing for selected conditions: Draft report Page 25
who do not respond after 4 to 8 weeks of treatment, dose adjustment, and additional monitoring may
be changed to an antidepressant from the same pharmacological class or to one from a different class.
Despite available options, only 20% of those treated receive adequate treatment (Wang et al., 2005),
and only 30% of those who receive adequate treatment reach remission (Trivedi et al., 2006). The
remaining 70% will either have a response without remission (approximately 20%) or not respond at all
(50%) (Trivedi et al., 2006).
Schizophrenia Spectrum and Other Psychotic Disorders
Definition. Schizophrenia spectrum and other psychotic disorders include schizophrenia, other psychotic
disorders, and schizotypal (personality) disorder. These disorders are characterized by a range of
cognitive, behavioral, and emotional abnormalities that present in 1 or more of 5 key symptom
domains, including: (1) delusions; (2) hallucinations; (3) disorganized thinking (speech); (4) extremely
disorganized or abnormal motor behavior (including catatonia); and (5) negative symptoms such as
diminished emotional expression, reduced feelings of pleasure, poverty of speech, and a decreased
ability to engage in self-initiated activities (APA, 2013).
Burden. Schizophrenia affects approximately 1% of the United States population (SAMHSA, 2015b) and
is ranked among the top 20 leading causes of global disability (Murray et al., 2013). While disease onset
typically occurs from 16 to 30 years of age, childhood-onset schizophrenia, which manifests before age
13 years, affects approximately 0.01% of children (SAMHSA, 2015b).
Initial treatment and results. Schizophrenia is typically treated with a combination of antipsychotic
medication and psychosocial treatment. Second-generation agents, also known as atypical antipsychotic
medications, are considered first-line treatment options for patients in the acute phase of illness due to
the reduced risk of extrapyramidal side effects (i.e., parkinsonism, dystonia, akathisia, and tardive
dyskinesia) compared with treatment with first-generation agents; however, for some patients, a first-
generation antipsychotic medication may also be appropriate (Lehman et al., 2004). Most medications
are only effective in 30% to 60% of patients, with 7% of patients experiencing a serious adverse event
(Pouget et al., 2014). Several factors may impact long-term medication adherence, including lack of
insight, medication beliefs, substance abuse, and unpleasant side effects such as weight gain, excessive
sedation, and tardive dyskinesia (Higashi et al., 2013). Agranulocytosis is a rare (cumulative incidence
0.8% to 1.5% within the first year of treatment) but potentially fatal adverse effect of clozapine
treatment (Pouget et al., 2014). Antipsychotic medication nonadherence in schizophrenia patients is
prevalent, with rates in the literature ranging from 20% to 89% (Barkhof et al., 2012). For patients that
discontinue taking medication, relapse rates are up to 5 times higher than those who continue
treatment (Lehman et al., 2004). In addition, nonadherent patients have 4 to 7 times greater risk of
suicide (Higashi et al., 2013).
Anxiety Disorders
Definition. Anxiety disorders are characterized by excessive and persistent fear or worry that is difficult
to control and substantially interferes with daily functioning (SAMHSA, 2015b). There are several types
WA – Health Technology Assessment October 20, 2016
Pharmacogenomic testing for selected conditions: Draft report Page 26
of anxiety disorders, including: panic disorder, generalized anxiety disorder (GAD), phobias, and
separation anxiety disorder (CDC, 2013a).
Burden. Anxiety disorders are the most common class of mental disorder in the United States, affecting
approximately 40 million adults, or 18% of the population (Kessler et al., 2009). Typically, anxiety
disorders have an earlier onset than other disorders, with phobias and GAD presenting around age 11
(SAMHSA, 2015b). Women are 60% more likely to experience an anxiety disorder over their lifetime
compared with men (Kessler et al., 2005). Anxiety disorders rank in the top 10 leading causes of global
disability (Murray et al., 2013; Baxter et al., 2014) and are associated with a significant impairment in
family, social, and work role functioning (Wittchen, 2002; Hoffman et al., 2008).
Initial treatment and results. Treatments for anxiety typically involve pharmacotherapy, psychosocial
interventions such as cognitive-behavioral therapy, mindful therapy, and exposure therapy, or a
combination of both medication and counseling. Antianxiety drugs (benzodiazepines), antidepressants,
and beta-blockers may be prescribed as part of a treatment approach (SAMHSA, 2015c). Medications
are occasionally prescribed as a first-line treatment for an anxiety disorder or are used if there is
insufficient improvement with psychotherapy (NIMH, 2016a). Although anxiety disorders are treatable,
only 34.3% of patients with an anxiety disorder receive minimally adequate healthcare treatment (Wang
et al., 2005).
Bipolar and Related Disorders
Definition. Bipolar disorder is a chronic mood disorder that causes recurrent, dramatic shifts in mood,
energy, and activity levels. It is characterized by a range of discrete mood episodes, including: manic
episodes (defined by abnormally elevated, unrestrained, or irritable mood); hypomanic episodes
(defined by less severe manic periods that are unlikely to cause significant social or occupational issues);
major depressive episodes (distinguished by lasting depressed mood or loss of interest or pleasure); or
mixed state (defined by symptoms, including elements of both manic and depressive states) (SAMHSA,
2015b). The four basic types of bipolar disorder include: bipolar I disorder, bipolar II disorder,
cyclothymic disorder, and other specified and unspecified bipolar and related disorders (NIMH, 2016b).
Each type is defined by the pattern of episodes a patient commonly experiences. For example,
individuals with bipolar I disorder experience manic episodes that persist for at least 7 days or are so
extreme that the individual requires immediate medical attention (NIMH, 2016b).
Burden. In the United States, the combined prevalence of bipolar I disorder, bipolar II disorder, and
cyclothymic disorder for adolescents (ages 13 to 18) and adults are 11.2% and 2.6%, respectively
(SAMHSA, 2015b). The median age of bipolar disorder onset is 25 years and men typically experience
earlier onset than women; however, women have 3.2 times greater risk of developing bipolar disorder
compared with men (CDC, 2013a). Symptoms of bipolar disorder are severe and create a substantial
burden on employers due to absenteeism and presenteeism (Laxman et al., 2008). Bipolar disorder
ranks among the top 20 leading causes of global disability (Murray et al., 2013). Furthermore, 25% to
50% of patients with bipolar disorder attempt suicide at least once (Jamison, 2000).
WA – Health Technology Assessment October 20, 2016
Pharmacogenomic testing for selected conditions: Draft report Page 27
Initial treatment and results. Bipolar disorder is typically treated with a combination of medication and
psychotherapies, such as cognitive-behavioral therapy, interpersonal and family therapies, and
psychoeducation. Several medications may be prescribed to help control the symptoms of bipolar
disorder, including mood stabilizers, antipsychotic agents, and antidepressants (SAMHSA, 2015c). Only
38.8% of patients with bipolar disorder receive minimally adequate healthcare treatment (Wang et al.,
2005) and from 20% to 60% of patients with bipolar disorder are nonadherent to medication leading to
increased hospitalization (Gaudiano et al., 2011).
Attention Deficit/Hyperactivity Disorder
Definition. Attention-deficit/hyperactivity disorder (ADHD) is characterized by symptoms of inattention
and/or hyperactivity with impulsivity that manifest as poor concentration, overall disorganization,
propensity to not complete tasks or projects, poor school/work performance, and issues with time
management and mood control. Hyperactivity in children may specifically manifest as fidgeting or
constant movement, and impulsivity as a lack of patience or lack of emotional control. Adults with ADHD
may seek treatment due to an associated complaint, such as procrastination, disorganization, lack of
motivation, insomnia, rage attacks, and/or mood swings. There are 3 subtypes of the disorder, including:
(1) predominantly hyperactive/impulsive presentation; (2) predominantly inattentive presentation; and
(3) combined hyperactive inattentive presentation (SAMHSA, 2015b).
Burden. ADHD is one of the most common childhood-onset neurobehavioral, psychiatric disorders,
affecting approximately 9% of children aged 13 to 18 years in the United States (SAMHSA, 2015b). For
60% to 85% of affected children, ADHD persists into adulthood. In the United States, prevalence
estimates of ADHD in adults range from 4% to 5% (Kessler et al., 2006; Pliszka, 2007; Lis et al., 2010;
Safren et al., 2010). Although the disorder can affect both sexes, it appears more frequently among men
than women (Benkert et al., 2010; Lis et al., 2010). The disorder may be accompanied by comorbidities,
including learning disabilities, substance use disorders, mania, depression, anxiety, conduct disorder,
and oppositional defiant disorder. ADHD symptoms can negatively impact a person’s ability to function
in more than one domain (e.g., school, home, work) and can impair self-esteem, interpersonal
relationships, and school or work performance (Pliszka, 2007; MFMER, 2016).
Initial treatment and results. Treatments include medication, psychotherapy, education or training, or a
combination of treatments. Medications called stimulants (e.g., methylphenidate [Ritalin, Concerta,
Methylin, Quillivant XR, and others], amphetamine [Adderall], dextroamphetamine [Dexedrine,
ProCentra], and lisdexamfetamine dimesylate [Vyvanse]) are commonly prescribed for the treatment of
ADHD. Non-stimulant medications (e.g., atomoxetine [Straterra], clonidine [Kapvay], guanfacine
[Intuniv]) may be prescribed to patients who experience side effects from stimulants or for whom
stimulants are not effective. Combinations of stimulant and non-stimulant medications may also be
considered. Approximately 70% to 80% of children with ADHD respond to stimulant medications with
improved attention span, reduced impulsivity, and improved on-task behavior (SAMHSA, 2015c).
However, it is not clear if stimulant medications benefit cognition, behavior, mood, or school
performance in the long term. Patients may need to try more than one medication or dose to find the
treatment with the highest efficacy and fewest side effects.

WA – Health Technology Assessment October 20, 2016
Pharmacogenomic testing for selected conditions: Draft report Page 28
Substance Use Disorders
Definition. Ten separate classes of drugs comprise substance-related disorders, including: alcohol;
caffeine; cannabis; hallucinogens; inhalants; opioids; sedatives, hypnotics, and anxiolytics; stimulants;
tobacco; and other substances (SAMHSA, 2015b). These drugs directly activate the brain’s reward
system, which is involved in behavior reinforcement and memory production (Koob, 2006).
Alcohol use disorder (AUD) is characterized by an excessive use of alcohol that increases an individual’s
risk of developing serious health problems associated with intoxication behaviors and withdrawal
symptoms. AUD may be mild, moderate, or severe, depending on the number of symptoms that meet
diagnostic criteria. Some symptoms of AUD include: difficulty controlling alcohol intake; persistent
alcohol use despite issues resulting from drinking; development of tolerance; or the development of
withdrawal symptoms (SAMHSA, 2015b).
Opioids are a type of medication used to relieve pain. Opioid use disorder (OUD) involves the excessive
use of opioids, such as oxycodone, hydrocodone, morphine, and heroin. These drugs increase a person’s
risk for serious medical complications, including overdose. Some symptoms of OUD include: a strong
desire for opioid use; inability to control or reduce use; continued use despite interference with major
obligations or social functioning; use of large amounts of opioids over time; development of tolerance;
spending large amounts of time obtaining and using opioids; and development of withdrawal symptoms
(SAMHSA, 2015b).
Burden. Substance use disorders rank among the top 10 leading causes of global disability (Murray et al.,
2013) and can contribute too many work-performance problems, including premature death/fatal
accidents, injury, absenteeism, and loss of production.
In the United States, AUDs affect approximately 16.3 million adults and 679,000 adolescents (aged 12 to
17 years) (SAMHSA, 2014; NIAAA, 2016). Alcohol use increases the risk of acute injury and traffic-related
injuries and deaths. In addition, alcohol dependence and excessive drinking are associated with
increased risk for liver disease, cardiovascular disease, neurological deficits, several types of cancer, and
psychiatric illnesses, particularly mood and anxiety disorders and drug abuse (Cargiulo, 2007; Rehm,
2011). Approximately 88,000 deaths are attributed to alcohol use per year (CDC, 2013b; SAMHSA,
2015b). Compared with individuals with treated AUDs, untreated AUDs use twice as much healthcare
(Holder, 1998).
With an estimated 1.9 million people having an OUD involving prescription pain relievers and 568,000
people having an OUD involving heroin, opioid overdose deaths in the United States hit a record high in
2014, reaching 9.0 per 100,000 people (Rudd et al., 2016). Natural and semisynthetic opioid pain
relievers (e.g., morphine, oxycodone) accounted for the most opioid-related deaths. Since 1999, rates of
opioid overdose-related deaths have risen by 265% and 400% among men and women, respectively
(SAMHSA, 2015b).
Initial treatment and results. A number of service components are often used in combination as a
multimodal approach for the treatment of substance use disorders. These service components include:
WA – Health Technology Assessment October 20, 2016
Pharmacogenomic testing for selected conditions: Draft report Page 29
medication; individual or group counseling; inpatient and residential treatment; intensive outpatient
treatment; partial hospital programs; case or care management; recovery support services; 12-Step
fellowship; and peer support (SAMHSA, 2015c). Due to the chronic nature of substance use disorders,
patients typically require long-term treatment, although the intensity and specific components of
treatment may change over time (Kleber et al., 2006).
Several medications have shown efficacy in adults for the treatment of AUD, including acamprosate,
disulfiram, and naltrexone. Acamprosate helps individuals with AUDs that have achieved abstinence
maintain abstinence for several weeks to months by reducing the symptoms of protracted withdrawal.
Disulfiram alters alcohol metabolism, resulting in flushing, nausea, vomiting and other unpleasant
symptoms after alcohol consumption. Naltrexone blocks the effects of opioids and reduces alcohol
cravings (SAMHSA, 2015c). Positive outcomes from AUD treatment have been documented in many
studies, with improved health status and reductions in the number of drinking days within 6 months of
starting treatment (Kleber et al., 2006). Despite success, only 25% of people seek treatment for AUDs
(Dawson et al., 2006).
Medications used for the treatment of OUDs include methadone, buprenorphine, or extended-release
injectable naltrexone. Methadone and buprenorphine act as opioid agonists and reduce cravings and
withdrawal symptoms. Extended-release injectable naltrexone helps control cravings and reduces the
risk of relapse and is often used in situations where an opioid agonist is not available or appropriate
(SAMHSA, 2015c). Treatments for OUDs can be highly effective; however, success is often limited by the
availability of treatment programs (Kleber et al., 2006).
Pharmacogenomics
Because drugs for psychiatric conditions (and many other important medical conditions) are selected
and dosed empirically, with less than a desirable response in all cases, and sometimes moderate to
serious adverse events, advance predictors of response or adverse events in individual patients have
been sought. Pharmacogenomics aims to identify relationships between base sequence variants in
genes that ultimately identify patients likely to respond to treatment or experience adverse events from
specific medications. The products of such genes are most likely to be involved in drug uptake and
metabolism (pharmacokinetics) or may have specific function at the target of drug action
(pharmacodynamics). Sequence variants of these genes may result in products that have slightly or
greatly reduced function, or none at all. Replication of these specific genes may amplify function,
increasing, for example, the metabolic function of a pharmacokinetic product.
An example of pharmacokinetic genetic variation is the cytochrome P450 (CYP450) superfamily, a large
group of enzymes that have an essential role in drug metabolism. In particular, the CYP2D6 CYP450
enzyme plays a role in the metabolism of 80% of antidepressant and antipsychotic drugs and the
CYP2C19 CYP450 enzyme plays a role in the metabolism of certain antidepressants such as citalopram,
escitalopram, amitriptyline, and sertraline (Muller et al., 2013). Variants in each of these genes may
result in enzymes with variable activity, and phenotypes of normal metabolizers (fully functional
activity), poor metabolizers (little to no activity), intermediate metabolizers (decreased activity, from
WA – Health Technology Assessment October 20, 2016
Pharmacogenomic testing for selected conditions: Draft report Page 30
normal to poor), and rapid/ultrarapid metabolizers (increased enzyme activity) (Caudle et al., 2016). A
patient who is a poor metabolizer treated with an antidepressant may have greater-than-expected drug
exposure with more potential for side effects, whereas an ultrarapid metabolizer given the same drug
may experience insufficient exposure and poor response. Note that these predicted results apply to an
active drug and would be opposite for a prodrug (a version of a drug that must first be metabolized into
its pharmacologically active form).
The dopaminergic and serotonergic neurotransmitter systems are central to antipsychotic drug efficacy;
therefore, much research has centered on the impact of genetic variants in the dopamine D2 receptor
(DRD2), the dopamine D3 receptor (DRD3), the serotonin 1A receptor (HTR1A), and the serotonin 2A
receptor (HTR2A) (Pouget et al., 2015), all examples of pharmacodynamic gene products. Variants in
these genes and many others are hypothesized to alter response to and clinical efficacy of psychotropic
drug treatment as well as likelihood of adverse effects.
Methodologic approaches to identifying genomic predictors of drug response or adverse effects include
candidate gene studies, whereby genes are selected based on biologic plausibility, as described in the
preceding examples. The majority of evidence supporting the association of gene variants with drug
treatment outcomes is based on candidate gene studies. The other approach is a genome-wide
association study(ies) (GWAS), which uses a hypothesis-free approach to test an enormous number of
single nucleotide polymorphisms across the genome for significant and relevant associations. For
example, the Genome-Based Therapeutic Drugs for Depression (GENDEP) project was a randomized
pharmacogenomic trial with 2 active treatment arms; 87% of patients were included in a genome-wide
analysis. The results of this GWAS were combined with 2 other similar GWAS in a meta-analysis to
increase the power for detecting significant associations. Interestingly, however, only modest evidence
was found that common genetic variation contributes to individual differences in antidepressant
response (GENDEP, 2013).
In order to personalize individual patient prescribing and improve pharmacotherapy outcomes, a
number of clinical pharmacogenomic laboratories are available, many of which offer testing services
that purport to address a range of psychotropic drugs. The primary evidence supporting the
development of these tests is gene variant treatment outcome associational evidence, one aspect of the
clinical validity of a test. A strong association supports a test’s ability to predict response or occurrence
of adverse effects. Weak individual pharmacogenomic associations may indicate complicated
pharmacokinetic or pharmacodynamics pathways within which the influence of a single gene is
insufficient for strong predictive ability. Moreover, a strong association may be a poor predictor if the
frequencies of the predictive genetic variant and/or the outcome are low in the target population (Tonk
et al., 2016).
Associational evidence has been used, in many cases exclusively, to support the addition of genetic
information to drug labels by the U.S. Food and Drug Administration (FDA). Wang et al. (2014) evaluated
biomarker information in 119 drug labels from the FDA Table of Pharmacogenomic Biomarkers in Drug
Labeling, a publicly accessible database, using guidelines from the Evaluation of Genomic Applications in
Practice and Prevention (EGAPP) Working Group to define strength of evidence for clinical validity and

WA – Health Technology Assessment October 20, 2016
Pharmacogenomic testing for selected conditions: Draft report Page 31
clinical utility. In total, 43 (36.1%) of 119 labels provided convincing clinical validity evidence. Sixty-one
(51.3%) of 119 labels made recommendations for clinical decision-making based on biomarker test
results; 36 (30.3%) of these were based on convincing clinical utility data. The authors concluded that
adding biomarker testing recommendations to drug labels may be premature when convincing data
linking testing to patient outcomes is lacking. Note, the indications for these drug labels were not limited
to those selected for this report.
Because association evidence has been widely used as primary evidence to support the use of
pharmacogenomic testing, it is important to examine the value of the information contained within such
evidence. Measures of association are often reported as odds ratios (OR), the value indicating the
relative strength of association. If the measure of association for a particular genetic variant and the
outcome of tardive dyskinesia when a patient is treated with antipsychotic drugs is a statistically
significant OR of 2, then patients with that particular variant may be twice as likely to experience tardive
dyskinesia when treated with antipsychotic drugs as patients who do not have that genetic variant (or
compared with the base rate in the population if the frequency of the genetic variant is small). ORs can
also be converted to the standardized mean difference, or Cohen’s d, a common measure of effect size
that can be compared across studies. Using published formulas, an OR of 2 equates to a Cohen’s d of
approximately 0.2 (Hasselblad and Hedges, 1995). At this value, 92% of the gene variant–positive and
gene variant–negative groups are predicted to overlap (see Figure 2), and the number needed to treat
to have one more favorable outcome in the treatment group compared with control group is predicted
to be 16.5. Using general guidelines, a Cohen’s d of 0.2 is small, 0.5 is medium, and 0.8 is large, although
these cutoff values are arbitrary and should not replace consideration of specific study details (Cohen,
1988).
Predictors of small effect size are likely to perform poorly as clinical laboratory tests. Where possible and
biologic plausibility and/or statistical analysis suggests, several predictors of small effect size may be
combined in test panels to generate larger effect sizes. However, overall effect sizes for specific
applications of individual pharmacogenomic tests combined into panels (e.g., for specific clinical
disorder indications and outcomes) are often lacking.
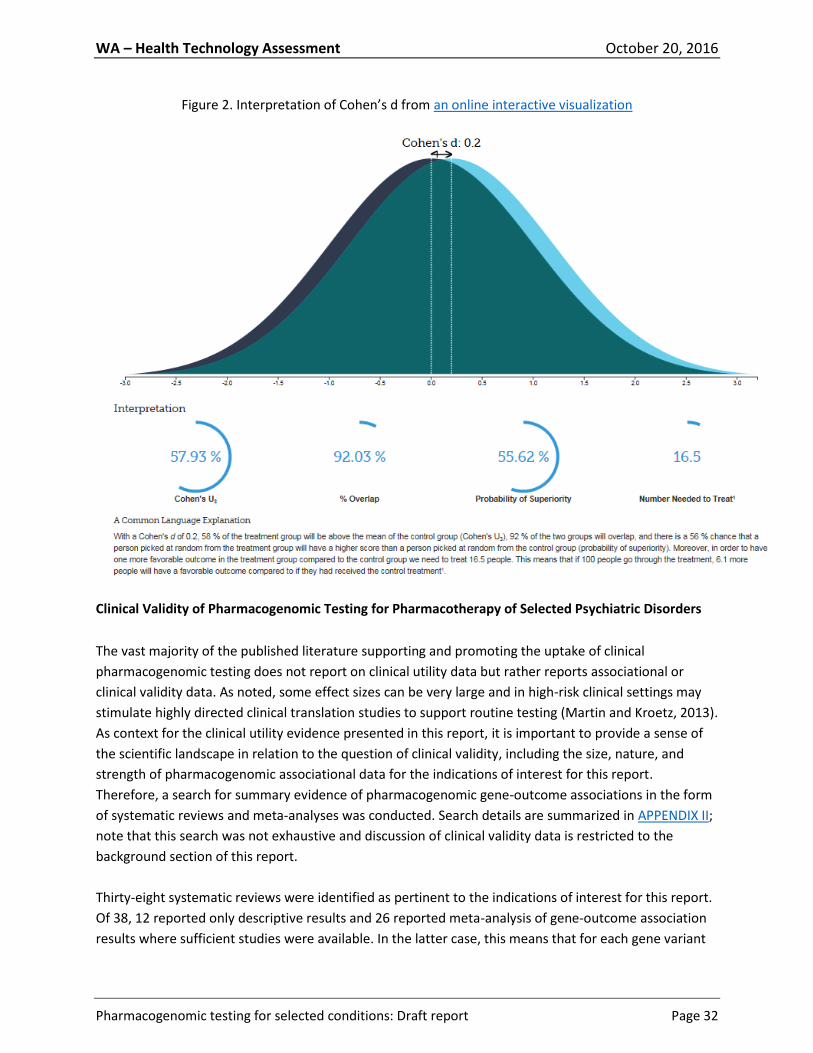
WA – Health Technology Assessment October 20, 2016
Pharmacogenomic testing for selected conditions: Draft report Page 32
Figure 2. Interpretation of Cohen’s d from an online interactive visualization
Clinical Validity of Pharmacogenomic Testing for Pharmacotherapy of Selected Psychiatric Disorders
The vast majority of the published literature supporting and promoting the uptake of clinical
pharmacogenomic testing does not report on clinical utility data but rather reports associational or
clinical validity data. As noted, some effect sizes can be very large and in high-risk clinical settings may
stimulate highly directed clinical translation studies to support routine testing (Martin and Kroetz, 2013).
As context for the clinical utility evidence presented in this report, it is important to provide a sense of
the scientific landscape in relation to the question of clinical validity, including the size, nature, and
strength of pharmacogenomic associational data for the indications of interest for this report.
Therefore, a search for summary evidence of pharmacogenomic gene-outcome associations in the form
of systematic reviews and meta-analyses was conducted. Search details are summarized in APPENDIX II;
note that this search was not exhaustive and discussion of clinical validity data is restricted to the
background section of this report.
Thirty-eight systematic reviews were identified as pertinent to the indications of interest for this report.
Of 38, 12 reported only descriptive results and 26 reported meta-analysis of gene-outcome association
results where sufficient studies were available. In the latter case, this means that for each gene variant
WA – Health Technology Assessment October 20, 2016
Pharmacogenomic testing for selected conditions: Draft report Page 33
(or in some cases, all variants combined for a single gene) and a selected outcome, a meta-analysis
across all published studies reporting that combination was reported. In addition, several models (allele
only, dominant, recessive, homozygous, heterozygous) may be reported, depending on what is and is
not known about the variant and its inheritance. Across all meta-analysis publications, many genes were
examined for gene-outcome associations, highlighting the complexity in the biological models used to
choose candidate genes for various psychiatric conditions. To report the results of all meta-analyses,
including the various models for each gene, would be excessive and uninformative. Therefore, the
indication of schizophrenia was selected as an example. APPENDIX I first lists all of the genes studied.
Next, gene-outcome associations reported in more than one of of the 8 applicable meta-analyses are
shown. For each, only the model with the most significant OR, whether or not it was statistically
significant, was chosen. The selections cover a range of models and give an indication of a range of ORs
that have been reported for the genes (or GWAS variants) as relevant to schizophrenia.
For the provided example of schizophrenia (see APPENDIX I), the highest OR reported is for the TNFa
gene and weight gain at a protective value of 0.23 (Zhang et al., 2016). Inverted, this corresponds to an
OR of 4.3 and a Cohen’s d of approximately 0.35, but the original result was not statistically significant
(P=0.34). The highest statistically significant OR greater than 1 is 2.08 (P=0.008; Cohen’s d, 0.18),
reported for CYP2D6 (all variants combined) and tardive dyskinesia (Fleeman et al., 2010; Fleeman et al.,
2011). The highest statistically significant OR less than 1 is for the association of MnSOD Ala-9Val and
tardive dyskinesia, OR equals 0.37 (P=0.009), inverted equals 2.7, Cohen’s d 0.24 (Bakker et al., 2008).
Therefore, despite a large number of association studies and several meta-analyses combining results
across studies, effect sizes for relevant gene-outcome associations tend to be relatively small. These
results can be compared with an opposite extreme, those for genetic variants predicting high-risk
adverse events. For example, in Han Chinese, presence of HLA-B*15:02 predicts life-threatening Steven-
Johnson syndrome at a highly statistically significant OR of 97.6, Cohen’s d 1.1 (Hsiao et al., 2014). The
presence of HLA-B*57:01 predicts immunologically confirmed hypersensitivity reaction to abacavir in
patients with clinically suspected reactions at ORs of 900 to 1945, Cohen’s d 1.6 to 1.8 (Saag et al.,
2008). These are both routinely used pharmacogenomic tests in applicable populations.
No meta-analyses combined results for more than one gene for the same outcome to show improved
effect size. Published examples describe the selection of a group of genes with the strongest effect sizes
and briefly summarize algorithms that “prioritize and apply differential weight to potential clinical
outcomes” in order to arrive at overall treatment recommendations (Salloum et al., 2014). Commercial
pharmacogenomic panels use patented or otherwise proprietary algorithms to synthesize the results
from individual gene variants and arrive at treatment recommendations (see examples in the Literature
Review of this report).
Other complexities that may not be accounted for in pharmacogenomic profiles include variation in
race/ethnicity, which can result in different associations due to different linkage profiles with other
genes, different gene-environment interactions, and different frequencies of variants alleles. Rare alleles
in one ethnic group can be mistaken for variant pharmacogenomic alleles but may be common in other
ethnic groups; gene variants may even appear to be protective in one ethnic group but causative in
WA – Health Technology Assessment October 20, 2016
Pharmacogenomic testing for selected conditions: Draft report Page 34
another due to confounding genetic influences (Risselada et al., 2011). An example of this can be seen in
the table Meta-analyses for Clinical Validity--Schizophrenia: Shen et al. (2014) show results for a variant
in the leptin gene (LEP) and its association with weight gain, for all study populations together (OR,
1.25), for studies of Asian populations (OR, 1.62), and for studies of European populations (OR, 0.78),
here displayed using the recessive model. Only the results for the Asian populations, however, are
statistically significant.
The table also emphasizes the number of different genes and gene variants that have been considered
plausibly related to drug response and adverse effects, reflecting the possibility of multiple metabolic
and effector pathways that may influence outcomes; fractional pathways may differ for specific drugs
even within classes. In addition, concomitant medications and patient comorbidities may interact with
the psychotropic drug, altering pharmacokinetics and/or pharmacodynamics.
Finally, not all individual study designs share good-quality criteria, which include correcting results for
multiple testing and conducting studies in large and representative populations (Risselada et al., 2011).
In addition, studies often do not study psychotropic drug-naïve patients, in which case clinical history
may also confound results. The study of antipsychotic drug use and genetic influences on weight gain is
one example.
Taken together, information regarding the clinical validity of pharmacogenomic testing for the
indications of interest for this report is limited to associational evidence of small effect size for single
genes/gene variants and selected outcomes, lacks information on how these gene variants are
combined to make treatment recommendations, and may not take full account of common potential
confounders of these relationships. For these reasons, a report focusing on the preponderance of
available association studies would be limited in its usefulness. Evidence regarding the use of
pharmacogenomic testing to prospectively guide the selection of treatment drug or dosing, compared
with treatment as usual, with measured impact on appropriate outcomes is of greater use and is
evaluated in the Literature Review section of this report.
Analytic Validity of Pharmacogenomic Testing for Pharmacotherapy of Selected Psychiatric Disorders
Analytic validity for laboratory tests refers to the technical performance of the test, how accurately,
precisely, and robustly the test detects what it is supposed to detect. The FDA conducts a detailed and
publicly available review of the analytic validity of any clinical laboratory test submitted for clearance,
which covers most laboratory tests in general. The exception is genetic tests, which are primarily
laboratory-developed tests not currently required to be submitted to the FDA as long as the test is not
manufactured and sold in kit form to other laboratories. Validation data for these types of tests are not
publicly available and, unless published in the medical literature, (rare) are not reported.
For additional context, we searched for information on the analytic validity of pharmacogenomic tests
used in the clinical validity studies outlined above and in those studies included in the Literature Review.
One systematic review (Fleeman et al., 2010) reported on 46 studies that reported on the analytic
WA – Health Technology Assessment October 20, 2016
Pharmacogenomic testing for selected conditions: Draft report Page 35
validity of genotyping 11 different CYP450 gene variants, almost half of which were related to CYP2D6.
CYP2C19 and CYP2C9 were also included in several studies. Real-time polymerase chain reaction (PCR)
was the most frequent genotyping method, although microarray methods (including the commercially
available AmpliChip) were also applied. PCR plus restriction fragment length polymorphism analysis and
sequencing were the most common reference methods, but sequencing was used sparingly, usually as a
second reference method. The majority of studies were conducted in Europe. Study size varied from 40
subjects to 428 for the test method. Few studies reported on the ethnic origin of test subjects. All
studies reported concordance of 95% or more, regardless of the CYP gene tested or the methods used.
Few studies reported on quality control or assay robustness. In most studies, both sensitivity and
specificity were 100%. Comprehensive data were available for AmpliChip (microarray testing for CYP2D6
and CYP2C19 variants), which was submitted to and cleared by the FDA for marketing in 2005. For this
assay, concordance was 100% and sensitivity and specificity were near or at 100%. Thus, testing for
CYP450 gene variants appears highly accurate but not all aspects of analytic validity have been reported.
The current search found no analytic validity evidence for genotyping non-CYP450 genes or for
commercially available gene panels.
WA – Health Technology Assessment October 20, 2016
Pharmacogenomic testing for selected conditions: Draft report Page 36
Washington State Agency Utilization and Costs
Related Medical Codes
WA – Health Technology Assessment October 20, 2016
Pharmacogenomic testing for selected conditions: Draft report Page 37
Review Objectives and Analytic Framework
Scope
The scope of this report is defined as:
Population: People any age who are being prescribed medications for treatment of depression,
mood disorder, psychosis, anxiety, attention deficit/hyperactivity disorder (ADHD), substance
use disorder.
Interventions: Clinical laboratory tests for genetic variants in targeted genes or in panels of
genes to inform the selection or dose of psychotropic medications relevant to the conditions of
interest.
Comparisons: Usual care/no genetic testing.
Outcomes: Patient Management (KQ1): physician and patient decision-making regarding drug
choice and/or dose; improved patient adherence to treatment regimen; clinically meaningful
improvement in patient response to treatment and reduction in adverse events as a result of
treatment;
Costs (KQ2): cost-effectiveness or cost.
Key Questions
The following key questions will be addressed:
1. Effectiveness: What is the clinical utility of genetic testing to inform the selection or dose of
medications for individuals diagnosed with depression, mood disorders, psychosis, anxiety,
attention deficit/hyperactivity disorder (ADHD), or substance use disorder?
a. Does genetic testing to inform the selection or dose of medications change the drug or
dose selected by physicians and/or patients compared with usual care/no genetic
testing?
b. Do decisions about selection or dose of medications guided by genetic testing result in
clinically meaningful improvement in patient response to treatment or reduction in
adverse events as a result of treatment compared with decisions based on usual care/no
genetic testing?
2. Harms: What direct harms are associated with conducting genetic testing when it is used to
inform the selection or dose of medications?
3. Special populations: Compared with usual care/no genetic testing, do decision-making, patient
outcomes, or harms following genetic testing to inform the selection or dose of medications
vary by:
a. Clinical history (e.g., prior treatments, whether the diagnosis is initial or recurrent,
duration of diagnosis, severity of illness, or concurrent medications); or
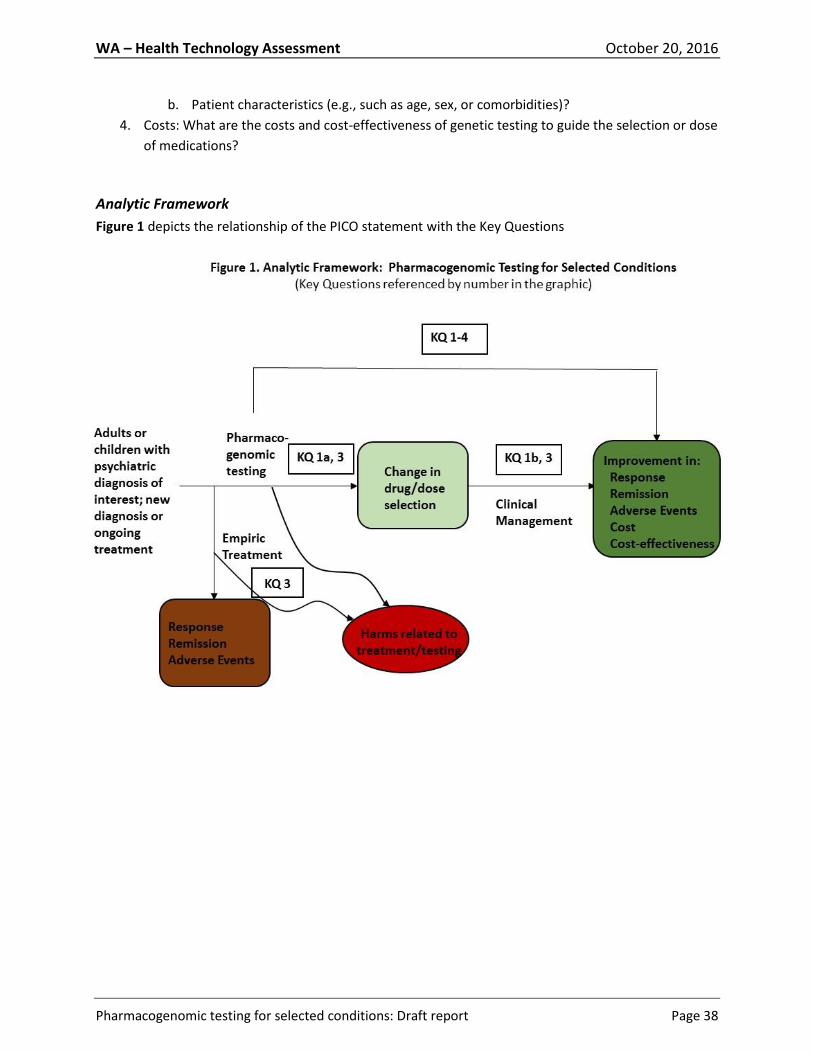
WA – Health Technology Assessment October 20, 2016
Pharmacogenomic testing for selected conditions: Draft report Page 38
b. Patient characteristics (e.g., such as age, sex, or comorbidities)?
4. Costs: What are the costs and cost-effectiveness of genetic testing to guide the selection or dose
of medications?
Analytic Framework
Figure 1 depicts the relationship of the PICO statement with the Key Questions

WA – Health Technology Assessment October 20, 2016
Pharmacogenomic testing for selected conditions: Draft report Page 39
Methods
Search Strategy and Selection Criteria
See APPENDIX II for additional search details.
Before conducting a search for primary data to answer the key questions of interest, the following
sources were searched on August 16, 2016, for systematic reviews, meta-analyses, economic
evaluations, and practice guidelines published in the last 10 years:
Core online databases such as the Agency for Healthcare Research and Quality (AHRQ), Centre
for Reviews and Dissemination (York University), National Institute for Health Research Health
Technology Assessment Programme (UK), Institute for Clinical Systems Improvement, and
National Guidelines Clearinghouse (NGC).
Websites of relevant professional societies.
PubMed, using filters for Practice Guidelines, Guidelines, Meta-analyses, and Systematic
Reviews.
Systematic reviews were not selected for inclusion in the Literature Review section of this report (since
they did not report on clinical utility) but rather formed the basis for the summary information on the
clinical validity of pharmacogenomic testing already outlined in the background section of this report.
Included systematic reviews were categorized into those that were only descriptive and those that
included quantitative meta-analyses for gene-outcome associations where sufficient numbers of studies
were available. This search was not exhaustive and was intended to exemplify the extent and type of
data that is available to support many pharmacogenomic tests for the indications of interest. Additional
details on the selection of the data presented in the background section of the report are described in
the Clinical Validity of Pharmacogenomic Testing for Pharmacotherapy of Selected Psychiatric Disorders
in APPENDIX I.
Since reports of analytic validity are rare in the clinical literature and information on the topic was
restricted to the background section of the report, no search criteria specific to analytic validity were
developed and the search is not considered systematic or exhaustive. In addition to systematic reviews
reviewed for clinical validity, and primary studies included in the Literature Summary, websites of
commercial gene panels used in the studies reviewed in the Literature Review sections of this report
were searched for information regarding analytic validity, but none were found.
Primary Studies
PubMed (January 1, 2000 to August 15, 2016), OVID-Embase (1996 to 2016, week 33) and PsycINFO
(1987 to July, week 4, 2016) databases were searched for primary studies and economic evaluations
designed to answer the Key Questions. Specific search strings are documented in APPENDIX II.
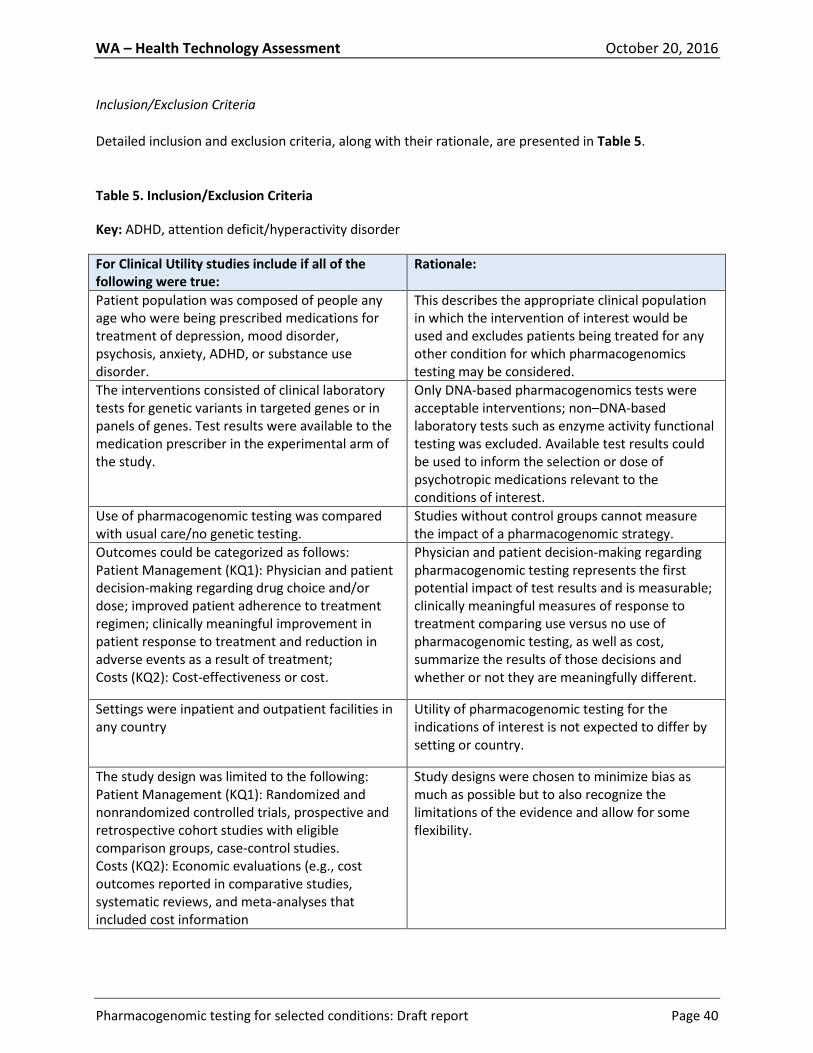
WA – Health Technology Assessment October 20, 2016
Pharmacogenomic testing for selected conditions: Draft report Page 40
Inclusion/Exclusion Criteria
Detailed inclusion and exclusion criteria, along with their rationale, are presented in Table 5.
Table 5. Inclusion/Exclusion Criteria
Key: ADHD, attention deficit/hyperactivity disorder
For Clinical Utility studies include if all of the following were true:
Rationale:
Patient population was composed of people any age who were being prescribed medications for treatment of depression, mood disorder, psychosis, anxiety, ADHD, or substance use disorder.
This describes the appropriate clinical population in which the intervention of interest would be used and excludes patients being treated for any other condition for which pharmacogenomics testing may be considered.
The interventions consisted of clinical laboratory tests for genetic variants in targeted genes or in panels of genes. Test results were available to the medication prescriber in the experimental arm of the study.
Only DNA-based pharmacogenomics tests were acceptable interventions; non–DNA-based laboratory tests such as enzyme activity functional testing was excluded. Available test results could be used to inform the selection or dose of psychotropic medications relevant to the conditions of interest.
Use of pharmacogenomic testing was compared with usual care/no genetic testing.
Studies without control groups cannot measure the impact of a pharmacogenomic strategy.
Outcomes could be categorized as follows: Patient Management (KQ1): Physician and patient decision-making regarding drug choice and/or dose; improved patient adherence to treatment regimen; clinically meaningful improvement in patient response to treatment and reduction in adverse events as a result of treatment; Costs (KQ2): Cost-effectiveness or cost.
Physician and patient decision-making regarding pharmacogenomic testing represents the first potential impact of test results and is measurable; clinically meaningful measures of response to treatment comparing use versus no use of pharmacogenomic testing, as well as cost, summarize the results of those decisions and whether or not they are meaningfully different.
Settings were inpatient and outpatient facilities in any country
Utility of pharmacogenomic testing for the indications of interest is not expected to differ by setting or country.
The study design was limited to the following: Patient Management (KQ1): Randomized and nonrandomized controlled trials, prospective and retrospective cohort studies with eligible comparison groups, case-control studies. Costs (KQ2): Economic evaluations (e.g., cost outcomes reported in comparative studies, systematic reviews, and meta-analyses that included cost information
Study designs were chosen to minimize bias as much as possible but to also recognize the limitations of the evidence and allow for some flexibility.
WA – Health Technology Assessment October 20, 2016
Pharmacogenomic testing for selected conditions: Draft report Page 41
Quality Assessment
Clinical Studies
APPENDIX III outlines the process used by Hayes for assessing the quality of individual primary studies
and the quality of bodies of evidence. This process is in alignment with the methods recommended by
the Grading of Recommendations, Assessment, Development and Evaluation (GRADE) Working Group.
Quality checklists for individual studies address study design, integrity of execution, completeness of
reporting, and the appropriateness of the data analysis approach. Additional items were added that
pertain specifically to this topic area. Individual studies are labeled as good, fair, poor, or very poor.
Like the GRADE Working Group, Hayes uses the phrase quality of evidence to describe bodies of
evidence in the same manner that other groups, such as the Agency for Healthcare Research and Quality
(AHRQ), use the phrase strength of evidence. The Hayes Evidence-Grading Guides ensure that
assessment of the quality of bodies of evidence takes into account the following considerations:
Methodological quality of individual studies, with an emphasis on the risk of bias within studies.
Applicability to the population(s), intervention(s), comparator(s), and outcome(s) of interest, i.e., applicability to the PICO statement.
Consistency of the results across studies. Quantity of data (number of studies and sample sizes).
Publication bias, if relevant information or analysis is available.
NOTE: Two terms related to applicability are directness and generalizability. Directness refers to how
applicable the evidence is to the outcomes of interest (i.e., health outcomes versus surrogate or
intermediate outcomes) or to the comparator of interest (indirect comparison of 2 treatments versus
head-to-head trials). Generalizability usually refers to whether study results are applicable to real-world
practice. If the setting is not specified in a PICO (population-interventions-comparator-outcomes)
statement, the issue of generalizability to real-world settings is not typically treated as an evidence
quality issue. Another term used by some organizations is imprecision, which refers to findings based on
such a small quantity of data that the CI surrounding a pooled estimate includes both clinically
important benefits and clinically important harms, or such a small quantity of data that any results other
than large statistically significant effects should be considered unreliable.
Bodies of evidence for particular outcomes are labeled as being of high, moderate, low, or very low
quality. Very-low-quality bodies of evidence are deemed to be insufficient to permit conclusions. These
labels can be interpreted in the following manner:
High: Suggests that we can have high confidence that the evidence found is reliable, reflecting the
true effect, and is very unlikely to change with the publication of future studies.
WA – Health Technology Assessment October 20, 2016
Pharmacogenomic testing for selected conditions: Draft report Page 42
Moderate: Suggests that we can have reasonable confidence that the results represent the true
direction of effect but that the effect estimate might well change with the publication of new
studies.
Low: We have very little confidence in the results obtained, which often occurs when the quality of
the studies is poor, the results are mixed, and/or there are few available studies. Future studies are
likely to change the estimates and possibly the direction of the results.
Very low: Suggests no confidence in any result found, which often occurs when there is a paucity of
data or the data are such that we cannot make a statement on the findings.
Economic Evaluations
A tool created for internal use at Hayes was used to guide interpretation and critical appraisal of
economic evaluations. The tool for economic evaluations was based on best practices as identified in the
literature and addresses issues such as the reliability of effectiveness estimates, transparency of the
report, quality of analysis (e.g., the inclusion of all relevant costs, benefits, and harms),
generalizability/applicability, and conflicts of interest. Sources are listed in APPENDIX III.
Guidelines
The Rigor of Development domain of the Appraisal of Guidelines Research and Evaluation (AGREE) tool
(AGREE Enterprise, 2013), along with a consideration of the items related to commercial funding and
conflicts of interest among the guideline authors, was used to assess the quality of practice guidelines.
Use of the AGREE tool was limited to these areas because they relate most directly to the link between
guideline recommendations and evidence.
Search Results
Included Studies
Fourteen studies were selected for detailed analysis as evidence pertaining to the Key Questions. Figure
3 summarizes the systematic identification and selection of these studies, which include 4 studies
addressing Key Question 1a (clinical utility, medical decision-making), 9 studies addressing Key Question
1b (clinical utility, patient outcomes), which were also assessed for Key Question 3 (subgroups), and 7
studies addressing Key Question 4 (economic outcomes). No unique studies were identified for Key
Question 2 (harms of testing).
Excluded Studies
See APPENDIX IV for a listing of the 19 studies that were excluded from analysis after full-text review.
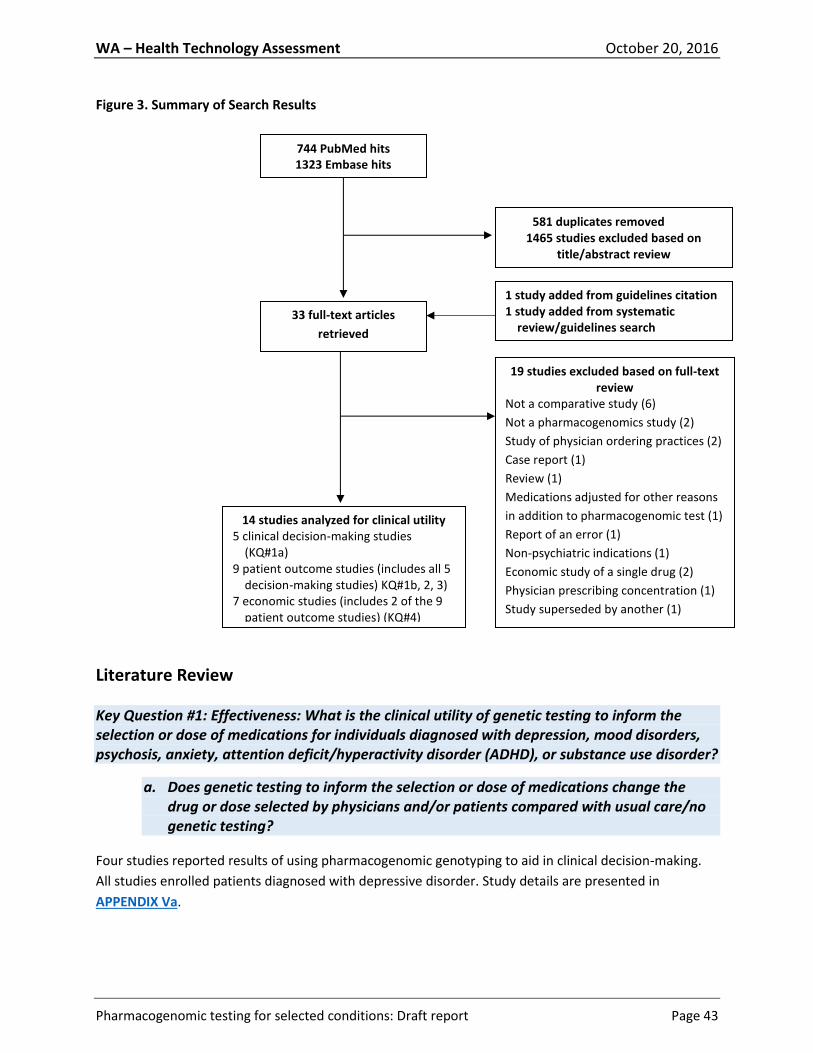
WA – Health Technology Assessment October 20, 2016
Pharmacogenomic testing for selected conditions: Draft report Page 43
Figure 3. Summary of Search Results
Literature Review
Key Question #1: Effectiveness: What is the clinical utility of genetic testing to inform the selection or dose of medications for individuals diagnosed with depression, mood disorders, psychosis, anxiety, attention deficit/hyperactivity disorder (ADHD), or substance use disorder?
a. Does genetic testing to inform the selection or dose of medications change the drug or dose selected by physicians and/or patients compared with usual care/no genetic testing?
Four studies reported results of using pharmacogenomic genotyping to aid in clinical decision-making.
All studies enrolled patients diagnosed with depressive disorder. Study details are presented in
APPENDIX Va.
581 duplicates removed 1465 studies excluded based on
title/abstract review
19 studies excluded based on full-text review
Not a comparative study (6)
Not a pharmacogenomics study (2)
Study of physician ordering practices (2)
Case report (1)
Review (1)
Medications adjusted for other reasons
in addition to pharmacogenomic test (1)
Report of an error (1)
Non-psychiatric indications (1)
Economic study of a single drug (2)
Physician prescribing concentration (1)
Study superseded by another (1)
33 full-text articles
retrieved
14 studies analyzed for clinical utility 5 clinical decision-making studies
(KQ#1a) 9 patient outcome studies (includes all 5
decision-making studies) KQ#1b, 2, 3) 7 economic studies (includes 2 of the 9
patient outcome studies) (KQ#4)
744 PubMed hits 1323 Embase hits
1 study added from guidelines citation 1 study added from systematic
review/guidelines search
WA – Health Technology Assessment October 20, 2016
Pharmacogenomic testing for selected conditions: Draft report Page 44
Two studies were prospective double-blind randomized controlled trials (RCTs) of fair quality (Winner et
al., 2013; Singh, 2015), 1 was a prospective controlled trial of poor quality (Hall-Flavin et al., 2012), and 1
was a retrospective comparative study of poor quality (Breitenstein et al., 2014).
Singh (2015) randomized 74 white patients to a pharmacogenomic genotyping arm and 74 similar
patients to a control arm, in which a DNA sample was obtained for patient blinding but was not
analyzed. A commercial genotyping assay detecting genetic variation in genes coding for the serotonin
transporter linked promoter region (5-HTTLPR), which may impact response to antidepressants, ABC
active efflux transporters at the blood brain barrier (ABCB1, ABCC1), and enzymes that metabolize
antidepressants (CYP2D6, CYP2C19, UGT1A1) was utilized. Results of the test were provided in the form
of an interpretive report with recommended dose ranges; prescribers were allowed to use their
judgment in choice of treatment medication. In the genotyping arm, all treatment prescribers were
verified to have viewed the pharmacogenomic interpretive report. In 65% of cases, prescribers indicated
that pharmacogenomic results changed medication dosing compared with their usual practice, as
conveyed by confidential feedback form.
In a similarly designed study, Winner et al. (2013) randomized 26 patients to pharmacogenomic
genotyping and 25 to treatment as usual. Control patients were genotyped but no results were provided
to attending physicians. A proprietary commercial test measuring variation in genetic sequence among
genes that are believed to influence antidepressant and antipsychotic drug metabolism (CYP2D6,
CYP2C19, CYP1A2) and response (SLC6A4, HTR2A) was utilized to provide an interpretive report and
recommendations for medication selection and dose. In the genotyping arm, 100% of baseline
medications that the assay interpretive report indicated should be used with caution and frequent
monitoring were changed. In the control arm, only 50% of similarly classified medications were altered
when the genotyping report was evaluated after the fact.
Breitenstein et al. (2014) conducted a retrospective comparative study of 116 patients undergoing a
moderate to severe depressive episode at hospital admission. ABCB1 genotyping had been available to
treatment prescribers for 58 of these patients. Among genotyped patients, those found to have an
identified “unfavorable” genotype, antidepressant dose was increased 1.63-fold compared with other
genotypes (P=0.012). A change to a different antidepressant also occurred more often in patients with
an unfavorable genotype than in other genotypes (P=0.011).
Finally, Hall-Flavin et al. (2012) conducted a prospective controlled trial using the same genotyping assay
as Winner et al. (2013). Twenty-five consecutively selected adults were genotyped with results
immediately returned to their physicians; 26 similar controls were also genotyped but results were not
provided to their physicians until after 8 weeks of treatment. At 8 weeks, only 5.9% of genotyped
patients were prescribed a medication that the pharmacogenomic interpretive report labeled “use with
caution” compared with 21.4% of controls (P=0.02).
The overall quality of the body of evidence to answer Key Question 1a was considered to be of low
quality. All studies were moderately to very small and limited to patients with depressive disorders; only
2 studies were randomized clinical trials. The limited results regarding clinical decision-making suggest
WA – Health Technology Assessment October 20, 2016
Pharmacogenomic testing for selected conditions: Draft report Page 45
that pharmacogenomic test results, whether derived from single-gene tests or interpretive panels, may
change prescribing patterns in favor of pharmacogenomic recommendations compared with treatment
as usual. This is a necessary but not sufficient step toward improving patient outcomes.
Key Question #1: Effectiveness: What is the clinical utility of genetic testing to inform the
selection or dose of medications for individuals diagnosed with depression, mood disorders,
psychosis, anxiety, attention deficit/hyperactivity disorder (ADHD), or substance use disorder?
b. Do decisions about selection or dose of medications guided by genetic testing result in clinically meaningful improvement in patient response to treatment or reduction in adverse events as a result of treatment compared with decisions based on usual care/no genetic testing?
Nine studies reported results of using pharmacogenomic genotyping and subsequent effects on patient
outcomes. Six studies enrolled patients with depressive disorders, 2 enrolled patients with any
psychiatric disorder, and 1 enrolled patients with alcohol use disorder. Study details are presented in
APPENDIX Va.
Pharmacogenomic Studies of Treatment of Depressive Disorders
Two studies were prospective double-blind RCTs of fair quality (Winner et al., 2013; Singh, 2015); 2 were
prospective controlled trials, 1 of fair quality (Hall-Flavin et al., 2013) and 1 of poor quality (Hall-Flavin et
al., 2012); 2 were retrospective comparative studies, 1 of poor quality (Breitenstein et al., 2014;
Fagerness et al., 2014; Espadaler et al., 2016) and 1 of very poor quality (Rundell et al., 2011).
Outcome: Remission
Four studies reported on remission from a depressive disorder, comparing patients whose prescribing
physicians had access to pharmacogenomic information to control patients treated as usual. In an RCT,
Singh (2015) reported that at 12 weeks after treatment based on pharmacogenomic results, tested
patients (blinded to physician use of test results) statistically significantly more often obtained remission
as defined by a 17-item Hamilton Depression Rating Scale (HAM-D17) score of less than 7 (OR=2.52; 95%
CI, 1.71-3.73; P<0.0001) and that the number needed to test to obtain remission was 3. This trial used a
commercial pharmacogenomic assay panel (CNSDose) that tests for variants in several genes and uses
proprietary technology to provide an interpretive report with recommended antidepressants and dose
ranges. Detail on how individual variant genotype results are combined to generate recommendations is
not available. The test is not currently available in the United States but may be available at a later date
(Venkatesh, 2016).
Winner et al. (2013), in an RCT, and Hall-Flavin et al. (2013), in a prospective controlled trial, both
employed the same U.S.-based commercial pharmacogenomic assay panel (GeneSight) to compare
remission outcomes for patients treated with pharmacogenomic information available versus patients
treated as usual. Patented proprietary technology is used to translate the several GeneSight panel gene
variant genotype results for each patient into an interpretive report in which 26 psychiatric medications
WA – Health Technology Assessment October 20, 2016
Pharmacogenomic testing for selected conditions: Draft report Page 46
are placed in categories of “use as directed,” “use with caution,” and “use with caution and with more
frequent monitoring.” In the underpowered Winner et al. RCT, results suggested greater likelihood of
remission for tested patients but were not statistically significant. In the Hall-Flavin et al. controlled trial,
tested patients were statistically significantly more likely to obtain remission compared with controls at
8 weeks, as defined by a Quick Inventory of Depressive Symptomatology (Clinician Rated) (QIDS-C16)
score < 6. However, similar results were not obtained using HAM-D17 or the 9-item Patient Health
Questionnaire (PHQ-9) depression severity score, except for results using data imputation to account for
27% of patients lost to follow-up.
Finally, in a retrospective comparative study testing for variants in a single gene, Breitenstein et al.
(2014) reported that genotyped patients were statistically significantly more likely to be in remission
(HAM-D score < 10) at hospital discharge compared with non-genotyped patients (83.6% versus 62.1%;
P=0.005).
Summary of Remission Outcomes:
It has been reported that approximately one-third of those who ultimately respond to treatment of a
depressive episode and half of those who entered remission did so after 6 weeks while 40%t of those
who entered remission required 8 or more weeks (Gaynes et al., 2008). All studies reporting remission
outcomes followed patients for 8 or more weeks, except Breitenstein et al. (results reported at
discharge; hospital stays averaged approximately 10 to 15 weeks). Thus follow-up times appear
reasonable.
In all studies, enrolled patients had minimum HAM-D scores of 14 to 18 whereas remission was defined
as HAM-D score of less than 7 to 10. Thus, for remission, scores were required to change by 4 to 11
points, depending on the study. The National Institute for Health and Clinical Excellence (NICE)
guidelines for depression (NICE, 2009) defines the minimal clinically important difference (MCID) in
HAM-D as 3 points but do not reference this value. In a letter to the editor, Masson and Tejani (2013)
report a systematic review of studies that identified the MCID of depression rating scales. For the HAM-
D17 (17 item) and HAM-D (21 item) scales, approximately 4.5- and 5.7-point differences, respectively,
are needed for clinical relevance. Only the Breitenstein et al. (2014) study does not meet this criterion.
Culpepper et al. (2015) recently stated that a HAM-D17 cutoff of 7 to define remission is no longer
considered acceptable because global psychosocial functioning and quality of life are still impaired.
Thus, although using accepted definitions, these studies may not be measuring full remission.
In summary, despite consistency of results favoring improved remission rates as a result of genotyping,
the quality of the evidence is low and our confidence that the results represent a true effect is therefore
also low. The results of Breitenstein et al. (2014) may lack clinical relevance. Hall-Flavin et al. (2013)
lacks consistency of results due to high losses to follow-up (27%) and reliance on data imputation for
statistical significance for 2 of 3 depression scores. The Winner et al. (2013) RCT is underpowered to
discriminate between groups. The most statistically significant results for the outcome of remission are
reported by Singh (2015) using a test that is not currently available in the United States. Because the
methods used to generate interpretations of the individual genetic variant results and derive overall

WA – Health Technology Assessment October 20, 2016
Pharmacogenomic testing for selected conditions: Draft report Page 47
clinical recommendations for drug selection and dose are not known, the clinical utility performance of
one specific panel test is not generalizable to that of any other pharmacogenomic test.
Outcome: Response to Treatment
Four studies reported on response to treatment of depressive disorders. In the RCT reported by Winner
et al. (2013), nonsignificant results in the direction of improved treatment response (> 50% reduction in
HAM-D17 score from baseline) were seen at 10 weeks. In a prospective controlled trial, Hall-Flavin et al.
(2013) reported consistent and statistically significantly improved response (> 50% reduction in score
from baseline) for 3 different commonly used measures of depression symptoms among genotyped
patients compared with controls. Odds ratios ranged from 2.06 to 2.58. In a similarly designed, fair-
quality, prospective controlled trial that also used the GeneSight pharmacogenomic test, Hall-Flavin et
al. (2012) reported improved response for a statistically significantly larger proportion of genotyped
patients than controls using QIDS-C16 and HAM-D17 depression severity scores. In a very-poor-quality
retrospective comparative study, Rundell et al. (2011) reported inconsistent but primarily nonsignificant
results for response to treatment. Clinical interpretation of some of the measures investigated (e.g., pre-
to post-baseline PHQ-9 scale slopes) was not provided.
Summary of Response to Treatment Outcomes:
Response to treatment of depression is typically measured as a reduction in score of 50% or more for
well-validated instruments such as HAM-D, QIDS-C16, and PHQ-9 (Culpepper et al., 2015). In fact, a 50%
or greater reduction in the PHQ-9 is a National Quality Measures Clearinghouse clinical quality measure
(NQMC, 2005). Overall, the results for response to treatment, comparing pharmacogenomic testing
informed prescribing to treatment as usual, lack consistency, are limited in some cases by lack of
acceptable measures of response, or were underpowered. The overall quality of the evidence is low.
Best results are reported by Hall-Flavin et al. (Hall-Flavin et al., 2013), which used such measures of
response and showed that patients whose prescribing physicians had access to GeneSight
pharmacogenomic genotyping results were statistically significantly more likely to respond than control
patients who were prescribed treatment as usual for 8 weeks. These results were obtained both for
remaining patients after 27% loss to follow-up and for imputed data with the exception of the imputed
QIDS-C16 score. As noted for the CNSDose assay, pharmacogenomic panel tests are not generalizable to
other pharmacogenomic tests as the methods used to generate interpretations of the individual genetic
variant results are not known.
Hall-Flavin et al. (2012) also used the GeneSight assay and obtained statistically significant reductions in
depression severity scores, but did not use a criterion to define response. Power analyses assumed only
20% to 25% reductions in scores. Lack of an accepted criterion for response renders the results less
clinically interpretable. Rundell et al. (2011) also did not use usual criteria for defining response to
treatment and further did not define the clinical relevance of measures used to compare response. Most
comparisons were not statistically significant. In this retrospective study, any one or more of four
different genes were required to have been genotyped, so pharmacogenomic comparisons between
patient groups were likely not equivalent. While Winner et al. reported the results of an RCT with a well-
WA – Health Technology Assessment October 20, 2016
Pharmacogenomic testing for selected conditions: Draft report Page 48
defined response to treatment, the study was underpowered and results favoring improved response of
genotyped patients were not statistically significant.
Outcome: Adherence, Tolerance, Adverse Events; Hospital Stay
Only Singh (2015) reported on tolerance of medications in an RCT, finding that non-genotyped control
patients were less tolerant of medications, statistically significantly more often requiring dose reduction
or cessation (OR=1.13; 95% CI, 1.01-1.25; P=0.0272). In addition, genotyped patients took sick leave less
often (4% versus 15%; P=0.0272) and took leave times of shorter duration when needed compared with
non-genotyped patients (4.3 versus 7.7 days; P=0.014).
Breitenstein et al. (2014), in a poor-quality retrospective comparative study, reported that patients who
were prescribed dose increases for genotype-appropriate antidepressants had shorter hospital stays
(P=0.009). Moreover, hospital stays for patients with an unfavorable ABCB1 genotype were reduced by
an average of 4.7 weeks if the antidepressant dose was increased by more than 1.5-fold.
While favoring pharmacogenomic genotyping, the evidence supporting pharmacogenomic impact on
outcomes related to adverse events and to duration of hospital stay is of very low quality, limited to 1
trial each, and, as such, is insufficient for forming conclusions.
Pharmacogenomic Studies of Treatment of Any Psychiatric Disorder
Two retrospective comparative studies of poor quality (overall, very-low-quality body of evidence)
enrolled patients diagnosed with any psychiatric disorder. In 1 study, patients had failed a previous
treatment regimen due to lack of efficacy and/or poor tolerability (Espadaler et al., 2016). Primary
diagnoses were major depression, psychotic disorder, and bipolar disorder. In another study (Fagerness
et al., 2014), primary diagnoses were ADHD, anxiety disorder, depression, and mood disorder. In both
studies, one group was selected because attending physicians had ordered pharmacogenomic testing.
Similar control groups were selected from the same source of patients. Fagerness et al. (2014) used
propensity score matching to choose an equivalent control group.
One study reported on response to treatment outcomes using a large commercial pharmacogenomic
assay panel (Neuropharmagen) developed in Spain and not available in the United States (Espadaler et
al., 2016). Espadaler et al. reported that at 3 months, 93% of genotyped patients versus 82% of control
patients treated as usual had Clinical Global Impression of Severity (CGI-S) scores statistically
significantly lower than baseline, a common global measure of response (adjusted OR=3.86; 95% CI,
1.36-10.95; P=0.011).
Espadaler et al. (2014) and Fagerness et al. (2014), using a pharmacogenomic panel assay developed and
available in the United States (Genecept Assay), reported outcomes related to adverse events. The
Genecept Assay determines genotypes of several gene variants, reports on those individual gene
variants and their therapeutic implications, and provides a drug interaction summary categorizing
medications as “use as directed,” “therapeutic options,” or “use with caution,” based on the patient
overall genotype. The method for this categorization is not provided. Espadaler et al. noted only that
WA – Health Technology Assessment October 20, 2016
Pharmacogenomic testing for selected conditions: Draft report Page 49
equal numbers of adverse events were reported in each group. Fagerness et al. found that genotyped
patients showed an average increase in drug treatment adherence of 6.3% compared with 0.3% in
patients treated as usual (P=0.0016).
Pharmacogenomic Studies of Treatment of Alcohol Use Disorder
Oslin et al. (2015) was a prospective observational study conducted within an RCT of fair quality. The
asn40asp variant of the OPRM1 gene had been identified in prior work as modifying the response to
naltrexone in the treatment of alcohol use disorder, with asp40 predicted to improve response. While
genotyping information was not used to modify treatment in this study, fixed-dose naltrexone and
placebo groups were stratified by asn40 and asp40 variant category to determine impact on treatment.
With regard to treatment response, the naltrexone-asp40 group was more likely to drink heavily
(OR=1.10; 95% CI, 0.52-2.31; P=0.80) than the naltrexone-asn40 group (OR=0.69; 95% CI, 0.41-1.18;
P=0.17), a result opposite to that expected, although not statistically significant. While serious and
severe adverse events were infrequent and unrelated to group assignment, adherence (at least 80% of
12 weeks of treatment days) was worse for the naltrexone-asp40 group than for all others.
The authors of this study suggested that it was unlikely the OPRM1 asn40asp variant significantly
modulates naltrexone treatment. Thus, very-low-quality evidence from 1 fair-quality study is insufficient
evidence to draw conclusions.
Overall Summary of Key Question #1 Evidence
A systematic search for the best available evidence uncovered just 9 studies that met inclusion criteria
for Key Question 1, and that did not address all indications of interest for this report. In some cases,
populations were limited by race and ethnicity, which reduces potential genotype confounders but also
reduces generalizability of results. Four studies were rated fair quality, 4 poor quality, and 1 very poor
quality. Only the fair-quality studies were prospectively designed. Of these, 1 RCT (Winner et al., 2013)
was seriously under-powered, as evidenced by a power analysis, which concluded that 92 to 115
patients were needed in each trial arm whereas 25 and 26 were enrolled. Therefore, all results had no
statistical significance. One reasonably well-designed RCT (Singh, 2015), with statistically significant
treatment response and remission results supporting pharmacogenomic testing for patients with major
depressive disorder, used a commercial interpretive panel assay that is not available in the United
States. As noted, pharmacogenomic panel tests are not generalizable to other pharmacogenomic tests,
as the methods used to generate clinical interpretations and treatment recommendations from the
individual genetic variant results are not known.
Two prospective controlled (nonrandomized) trials (Hall-Flavin et al., 2012; Hall-Flavin et al., 2013)
conducted using the same U.S.-based commercial interpretive pharmacogenomic panel both reported
statistically significant remission and/or response to treatment results. Only one of these (Hall-Flavin et
al., 2013) appropriately defined clinical measures of remission and response but lacked some
consistency of results between those calculated from remaining patients (27% lost to follow-up) and
those calculated using imputed data. Among poor-quality studies, all were retrospective, some did not

WA – Health Technology Assessment October 20, 2016
Pharmacogenomic testing for selected conditions: Draft report Page 50
define the clinical relevance of treatment response measures, or may have lacked equivalency of
comparison groups. For the 2 studies that enrolled patients with any psychiatric disorder and the
pharmacogenomic assays used in these studies, patient numbers were too few, study quality poor, and
results too sparse for conclusions regarding the impact of pharmacogenomic testing on treatment
response or adverse event–related outcomes. The authors of the single study on pharmacogenomic
variant testing to improve response to naltrexone for alcohol use disorder concluded that the variant in
question likely did not moderate the response.
In summary, the evidence base for pharmacogenomic testing for the psychiatric disorders of interest for
this report is extremely limited and compromised and is considered to be of low to very low quality,
depending on the outcome measured. As such, the evidence is insufficient for forming conclusions
regarding clinical use.
Key Question #2: What direct harms are associated with conducting genetic testing when it is used to inform the selection or dose of medications?
No studies were found that address the direct harms of pharmacogenomic testing. DNA may be
collected from a whole blood sample, which involves an invasive procedure, or for some tests, it may be
collected from a cheek swab or from saliva, which is noninvasive.
Key Question #3: Compared with usual care/no genetic testing, do decision-making, patient outcomes, or harms following genetic testing to inform the selection or dose of medications vary by:
a. Clinical history (e.g., prior treatments, whether the diagnosis is initial or recurrent, duration of diagnosis, severity of illness, or concurrent medications); or
b. Patient characteristics (e.g., such as age, sex, or comorbidities)?
All 9 included studies were reviewed for presentation of results by clinical history or patient
characteristic parameters. Study details are presented in APPENDIX Vb.
Two studies were RCTs (Winner et al., 2013; Singh, 2015) and a third was conducted within an RCT (Oslin
et al., 2015). Two retrospective comparative studies matched control patients according to age, sex, and
varying clinical history parameters to pharmacogenomically tested patients (Breitenstein et al., 2014;
Fagerness et al., 2014). Two prospective controlled trials selected 2 consecutive groups from the same
population (Hall-Flavin et al., 2012; Hall-Flavin et al., 2013). A third retrospective comparative study
drew 2 groups from the same population but did not actively match (Espadaler et al., 2016). One
retrospective comparative study selected pharmacogenomically tested versus untested patients
(Rundell et al., 2011).
All studies compared pharmacogenomically tested groups with control groups at baseline and 8 of 9
studies found few statistically significant differences. The exception is Rundell et al. (2011), a very-poor-
quality study that retrospectively enrolled patients who did and did not have pharmacogenomic testing
WA – Health Technology Assessment October 20, 2016
Pharmacogenomic testing for selected conditions: Draft report Page 51
ordered. Tested patients had greater degrees of psychiatric predisposition and depression severity at
baseline as evidenced by differences in several related variables. After adjustment for these clinical
history variables, no significant differences for the PHQ-9 depression severity scores were found among
genotypes. Outcomes for specific subgroups were not reported.
Espadaler et al. (2016), in a poor-quality retrospective comparative study, compared
pharmacogenomically tested versus untested groups using multivariate logistic regression and found
that neither clinical history variables nor patient characteristic variables were statistically significant
predictors of the response to medication as measured by the QIDS-C16.
No other studies adjusted for or reported results of subgroup analyses according to clinical history or
patient characteristic variables. Taken together, the evidence is of very low quality for detecting
subgroups and therefore insufficient for forming conclusions.
Key Question #4: What are the costs and cost-effectiveness of genetic testing to guide the selection or dose of medications?
The literature search identified 7 economics assessments that compared the cost of pharmacogenomic
testing versus usual care for psychiatric conditions. The results of 3 cost-comparison studies suggest that
employment of pharmacogenomic testing is associated with reduced total costs for healthcare.
Medication costs in tested patients were greater than non-tested patients in 1 study and less in another
study. Two studies reported that medication adherence was higher in patients who were tested versus
those who were not tested. Of the 2 cost-effectiveness studies, 1 reported that pharmacogenomics
testing was not cost-effective and the other found that it was moderately cost-effective. One additional
study found that patients were willing to pay for pharmacogenomic testing if it reduced the number of
medication trials or the amount of time for correct dosing to be achieved. The studies are summarized in
the following paragraphs.
NOTE: For the following currency conversions, the CCEMG-EPPI-Centre web-based cost converter with
the International Monetary Fund (IMF) dataset for Purchasing Power Parity (PPP) values was used on
September 28, 2016, with the specified price year and 2016 as the target price year: CCEMG-EPPI-Centre
Cost Converter (last updated on April 29, 2016) (Shemilt et al., 2010). These conversions represent an
approximate translation of the procedural cost and/or product price values to current U.S. values. These
conversions do NOT provide an estimate of the current cost and do not directly reflect the U.S.
healthcare system.
Cost-Comparison Studies
Winner et al. (2015) – Pharmacy benefits provider database (September 2011 to December 2013) used
to select patients prescribed psychiatric medication in multiple U.S. practice settings; pharmacogenomic
testing (n=1662) versus propensity-matched controls (n=10,880), mixed psychiatric diagnoses, 1-year
total medication costs, currency reference year was not reported:
WA – Health Technology Assessment October 20, 2016
Pharmacogenomic testing for selected conditions: Draft report Page 52
The average medication costs per member per year increased by $1725 in the standard care control
group versus $690 in the pharmacogenomic testing group from the pretest period to the study end,
resulting in a cost savings of $1035 for the tested group (P<0.0001). The proportion of days covered
ratio indicated that the medication adherence rate increased by 0.11 in the tested group and decreased
by 0.01 in the standard care group, resulting in a net improvement of 0.123 in the tested group
(P<0.0001). Of the patients in the tested group, 78% received medications that were congruent with the
test results and 22% received incongruent medications. Treatment with medications that were
congruent with pharmacogenomics testing outcomes was associated with a net annual cost savings of
$2775 versus treatment with incongruent medications (P<0.0001). When analyzed by psychiatric
diagnosis, treatment with congruent medications was associated with net annual cost savings of $6875
in patients with anxiety disorder (P<0.0001), $3580 in patients with depressive disorder (P<0.007), and
$4795 in patients with bipolar disorder (P=0.14) compared with treatment with incongruent
medications.
Fagerness et al. (2014) – U.S.-based medical and pharmacy claims database (September 2010 to
September 2012), pharmacogenomic testing (n=111) versus propensity-matched controls (n=222),
mixed psychiatric diagnoses, medication and outpatient medical visit costs, currency reference year was
not reported:
The average medication costs per patient increased by $886 (14.2%) in the pharmacogenomic testing
group versus $222 (5.5%) in the standard care control group from the pretest period to 4 months
posttest, resulting in a $664 lesser cost for the control group (P<0.108). The average increase in
medication adherence was 6.3% in the test group versus 0.3% in the control group, resulting in a
statistically significant difference in adherence favoring the test group (6%; P=0.001). Outpatient private
practitioner visits declined by an average of 1.2 and 0.1 visits from the pretest to posttest period in the
test group and control group, respectively. Private practitioner costs were reduced by $425 (–26.8%) per
patient in the test group and increased by $537 (63.4%) in the control group (P=0.105). Overall, total
costs increased by 5.9% in the test group and 15.4% in the control group. The relative cost savings for
patients who received pharmacogenomics testing was $562 (9.5%) per patient versus the control
patients.
Herbild et al. (2013) – Danish patient registers, pharmacogenomic testing (n=103) versus standard care
controls (n=104), schizophrenia, total healthcare costs (medications, primary care services, hospital
services, and psychiatric services), currency reference year 2010:
Mean total costs for 1 year were DKK 131,141 (USD 18,440 in 2016) in the test group (range, DKK 1702
to 1,189,742 [USD 239 to 167,295 in 2016]) and DKK 153,536 (USD 21,589 in 2016) in the control group
(range, DKK 12,032 to 1,052,956 [USD 1691 to 148,061 in 2016]). Both means were affected by a few
patients with very high healthcare costs—median costs were DKK 86,388 (USD 12,147 in 2016) for the
test group and DKK 105,392 (USD 14,819 in 2016) for controls. Mean psychiatric costs for 1 year were
DKK 100,433 (USD 14,122 in 2016) in the test group (range DKK 1642 to 1,189,742 [USD 230 to 167,295
in 2016]) and DKK 121,648 (USD 17,105 in 2016) in the control group (range DKK 1642 to 1,030,560 [USD
230 to 144,912 in 2016]). Psychiatric care means were also affected by a few patients with very high

WA – Health Technology Assessment October 20, 2016
Pharmacogenomic testing for selected conditions: Draft report Page 53
psychiatric costs—median costs were DKK 47,618 (USD 6695 in 2016) for the test group and DKK 76,348
(USD 10,735 in 2016) in the control group. Mean medication costs for 1 year were DKK 21,709 (USD
3052 in 2016) in the test group and DKK 22,544 (USD 3170 in 2016) in the control group. Incorporating
the data into various models of total medical care and psychiatric care, which stratified patients based
on metabolizer genotype, suggested that pharmacogenomics testing significantly reduced healthcare
costs among patients who were classified as extreme metabolizers (either poor or ultrarapid
metabolizers).
NOTE: Costs were converted from the value of the Danish krone in 2010 to USD 2016.
Rundell et al. (2011) – Mayo Clinic database (January 2006 to June 2010), pharmacogenomic testing
(n=45) versus standard care controls (n=47), depression, total healthcare costs, currency reference year
2010:
The mean healthcare costs from the pretest period to posttest period were $5010 in the
pharmacogenomics test group and $6693 in the control group (P=0.08). The difference between groups
was statistically significant after adjusting for diagnosis of major depressive disorder (P=0.049) and the
numbers of psychotropic drug trials (P=0.02) but not after adjusting for baseline depression severity,
family history of mood disorder, or practice setting (all analyses, P>0.07).
Cost-Effectiveness Studies
Perlis et al. (2009) – Data from the Sequenced Treatment Alternatives to Relieve Depression (STAR*D)
study, pharmacogenomics testing either before first-line treatment (test first) or after first-line
treatment failure (test second) versus no testing (control), depression, direct costs (outpatient
treatment, hospitalization, and antidepressant medications), currency reference year 2006:
Cost-effectiveness analyses were performed using state-transition probability models incorporating
probabilities from the STAR*D study. Costs and quality-adjusted life-years (QALY) were compared for
sequential trials of antidepressants with or without guidance from a pharmacogenomics test. The base
case was a 40-year-old with major depressive disorder. Compared with treating all patients with a
selective serotonin reuptake inhibitor as first- or second-line therapy, testing patients first and assigning
bupropion to those testing negative increased costs by $505.50 per patient but provided an additional
0.0054 QALY to yield an incremental cost-effectiveness ratio (ICER) of $93,520 per QALY. Based on the
commonly used threshold of $50,000 per QALY, pharmacogenomics testing would not be cost-effective.
In one-way sensitivity analyses to examine the impact of individual model parameters, the ICER for
testing was in the $80,000 to $100,000 range. Test cost, which ranged from $100 to $1000, had a large
effect on cost-effectiveness. When the response risk ratio was varied over its 95% confidence interval,
the ICER decreased from $218,000 to $59,000 per QALY.
Olgiati et al. (2012) – Hypothetical cohort of white adults modeled from the STAR*D study,
pharmacogenomics testing versus no testing in high-income Western European countries, depression,
direct costs, currency (international dollars [Intl]) reference year 2009:
WA – Health Technology Assessment October 20, 2016
Pharmacogenomic testing for selected conditions: Draft report Page 54
Cost-effectiveness analyses were performed using state-transition probability models. Costs for
outpatient and inpatient care were obtained from World Health Organization data. The incremental
benefit of the pharmacogenomic approach is 0.062 quality-adjusted life-weeks (QALW) for clinical
response plus 0.016 QALWs for side effect burden. Assuming that patients will have 2 recurrent
episodes, the overall incremental benefit of pharmacogenomic testing is 0.156 QALWs. The estimated
overall cost of healthcare was Intl $2242 with pharmacogenomics testing and Intl $2063 without testing.
The incremental cost of pharmacogenomic testing was Intl $179 and the ICER was Intl $1147.
Multivariate sensitivity analyses were performed using estimated ICER values ranging from Intl $638 to
Intl $1738 (representing the 10th to 90th percentiles). Cost-effectiveness acceptability curves revealed
that the probability of having an ICER value below the Intl $1926 cost-effectiveness threshold suggested
by the World Health Organization was 90%, suggesting that pharmacogenomics testing was moderately
cost-effective.
Cost-Utility Study
Herbild et al. (2009) – Web-based discrete choice questionnaire of Danes (n=323), pharmacogenomics
testing versus no testing, depression, willingness to pay for pharmacogenomics testing, currency
reference date was not reported:
A fractional factorial experimental design was employed to assess the willingness of Danish people to
pay for pharmacogenomic testing upon diagnosis of depression. The questionnaire was based on expert
opinion, literature review, and focus group interviews. Conditional logistic regression analyses
determined that the coefficient on the price attribute was negative, indicating decreasing utility as the
cost of the test increases. The coefficients of the effect attributes were positive, indicating that utility
increases with decreases in the number of changes in medications or reduced times for dosage
adjustments. The willingness-to-pay estimate for a 10% probability of a reduction of 1 in the number of
antidepressant changes was DKK 1571 (USD 229 in 2016) and for the reduction of 1 month in the time
for dosage adjustments was DKK 604 (USD 88 in 2016). The pharmacogenomics test price was DKK 1630
(USD 237 in 2016); therefore, the willingness to pay exceeds the cost of the test.
NOTE: Costs were converted from the value of the Danish krone in 2008 to USD 2016.
Summary of Economic Studies
The economic evidence base includes studies of different designs and study populations, each
incorporating different pharmacogenomic tests that were compared with no-test treatment regimens.
Results in some cases suggested cost-effectiveness but lacked consistency overall. Cost analyses were
limited by the available evidence base and the applicability of the evidence selected to create the
various models for economic analyses. There were indications that results may depend at least partly on
test cost and on the effect size of the clinical validity evidence supporting the pharmacogenomic test. In
a survey of non-patients, the utility of testing increases with decreases in the number of changes in
medications or reduced times for dosage adjustments.
WA – Health Technology Assessment October 20, 2016
Pharmacogenomic testing for selected conditions: Draft report Page 55
Practice Guidelines
The search of the core sources and relevant specialty groups identified 12 guidelines that mention
pharmacogenomic testing and published within the past 10 years. The general recommendations
provided by the guidelines are summarized in Table 4 of the Evidence Summary and are presented in
detail in APPENDIX VIa.
Most guidelines made no formal recommendations for use of pharmacogenomic testing. Those that
mentioned pharmacogenomic testing indicate a need for future research to help determine the optimal
choice of pharmacotherapy based on the gene or genes involved in the etiology of treatment
responsiveness. Pharmacogenomic testing may help guide identification of particular patient
populations that will benefit from specific therapeutic options. In addition, some guidelines suggest that
pharmacogenomic testing in combination with therapeutic drug monitoring may be beneficial in certain
circumstances.
The Clinical Pharmacogenetics Implementation Consortium (CPIC) of the National Institutes of Health’s
Pharmacogenomics Research Network and the Pharmacogenomics Knowledge Base is to provide peer-
reviewed, evidence-based, accessible guidelines for gene-drug associations in order to facilitate the
translation of pharmacogenomic knowledge from bench to bedside. CPIC guidelines include dosing
recommendations for tricyclic antidepressants and selective serotonin reuptake inhibitors based on
CYP2D6 and CYP2D6 gene phenotypes (e.g., ultrarapid metabolizer, extensive metabolizer, intermediate
metabolizer, or poor metabolizer). However, these guidelines state that recommendations are based on
clinical validity evidence, most of which relies on drug plasma concentration outcomes and includes case
reports and pharmacokinetic studies of healthy individuals. No evidence is presented linking plasma
concentration to clinical outcomes in these guidelines.
We also searched a number of other guidelines from authoritative organizations that are listed in
APPENDIX VIb. None of these guidelines made any reference to pharmacogenomic testing.
Selected Payer Policies
Centers for Medicare & Medicaid Services (CMS)
The keywords genetic or genomic or antidepressant or antipsychotic were used to search for CMS
National Coverage Determination (NCD) or, in the absence of an NCD, Local Coverage Determination
(LCD) documents on pharmacogenomic testing for the psychiatric conditions of interest or for relevant
genes/gene variants. No CMS NCD for pharmacogenetics or pharmacogenomic testing was identified on
September 23, 2016 at: CMS Advanced Search Database.
An LCD for CYP2C19, CYP2D6, CYP2C9 and VKORC1 genetic testing (L36312), effective July 8, 2016, was issued by Noridian Healthcare Solutions LLC, a Medicare contractor in the state of Washington. The LCD states:
Genetic testing for the CYP2C19 gene is considered investigational for: o Amitriptyline
WA – Health Technology Assessment October 20, 2016
Pharmacogenomic testing for selected conditions: Draft report Page 56
o Selective serotonin reuptake inhibitors.
Genetic testing of the CYP2D6 gene is considered medically necessary to guide medical treatment and/or dosing for individuals for whom initial therapy is planned with Amitriptyline or Nortriptyline for treatment of depressive disorders.
There is insufficient evidence to demonstrate that genetic testing for the CYP2D6 gene improves clinical outcomes. Consequently, genetic testing for the CYP2D6 gene is considered investigational including but not limited to the following medications:
o Antidepressants other than those listed above o Antipsychotics o Codeine o Donepezil o Galantamine
Genetic testing for the CYP2C9 gene is considered investigational as there is currently no proven clinical utility related to any medication (except warfarin).
Genetic testing for the VKORC1 gene is considered investigational for all medications (except warfarin).
An LCD on MolDX: GeneSight Assay for Refractory Depression (L36324), effective October 1, 2015, was issued by Noridian Healthcare Solutions LLC, a Medicare contractor in the state of Washington. It states: “This LCD provides limited coverage for the GeneSight Psychotropic (AssureRx Health Inc.) gene panel. GeneSight testing may only be ordered by licensed psychiatrists or neuropsychiatrists contemplating an alteration in neuropsychiatric medication for patients diagnosed with major depressive disorder (MDD) who are suffering with refractory moderate to severe depression after at least 1 prior neuropsychiatric medication failure.” An LCD on MolDX: HLA-B*15:02 Genetic Testing (L36149), effective April 1, 2016, was issued by Noridian Healthcare Solutions LLC. The policy provides limited coverage for HLA-B*15:02 genotype testing for patients of Asian and Oceanian ancestry when initial treatment with carbamazepine is planned. The following private payer sites were searched using keywords pharmacogenetics or pharmacogenomic
or antidepressant or depression or antipsychotic during the time frame of September 13 through
September 23, 2016.
Aetna
Aetna considers CYP2D6 genotyping experimental and investigational for identifying individuals with Alzheimer disease with different clinical response to donepezil (Aricept) because its clinical value has not been established. Aetna considers genotyping for other cytochrome P450 (CYP450) polymorphisms (diagnostic tests to identify specific genetic variations that may be linked to reduced/enhanced effect or severe side effects of drugs metabolized by the cytochrome P450 system, including opioid analgesics, antipsychotic medications, and SSRIs) experimental and investigational because the clinical value of this type of genetic testing has not been established.
WA – Health Technology Assessment October 20, 2016
Pharmacogenomic testing for selected conditions: Draft report Page 57
Aetna considers genotyping for HLA-B*15:02 medically necessary for persons of Asian ancestry before commencing treatment with carbamazepine (Tegretol). Aetna considers genotyping for methylenetetrahydrofolate reductase (MTHFR) for guiding antidepressant therapy experimental and investigational because its clinical value has not been established. Aetna considers GeneSightRx testing for the management of individuals treated with antidepressant and/or antipsychotic medications experimental and investigational because its clinical value has not been established. Aetna considers the Genecept Assay (Genomind) experimental and investigational for managing psychiatric conditions. See Pharmacogenetic and Pharmacodynamic Testing (Aetna Clinical Policy Bulletin No. 0715).
GroupHealth
The Group Health Cooperative (GHC) policy on genetic screening and testing states CYPP450 - 3A4/3A5 genotyping is not covered per MCG (Milliman Care Guidelines) 20th Edition. See Genetic Screening and Testing (Clinical Review Criteria).
GHC considers genetic testing panels medically necessary when the results are expected to directly
affect treatment, management, surveillance, or reproductive decisions and when all genes or genetic
variants included in the panel have high-quality, evidence-based guidelines established to direct clinical
management based on results.
Testing for individual components of a panel may be medically necessary in some clinical situations.
Separate clinical criteria for these components may apply.
GHC considers the following genetic panels not medically necessary:
• Genecept Assay for Psychotropic Treatment
• GeneSight ADHD
• GeneSight Psychotropic test
• Proove Pharmacogenetic Panels:
Drug Metabolism
Opioid Response • YouScript Personalized Prescribing System
The current scientific evidence is not yet sufficient to establish how test results from all components of
these panels should be used to direct treatment decisions. There is also insufficient evidence to
establish that use of these genetic panels to guide treatment decisions results in improved patient
health outcomes. See Genetic Panels using Next Generation Sequencing (Clinical Review Criteria).
WA – Health Technology Assessment October 20, 2016
Pharmacogenomic testing for selected conditions: Draft report Page 58
The GHC policy on pharmacogenomic/pharmacological testing refers to MCG guidelines for the
following genetic testing coverage criteria:
• Carbamazepine Pharmacogenetics – HLA-B*15:02 Allele
• Psychotropic Medication Pharmacogenetic Testing
• Selective Serotonin Reuptake Inhibitors (SSRIs) – Cytochrome P450 Polymorphism Testing (only
covers CYP2D6 and CYP2C19)
See Pharmacogenomic/Pharmacological Testing for Predicting Response of Chemotherapeutic Agents
(Clinical Review Criteria).
Oregon Health Evidence Review Commission (HERC)
No coverage guidance for pharmacogenomics or pharmacogenetics was identified on the Oregon HERC
website (Oregon HERC Coverage Guidances). However, the website indicates that a new coverage
guidance will be developed to address “Genetic Tests for Selection of Antidepressant Therapy,” based
on HERC and Oregon Health Authority priorities and subject to available resources.
Regence
Regence Group considers the identified genetic panels investigational because the evidence base is
insufficient to demonstrate how comprehensive test results from all genes and/or gene mutations
included in the panels listed below may be used to manage treatment decisions and improve net health
outcomes. The panels listed below are identified in the policy, Evaluating the Utility of Genetic Panels
(Regence Group Medical Policy No. 64):
Empowering Personalized Medicine (EPM) Panel
Genecept Assay for Psychotropic Treatment
GeneSight ADHD, GeneSight Analgesic, GeneSight Psychotropic Genetic Testing
Informed PGx ADHD, Informed PGx Depression, Informed PGx Psychotropic
Mental Health DNA Insight
Proove Drug Metabolism Panel, Opioid Response Panel
STA2R SureGene Test for Antipsychotic and Antidepressant Response
YouScript Personalized Prescribing System
WA – Health Technology Assessment October 20, 2016
Pharmacogenomic testing for selected conditions: Draft report Page 59
References
American Psychiatric Association (APA). Practice guideline for the treatment of patients with major depressive disorder (revision). Am J Psychiatry. 2000 (Reaffirmed 2015);157(4 Suppl):1-45.
American Psychiatric Association (APA). Diagnostic and Statistical Manual of Mental Disorders (5th ed.). Arlington, VA: American Psychiatric Publishing; 2013.
Bakker PR, van Harten PN, van Os J. Antipsychotic-induced tardive dyskinesia and polymorphic variations in comt, drd2, cyp1a2 and mnsod genes: A meta-analysis of pharmacogenetic interactions. Mol Psychiatry. 2008;13(5):544-556.
Barkhof E, Meijer CJ, de Sonneville LM, Linszen DH, de Haan L. Interventions to improve adherence to antipsychotic medication in patients with schizophrenia--a review of the past decade. Eur Psychiatry. 2012;27(1):9-18.
Bauer M, Pfennig A, Severus E, et al. World Federation of Societies of Biological Psychiatry (WFSBP)
guidelines for biological treatment of unipolar depressive disorders, part 1: update 2013 on the acute
and continuation treatment of unipolar depressive disorders. World J Biol Psychiatry. 2013;14(5):334-
385.
Baumann P, Ulrich S, Eckermann G, et al. The AGNP-TDM Expert Group Consensus Guidelines: focus on
therapeutic monitoring of antidepressants. Dialogues Clin Neurosci. 2005;7(3):231-247.
Baxter AJ, Vos T, Scott KM, Ferrari AJ, Whiteford HA. The global burden of anxiety disorders in 2010. Psychol Med. 2014;44(11):2363-2374.
Benkert D, Krause KH, Wasem J, Aidelsburger P. Effectiveness of pharmaceutical therapy of ADHD (attention-deficit/hyperactivity disorder) in adults – health technology assessment. GMS Health Technol Assess. 2010;6:Doc13.
Breitenstein B, Scheuer S, Pfister H, et al. The clinical application of ABCB1 genotyping in antidepressant treatment: a pilot study. CNS Spectr. 2014;19(2):165-175.
Canadian Agency for Drugs and Technologies in Health (CADTH). Optimal Use Recommendations for
Atypical Antipsychotics: Combination and High-Dose Treatment Strategies in Adolescents and Adults
with Schizophrenia. Volume 1, Issue 1C, December 2011. Available at:
WA – Health Technology Assessment October 20, 2016
Pharmacogenomic testing for selected conditions: Draft report Page 60
https://www.cadth.ca/reports?keywords=&result_type%5B%5D=report&sort=field_date%3Avalue-
desc&amount_per_page=10&email=&page=1. Accessed October 13, 2016.
Cargiulo T. Understanding the health impact of alcohol dependence. Am J Health Syst Pharm. 2007;64(5 Suppl 3):S5-S11.
Caudle KE, Dunnenberger HM, Freimuth RR, et al. Standardizing terms for clinical pharmacogenetic test results: consensus terms from the Clinical Pharmacogenetics Implementation Consortium (CPIC). Genet Med. 2016. Epub ahead of print. July 21, 2016. Available at: http://www.nature.com/gim/journal/vaop/ncurrent/full/gim201687a.html. Accessed October 1, 2016.
Centers for Disease Control and Prevention (CDC). Mental Health. Burden of Mental Illness. Updated October 4, 2013a. Available at: https://www.cdc.gov/mentalhealth/basics/burden.htm. Accessed September 13, 2016.
Centers for Disease Control and Prevention (CDC). Alcohol and Public Health: Alcohol-Related Disease Impact (ARDI). 2013b. Available at: https://nccd.cdc.gov/DPH_ARDI/Default/Report.aspx?T=AAM&P=f6d7eda7-036e-4553-9968-9b17ffad620e&R=d7a9b303-48e9-4440-bf47-070a4827e1fd&M=8E1C5233-5640-4EE8-9247-1ECA7DA325B9&F=&D=. Accessed September 15, 2016.
Chou R, Cruciani RA, Fiellin DA, et al. Methadone safety: a clinical practice guideline from the American
Pain Society and College on Problems of Drug Dependence, in collaboration with the Heart Rhythm
Society. J Pain. 2014;15(4):321-337.
Cohen J. Statistical Power Analysis for the Behavioral Sciences. 2nd ed. Hillsdale, NJ: Lawrence Erlbaum Associates; 1988.
Cooper SJ, Reynolds GP, Barnes TR, et al. BAP guidelines on the management of weight gain, metabolic
disturbances and cardiovascular risk associated with psychosis and antipsychotic drug treatment. J
Psychopharmacol. 2016;30(8):717-748.
Culpepper L, Muskin PR, Stahl SM. Major depressive disorder: understanding the significance of residual symptoms and balancing efficacy with tolerability. Am J Med. 2015;128(9 Suppl):S1-S15.
Dawson DA, Grant BF, Stinson FS, Chou PS. Estimating the effect of help-seeking on achieving recovery from alcohol dependence. Addiction. 2006;101(6):824-834.

WA – Health Technology Assessment October 20, 2016
Pharmacogenomic testing for selected conditions: Draft report Page 61
de Matos LP, Santana CV, Souza RP. Meta-analysis of dopamine receptor D1 rs4532 polymorphism and
susceptibility to antipsychotic treatment response. Psychiatry Res. 2015;229(1-2):586-588.
Espadaler J, Tuson M, Lopez-Ibor JM, Lopez-Ibor F, Lopez-Ibor MI. Pharmacogenetic testing for the guidance of psychiatric treatment: a multicenter retrospective analysis. CNS Spectr. 2016;1-10. Epub April 21, 2016. Available at: https://www.cambridge.org/core/journals/cns-spectrums/article/pharmacogenetic-testing-for-the-guidance-of-psychiatric-treatment-a-multicenter-retrospective-analysis/406161554A900C11ACFFB2FD817259E5. Accessed October 1, 2016.
Fagerness J, Fonseca E, Hess GP, et al. Pharmacogenetic-guided psychiatric intervention associated with increased adherence and cost savings. Am J Manag Care. 2014;20(5):e146-e156.
Findling RL, Drury SS, Jensen PS, Rapoport JL; AACAP Committee on Quality Issues. Practice Parameter
for the Use of Atypical Antipsychotic Medications in Children and Adolescents. 2011. American Academy
of Child and Adolescent Psychiatry. Available at:
http://www.aacap.org/App_Themes/AACAP/docs/practice_parameters/Atypical_Antipsychotic_Medica
tions_Web.pdf. Accessed October 13, 2016.
Fleeman N, Dundar Y, Dickson R, et al. Cytochrome P450 testing for prescribing antipsychotics in adults with schizophrenia: systematic review and meta-analyses. Pharmacogenomics J. 2011;11(1):1-14.
Fleeman N, McLeod C, Bagust A, et al. The clinical effectiveness and cost-effectiveness of testing for cytochrome P450 polymorphisms in patients with schizophrenia treated with antipsychotics: a systematic review and economic evaluation. Health Technol Assess. 2010;14(3):1-157, iii.
Gaudiano BA, Weinstock LM, Miller IW. Improving treatment adherence in patients with bipolar disorder and substance abuse: rationale and initial development of a novel psychosocial approach. J Psychiatr Pract. 2011;17(1):5-20.
Gaynes BN, Rush AJ, Trivedi MH, Wisniewski SR, Spencer D, Fava M. The STAR*D study: treating depression in the real world. Cleve Clin J Med. 2008;75(1):57-66.
GENDEP Investigators, MARS Investigators, STAR*D Investigators. Common genetic variation and antidepressant efficacy in major depressive disorder: a meta-analysis of three genome-wide pharmacogenetic studies. Am J Psychiatry. 2013;170(2):207-217.
Gressier F, Porcelli S, Calati R, Serretti A. Pharmacogenetics of clozapine response and induced weight gain: a comprehensive review and meta-analysis. Eur Neuropsychopharmacol. 2016;26(2):163-185.

WA – Health Technology Assessment October 20, 2016
Pharmacogenomic testing for selected conditions: Draft report Page 62
Hall-Flavin DK, Winner JG, Allen JD, et al. Using a pharmacogenomic algorithm to guide the treatment of depression. Transl Psychiatry. 2012;2:e172.
Hall-Flavin DK, Winner JG, Allen JD, et al. Utility of integrated pharmacogenomic testing to support the treatment of major depressive disorder in a psychiatric outpatient setting. Pharmacogenet Genomics. 2013;23(10):535-548.
Handford C, Kahan M, Srivastava A, et al. Buprenorphine/Naloxone for Opioid Dependence: Clinical
Practice Guideline. Canada: Centre for Addiction and Mental Health (CAMH). 2012. Available at:
https://www.camh.ca. Accessed October 13, 2016.
Hasselblad V, Hedges LV. Meta-analysis of screening and diagnostic tests. Psychol Bull. 1995;117(1):167-178.
Herbild L, Andersen SE, Werge T, Rasmussen HB, Jurgens G. Does pharmacogenetic testing for CYP450 2D6 and 2c19 among patients with diagnoses within the schizophrenic spectrum reduce treatment costs? Basic Clin Pharmacol Toxicol. 2013;113(4):266-272.
Herbild L, Bech M, Gyrd-Hansen D. Estimating the danish populations' preferences for pharmacogenetic testing using a discrete choice experiment. The case of treating depression. Value Health. 2009;12(4):560-567.
Hicks JK, Bishop JR, Sangkuhl K, et al. Clinical Pharmacogenetics Implementation Consortium (CPIC)
guideline for CYP2D6 and CYP2C19 genotypes and dosing of selective serotonin reuptake inhibitors. Clin
Pharmacol Ther. 2015;98(2):127-134.
Hicks JK, Swen JJ, Thorn CF, et al. Clinical Pharmacogenetics Implementation Consortium (CPIC) guideline
for CYP2D6 and CYP2C19 genotypes and dosing of tricyclic antidepressants. Clin Pharmacol Ther.
2013;93(5):402-408.
Higashi K, Medic G, Littlewood KJ, Diez T, Granstrom O, De Hert M. Medication adherence in schizophrenia: factors influencing adherence and consequences of nonadherence, a systematic literature review. Ther Adv Psychopharmacol. 2013;3(4):200-218.
Hoffman DL, Dukes EM, Wittchen HU. Human and economic burden of generalized anxiety disorder. Depress Anxiety. 2008;25(1):72-90.
WA – Health Technology Assessment October 20, 2016
Pharmacogenomic testing for selected conditions: Draft report Page 63
Holder HD. Cost benefits of substance abuse treatment: an overview of results from alcohol and drug abuse. J Ment Health Policy Econ. 1998;1(1):23-29.
Hsiao YH, Hui RC, Wu T, et al. Genotype-phenotype association between hla and carbamazepine-induced hypersensitivity reactions: strength and clinical correlations. J Dermatol Sci. 2014;73(2):101-109.
Hwang R, Zai C, Tiwari A, et al. Effect of dopamine D3 receptor gene polymorphisms and clozapine treatment response: exploratory analysis of nine polymorphisms and meta-analysis of the Ser9Gly variant. Pharmacogenomics J. 2010;10(3):200-218.
Jamison KR. Suicide and bipolar disorder. J Clin Psychiatry. 2000;61(Suppl 9):47-51.
Kessler RC, Adler L, Barkley R, et al. The prevalence and correlates of adult adhd in the united states: results from the national comorbidity survey replication. Am J Psychiatry. 2006;163(4):716-723.
Kessler RC, Aguilar-Gaxiola S, Alonso J, et al. The global burden of mental disorders: an update from the WHO World Mental Health (WMH) surveys. Epidemiol Psichiatr Soc. 2009;18(1):23-33.
Kessler RC, Berglund P, Demler O, Jin R, Merikangas KR, Walters EE. Lifetime prevalence and age-of-onset distributions of DSM-IV disorders in the national comorbidity survey replication. Arch Gen Psychiatry. 2005;62(6):593-602.
Kleber HD, Weiss RD, Anton RF Jr, et al.; American Psychiatic Association Work Group on Substance Use Disorders. Treatment of patients with substance use disorders, second edition. Am J Psychiatry. 2006;163(8 Suppl):5-82.
Koob GF. The neurobiology of addiction: a neuroadaptational view relevant for diagnosis. Addiction. 2006;101 Suppl 1:23-30.
Laxman KE, Lovibond KS, Hassan MK. Impact of bipolar disorder in employed populations. Am J Manag Care. 2008;14(11):757-764.
Lehman AF, Lieberman JA, Dixon LB, et al. Practice guideline for the treatment of patients with schizophrenia, second edition. Am J Psychiatry. 2004;161(2 Suppl):1-56.
Lingford-Hughes AR, Welch S, Peters L, Nutt DJ; British Association for Psychopharmacology (BAP),
Expert Reviewers Group. BAP updated guidelines: evidence-based guidelines for the pharmacological
WA – Health Technology Assessment October 20, 2016
Pharmacogenomic testing for selected conditions: Draft report Page 64
management of substance abuse, harmful use, addiction and comorbidity: recommendations from BAP.
J Psychopharmacol. 2012;26(7):899-952.
Lis S, Baer N, Stein-en-Nosse C, Gallhofer B, Sammer G, Kirsch P. Objective measurement of motor activity during cognitive performance in adults with attention-deficit/hyperactivity disorder. Acta Psychiatr Scand. 2010;122(4):285-294.
Martin MA, Kroetz DL. Abacavir pharmacogenetics--from initial reports to standard of care. Pharmacotherapy. 2013;33(7):765-775.
Masson SC, Tejani AM. Minimum clinically important differences identified for commonly used depression rating scales. J Clin Epidemiol. 2013;66(7):805-807.
Mayo Foundation for Medical Education and Research (MFMER). Attention-deficit/hyperactivity disorder (ADHD) in children. March 11, 2016. Available at: http://www.mayoclinic.org/diseases-conditions/adhd/home/ovc-20196177. Accessed September 24, 2016.
McClellan J, Stock S; American Academy of Child and Adolescent Psychiatry (AACAP) Committee on
Quality Issues (CQI). Practice parameter for the assessment and treatment of children and adolescents
with schizophrenia. J Am Acad Child Adolesc Psychiatry. 2013;52(9):976-990.
McDermott B, Baigent M, Chanen A, et al. beyondblue Expert Working Committee (2010) Clinical
practice guidelines: Depression in adolescents and young adults. Melbourne, Australia: beyondblue;
2010. Available at: http://resources.beyondblue.org.au/prism/file?token=BL/0890. Accessed October
13, 2016.
Ministry of Health (MOH), Singapore. Anxiety Disorders. MOH Clinical Practice Guidelines on Anxiety
Disorders. Anxiety Disorders – Full Guidelines. April 2015. Available at:
https://www.moh.gov.sg/content/dam/moh_web/HPP/Doctors/cpg_medical/current/2015/anxiety_dis
disord/cpg_Anxiety%20Disorders%20%20Apr%202015%20-%20Full%20Guidelines.pdf. Accessed
October 13, 2016.
Moller HJ, Bitter I, Bobes J, Fountoulakis K, Hoschl C, Kasper S. Position statement of the European Psychiatric Association (EPA) on the value of antidepressants in the treatment of unipolar depression. Eur Psychiatry. 2012;27(2):114-128.
Muller DJ, Kekin I, Kao ACC, Brandl EJ. Towards the implementation of CYP2D6 and CYP2C19 genotypes in clinical practice: update and report from a pharmacogenetic service clinic. Int Rev Psychiatry. 2013;25(5):554-571.
WA – Health Technology Assessment October 20, 2016
Pharmacogenomic testing for selected conditions: Draft report Page 65
Murray CJ, Atkinson C, Bhalla K, et al. The state of US health, 1990-2010: burden of diseases, injuries, and risk factors. JAMA. 2013;310(6):591-608.
National Institute for Health and Care Excellence (NICE). Attention deficit hyperactivity disorder:
diagnosis and management. London, UK: National Institute for Health and Care Excellence; 2008. NICE
Clinical Guideline No. 72. Available at: https://www.nice.org.uk/guidance/cg72. Accessed October 13,
2016.
National Institute for Health and Care Excellence (NICE). Depression in adults: Recognition and management. London, UK: National Institute for Health and Care Excellence; 2009. NICE Clinical Guideline No. 90. Available at: https://www.nice.org.uk/guidance/cg90. Accessed September 16, 2016.
National Institute for Health and Care Excellence (NICE). Generalised anxiety disorder and panic disorder
in adults: management. London, UK: National Institute for Health and Care Excellence; 2011a. NICE
Clinical Guideline No. 113. Available at: https://www.nice.org.uk/guidance/cg113. Accessed October 13,
2016.
National Institute for Health and Care Excellence (NICE). The NICE guideline on diagnosis, assessment,
and management of harmful drinking and alcohol dependence. London, UK: National Institute for Health
and Care Excellence; 2011b. NICE Clinical Guideline No. 115. Available at:
https://www.nice.org.uk/guidance/cg115. Accessed October 13, 2016.
National Institute for Health and Care Excellence (NICE). Psychosis and schizophrenia in children and
young people: recognition and management. London, UK: National Institute for Health and Care
Excellence; 2013a. NICE Clinical Guideline No. 155. Available at:
https://www.nice.org.uk/guidance/cg155. Accessed October 13, 2016.
National Institute for Health and Care Excellence (NICE). Social anxiety disorder: recognition, assessment
and treatment. London, UK: National Institute for Health and Care Excellence; 2013b. NICE Clinical
Guideline No. 159. Available at: https://www.nice.org.uk/guidance/cg159. Accessed October 13, 2016.
National Institute for Health and Care Excellence (NICE). Psychosis and schizophrenia in adults:
prevention and management. London, UK: National Institute for Health and Care Excellence; 2014a.
NICE Clinical Guideline No. 178. Available at: https://www.nice.org.uk/guidance/cg178. Accessed
October 13, 2016.
WA – Health Technology Assessment October 20, 2016
Pharmacogenomic testing for selected conditions: Draft report Page 66
National Institute for Health and Care Excellence (NICE). Bipolar disorder: assessment and management.
London, UK: National Institute for Health and Care Excellence; 2014b. NICE Clinical Guideline No. 185.
Available at: https://www.nice.org.uk/guidance/cg185. Accessed October 13, 2016.
National Institute of Mental Health (NIMH). Annual Total Direct and Indirect Costs of Serious Mental Illness (2002). 2002. Available at: http://www.nimh.nih.gov/health/statistics/cost/index.shtml. Accessed September 27, 2016.
National Institute of Mental Health (NIMH). Use of Mental Health Services and Treatment Among Adults. 2008. Available at: http://www.nimh.nih.gov/health/statistics/prevalence/use-of-mental-health-services-and-treatment-among-adults.shtml. Accessed September 27, 2016.
National Institute of Mental Health (NIMH). Anxiety Disorders. Revised March 2016a. Available at: http://www.nimh.nih.gov/health/topics/anxiety-disorders/index.shtml#part_145338. Accessed September 23, 2016.
National Institute of Mental Health (NIMH). Bipolar Disorder. Revised April 2016b. Available at: https://www.nimh.nih.gov/health/topics/bipolar-disorder/index.shtml. Accessed Accessed September 13, 2016.
National Institute on Alcohol Abuse and Alcoholism (NIAAA). Alcohol Facts & Statistics. Revised June 2016. Available at: https://www.niaaa.nih.gov/alcohol-health/overview-alcohol-consumption/alcohol-facts-and-statistics. Accessed September 15, 2016.
National Quality Measures Clearinghouse (NQMC). Depression: percent of clinically significant depression patients with a 50 percent or greater reduction in Patient Health Questionnaire (PHQ). Measure Summary No. 001620. January 2005. Agency for Healthcare Research and Quality [website]. Available at: https://www.qualitymeasures.ahrq.gov/summaries/summary/27604. Accessed September 24, 2016.
Olgiati P, Bajo E, Bigelli M, De Ronchi D, Serretti A. Should pharmacogenetics be incorporated in major depression treatment? Economic evaluation in high- and middle-income european countries. Prog Neuropsychopharmacol Biol Psychiatry. 2012;36(1):147-154.
Oslin DW, Leong SH, Lynch KG, et al. Naltrexone vs placebo for the treatment of alcohol dependence: a randomized clinical trial. JAMA Psychiatry. 2015;72(5):430-437.
Perlis RH, Patrick A, Smoller JW, Wang PS. When is pharmacogenetic testing for antidepressant response ready for the clinic? A cost-effectiveness analysis based on data from the star*d study. Neuropsychopharmacology. 2009;34(10):2227-2236.
WA – Health Technology Assessment October 20, 2016
Pharmacogenomic testing for selected conditions: Draft report Page 67
Pliszka S; AACAP Work Group on Quality Issues. Practice parameter for the assessment and treatment of children and adolescents with attention-deficit/hyperactivity disorder. J Am Acad Child Adolesc Psychiatry. 2007;46(7):894-921.
Pouget JG, Goncalves VF, Nurmi EL, et al. Investigation of TSPO variants in schizophrenia and antipsychotic treatment outcomes. Pharmacogenomics. 2015;16(1):5-22.
Pouget JG, Shams TA, Tiwari AK, Muller DJ. Pharmacogenetics and outcome with antipsychotic drugs. Dialogues Clin Neurosci. 2014;16(4):555-566.
Rehm J. The risks associated with alcohol use and alcoholism. Alcohol Res Health. 2011;34(2):135-143.
Risselada AJ, Mulder H, Heerdink ER, Egberts TC. Pharmacogenetic testing to predict antipsychotic-induced weight gain: a systematic review. Pharmacogenomics. 2011;12(8):1213-1227.
Rudd RA, Aleshire N, Zibbell JE, Gladden RM. Increases in drug and opioid overdose deaths--United States, 2000-2014. MMWR Morb Mortal Wkly Rep. 2016;64(50-51):1378-1382.
Rundell JR, Harmandayan M, Staab JP. Pharmacogenomic testing and outcome among depressed patients in a tertiary care outpatient psychiatric consultation practice. Transl Psychiatry. 2011;1:e6.
Saag M, Balu R, Phillips E, et al. High sensitivity of Human Leukocyte Antigen-B*5701 as a marker for immunologically confirmed abacavir hypersensitivity in white and black patients. Clin Infect Dis. 2008;46(7):1111-1118.
Safren SA, Sprich S, Mimiaga MJ, et al. Cognitive behavioral therapy vs relaxation with educational support for medication-treated adults with adhd and persistent symptoms: a randomized controlled trial. JAMA. 2010;304(8):875-880.
Salloum NC, McCarthy MJ, Leckband SG, Kelsoe JR. Towards the clinical implementation of pharmacogenetics in bipolar disorder. BMC Med. 2014;12:90.
Scottish Intercollegiate Guidelines Network (SIGN). Management of schizophrenia. Edinburgh, UK:
Scottish Intercollegiate Guidelines Network; March 2013. SIGN Guideline No. 131. Available at:
http://www.sign.ac.uk. Accessed October 13, 2016.
Shen J, Ge W, Zhang J, Zhu HJ, Fang Y. Leptin -2548g/a gene polymorphism in association with antipsychotic-induced weight gain: a meta-analysis study. Psychiatr Danub. 2014;26(2):145-151.

WA – Health Technology Assessment October 20, 2016
Pharmacogenomic testing for selected conditions: Draft report Page 68
Singh AB. Improved antidepressant remission in major depression via a pharmacokinetic pathway polygene pharmacogenetic report. Clin Psychopharmacol Neurosci. 2015;13(2):150-156.
Stein MB, Goin MK, Pollack MH, et al.; Work Group on Panic Disorder. American Psychiatric Association Practice Guidelines. Practice Guideline for the Treatment of Patients With Panic Disorder. 2nd edition. 2010. psychiatryonline {website]. Available at: http://psychiatryonline.org/guidelines. Accessed October 13, 2016.
Substance Abuse and Mental Health Services Administration (SAMHSA). Results from the 2014 National Survey on Drug Use and Health: Detailed Tables. Table 2.41B – Alcohol Use in Lifetime, Past Year, and Past Month among Persons Aged 18 or Older, by Demographic Characteristics: Percentages, 2013 and 2014. 2014. Available at: http://www.samhsa.gov/data/sites/default/files/NSDUH-DetTabs2014/NSDUH-DetTabs2014.htm#tab2-41b. Accessed September 15, 2016.
Substance Abuse and Mental Health Services Administration (SAMHSA). Behavioral Health Trends in the United States: Results from the 2014 National Survey on Drug Use and Health (NSDUH). Publication No. SMA 15-4927. Reviewed September 11, 2015a. Available at: http://store.samhsa.gov/product/Behavioral-Health-Trends-in-the-United-States/SMA15-4927. Accessed September 12, 2016.
Substance Abuse and Mental Health Services Administration (SAMHSA). Mental and Substance Use Disorders >> Mental Disorders. Updated October 27, 2015b. Available at: http://www.samhsa.gov/disorders/mental. Accessed September 12, 2016.
Substance Abuse and Mental Health Services Administration (SAMHSA). Treatments for Mental Disorders >> Treatment for Schizophrenia. Updated October 27, 2015c. Available at: http://www.samhsa.gov/treatment/mental-disorders#schizophrenia. Accessed September 12, 2016.
Tonk EC, Gurwitz D, Maitland-van der Zee AH, Janssens AC. Assessment of pharmacogenetic tests: presenting measures of clinical validity and potential population impact in association studies. Pharmacogenomics J. 2016. Epub ahead of print. May 10, 2016. Available at: http://www.nature.com/tpj/journal/vaop/ncurrent/full/tpj201634a.html. Accessed October 1, 2016.
Trangle M, Gursky J, Haight R, et al. Depression, Adult in Primary Care. Updated March 2016. Institute for Clinical Systems Improvement [website]. Available at: https://www.icsi.org/guidelines__more/. Accessed October 13, 2016. Trivedi MH, Rush AJ, Wisniewski SR, et al. Evaluation of outcomes with citalopram for depression using measurement-based care in STAR*D: implications for clinical practice. Am J Psychiatry. 2006;163(1):28-40.
WA – Health Technology Assessment October 20, 2016
Pharmacogenomic testing for selected conditions: Draft report Page 69
Venkatesh A. It's all in the genes! [news article]. August 19, 2016. BioSpectrum. Available at: http://www.biospectrumasia.com/biospectrum/news/224177/it-s-genes. Accessed October 1, 2016.
Veterans Affairs, Department of (VA); The Management of Bipolar Disorder Working Group. VA/DoD
Clinical Practice Guidelines >> Mental Health >> Bipolar Disorder (BD) in Adults >> Guideline Links >>
Bipolar Disorder – Full Guideline. VA/DoD Clinical Practice Guideline for Management of Bipolar Disorder
in Adults. May 2010. Available at: http://www.healthquality.va.gov/. Accessed October 13, 2016.
Veterans Affairs, Department of (VA); The VA/DoD Management of Substance Use Disorder Working
Group. VA/DoD Clinical Practice Guidelines >> Mental Health >> Substance Use Disorder (SUD) >>
Related Guidelines >>Substance Use Disorder (SUD). VA/DoD Clinical Practice Guideline for the
Management of Substance Use Disorders. Version 3.0 – 2015. 2015. Available at:
http://www.healthquality.va.gov/. Accessed October 13, 2016.
Veterans Affairs, Department of (VA); The Management of Major Depressive Disorder Working Group.
VA/DoD Clinical Practice Guidelines >> Mental Health >> Major Depressive Disorder (MDD) >> Guideline
Links. MDD Full Text (2016). VA/DoD Clinical Practice Guideline for the Management of Major Depressive
Disorder. Version 3.0 – 2016. 2016. Available at: http://www.healthquality.va.gov/. Accessed October
13, 2016.
Wang B, Canestaro WJ, Choudhry NK. Clinical evidence supporting pharmacogenomic biomarker testing provided in US Food and Drug Administration drug labels. JAMA Intern Med. 2014;174(12):1938-1944.
Wang PS, Lane M, Olfson M, Pincus HA, Wells KB, Kessler RC. Twelve-month use of mental health services in the United States: results from the National Comorbidity Survey Replication. Arch Gen Psychiatry. 2005;62(6):629-640.
Winner JG, Carhart JM, Altar CA, Allen JD, Dechairo BM. A prospective, randomized, double-blind study assessing the clinical impact of integrated pharmacogenomic testing for major depressive disorder. Discov Med. 2013;16(89):219-227.
Wittchen HU. Generalized anxiety disorder: prevalence, burden, and cost to society. Depress Anxiety. 2002;16(4):162-171.
Wolraich M, Brown L, Brown RT, et al.; Subcommittee on Attention-Deficit/Hyperactivity Disorder;
Steering Committee on Quality Improvement and Management. ADHD: clinical practice guideline for the
diagnosis, evaluation, and treatment of attention-deficit/hyperactivity disorder in children and
adolescents. Pediatrics. 2011;128(5):1007-1022.
WA – Health Technology Assessment October 20, 2016
Pharmacogenomic testing for selected conditions: Draft report Page 70
Zhang JP, Lencz T, Malhotra AK. D2 receptor genetic variation and clinical response to antipsychotic drug treatment: a meta-analysis. Am J Psychiatry. 2010;167(7):763-772.
Zhang JP, Lencz T, Zhang RX, et al. Pharmacogenetic associations of antipsychotic drug-related weight gain: a systematic review and meta-analysis. Schizophr Bull. 2016;23:23.

WA – Health Technology Assessment October 20, 2016
Pharmacogenomic testing for selected conditions: Draft report Page 71
APPENDIXES
APPENDIX I. Meta-analyses of Clinical Validity – Schizophrenia
Systematic Reviews with Meta-analyses for Clinical Validity – Schizophrenia
Key: GWAS: genome-wide association studies; MA, meta-analyses; rs, reference SNP cluster—denotes base position within the human genome DNA sequence; SNP, single nucleotide polymorphism
Indication Medication Type
# MA Gene (Polymorphism) Information Evaluated
Schizophrenia Antipsychotics
8 CYP450 (2D6, 2C19, 1A2, 17, 3A4, 3A5), DRD2 (rs1799732), DRD3 (rs6280), DRD4, DRD3 (Ser9Gly), LEP (2548G/A);
HTR2A (rs6313, rs6311, rs6314), HTR2C (rs6318), HTR3A (rs1062613), TNFa (rs1800629), 5-HTTLPR, GNB3, ADRA1A,
ADRA2A, ADRB3, H2, DRD1, COMT, MnSOD, ANKK1, BDNF, CNR1, FTO, HTR6, INSIG2, LEPR, MC4R, MDR1,
PPARG, SNAP25, GWAS SNPs
Meta-analyses for Clinical Validity – Schizophrenia
The most significant results are recorded from each meta-analysis for each gene-outcome association; however, not every result is statistically
significant.
Key: AIMS, abnormal involuntary movement scale; Assn, association; BMI, body mass index; CLZ, clozapine; Del, deletion; Ins, insertion; MA, meta-analysis; mut, mutation; NR, not reported; NS, not significant; OR, odds ratio; pts, patients; rs, reference SNP cluster—denotes base position within the human genome DNA sequence; SAS score, Simpson-Angus Scale (for measuring drug-related extrapyramidal side effects); WMD, weighted mean difference; wt, wild type
Gene1-Outcome Assn Author, Yr Comparison
# Studies in
MA # Pts in MA Effect Size (95% CI); I
2 P Value
Genotype Favored by
Result
CYP2D6 genotype and
tardive dyskinesia
Fleeman2 et al.,
2010 and 2011
wt/mut vs wt/wt 4
282 OR (fixed) 2.08
(1.21, 3.57)
P=0.008 wt/wt
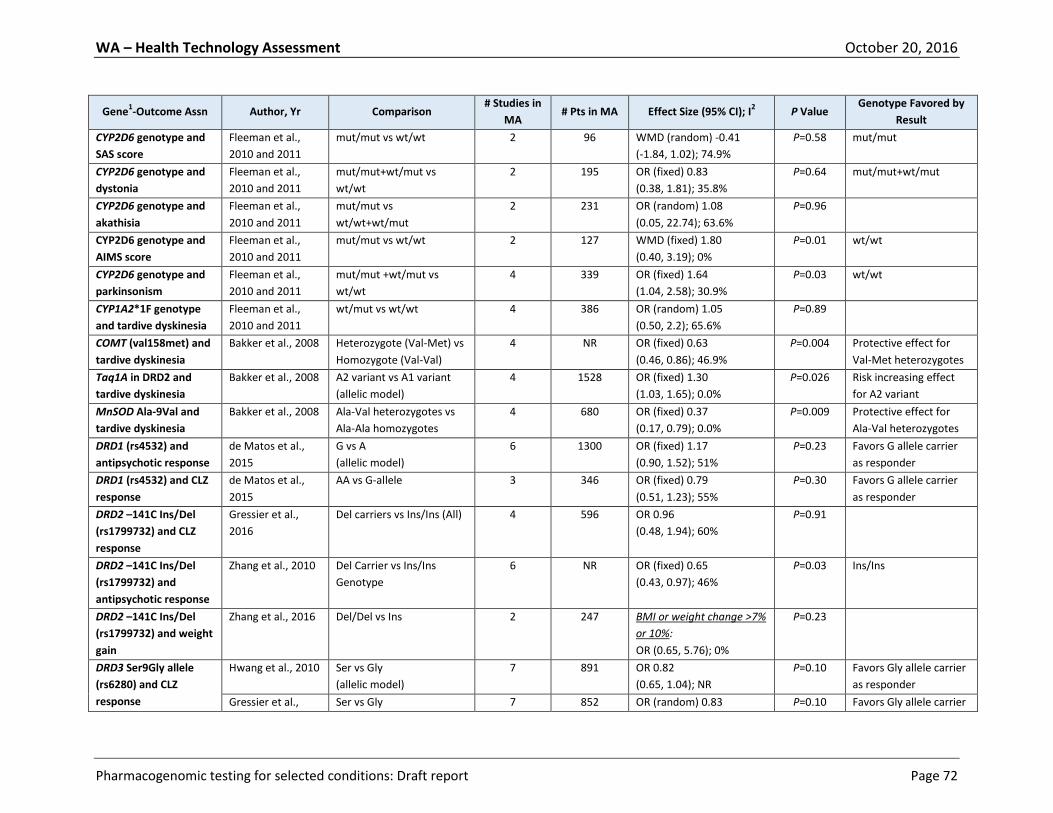
WA – Health Technology Assessment October 20, 2016
Pharmacogenomic testing for selected conditions: Draft report Page 72
Gene1-Outcome Assn Author, Yr Comparison
# Studies in
MA # Pts in MA Effect Size (95% CI); I
2 P Value
Genotype Favored by
Result
CYP2D6 genotype and
SAS score
Fleeman et al.,
2010 and 2011
mut/mut vs wt/wt 2 96 WMD (random) -0.41
(-1.84, 1.02); 74.9%
P=0.58 mut/mut
CYP2D6 genotype and
dystonia
Fleeman et al.,
2010 and 2011
mut/mut+wt/mut vs
wt/wt
2 195 OR (fixed) 0.83
(0.38, 1.81); 35.8%
P=0.64 mut/mut+wt/mut
CYP2D6 genotype and
akathisia
Fleeman et al.,
2010 and 2011
mut/mut vs
wt/wt+wt/mut
2 231 OR (random) 1.08
(0.05, 22.74); 63.6%
P=0.96
CYP2D6 genotype and
AIMS score
Fleeman et al.,
2010 and 2011
mut/mut vs wt/wt
2 127 WMD (fixed) 1.80
(0.40, 3.19); 0%
P=0.01 wt/wt
CYP2D6 genotype and
parkinsonism
Fleeman et al.,
2010 and 2011
mut/mut +wt/mut vs
wt/wt
4 339 OR (fixed) 1.64
(1.04, 2.58); 30.9%
P=0.03 wt/wt
CYP1A2*1F genotype
and tardive dyskinesia
Fleeman et al.,
2010 and 2011
wt/mut vs wt/wt 4 386 OR (random) 1.05
(0.50, 2.2); 65.6%
P=0.89
COMT (val158met) and
tardive dyskinesia
Bakker et al., 2008 Heterozygote (Val-Met) vs
Homozygote (Val-Val)
4 NR OR (fixed) 0.63
(0.46, 0.86); 46.9%
P=0.004 Protective effect for
Val-Met heterozygotes
Taq1A in DRD2 and
tardive dyskinesia
Bakker et al., 2008 A2 variant vs A1 variant
(allelic model)
4 1528 OR (fixed) 1.30
(1.03, 1.65); 0.0%
P=0.026 Risk increasing effect
for A2 variant
MnSOD Ala-9Val and
tardive dyskinesia
Bakker et al., 2008 Ala-Val heterozygotes vs
Ala-Ala homozygotes
4 680 OR (fixed) 0.37
(0.17, 0.79); 0.0%
P=0.009 Protective effect for
Ala-Val heterozygotes
DRD1 (rs4532) and
antipsychotic response
de Matos et al.,
2015
G vs A
(allelic model)
6 1300 OR (fixed) 1.17
(0.90, 1.52); 51%
P=0.23 Favors G allele carrier
as responder
DRD1 (rs4532) and CLZ
response
de Matos et al.,
2015
AA vs G-allele 3 346 OR (fixed) 0.79
(0.51, 1.23); 55%
P=0.30 Favors G allele carrier
as responder
DRD2 –141C Ins/Del
(rs1799732) and CLZ
response
Gressier et al.,
2016
Del carriers vs Ins/Ins (All) 4 596 OR 0.96
(0.48, 1.94); 60%
P=0.91
DRD2 –141C Ins/Del
(rs1799732) and
antipsychotic response
Zhang et al., 2010 Del Carrier vs Ins/Ins
Genotype
6 NR OR (fixed) 0.65
(0.43, 0.97); 46%
P=0.03 Ins/Ins
DRD2 –141C Ins/Del
(rs1799732) and weight
gain
Zhang et al., 2016 Del/Del vs Ins 2 247 BMI or weight change >7%
or 10%:
OR (0.65, 5.76); 0%
P=0.23
DRD3 Ser9Gly allele
(rs6280) and CLZ
response
Hwang et al., 2010
Ser vs Gly
(allelic model)
7 891 OR 0.82
(0.65, 1.04); NR
P=0.10 Favors Gly allele carrier
as responder
Gressier et al., Ser vs Gly 7 852 OR (random) 0.83 P=0.10 Favors Gly allele carrier
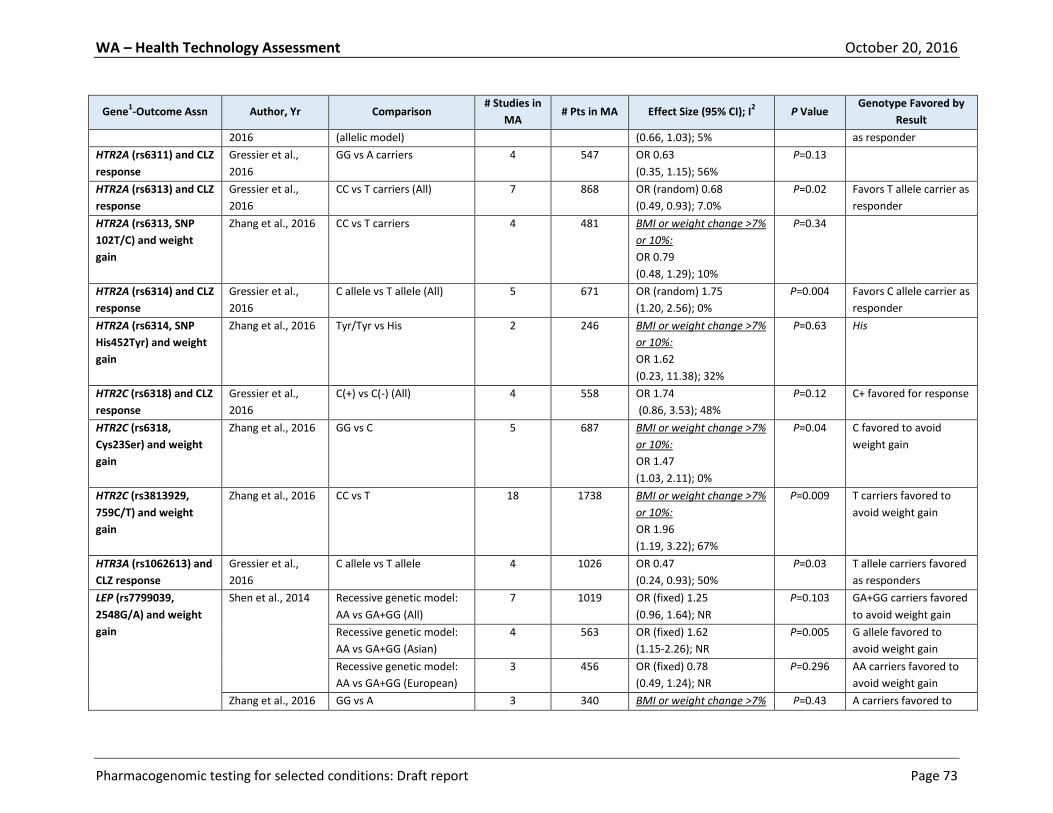
WA – Health Technology Assessment October 20, 2016
Pharmacogenomic testing for selected conditions: Draft report Page 73
Gene1-Outcome Assn Author, Yr Comparison
# Studies in
MA # Pts in MA Effect Size (95% CI); I
2 P Value
Genotype Favored by
Result
2016 (allelic model) (0.66, 1.03); 5% as responder
HTR2A (rs6311) and CLZ
response
Gressier et al.,
2016
GG vs A carriers 4 547 OR 0.63
(0.35, 1.15); 56%
P=0.13
HTR2A (rs6313) and CLZ
response
Gressier et al.,
2016
CC vs T carriers (All) 7 868 OR (random) 0.68
(0.49, 0.93); 7.0%
P=0.02 Favors T allele carrier as
responder
HTR2A (rs6313, SNP
102T/C) and weight
gain
Zhang et al., 2016 CC vs T carriers 4 481 BMI or weight change >7%
or 10%:
OR 0.79
(0.48, 1.29); 10%
P=0.34
HTR2A (rs6314) and CLZ
response
Gressier et al.,
2016
C allele vs T allele (All) 5 671 OR (random) 1.75
(1.20, 2.56); 0%
P=0.004 Favors C allele carrier as
responder
HTR2A (rs6314, SNP
His452Tyr) and weight
gain
Zhang et al., 2016 Tyr/Tyr vs His 2 246 BMI or weight change >7%
or 10%:
OR 1.62
(0.23, 11.38); 32%
P=0.63 His
HTR2C (rs6318) and CLZ
response
Gressier et al.,
2016
C(+) vs C(-) (All) 4 558 OR 1.74
(0.86, 3.53); 48%
P=0.12 C+ favored for response
HTR2C (rs6318,
Cys23Ser) and weight
gain
Zhang et al., 2016 GG vs C 5 687 BMI or weight change >7%
or 10%:
OR 1.47
(1.03, 2.11); 0%
P=0.04 C favored to avoid
weight gain
HTR2C (rs3813929,
759C/T) and weight
gain
Zhang et al., 2016 CC vs T 18 1738 BMI or weight change >7%
or 10%:
OR 1.96
(1.19, 3.22); 67%
P=0.009 T carriers favored to
avoid weight gain
HTR3A (rs1062613) and
CLZ response
Gressier et al.,
2016
C allele vs T allele 4 1026 OR 0.47
(0.24, 0.93); 50%
P=0.03 T allele carriers favored
as responders
LEP (rs7799039,
2548G/A) and weight
gain
Shen et al., 2014 Recessive genetic model:
AA vs GA+GG (All)
7 1019 OR (fixed) 1.25
(0.96, 1.64); NR
P=0.103 GA+GG carriers favored
to avoid weight gain
Recessive genetic model:
AA vs GA+GG (Asian)
4 563 OR (fixed) 1.62
(1.15-2.26); NR
P=0.005 G allele favored to
avoid weight gain
Recessive genetic model:
AA vs GA+GG (European)
3 456 OR (fixed) 0.78
(0.49, 1.24); NR
P=0.296 AA carriers favored to
avoid weight gain
Zhang et al., 2016 GG vs A 3 340 BMI or weight change >7% P=0.43 A carriers favored to
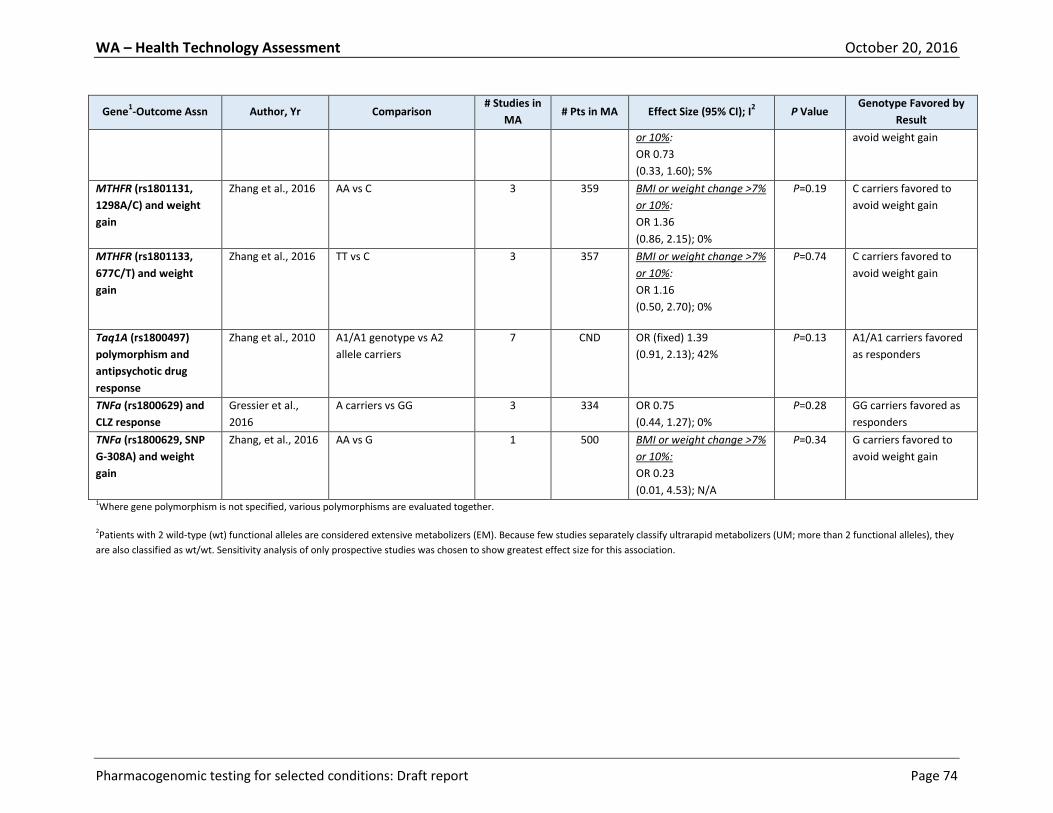
WA – Health Technology Assessment October 20, 2016
Pharmacogenomic testing for selected conditions: Draft report Page 74
Gene1-Outcome Assn Author, Yr Comparison
# Studies in
MA # Pts in MA Effect Size (95% CI); I
2 P Value
Genotype Favored by
Result
or 10%:
OR 0.73
(0.33, 1.60); 5%
avoid weight gain
MTHFR (rs1801131,
1298A/C) and weight
gain
Zhang et al., 2016 AA vs C 3 359 BMI or weight change >7%
or 10%:
OR 1.36
(0.86, 2.15); 0%
P=0.19 C carriers favored to
avoid weight gain
MTHFR (rs1801133,
677C/T) and weight
gain
Zhang et al., 2016 TT vs C 3 357 BMI or weight change >7%
or 10%:
OR 1.16
(0.50, 2.70); 0%
P=0.74 C carriers favored to
avoid weight gain
Taq1A (rs1800497)
polymorphism and
antipsychotic drug
response
Zhang et al., 2010 A1/A1 genotype vs A2
allele carriers
7 CND OR (fixed) 1.39
(0.91, 2.13); 42%
P=0.13 A1/A1 carriers favored
as responders
TNFa (rs1800629) and
CLZ response
Gressier et al.,
2016
A carriers vs GG 3 334 OR 0.75
(0.44, 1.27); 0%
P=0.28 GG carriers favored as
responders
TNFa (rs1800629, SNP
G-308A) and weight
gain
Zhang, et al., 2016 AA vs G 1 500 BMI or weight change >7%
or 10%:
OR 0.23
(0.01, 4.53); N/A
P=0.34 G carriers favored to
avoid weight gain
1Where gene polymorphism is not specified, various polymorphisms are evaluated together.
2Patients with 2 wild-type (wt) functional alleles are considered extensive metabolizers (EM). Because few studies separately classify ultrarapid metabolizers (UM; more than 2 functional alleles), they
are also classified as wt/wt. Sensitivity analysis of only prospective studies was chosen to show greatest effect size for this association.

WA – Health Technology Assessment October 20, 2016
Pharmacogenomic testing for selected conditions: Draft report Page 75
APPENDIX II. Search Strategy
INITIAL SEARCH, SYSTEMATIC REVIEWS AND PRACTICE GUIDELINES (conducted August 16, 2016)
Initially, evidence for this report was obtained by searching for systematic reviews, meta-analyses,
practice guidelines, and economic evaluations that had been published in the past 10 years. Searches
were conducted in the following databases using the terms rhinosinusitis or sinusitis: Agency for
Healthcare Research and Quality (AHRQ), Blue Cross Blue Shield Center for Clinical Effectiveness (CCE)
Assessments, Canadian Agency for Drugs and Technology in Health (CADTH), Centre for Reviews and
Dissemination (CRD) (York University), Hayes Knowledge Center, Institute for Clinical Systems
Improvement (ICSI), National Institute for Health Research Health Technology Assessment (NIHR HTA)
Programme (UK), National Guidelines Clearinghouse (NGC), National Institute for Health and Care
Excellence (NICE), and Veterans Health Administration/Department of Defense Clinical Practice
Guidelines. (NOTE: The CRD search strategy includes a search for Cochrane Reviews.)
The websites for the American Psychiatric Association, The American Academy of Child and Adolescent
Psychiatry, the American College of Neuropsychopharmacology (no guidelines), and the World
Psychiatric Association were also searched.
Additional systematic reviews were sought from a search of the PubMed database using filters for
Practice Guidelines, Guidelines, Meta-Analyses, and Systematic Reviews, according to this search:
Search Term Hits Notes 1. (((((((pharmacogenetics[MeSH Terms]) OR precision medicine[MeSH
Terms]) OR pharmacogen*)) 11886 Filters: Publication date from
2000/01/01 to 2016/08/15
2. (((((((((("Anxiety Disorders"[Mesh]) OR "Bipolar and Related Disorders"[Mesh]) OR "Schizophrenia Spectrum and Other Psychotic Disorders"[Mesh]) OR "Mood Disorders"[Mesh]) OR "Attention Deficit Disorder with Hyperactivity"[Mesh]) OR "Alcohol-Related Disorders"[Mesh]) OR "Opioid-Related Disorders"[Mesh]) OR “Depression"[Mesh]))
92054 Filters: Publication date from 2000/01/01 to 2016/08/15
3. 1 and 2 102 Filters: Publication date from 2000/01/01 to 2016/08/15; Meta-Analysis; Systematic Reviews; Guideline; Practice Guideline
SEARCH FOR PRIMARY CLINICAL STUDIES AND ECONOMIC EVALUATIONS
Since no systematic reviews were identified that addressed the Key Questions for this report, the main
literature search was designed to identify all primary studies of pharmacogenomic testing that
addressed the relevant indications and assessed clinical utility.
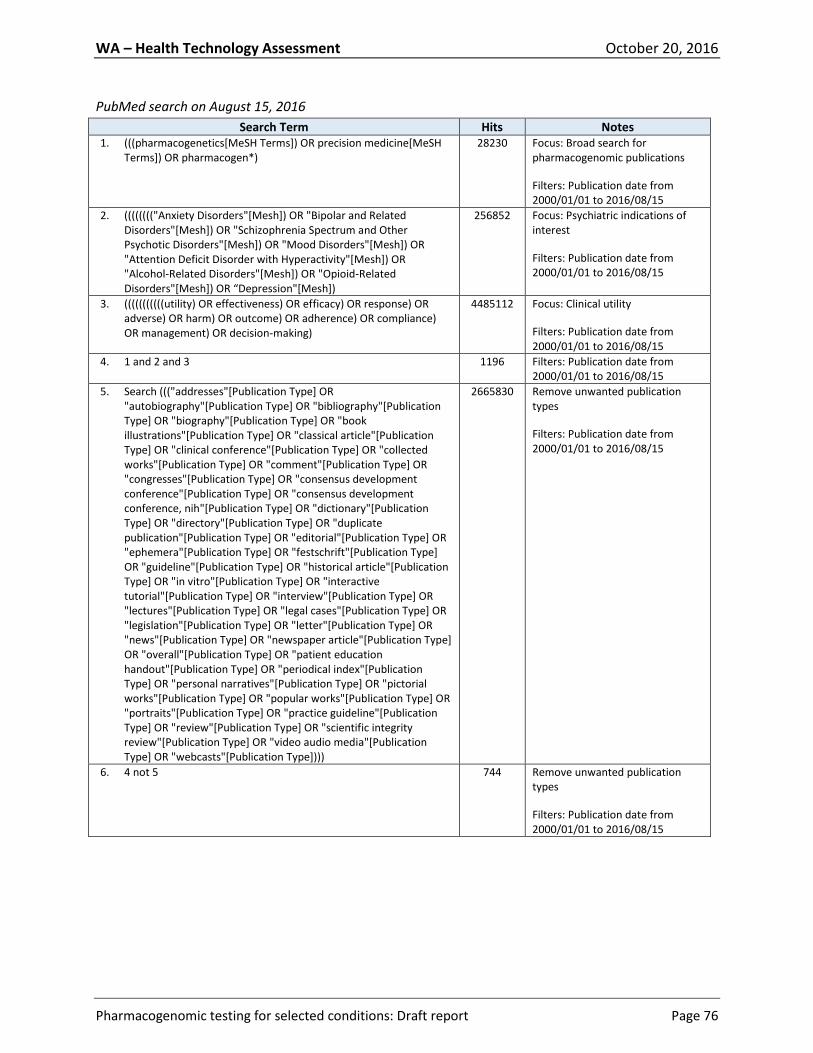
WA – Health Technology Assessment October 20, 2016
Pharmacogenomic testing for selected conditions: Draft report Page 76
PubMed search on August 15, 2016
Search Term Hits Notes 1. (((pharmacogenetics[MeSH Terms]) OR precision medicine[MeSH
Terms]) OR pharmacogen*)
28230 Focus: Broad search for pharmacogenomic publications
Filters: Publication date from 2000/01/01 to 2016/08/15
2. (((((((("Anxiety Disorders"[Mesh]) OR "Bipolar and Related Disorders"[Mesh]) OR "Schizophrenia Spectrum and Other Psychotic Disorders"[Mesh]) OR "Mood Disorders"[Mesh]) OR "Attention Deficit Disorder with Hyperactivity"[Mesh]) OR "Alcohol-Related Disorders"[Mesh]) OR "Opioid-Related Disorders"[Mesh]) OR “Depression"[Mesh])
256852 Focus: Psychiatric indications of interest
Filters: Publication date from 2000/01/01 to 2016/08/15
3. (((((((((((utility) OR effectiveness) OR efficacy) OR response) OR adverse) OR harm) OR outcome) OR adherence) OR compliance) OR management) OR decision-making)
4485112 Focus: Clinical utility
Filters: Publication date from 2000/01/01 to 2016/08/15
4. 1 and 2 and 3 1196 Filters: Publication date from 2000/01/01 to 2016/08/15
5. Search ((("addresses"[Publication Type] OR "autobiography"[Publication Type] OR "bibliography"[Publication Type] OR "biography"[Publication Type] OR "book illustrations"[Publication Type] OR "classical article"[Publication Type] OR "clinical conference"[Publication Type] OR "collected works"[Publication Type] OR "comment"[Publication Type] OR "congresses"[Publication Type] OR "consensus development conference"[Publication Type] OR "consensus development conference, nih"[Publication Type] OR "dictionary"[Publication Type] OR "directory"[Publication Type] OR "duplicate publication"[Publication Type] OR "editorial"[Publication Type] OR "ephemera"[Publication Type] OR "festschrift"[Publication Type] OR "guideline"[Publication Type] OR "historical article"[Publication Type] OR "in vitro"[Publication Type] OR "interactive tutorial"[Publication Type] OR "interview"[Publication Type] OR "lectures"[Publication Type] OR "legal cases"[Publication Type] OR "legislation"[Publication Type] OR "letter"[Publication Type] OR "news"[Publication Type] OR "newspaper article"[Publication Type] OR "overall"[Publication Type] OR "patient education handout"[Publication Type] OR "periodical index"[Publication Type] OR "personal narratives"[Publication Type] OR "pictorial works"[Publication Type] OR "popular works"[Publication Type] OR "portraits"[Publication Type] OR "practice guideline"[Publication Type] OR "review"[Publication Type] OR "scientific integrity review"[Publication Type] OR "video audio media"[Publication Type] OR "webcasts"[Publication Type])))
2665830 Remove unwanted publication types
Filters: Publication date from 2000/01/01 to 2016/08/15
6. 4 not 5 744 Remove unwanted publication types
Filters: Publication date from 2000/01/01 to 2016/08/15
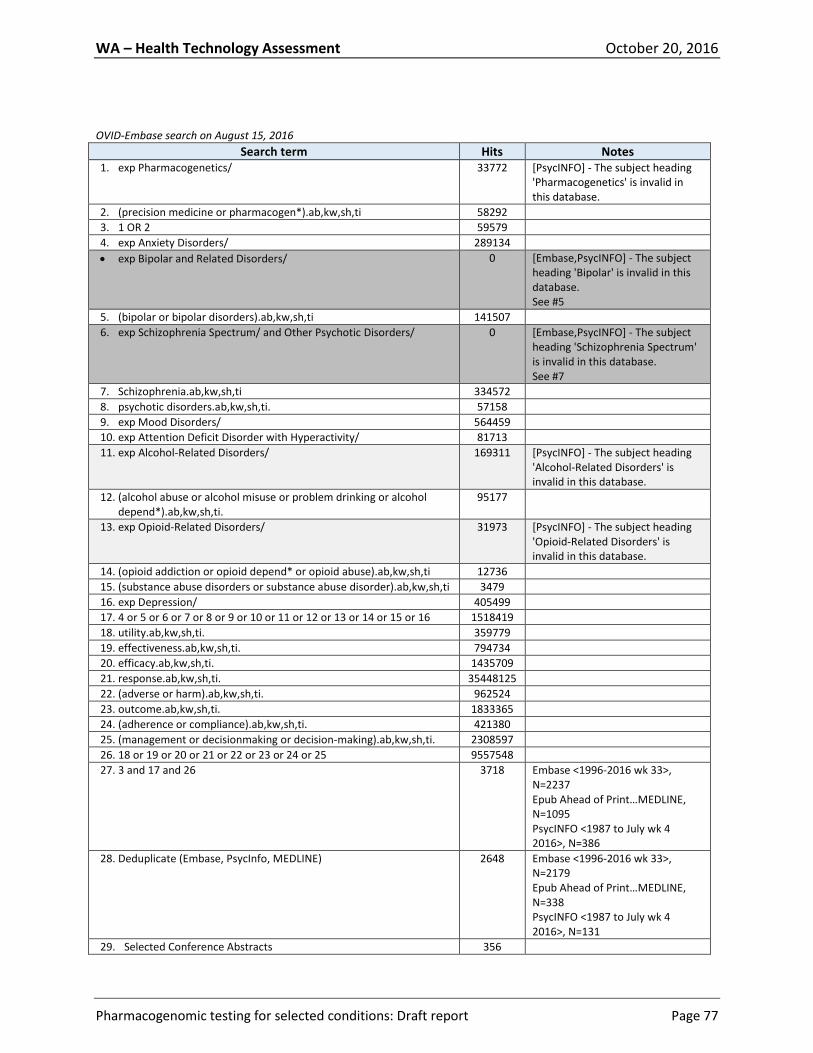
WA – Health Technology Assessment October 20, 2016
Pharmacogenomic testing for selected conditions: Draft report Page 77
OVID-Embase search on August 15, 2016
Search term Hits Notes 1. exp Pharmacogenetics/
33772 [PsycINFO] - The subject heading 'Pharmacogenetics' is invalid in this database.
2. (precision medicine or pharmacogen*).ab,kw,sh,ti 58292
3. 1 OR 2 59579
4. exp Anxiety Disorders/ 289134
exp Bipolar and Related Disorders/ 0 [Embase,PsycINFO] - The subject heading 'Bipolar' is invalid in this database. See #5
5. (bipolar or bipolar disorders).ab,kw,sh,ti 141507
6. exp Schizophrenia Spectrum/ and Other Psychotic Disorders/ 0 [Embase,PsycINFO] - The subject heading 'Schizophrenia Spectrum' is invalid in this database. See #7
7. Schizophrenia.ab,kw,sh,ti 334572
8. psychotic disorders.ab,kw,sh,ti. 57158
9. exp Mood Disorders/ 564459
10. exp Attention Deficit Disorder with Hyperactivity/ 81713
11. exp Alcohol-Related Disorders/ 169311 [PsycINFO] - The subject heading 'Alcohol-Related Disorders' is invalid in this database.
12. (alcohol abuse or alcohol misuse or problem drinking or alcohol depend*).ab,kw,sh,ti.
95177
13. exp Opioid-Related Disorders/ 31973 [PsycINFO] - The subject heading 'Opioid-Related Disorders' is invalid in this database.
14. (opioid addiction or opioid depend* or opioid abuse).ab,kw,sh,ti 12736
15. (substance abuse disorders or substance abuse disorder).ab,kw,sh,ti 3479
16. exp Depression/ 405499
17. 4 or 5 or 6 or 7 or 8 or 9 or 10 or 11 or 12 or 13 or 14 or 15 or 16 1518419
18. utility.ab,kw,sh,ti. 359779
19. effectiveness.ab,kw,sh,ti. 794734
20. efficacy.ab,kw,sh,ti. 1435709
21. response.ab,kw,sh,ti. 35448125
22. (adverse or harm).ab,kw,sh,ti. 962524
23. outcome.ab,kw,sh,ti. 1833365
24. (adherence or compliance).ab,kw,sh,ti. 421380
25. (management or decisionmaking or decision-making).ab,kw,sh,ti. 2308597
26. 18 or 19 or 20 or 21 or 22 or 23 or 24 or 25 9557548
27. 3 and 17 and 26 3718 Embase <1996-2016 wk 33>, N=2237 Epub Ahead of Print…MEDLINE, N=1095 PsycINFO <1987 to July wk 4 2016>, N=386
28. Deduplicate (Embase, PsycInfo, MEDLINE) 2648 Embase <1996-2016 wk 33>, N=2179 Epub Ahead of Print…MEDLINE, N=338 PsycINFO <1987 to July wk 4 2016>, N=131
29. Selected Conference Abstracts 356
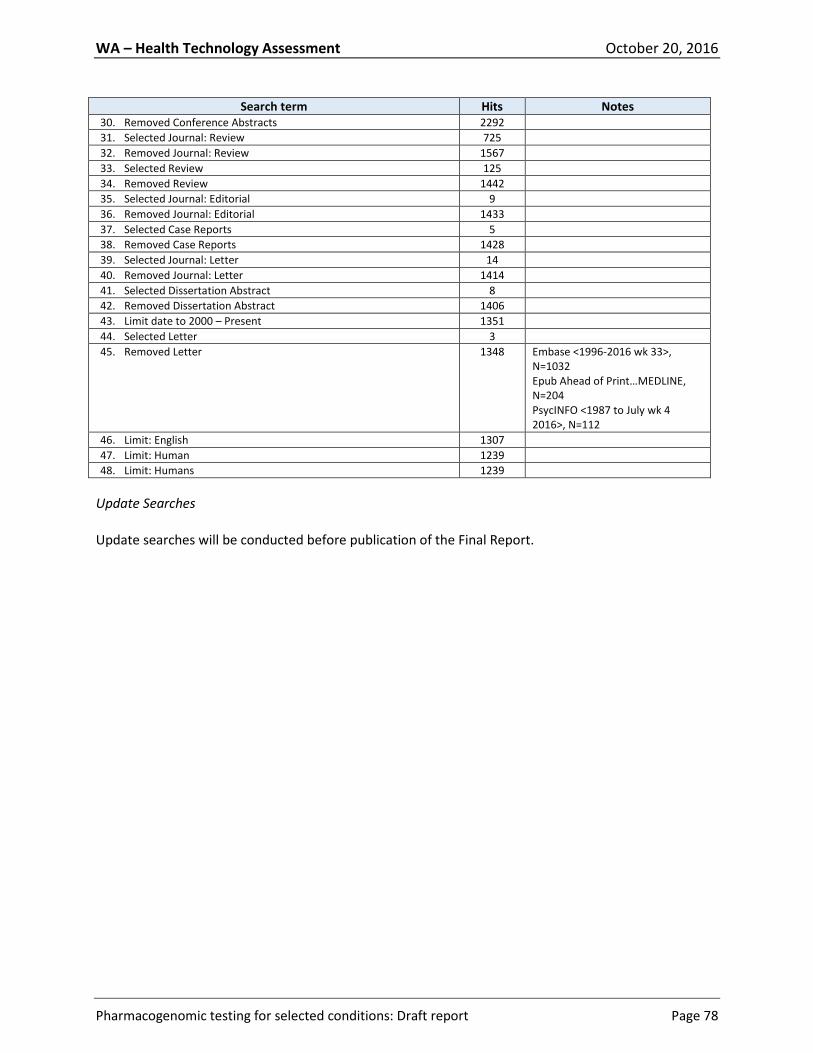
WA – Health Technology Assessment October 20, 2016
Pharmacogenomic testing for selected conditions: Draft report Page 78
Search term Hits Notes 30. Removed Conference Abstracts 2292
31. Selected Journal: Review 725
32. Removed Journal: Review 1567
33. Selected Review 125
34. Removed Review 1442
35. Selected Journal: Editorial 9
36. Removed Journal: Editorial 1433
37. Selected Case Reports 5
38. Removed Case Reports 1428
39. Selected Journal: Letter 14
40. Removed Journal: Letter 1414
41. Selected Dissertation Abstract 8
42. Removed Dissertation Abstract 1406
43. Limit date to 2000 – Present 1351
44. Selected Letter 3
45. Removed Letter 1348 Embase <1996-2016 wk 33>, N=1032 Epub Ahead of Print…MEDLINE, N=204 PsycINFO <1987 to July wk 4 2016>, N=112
46. Limit: English 1307
47. Limit: Human 1239
48. Limit: Humans 1239
Update Searches
Update searches will be conducted before publication of the Final Report.

WA – Health Technology Assessment October 20, 2016
Pharmacogenomic testing for selected conditions: Draft report Page 79
APPENDIX III. Overview of Evidence Quality Assessment Methods
Clinical Studies
Tools used include internally developed Quality Checklists for evaluating the quality (internal validity) of
different types of studies, a checklist for judging the adequacy of systematic reviews used instead of de
novo analysis, and Hayes Evidence-Grading Guides for evaluating bodies of evidence for different types
of technologies. Hayes methodology is in alignment with the GRADE (Grading of Recommendations,
Assessment, Development, and Evaluation) system, which was developed by the GRADE Working Group,
an international collaborative body.
Step 1 Individual study appraisal: a. Initial rating according to study design Good: Randomized Controlled Trials Fair: Nonrandomized Trial (controlled, parallel-group, quasi-randomized) Poor: Observational Comparative Studies (prospective or retrospective trials involving historical controls, pretest-posttest control trial [patients legitimately serve as their own controls], case-control, registry/chart/database analysis involving a comparison group) Very Poor: Descriptive Uncontrolled Studies (case reports, case series, cross-sectional surveys [individual-level data], correlation studies [group-level data]) b. Consider the methodological rigor of study execution according to items in a proprietary Quality Checklist c. Repeat for each study
Step 2 Evaluation of each body of evidence by outcome, key question, or application: a. Initial quality designation according to best study design in a body of evidence b. Downgrade/upgrade Downgrade factors: Study weaknesses (Quality Checklists), small quantity of evidence, lack of applicability, inconsistency of results, publication bias Possible upgrade factors: Strong association, dose-response effect, bias favoring no effect c. Assign final rating: High-Moderate-Low-Very Low d. Repeat for each outcome/question/application
Step 3 Evaluation of overall evidence: a. Rank outcomes by clinical importance b. Consider overall quality of evidence for each critical outcome c. Assign overall rating based on lowest-quality body: High-Moderate-Low-Very Low
Step 4 Evidence-based conclusion: Overall quality of evidence + Balance of benefits and harms
Practice Guidelines (checklist taken from AGREE Tool and approach to scoring used in this
report)
Rank each item on a scale of 1-7.
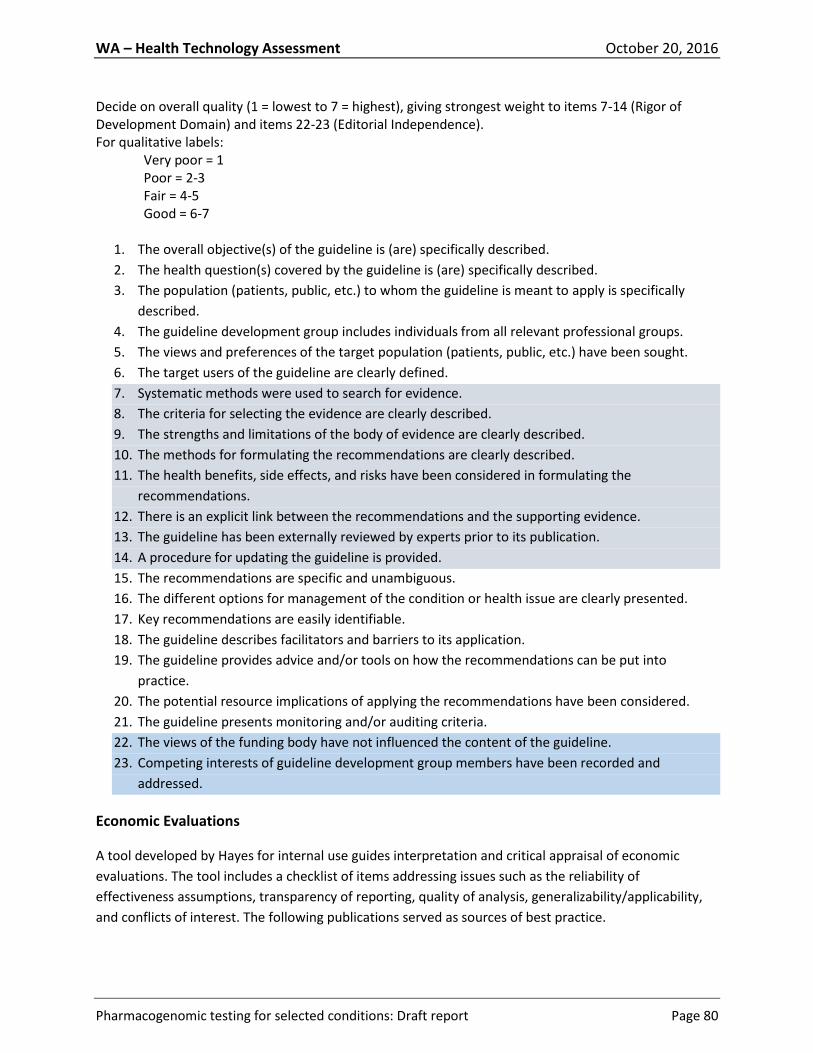
WA – Health Technology Assessment October 20, 2016
Pharmacogenomic testing for selected conditions: Draft report Page 80
Decide on overall quality (1 = lowest to 7 = highest), giving strongest weight to items 7-14 (Rigor of Development Domain) and items 22-23 (Editorial Independence). For qualitative labels:
Very poor = 1 Poor = 2-3 Fair = 4-5 Good = 6-7
1. The overall objective(s) of the guideline is (are) specifically described.
2. The health question(s) covered by the guideline is (are) specifically described.
3. The population (patients, public, etc.) to whom the guideline is meant to apply is specifically
described.
4. The guideline development group includes individuals from all relevant professional groups.
5. The views and preferences of the target population (patients, public, etc.) have been sought.
6. The target users of the guideline are clearly defined.
7. Systematic methods were used to search for evidence.
8. The criteria for selecting the evidence are clearly described.
9. The strengths and limitations of the body of evidence are clearly described.
10. The methods for formulating the recommendations are clearly described.
11. The health benefits, side effects, and risks have been considered in formulating the
recommendations.
12. There is an explicit link between the recommendations and the supporting evidence.
13. The guideline has been externally reviewed by experts prior to its publication.
14. A procedure for updating the guideline is provided.
15. The recommendations are specific and unambiguous.
16. The different options for management of the condition or health issue are clearly presented.
17. Key recommendations are easily identifiable.
18. The guideline describes facilitators and barriers to its application.
19. The guideline provides advice and/or tools on how the recommendations can be put into
practice.
20. The potential resource implications of applying the recommendations have been considered.
21. The guideline presents monitoring and/or auditing criteria.
22. The views of the funding body have not influenced the content of the guideline.
23. Competing interests of guideline development group members have been recorded and
addressed.
Economic Evaluations
A tool developed by Hayes for internal use guides interpretation and critical appraisal of economic
evaluations. The tool includes a checklist of items addressing issues such as the reliability of
effectiveness assumptions, transparency of reporting, quality of analysis, generalizability/applicability,
and conflicts of interest. The following publications served as sources of best practice.
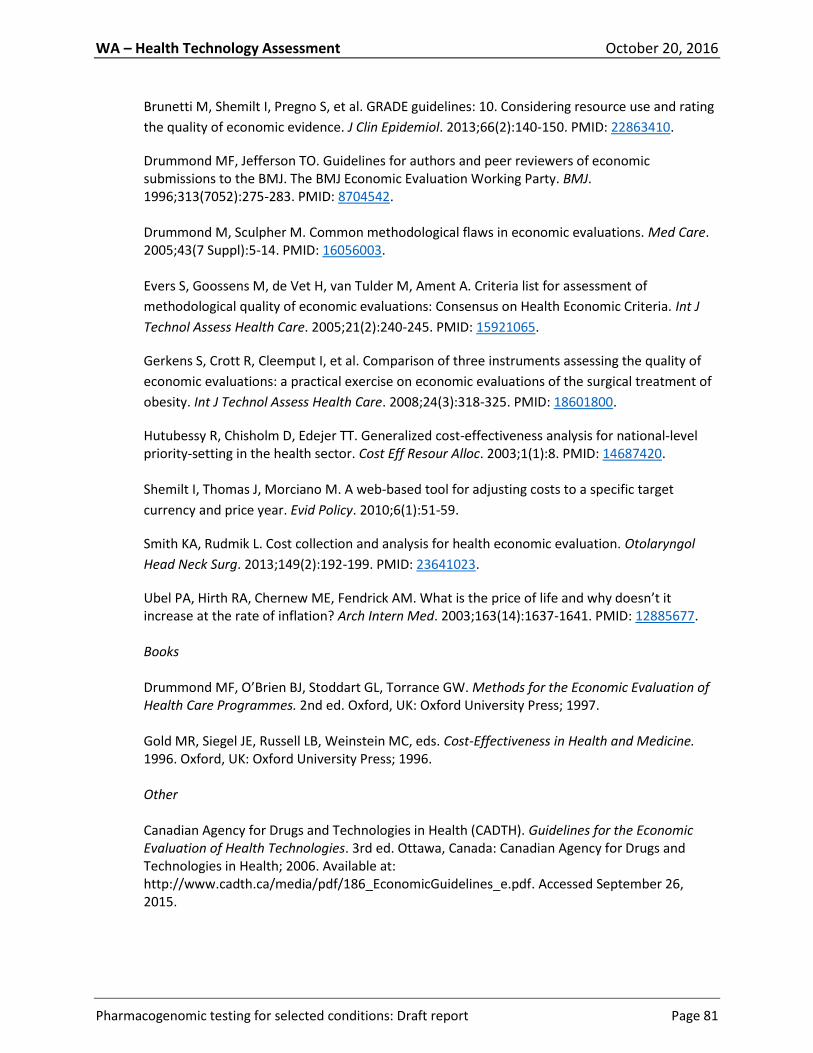
WA – Health Technology Assessment October 20, 2016
Pharmacogenomic testing for selected conditions: Draft report Page 81
Brunetti M, Shemilt I, Pregno S, et al. GRADE guidelines: 10. Considering resource use and rating
the quality of economic evidence. J Clin Epidemiol. 2013;66(2):140-150. PMID: 22863410.
Drummond MF, Jefferson TO. Guidelines for authors and peer reviewers of economic submissions to the BMJ. The BMJ Economic Evaluation Working Party. BMJ. 1996;313(7052):275-283. PMID: 8704542. Drummond M, Sculpher M. Common methodological flaws in economic evaluations. Med Care. 2005;43(7 Suppl):5-14. PMID: 16056003. Evers S, Goossens M, de Vet H, van Tulder M, Ament A. Criteria list for assessment of
methodological quality of economic evaluations: Consensus on Health Economic Criteria. Int J
Technol Assess Health Care. 2005;21(2):240-245. PMID: 15921065.
Gerkens S, Crott R, Cleemput I, et al. Comparison of three instruments assessing the quality of
economic evaluations: a practical exercise on economic evaluations of the surgical treatment of
obesity. Int J Technol Assess Health Care. 2008;24(3):318-325. PMID: 18601800.
Hutubessy R, Chisholm D, Edejer TT. Generalized cost-effectiveness analysis for national-level priority-setting in the health sector. Cost Eff Resour Alloc. 2003;1(1):8. PMID: 14687420. Shemilt I, Thomas J, Morciano M. A web-based tool for adjusting costs to a specific target
currency and price year. Evid Policy. 2010;6(1):51-59.
Smith KA, Rudmik L. Cost collection and analysis for health economic evaluation. Otolaryngol
Head Neck Surg. 2013;149(2):192-199. PMID: 23641023.
Ubel PA, Hirth RA, Chernew ME, Fendrick AM. What is the price of life and why doesn’t it increase at the rate of inflation? Arch Intern Med. 2003;163(14):1637-1641. PMID: 12885677. Books Drummond MF, O’Brien BJ, Stoddart GL, Torrance GW. Methods for the Economic Evaluation of Health Care Programmes. 2nd ed. Oxford, UK: Oxford University Press; 1997. Gold MR, Siegel JE, Russell LB, Weinstein MC, eds. Cost-Effectiveness in Health and Medicine. 1996. Oxford, UK: Oxford University Press; 1996. Other Canadian Agency for Drugs and Technologies in Health (CADTH). Guidelines for the Economic Evaluation of Health Technologies. 3rd ed. Ottawa, Canada: Canadian Agency for Drugs and Technologies in Health; 2006. Available at: http://www.cadth.ca/media/pdf/186_EconomicGuidelines_e.pdf. Accessed September 26, 2015.
WA – Health Technology Assessment October 20, 2016
Pharmacogenomic testing for selected conditions: Draft report Page 82
APPENDIX IV. Excluded Studies
The following 19 key studies were excluded during full-text review.
Noncomparative studies
Altar CA, Carhart JM, Allen JD, Hall-Flavin DK, Dechairo BM, Winner JG. Clinical validity: combinatorial pharmacogenomics predicts antidepressant responses and healthcare utilizations better than single gene phenotypes. Pharmacogenomics J. 2015;15(5):443-451.
Mas S, Gasso P, Alvarez S, Parellada E, Bernardo M, Lafuente A. Intuitive pharmacogenetics: spontaneous risperidone dosage is related to CYP2D6, CYP3A5 and ABCB1 genotypes. Pharmacogenomics J. 2012;12(3):255-259.
Mihaljevic-Peles A, Bozina N, Sagud M. Pharmacogenetics in modern psychiatry. Psychiatria Danubina. 2007;19(3):231-233.
Murphy MP, Beaman ME, Clark LS, et al. Prospective CYP2D6 genotyping as an exclusion criterion for enrollment of a phase III clinical trial. Pharmacogenetics. 2000;10(7):583-590.
Stamm TJ, Rampp C, Wiethoff K, et al. The FKBP5 polymorphism rs1360780 influences the effect of an algorithm-based antidepressant treatment and is associated with remission in patients with major depression. J Psychopharmacol. 2016;30(1):40-47.
ter Laak MA, Temmink AH, Koeken A, van 't Veer NE, van Hattum PR, Cobbaert CM. Recognition of impaired atomoxetine metabolism because of low CYP2D6 activity. Pediatr Neurol. 2010;43(3):159-162.
Not studies of pharmacogenomic testing
Chialda L, Griffith LS, Heinig A, Pahl A. Prospective use of CYP pharmacogenetics and medication analysis to facilitate improved therapy - a pilot study. Per Med. 2008;5(1):37-45.
[Medications adjusted for other reasons in addition to pharmacogenomic test results]
Mihajlovic G, Djukic-Dejanovic S, Jovanovic-Mihajlovic N, et al. Comparison of safety between individualized and empiric dose regimen of amitriptyline in the treatment of major depressive episode. Psychiatria Danubina. 2010;22(2):354-357.
Mrazek DA, Biernacka JM, McAlpine DE, et al. Treatment outcomes of depression: the pharmacogenomic research network antidepressant medication pharmacogenomic study. J Clin Psychopharmacol. 2014a;34(3):313-317.
Limited to assessment of physician ordering practices
Dunbar L, Butler R, Wheeler A, Pulford J, Miles W, Sheridan J. Clinician experiences of employing the AmpliChip® CYP450 test in routine psychiatric practice. Journal Psychopharmacol. 2012;26(3):390-397.
Rundell JR, Staab JP, Shinozaki G, et al. Pharmacogenomic testing in a tertiary care outpatient psychosomatic medicine practice. Psychosomatics. 2011;52(2):141-146.
WA – Health Technology Assessment October 20, 2016
Pharmacogenomic testing for selected conditions: Draft report Page 83
Review
Muller DJ, Kekin I, Kao AC, Brandl EJ. Towards the implementation of CYP2D6 and CYP2C19 genotypes in clinical practice: update and report from a pharmacogenetic service clinic. Int Rev Psychiatry. 2013;25(5):554-571.
Case report
Paulzen M, Tauber SC, Kirner-Veselinovic A, Grunder G. Cytochrome P450 2D6 polymorphism and its impact on decision-making in psychopharmacotherapy: finding the right way in an ultrarapid metabolizing patient. J Clin Psychiatry. 2011;72(11):1465-1467.
Erratum
Mrazek DA, Biernacka JM, McAlpine DE, et al. "Treatment outcomes of depression: the pharmacogenomic research network antidepressant medication pharmacogenomic study": Erratum in J Clin Psychopharmacol. 2014b;34(5):558.
Economic studies narrowly focused on a single drug
Perlis RH, Ganz DA, Avorn J, et al. Pharmacogenetic testing in the clinical management of schizophrenia: a decision-analytic model. J Clin Psychopharmacol. 2005;25(5):427-434.
Rejon-Parrilla JC, Nuijten M, Redekop WK, Gaultney JG. Economic evaluation of the use of a pharmacogenetic diagnostic test in schizophrenia. Health Policy Technol. 2014;3(4):314-324.
Economic study focused on non-psychiatric indications
Arnaout R, Buck TP, Roulette P, Sukhatme VP. Predicting the cost and pace of pharmacogenomic advances: an evidence-based study. Clin Chem. 2013;59(4):649-657.
Economic study concerned with impact of physician prescribing concentration
Hodgkin D, Merrick EL, Hiatt D. The relationship of antidepressant prescribing concentration to treatment duration and cost. J Ment Health Policy Econ. 2012;15(1):3-11.
Economic study; superseded by Olgiati 2012 (included study)
Serretti A, Olgiati P, Bajo E, Bigelli M, De Ronchi D. A model to incorporate genetic testing (5-HTTLPR) in pharmacological treatment of major depressive disorders. World J Biol Psychiatry. 2011;12(7):501-515.

WA – Health Technology Assessment October 20, 2016
Pharmacogenomic testing for selected conditions: Draft report Page 84
APPENDIX V. Evidence Tables
APPENDIX Va. Studies Assessing the Impact of Pharmacogenomic Testing on Clinical Decision-Making (KQ1a) and Patient Outcomes (KQ1b)
Key: ADHD, attention deficit/hyperactivity disorder; CGI-S, Clinical Global Impression of Severity; Ctl, control arm; CYP450, cytochrome P450; Exp, experimental arm; HAM-D, Hamilton Depression Rating Scale (21 items unless otherwise specified); MAOI, monoamine oxidase inhibitor; MDD, major depressive disorder; NS, not statistically significant; OR, odds ratio; PGx, pharmacogenomic; PHQ-9, Patient Health Questionnaire (9 items); pt(s), patient(s); PTSD, posttraumatic stress disorder; QIDS-C16, Quick Inventory of Depressive Symptomatology-Clinician Rated (16 items); RCT, randomized controlled trial; SNRI, serotonin-norepinephrine reuptake inhibitor; SSRI, selective serotonin reuptake inhibitor; TCA, tricyclic antidepressant; tx, treatment
Authors/Study Design/ Protocol
Patients/Setting/Treatment Main Findings Quality/Comments
Depressive Disorders
Winner et al. (2013) Prospective double-blind RCT Index test: GeneSight assay (genotypes CYP2D6, CYP2C19, CYP1A2, SLC6A4, HTR2A-T102C; includes proprietary interpretive report and recommendations in which 26 psychiatric medications were placed in the advisory categories of “use as directed,” “use with caution,” and “use with caution and with more frequent monitoring” based on known pharmacological profile and specific pt genotype) results provided immediately Reference standard: Same genotyping but results not
Exp: 26 pts with a diagnosis of MDD or depressive disorder not otherwise specified (HAM-D17 >14), randomized to pharmacogenomic genotyping Ctl: 25 similarly selected pts, randomized to tx as usual General exclusions: Diagnosis of bipolar disorder, schizophrenia, or schizoaffective disorders Setting: Outpatient psychiatric practice Pharmacologic tx: Not described Previous tx: Allowed Maximum follow-up: 10 weeks
Clinical Decision-making: Exp vs Ctl: 100% of baseline medications that genotyping indicated should be used with caution and with more frequent monitoring were changed in the Exp group; only 50% of similarly classified medications were changed or dose adjusted in the Ctl group. Pt Outcomes: Exp vs Ctl: 36% of genotyped pts were responders (50% reduction in HAM-D17 at 10 weeks) vs 20.8% treated as usual: OR=2.14; 95% CI, 0.59-7.69; P=NS 20% of genotyped pts achieved remission (HAM-D17 <7) at 10 weeks vs 8.3% treated as usual: OR=2.75; 95% CI, 0.48-15.8; P=NS Improvements in HAM-D17, PHQ-9, and QIDS-C16 scores favored the genotyped arm at 10 weeks but were not statistically significant.
Fair Very small study, lacking in power to discriminate outcomes between tx arms.
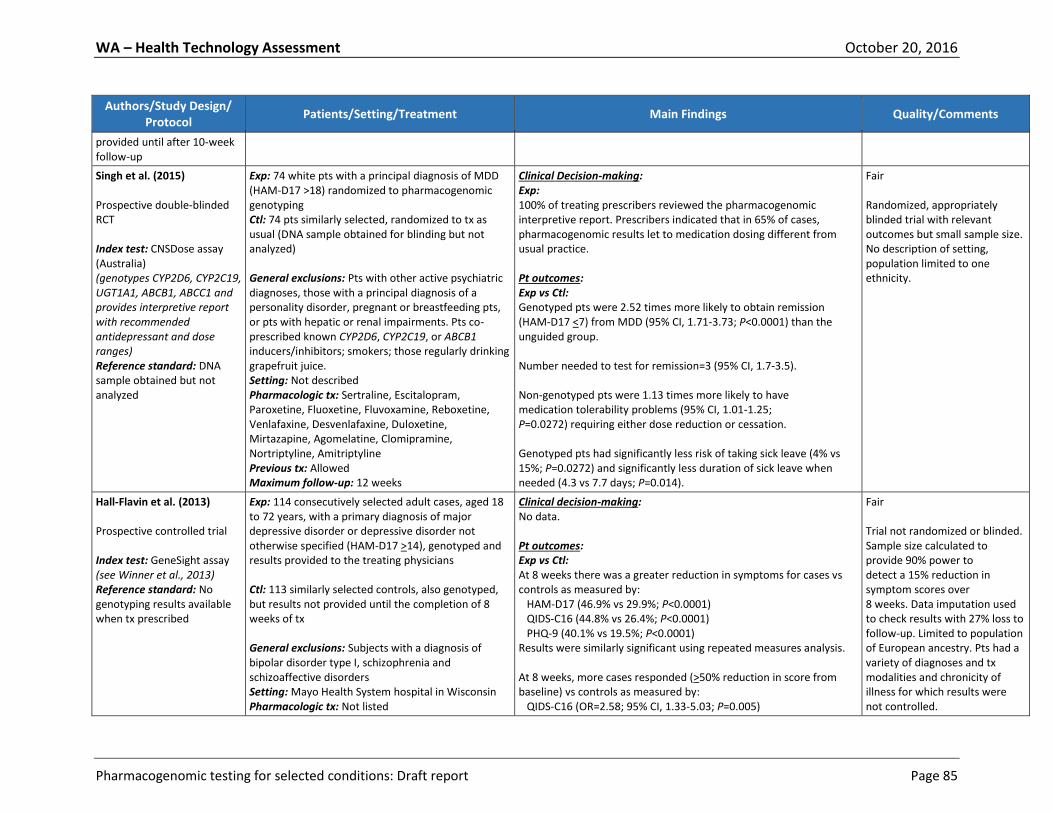
WA – Health Technology Assessment October 20, 2016
Pharmacogenomic testing for selected conditions: Draft report Page 85
Authors/Study Design/ Protocol
Patients/Setting/Treatment Main Findings Quality/Comments
provided until after 10-week follow-up
Singh et al. (2015) Prospective double-blinded RCT Index test: CNSDose assay (Australia) (genotypes CYP2D6, CYP2C19, UGT1A1, ABCB1, ABCC1 and provides interpretive report with recommended antidepressant and dose ranges) Reference standard: DNA sample obtained but not analyzed
Exp: 74 white pts with a principal diagnosis of MDD (HAM-D17 >18) randomized to pharmacogenomic genotyping Ctl: 74 pts similarly selected, randomized to tx as usual (DNA sample obtained for blinding but not analyzed) General exclusions: Pts with other active psychiatric diagnoses, those with a principal diagnosis of a personality disorder, pregnant or breastfeeding pts, or pts with hepatic or renal impairments. Pts co-prescribed known CYP2D6, CYP2C19, or ABCB1 inducers/inhibitors; smokers; those regularly drinking grapefruit juice. Setting: Not described Pharmacologic tx: Sertraline, Escitalopram, Paroxetine, Fluoxetine, Fluvoxamine, Reboxetine, Venlafaxine, Desvenlafaxine, Duloxetine, Mirtazapine, Agomelatine, Clomipramine, Nortriptyline, Amitriptyline Previous tx: Allowed Maximum follow-up: 12 weeks
Clinical Decision-making: Exp: 100% of treating prescribers reviewed the pharmacogenomic interpretive report. Prescribers indicated that in 65% of cases, pharmacogenomic results let to medication dosing different from usual practice. Pt outcomes: Exp vs Ctl: Genotyped pts were 2.52 times more likely to obtain remission (HAM-D17 <7) from MDD (95% CI, 1.71-3.73; P<0.0001) than the unguided group. Number needed to test for remission=3 (95% CI, 1.7-3.5). Non-genotyped pts were 1.13 times more likely to have medication tolerability problems (95% CI, 1.01-1.25; P=0.0272) requiring either dose reduction or cessation. Genotyped pts had significantly less risk of taking sick leave (4% vs 15%; P=0.0272) and significantly less duration of sick leave when needed (4.3 vs 7.7 days; P=0.014).
Fair Randomized, appropriately blinded trial with relevant outcomes but small sample size. No description of setting, population limited to one ethnicity.
Hall-Flavin et al. (2013) Prospective controlled trial Index test: GeneSight assay (see Winner et al., 2013) Reference standard: No genotyping results available when tx prescribed
Exp: 114 consecutively selected adult cases, aged 18 to 72 years, with a primary diagnosis of major depressive disorder or depressive disorder not otherwise specified (HAM-D17 >14), genotyped and results provided to the treating physicians Ctl: 113 similarly selected controls, also genotyped, but results not provided until the completion of 8 weeks of tx General exclusions: Subjects with a diagnosis of bipolar disorder type I, schizophrenia and schizoaffective disorders Setting: Mayo Health System hospital in Wisconsin Pharmacologic tx: Not listed
Clinical decision-making: No data. Pt outcomes: Exp vs Ctl: At 8 weeks there was a greater reduction in symptoms for cases vs controls as measured by: HAM-D17 (46.9% vs 29.9%; P<0.0001) QIDS-C16 (44.8% vs 26.4%; P<0.0001) PHQ-9 (40.1% vs 19.5%; P<0.0001) Results were similarly significant using repeated measures analysis. At 8 weeks, more cases responded (>50% reduction in score from baseline) vs controls as measured by: QIDS-C16 (OR=2.58; 95% CI, 1.33-5.03; P=0.005)
Fair Trial not randomized or blinded. Sample size calculated to provide 90% power to detect a 15% reduction in symptom scores over 8 weeks. Data imputation used to check results with 27% loss to follow-up. Limited to population of European ancestry. Pts had a variety of diagnoses and tx modalities and chronicity of illness for which results were not controlled.
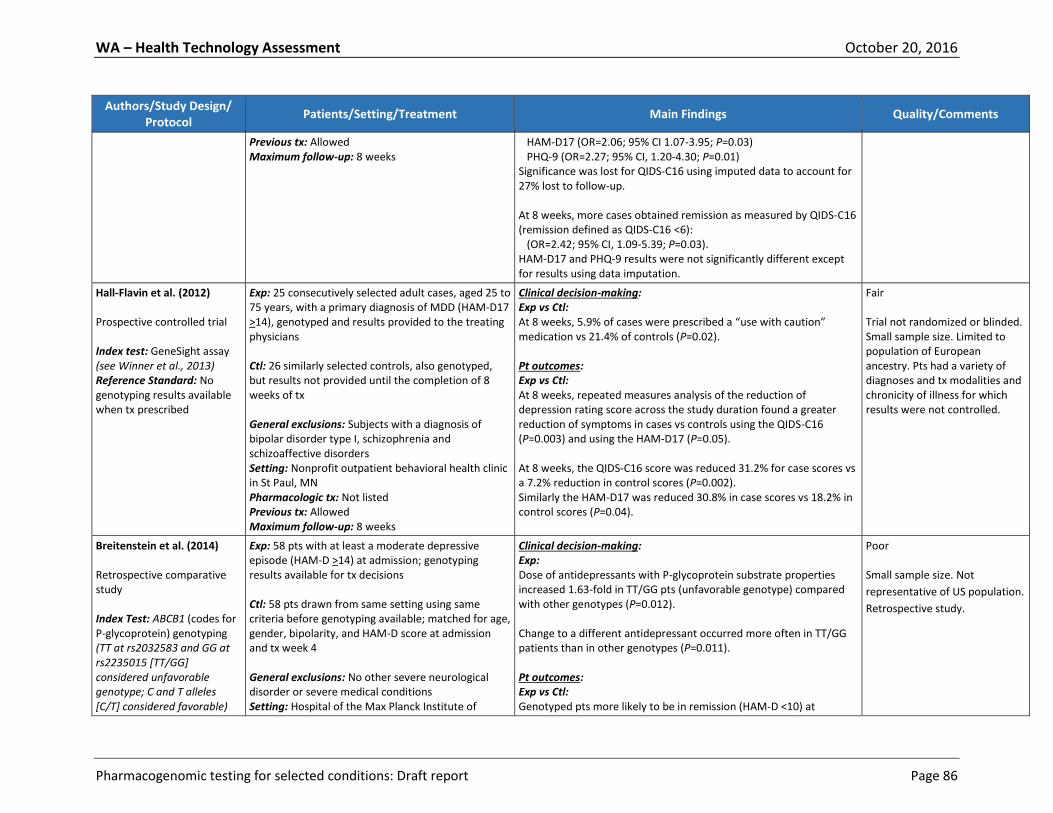
WA – Health Technology Assessment October 20, 2016
Pharmacogenomic testing for selected conditions: Draft report Page 86
Authors/Study Design/ Protocol
Patients/Setting/Treatment Main Findings Quality/Comments
Previous tx: Allowed Maximum follow-up: 8 weeks
HAM-D17 (OR=2.06; 95% CI 1.07-3.95; P=0.03) PHQ-9 (OR=2.27; 95% CI, 1.20-4.30; P=0.01) Significance was lost for QIDS-C16 using imputed data to account for 27% lost to follow-up. At 8 weeks, more cases obtained remission as measured by QIDS-C16 (remission defined as QIDS-C16 <6): (OR=2.42; 95% CI, 1.09-5.39; P=0.03). HAM-D17 and PHQ-9 results were not significantly different except for results using data imputation.
Hall-Flavin et al. (2012) Prospective controlled trial Index test: GeneSight assay (see Winner et al., 2013) Reference Standard: No genotyping results available when tx prescribed
Exp: 25 consecutively selected adult cases, aged 25 to 75 years, with a primary diagnosis of MDD (HAM-D17 >14), genotyped and results provided to the treating physicians Ctl: 26 similarly selected controls, also genotyped, but results not provided until the completion of 8 weeks of tx General exclusions: Subjects with a diagnosis of bipolar disorder type I, schizophrenia and schizoaffective disorders Setting: Nonprofit outpatient behavioral health clinic in St Paul, MN Pharmacologic tx: Not listed Previous tx: Allowed Maximum follow-up: 8 weeks
Clinical decision-making: Exp vs Ctl: At 8 weeks, 5.9% of cases were prescribed a “use with caution” medication vs 21.4% of controls (P=0.02). Pt outcomes: Exp vs Ctl: At 8 weeks, repeated measures analysis of the reduction of depression rating score across the study duration found a greater reduction of symptoms in cases vs controls using the QIDS-C16 (P=0.003) and using the HAM-D17 (P=0.05). At 8 weeks, the QIDS-C16 score was reduced 31.2% for case scores vs a 7.2% reduction in control scores (P=0.002). Similarly the HAM-D17 was reduced 30.8% in case scores vs 18.2% in control scores (P=0.04).
Fair Trial not randomized or blinded. Small sample size. Limited to population of European ancestry. Pts had a variety of diagnoses and tx modalities and chronicity of illness for which results were not controlled.
Breitenstein et al. (2014) Retrospective comparative study Index Test: ABCB1 (codes for P-glycoprotein) genotyping (TT at rs2032583 and GG at rs2235015 [TT/GG] considered unfavorable genotype; C and T alleles [C/T] considered favorable)
Exp: 58 pts with at least a moderate depressive episode (HAM-D >14) at admission; genotyping results available for tx decisions Ctl: 58 pts drawn from same setting using same criteria before genotyping available; matched for age, gender, bipolarity, and HAM-D score at admission and tx week 4 General exclusions: No other severe neurological disorder or severe medical conditions Setting: Hospital of the Max Planck Institute of
Clinical decision-making: Exp: Dose of antidepressants with P-glycoprotein substrate properties increased 1.63-fold in TT/GG pts (unfavorable genotype) compared with other genotypes (P=0.012). Change to a different antidepressant occurred more often in TT/GG patients than in other genotypes (P=0.011). Pt outcomes: Exp vs Ctl: Genotyped pts more likely to be in remission (HAM-D <10) at
Poor Small sample size. Not
representative of US population.
Retrospective study.

WA – Health Technology Assessment October 20, 2016
Pharmacogenomic testing for selected conditions: Draft report Page 87
Authors/Study Design/ Protocol
Patients/Setting/Treatment Main Findings Quality/Comments
Reference Standard: No genotyping
Psychiatry; pts selected from the Munich Antidepressant Response Signature project Pharmacologic tx: Any, classified into substrates and non-substrates of P-glycoprotein transporter Previous tx: Allowed Maximum follow-up: 5 weeks after genotyping for decision-making outcomes; unknown for pt outcomes
discharge compared with non-genotyped pts (83.6% vs 62.1%; P=0.005). Dose increases in substrate antidepressants were associated with shorter hospital stays (P=0.009). TT/GG pt hospital stay was reduced by 4.7 weeks if substrate dose increased more than 1.5.
Rundell et al. (2011) Retrospective comparative study Index test: At least one of CYP2D6, CYP2C19, CYP2C9, and/or serotonin transporter genotype 5-HTTLPR Reference standard: No genotyping ordered
Exp: 29 psychiatric outpatients who had at least 2 PHSQ-9 depression severity scores preceding and 2 following (by at least 14 days) a consultation with pharmacogenomic genotyping Ctl: 17 similarly qualified pts who did not have pharmacogenomic genotyping General exclusions: None Setting: Mayo Clinic Rochester, outpatient psychiatric consultation practices Pharmacologic tx: Antidepressants, mood stabilizers, antipsychotics Previous tx: Allowed Maximum follow-up: 8 weeks
Clinical decision-making: No data. Pt outcomes: Exp vs Ctl: For post-day 14 serial PHQ-9 scores, there were no significant differences over time among CYP450 genotype categories. For 5-HTTLPR categories, L/L genotype pts had significantly greater improvement in PHQ-9 scores than other genotypes at times 4 and 5 (P=0.02 to P=0.05). There were no significant differences between genotyped and non-genotyped groups with regard to adjusted PHQ-9 scale slopes post-day 14. The differences in pre-baseline to post-baseline PHQ-9 depression severity scale score slopes, were not significant.
Very poor Small, retrospective, “exploratory” study based on medical record review. Those who received pharmacogenomic genotyping differed significantly from those who did not making comparisons difficult. Not fully representative of consulting pt population.
Any Psychiatric Diagnosis
Espadaler et al. (2016) Retrospective comparative study Index Test: Neuropharmagen (Spain) recommendations used to direct tx (genotypes for CYP2D6, CYP2C19, CYP2C9, CYP1A2, CYP2B6, EPHX1, BDNF, 5-HTTLPR, ABCB1, GRIK4,
Exp: 89 pts aged >18 years, who failed a previous tx regimen due to lack of efficacy and/or poor tolerability, and whose tx followed genotyping recommendations Ctl: 93 pts drawn from same source group but whose tx did not follow genotyping recommendations General exclusions: CGI-S score <3; no restrictions on diagnoses (primarily major depression, psychotic disorder, bipolar disorder), other medical conditions (49%), or prescribed treatments
Clinical decision-making: No data. Pt outcomes: Exp vs Ctl: At 3 months, 93% (Exp) vs 82% (Ctl) had CGI-S scores lower than baseline (adjusted OR controlling for comorbidities = 3.86 (95% CI, 1.36-10.95; P=0.011). The magnitude of change in CGI-S score was -1.43 (Exp) vs +1.25 (Ctl); adjusted mean score difference 0.24 (P=0.034).
Poor Small sample size. Not representative of U.S. population. Retrospective study.
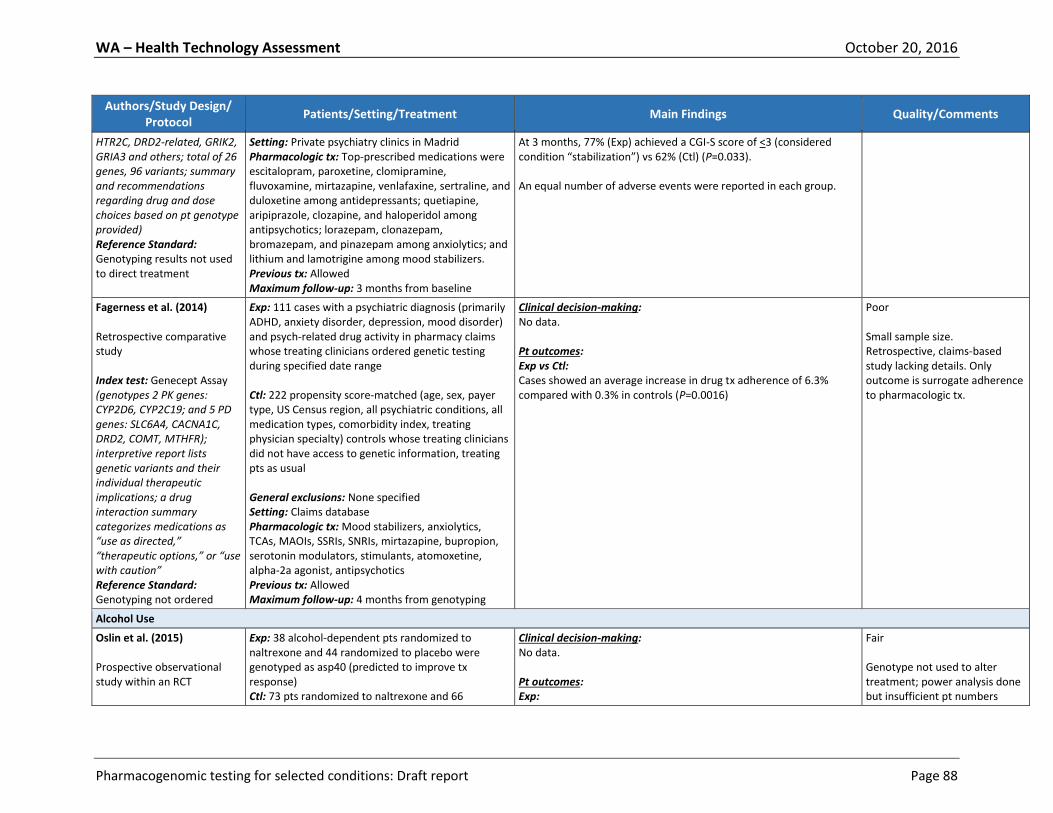
WA – Health Technology Assessment October 20, 2016
Pharmacogenomic testing for selected conditions: Draft report Page 88
Authors/Study Design/ Protocol
Patients/Setting/Treatment Main Findings Quality/Comments
HTR2C, DRD2-related, GRIK2, GRIA3 and others; total of 26 genes, 96 variants; summary and recommendations regarding drug and dose choices based on pt genotype provided) Reference Standard: Genotyping results not used to direct treatment
Setting: Private psychiatry clinics in Madrid Pharmacologic tx: Top-prescribed medications were escitalopram, paroxetine, clomipramine, fluvoxamine, mirtazapine, venlafaxine, sertraline, and duloxetine among antidepressants; quetiapine, aripiprazole, clozapine, and haloperidol among antipsychotics; lorazepam, clonazepam, bromazepam, and pinazepam among anxiolytics; and lithium and lamotrigine among mood stabilizers. Previous tx: Allowed Maximum follow-up: 3 months from baseline
At 3 months, 77% (Exp) achieved a CGI-S score of <3 (considered condition “stabilization”) vs 62% (Ctl) (P=0.033). An equal number of adverse events were reported in each group.
Fagerness et al. (2014) Retrospective comparative study Index test: Genecept Assay (genotypes 2 PK genes: CYP2D6, CYP2C19; and 5 PD genes: SLC6A4, CACNA1C, DRD2, COMT, MTHFR); interpretive report lists genetic variants and their individual therapeutic implications; a drug interaction summary categorizes medications as “use as directed,” “therapeutic options,” or “use with caution” Reference Standard: Genotyping not ordered
Exp: 111 cases with a psychiatric diagnosis (primarily ADHD, anxiety disorder, depression, mood disorder) and psych-related drug activity in pharmacy claims whose treating clinicians ordered genetic testing during specified date range Ctl: 222 propensity score-matched (age, sex, payer type, US Census region, all psychiatric conditions, all medication types, comorbidity index, treating physician specialty) controls whose treating clinicians did not have access to genetic information, treating pts as usual General exclusions: None specified Setting: Claims database Pharmacologic tx: Mood stabilizers, anxiolytics, TCAs, MAOIs, SSRIs, SNRIs, mirtazapine, bupropion, serotonin modulators, stimulants, atomoxetine, alpha-2a agonist, antipsychotics Previous tx: Allowed Maximum follow-up: 4 months from genotyping
Clinical decision-making: No data. Pt outcomes: Exp vs Ctl: Cases showed an average increase in drug tx adherence of 6.3% compared with 0.3% in controls (P=0.0016)
Poor Small sample size. Retrospective, claims-based study lacking details. Only outcome is surrogate adherence to pharmacologic tx.
Alcohol Use
Oslin et al. (2015) Prospective observational study within an RCT
Exp: 38 alcohol-dependent pts randomized to naltrexone and 44 randomized to placebo were genotyped as asp40 (predicted to improve tx response) Ctl: 73 pts randomized to naltrexone and 66
Clinical decision-making: No data. Pt outcomes: Exp:
Fair Genotype not used to alter treatment; power analysis done but insufficient pt numbers
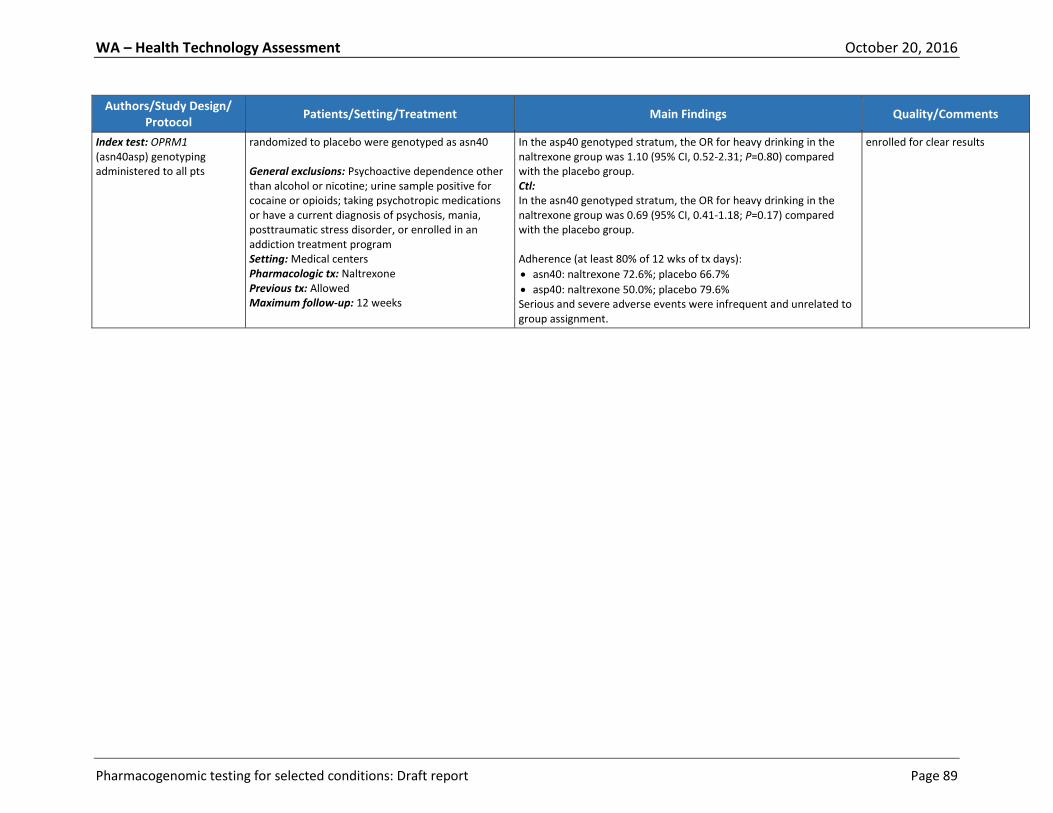
WA – Health Technology Assessment October 20, 2016
Pharmacogenomic testing for selected conditions: Draft report Page 89
Authors/Study Design/ Protocol
Patients/Setting/Treatment Main Findings Quality/Comments
Index test: OPRM1 (asn40asp) genotyping administered to all pts
randomized to placebo were genotyped as asn40 General exclusions: Psychoactive dependence other than alcohol or nicotine; urine sample positive for cocaine or opioids; taking psychotropic medications or have a current diagnosis of psychosis, mania, posttraumatic stress disorder, or enrolled in an addiction treatment program Setting: Medical centers Pharmacologic tx: Naltrexone Previous tx: Allowed Maximum follow-up: 12 weeks
In the asp40 genotyped stratum, the OR for heavy drinking in the naltrexone group was 1.10 (95% CI, 0.52-2.31; P=0.80) compared with the placebo group. Ctl: In the asn40 genotyped stratum, the OR for heavy drinking in the naltrexone group was 0.69 (95% CI, 0.41-1.18; P=0.17) compared with the placebo group. Adherence (at least 80% of 12 wks of tx days):
asn40: naltrexone 72.6%; placebo 66.7%
asp40: naltrexone 50.0%; placebo 79.6% Serious and severe adverse events were infrequent and unrelated to group assignment.
enrolled for clear results

WA – Health Technology Assessment October 20, 2016
Pharmacogenomic testing for selected conditions: Draft report Page 90
APPENDIX Vb. Summary of Subgroup Results for Clinical Utility Studies of Pharmacogenomic Testing (KQ3)
Key: CGI-S, Clinical Global Impression of Severity; Ctl, control group for which genotyping results were available at the end of the treatment period or not available at all, depending on study design; Exp, experimental or genotyped treatment group for which results were immediately available to prescribing physicians; HAM-D, Hamilton Depression Rating Scale (21 items unless otherwise specified); hx, history; MDD, major depressive disorder; med, medication; PGx, pharmacogenomic; PHQ-9, Patient Health Questionnaire (9 items); Prev, previous; psych, psychiatric; pts, patients; QIDS-C16, Quick Inventory of Depressive Symptomatology-Clinician Rated (16 items); tx, treatment
Author/Study Design/Protocol
Patient Qualifications Exp vs Ctl (see Key and APPENDIX Table IVa) Statistically Significant
Differences at Baseline
Subgroup Results by Clinical History
Subgroup Results by Patient Characteristics
Depressive disorders
Winner et al. (2013) (RCT, fair Exp n=26 vs Ctl n=25, see Key)
Pts with a diagnosis of a depressive disorder, minimum HAM-D17 score; bipolar disorder, schizophrenia, or schizoaffective disorders excluded
31% vs 8% male; P=0.04 No subgroup results No subgroup results
Singh (2015) (RCT, fair Exp n=74 vs Ctl n=74, see Key)
Pts of white ethnicity with a principal diagnosis of MDD, minimum HAM-D17 score, numerous exclusions (see APPENDIX Table IVa)
None No subgroup results No subgroup results
Hall-Flavin et al. (2013) (Controlled trial, fair Exp n=114 vs Ctl n=113, all genotyped, see Key)
Consecutively selected adult cases with a primary diagnosis of a depressive disorder, minimum HAM-D17 score; bipolar disorder type I, schizophrenia and schizoaffective disorder diagnoses excluded; mostly European ancestry
QIDS-C16 Score (P=0.003) Previous med trials (P=0.021) Previous panel med trials (P=0.026)
No subgroup results No subgroup results
Hall-Flavin et al. (2012) (Controlled trial, fair Exp n=25 vs Ctl n=26;
Primary diagnosis major depressive disorder, minimum HAM-D17 score; bipolar, schizophrenia, schizoaffective
None No subgroup results No subgroup results
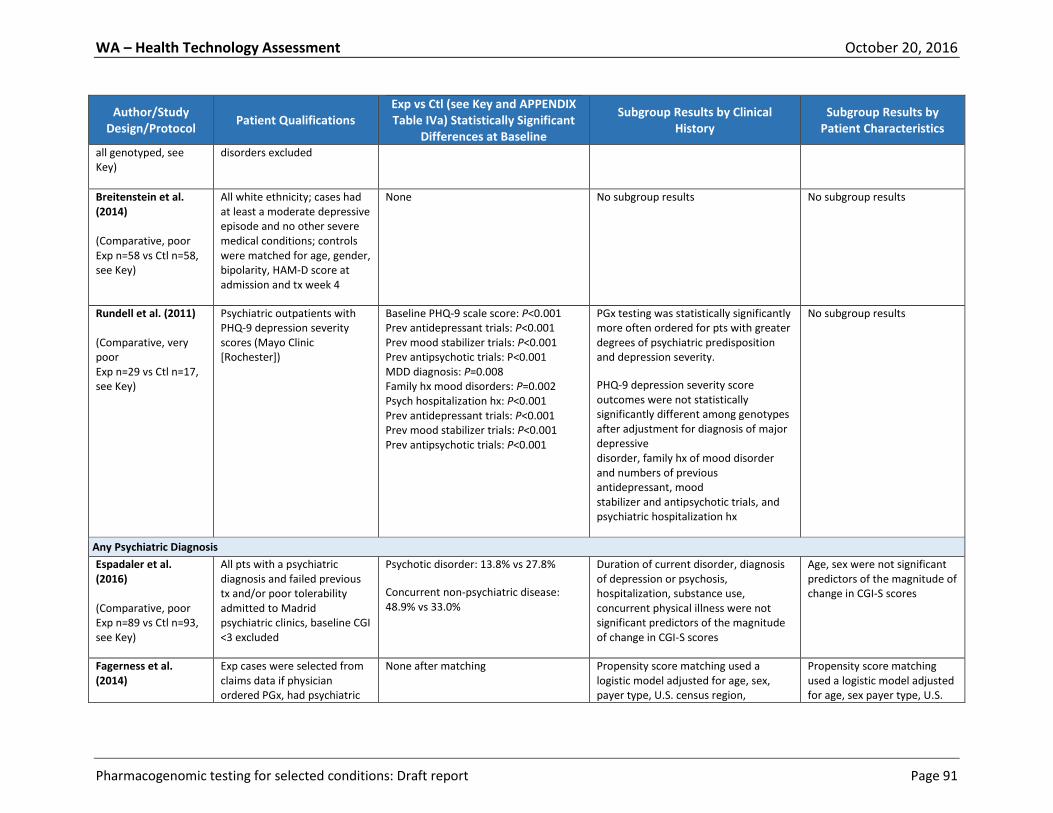
WA – Health Technology Assessment October 20, 2016
Pharmacogenomic testing for selected conditions: Draft report Page 91
Author/Study Design/Protocol
Patient Qualifications Exp vs Ctl (see Key and APPENDIX Table IVa) Statistically Significant
Differences at Baseline
Subgroup Results by Clinical History
Subgroup Results by Patient Characteristics
all genotyped, see Key)
disorders excluded
Breitenstein et al. (2014) (Comparative, poor Exp n=58 vs Ctl n=58, see Key)
All white ethnicity; cases had at least a moderate depressive episode and no other severe medical conditions; controls were matched for age, gender, bipolarity, HAM-D score at admission and tx week 4
None No subgroup results No subgroup results
Rundell et al. (2011) (Comparative, very poor Exp n=29 vs Ctl n=17, see Key)
Psychiatric outpatients with PHQ-9 depression severity scores (Mayo Clinic [Rochester])
Baseline PHQ-9 scale score: P<0.001 Prev antidepressant trials: P<0.001 Prev mood stabilizer trials: P<0.001 Prev antipsychotic trials: P<0.001 MDD diagnosis: P=0.008 Family hx mood disorders: P=0.002 Psych hospitalization hx: P<0.001 Prev antidepressant trials: P<0.001 Prev mood stabilizer trials: P<0.001 Prev antipsychotic trials: P<0.001
PGx testing was statistically significantly more often ordered for pts with greater degrees of psychiatric predisposition and depression severity.
PHQ-9 depression severity score outcomes were not statistically significantly different among genotypes after adjustment for diagnosis of major depressive disorder, family hx of mood disorder and numbers of previous antidepressant, mood stabilizer and antipsychotic trials, and psychiatric hospitalization hx
No subgroup results
Any Psychiatric Diagnosis
Espadaler et al. (2016) (Comparative, poor Exp n=89 vs Ctl n=93, see Key)
All pts with a psychiatric diagnosis and failed previous tx and/or poor tolerability admitted to Madrid psychiatric clinics, baseline CGI <3 excluded
Psychotic disorder: 13.8% vs 27.8%
Concurrent non-psychiatric disease: 48.9% vs 33.0%
Duration of current disorder, diagnosis of depression or psychosis, hospitalization, substance use, concurrent physical illness were not significant predictors of the magnitude of change in CGI-S scores
Age, sex were not significant predictors of the magnitude of change in CGI-S scores
Fagerness et al. (2014)
Exp cases were selected from claims data if physician ordered PGx, had psychiatric
None after matching Propensity score matching used a logistic model adjusted for age, sex, payer type, U.S. census region,
Propensity score matching used a logistic model adjusted for age, sex payer type, U.S.
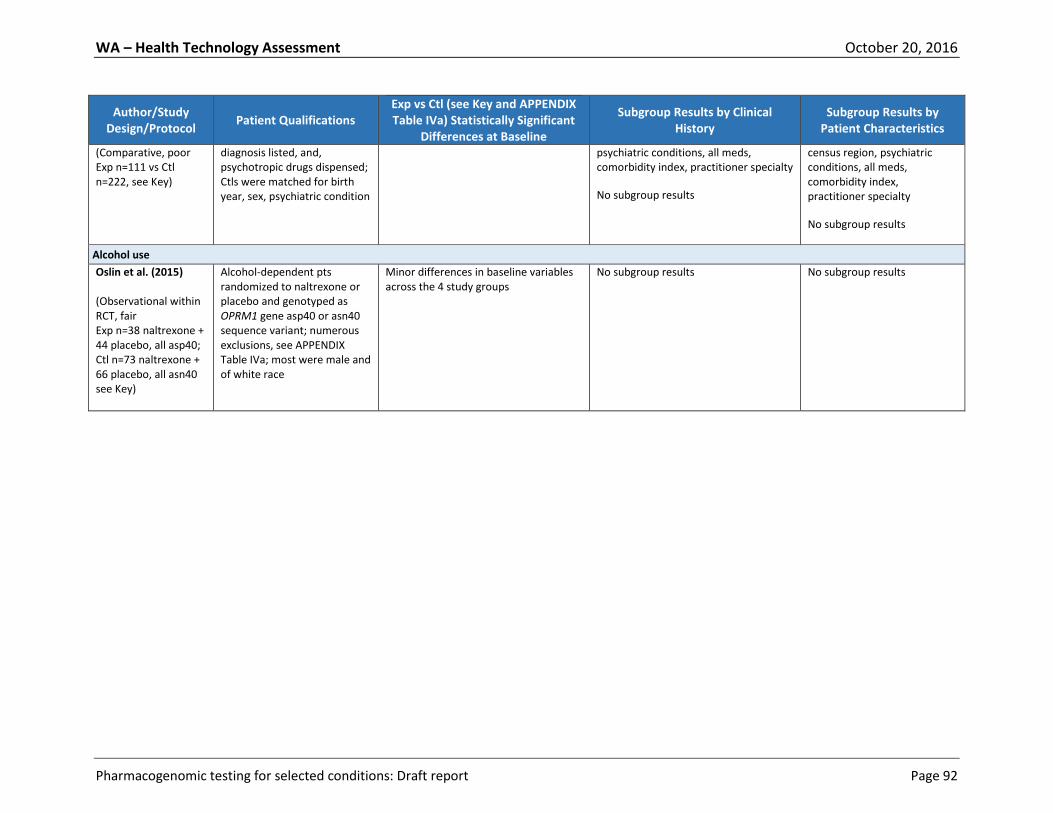
WA – Health Technology Assessment October 20, 2016
Pharmacogenomic testing for selected conditions: Draft report Page 92
Author/Study Design/Protocol
Patient Qualifications Exp vs Ctl (see Key and APPENDIX Table IVa) Statistically Significant
Differences at Baseline
Subgroup Results by Clinical History
Subgroup Results by Patient Characteristics
(Comparative, poor Exp n=111 vs Ctl n=222, see Key)
diagnosis listed, and, psychotropic drugs dispensed; Ctls were matched for birth year, sex, psychiatric condition
psychiatric conditions, all meds, comorbidity index, practitioner specialty
No subgroup results
census region, psychiatric conditions, all meds, comorbidity index, practitioner specialty
No subgroup results
Alcohol use
Oslin et al. (2015) (Observational within RCT, fair Exp n=38 naltrexone + 44 placebo, all asp40; Ctl n=73 naltrexone + 66 placebo, all asn40 see Key)
Alcohol-dependent pts randomized to naltrexone or placebo and genotyped as OPRM1 gene asp40 or asn40 sequence variant; numerous exclusions, see APPENDIX Table IVa; most were male and of white race
Minor differences in baseline variables across the 4 study groups
No subgroup results No subgroup results
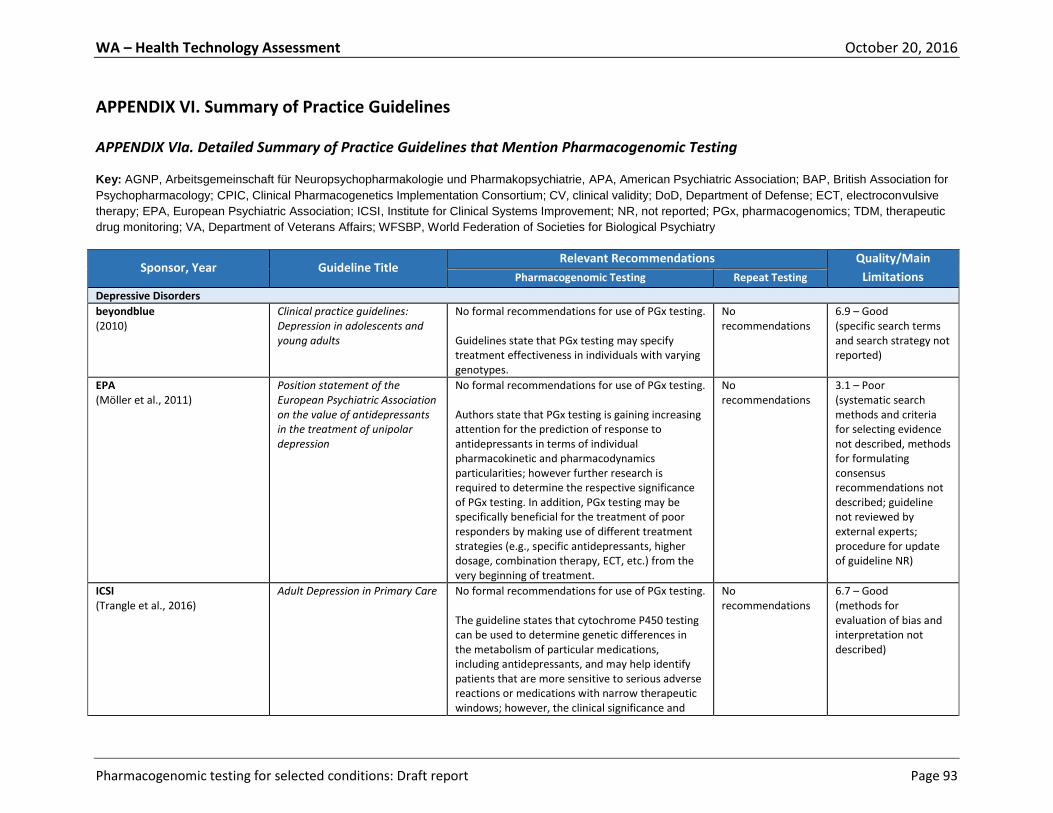
WA – Health Technology Assessment October 20, 2016
Pharmacogenomic testing for selected conditions: Draft report Page 93
APPENDIX VI. Summary of Practice Guidelines
APPENDIX VIa. Detailed Summary of Practice Guidelines that Mention Pharmacogenomic Testing
Key: AGNP, Arbeitsgemeinschaft für Neuropsychopharmakologie und Pharmakopsychiatrie, APA, American Psychiatric Association; BAP, British Association for
Psychopharmacology; CPIC, Clinical Pharmacogenetics Implementation Consortium; CV, clinical validity; DoD, Department of Defense; ECT, electroconvulsive
therapy; EPA, European Psychiatric Association; ICSI, Institute for Clinical Systems Improvement; NR, not reported; PGx, pharmacogenomics; TDM, therapeutic
drug monitoring; VA, Department of Veterans Affairs; WFSBP, World Federation of Societies for Biological Psychiatry
Sponsor, Year Guideline Title Relevant Recommendations Quality/Main
Limitations Pharmacogenomic Testing Repeat Testing
Depressive Disorders
beyondblue (2010)
Clinical practice guidelines: Depression in adolescents and young adults
No formal recommendations for use of PGx testing. Guidelines state that PGx testing may specify treatment effectiveness in individuals with varying genotypes.
No recommendations
6.9 – Good (specific search terms and search strategy not reported)
EPA (Möller et al., 2011)
Position statement of the European Psychiatric Association on the value of antidepressants in the treatment of unipolar depression
No formal recommendations for use of PGx testing. Authors state that PGx testing is gaining increasing attention for the prediction of response to antidepressants in terms of individual pharmacokinetic and pharmacodynamics particularities; however further research is required to determine the respective significance of PGx testing. In addition, PGx testing may be specifically beneficial for the treatment of poor responders by making use of different treatment strategies (e.g., specific antidepressants, higher dosage, combination therapy, ECT, etc.) from the very beginning of treatment.
No recommendations
3.1 – Poor (systematic search methods and criteria for selecting evidence not described, methods for formulating consensus recommendations not described; guideline not reviewed by external experts; procedure for update of guideline NR)
ICSI (Trangle et al., 2016)
Adult Depression in Primary Care
No formal recommendations for use of PGx testing. The guideline states that cytochrome P450 testing can be used to determine genetic differences in the metabolism of particular medications, including antidepressants, and may help identify patients that are more sensitive to serious adverse reactions or medications with narrow therapeutic windows; however, the clinical significance and
No recommendations
6.7 – Good (methods for evaluation of bias and interpretation not described)
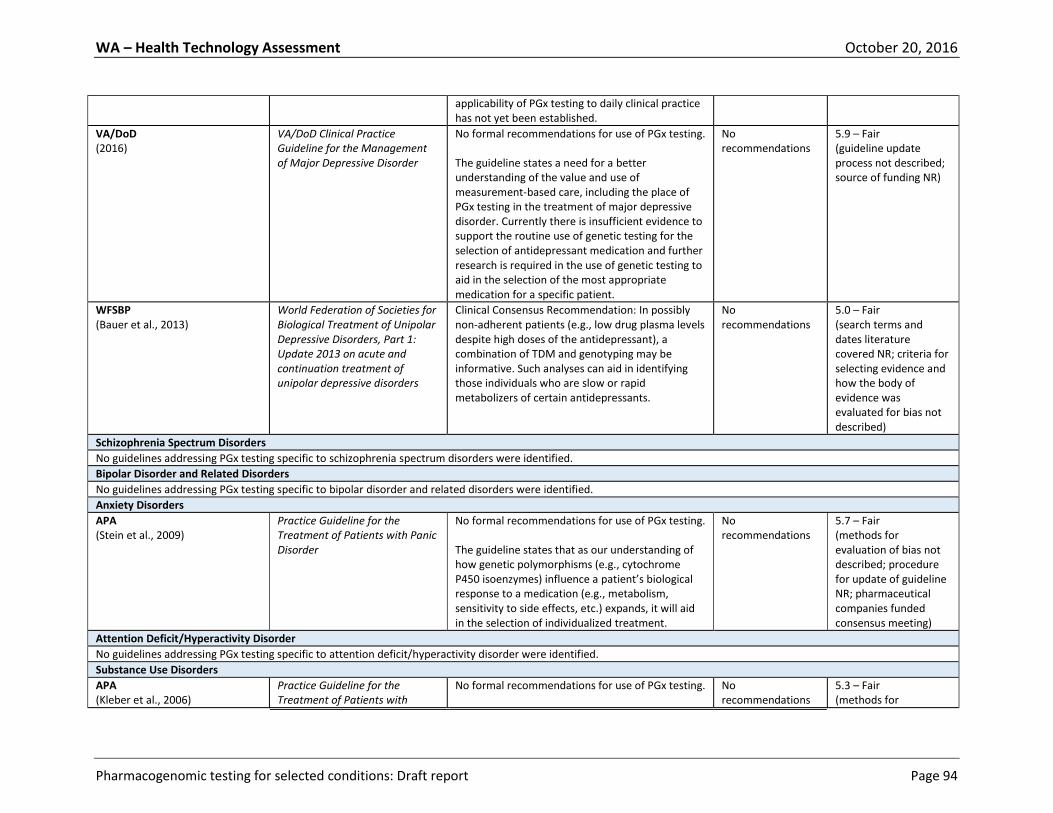
WA – Health Technology Assessment October 20, 2016
Pharmacogenomic testing for selected conditions: Draft report Page 94
applicability of PGx testing to daily clinical practice has not yet been established.
VA/DoD (2016)
VA/DoD Clinical Practice Guideline for the Management of Major Depressive Disorder
No formal recommendations for use of PGx testing. The guideline states a need for a better understanding of the value and use of measurement-based care, including the place of PGx testing in the treatment of major depressive disorder. Currently there is insufficient evidence to support the routine use of genetic testing for the selection of antidepressant medication and further research is required in the use of genetic testing to aid in the selection of the most appropriate medication for a specific patient.
No recommendations
5.9 – Fair (guideline update process not described; source of funding NR)
WFSBP (Bauer et al., 2013)
World Federation of Societies for Biological Treatment of Unipolar Depressive Disorders, Part 1: Update 2013 on acute and continuation treatment of unipolar depressive disorders
Clinical Consensus Recommendation: In possibly non-adherent patients (e.g., low drug plasma levels despite high doses of the antidepressant), a combination of TDM and genotyping may be informative. Such analyses can aid in identifying those individuals who are slow or rapid metabolizers of certain antidepressants.
No recommendations
5.0 – Fair (search terms and dates literature covered NR; criteria for selecting evidence and how the body of evidence was evaluated for bias not described)
Schizophrenia Spectrum Disorders
No guidelines addressing PGx testing specific to schizophrenia spectrum disorders were identified.
Bipolar Disorder and Related Disorders
No guidelines addressing PGx testing specific to bipolar disorder and related disorders were identified.
Anxiety Disorders
APA (Stein et al., 2009)
Practice Guideline for the Treatment of Patients with Panic Disorder
No formal recommendations for use of PGx testing. The guideline states that as our understanding of how genetic polymorphisms (e.g., cytochrome P450 isoenzymes) influence a patient’s biological response to a medication (e.g., metabolism, sensitivity to side effects, etc.) expands, it will aid in the selection of individualized treatment.
No recommendations
5.7 – Fair (methods for evaluation of bias not described; procedure for update of guideline NR; pharmaceutical companies funded consensus meeting)
Attention Deficit/Hyperactivity Disorder
No guidelines addressing PGx testing specific to attention deficit/hyperactivity disorder were identified.
Substance Use Disorders
APA (Kleber et al., 2006)
Practice Guideline for the Treatment of Patients with
No formal recommendations for use of PGx testing.
No recommendations
5.3 – Fair (methods for
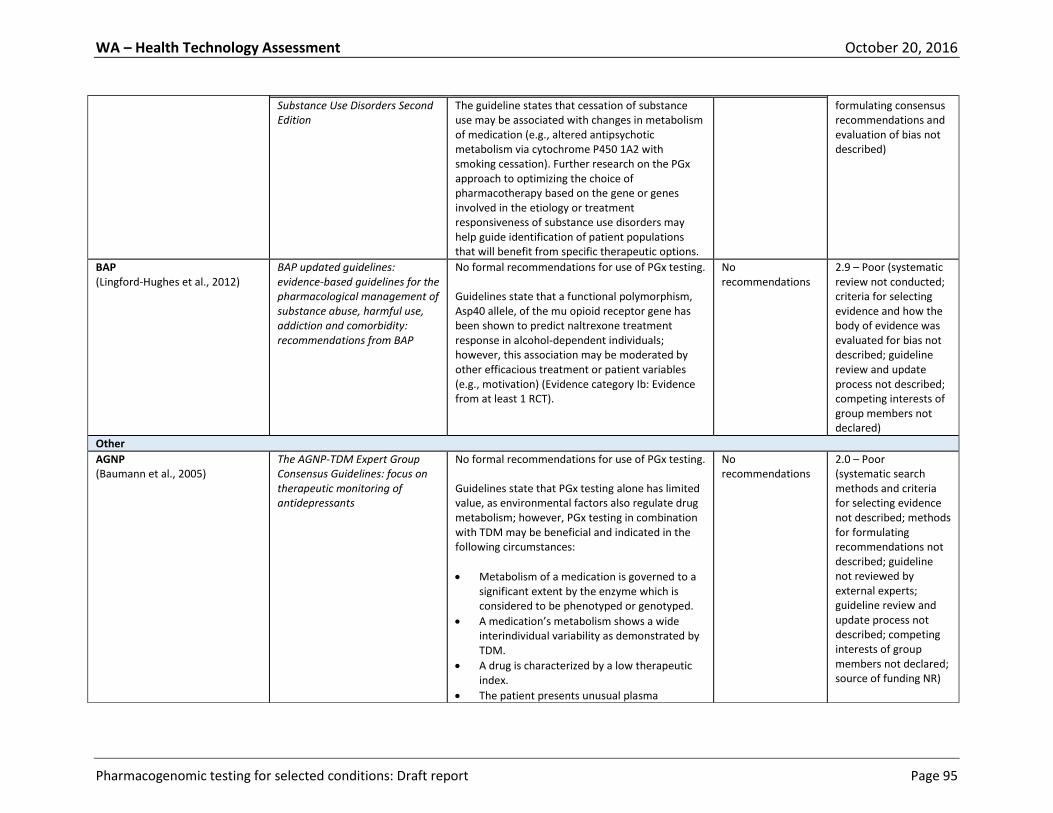
WA – Health Technology Assessment October 20, 2016
Pharmacogenomic testing for selected conditions: Draft report Page 95
Substance Use Disorders Second Edition
The guideline states that cessation of substance use may be associated with changes in metabolism of medication (e.g., altered antipsychotic metabolism via cytochrome P450 1A2 with smoking cessation). Further research on the PGx approach to optimizing the choice of pharmacotherapy based on the gene or genes involved in the etiology or treatment responsiveness of substance use disorders may help guide identification of patient populations that will benefit from specific therapeutic options.
formulating consensus recommendations and evaluation of bias not described)
BAP (Lingford-Hughes et al., 2012)
BAP updated guidelines: evidence-based guidelines for the pharmacological management of substance abuse, harmful use, addiction and comorbidity: recommendations from BAP
No formal recommendations for use of PGx testing. Guidelines state that a functional polymorphism, Asp40 allele, of the mu opioid receptor gene has been shown to predict naltrexone treatment response in alcohol-dependent individuals; however, this association may be moderated by other efficacious treatment or patient variables (e.g., motivation) (Evidence category Ib: Evidence from at least 1 RCT).
No recommendations
2.9 – Poor (systematic review not conducted; criteria for selecting evidence and how the body of evidence was evaluated for bias not described; guideline review and update process not described; competing interests of group members not declared)
Other
AGNP (Baumann et al., 2005)
The AGNP-TDM Expert Group Consensus Guidelines: focus on therapeutic monitoring of antidepressants
No formal recommendations for use of PGx testing. Guidelines state that PGx testing alone has limited value, as environmental factors also regulate drug metabolism; however, PGx testing in combination with TDM may be beneficial and indicated in the following circumstances:
Metabolism of a medication is governed to a significant extent by the enzyme which is considered to be phenotyped or genotyped.
A medication’s metabolism shows a wide interindividual variability as demonstrated by TDM.
A drug is characterized by a low therapeutic index.
The patient presents unusual plasma
No recommendations
2.0 – Poor (systematic search methods and criteria for selecting evidence not described; methods for formulating recommendations not described; guideline not reviewed by external experts; guideline review and update process not described; competing interests of group members not declared; source of funding NR)

WA – Health Technology Assessment October 20, 2016
Pharmacogenomic testing for selected conditions: Draft report Page 96
concentrations of the drug or its metabolites, and genetic factors are suspected to be responsible.
The patient suffers from a chronic illness that requires life-long treatment.
BAP (Cooper et al., 2016)
BAP guidelines on the management of weight gain, metabolic disturbances and cardiovascular risk associated with psychosis and antipsychotic drug treatment
No formal recommendations for use of PGx testing. Guidelines state that genetic factors associated with drug-induced weight gain and its metabolic consequences provide clues about the underlying mechanisms, and in the future may provide opportunities for personalized medicine in the predictive assessment of metabolic risk with antipsychotic drug treatment.
No recommendations
3.3 – Poor (systematic review not conducted; criteria for selecting evidence and how the body of evidence was evaluated for bias not described; guideline not reviewed by external experts; guideline review and update process not described; competing interests of grp members not declared)
CPIC (Hicks et al., 2013)
Clinical Pharmacogenetics Implementation Consortium Guideline for CYP2D6 and CYP2C19 Genotypes and Dosing of Tricyclic Antidepressants
Dosing recommendations for amitriptyline and nortriptyline based on CYP2D6 phenotype: CYP2D6 ultrarapid metabolizer:
For increased metabolism of tricyclics to less active compounds as comparted with extensive metabolizers, avoid tricyclic use due to potential lack of efficacy. Consider alternative drug not metabolized by CYP2D6. (Strong)
If tricyclic is warranted, consider increasing the starting dose. Use therapeutic drug monitoring to guide dose adjustments. (Strong)
CYP2D6 extensive metabolizer:
For normal metabolism of tricyclics, initiate therapy with recommended starting dose. (Strong)
CYP2D6 intermediate metabolizer:
For reduced metabolism of tricyclics to less active compounds as compared with extensive metabolizers, consider a 25%
No recommendations
4.9 – Fair (recommendations based on CV evidence and consensus; methods evaluation of bias and interpretation not described; guideline not reviewed by external experts)

WA – Health Technology Assessment October 20, 2016
Pharmacogenomic testing for selected conditions: Draft report Page 97
reduction of recommended starting dose. Use TDM to guide dose adjustments. (Moderate)
CYP2D6 poor metabolizer:
For greatly reduced metabolism of tricyclics to less active compounds as compared with extensive metabolizers, avoid tricyclic use due to potential side effects. Consider alternative drug not metabolized by CYP2D6. (Strong)
If a tricyclic is warranted, consider a 50% reduction of recommended starting dose. Use TDM to guide dose adjustments. (Strong)
Dosing recommendations for amitriptyline based on CYP2C19 phenotype: CYP2C19 ultrarapid metabolizer:
For increased metabolism of amitriptyline as compared with extensive metabolizers, consider alternative drug not metabolized by CYP2C19. If tricyclic is warranted, use therapeutic drug monitoring to guide dose adjustments. (Optional)
CYP2C19 extensive metabolizer:
For normal metabolism of amitriptyline, initiate therapy with recommended starting dose. (Strong)
CYP2C19 intermediate metabolizer:
For reduced metabolism of amitriptyline as compared with extensive metabolizers, initiate therapy with recommended starting dose. (Strong)
CYP2C19 poor metabolizer:
For greatly reduced metabolism of amitriptyline as compared with extensive metabolizers, consider a 50% reduction of recommended starting dose. Use TDM to guide dose adjustments. (Moderate)
CPIC (Hicks et al., 2015)
Clinical Pharmacogenetics Implementation Consortium Guideline for CYP2D6 and CYP2C19 Genotypes and Dosing of Selective Serotonin Reuptake
Dosing recommendations for paroxetine based on CYP2D6 phenotype: CYP2D6 ultrarapid metabolizer:
For increased metabolism to less active
No recommendations
4.9 – Fair (recommendations based on CV evidence and consensus; methods for evaluation
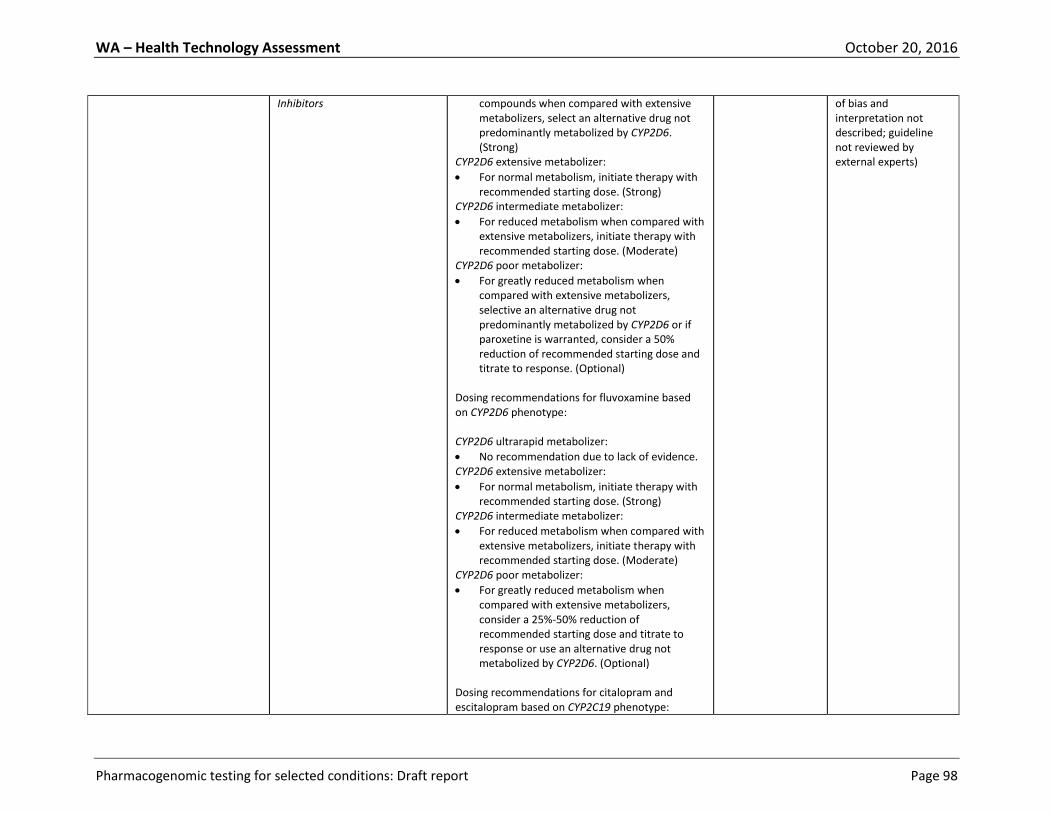
WA – Health Technology Assessment October 20, 2016
Pharmacogenomic testing for selected conditions: Draft report Page 98
Inhibitors
compounds when compared with extensive metabolizers, select an alternative drug not predominantly metabolized by CYP2D6. (Strong)
CYP2D6 extensive metabolizer:
For normal metabolism, initiate therapy with recommended starting dose. (Strong)
CYP2D6 intermediate metabolizer:
For reduced metabolism when compared with extensive metabolizers, initiate therapy with recommended starting dose. (Moderate)
CYP2D6 poor metabolizer:
For greatly reduced metabolism when compared with extensive metabolizers, selective an alternative drug not predominantly metabolized by CYP2D6 or if paroxetine is warranted, consider a 50% reduction of recommended starting dose and titrate to response. (Optional)
Dosing recommendations for fluvoxamine based on CYP2D6 phenotype: CYP2D6 ultrarapid metabolizer:
No recommendation due to lack of evidence. CYP2D6 extensive metabolizer:
For normal metabolism, initiate therapy with recommended starting dose. (Strong)
CYP2D6 intermediate metabolizer:
For reduced metabolism when compared with extensive metabolizers, initiate therapy with recommended starting dose. (Moderate)
CYP2D6 poor metabolizer:
For greatly reduced metabolism when compared with extensive metabolizers, consider a 25%-50% reduction of recommended starting dose and titrate to response or use an alternative drug not metabolized by CYP2D6. (Optional)
Dosing recommendations for citalopram and escitalopram based on CYP2C19 phenotype:
of bias and interpretation not described; guideline not reviewed by external experts)
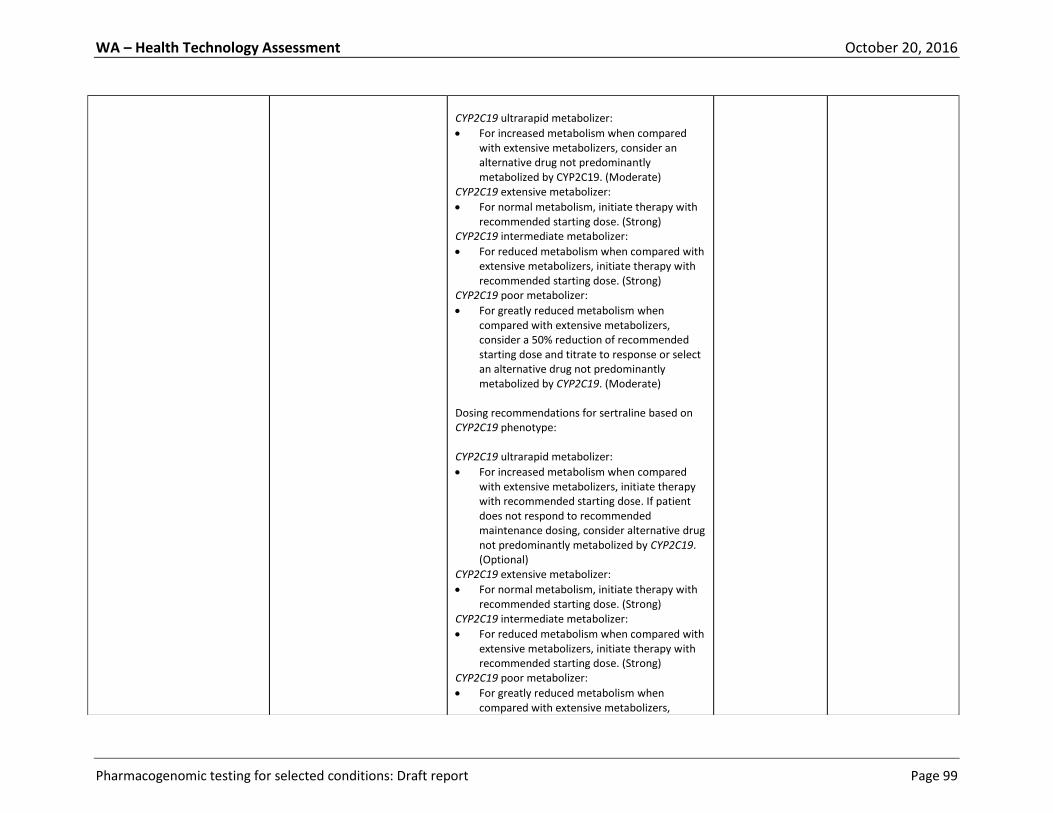
WA – Health Technology Assessment October 20, 2016
Pharmacogenomic testing for selected conditions: Draft report Page 99
CYP2C19 ultrarapid metabolizer:
For increased metabolism when compared with extensive metabolizers, consider an alternative drug not predominantly metabolized by CYP2C19. (Moderate)
CYP2C19 extensive metabolizer:
For normal metabolism, initiate therapy with recommended starting dose. (Strong)
CYP2C19 intermediate metabolizer:
For reduced metabolism when compared with extensive metabolizers, initiate therapy with recommended starting dose. (Strong)
CYP2C19 poor metabolizer:
For greatly reduced metabolism when compared with extensive metabolizers, consider a 50% reduction of recommended starting dose and titrate to response or select an alternative drug not predominantly metabolized by CYP2C19. (Moderate)
Dosing recommendations for sertraline based on CYP2C19 phenotype: CYP2C19 ultrarapid metabolizer:
For increased metabolism when compared with extensive metabolizers, initiate therapy with recommended starting dose. If patient does not respond to recommended maintenance dosing, consider alternative drug not predominantly metabolized by CYP2C19. (Optional)
CYP2C19 extensive metabolizer:
For normal metabolism, initiate therapy with recommended starting dose. (Strong)
CYP2C19 intermediate metabolizer:
For reduced metabolism when compared with extensive metabolizers, initiate therapy with recommended starting dose. (Strong)
CYP2C19 poor metabolizer:
For greatly reduced metabolism when compared with extensive metabolizers,
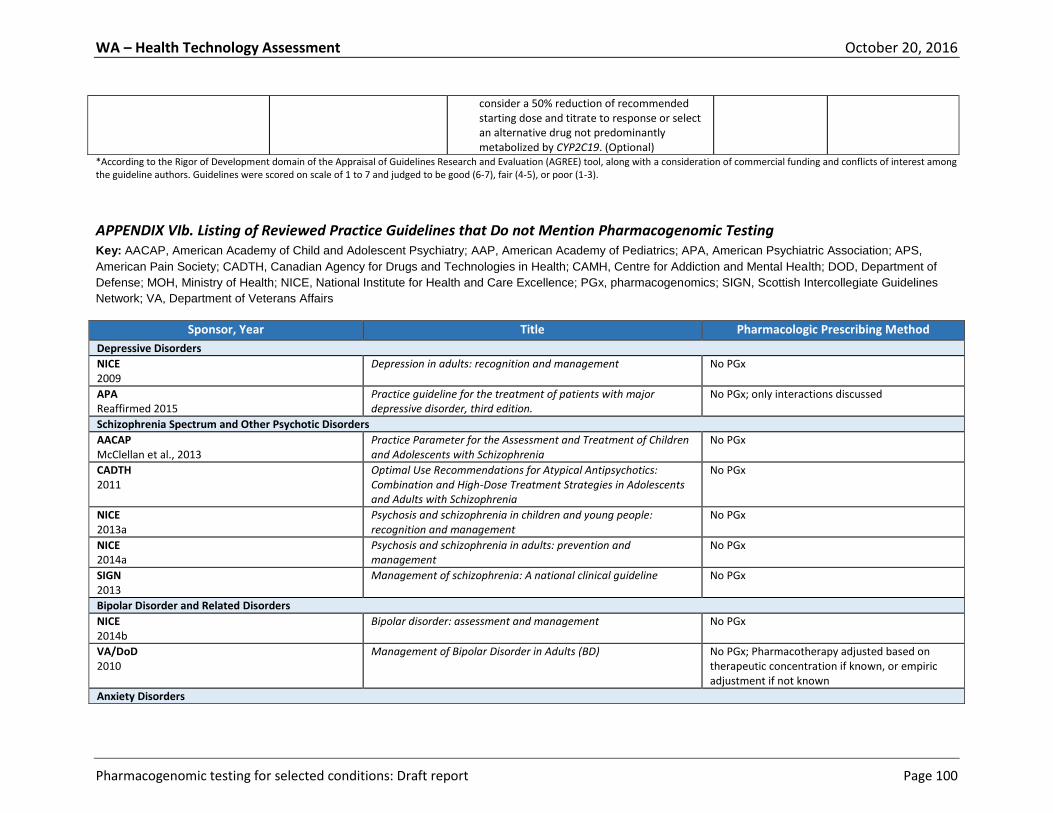
WA – Health Technology Assessment October 20, 2016
Pharmacogenomic testing for selected conditions: Draft report Page 100
*According to the Rigor of Development domain of the Appraisal of Guidelines Research and Evaluation (AGREE) tool, along with a consideration of commercial funding and conflicts of interest among the guideline authors. Guidelines were scored on scale of 1 to 7 and judged to be good (6-7), fair (4-5), or poor (1-3).
APPENDIX VIb. Listing of Reviewed Practice Guidelines that Do not Mention Pharmacogenomic Testing Key: AACAP, American Academy of Child and Adolescent Psychiatry; AAP, American Academy of Pediatrics; APA, American Psychiatric Association; APS,
American Pain Society; CADTH, Canadian Agency for Drugs and Technologies in Health; CAMH, Centre for Addiction and Mental Health; DOD, Department of
Defense; MOH, Ministry of Health; NICE, National Institute for Health and Care Excellence; PGx, pharmacogenomics; SIGN, Scottish Intercollegiate Guidelines
Network; VA, Department of Veterans Affairs
Sponsor, Year Title Pharmacologic Prescribing Method
Depressive Disorders
NICE 2009
Depression in adults: recognition and management No PGx
APA Reaffirmed 2015
Practice guideline for the treatment of patients with major depressive disorder, third edition.
No PGx; only interactions discussed
Schizophrenia Spectrum and Other Psychotic Disorders
AACAP McClellan et al., 2013
Practice Parameter for the Assessment and Treatment of Children and Adolescents with Schizophrenia
No PGx
CADTH 2011
Optimal Use Recommendations for Atypical Antipsychotics: Combination and High-Dose Treatment Strategies in Adolescents and Adults with Schizophrenia
No PGx
NICE 2013a
Psychosis and schizophrenia in children and young people: recognition and management
No PGx
NICE 2014a
Psychosis and schizophrenia in adults: prevention and management
No PGx
SIGN 2013
Management of schizophrenia: A national clinical guideline No PGx
Bipolar Disorder and Related Disorders
NICE 2014b
Bipolar disorder: assessment and management No PGx
VA/DoD 2010
Management of Bipolar Disorder in Adults (BD) No PGx; Pharmacotherapy adjusted based on therapeutic concentration if known, or empiric adjustment if not known
Anxiety Disorders
consider a 50% reduction of recommended starting dose and titrate to response or select an alternative drug not predominantly metabolized by CYP2C19. (Optional)

WA – Health Technology Assessment October 20, 2016
Pharmacogenomic testing for selected conditions: Draft report Page 101
Sponsor, Year Title Pharmacologic Prescribing Method
MOH Singapore 2015
Clinical Practice Guidelines: Anxiety Disorders
NICE 2011a
Generalized anxiety disorder and panic disorder in adults: management
No PGx
NICE 2013b
Social anxiety disorder: recognition, assessment and treatment No PGx
Attention Deficit/Hyperactivity Disorder
AAP 2011
ADHD: Clinical Practice Guideline for the Diagnosis, Evaluation, and Treatment of Attention-Deficit/Hyperactivity Disorder in Children and Adolescents
No PGx; describes % response, trial z error approach
NICE 2008
Attention deficit hyperactivity disorder: diagnosis and management
No PGx
Substance Use Disorders
APS Chou et al., 2014
Methadone Safety: A Clinical Practice Guideline From the American Pain Society and College on Problems of Drug Dependence, in Collaboration With the Heart Rhythm Society
No PGx; only interactions discussed
CAMH Handford et al., 2012
Buprenorphine/Naloxone for Opioid Dependence: Clinical Practice Guideline
No PGx
NICE 2011b
Alcohol-Use Disorders: Diagnosis, Assessment, and Management of Harmful Drinking and Alcohol Dependence
Does not address pharmacological interventions
VA/DoD 2015
VA/DoD Clinical Practice Guideline for the Management of Substance Use Disorders
No PGx; all treatments by recommended or empiric dosing
Other
AACAP 2011
Practice Parameter for the Use of Atypical Antipsychotic Medications in Children and Adolescents
No PGx