Embed Size (px)
Citation preview
An IMAPHEALTHCAREReport
Pharmaceuticals & Biotech Industry Global Report — 2011

www.imap.com
Through a proprietary mix of global reach, local market knowledge, superior client service, exceptional market analytics, a customized-team approach, and familiarity with the biotechnology and pharmaceutical industries, IMAP has developed a formula for ensuring your next M&A project succeeds.
Our formula for cross-border M&A is so effectivewe’d patent it if we could.
EVERY BUSINESS DAY, SOMEWHERE IN THE WORLD, AN IMAP ADVISOR IS CLOSING AN M&A TRANSACTION.

IMAP’s Pharma & Biotech Industry Global Report 2011: Page 1
P H A R M A & B I O T E C H I N D U S T R Y G L O B A L R E P O R T — 2 0 1 1
ContentsPharma on acquisition spree . . . . . . . . . . . . . . . . . . . . . . . . . . . . . . . . . . . . . . . . . . . . . . . . . . . . . . . . . . . . 2
Global Pharma Sector . . . . . . . . . . . . . . . . . . . . . . . . . . . . . . . . . . . . . . . . . . . . . . . . . . . . . . . . . . . . . . . . . . . 3 2011 — Transformation proceeds . . . . . . . . . . . . . . . . . . . . . . . . . . . . . . . . . . . . . . . . . . . . . . . . . . . . . . . . . . . . . . . 3
Post 2011 . . . . . . . . . . . . . . . . . . . . . . . . . . . . . . . . . . . . . . . . . . . . . . . . . . . . . . . . . . . . . . . . . . . . . . . . . . . . . . . 4 Patent cliff . . . . . . . . . . . . . . . . . . . . . . . . . . . . . . . . . . . . . . . . . . . . . . . . . . . . . . . . . . . . . . . . . . . . . . . . . . . . . . . . . . . . . . . . 4 Patent cliff’s impact depends on many factors . . . . . . . . . . . . . . . . . . . . . . . . . . . . . . . . . . . . . . . . . . . . . . . . 4 Price cuts and reimbursement restrictions continue to limit growth . . . . . . . . . . . . . . . . . . . . . . . . 5 Growing regulatory pressures . . . . . . . . . . . . . . . . . . . . . . . . . . . . . . . . . . . . . . . . . . . . . . . . . . . . . . . . . . . . . . . . . . 5
Move to emerging markets — a major growth driver for the pharma industry . . . . . . . . . . . . 6 Tier 1: China — in a league of its own . . . . . . . . . . . . . . . . . . . . . . . . . . . . . . . . . . . . . . . . . . . . . . . . . . . . . . . . . . . . 6 Tier 2: Brazil, Russia, and India — hot on the heels . . . . . . . . . . . . . . . . . . . . . . . . . . . . . . . . . . . . . . . . . . . . . 6 Tier 3: Fast followers . . . . . . . . . . . . . . . . . . . . . . . . . . . . . . . . . . . . . . . . . . . . . . . . . . . . . . . . . . . . . . . . . . . . . . . . . . . . . 7
The epic problem: Low productivity of R&D pipelines . . . . . . . . . . . . . . . . . . . . . . . . . . . . . . . . . . . . 8 Medical differentiation is a must. . . . . . . . . . . . . . . . . . . . . . . . . . . . . . . . . . . . . . . . . . . . . . . . . . . . . . . . . . . . . . . . 8 Flexible organizations and rapid process . . . . . . . . . . . . . . . . . . . . . . . . . . . . . . . . . . . . . . . . . . . . . . . . . . . . . . . 9
Oncology — a special case . . . . . . . . . . . . . . . . . . . . . . . . . . . . . . . . . . . . . . . . . . . . . . . . . . . . . . . . . . . . . . 9
Biosimilars — an emerging opportunity . . . . . . . . . . . . . . . . . . . . . . . . . . . . . . . . . . . . . . . . . . . . . . . . 10
Snap shots of Big Pharma . . . . . . . . . . . . . . . . . . . . . . . . . . . . . . . . . . . . . . . . . . . . . . . . . . . . . . . . . . . . . . . 11
Future Outlook . . . . . . . . . . . . . . . . . . . . . . . . . . . . . . . . . . . . . . . . . . . . . . . . . . . . . . . . . . . . . . . . . . . . . . . . 13
Statistical reference (Appendices) Appendix A: The pharma and biotech industry structure . . . . . . . . . . . . . . . . . . . . . . . . . . . . . . . . . . . . A-i Appendix B: Summary of M&A transactions . . . . . . . . . . . . . . . . . . . . . . . . . . . . . . . . . . . . . . . . . . . . . . . . . B-i Appendix C: Pharmaceutical market overview and trends . . . . . . . . . . . . . . . . . . . . . . . . . . . . . . . . . . C-i Appendix D: Generic market overview and trends . . . . . . . . . . . . . . . . . . . . . . . . . . . . . . . . . . . . . . . . . . . D-i
An IMAPHEALTHCARE
Report
IMAP, Inc. is a Delaware corporation. Its regional firms are independently operating in various jurisdictions under a variety of legal forms of organization. References to IMAP transactions, offices, locations and other similar associations should not imply any form of IMAP ownership or agency over the local firms or cause any liability between the local firms and IMAP whatsoever.

IMAP’s Pharma & Biotech Industry Global Report — 2011: Page 2
2010 vs. 2009 2009 2010Transaction value (USD billion) 161.2 51.6Top 5 transactions 78.4% 38.3%Top 5 Countries in 2010 No. of transactions Value (USD mn)United States 114 25.6Germany 18 5.4India 48 4.9China 105 3.4Brazil 13 1.9
Source: Thomson M&A Database, IMAP
M&A Activities at a Glance
Pharma on acquisition spreeThe mega-merger boom of 2009 may have cooled, but pharma and biotech companies’ appetite for M&A barely dimmed last year. The pharma sector saw 548 deals valued at $51.5 billion USD in 2010, representing a sharp decline of 68 percent ($161.2 billion USD during the previous period with 563 deals). Dollar volume in this period included one major deal (Teva Pharma/Ratiopharm), which represented $4.9 billion USD or nearly 9.6 percent of the total. During the previous period, the largest deal was the acquisition of Wyeth by Pfizer for $67.9 billion USD.
In terms of transaction value, the United States and Europe led the way through mega deals, while China leads in micro-size deals of less than $20 million USD.
Global pharma players continue to penetrate the burgeoning emerging markets by acquisition of domestic generics and manufacturing companies, which accounted for nearly 50 percent of M&A targets for deals made during 2008 to 2010 in the emerging markets (compared to 21 percent of targets in North America, Europe, Australia and Japan) . The year 2010 also brought again a plethora of licensing deals as Big Pharma aims to secure future growth. In addition, these players try to get access to new niche markets through acquisitions.
Strategic mid-market buys, characterized as deals of $100 million to $500 million USD, are likely to remain one area of high intensity. Novartis acquired Aires Pharmaceuticals, whose focus is on cystic fibrosis and pneumonia, for $250 million USD. Over-the-counter (OTC) pharmaceuticals in emerging markets is another focal area. For example, sanofi-aventis boosted its OTC presence in China with the $520 million USD acquisition of BMP Sunstone in 2010, adding brands in the Chinese consumer healthcare market, including vitamin and mineral supplements and cough and cold treatments.
Consolidation and alliances will continue to transform the market as companies adapt to changing conditions within the industry. Pharma companies will turn to M&A to consolidate
their core businesses, and to get access to new areas of growth. With continued low interest rates and lots of cash on hand of the Big Players, M&A and licensing activity is bound to grow further in the future.
Hence, a significant growth in in-licensing activities and collaborations for the development of pipeline candidates will be seen. Instead of developing a product from scratch, which involves a lot of funds, pharma companies will increasingly shop for mid-to late-stage pipeline candidates. Accordingly, 91 percent of industry executives believe pharma-biotech mergers will increase in the next 10 years, and 69 percent also believe there will likely be increased consolidation between companies within the biotech sector1. Therapeutic areas such as oncology, central nervous system disorders, diabetes and immunology/inflammation could see a lot of licensing activity.
1 Survey conducted by Business Insights
US Europe Japan China Latin America RoW Total
Undisclosed Deals 47 79 16 26 7 64 239Up to 20 Million USD 21 24 6 58 2 55 16620 to 50 Million USD 13 10 2 13 5 17 6050 to 100 Million USD 11 7 2 3 2 4 29100 to 250 Million USD 10 3 0 2 1 4 20250 to 500 Million USD 4 5 1 2 1 0 13Above 500 Million USD 8 6 0 1 1 5 21Total 114 134 27 105 19 149 548
Source: Thomson M&A Database, IMAP

IMAP’s Pharma & Biotech Industry Global Report 2011: Page 3
Global Pharma Sector
2011 – Transformation proceeds
Total World Market Growth Rate
Source: IMS Health, IMAP
Global Pharmaceutical Market Estimate
USD
Bill
ion
CAGR: 6.5%
781 808
875
920 990 1,060
1,140 1,200
1,000
800
600
400
200
02014E2013E2012E2011E2010E20092008
10%
8%
6%
4%
2%1%0%
9%
7%
5%
3%
The global pharmaceutical market in 2010 is expected to grow by 8.3 percent and will reach a level of $875 billion USD, driven by stronger near-term growth in the US market1. In 2009, the pharmaceutical market grew only 3.5 percent with market size of $808 billion USD.
At present, the global pharmaceutical market is dominated by the US, which accounts for about 28 percent of global sales in 2009, followed by the EU, accounting for nearly 15 percent, and Japan for 12 percent. Together, these three markets represent nearly 55 percent of the global market.
While the performance of the global pharmaceutical market is more positive in 2010 than in 2009, the fundamental dynamics of the innovation cycle and funding pressures will result in mid-single-digit growth over the next five years. Notwithstanding the improved prospects in the US market, the pressure on pharma companies to adapt to the longer-term marketplace trends and evolving patient needs remains undiminished.
Due to many patent expirations, the generic drug industry has experienced great growth in the past few years. The global market for generic drugs was worth $107.8 billion USD in 2009 and is projected to reach $129.3 billion USD by 2014 with a CAGR of 9 percent. Rising cost pressure on healthcare has resulted in an increase in generic pharmaceutical usage — generic drugs cost 30 to 80 percent less than their original equivalents.
1 Intercontinental Marketing Services (IMS) Health
Although patent expirations and limits on drug spending can hamper growth of drug sales in developed countries, global pharmaceutical sales are nonetheless expected to grow 5–7 percent in 2011 and the market is to reach $880 billion USD in 2011. Much of the rise will come from the 17 ‘pharmerging’ markets2, where sales are forecast to grow at 15–17 percent to $170–180 billion USD, boosted by greater government spending on healthcare. A great majority of the expansion is driven by explosive growth in China, the world’s third-largest market for pharmaceutical sales. A great slowdown will be seen in the five major European markets (France, Germany, Italy, Spain and the UK), along with Canada, with minimal growth of 1–3 percent. The US will continue to remain the single largest pharmaceutical market, with sales of $320–330 billion USD, up 3–5 percent.
Drugs with sales of more than $30 billion USD are expected to face generic competition in 2011 with Lipitor accounting for $11 billion USD. Government will continue to try to reduce drug costs. Illustrative are the sizable cuts in the price of generics in comparison to their original equivalents in Spain and in Canada. There will also be new price negotiations in Germany and cost cuts for original products in Greece and Turkey. It will also be a crucial year for understanding how healthcare reform efforts in prominent markets develop and shape up amid the foreseen macroeconomic rebound. For pharmaceutical manufacturers, an incessant focus on attaining distinct value to patients and health systems will be important to managing this dynamic market.
2 Emerging markets targeted by pharmaceutical companies (Pharm(aceutical) + (e)merging). List of Pharmerging countries includes Argentina, Brazil, China, Egypt, India, Indonesia, Mexico, Pakistan, Poland, Romania, Russia, South Africa, Thailand, Turkey, Ukraine, Venezuela and Vietnam

IMAP’s Pharma & Biotech Industry Global Report — 2011: Page 4
In the long run, the global pharmaceutical market is expected to grow at a 5-8 percent CAGR through 2014, taking into account the impact of the changing mix of innovative and mature products and the rising healthcare access in emerging markets, and on the other hand, the price pressure by regulators in developed countries. Consequently, the global pharmaceutical market is expected to expand to $1.1 trillion USD by 2014. The pharmerging countries are expected to grow by 13-16 percent over the next five years. China's pharmaceutical market is expected to continue to grow at a pace of more than 20 percent annually.
During the next five years, markets will be impacted by numerous payer actions, including the imposition of price cuts on existing drugs, the raising of standards required to achieve reimbursement of innovative therapies, and the use of economic incentives for prescribers and pharmacists to drive a shift to generic equivalents. Evidence of the value that medicines bring to healthcare systems will be required to achieve access and funding in both developed and emerging markets.
Patent cliffPatent cliff describes what happens to the sales of an original drug when its protection (patent, regulatory, etc.) ceases: A dramatic drop in sales both due to declining unit numbers, but also a price erosion of up to 70 percent within months. Patent cliff will fundamentally impact individual pharma companies in the mid-term future: During the next five-year period (2010-
2014), the revenues of drugs having patents that will expire are about $89.5 billion USD1, the majority of them small molecules. (In the five-year period from 2005-2009, this value was $90.5 billion USD).
In 2011 the world’s biggest selling drug, Lipitor, will go off-protection. Other drugs that lose protection in 2011 are Plavix, which is used to inhibit blood clots; Actos, which treats diabetes; and Seroquel and Zyprexa, two drugs that treat schizophrenia and bipolar disorder. Revenues hammered by patent cliffs can only partially be compensated by newly launched products, e.g. in indications such as osteoporosis, respiratory illnesses, thrombosis, multiple sclerosis and cancer.
Patent cliffs' impact depends on many factorsThe speed and degree of sales erosion when falling down patent cliff are not equal across countries, prescription setting, and therapy area and formulation type. On average, small molecule originals in the US witnessed the most severe sales erosion on patent expiry. In some countries, off-protection products don’t even get generic competition, particularly if the original’s sales are relatively small. After the US, sales erosion due to patent cliff was next highest in the UK, Germany and France, and was the lowest in Australia, Italy, Russia, Spain and Japan. Originals did not see massive drops in sales upon patent expiry in China, since they often were exposed to generic competition from the outset.
1 IMS Health Midas
Post 2011...

IMAP’s Pharma & Biotech Industry Global Report 2011: Page 5
Price cuts and reimbursement restrictions continue to limit growthGovernments around the world are grappling to arrive at solutions for health account deficits. Political pressures have increased during the past economic crisis. Actions mainly address treatments for nonlethal indications with large patient numbers, decreasing profit margins. Hence, pharma companies have adapted their strategies: Many pharma companies have altered their drug portfolios from primary care driven blockbusters towards specialties such as oncology, immunology and inflammation, where the medical need is so high that prices are more easily accepted by the regulators.
Price cuts and reimbursement restrictions present in both developed and emerging markets
Source: Datamonitor, IMAP
France: Introduction of a low (10-20%) reimbursement group
Brazil: Cost containment pressures may result in cuts in the drugs' budget
Spain: Use of price cuts and reference groups to reduce the drugs' bill
India: Potential expansion of drug price controls from 74 to all 354 drugs on the essential medicines list
Germany: Introduction of a cost-effectiveness analysis impacting reim-bursement decisions
Russia: Stricter drug price regulation
China: 12% drug price cut
US: Expanded support for comparative effectiveness research, Increased Medicaid Part D donut hole discounts if the reform bills are passed
Japan: 5.75% across the board price cut, Changes to the average over-seas price calculation aimed at reducing launch prices
UK: Continued use of risk-sharing schemes (effective drug discounting) for expensive drugs • Flexible drug pricing to
maximize overall returns• Increased price elasticity
with focus on volume• Lower prices for emerging
markets• Move away from large
physician-targeting sales force to payer- and patient-centric sales model
• Drug portfolios to match unmet needs
• Disruptive rather than incremental innovation
• Demonstrate monetary value of a treatment path-way in addition to efficacy of an individual drug
• Offer disease manage-ment solutions
• Downward price pressures• Difficult to obtain desired reimbursement
Cost-containment focuses on price cuts and reimbursement restrictions
Growing regulatory pressuresThe FDA Amendments Act of 2007 has forced the FDA to increase standards for approvals of new drugs, introducing mandatory risk evaluation and mitigation strategies (REMS). This is one example of a long-term, global trend of ever higher hurdles for new drugs to be approved, with the corresponding high failure rates and costs associated. Ever tougher demands on pharmacovigilance systems increase the regulatory burden on pharma companies’ internal systems once the new drugs have been granted marketing authorization. Pharma companies are also under the lens for their marketing practices, forcing them to adapt their promotional models.
Although the greater cooperation between the regulators in different markets will ultimately be advantageous for the pharma industry as a whole due to streamlining development and approval requirements and reducing costs, in the near term it could cause spread of approval restrictions around markets.
On the other hand, protection and enforcement of IP rights remains a difficult issue in many emerging markets, with counterfeit and first-copy products rife. For example, India’s patent system fails to reach the required standard, with the recent rejection of the patent for Bayer’s Nexavar (sorafenib) as one notable example. Unless such issues are sorted out, pharma companies must adapt their drug portfolios and commercialization strategies to the particular local market conditions.
List of Pharmerging Countries
Tiers Countries
2009 GDP based on PPP valuation (Trillion USD)
Incremental Pharma Market Growth from 2009-13 (Billion USD)
Tier 1 1: China 9 40B+
Tier 22: Brazil3: Russia4: India
2-4 5-15B
Tier 3
5: Venezuela6: Poland7: Argentina8: Turkey9: Mexico10: Vietnam11: S. Africa
12: Thailand13: Indonesia14: Romania15: Egypt16: Pakistan17: Ukraine
<2 1-5B
Source: IMS Health, IMAP

IMAP’s Pharma & Biotech Industry Global Report — 2011: Page 6
The dynamic and high-potential pharmerging markets offer tremendous opportunities for drug manufacturers. Big Pharma’s drive into a group of high-potential “pharmerging” markets has continued to gather momentum. The market research organization IMS Health categorizes the market in Tier 1, Tier 2 and Tier 3 pharmerging markets1. Collectively, these markets have been steadily gaining share at the expense of the US and top five European countries (France, Germany, Italy, UK and Spain), accounting for close to 34 percent of global growth in 2009.
Eight pharmerging countries are amongst the top 20 world pharmaceutical markets, and China is likely to become one of the “top three” in the near future. This forces pharma companies to adapt their historically grown launch plans. As of today, their performance in the pharmerging region has been mixed. A few high-profile pharmaceutical companies have been able to gain a foothold, with some of them having notable success. Recent strategic moves include Abbott’s acquisition of Piramal Healthcare in India — a deal that could potentially make the US giant the top player in this country; GSK’s and Lilly’s announcements to double revenue in emerging markets by 2015; Pfizer’s discount-card system in Russia, offering drug price cuts of up to 50 percent; and the purchase of Medley, Brazil’s third-largest pharmaceutical company by Sanofi Aventis. Those pharma companies that fail to enter pharmerging countries run the risk of leaving significant untapped revenue potential on the top-line.
Positive developments in the pharmerging markets, such as greater government investment in healthcare, increasing demand for drugs to treat diseases and strengthening of regulatory and IP requirements, enable global players to launch their products in pharmerging markets: The time lag of drug launch between the first global launch and the first entry into a pharmerging market has halved in the past decade from 2.5 years to 1.25 years. Among all pharmerging markets, Brazil is a preferred destination for drug launch.
Over all, most global drug companies remain under-exposed and underperforming in the pharmerging markets. In 2009 the world’s top 15 pharmaceutical manufacturers derived just 0.9 percent of their combined revenues from China; 2.9 percent from Tier 2 markets of Brazil, India and Russia; and 5.6 percent from Tier 3 markets2. In many cases, this reflects a continued focus on the premium section of the market rather than the typically larger branded generics segment. There are signs that this is beginning to change with some providers of original drugs now exploring options for operating in the generics sector.
1 Pharmerging Shake-up, IMS Health, 2010. Tier 1 (China); Tier 2 (Brazil, Russia, India); Tier 3 (Venezuela, Poland, Argentina, Turkey, Mexico, Vietnam, South Africa, Thailand, Indonesia, Romania, Egypt, Pakistan, Ukraine)
2 IMS Health MIDAS Mat Sept 09
Move to emerging markets — a major growth driver for the pharma industry
Tier 1: China – in a league of its ownGiven absolute GDP of $9.1 trillion USD in 2009 and a pharmaceutical market that is estimated to drive $40 billion USD in growth through 2013 , China is leading the pharmerging markets. Driven by aggressive government spending on healthcare and an increasing demand for drugs to treat chronic illnesses, China’s pharmaceutical market expanded at an astonishing 20 percent in 2009. A landmark $125 billion USD incremental government funding is at the heart of the healthcare transformation, targeting substantial improvement to the nation’s healthcare infrastructure, a move which is projected to double the size of China’s pharmaceutical market by 2013. Nevertheless, the operating environment remains complicated and a challenge along with local competition, government intervention on drug pricing and uncertainty of healthcare reforms. On the corporate radar, Bayer’s incremental growth is attributed to investments in China and Turkey and its capacity to adapt to the local market environment. By investing in products such as Glucobay for diabetes and Adalat for hypertension, the company has achieved a dominant position in these high-growth therapy areas and now derives 3 percent of global revenues from China. Other factors such as superior local execution capabilities and a stable senior leadership team have also played a key role in Bayer’s success in this market. Following Bayer’s success, Novartis has committed to investing $1 billion USD in R&D in China and $125 million USD to buy 85 percent stake in a privately held vaccine company.
Tier 2: Brazil, Russia, and India — hot on the heelsGiven a GDP of $2-4 trillion USD in 2009, Brazil, Russia and India are each expected to add $5 billion-$15 billion USD to the pharmaceutical market through 2013. Brazil has achieved consistent double-digit pharmaceutical growth over the last few years, at 20 percent in 2008. The market benefits from a high percentage (85 percent) of city dwellers with higher access to medicines, and 90 percent of the population covered by public health insurance. However, out-of-pocket healthcare costs are high and the distribution of income is highly skewed, limiting the number of people who can afford novel therapies. The local environment has seen a number of recent changes including growing competition from generic drugs, increased government investment in state-owned pharmaceutical enterprises and greater emphasis on cost-restricting initiatives that favor local businesses. A prominent example of investment by global pharma players includes Sanofi-Aventis’ acquisition of Medley in Brazil and Kendrick in Mexico, which made the French company a leader in the Latin American market.

IMAP’s Pharma & Biotech Industry Global Report 2011: Page 7
The Russian market has also seen high double-digit growth in recent years and offers potential from increased private insurance and positive developments in the reimbursement system. While health awareness is increasing, poor knowledge of prevention, diagnosis and treatment at primary-care level and the overall lack of clinical standards and guidelines hinder successful management of chronic diseases. High prices, rising government influence over drug prescriptions and powerful lobbies in favor of local businesses further characterize this market. One example of how Big Pharma acts on this market of interest is Pfizer’s discount-card system offering drug price cuts of up to 50 percent. Among the early movers were Switzerland-based Nycomed, which entered the Russian market in the early 1990s, and is now ranked No. 11 among Russian pharmaceutical companies. Local adaptation has also enabled Novartis to become the leading player in Russia with its success attributed to its strong focus on OTC and generics, local acquisitions, a solid base of human resources and a strong commitment to establishing local government relationships.
In India a number of recent developments, such as establishment of intellectual property rights (IPR), a rapidly growing middle-class population, emerging rural markets and improvements in medical infrastructure have benefitted outside manufacturers. The worrisome part is the lack of enforcement of the IPR regulations. Competition from copycat generics and low-cost biosimilars is a prominent feature of this market in the absence of a stringent approval process. Examples of Big Pharma’s entry here include Abbott’s acquisition of Piramal Healthcare.
Tier 3: Fast followersTier 3 markets, following the footsteps of Tier 1/Tier 2 markets, are a group of 13 countries. With GDP of around $2 trillion USD in 2009, with each nation expected to contribute $1-5 billion USD up to 2013 , these lesser known pharmaceutical markets offer rich opportunities for growth. Amongst all, Romania has been a consistently high-performing market
compared to its Central and Eastern European (CEE) peers and is currently growing at around 23 percent. Constraint in healthcare budgets and challenging new price regulations notwithstanding, a number of big changes will beneficially impact the pharmaceutical sector over the next few years. Although highly fragmented and with ongoing concerns over drug registration and IP protection, Vietnam is also an attractive market. There are increasing opportunities in the 65-plus patient category, a burgeoning private insurance market and increased public funding that will significantly boost growth in the hospital sector. Egypt, too, offers rising potential with a fast-growing population, widespread access to healthcare, significant growth in the dominant retail market and a relatively quick drug approval process. Argentina’s combination of high healthcare spending, an attractive market access environment, and expanding elderly population are all conducive to increased sales growth despite IP issues, public sector inefficiencies and a good number of uninsured patients.
To remain profitable amid slowing sales to 2014, pharma companies have to implement deep cost-cutting measures — for many players, a new experience. Cost cutting not only targets R&D but also sales and corporate business units.
Cost effectiveness is also one driver for mega M&A deals, to create benefits of scale. Mega-merger deals in 2009 of Pfizer-Wyeth and Merck-Schering-Plough will offer cost reliefs of $4 billion USD and $3.5 billion USD, respectively, until 2014 by reducing expenditure on marketing and administration, manufacturing and R&D.
Sales staff has felt the brunt of the sector’s cost saving initiatives. In 2009, 67,000 employees were lost across just 10 pharma companies.
Cost-cutting in R&D is much more tricky. The general feeling is that the R&D engines as a whole need a complete overhaul; however, no large player seems to have found a recipe to make innovation more cost-effective.

IMAP’s Pharma & Biotech Industry Global Report — 2011: Page 8
The epic problem: Low productivity of R&D pipelinesDespite a number of special efforts to bring pharma R&D back to higher productivity levels, the pace of innovation remains anemic: The long-term average is merely one new remedy drug a year per company. Despite R&D spending at a high of 18 percent of revenues, Big Pharma’s R&D productivity declined by 20 percent between 2001 and 20071.
However, large players increasingly find that shopping for innovation externally won’t help close the gap. Recent Bain analysis of 6,000 biotech projects, available for late-stage licensing, shows that only about 200 are likely candidates for a large pharma company. Of these, fewer than 100 show potential to become top-sellers; and taken together, they account for only about $30 billion USD in potential revenue.
As pipelines dry out, many companies have started to experiment with new R&D models. For example, GlaxoSmithKline has restructured its R&D centers to emulate biotech R&D culture. The company hopes to replicate an entrepreneurial culture in a large pharma organization. Eli Lilly acquired ImClone to source innovation from outside the company and then left it as a stand-alone unit operating independently, much as Roche did extremely successfully with Genentech. Pfizer and GSK broke down corporate barriers to share intellectual property and assets to develop new drugs for diseases such as HIV. Several pharma companies
1 McKinsey Quarterly
are partnering with leading academic institutions to promote innovation from basic research.
The jury is still out on whether these efforts prime the innovation pump enough, however. Broadly, to raise innovation returns back to the level that prevailed in the era of blockbusters, pharma companies need transformational change. Pressing areas of improvement for pharma companies are: increasing managerial autonomy; aligning research goals with incentives; attracting and retaining the right, creative talent; minimizing bureaucracy; and creating flexible organizations.
Medical differentiation is a mustAs most single-cause conditions with large patient relevant populations in mature and emerging markets can be addressed today by generic drugs, pharma companies will need a higher degree of medical differentiation to successfully introduce new products into the market. A showcase is Genentech in oncology. In the 1990s, the pipeline for cancer treatments got crowded with pharma companies developing ever newer chemotherapies with little therapeutic difference. Instead of becoming a “me too,” Genentech concentrated on changing the way cancer is treated. With the help of PDL’s humanization technology, it developed treatments based on humanized monoclonal antibodies—a technology that most pharma companies considered too complicated. The company’s researchers focused on understanding tumor biology and set goals to take patient outcomes to a new level. With this, Genentech gained market leadership along with being able to price its therapies several times higher than pharma’s marginally improved options.
In today’s market, differentiation is more important than ever. Big Pharma’s customers increasingly are payers (very often government units) and patients who care about two criteria: health outcomes and affordability.

IMAP’s Pharma & Biotech Industry Global Report 2011: Page 9
Flexible organizations and rapid processAs organizations grow and expand, they adopt more complex structures and processes. Over time, complexity becomes a drag on the quality and speed of decision making. Industry experts stress that Big Pharma must develop incentives that reward rapid learning, testing and adaptation from pilot projects. To make the approach work, a good first step is to dismantle the pharma company’s functional staffing model and replace it with a more flexible human resource model. Companies such as the UK’s Vernalis or Big Pharma-backed initiatives such as Chorus have established virtual development as a viable and often more effective and efficient development model. Chorus, which was set up by Eli Lilly as an autonomous division, advanced more than two dozen molecules through candidate identification and Phase I, at median cycle times that were 40 to 60 percent faster than the industry average. Thus, these companies manage costs better by limiting full-time employees, reducing fixed assets and clamping down on overheads; their flexibility and lean structure helps them to become sharper in successful innovation or quickly move on to the next promising idea.
Another company, Shire Pharmaceuticals, is a good example of a virtual company. It outsources almost everything that a normal pharma company does, i.e., discovery, medical monitoring, data management, statistics and medical writing. With the exception of its genetic therapy division, every product it develops has been purchased from an outside source, via in-licensing or acquisition.
Cancer has rising therapeutic and commercial importance, as more than 20 million new cases of cancer are predicted in 2025, compared with 12 million in 20081. The oncology drug market has grown impressively, driven by expanding patient populations and technological advances, especially in biomolecular medicine. Current treatments are better-tolerated and more effective than ever before. The innovative products on the market will drive double-digit annual growth in the upcoming period. Moreover, approximately 25 to 30 new anti-cancer agents are expected to be approved for a variety of new indications, helping to expand the treated patient population.
1 WHO
With this positive scenario, global sales of cancer drugs will grow at a CAGR of 12 to 15 percent, reaching $75-80 billion USD by 20122 from $48 billion USD in 2008. The factors that are driving the tremendous growth include the increasing number of cancer patients on chemotherapy in Europe, Japan and North America, i.e., mainly developed markets, and more patients in emerging markets gaining access to modern targeted therapies. Currently, around 70 percent of the revenues come from the US and Europe’s top five markets, namely, France, Germany, Italy, the UK and Spain.
2 IMS Health, 2009
Oncology – a special case
Projected Top 5 Oncology Products Worldwide in 2016
Source: EvaluatePharma®, April 2010
Rank Product Generic Name Company Pharma Class Sales CAGR Market Share Current Status2009 2016 2009-16 2009 2016
1 Avastin bevacizumab Roche Anti-VEGF MAb 5,744 8,909 6.5% 11.3% 12.2% Marketed
2 Rituxan rituximab Roche + Biogen Idec Anti-CD20 MAb 5,620 6,788 2.7% 11.1% 9.3% Marketed
3 Herceptin trastuzumab Roche Anti-HER2 MAb 4,862 6,167 3.5% 9.6% 8.5% Marketed
4 Alimta pemetrexed sodium Eli Lilly Thymidylate synthase inhibitor 1,706 3,275 9.8% 3.4% 4.5% Marketed
5 Erbitux cetuximab BMS + Merck KGaA + Lilly Anti-EGFr MAb 1,654 2,513 6.2% 3.3% 3.5% MarketedNOTE: Oncology Includes: Alkaloids, Alkylating agents, Anti-metabolites, Anti-neoplastic MAbs, Cytotoxic antibiotics, Hormone therapies, Platinum compounds and other anti-cancer. Adjusted to include Provenge (currently classified as an immunostimulant). Excludes anti-emetics and anti-anaemics used in chemotherapy-induced anaemia. Also excludes: Interferons, immunostimulants (e.g Revlimid (CELG) [2016 Sales: $4.8bn], Afinitor (NVS) [$1.6bn]) & immunosuppressants.
Drivers and Inhibitors for Pharma Industry
Drivers Inhibitors
Emerging market expansion: growth potential of 12% year-on-year
The patent cliff: Pharma set to lose 89.5 billion USD between 2009 and 2014
Biologics market expansion: biologics set to grow by $41 billion between 2009 and 2014
Price and reimbursement cuts: continued use in developed and emerging markets to contain costs
New R& D modelsGrowing regulatory pressure: focus on drug safety and restrictions of pharma marketing continue

IMAP’s Pharma & Biotech Industry Global Report — 2011: Page 10
The first biotech drugs having gone off-patent (e.g. the $9 billion USD EPO) have created a new market: biosimilars. For several years, market introduction of biosimilars was hindered by unclear regulatory guidelines. For generic drugs (small mol-ecules), a simple bioequivalence study with 20 patients costing $1-3 million USD is sufficient to get marketing authorization. For biosimilars (equivalents of off-patent biotech drugs), the regula-tory demands are much higher, requiring full-blown phase I and III studies for each production line, as small changes in manufactur-ing can substantially impact the medical outcome.
With the issuance of the guidelines for biosimilar drug approval, the EU has taken the lead on the biosimilar front. It has also become the testing ground for biosimilar drugs, with three biosimilars having entered the market — hGH, EPO and filgrastim. All three were first launched in Germany, the largest generics market in Europe, with one of the highest levels of uptake. The generic-friendly nature of the German market, driven by strong payer pressure, makes a favorable scenario for the biosimilars segment. Indeed, the German biosimilars market will contribute to almost half of all seven major market biosimilars volume sales through 2012, beyond which it will be overtaken by the US biosimilars market1.
The US market represents the greatest opportunity for the emerging biosimilars industry, and is forecast to constitute nearly 90 percent of the seven major market biosimilars volume market in 2014. The size of the US market, combined with typically high generic substitution that characterizes it, makes it an attractive prospect for potential biosimilars players. However, how fast this market can develop, and how many players can participate, depends on the biosimilars approval pathway.
Although guidance for biosimilars approval was issued in Japan in 2009, this market is unlikely to experience significant biosimilars incursion through the period of 2010 to 2014, contributing 2 percent at most. The historically slow uptake of conventional small-molecule generics suggests that biosimilars will face an uphill struggle in Japan, where distrust of the quality and efficacy of generic drugs from all key stakeholders has hindered uptake to date.
Through 2015, biologic drugs worth more than $80 billion USD in global sales will lose patent protection, presenting a major opportunity2. Given this potential, Big Pharma companies are poised to enter the biosimilars market. Even the larger generics players are in danger of being overtaken by the originator drug companies, with Merck & Co., AstraZeneca and Eli Lilly all look-ing to carve out a share for themselves in the biosimilars market.
Merck is set to enter the biosimilars market in 2012 and intends to become a key player in the biologic and emerging biosimilars sector, using proprietary "Glyco" technology, acquired in 2006. 1 Datamonitor Research2 Yanai, 2009
Biosimilars – an emerging opportunity
The system will be used by Merck to create innovative biologics, in addition to biosimilars, with the recently created Merck BioVentures responsible for the latter. In February 2009, Merck acquired the Colorado biologics facility and biosimilars pipeline of Insmed for $130 million USD, which the company was on track to bring to the US market immediately on patent expiry — in 2013 and 2015, respectively. Also, it intends to conduct full clinical trials for its first biosimilars, anticipating that the US biosimilars approval pathway will be a fairly stringent one.
AstraZeneca and Eli Lilly are also committed to entering the biosimilars market. In December 2008, AstraZeneca’s CEO David Brennan suggested that the company may move into the biosimilars industry, stating that it was ideally positioned to do so, and would be watching events in the US closely. The company’s Med Immune facilities were cited as being "well equipped" for biosimilars production, should legislation go through in the US.
Subsequent to Eli Lilly’s acquisition of ImClone in October 2008, the company is now the fifth largest biotech company, with biologics constituting more than half its pipeline. The $6.5 billion price tag of ImClone underlines Eli Lilly’s commitment to entering the biotech arena, with the company’s CEO indicating that biosimilars were definitely an opportunity to be pursued. Because biosimilars have yet to be included in the company’s pipeline, it is anticipated that Eli Lilly may well be a late entrant to the arena; however the company’s considerable biotech know-how, acquired via ImClone, will compensate for this to an extent.
By acquiring Ranbaxy, Daiichi-Sankyo has gained a certain degree of biosimilars know-how, through the Ranbaxy’s associa-tion with Indian biotech company Zenotech. Ranbaxy entered into collaboration with Zenotech over a period of two years prior to acquiring a stake in the company in 2007. Zenotech has three biosimilars on the Indian market with a pipeline reportedly repre-senting a third of the $65 billion USD global biologics market.
Another interesting development is the joint venture between Teva and contract manufacturing giant Lonza. This gives Teva access to the most important assets in the biosimilar game, production expertise and capacity.

IMAP’s Pharma & Biotech Industry Global Report 2011: Page 11
Sanofi-AventisDuring the last five years, the Sanofi-Aventis’ performance is outstanding with revenue growth of 24.1 percent over the period . While the revenue growth remained above industry average, the impact of generic competition remains the key issue with the company. To combat the issues related to generics, the company has struck numerous M&A deals in the generic segment in 2008 and 2009. Going forward, in 2009–11, the company is expected to gain top-line growth, driven by uptake of Lantus (insulin glargine); however, further patent expiries will see the company lose increasing market share to generic competitors over 2011–15.
In 2008, Sanofi-Aventis acquired British vaccine-maker Acambis and Czech generics player Zentiva. In Q1 2009, it also acquired Mexican generics company Laboratorios Kendrick and Brazilian generics giant Medley. It also announced the acquisition of Indian vaccines specialist Shantha Biotechnics in July 2009, followed by the acquisition of generics maker Helvepharm from Swiss health care group Zur Rose.
Outside of prescription sales, Sanofi-Aventis acquired the remaining 50 percent stake in the animal health business Merial in October 2009, which is presently a joint venture with Merck & Co. It also made local additions to its consumer care business with the 2008 purchase of Australian consumer health company Symbion, Oenobiol (France), Kernpharm (Netherlands) and Gramon (Argentina).
Looking at the company’s acquisition strategy, industry experts believe it is unlikely that Sanofi-Aventis will enter into
large scale M&A activity in the near future. Instead, strategic rationale should dictate similarly small "niche area" acquisitions that support the diversified business model.
TevaTeve is considered the leading generic drugs company globally, with a srong foothold in the USA. Boosted by a number of acquisitions, Teva experienced robust sales growth during 2003–09, at a CAGR of 29.2 percent. The company benefited from the launch of a number of key generic products with exclusivity, and sustained growth was provided by
Snap shots of selected pharma companies
proprietary products, particularly Copaxone (glatiramer acetate). Going forward, its performance over 2009–15 will benefit from integrating recent acquisitions Barr and Ratiopharm, although the overall rate of growth is forecast to be notably slower than historically achieved, at 2.2 percent CAGR.
M&A remains a key factor driving the growth of generic drug companies — scale is the name of the game to keep competitive in a segment of the market where price is the only differentiator. Barriers to entry, such as difficult-to-manufacture formulations, can limit the number of competitors. In 2008, Teva acquired Barr, which represented a close fit, allowing cost savings in overlapping areas while enhancing the combined company’s portfolio of marketed and development products. In addition, Barr added to Teva’s biosimilar capabilities and coverage of European and other world markets. With the addition of Barr’s portfolio, Teva now dominates the US generic drug market, accounting for approximately 24 percent of total prescriptions in 20091.
For geographical expansion and filling the gaps in Europe, Teva has made a number of smaller acquisitions. In April 2002, it acquired Bayer’s generics operations in France, Bayer Classics. Similarly, Dorom was acquired in December 2004, giving Teva one of the largest suppliers of generic pharmaceuticals to the Italian retail market. More recently, in 2008, Teva acquired Spain-focused generics company Bentley. In March 2010, Teva acquired German generics company Ratiopharm, raising its position in the EU and the ability to compete in drug tenders in Germany.
To counter its exceptionally low generic penetration rates in Japan, one of the largest pharmaceutical markets, in September 2008, Teva announced the formation of an alliance with domestic player Kowa to develop and market a range of generic products for the Japanese market. It is estimated that the JV between the two companies, Teva-Kowa Pharma, will benefit from the Japanese government’s plan to increase generic drug penetration rates from 17 percent of volume to 30 percent by 2012. Also, in December 2009, Teva-Kowa acquired a majority stake in Taisho, which sells more than 200 generic products in Japan.
In a further important and industry-transforming deal, Teva founded a joint venture with Swiss contract manufacturing giant Lonza to develop and market biosimilars.
PfizerWith the Wyeth acquisition in 2009 for $68 billion USD, Pfizer is back into action in M&A , and set a new benchmark in the pharmaceutical industry and allows the company to retain and enhance its leadership of the market. Big-size acquisitions have shaped the company’s sales growth performance over the
1 Teva Investor Presentation, dated 18th March 2009
Source: IMS Health
Top 15 Global Pharma Corporations, 2009Ranking Corporation
1 Pfizer
2 Merck & Co.
3 Novartis
4 Sanofi-Aventis
5 Glaxosmithkline
6 Astrazeneca
7 Roche
8 Johnson & Johnson
9 Lilly
10 Abbott
11 Teva
12 Bayer
13 Boehringer Ingel
14 Amgen
15 Takeda

IMAP’s Pharma & Biotech Industry Global Report — 2011: Page 12
Future OutlookThe pharma industry is facing a number of key resistors to growth, including “patent cliffs,” which will erode $90 billion USD in branded sales over the 2010–14 period. Price cuts, reimbursement restrictions and growing regulatory pressure are further set to limit sales growth going forward. Factors that are largely growth neutral for pharma include US healthcare reform. While the industry’s medium-term outlook is boosted by increased sales volume and longer exclusivity for biologics, in the long run cost-containment pressures will intensify, restricting sales growth.
In order to sustain under an unfavorable climate, the industry is transitioning away from the primary-care, small-molecule driven sales model, towards targeting specialist secondary care indications through the use of high-value biologic therapies in the developed markets (Europe and the US), while also taking a global perspective through marketing branded and off-patent medicines in the fast growing emerging markets. Cost-savings facilitated by mergers and acquisitions are also set to bolster profits.
Pharma companies are striving hard to stave off the R&D crisis through mergers and acquisitions, geographic expansion and diversification into new areas such as consumer health. But they recognize that while these efforts yield more predictable sales in the future, they have limited impact on the profit gap. The US, Japan and Western Europe still account for 80 percent of the global market and recent growth in emerging markets cannot replace lost revenues or profits in the short-term future. Diversification into other healthcare businesses does not help fill the profit gap either, as “logical” expansions (e.g. to MedTech, diagnostics etc) typically have much lower margins compared with prescription drugs.
From an investment standpoint, the companies best equipped to deal with these challenges are those with robust pipelines capable of offsetting the impact from patent expiries. Diversified players, those that can offset difficulties in one segment or region with better performance in another, are also well placed. Despite the challenges, the industry remains extraordinarily profitable.
past decade, with the integration of Wyeth preceded by the purchases of Warner-Lambert (2000) and Pharmacia (2003).
Strategically, however, Pfizer has begun to undergo fundamental change. The loss of patent protection of Lipitor in many developed countries in 2011 already now has a painful impact on the company. This pressure also changed the underlying motive for acquiring Wyeth versus its previous large-scale acquisitions. While Warner-Lambert and Pharmacia were integral in shaping Pfizer’s industry-leading blockbuster growth strategy, Wyeth drives significant diversification at Pfizer as the industry-leading player seeks to navigate its way across a rapidly changing market landscape.
Given the historical precedent set by Pfizer over the last decade, it is worth considering that the company may enter into further large-scale M&A activity before 2015. Considered to have a too meager pipeline, the company will find it increasingly hard to expand via organic means.
NovartisBased on organic performance, Novartis is forecast to deliver the strongest prescription pharmaceutical sales growth over the period 2009-15, an anticipated growth of CAGR 4.1 percent vs. 1.4 percent for the industry. Structurally the company’s prescription pharmaceuticals business comprises its core branded pharma division with a diversified portfolio, supported by its generics unit Sandoz — one of the largest global generics players — and its vaccines division—inherited through the acquisition of Chiron and ranked as the industry’s
fifth largest vaccine business. However, the exposure of blockbuster brands to generic competition from 2011 onwards, with Diovan, Co-Diovan and Zometa losing protection, will impact the performance of the company.
Critically, neither the vaccine nor Sandoz businesses will be exposed to a directly comparable competitive threat, an inherent factor that has both driven Novartis’s investment in these market segments and which will dictate stronger sales growth performances for these units over 2009-15. Having long been regarded as a commercially unattractive commodity market, vaccines have re-emerged as important sales growth drivers for Big Pharma companies in recent years. The launch and rapid uptake of novel, high-price products alongside the emergence of novel vaccine technologies and favorable legislation have brought vaccines back into the commercial focus of pharmaceutical and biotech companies, with Novartis well poised to benefit from expansion of this segment.
List of Players by Strategy
Diversification* Strategy Followers Focus Pharma Players
AbbottBayerGSKJohnson & JohnsonMerck Schering PloughNovartisRocheSanofi-Aventis
AmgenAstra ZenecaEli LillyPfizer
* Apart from core pharma services Includes in OTC, vaccine, Source: IMAP branded generics, eye care, medical devices, generics etc.

IMAP’s Pharma & Biotech Industry Global Report — 2011: Appendix A-i
Appendix A: The pharma and biotech industry structure
The long path to a new drugWhen speaking of the Pharma /Biotech business model, the focus is actually on the development process of new drugs (not the actual process from manufacturing to patient). Drug development is a very complex process driven by medical science, regulatory constraints, and reimbursement standards. The very nature of this process shapes the industry and is the root cause for most M&A activity, hence it makes sense to look at it in some detail.
Target identification and validation: Based on new findings in basic research (genomics, proteomics) new potential “drug targets” may be determined. Drug targets are molecular structures (e.g. proteins) which (i) are the cause of, or are involved in, a disease or condition, and (ii) can be accessed using drugs. Target identification and validation is typically a very early stage of drug discovery. Many known drug targets are identified in academic research.
Drug discovery: Drug discovery describes the process of finding a chemical or biological substance (e.g. an antibody) that alters the action of the drug target in a manner to improve the medical condition. Drug discovery is often a trial-and-error process in which fully automized systems are used to perform screenings of thousands or millions of drug candidates (High-Throughput Screening).
Pharmacology: Lead compounds are then typically tested for their pharmacology (ADMET: absorption, distribution, metabolism, excretion, toxicology) and sometimes chemically modified to improve their tolerability by the human body.
Clinical development: Once the candidate drug has gone through a set of rigid tests to prove its safety in principal, the developing company may file an Investigational New Drug (IND) application. Once it gets granted permission, it may start the actual development of the drug. Today, the drug development process is not as strictly separated in its phases anymore, as combination of phases (I/II or II/III) are often used to shorten development times, but the concept still is valid.
• In Phase I, the safety of the drug is verified by applying increasing doses of the drug candidate to healthy patients (typically 10-20).
• If no side effects are measured, the drug is progressed to phase II, in which the efficacy is tested in volunteer patients.
• Phase III finally applies the drug to a larger group of patients to detect frequent side effects, and includes often other (older) drugs as comparator.
ReviewThe whole documentation is then filed with the regulatory bodies (FDA in the US, EMEA in Europe) for review via a New Drug Application (NDA). The regulator will review the data provided formally (protocols used, soundness of data collected, statistical significance of results) and medically (benefit of new drug compared to existing ones, side-effects, patient benefit). The development strategy is absolutely crucial for success: which indication or patient sub-set is selected, and which clinical end-points are chosen can decide the fate of the program, e.g., for formal reasons, regulators will not accept claims based on actual unexpected observations in the studies, which were not anticipated before the study's commencement and defined as an observable (a "clinical endpoint"). So it may be that a great new drug is sent back into development due to the wrong choice of the clinical endpoint.
It is also part of the development strategy to launch new development programs for other indications once the drug is launched. For example, in oncology the first indication typically addresses only patients who have not responded to other therapies on the market. Due to this restriction, the requirements for safety and side-effects are minimal. Once this product is on the market, the indications are extended to second-line and then first-line treatments, thereby multiplying the addressable patient population. Clinical studies after market authorization may also be used as a promotional tool.
Drug development is a long and costly process. Typical time frames from drug discovery to market authorization last seven to 14 years. While it is possible to bring a drug from lead optimization to market
1 Investigational New Drug application; 2 New Drug Application; 3 Market Authorization
Value Chain in Pharmaceutical Market
Discovery Development Proprietary Marketing Generic Marketing
ADMET
Lead optimization
Lead discovery
Target validation
Target identification
Academia
Biotech Companies
Biotech/Pharma Companies
Review
Phase III
Phase II
Phase I
Reg. ADMETIND1
NDA2
MA3
Off-protection

IMAP’s Pharma & Biotech Industry Global Report — 2011: Appendix A-ii
with a budget of $50 million USD in very lean biotech companies, budgets in large pharma companies are typically five times larger. These are non-discounted costs for one project. They do not take into account failure rates, i.e. the fact that most (nine out of 10) drug candidates entering the clinical development phase won’t make it to the market due to lack of efficacy or safety, or due to severe side effects (see table above).
Proprietary marketing phaseDrug developers may protect their market exclusivity in three ways: First, by having a patent on the drug they developed. Because patents have to be filed very early in the development process, and development times are so long, patents may run out quite soon after market launch. Hence, most governments in developed countries may provide protection certificates that extend patent protection if the costs and duration of development were excessive. Third, a developer may apply for regulatory exclusivity for the first launch of a drug in a new indication (even if the patent is long expired); if this is granted, no other company can use or refer to the clinical data produced by the originator to launch a new drug; however, other players can repeat the studies to have me-too products.
Whereas the cost for drug development is huge, market launches can cost again the same amounts. A drug that is prescribed by general practitioners requires large sales forces and substantial investment in promotion for their launch, at a cost similar to the clinical studies (up to $200 million USD).
During the proprietary marketing phase, the only limits to the profits of the pharma company are the number of prescriptions and the maximum price health insurers are willing to reimburse for the drug. While the first factor depends on the effectiveness of its sales force, the second factor is a matter of negotiations. Regulators around the globe, particularly in the UK, start to apply rigid standards such as cost per QALY (quality-adjusted life-years) to decide whether a drug is reimbursed or not. Health economics has become an integral part of evaluating the value of a drug development program.
Manufacturing costs for proprietary drugs are negligible — at 3 percent to 5 percent of the ex-factory price for chemical drugs, and typically below 20 percent for biotech drugs. Potential cost savings from outsourcing are counter-balanced by the risk of non-compliance with regulatory standards, or to run out of stock. Hence, typically large pharma companies manufacture in-house — with many exceptions, of course.
Generic marketing phaseThe effect of the loss of marketing exclusivity due to the expiry of patent protection or regulatory exclusivity depends on the nature of the drug.
For chemical drugs, regulators grant marketing authorization if the manufacturer can prove that its version of the original drug has, within certain boundaries, the same pharmacology as the original drug. For this, a small study with 20 to 30 healthy patients at a typical cost of $3 million USD is sufficient. Hence, entry barriers for copy-cat generic drugs are small, and competition can be fierce.
For biological drugs, the situation is more complex. As the effect of a biological drug can vary from one preparation to another due to subtle changes in the fermentation process, regulators demand clinical safety and side-effect studies in patients very much like phase I and phase III studies in new drug developments, for each new process (hence it is called “biosimilar”). The cost for these studies easily amounts to $30 million USD or more, and failure rates are significant. Hence, only few players manage to enter the arena of biosimilars for each original.
Marketing post-exclusivity is driven by three parameters: price, price and price. Manufacturing costs are an issue. Hence, generic drug providers typically produce or let produce in low-cost countries.
Interestingly, we observe that several large pharma companies have started to build their own generic drug units. Faced with the prospect of precipitating sales after losing exclusivity, some players chose to self-cannibalize rather than give up the territory completely to others. E.g., Nycomed launched a generic version of its Pantozol before the expiry of its patent, and now in some markets has 70 percent market share of the generics. These types of plays are also to be expected from other firms.
How do the mechanics of the market drive deal-making?The pharma value chain as described above is continuously reshaped. For all functions in the process — discovery, development, manufacturing, even sales — service providers can be found. Outsourcing, as in all mature industries, is rife, and all sorts of corporate restructurings drive minor M&A activity.
To be sustainable, pharma companies need a continuous pipeline of new drugs. Because of the uncertainties of the drug development process, they need to have a multitude of programs in parallel at any time. And to be able to fund them, they need to be big. However, large organizations tend to stifle innovation. The way out of this problem for Big Pharma are acquisitions (or obtaining exclusive licenses, which in one view are simply asset deals with deferred payments).
Biotech firms on the other hand, with very few notable exceptions, don’t have the capital or market access to launch a product. By selling out to a large player, their owners typically get much more value as compared to a stand-alone corporate development.
Hence, the pharma industry’s structure gradually rearranges, with some very large firms with large sales/marketing organizations and capital and knowledge for late-stage clinical developments that systematically acquire small Biotechs with interesting candidate products. (Interestingly, Novartis has split its R&D in an early-stage unit (research until phase I clinical studies) and a clinical-stage division).
As for generic drugs and biosimilars, we expect that the pure players in this arena (will become integrated in large pharma companies. Boundaries between originators and generic providers blur, and ultimately, the paramount strategic imperative for both types of players is the same: size.
Disease Group Phase I Phase II Phase III NDA Cumul.
Arthritis/Pain 76.9% 38.1% 78.1% 89.1% 20.4%
CNS 66.2% 45.6% 61.8% 77.9% 14.5%
Cardiovascular 62.7% 43.3% 76.3% 84.4% 17.5%
Gastrointestinal 66.8% 49.1% 71.0% 85.9% 20.0%
Immunology 64.8% 44.6% 65.2% 81.6% 15.4%
Infections 70.8% 51.2% 79.9% 96.9% 28.1%
Metabolism 47.8% 52.0% 78.9% 92.8% 18.2%
Oncology 64.4% 41.8% 65.4% 89.7% 15.8%
Ophthalmology 66.0% 39.0% 64.0% 92.0% 15.2%
Respiratory 63.4% 41.1% 59.9% 76.9% 12.0%
Urology 50.0% 38.0% 67.0% 79.0% 10.1%
Women's Health 39.0% 42.0% 48.0% 59.0% 4.6%
Source: “Valuation in Life Sciences” by Boris Bogdan and Ralph VilligerCourtesy of Avance, Basel /Switzerland
Drug development success rates

IMAP’s Pharma & Biotech Industry Global Report — 2011: Appendix A-iii
1: Pfizer Inc
RevenuesTTM: 66.8 billion USD2009: 50.0 billion USD2008: 48.3 billion USD
Revenue CAGR (2007 - 2009) 1.6%Net profit (TTM) 6.1 billion USDNet profit CAGR (2007 - 2009) 3.0%
R&D expensesTTM: 9.5 billion USD (14.2% of revenues)2009: 7.7 billion USD (15.5% of revenues)2008: 7.9 billion USD (16.5% of revenues)
Number of employees 1,16,500 Location of headquarters USPrincipal areas of business Prescription pharmaceuticals, non-prescription self-medications and animal health products
Segmental revenue breakdown (TTM) Biopharmaceutical: 86.9%; Animal Health: 5.2%; Consumer Healthcare: 3.8%; Nutrition: 2.4% Capsugel: 1.2%; Corporate/Other: 0.6%
Geographical revenue breakdown (TTM) International: 56.2%; US: 43.8%Top 3 biopharmaceutical drugs (TTM) Lipitor: 11.3 billion USD; Lyrica: 3.1 billion USD; Enbrel: 2.8 billion USD
Recent Acquisition Summary
- Announced acquisition of Synbiotics Corporation, a provider of diagnostic products for the animal health care industry, for 9.7 million USD. The deal is currently pending.
- Announced purchase of a stake in Laboratorio Teuto Brasileiro, a Brazil based pharmaceutical company, for 400.0 million BRL. The deal is currently pending.
- Announced purchase of certain assets of Strides Arcolab Ltd. The deal is currently pending.- Announced purchase of intellectual property and other assets of Biocon Ltd for 200.0 million USD. The deal is currently pending.
- Acquired FoldRx Pharmaceuticals Inc, a drug developer for treating diseases of protein misfolding. - Acquired partial stake in Ablexis LLC for 12.0 million USD.- Acquired Canada based Microtek International Inc.- Acquired Switzerland based Terguride.- Acquired partial stake in Merus Biopharmaceuticals BV.
Recent License Deals Summary- Exclusive rights to commercialize Biocon's biosimilars versions of insulin and insulin analog products.- Agreement with Ergonex Pharma GmbH for exclusive worldwide rights, excluding Japan, to commercialize Terguride for the treatment of Pulmonary Arterial Hypertension.
2: Johnson & Johnson
Revenues2010: 61.6 billion USD2009: 61.9 billion USD2008: 63.7 billion USD
Revenue CAGR (2008 - 2010) (1.7%)Net profit (2010) 13.3 billion USDNet profit CAGR (2008 - 2010) 1.5%
R&D expenses2010: 6.8 billion USD (11.1% of revenues)2009: 7.0 billion USD (11.3% of revenues)2008: 7.6 billion USD (11.9% of revenues)
Number of employees 115,500Location of headquarters USPrincipal areas of business Skin and hair care products, acetaminophen products, pharmaceuticals, surgical and diagnostic equipmentSegmental revenue breakdown (2010) Medical Devices and Diagnostics: 39.9%; Pharmaceutical: 36.4%; Consumer: 23.7%Geographical revenue breakdown (2010) US: 47.8%; Europe: 25.2%; Asia Pacific & Africa: 18.0%; Western Hemisphere excluding US: 9.0%Top 3 biopharmaceutical drugs (2010 Sales) Remicade: 4.6 billion USD; Procrit/Eprex: 1.9 billion USD; Risperdal Consta: 1.5 billion USD
Recent Acquisition Summary
- Acquired partial stake in 23andMe Inc.- Acquired Micrus Endovascular Corporation, a manufacturer of medical devices for treatment of cerebral vascular diseases, for 387.5 million USD.
- Acquired RespiVert Ltd, a small molecule drug discovery company for treatment of chronic obstructive pulmonary disease, cystic fibrosis and severe asthma.
- Acquired partial stake in Astute Medical Inc for 26.5 million USD.- Acquired Acclarent Inc, a medical technology company in the field of ENT, for 785.0 million USD.
Recent License Deals Summary
- Agreement with Ostial Solutions for the worldwide distribution of the OSTIAL PRO Stent Positioning System 2010.
- Agreement with Watson Laboratories Inc to distribute an authorized generic version of CONCERTA.- Agreement with Merck & Co Inc for marketing rights for CAEYLX outside the US.- Agreement with Diamyd Medical AB to develop and commercialize GAD65 antigen-based therapy.- Expansion of licensing agreement with the Grünenthal Group to register, manufacture and commercialize
Tapentadol in additional regions, including selected Asia Pacific, Latin American, African, and New European countries including Turkey and Greece.
Thumbnail summaries of top 50 pharmaceutical and biotech companies

IMAP’s Pharma & Biotech Industry Global Report — 2011: Appendix A-iv
3: Novartis AG
Revenues2010: 50.6 billion USD2009: 44.3 billion USD2008: 41.5 billion USD
Revenue CAGR (2008-2010) 10.5%Net profit (2010) 9.8 billion USDNet profit CAGR (2008-2010) 9.3%
R&D expenses2010: 9.1 billion USD (17.9% of revenues)2009: 7.5 billion USD (16.9% of revenues)2008: 7.2 billion USD (17.4% of revenues)
Number of employees 99,834Location of headquarters Switzerland
Principal areas of businessDrugs for cardiovascular, respiratory and infectious diseasesOncology, neuroscience, transplantation, dermatology, arthritis, gastrointestinal and urinary conditionsVaccines, diagnostics, vision and animal health products
Segmental revenue breakdown (2010) Pharmaceuticals: 59.8%; Sandoz: 16.8%; Consumer Health: 12.6%; Vaccines and Diagnostics: 8.0%; Other: 2.8%
Geographical revenue breakdown (2010) Europe: 38.8%; US: 32.7%; Rest of world: 18.7%; Canada and Latin America: 8.6%; Other: 1.2%Top 3 biopharmaceutical drugs (2010) Diovan: 6.1 billion USD; Gleevec/Glivec: 4.2 billion USD; Zometa: 1.5 billion USD
Recent Acquisition Summary
- Acquired partial stake in Chiron Behring Vaccines, involved in production of bacterial and virus vaccines, toxoids and analogous products, for 22.4 million USD.
- Announced acquiring Aires Pharmaceutical Inc, which develops therapies to treat pulmonary disorders in adults and children.
- Acquired partial stake in Alcon Inc, an eye care company, for 25.9 billion USD.- Acquired US based Corthera Inc for 120.0 million USD.- Acquired partial stake in Netherlands based Merus Biopharmaceuticals BV for 21.7 million EUR.
Recent License Deals Summary - Agreement with Debiopharm Group for exclusive worldwide rights (excluding Japan) to develop and market Debio 025.
4: Roche Holding AG
RevenuesTTM: 46.8 billion USD2009: 45.3 billion USD2008: 42.3 billion USD
Revenue CAGR (2007 - 2009) 8.5%Net profit (TTM) 9.2 billion USDNet profit CAGR (2007 - 2009) (6.0%)
R&D expensesTTM: 9.3 billion USD (19.8% of revenues)2009: 9.1 billion USD (20.1% of revenues)2008: 8.2 billion USD (19.4% of revenues)
Number of employees 81,507Location of headquarters Switzerland
Principal areas of business Prescription drugs for cardiovascular, infectious, autoimmune and respiratory diseases, dermatology, metabolic disorders, oncology, transplantation, and central nervous system
Segmental revenue breakdown (TTM) Pharmaceuticals: 79.1%; Diagnostics: 20.9%
Geographical revenue breakdown (TTM) US: 34.9%; EMEA: 32.5%; Japan: 10.4%; Central & Eastern Europe, Middle East, Africa, Central Asia: 6.9%; Latin America: 6.7%; Asia Pacific: 6.5%; Other: 2.2%
Top 3 biopharmaceutical drugs (TTM) Avastin: 6.1 billion USD; MabThera/Rituxan: 5.9 billion USD; Herceptin: 5.1 billion USD
Recent Acquisition Summary
- Announced acquisition of Marcadia Biotech Inc, which develops therapeutics for treatment of diabetes, obesity and other metabolic diseases. The deal is currently pending.
- Announced acquisition of certain assets of Medical Automation Systems Inc. The deal is currently pending.- Announced acquisition of BioImagene Inc, which provides digital imaging solutions, for 100.0 million USD. The deal is currently pending.
- Acquired US based Medingo Ltd.- Acquired certain assets of BioMicro Systems Inc.
Recent License Deals Summary
- Worldwide sublicense from Genzyme Corporation to develop a diagnostic assay for the detection of Epidermal Growth-Factor Receptor mutations.
- Full worldwide development and commercialization rights to Danoprevir (RG7227/ITMN-191) from InterMune Inc.

IMAP’s Pharma & Biotech Industry Global Report — 2011: Appendix A-v
5: Bayer AG
RevenuesTTM: 46.1 billion USD2009: 43.5 billion USD2008: 48.4 billion USD
Revenue CAGR (2007-2009) (1.1%)Net profit (TTM) 2.2 billion USDNet profit CAGR (2007-2009) (45.8%)
R&D expensesTTM: 4.0 billion USD (8.8% of revenues)2009: 3.8 billion USD (8.8% of revenues)2008: 3.9 billion USD (8.1% of revenues)
Number of employees 108,800Location of headquarters Germany
Principal areas of businessAspirin, antibiotics, anti-infectiveCardiovascular, oncology, and central nervous system drugs, OTC medicationsDiagnostics, animal health products, crop protection products, plastics, polyurethanes
Segmental revenue breakdown (TTM) Healthcare: 48.9%; Material Science: 28.0%; Crop Science: 19.3%; Other: 3.8%Geographical revenue breakdown (TTM) Presence in Europe; North America; Asia/Pacific; Latin America/Africa/Middle EastTop 3 biopharmaceutical drugs (TTM) Betaferon/Betaseron: 1.6 billion USD; Yasmin/YAZ/Yasminelle: 1.5 billion USD; Kogenate: 1.3 billion USD
Recent Acquisition Summary - Announced acquisition of New Zealand based Bomac Group. The deal is currently pending.- Acquired US based Artificial Muscle Inc.
Recent License Deals Summary
- Agreement with KYTHERA Biopharmaceuticals Inc for exclusive rights to commercialize ATX-101 outside the US and Canada.
- Exclusive rights for access to Paraco Technology Ltd’s current lead molecules for testing and development in animal health.
- Agreement with OncoMed Pharmaceuticals Inc for option to exclusively license antibody and protein therapeutic product candidates at any point up to the completion of Phase I testing.
- Agreement with EndoCeutics Inc for a worldwide, exclusive license to develop, manufacture and commercialize Vaginorm.
6: GlaxoSmithKline PLC
RevenuesTTM: 45.7 billion USD2009: 44.4 billion USD2008: 45.1 billion USD
Revenue CAGR (2007 - 2009) (1.2%)Net profit (TTM) 6.2 billion USDNet profit CAGR (2007 - 2009) (8.9%)
R&D expensesTTM: 6.2 billion USD (13.6% of revenues)2009: 6.2 billion USD (13.9% of revenues)2008: 6.5 billion USD (14.4% of revenues)
Number of employees 98,854Location of headquarters UKPrincipal areas of business Vaccines, prescription drugs, OTC medicines, health related consumer products Segmental revenue breakdown (TTM) Pharmaceuticals: 82.9%; Consumer Healthcare: 17.1%Geographical revenue breakdown (TTM) US: 32.8%; Europe: 32.6%; Rest of World: 34.6%Top 3 biopharmaceutical drugs (TTM) Seretide/Advair: 8.1 billion USD; Flixotide/Flovent: 1.3 billion USD; Valtrex: 1.0 billion USD
Recent Acquisition Summary
- Announced acquisition of Nanjing MeRui Pharma Co Ltd, which offers pharmaceuticals medicines, medical devices and allergy diagnostics, for 70.0 million USD. The deal is currently pending.
- Announced acquisition of Maxinutrition Ltd, which manufactures sports nutrition products, for 162.0 million GBP. The deal is currently pending.
- Announced acquisition of Theravance Inc, which develops small molecule medicines for respiratory diseases, bac-terial infections and gastrointestinal disorders, for 129.4 million USD. The deal is currently pending.
- Acquired Argentina based Laboratorios Phoenix SACyF for 253.0 million USD.- Announced acquisition of Dong-A Pharmaceuticals Co Ltd, which manufactures pharmaceuticals products including vaccines, AIDA diagnostic kits, drinks and OTC drugs, for 142.9 billion KRW. The deal is currently pending.
- Acquired partial stakes in JCR Pharmaceuticals Co Ltd, which develops pharmaceutical products, raw materials and equipment, in three separate deals.
Recent License Deals Summary
- Agreement with Impax Laboratories Inc for an exclusive license to commercialize IPX066 throughout the world except in the US and Taiwan.
- Agreement with Amicus Therapeutics for exclusive worldwide rights to develop, manufacture and commercialize AmigalTM (migalastat HCl).
- Agreement with Fondazione Telethon and Fondazione San Raffaele for exclusive license to develop and commercialize an investigational gene therapy, for ADA Severe Combined Immune Deficiency.
- Agreement with Medivir for exclusive rights to commercialize and distribute non-prescription Xerclear as part of the Zovirax franchise, across multiple markets, including Europe, Russia, Japan, India, Australia and New Zealand.
IMAP’s Pharma & Biotech Industry Global Report — 2011: Appendix A-vi
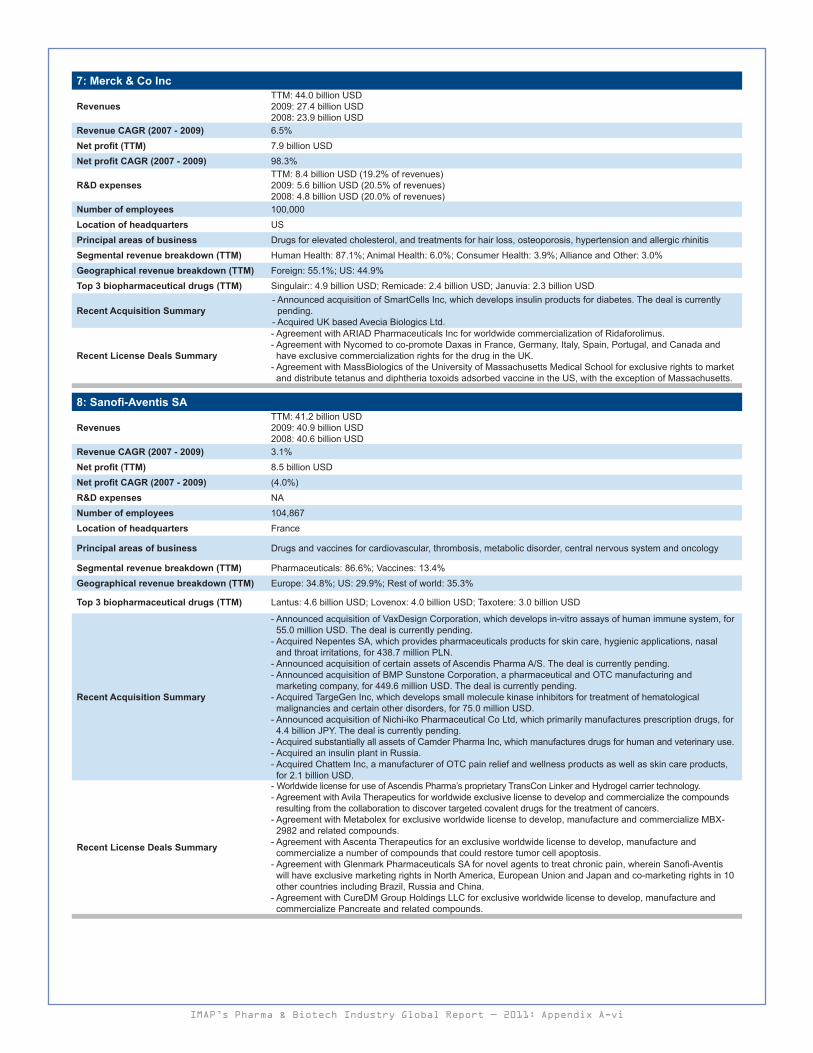
7: Merck & Co Inc
RevenuesTTM: 44.0 billion USD2009: 27.4 billion USD2008: 23.9 billion USD
Revenue CAGR (2007 - 2009) 6.5%Net profit (TTM) 7.9 billion USDNet profit CAGR (2007 - 2009) 98.3%
R&D expensesTTM: 8.4 billion USD (19.2% of revenues)2009: 5.6 billion USD (20.5% of revenues)2008: 4.8 billion USD (20.0% of revenues)
Number of employees 100,000Location of headquarters USPrincipal areas of business Drugs for elevated cholesterol, and treatments for hair loss, osteoporosis, hypertension and allergic rhinitisSegmental revenue breakdown (TTM) Human Health: 87.1%; Animal Health: 6.0%; Consumer Health: 3.9%; Alliance and Other: 3.0%Geographical revenue breakdown (TTM) Foreign: 55.1%; US: 44.9%Top 3 biopharmaceutical drugs (TTM) Singulair:: 4.9 billion USD; Remicade: 2.4 billion USD; Januvia: 2.3 billion USD
Recent Acquisition Summary- Announced acquisition of SmartCells Inc, which develops insulin products for diabetes. The deal is currently pending.
- Acquired UK based Avecia Biologics Ltd.
Recent License Deals Summary
- Agreement with ARIAD Pharmaceuticals Inc for worldwide commercialization of Ridaforolimus.- Agreement with Nycomed to co-promote Daxas in France, Germany, Italy, Spain, Portugal, and Canada and have exclusive commercialization rights for the drug in the UK.
- Agreement with MassBiologics of the University of Massachusetts Medical School for exclusive rights to market and distribute tetanus and diphtheria toxoids adsorbed vaccine in the US, with the exception of Massachusetts.
8: Sanofi-Aventis SA
RevenuesTTM: 41.2 billion USD2009: 40.9 billion USD2008: 40.6 billion USD
Revenue CAGR (2007 - 2009) 3.1%Net profit (TTM) 8.5 billion USDNet profit CAGR (2007 - 2009) (4.0%)R&D expenses NANumber of employees 104,867Location of headquarters France
Principal areas of business Drugs and vaccines for cardiovascular, thrombosis, metabolic disorder, central nervous system and oncology
Segmental revenue breakdown (TTM) Pharmaceuticals: 86.6%; Vaccines: 13.4%Geographical revenue breakdown (TTM) Europe: 34.8%; US: 29.9%; Rest of world: 35.3%
Top 3 biopharmaceutical drugs (TTM) Lantus: 4.6 billion USD; Lovenox: 4.0 billion USD; Taxotere: 3.0 billion USD
Recent Acquisition Summary
- Announced acquisition of VaxDesign Corporation, which develops in-vitro assays of human immune system, for 55.0 million USD. The deal is currently pending.
- Acquired Nepentes SA, which provides pharmaceuticals products for skin care, hygienic applications, nasal and throat irritations, for 438.7 million PLN.
- Announced acquisition of certain assets of Ascendis Pharma A/S. The deal is currently pending.- Announced acquisition of BMP Sunstone Corporation, a pharmaceutical and OTC manufacturing and marketing company, for 449.6 million USD. The deal is currently pending.
- Acquired TargeGen Inc, which develops small molecule kinase inhibitors for treatment of hematological malignancies and certain other disorders, for 75.0 million USD.
- Announced acquisition of Nichi-iko Pharmaceutical Co Ltd, which primarily manufactures prescription drugs, for 4.4 billion JPY. The deal is currently pending.
- Acquired substantially all assets of Camder Pharma Inc, which manufactures drugs for human and veterinary use.- Acquired an insulin plant in Russia.- Acquired Chattem Inc, a manufacturer of OTC pain relief and wellness products as well as skin care products, for 2.1 billion USD.
Recent License Deals Summary
- Worldwide license for use of Ascendis Pharma’s proprietary TransCon Linker and Hydrogel carrier technology.- Agreement with Avila Therapeutics for worldwide exclusive license to develop and commercialize the compounds resulting from the collaboration to discover targeted covalent drugs for the treatment of cancers.
- Agreement with Metabolex for exclusive worldwide license to develop, manufacture and commercialize MBX-2982 and related compounds.
- Agreement with Ascenta Therapeutics for an exclusive worldwide license to develop, manufacture and commercialize a number of compounds that could restore tumor cell apoptosis.
- Agreement with Glenmark Pharmaceuticals SA for novel agents to treat chronic pain, wherein Sanofi-Aventis will have exclusive marketing rights in North America, European Union and Japan and co-marketing rights in 10 other countries including Brazil, Russia and China.
- Agreement with CureDM Group Holdings LLC for exclusive worldwide license to develop, manufacture and commercialize Pancreate and related compounds.
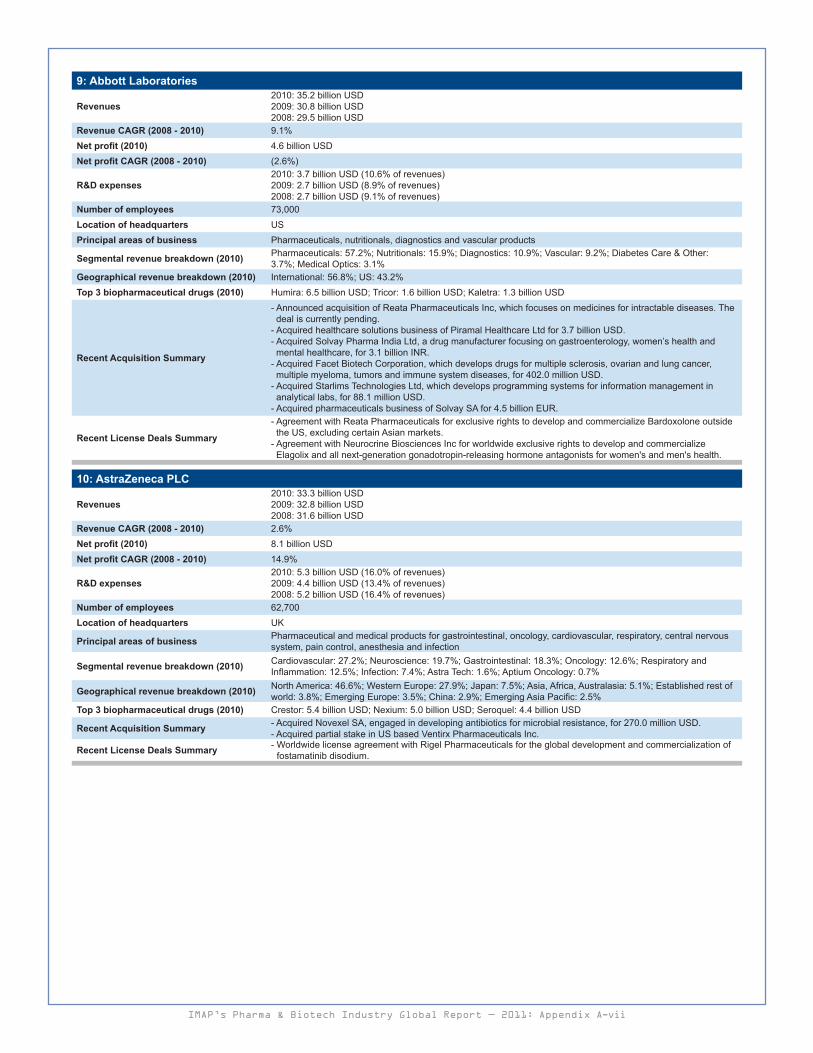
IMAP’s Pharma & Biotech Industry Global Report — 2011: Appendix A-vii
9: Abbott Laboratories
Revenues2010: 35.2 billion USD2009: 30.8 billion USD2008: 29.5 billion USD
Revenue CAGR (2008 - 2010) 9.1%Net profit (2010) 4.6 billion USDNet profit CAGR (2008 - 2010) (2.6%)
R&D expenses2010: 3.7 billion USD (10.6% of revenues)2009: 2.7 billion USD (8.9% of revenues)2008: 2.7 billion USD (9.1% of revenues)
Number of employees 73,000Location of headquarters USPrincipal areas of business Pharmaceuticals, nutritionals, diagnostics and vascular products
Segmental revenue breakdown (2010) Pharmaceuticals: 57.2%; Nutritionals: 15.9%; Diagnostics: 10.9%; Vascular: 9.2%; Diabetes Care & Other: 3.7%; Medical Optics: 3.1%
Geographical revenue breakdown (2010) International: 56.8%; US: 43.2%Top 3 biopharmaceutical drugs (2010) Humira: 6.5 billion USD; Tricor: 1.6 billion USD; Kaletra: 1.3 billion USD
Recent Acquisition Summary
- Announced acquisition of Reata Pharmaceuticals Inc, which focuses on medicines for intractable diseases. The deal is currently pending.
- Acquired healthcare solutions business of Piramal Healthcare Ltd for 3.7 billion USD.- Acquired Solvay Pharma India Ltd, a drug manufacturer focusing on gastroenterology, women’s health and mental healthcare, for 3.1 billion INR.
- Acquired Facet Biotech Corporation, which develops drugs for multiple sclerosis, ovarian and lung cancer, multiple myeloma, tumors and immune system diseases, for 402.0 million USD.
- Acquired Starlims Technologies Ltd, which develops programming systems for information management in analytical labs, for 88.1 million USD.
- Acquired pharmaceuticals business of Solvay SA for 4.5 billion EUR.
Recent License Deals Summary
- Agreement with Reata Pharmaceuticals for exclusive rights to develop and commercialize Bardoxolone outside the US, excluding certain Asian markets.
- Agreement with Neurocrine Biosciences Inc for worldwide exclusive rights to develop and commercialize Elagolix and all next-generation gonadotropin-releasing hormone antagonists for women's and men's health.
10: AstraZeneca PLC
Revenues2010: 33.3 billion USD2009: 32.8 billion USD2008: 31.6 billion USD
Revenue CAGR (2008 - 2010) 2.6%Net profit (2010) 8.1 billion USDNet profit CAGR (2008 - 2010) 14.9%
R&D expenses2010: 5.3 billion USD (16.0% of revenues)2009: 4.4 billion USD (13.4% of revenues)2008: 5.2 billion USD (16.4% of revenues)
Number of employees 62,700Location of headquarters UK
Principal areas of business Pharmaceutical and medical products for gastrointestinal, oncology, cardiovascular, respiratory, central nervous system, pain control, anesthesia and infection
Segmental revenue breakdown (2010) Cardiovascular: 27.2%; Neuroscience: 19.7%; Gastrointestinal: 18.3%; Oncology: 12.6%; Respiratory and Inflammation: 12.5%; Infection: 7.4%; Astra Tech: 1.6%; Aptium Oncology: 0.7%
Geographical revenue breakdown (2010) North America: 46.6%; Western Europe: 27.9%; Japan: 7.5%; Asia, Africa, Australasia: 5.1%; Established rest of world: 3.8%; Emerging Europe: 3.5%; China: 2.9%; Emerging Asia Pacific: 2.5%
Top 3 biopharmaceutical drugs (2010) Crestor: 5.4 billion USD; Nexium: 5.0 billion USD; Seroquel: 4.4 billion USD
Recent Acquisition Summary - Acquired Novexel SA, engaged in developing antibiotics for microbial resistance, for 270.0 million USD.- Acquired partial stake in US based Ventirx Pharmaceuticals Inc.
Recent License Deals Summary - Worldwide license agreement with Rigel Pharmaceuticals for the global development and commercialization of fostamatinib disodium.

IMAP’s Pharma & Biotech Industry Global Report — 2011: Appendix A-viii
11: Eli Lilly & Co
Revenues2010: 23.1 billion USD2009: 21.8 billion USD2008: 20.4 billion USD
Revenue CAGR (2008 - 2010) 6.4%Net profit (2010) 5.1 billion USDNet profit CAGR (2008 - 2010) NM
R&D expenses2010: 4.9 billion USD (21.2% of revenues)2009: 4.3 billion USD (19.8% of revenues)2008: 3.8 billion USD (18.9% of revenues)
Number of employees 40,360 Location of headquarters US
Principal areas of business Pharmaceutical products for neuroscience, endocrines, oncology products and animal healthCardiovascular agents and anti-infective
Segmental revenue breakdown (2010) Pharmaceutical: 91.5%; Animal Health: 5.8%; Collaboration and Other: 2.8%Geographical revenue breakdown (2010) US: 55.7%; Outside US: 44.3%;Top 3 biopharmaceutical drugs (2010) Zyprexa: 5.1 billion USD; Cymbalta: 3.3 billion USD; Alimta: 2.2 billion USD
Recent Acquisition Summary
- Acquired Avid Radiopharmaceuticals Inc, a provider of clinical-stage products focusing on molecular imaging agents, for 300.0 million USD.
- Acquired Alnara Pharmaceuticals Inc, which develops protein therapeutics for treatment of metabolic diseases.- Acquired partial stake in HemaQuest Pharmaceuticals Inc, which develops small molecule therapeutics to treat anemia.
Recent License Deals Summary- License agreement for worldwide commercialization for with Marcadia Biotech Inc’s short-acting glucagon
program.- Agreement with Acrux for worldwide rights to commercialize AXIRON.
12: Bristol-Myers Squibb Co
Revenues2010: 19.5 billion USD2009: 18.8 billion USD2008: 17.7 billion USD
Revenue CAGR (2008 - 2010) 4.9%Net profit (TTM) 3.1 billion USDNet profit CAGR (2008 - 2010) (23.1%)
R&D expenses2010: 3.6 billion USD (18.3% of revenues)2009: 3.6 billion USD (19.4% of revenues)2008: 3.5 billion USD (19.8% of revenues)
Number of employees 28,000Location of headquarters US
Principal areas of business Products for cancer, heart diseases, HIV/AIDS, diabetes, rheumatoid arthritis, organ transplant rejection and psychiatric disorders
Segmental revenue breakdown (2010) Cardiovascular: 39.9%; Virology: 18.9%; Other Biopharmaceuticals: 17.3%; Psychiatric: 13.5%; Oncology: 6.6%; Immunoscience: 3.5%; Metabolic: 0.3%
Geographical revenue breakdown (2010) US: 63.1%; Others: 36.9%Top 3 biopharmaceutical drugs (2010) Plavix: 6.6 billion USD; Abilify: 2.6 billion USD; Reyataz: 1.5 billion USD
Recent Acquisition Summary - Acquired Zymogenetics Inc, which develops protein drugs to treat Hepatitis C, cancer and autoimmune/inflammation conditions, for 725.2 million USD.
Recent License Deals Summary
- Agreement with Oncolys BioPharma Inc for exclusive worldwide rights to manufacture, develop and commercialize Festinavir.
- Agreement with Allergan Inc for exclusive worldwide rights to develop, manufacture and commercialize AGN-209323 and backup compounds.
13: Boehringer Ingelheim GmbH**
Revenues2009: 17.7 billion USD2008: 17.1 billion USD2007: 15.0 billion USD
Revenue CAGR (2007 - 2009) 8.7%Net profit (TTM) 2.5 billion USDNet profit CAGR (2007 - 2009) (0.5%)
R&D expenses2009: 3.1 billion USD (17.4% of revenues)2008: 3.1 billion USD (18.2% of revenues)2007: 2.4 billion USD (15.8% of revenues)
Number of employees 41,534Location of headquarters GermanyPrincipal areas of business Branded and generic medicinesSegmental revenue breakdown (TTM) Human Pharmaceuticals: 95.2%; Animal Health: 4.8%Geographical revenue breakdown (TTM) The Americas: 49.2%; Europe: 31.3%; Asia Pacific and Africa: 19.5%Top 3 biopharmaceutical drugs (TTM) Spiriva: 3.4 billion USD; Flomax: 2.0 billion USD; Micardis: 1.9 billion USD
Recent Acquisition Summary - Acquired SSP Co Ltd, which manufactures food supplements, cold and gastrointestinal medicine, painkiller, anti-inflammatory agents and poultice, in two separate transactions.
Recent License Deals Summary NA

IMAP’s Pharma & Biotech Industry Global Report — 2011: Appendix A-ix
14: Takeda Pharmaceutical Co Ltd
Revenues2010: 15.8 billion USD2009: 15.4 billion USD2008: 12.1 billion USD
Revenue CAGR (2008 - 2010) 14.4%Net profit (2010) 3.2 billion USDNet profit CAGR (2008 - 2010) 1.4%
R&D expenses2010: 3.2 billion USD (20.2% of revenues)2009: 4.5 billion USD (29.2% of revenues)2008: 2.4 billion USD (19.8% of revenues)
Number of employees 18,527Location of headquarters JapanPrincipal areas of business Pharmaceuticals, food supplements and chemical productsSegmental revenue breakdown (2010) Pharmaceuticals: 93.5%; Other-Test Reagent, Clinical Inspection, Chemical Products: 6.5%Geographical revenue breakdown (2010) Japan: 52.7%; North America: 35.4%; Europe: 10.6%; Rest of world: 1.3%Top 3 biopharmaceutical drugs (2010) Actos: 4.3 billion USD; Blopress: 2.4 billion USD; Takepron: 1.8 billion USDRecent Acquisition Summary NA
Recent License Deals Summary
- Agreement with Baxter International Inc for exclusive license to Baxter’s proprietary Vero cell-based influenza vaccine technology for the Japanese market.
- Agreement with the Japan Health Sciences Foundation for worldwide exclusive use of patent rights of a human papillomavirus (HPV) vaccine.
- Agreement with Orexigen Therapeutics Inc for exclusive marketing rights of Contrave in US, Mexico and Canada.- Agreement with AMAG Pharmaceuticals Inc for exclusive license to Feraheme for all therapeutic applications in Europe, Canada, Turkey, the Commonwealth of Independent States and Asia Pacific countries, excluding Japan, China and Taiwan.
- Agreement with Janssen Pharmaceutical KK and Janssen Pharmaceutica NV for rights to co-market Galantamine Hydrobromide in Japan.
15: Teva Pharmaceutical Industries
RevenuesTTM: 15.5 billion USD2009: 13.9 billion USD2008: 11.1 billion USD
Revenue CAGR (2007 - 2009) 21.5%Net profit (TTM) 2.9 billion USDNet profit CAGR (2007 - 2009) 1.3%
R&D expensesTTM: 882.0 million USD (5.7% of revenues)2009: 802.0 million USD (5.8% of revenues)2008: 786.0 million USD (7.1% of revenues)
Number of employees 35,089Location of headquarters IsraelPrincipal areas of business Generic and branded human pharmaceuticals, and APIs
Segmental revenue breakdown (TTM) Generic Pharmaceuticals: 66.5%; Specialty Products: 19.1%; Respiratory Products: 5.7%; APIs: 3.8%; Proprietary Women Health Products: 4.0%; Biogenerics: 1.0%
Geographical revenue breakdown (TTM) North America: 63.4%; Europe: 22.9%; Rest of world: 13.8%Top 3 biopharmaceutical drugs (TTM) Copaxone: 2,720.0 million USD; Azilect: 297 million USD
Recent Acquisition Summary
- Acquired partial stake in Taisho Pharm. Ind. Ltd, a manufacturer of drugs for human and veterinary use, in two separate transactions.
- Acquired Ratiopharm GmbH, which is a manufacturer of high quality generic drugs, for 3.6 billion EUR.- Acquired partial stake in OncoGenex Pharmaceutical Inc, which develops new cancer therapies for treatment resistance in cancer patients, for 10.0 million USD
Recent License Deals Summary - Agreement with Active Biotech for marketing and distribution rights of oral Laquinimod in the Nordic and Baltic region.
16: Amgen Inc
RevenuesTTM: 15.1 billion USD2009: 14.6 billion USD2008: 15.0 billion USD
Revenue CAGR (2007 - 2009) 0.2%Net profit (TTM) 4.6 billion USDNet profit CAGR (2007 - 2009) 6.9%
R&D expensesTTM: 2.9 billion USD (19.2% of revenues)2009: 2.9 billion USD (19.6% of revenues)2008: 3.0 billion USD (20.2% of revenues)
Number of employees 17,000Location of headquarters USPrincipal areas of business Human therapeutics for hematology, cancer, infectious diseases, endocrinology, neurobiology and inflammationSegmental revenue breakdown (TTM) Product Sales: 97.4%; Other Revenues: 2.6%Geographical revenue breakdown (TTM) US: 74.8%; Outside US: 22.6%; Worldwide Revenues from Royalties and Collaborations: 2.6%Top 3 biopharmaceutical drugs (TTM) Neulasta: 3.6 billion USD; Enbrel: 3.5 billion USD; Epogen: 2.5 billion USDRecent Acquisition Summary NARecent License Deals Summary NA

IMAP’s Pharma & Biotech Industry Global Report — 2011: Appendix A-x
17: Baxter International Inc
RevenuesTTM: 12.8 billion USD2009: 12.6 billion USD2008: 12.4 billion USD
Revenue CAGR (2007 – 2009) 5.6%Net profit (TTM) 1.6 billion USDNet profit CAGR (2007 - 2009) 13.7%
R&D expensesTTM: 899.0 million USD (7.0% of revenues)2009: 917.0 million USD (7.3% of revenues)2008: 868.0 million USD (7.0% of revenues)
Number of employees 49,700Location of headquarters US
Principal areas of business Products and technologies related to hemophilia, immune disorders, infectious diseases, kidney diseases, trauma and other chronic and acute medical conditions
Segmental revenue breakdown (TTM) BioScience: 44.2%; Medication Delivery: 37.1%; Renal: 18.7%Geographical revenue breakdown (TTM) International: 59.1%; US: 40.9%Top 3 biopharmaceutical drugs (TTM) NA
Recent Acquisition Summary - Acquired certain assets of Archemix Corporation.- Acquired ApaTech Ltd, an orthopedics service provider, for 240.0 million USD.
Recent License Deals Summary - Agreement with Kamada Ltd for exclusive commercial rights to GLASSIA in the US, Australia, New Zealand and Canada. Baxter has purchased the right to process GLASSIA.
18: Merck KGaA
RevenuesTTM: 11.9 billion USD2009: 10.8 billion USD2008: 11.1 billion USD
Revenue CAGR (2007 - 2009) 5.7%Net profit (TTM) 871.3 million USDNet profit CAGR (2007 - 2009) (67.4%)
R&D expensesTTM: 1.9 billion USD (15.8% of revenues)2009: 1.9 billion USD (17.4% of revenues)2008: 1.8 billion USD (16.3% of revenues)
Number of employees 40,507Location of headquarters Germany
Principal areas of business Drugs in the fields of oncology, neurodegenerative, autoimmune and inflammatory diseasesCardiovascular, fertility, endocrinology and OTC products
Segmental revenue breakdown (TTM) Pharmaceuticals: 65.8%; Chemicals: 29.8%; Royalty Income: 4.4%
Geographical revenue breakdown (TTM) Europe: 40.8%; Asia, Africa, Australasia: 27.4%; North America: 14.1%; Latin America: 13.3%; Worldwide Royalty Income: 4.4%
Top 3 biopharmaceutical drugs (TTM) Rebif: 2.2 billion USD; Erbitux: 1.1 billion USD; Gonal-f: 683.8 million USD
Recent Acquisition Summary - Acquired Millipore Corporation, which is a solutions provider for development and manufacturing of new therapeutic drugs, for 6.8 billion USD.
Recent License Deals Summary- A worldwide research and development agreement with Sanofi-Aventis US Inc under which its division, Merck Serono, and Sanofi-Aventis will collaboratively investigate novel experimental combinations of agents that could block specific pathways in cancer cells.
19: Otsuka Holdings Co Ltd
Revenues2010: 11.7 billion USD2009: 9.6 billion USD2008: 8.2 billion USD
Revenue CAGR (2008 - 2010) 19.8%Net profit (2010) 727.3 million USDNet profit CAGR (2008 - 2010) 15.7%
R&D expenses2010: 1.6 billion USD (14.0% of revenues)2009: 1.4 billion USD (14.2% of revenues)2008: NA
Number of employees 24,589Location of headquarters JapanPrincipal areas of business Pharmaceuticals, clinical testing and medical equipment for intractable diseasesSegmental revenue breakdown (2010) Pharmaceuticals: 66.0%; Nutraceuticals: 22.8%; Others: 6.6%; Consumer Products: 4.6% Geographical revenue breakdown (2010) Japan: 51.5%; US: 35.8%; Rest of world: 12.6%Top 3 biopharmaceutical drugs (2010) Ablify: 4.1 billion USD; Pletaal: 1.0 billion USD; TS-1: 402.2 million USDRecent Acquisition Summary NA
Recent License Deals Summary - Sublicensing agreement with Fuso Pharmaceutical Industries Ltd for manufacturing and commercialization of a therapeutic cancer vaccine, OTS102, in Japan.
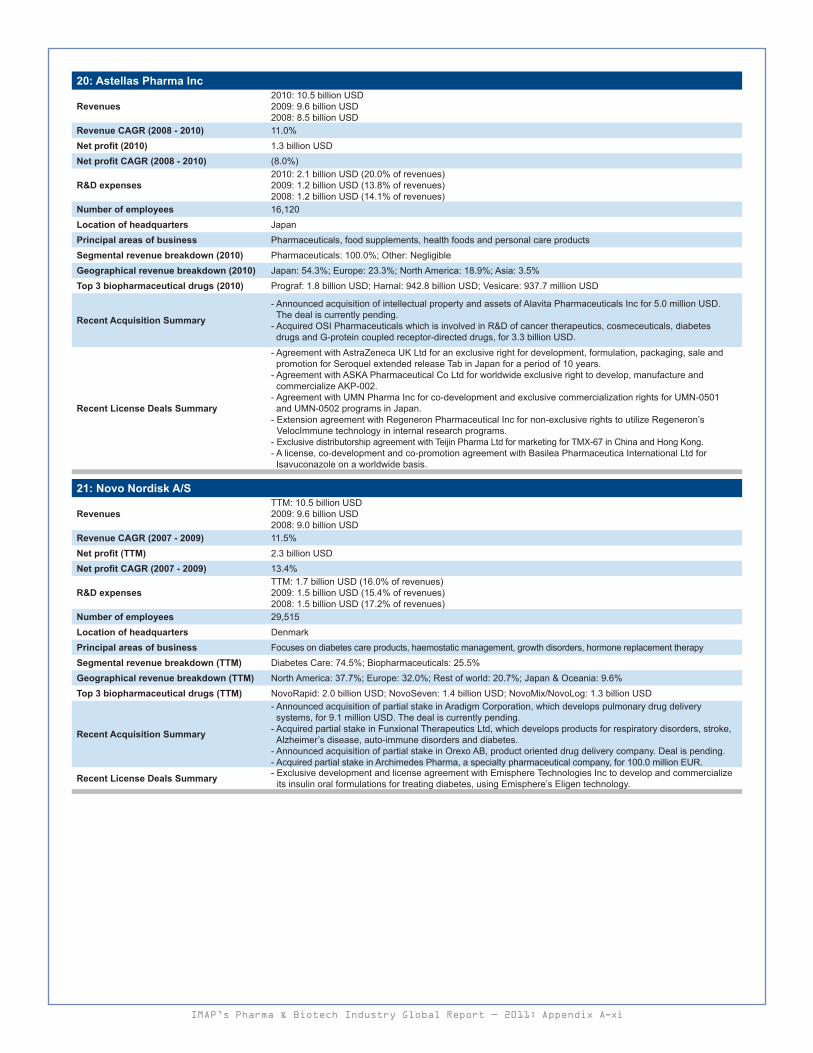
IMAP’s Pharma & Biotech Industry Global Report — 2011: Appendix A-xi
20: Astellas Pharma Inc
Revenues2010: 10.5 billion USD2009: 9.6 billion USD2008: 8.5 billion USD
Revenue CAGR (2008 - 2010) 11.0%Net profit (2010) 1.3 billion USDNet profit CAGR (2008 - 2010) (8.0%)
R&D expenses2010: 2.1 billion USD (20.0% of revenues)2009: 1.2 billion USD (13.8% of revenues)2008: 1.2 billion USD (14.1% of revenues)
Number of employees 16,120Location of headquarters JapanPrincipal areas of business Pharmaceuticals, food supplements, health foods and personal care productsSegmental revenue breakdown (2010) Pharmaceuticals: 100.0%; Other: NegligibleGeographical revenue breakdown (2010) Japan: 54.3%; Europe: 23.3%; North America: 18.9%; Asia: 3.5%Top 3 biopharmaceutical drugs (2010) Prograf: 1.8 billion USD; Harnal: 942.8 billion USD; Vesicare: 937.7 million USD
Recent Acquisition Summary
- Announced acquisition of intellectual property and assets of Alavita Pharmaceuticals Inc for 5.0 million USD. The deal is currently pending.
- Acquired OSI Pharmaceuticals which is involved in R&D of cancer therapeutics, cosmeceuticals, diabetes drugs and G-protein coupled receptor-directed drugs, for 3.3 billion USD.
Recent License Deals Summary
- Agreement with AstraZeneca UK Ltd for an exclusive right for development, formulation, packaging, sale and promotion for Seroquel extended release Tab in Japan for a period of 10 years.
- Agreement with ASKA Pharmaceutical Co Ltd for worldwide exclusive right to develop, manufacture and commercialize AKP-002.
- Agreement with UMN Pharma Inc for co-development and exclusive commercialization rights for UMN-0501 and UMN-0502 programs in Japan.
- Extension agreement with Regeneron Pharmaceutical Inc for non-exclusive rights to utilize Regeneron’s VelocImmune technology in internal research programs.
- Exclusive distributorship agreement with Teijin Pharma Ltd for marketing for TMX-67 in China and Hong Kong.- A license, co-development and co-promotion agreement with Basilea Pharmaceutica International Ltd for Isavuconazole on a worldwide basis.
21: Novo Nordisk A/S
RevenuesTTM: 10.5 billion USD2009: 9.6 billion USD2008: 9.0 billion USD
Revenue CAGR (2007 - 2009) 11.5%Net profit (TTM) 2.3 billion USDNet profit CAGR (2007 - 2009) 13.4%
R&D expensesTTM: 1.7 billion USD (16.0% of revenues)2009: 1.5 billion USD (15.4% of revenues)2008: 1.5 billion USD (17.2% of revenues)
Number of employees 29,515Location of headquarters DenmarkPrincipal areas of business Focuses on diabetes care products, haemostatic management, growth disorders, hormone replacement therapySegmental revenue breakdown (TTM) Diabetes Care: 74.5%; Biopharmaceuticals: 25.5%Geographical revenue breakdown (TTM) North America: 37.7%; Europe: 32.0%; Rest of world: 20.7%; Japan & Oceania: 9.6%Top 3 biopharmaceutical drugs (TTM) NovoRapid: 2.0 billion USD; NovoSeven: 1.4 billion USD; NovoMix/NovoLog: 1.3 billion USD
Recent Acquisition Summary
- Announced acquisition of partial stake in Aradigm Corporation, which develops pulmonary drug delivery systems, for 9.1 million USD. The deal is currently pending.
- Acquired partial stake in Funxional Therapeutics Ltd, which develops products for respiratory disorders, stroke, Alzheimer’s disease, auto-immune disorders and diabetes.
- Announced acquisition of partial stake in Orexo AB, product oriented drug delivery company. Deal is pending.- Acquired partial stake in Archimedes Pharma, a specialty pharmaceutical company, for 100.0 million EUR.
Recent License Deals Summary - Exclusive development and license agreement with Emisphere Technologies Inc to develop and commercialize its insulin oral formulations for treating diabetes, using Emisphere’s Eligen technology.

IMAP’s Pharma & Biotech Industry Global Report — 2011: Appendix A-xii
22: Daiichi Sankyo Co Ltd
Revenues2010: 10.3 billion USD2009: 8.4 billion USD2008: 7.7 billion USD
Revenue CAGR (2008 - 2010) 15.3%Net profit (2010) 451.3 million USDNet profit CAGR (2008 - 2010) (27.5%)
R&D expenses2010: 2.1 billion USD (20.7% of revenues)2009: 1.8 billion USD (21.9% of revenues)2008: 1.4 billion USD (18.7% of revenues)
Number of employees 30,423Location of headquarters JapanPrincipal areas of business Pharmaceuticals for human and veterinary use, medical tools and equipmentSegmental revenue breakdown (2010) Pharmaceuticals: 99.8%; Other-Food, Agriculture Chemicals: 0.2%Geographical revenue breakdown (2010) Presence in North America; Europe; Japan; Rest of worldTop 3 biopharmaceutical drugs (2010) Olmesartan (Benicar): 2.7 billion USD; Levofloxacin: 868.3 million USD; Loxonin: 560.6 million USD
Recent Acquisition Summary
- Announced acquisition of Roxro Pharma Inc, which develops treatments for acute pain and assisting patients to recover from injury or live with ailments. The deal is currently pending.
- Acquired partial stake in Zenotech Laboratories Ltd, which is manufacturer of generic biopharmaceuticals for oncology and neurology, for 782.4 million INR.
Recent License Deals Summary - Agreement with AstraZeneca KK for co-promotion and supply of Esomeprazole in Japan.
23: Eisai Co Ltd
Revenues2010: 8.7 billion USD2009: 7.8 billion USD2008: 6.4 billion USD
Revenue CAGR (2008 - 2010) 15.9%Net profit (2010) 551.7 million USDNet profit CAGR (2008 - 2010) NM
R&D expenses2010: 1.9 billion USD (22.3% of revenues)2009: 1.6 billion USD (20.0% of revenues)2008: 2.0 billion USD (31.1% of revenues)
Number of employees 11,653Location of headquarters JapanPrincipal areas of business Prescription and diagnostic drugs, medical equipment, food, livestock feeds, chemicals and agrochemicalsSegmental revenue breakdown (2010) Pharmaceuticals: 96.4%; Others: 3.6%Geographical revenue breakdown (2010) Presence in Japan; North America; Europe; China; Rest of AsiaTop 3 biopharmaceutical drugs (2010) Aricept: 3.8 billion USD; Aciphex/Pariet: 1.6 billion USD; Aloxi: 408.5 million USDRecent Acquisition Summary - Acquired US based AkaRx Inc for 255.0 million USD.
Recent License Deals Summary
- Exclusive agreement with Teikoku Seiyaku Co Ltd to market the anti-inflammatory analgesic poultice, Haojishi, in China.
- Sanko Junyaku Co Ltd (subsidiary) signed an agreement with Sekisui Medical Co Ltd for exclusive marketing right of RapidTesta FLU II in Japan.
- Agreement with Arena Pharmaceuticals Inc for exclusive US rights to commercialize Lorcaserin.- License agreement with Helsinn Healthcare SA for commercialization of a new product for potential use in the
prevention of chemotherapy-induced nausea and vomiting in the US.- Agreement with Almirall SA for exclusive rights to develop, manufacture and market Cinitapride in China.
24: Gilead Sciences Inc
Revenues2010: 7.9 billion USD2009: 7.0 billion USD2008: 5.3 billion USD
Revenue CAGR (2008 - 2010) 22.1%Net profit (2010) 2.9 billion USDNet profit CAGR (2008 - 2010) 21.1%
R&D expenses2010: 1.1 billion USD (13.5% of revenues)2009: 939.9 million USD (13.4% of revenues)2008: 721.8 million USD (13.5% of revenues)
Number of employees 3,852Location of headquarters USPrincipal areas of business Therapeutics for life-threatening diseases including HIV/AIDS, liver diseases, cardiovascular and respiratory ailmentsSegmental revenue breakdown (2010) Product Sales: 93.0%; Royalty: 7.0%Geographical revenue breakdown (2010) US: 45.7%; International: 36.6%; Worldwide Other Revenues: 17.8%Top 3 biopharmaceutical drugs (2010) Atripla: 2.9 billion USD; Truvada: 2.6 billion USD; Viread: 732.2 million USD
Recent Acquisition Summary - Announced acquisition of CGI Pharmaceuticals Inc, which develops small molecule therapeutics for oncology, allergy, auto-immune and inflammatory diseases. The deal is currently pending.
Recent License Deals Summary NA

IMAP’s Pharma & Biotech Industry Global Report — 2011: Appendix A-xiii
25: Alcon Inc
RevenuesTTM: 6.5 billion USD2009: 6.3 billion USD2008: 5.6 billion USD
Revenue CAGR (2007 - 2009) 7.7%Net profit (TTM) 2.1 billion USDNet profit CAGR (2007 - 2009) 12.5%
R&D expensesTTM: 741.0 million USD (10.5% of revenues)2009: 665.0 million USD (10.2% of revenues)2008: 618.7 million USD (9.8% of revenues)
Number of employees 15,700Location of headquarters SwitzerlandPrincipal areas of business Pharmaceuticals, surgical equipment and devices for eye careSegmental revenue breakdown (TTM) Ophthalmic Surgical: 45.0%; Ophthalmic Pharmaceuticals: 42.4%; Consumer Eye Care: 12.6%Geographical revenue breakdown (TTM) International: 55.5%; US: 44.5%Top 3 biopharmaceutical drugs (TTM) Glaucoma: 1.3 billion USD; Otic: 405.0 million USD
Recent Acquisition Summary
- Announced acquisition of LenSx Lasers Inc, a surgical laser equipment designer, for 361.5 million USD. The deal is currently pending.
- Acquired certain assets of Sirion Therapeutics Inc.- Acquired certain assets of Tenby Pharma Inc.- Acquired Israel based Optonol Ltd.
Recent License Deals Summary NA
26: Mylan Inc
RevenuesTTM: 5.4 billion USD2009: 5.1 billion USD2008: 5.1 billion USD
Revenue CAGR (2007 - 2009) 38.2%Net profit (TTM) 225.1 million USDNet profit CAGR (2007 - 2009) NM
R&D expensesTTM: 272.7 million USD (5.1% of revenues)2009: 275.3 million USD (5.4% of revenues)2008: 317.2 billion USD (6.2% of revenues)
Number of employees 15,500Location of headquarters USPrincipal areas of business APIs and respiratory, allergy and psychiatric therapiesSegmental revenue breakdown (TTM) Generics: 92.5%; Specialty: 9.1%; Corporate/Other: (1.6%)Geographical revenue breakdown (TTM) NATop 3 biopharmaceutical drugs (TTM) NARecent Acquisition Summary - Acquired Bioniche Pharma Holdings, a manufacturer of injectable pharmaceuticals, for 550.0 million USD.
Recent License Deals Summary
- Dey Pharma LP (affiliate) signed a license agreement with Meda for the exclusive marketing and distribution rights of EpiPen Auto-Injector in Europe.
- Settlement and license agreements with Forest Laboratories and Merz Pharmaceuticals related to Namenda tablets (5 mg and 10 mg) in the US.
27: Les Laboratoires Servier SAS
Revenues2010: 5.0 billion USD2009: NA2008: NA
Revenue CAGR (2008 - 2010) 34.0%Net profit (2010) (62.5 million USD)Net profit CAGR (2008 - 2010) NAR&D expenses NANumber of employees 20,000Location of headquarters FrancePrincipal areas of business Drugs primarily for neurosciences, oncology, cardiovascular diseases, metabolic diseases and rheumatologySegmental revenue breakdown (2010) NAGeographical revenue breakdown (2010) NATop 3 biopharmaceutical drugs (2010) NARecent Acquisition Summary NA
Recent License Deals Summary - Agreement with Galapagos NV for joint discovery and development of novel small molecules for osteoarthritis and commercialization of these drugs worldwide, except in the US.

IMAP’s Pharma & Biotech Industry Global Report — 2011: Appendix A-xiv
28: Allergan Inc
RevenuesTTM: 4.8 billion USD2009: 4.5 billion USD2008: 4.4 billion USD
Revenue CAGR (2007 - 2009) 6.9%Net profit (TTM) (41.0 million USD)Net profit CAGR (2007 - 2009) 11.6%
R&D expensesTTM: 789.5 million USD (16.3% of revenues)2009: 706.0 million USD (15.7% of revenues)2008: 797.9 million USD (18.1% of revenues)
Number of employees 8,300Location of headquarters USPrincipal areas of business Pharmaceuticals, biologics and medical devicesSegmental revenue breakdown (TTM) Specialty Pharmaceuticals: 80.8%; Medical Devices: 17.2%; Other: 2.0%Geographical revenue breakdown (TTM) US: 61.9; Europe: 19.0%; Asia Pacific: 6.5%; Latin America: 6.3%; Other regions: 4.1%; Other operations: 2.1%
Top 3 biopharmaceutical drugs (TTM) Restasis: 608.9 million USD; Lumigan: 507.5 million USD; Alphagen P, Alphagen & Combigan: 400.9 million USD
Recent Acquisition Summary - Acquired US based Serica Technologies Inc for 63.7 million USD.
Recent License Deals Summary - Agreement with Serenity Pharmaceuticals LLC for exclusive worldwide rights to develop, manufacture and commercialize Ser-120.
29: Kyowa Hakko Kirin Co Ltd
Revenues2010: 4.7 billion USD2009: 4.6 billion USD2008: 3.4 billion USD
Revenue CAGR (2008 - 2010) 17.2%Net profit (2010) 253.6 million USDNet profit CAGR (2008 - 2010) 10.9%
R&D expenses2010: 505.1 million USD (10.7% of revenues)2009: 483.5 million USD (10.5% of revenues)2008: 299.5 million USD (8.7% of revenues)
Number of employees 7,499Location of headquarters JapanPrincipal areas of business Protein produced by genetic recombination, anti-anemia agent, glycoprotein, human erythropoietinSegmental revenue breakdown (2010) Pharmaceuticals: 48.3%; Chemicals: 29.9%; Biochemicals: 19.4%; Wholesale/Logistics: 2.4%Geographical revenue breakdown (2010) Japan: 79.4%; Rest of Asia: 9.6%; North America: 5.7%; Europe: 5.2%; Rest of world: 0.1%Top 3 biopharmaceutical drugs (2010) NESP/ESPO: 511.7 million USD; Allelock: 313.5 million USD; Coniel: 224.5 million USD
Recent Acquisition Summary- Announced acquisition of partial stake in Japan based Kashiwagi Corporation. The deal is currently pending.- Announced acquisition of partial stake in Miyako Kagaku Co Ltd, a wholesaler of drugs and toiletries. The deal is currently pending.
Recent License Deals Summary - Agreement with Reata Pharmaceuticals Inc for exclusive right to develop and commercialize Bardoxolone Methyl in Japan, China, Taiwan, Korea and Southeast Asian markets.
30: Biogen Idec Inc
RevenuesTTM: 4.6 billion USD2009: 4.4 billion USD2008: 4.1 billion USD
Revenue CAGR (2007 - 2009) 17.5%Net profit (TTM) 1.1 billion USDNet profit CAGR (2007 - 2009) 23.2%
R&D expensesTTM: 1.2 billion USD (26.8% of revenues)2009: 1.3 billion USD (29.3% of revenues)2008: 1.1 billion USD (26.2% of revenues)
Number of employees 4,750Location of headquarters USPrincipal areas of business Therapies for neurology, oncology and immunologySegmental revenue breakdown (TTM) Product Sales: 73.2%; Unconsolidated Joint Business: 23.3%; Other Revenues: 3.5%Geographical revenue breakdown (TTM) NATop 3 biopharmaceutical drugs (TTM) Avonex: 2.5 billion USD; Tysabri: 874.7 million USD; Fumaderm: 51.5 million USD
Recent Acquisition Summary - Acquired a subsidiary of Neurimmune Holding AG, which includes the world-wide rights to three pre-clinical immunotherapy programs, for an initial payment of 32.5 million USD.
Recent License Deals Summary - Agreement with Knopp Neurosciences for the development of KNS-760704 and its potential commercialization in global markets.

IMAP’s Pharma & Biotech Industry Global Report — 2011: Appendix A-xv
31: Mitsubishi Tanabe Pharma Corporation
Revenues2010: 4.4 billion USD2009: 4.1 billion USD2008: 2.8 billion USD
Revenue CAGR (2008 - 2010) 25.5%Net profit (2010) 326.2 million USDNet profit CAGR (2008 - 2010) 30.0%
R&D expenses2010: 895.9 million USD (20.5% of revenues)2009: 730.4 million USD (17.6% of revenues)2008: 525.1 million USD (18.8% of revenues)
Number of employees 9,294Location of headquarters Japan
Principal areas of business Drugs for cardiac arrest, hypertension, circulatory diseases and ulcerHealth care products, food additives, pesticides, cosmetics and medical products for veterinary use
Segmental revenue breakdown (2010) Pharmaceutical Manufacturing: 97.8%; Synthetic: 2.2%Geographical revenue breakdown (2010) Japan: 93.4%; Overseas: 6.6%Top 3 biopharmaceutical drugs (2010) NARecent Acquisition Summary NA
32: Chugai Pharmaceutical Co Ltd
RevenuesTTM: 4.4 billion USD2009: 4.6 billion USD2008: 3.2 billion USD
Revenue CAGR (2007 - 2009) 25.1%Net profit (TTM) 489.4 million USDNet profit CAGR (2007 - 2009) 33.4%
R&D expensesTTM: 641.8 million USD (14.5% of revenues)2009: 591.9 million USD (12.9% of revenues)2008: 516.3 million USD (16.3% of revenues)
Number of employees 6,723Location of headquarters JapanPrincipal areas of business Drugs for cancer, infectious diseases, bone, blood and circulatory systemsSegmental revenue breakdown (TTM) Pharmaceuticals: 98.4%; Other: 1.6%Geographical revenue breakdown (TTM) Japan: 90.2%; Rest of world: 9.8%Top 3 biopharmaceutical drugs (TTM) Avastin: 530.3 million USD; Epogin: 461.6 million USD; Neutrogin: 321.7 million USDRecent Acquisition Summary NA
33: Nycomed S.C.A. SICAR**
RevenuesTTM: 4.3 billion USD2009: 4.6 billion USD2008: 4.7 billion USD
Revenue CAGR (2007 - 2009) (4.8%)Net profit (TTM) (43.9 million USD)Net profit CAGR (2007 - 2009) (1.4%)
R&D expensesTTM: 265.0 million USD (6.2% of revenues)2009: 284.7 million USD (6.2% of revenues)2008: 314.0 million USD (6.7% of revenues)
Number of employees 12,043Location of headquarters SwitzerlandPrincipal areas of business Medicines in gastrointestinal, respiratory & inflammatory diseases, pain, osteoporosis, & tissue management areas
Segmental revenue breakdown (TTM) Europe: 55.8%; Russia/CIS: 13.8%; North America: 12.8%; Latin America: 10.8%; Asia Pacific, Africa and Middle East: 7.4%
Geographical revenue breakdown (TTM) NATop 3 biopharmaceutical drugs (TTM) NARecent Acquisition Summary - Acquired China based Guangdong Techpool Bio-Pharma Co Ltd for 210.0 million USD.

IMAP’s Pharma & Biotech Industry Global Report — 2011: Appendix A-xvi
34: Genzyme Corporation
RevenuesTTM: 4.2 billion USD2009: 4.5 billion USD2008: 4.6 billion USD
Revenue CAGR (2007 - 2009) 8.8%Net profit (TTM) (26.5 million USD)Net profit CAGR (2007 - 2009) (6.2%)
R&D expensesTTM: 882.1 million USD (20.8% of revenues)2009: 865.3 million USD (19.2% of revenues)2008: 1.3 billion USD (28.4% of revenues)
Number of employees 12,000Location of headquarters US
Principal areas of business Therapeutics for rare disorders, renal diseases, orthopedics, cancer, transplant and immune diseases, diagnostics and predictive testing; Diagnostics products and services
Segmental revenue breakdown (TTM) Product Sales: 92.3%; Service Revenues: 7.6%; R&D Revenues: 0.1%Geographical revenue breakdown (TTM) NATop 3 biopharmaceutical drugs (TTM) Renagel/Renvela: 692.3 million USD; Cerezyme: 603.0 million USD; Synvisc/Synvisc-One: 382.6 million USDRecent Acquisition Summary NA
35: Forest Laboratories Inc
Revenues2010: 4.1 billion USD2009: 3.8 billion USD2008: 3.7 billion USD
Revenue CAGR (2008 - 2010) 5.2%Net profit (2010) 682.4 million USDNet profit CAGR (2008 - 2010) (16.0%)
R&D expenses2010: 1.1 billion USD (25.6% of revenues)2009: 661.3 million USD (17.2% of revenues)2008: 671.0 million USD (18.1% of revenues)
Number of employees 5,200Location of headquarters USPrincipal areas of business Branded and generic prescription drugs, non-prescription pharmaceutical productsSegmental revenue breakdown (2010) Pharmaceutical: 95.7%; Contract revenue: 4.3%Geographical revenue breakdown (2010) NATop 3 biopharmaceutical drugs (2010) Lexapro: 2.3 billion USD; Namenda: 1.2 billion USD; Bystolic: 244.4 million USDRecent Acquisition Summary NA
36: Hospira Inc
RevenuesTTM: 4.0 billion USD2009: 3.9 billion USD2008: 3.6 billion USD
Revenue CAGR (2007 - 2009) 6.3%Net profit (TTM) 393.3 million USDNet profit CAGR (2007 - 2009) 71.9%
R&D expensesTTM: 277.0 million USD (7.0% of revenues)2009: 240.5 million USD (6.2% of revenues)2008: 211.9 million USD (5.8% of revenues)
Number of employees 13,500Location of headquarters US
Principal areas of business Generic acute-care and oncology injectables and integrated infusion therapy and medication management systems
Segmental revenue breakdown (TTM) Pharmaceuticals: 70.6%; Devices: 24.7%; Other: 4.7%Geographical revenue breakdown (TTM) The Americas: 80.0%; EMEA: 12.9%; Asia, Japan and Australia: 7.2%Top 3 biopharmaceutical drugs (TTM) NA
Recent Acquisition Summary- Acquired Javelin Pharmaceuticals, a manufacturer of specialty drugs for pain relief, for 140.8 million USD.- Acquired generic injectable pharmaceuticals business of Orchid Chemicals and Pharmaceuticals Ltd for 400.0 million USD.
37: CSL Ltd
Revenues2010: 3.9 billion USD2009: 3.5 billion USD2008: 3.2 billion USD
Revenue CAGR (2008 - 2010) 11.0%Net profit (2010) 928.9 million USDNet profit CAGR (2008 - 2010) 21.5%
R&D expenses2010: 279.4 million USD (7.1% of revenues)2009: 232.9 million USD (6.7% of revenues)2008: 201.8 million USD (6.3% of revenues)
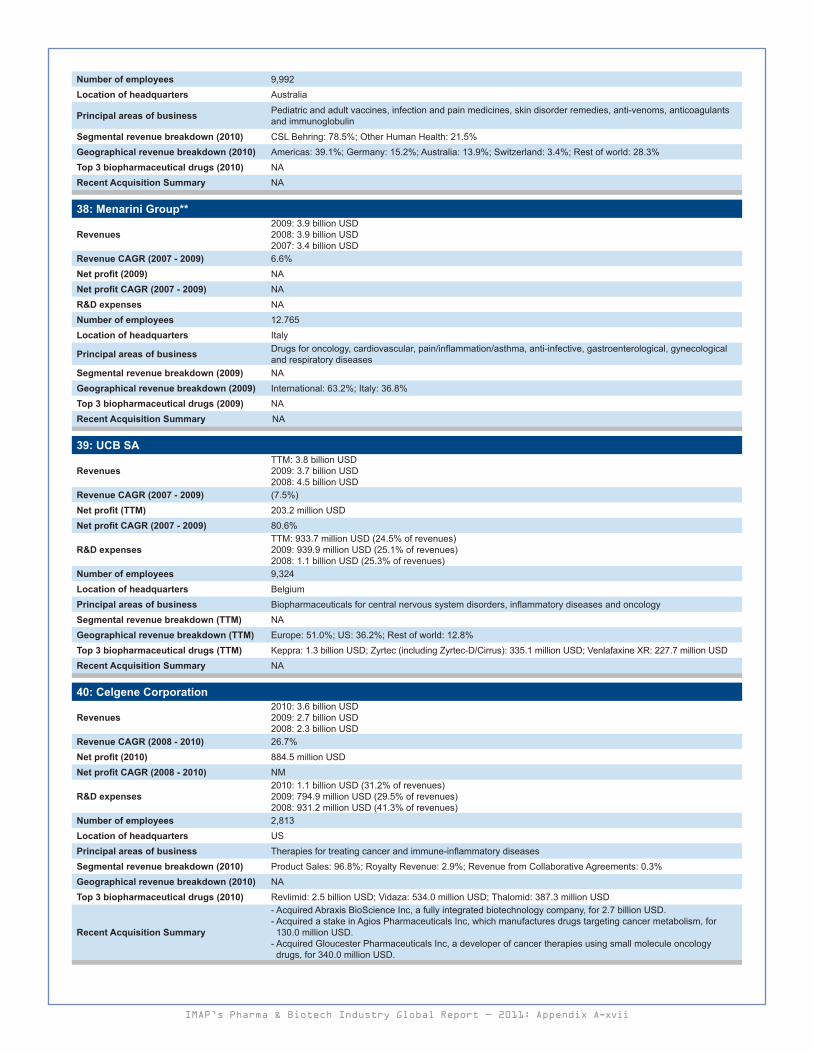
IMAP’s Pharma & Biotech Industry Global Report — 2011: Appendix A-xvii
Number of employees 9,992Location of headquarters Australia
Principal areas of business Pediatric and adult vaccines, infection and pain medicines, skin disorder remedies, anti-venoms, anticoagulants and immunoglobulin
Segmental revenue breakdown (2010) CSL Behring: 78.5%; Other Human Health: 21.5%Geographical revenue breakdown (2010) Americas: 39.1%; Germany: 15.2%; Australia: 13.9%; Switzerland: 3.4%; Rest of world: 28.3%Top 3 biopharmaceutical drugs (2010) NARecent Acquisition Summary NA
38: Menarini Group**
Revenues 2009: 3.9 billion USD2008: 3.9 billion USD2007: 3.4 billion USD
Revenue CAGR (2007 - 2009) 6.6%Net profit (2009) NANet profit CAGR (2007 - 2009) NAR&D expenses NANumber of employees 12.765Location of headquarters Italy
Principal areas of business Drugs for oncology, cardiovascular, pain/inflammation/asthma, anti-infective, gastroenterological, gynecological and respiratory diseases
Segmental revenue breakdown (2009) NAGeographical revenue breakdown (2009) International: 63.2%; Italy: 36.8%Top 3 biopharmaceutical drugs (2009) NARecent Acquisition Summary NA
39: UCB SA
RevenuesTTM: 3.8 billion USD2009: 3.7 billion USD2008: 4.5 billion USD
Revenue CAGR (2007 - 2009) (7.5%)Net profit (TTM) 203.2 million USDNet profit CAGR (2007 - 2009) 80.6%
R&D expensesTTM: 933.7 million USD (24.5% of revenues)2009: 939.9 million USD (25.1% of revenues)2008: 1.1 billion USD (25.3% of revenues)
Number of employees 9,324Location of headquarters BelgiumPrincipal areas of business Biopharmaceuticals for central nervous system disorders, inflammatory diseases and oncologySegmental revenue breakdown (TTM) NAGeographical revenue breakdown (TTM) Europe: 51.0%; US: 36.2%; Rest of world: 12.8%Top 3 biopharmaceutical drugs (TTM) Keppra: 1.3 billion USD; Zyrtec (including Zyrtec-D/Cirrus): 335.1 million USD; Venlafaxine XR: 227.7 million USDRecent Acquisition Summary NA
40: Celgene Corporation
Revenues2010: 3.6 billion USD2009: 2.7 billion USD2008: 2.3 billion USD
Revenue CAGR (2008 - 2010) 26.7%Net profit (2010) 884.5 million USDNet profit CAGR (2008 - 2010) NM
R&D expenses2010: 1.1 billion USD (31.2% of revenues)2009: 794.9 million USD (29.5% of revenues)2008: 931.2 million USD (41.3% of revenues)
Number of employees 2,813Location of headquarters USPrincipal areas of business Therapies for treating cancer and immune-inflammatory diseasesSegmental revenue breakdown (2010) Product Sales: 96.8%; Royalty Revenue: 2.9%; Revenue from Collaborative Agreements: 0.3%Geographical revenue breakdown (2010) NATop 3 biopharmaceutical drugs (2010) Revlimid: 2.5 billion USD; Vidaza: 534.0 million USD; Thalomid: 387.3 million USD
Recent Acquisition Summary
- Acquired Abraxis BioScience Inc, a fully integrated biotechnology company, for 2.7 billion USD.- Acquired a stake in Agios Pharmaceuticals Inc, which manufactures drugs targeting cancer metabolism, for 130.0 million USD.
- Acquired Gloucester Pharmaceuticals Inc, a developer of cancer therapies using small molecule oncology drugs, for 340.0 million USD.

IMAP’s Pharma & Biotech Industry Global Report — 2011: Appendix A-xviii
41: Shire PLC
RevenuesTTM: 3.4 billion USD2009: 3.0 billion USD2008: 3.0 billion USD
Revenue CAGR (2007 - 2009) 11.5%Net profit (TTM) 597.0 million USDNet profit CAGR (2007 - 2009) NM
R&D expensesTTM: 621.8 million USD (18.1% of revenues)2009: 638.3 million USD (21.2% of revenues)2008: 494.3 million USD (16.4% of revenues)
Number of employees 3,769Location of headquarters Ireland
Principal areas of business Prescription medicines for attention deficit, hyperactivity disorders, human genetic therapies, gastrointestinal and renal diseases.
Segmental revenue breakdown (TTM) Specialty Pharmaceuticals: 66.1%; Human Genetics Therapies: 23.1%; Royalties: 10.8%Geographical revenue breakdown (TTM) NATop 3 biopharmaceutical drugs (TTM) Vyvanse: 598.6 million USD; Adderall XR: 464.2 million USD; Elaprase: 391.6 million USD
Recent Acquisition Summary - Acquired Movetis NV, focusing on treatments for gastrointestinal conditions, for 318.9 million EUR.- Acquired Lexington Technology Park campus in the US.
42: Watson Pharmaceuticals Inc
RevenuesTTM: 3.4 billion USD2009: 2.8 billion USD2008: 2.5 billion USD
Revenue CAGR (2007 - 2009) 5.8%Net profit (TTM) 223.0 million USDNet profit CAGR (2007 - 2009) 25.5%
R&D expensesTTM: 257.6 million USD (7.6% of revenues)2009: 197.3 million USD (7.1% of revenues)2008: 170.1 million USD (6.7% of revenues)
Number of employees 5,830Location of headquarters USPrincipal areas of business Generic, specialty, nephrology and urology productsSegmental revenue breakdown (TTM) Generic: 63.5%; Distribution: 24.3%; Brand: 12.2%Geographical revenue breakdown (TTM) NATop 3 biopharmaceutical drugs (TTM) NA
Recent Acquisition Summary - Acquired CRINONE Progesterone gel production line from Columbia Laboratories Inc for 47.0 million USD.- Acquired UK based Eden Biopharm Group Ltd for 15.0 million USD.
43: Dainippon Sumitomo Pharma Co Ltd
Revenues2010: 3.2 billion USD2009: 2.6 billion USD2008: 2.3 billion USD
Revenue CAGR (2008 - 2010) 17.4%Net profit (2010) 226.0 million USDNet profit CAGR (2008 - 2010) 0.3%
R&D expenses2010: 554.0 million USD (17.3% of revenues)2009: 527.8 million USD (20.0% of revenues)2008: 415.0 million USD (18.0% of revenues)
Number of employees 7,513Location of headquarters Japan
Principal areas of business Pharmaceuticals for human and veterinary use, livestock feeds, food additives and chemical products, clinical pathology tests for animals
Segmental revenue breakdown (2010) Pharmaceuticals: 91.3%; Animal Medicine: 8.7%Geographical revenue breakdown (2010) Japan: 35.0%; Rest of world: 65.0%Top 3 biopharmaceutical drugs (2010) Amlodin: 514.6 million USD; Meropen: 308.8 million USD; Gasmotin: 243.6 million USDRecent Acquisition Summary NA
44: Shionogi & Co Ltd
Revenues2010: 3.0 billion USD2009: 2.3 billion USD2008: 1.9 billion USD
Revenue CAGR (2008 - 2010) 26.3%Net profit (2010) 416.5 million USDNet profit CAGR (2008 - 2010) 37.6%
R&D expenses2010: 558.7 million USD (18.6% of revenues)2009: 527.8 million USD (23.2% of revenues)2008: 353.8 million USD (18.6% of revenues)

IMAP’s Pharma & Biotech Industry Global Report — 2011: Appendix A-xix
Number of employees 5,486Location of headquarters JapanPrincipal areas of business Prescription and OTC drugs and diagnosticsSegmental revenue breakdown (2010) Pharmaceuticals and related business: 99.1%; Logistic Services: 0.9%Geographical revenue breakdown (2010) Presence in Japan; North America; Europe; Rest of AsiaTop 3 biopharmaceutical drugs (2010) Crestor: 295.3 million USD; Flomox: 254.5 million USD; Rinderon: 105.1 million USDRecent Acquisition Summary NA
45: Warner Chilcott PLC
RevenuesTTM: 3.0 billion USD2009: 1.4 billion USD2008: 938.1 million USD
Revenue CAGR (2007 - 2009) 26.3%Net profit (TTM) 146.0 million USDNet profit CAGR (2007 - 2009) 321.9%
R&D expensesTTM: 145.0 million USD (4.9% of revenues)2009: 76.7 million USD (5.3% of revenues)2008: 50.0 million USD (5.3% of revenues)
Number of employees 2,700Location of headquarters IrelandPrincipal areas of business Branded prescription products for women’s healthcare and dermatologySegmental revenue breakdown (TTM) NAGeographical revenue breakdown (TTM) US: 76.1%; Rest of world: 23.9%Top 3 biopharmaceutical drugs (TTM) Actonel: 1.0 billion USD; Asacol: 653.2 million USD; Loestrin 24 FE: 325.0 million USDRecent Acquisition Summary NA
46: Taisho Pharmaceutical Co Ltd
Revenues2010: 2.8 billion USD2009: 2.6 billion USD2008: 2.2 billion USD
Revenue CAGR (2008 - 2010) 12.7%Net profit (2010) 210.1 million USDNet profit CAGR (2008 - 2010) (2.2%)
R&D expenses2010: 303.2 million USD (10.9% of revenues)2009: 275.0 million USD (10.7% of revenues)2008: 217.3 million USD (9.8% of revenues)
Number of employees 5,664Location of headquarters Japan
Principal areas of business Pharmaceuticals, foods and related products
Segmental revenue breakdown (2010) Self-medication Operations: 62.2%; Prescription Pharmaceutical Operations: 37.8%Geographical revenue breakdown (2010) Japan: 100.0%Top 3 biopharmaceutical drugs (2010) Lipovitan Series: 804.9 million USD; Pabron Series: 271.5 million USD; Clarith: 255.2 million USDRecent Acquisition Summary NA
47: H Lundbeck A/S
RevenuesTTM: 2.7 billion USD2009: 2.8 billion USD2008: 2.6 billion USD
Revenue CAGR (2007 - 2009) 12.9%Net profit (TTM) 448.9 million USDNet profit CAGR (2007 - 2009) 7.4%
R&D expensesTTM: 544.2 million USD (19.8% of revenues)2009: 598.5 million USD (23.2% of revenues)2008: 589.8 million USD (25.8% of revenues)
Number of employees 5,631Location of headquarters DenmarkPrincipal areas of business Drugs for treatment of psychiatric and neurological disordersSegmental revenue breakdown (TTM) Pharmaceuticals: 98.1%; Other Revenue: 1.9%Geographical revenue breakdown (TTM) Europe: 53.3%; US: 25.6%; Rest of world:19.1%; Other Revenue: 1.9%Top 3 biopharmaceutical drugs (TTM) Cipralex: 1.0 billion USD; Lexapro: 460.2 million USD; Ebixa: 430.5 million USD
Recent Acquisition Summary - Announced acquisition of intellectual property and other assets of Merck & Co Inc. The deal us currently pending.

IMAP’s Pharma & Biotech Industry Global Report — 2011: Appendix A-xx
48: Cephalon Inc
RevenuesTTM: 2.6 billion USD2009: 2.2 billion USD2008: 2.0 billion USD
Revenue CAGR (2007 - 2009) 11.2%Net profit (TTM) 428.7 million USDNet profit CAGR (2007 - 2009) NM
R&D expensesTTM: 408.8 million USD (15.6% of revenues)2009: 395.4 million USD (18.0% of revenues)2008: 362.2 million USD (18.3% of revenues)
Number of employees 3,026Location of headquarters USPrincipal areas of business Medications to treat nervous system disorders, cancer and painSegmental revenue breakdown (TTM) Products: 97.8%; Other Revenue: 2.2%Geographical revenue breakdown (TTM) US: 78.1%; Europe: 21.9%Top 3 biopharmaceutical drugs (TTM) Provigil: 1.1 billion USD; Treanda: 346.5 million USD; Fentora: 168.2 million USD
Recent Acquisition Summary
- Announced acquisition of US based BioAssets Development Corporation for 30.0 million USD. The deal is currently pending.
- Announced acquisition of partial stake in Mesoblast Ltd, which develops treatments for orthopedic conditions, for 222.4 million AUD. The deal is currently pending.- Acquired Switzerland based Mepha AG for 662.4 million CHF.- Acquired US based Ception Therapeutics Inc for 250.0 million USD.
49: Stada Arzneimittel AG
RevenuesTTM: 2.2 billion USD2009: 2.2 billion USD2008: 2.4 billion USD
Revenue CAGR (2007 - 2009) 0.8%Net profit (TTM) 92.0 million USDNet profit CAGR (2007 - 2009) (1.0%)
R&D expensesTTM: 70.5 million USD (3.2% of revenues)2009: 65.1 million USD (3.0% of revenues)2008: 68.4 million USD (2.8% of revenues)
Number of employees 8,083Location of headquarters GermanyPrincipal areas of business Generics, branded products, cancer therapy and other special pharmaceuticalsSegmental revenue breakdown (2009) Generics: 71.1%; Branded Products: 25.0%; Commercial Business: 3.3%; Other: 0.6%Geographical revenue breakdown (2009) Europe: 85.5%; Asia: 2.2%; Rest of world: 12.4%Top 3 biopharmaceutical drugs (2009) NARecent Acquisition Summary NA
50: Actavis Group HF**Revenues (June 2007) TTM: 1.9 billion USDRevenue CAGR (2008 - 2010) NANet profit (TTM) 71.0 million USDNet profit CAGR (2008 - 2010) NAR&D expenses TTM: 98.5 million USD (5.2% of revenues)Number of employees 10,874Location of headquarters Iceland
Principal areas of business Generic pharmaceutical products for human use covering multiple medical fields including alimentary tract and metabolism, cardiovascular system, central nervous system and genito-urinary and sex hormones
Segmental revenue breakdown (TTM) NAGeographical revenue breakdown (TTM) Central and Eastern Europe and Asia: 40.5%; Western Europe, Middle East and Africa: 32.1%; US: 27.3%Top 3 biopharmaceutical drugs (TTM) NARecent Acquisition Summary NA
Source: Bloomberg, Capital IQ, Company Web sites **This company is private and hence data availability is limited.

IMAP’s Pharma & Biotech Industry Global Report — 2011: Appendix B-i
The mega-merger boom of 2009 may have cooled, but pharma and biotech companies’ appetite for M&A barely dimmed last year. The pharma sector saw 548 deals valued at $51.5 billion USD in 2010, representing a sharp decline of 68 percent in terms of deal value ($161.2 billion USD during the previous period with 563 deals). Dollar volume in this period included one major deal (Teva Pharma/Ratiopharm), which represented $4.9 billion USD or nearly 9.6 percent of total dollar volume. During the previous period, the largest deal was the acquisition of Wyeth by Pfizer for $67.9 billion USD.
Particulars 2009 2010Total number of deals 563 548
Deals with available transaction value 314 309
Total transaction value $161.2 billion USD $51.6 billion USD
Largest deal Acquisition of Wyeth by Pfizer for $67.9 billion USD
Acquisition of Ratiopharm by Teva Pharma for $4.9 billion USD
Top 5 deals as a % of total deal value 78.4% 38.8%
In terms of geography, the US saw the highest transaction value of 25.6 billion USD with a total of 114 deals in 2010. Germany came in second with a value of $5.4 billion USD through 18 deals.
Top Five Countries No. of transactions Value (USD bn)United States 114 25.6
Germany 18 5.4
India 48 4.9
China 105 3.4
Brazil 13 1.9
In terms of transaction value, the US and Europe leads the way through mega deals while China leads in micro size deals of less than $20 million USD.
U.S. Europe Japan China Latin America RoW TOTAL
Undisclosed Deals 47 79 16 26 7 64 239
Up to $20 Million USD 21 24 6 58 2 55 166
$20 to $50 Million USD 13 10 2 13 5 17 60
$50 to $100 Million USD 11 7 2 3 2 4 29
$100 to $250 Million USD 10 3 0 2 1 4 20
$250 to $500 Million USD 4 5 1 2 1 0 13
Above $500 Million USD 8 6 0 1 1 5 21
TOTAL 114 134 27 105 19 149 548
1 Only mergers and acquisitions have been considered and this analysis includes pure pharma deals and other deals related to the medical technology, diagnostics arenas, nutritionals, animal drugs etc. Source: Thomson M&A Database
Appendix B: Summary of M&A transactions1 in the pharma sector
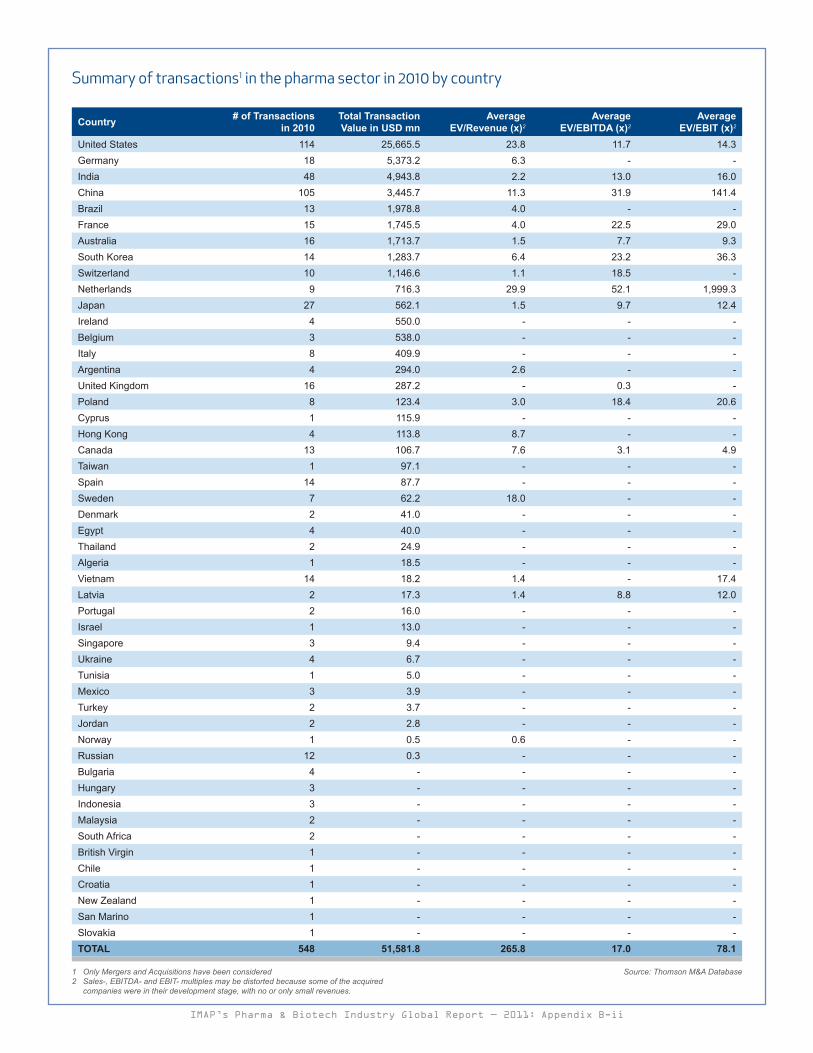
IMAP’s Pharma & Biotech Industry Global Report — 2011: Appendix B-ii
Country # of Transactions in 2010
Total Transaction Value in USD mn
Average EV/Revenue (x)2
Average EV/EBITDA (x)2
Average EV/EBIT (x)2
United States 114 25,665.5 23.8 11.7 14.3 Germany 18 5,373.2 6.3 - - India 48 4,943.8 2.2 13.0 16.0 China 105 3,445.7 11.3 31.9 141.4 Brazil 13 1,978.8 4.0 - - France 15 1,745.5 4.0 22.5 29.0 Australia 16 1,713.7 1.5 7.7 9.3 South Korea 14 1,283.7 6.4 23.2 36.3 Switzerland 10 1,146.6 1.1 18.5 - Netherlands 9 716.3 29.9 52.1 1,999.3 Japan 27 562.1 1.5 9.7 12.4 Ireland 4 550.0 - - - Belgium 3 538.0 - - - Italy 8 409.9 - - - Argentina 4 294.0 2.6 - - United Kingdom 16 287.2 - 0.3 - Poland 8 123.4 3.0 18.4 20.6 Cyprus 1 115.9 - - - Hong Kong 4 113.8 8.7 - - Canada 13 106.7 7.6 3.1 4.9 Taiwan 1 97.1 - - - Spain 14 87.7 - - - Sweden 7 62.2 18.0 - - Denmark 2 41.0 - - - Egypt 4 40.0 - - - Thailand 2 24.9 - - - Algeria 1 18.5 - - - Vietnam 14 18.2 1.4 - 17.4 Latvia 2 17.3 1.4 8.8 12.0 Portugal 2 16.0 - - - Israel 1 13.0 - - - Singapore 3 9.4 - - - Ukraine 4 6.7 - - - Tunisia 1 5.0 - - - Mexico 3 3.9 - - - Turkey 2 3.7 - - - Jordan 2 2.8 - - - Norway 1 0.5 0.6 - - Russian 12 0.3 - - - Bulgaria 4 - - - - Hungary 3 - - - - Indonesia 3 - - - - Malaysia 2 - - - - South Africa 2 - - - - British Virgin 1 - - - - Chile 1 - - - - Croatia 1 - - - - New Zealand 1 - - - - San Marino 1 - - - - Slovakia 1 - - - - TOTAL 548 51,581.8 265.8 17.0 78.1
Summary of transactions1 in the pharma sector in 2010 by country
1 Only Mergers and Acquisitions have been considered Source: Thomson M&A Database2 Sales-, EBITDA- and EBIT- multiples may be distorted because some of the acquired
companies were in their development stage, with no or only small revenues.
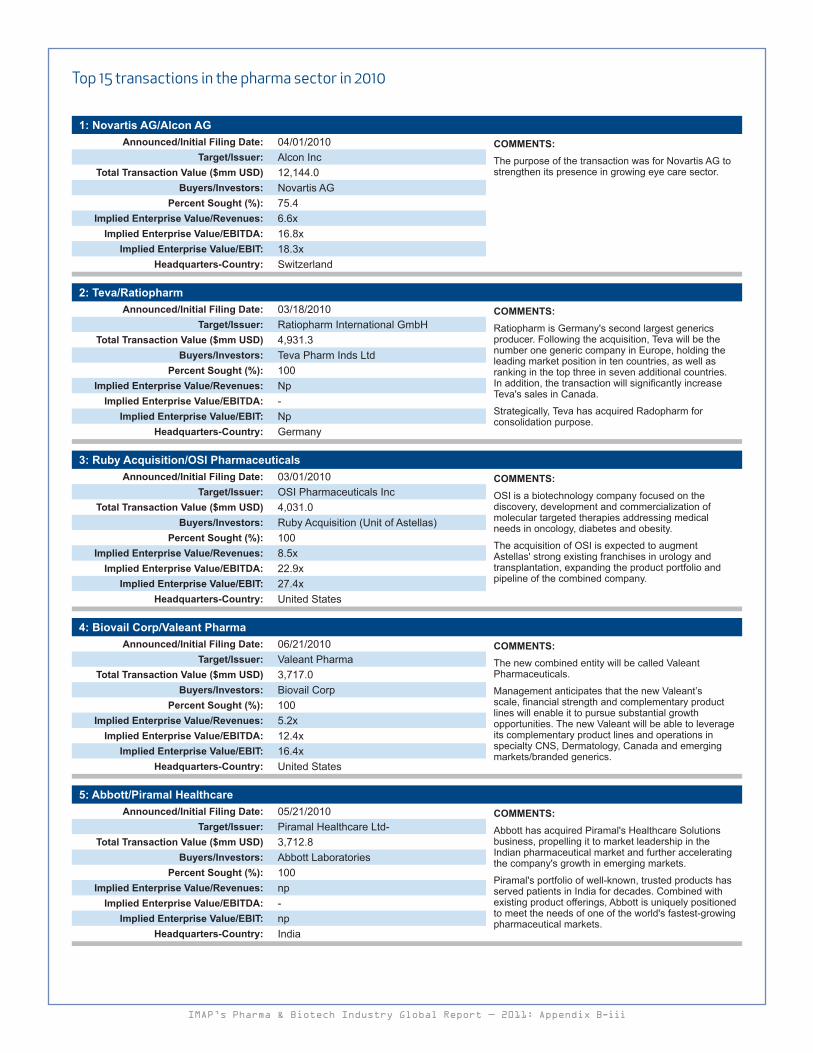
IMAP’s Pharma & Biotech Industry Global Report — 2011: Appendix B-iii
Top 15 transactions in the pharma sector in 2010
1: Novartis AG/Alcon AG Announced/Initial Filing Date: 04/01/2010 COMMENTS:
The purpose of the transaction was for Novartis AG to strengthen its presence in growing eye care sector.
Target/Issuer: Alcon IncTotal Transaction Value ($mm USD) 12,144.0
Buyers/Investors: Novartis AGPercent Sought (%): 75.4
Implied Enterprise Value/Revenues: 6.6xImplied Enterprise Value/EBITDA: 16.8x
Implied Enterprise Value/EBIT: 18.3xHeadquarters-Country: Switzerland
2: Teva/Ratiopharm Announced/Initial Filing Date: 03/18/2010 COMMENTS:
Ratiopharm is Germany's second largest generics producer. Following the acquisition, Teva will be the number one generic company in Europe, holding the leading market position in ten countries, as well as ranking in the top three in seven additional countries. In addition, the transaction will significantly increase Teva's sales in Canada.Strategically, Teva has acquired Radopharm for consolidation purpose.
Target/Issuer: Ratiopharm International GmbHTotal Transaction Value ($mm USD) 4,931.3
Buyers/Investors: Teva Pharm Inds LtdPercent Sought (%): 100
Implied Enterprise Value/Revenues: NpImplied Enterprise Value/EBITDA: -
Implied Enterprise Value/EBIT: NpHeadquarters-Country: Germany
3: Ruby Acquisition/OSI Pharmaceuticals Announced/Initial Filing Date: 03/01/2010 COMMENTS:
OSI is a biotechnology company focused on the discovery, development and commercialization of molecular targeted therapies addressing medical needs in oncology, diabetes and obesity. The acquisition of OSI is expected to augment Astellas' strong existing franchises in urology and transplantation, expanding the product portfolio and pipeline of the combined company.
Target/Issuer: OSI Pharmaceuticals IncTotal Transaction Value ($mm USD) 4,031.0
Buyers/Investors: Ruby Acquisition (Unit of Astellas)Percent Sought (%): 100
Implied Enterprise Value/Revenues: 8.5xImplied Enterprise Value/EBITDA: 22.9x
Implied Enterprise Value/EBIT: 27.4xHeadquarters-Country: United States
4: Biovail Corp/Valeant Pharma Announced/Initial Filing Date: 06/21/2010 COMMENTS:
The new combined entity will be called Valeant Pharmaceuticals.Management anticipates that the new Valeant’s scale, financial strength and complementary product lines will enable it to pursue substantial growth opportunities. The new Valeant will be able to leverage its complementary product lines and operations in specialty CNS, Dermatology, Canada and emerging markets/branded generics.
Target/Issuer: Valeant PharmaTotal Transaction Value ($mm USD) 3,717.0
Buyers/Investors: Biovail CorpPercent Sought (%): 100
Implied Enterprise Value/Revenues: 5.2xImplied Enterprise Value/EBITDA: 12.4x
Implied Enterprise Value/EBIT: 16.4xHeadquarters-Country: United States
5: Abbott/Piramal Healthcare Announced/Initial Filing Date: 05/21/2010 COMMENTS:
Abbott has acquired Piramal's Healthcare Solutions business, propelling it to market leadership in the Indian pharmaceutical market and further accelerating the company's growth in emerging markets. Piramal's portfolio of well-known, trusted products has served patients in India for decades. Combined with existing product offerings, Abbott is uniquely positioned to meet the needs of one of the world's fastest-growing pharmaceutical markets.
Target/Issuer: Piramal Healthcare Ltd-Total Transaction Value ($mm USD) 3,712.8
Buyers/Investors: Abbott LaboratoriesPercent Sought (%): 100
Implied Enterprise Value/Revenues: npImplied Enterprise Value/EBITDA: -
Implied Enterprise Value/EBIT: npHeadquarters-Country: India
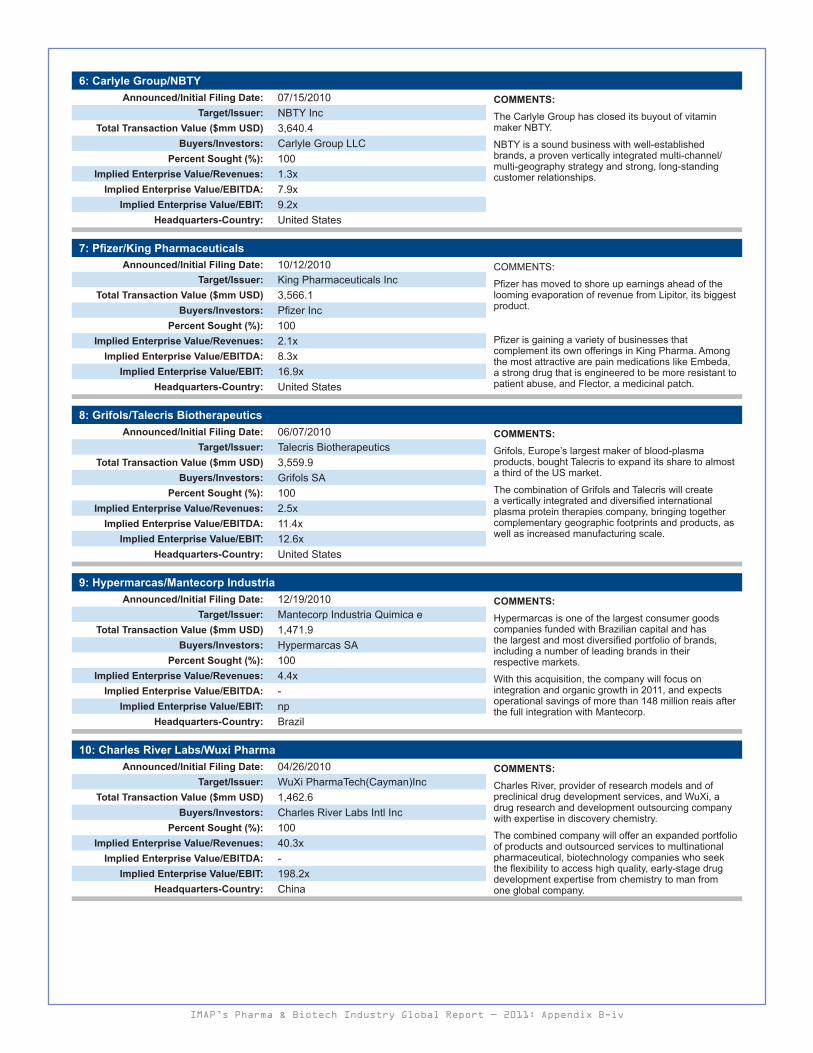
IMAP’s Pharma & Biotech Industry Global Report — 2011: Appendix B-iv
6: Carlyle Group/NBTY Announced/Initial Filing Date: 07/15/2010 COMMENTS:
The Carlyle Group has closed its buyout of vitamin maker NBTY. NBTY is a sound business with well-established brands, a proven vertically integrated multi-channel/multi-geography strategy and strong, long-standing customer relationships.
Target/Issuer: NBTY IncTotal Transaction Value ($mm USD) 3,640.4
Buyers/Investors: Carlyle Group LLCPercent Sought (%): 100
Implied Enterprise Value/Revenues: 1.3xImplied Enterprise Value/EBITDA: 7.9x
Implied Enterprise Value/EBIT: 9.2xHeadquarters-Country: United States
7: Pfizer/King Pharmaceuticals Announced/Initial Filing Date: 10/12/2010 COMMENTS:
Pfizer has moved to shore up earnings ahead of the looming evaporation of revenue from Lipitor, its biggest product.
Pfizer is gaining a variety of businesses that complement its own offerings in King Pharma. Among the most attractive are pain medications like Embeda, a strong drug that is engineered to be more resistant to patient abuse, and Flector, a medicinal patch.
Target/Issuer: King Pharmaceuticals IncTotal Transaction Value ($mm USD) 3,566.1
Buyers/Investors: Pfizer IncPercent Sought (%): 100
Implied Enterprise Value/Revenues: 2.1xImplied Enterprise Value/EBITDA: 8.3x
Implied Enterprise Value/EBIT: 16.9xHeadquarters-Country: United States
8: Grifols/Talecris Biotherapeutics Announced/Initial Filing Date: 06/07/2010 COMMENTS:
Grifols, Europe’s largest maker of blood-plasma products, bought Talecris to expand its share to almost a third of the US market.The combination of Grifols and Talecris will create a vertically integrated and diversified international plasma protein therapies company, bringing together complementary geographic footprints and products, as well as increased manufacturing scale.
Target/Issuer: Talecris BiotherapeuticsTotal Transaction Value ($mm USD) 3,559.9
Buyers/Investors: Grifols SAPercent Sought (%): 100
Implied Enterprise Value/Revenues: 2.5xImplied Enterprise Value/EBITDA: 11.4x
Implied Enterprise Value/EBIT: 12.6xHeadquarters-Country: United States
9: Hypermarcas/Mantecorp Industria Announced/Initial Filing Date: 12/19/2010 COMMENTS:
Hypermarcas is one of the largest consumer goods companies funded with Brazilian capital and has the largest and most diversified portfolio of brands, including a number of leading brands in their respective markets. With this acquisition, the company will focus on integration and organic growth in 2011, and expects operational savings of more than 148 million reais after the full integration with Mantecorp.
Target/Issuer: Mantecorp Industria Quimica eTotal Transaction Value ($mm USD) 1,471.9
Buyers/Investors: Hypermarcas SAPercent Sought (%): 100
Implied Enterprise Value/Revenues: 4.4xImplied Enterprise Value/EBITDA: -
Implied Enterprise Value/EBIT: npHeadquarters-Country: Brazil
10: Charles River Labs/Wuxi Pharma Announced/Initial Filing Date: 04/26/2010 COMMENTS:
Charles River, provider of research models and of preclinical drug development services, and WuXi, a drug research and development outsourcing company with expertise in discovery chemistry. The combined company will offer an expanded portfolio of products and outsourced services to multinational pharmaceutical, biotechnology companies who seek the flexibility to access high quality, early-stage drug development expertise from chemistry to man from one global company.
Target/Issuer: WuXi PharmaTech(Cayman)IncTotal Transaction Value ($mm USD) 1,462.6
Buyers/Investors: Charles River Labs Intl IncPercent Sought (%): 100
Implied Enterprise Value/Revenues: 40.3xImplied Enterprise Value/EBITDA: -
Implied Enterprise Value/EBIT: 198.2xHeadquarters-Country: China

IMAP’s Pharma & Biotech Industry Global Report — 2011: Appendix B-v
11: Endo Pharmaceuticals/Qualitest Pharmaceuticals Announced/Initial Filing Date: 09/28/2010 COMMENTS:
Endo Pharmaceuticals had completed its acquisition of Qualitest Pharmaceuticals, a privately held generics company in the US for top-line growth.
Target/Issuer: Qualitest Pharmaceuticals IncTotal Transaction Value ($mm USD) 1,200
Buyers/Investors: Endo Pharmaceuticals HoldingsPercent Sought (%): 100
Implied Enterprise Value/Revenues: NpImplied Enterprise Value/EBITDA: -
Implied Enterprise Value/EBIT: npHeadquarters-Country: United States
12: Aspen Pharmacare/Herron Pharmaceuticals Announced/Initial Filing Date: 07/18/2010 COMMENTS:
Herron is an Australian brand of pharmaceutical and natural healthcare items.
Target/Issuer: Herron Pharmaceuticals Pty LtdTotal Transaction Value ($mm USD) 807.8
Buyers/Investors: Aspen Pharmacare Holdings LtdPercent Sought (%): 100
Implied Enterprise Value/Revenues: npImplied Enterprise Value/EBITDA: -
Implied Enterprise Value/EBIT: npHeadquarters-Country: Australia
13: Aspen Pharmacare/Sigma Pharm Announced/Initial Filing Date: 05/21/2010 COMMENTS:
Sigma had sold the unit of generic medicines and manufacturing. Aspen assumes that this is the biggest purchase of overseas assets by an African company. It will lead to cost savings and allow the company to introduce its own generic and over-the-counter products in Australia. The Durban, South Africa-based company is buying a business that Sigma blamed for a record loss in March and reduced earnings forecast in July.
Target/Issuer: Sigma Pharm Ltd-Pharm DivTotal Transaction Value ($mm USD) 803.4
Buyers/Investors: Aspen Pharmacare Holdings LtdPercent Sought (%): 100
Implied Enterprise Value/Revenues: NpImplied Enterprise Value/EBITDA: -
Implied Enterprise Value/EBIT: npHeadquarters-Country: Australia
14: Eli Lilly/Avid Radiopharmaceuticals Announced/Initial Filing Date: 11/08/2010 COMMENTS:
Avid Radiopharmaceuticals is a privately held company developing novel molecular imaging compounds intended for the detection and monitoring of chronic human diseases.The acquisition of Avid Radiopharmaceuticals aligns well with Lilly's innovation-based strategy, offers a potential near-term revenue opportunity, leverages our neuroscience expertise and will immediately bolster our diagnostics capabilities.
Target/Issuer: Avid Radiopharmaceuticals IncTotal Transaction Value ($mm USD) 800
Buyers/Investors: Eli Lilly & CoPercent Sought (%): 100
Implied Enterprise Value/Revenues: npImplied Enterprise Value/EBITDA: -
Implied Enterprise Value/EBIT: npHeadquarters-Country: United States
15:Reckitt Benckiser/Paras Pharmaceuticals Announced/Initial Filing Date: 12/13/2010 COMMENTS:
Paras is expected to make sales of more than 1 million INR in 2010, makes several OTC medication. The acquisition of Paras is another step forward in RB's growth strategy in consumer health care. It creates a material health care business in India, one of the most promising health care markets in the world with the addition of number of strong and leading brands.
Target/Issuer: Paras Pharmaceuticals LtdTotal Transaction Value ($mm USD) 722.5
Buyers/Investors: Reckitt Benckiser Group PLCPercent Sought (%): 100
Implied Enterprise Value/Revenues: npImplied Enterprise Value/EBITDA: -
Implied Enterprise Value/EBIT: npHeadquarters-Country: India
Source: ThomsonOne M&A database Note: Sales, EBITDA and EBIT multiples may be distorted because some of the acquired companies were in their development stage, with no or only small revenues.

IMAP’s Pharma & Biotech Industry Global Report — 2011: Appendix C-i
Market Size Estimation The global pharmaceutical market in 2010 is expected to grow by 8.3 percent and will reach at a level of $875 billion USD, driven by stronger near-term growth in the US market1. In 2009, the pharmaceutical market has grown meager to 3.5 percent with market size of $808 billion USD.
Currently, the global pharmaceutical market is dominated by US, which accounts for about 28 percent of global sales in 2009 followed by the EU accounting for roughly 15 percent and Japan accounting for 12 percent. Together, these three regions represent nearly 55 percent of the global market.
While the performance of the global pharmaceutical market is more positive in 2010 than in 2009, the fundamental dynamics of the innovation cycle, funding pressures, and the broader macroeconomic environment will result in mid-single-digit growth over the next five years. Notwithstanding the improved prospects in the US market, the drive by pharmaceutical manufacturers to adapt to the longer-term marketplace trends and evolving patient needs will continue undiminished.
According to Intercontinental Marketing Services (IMS) Health, global drug sales will rise in 2011 despite patent losses. Although patent expirations and limits on drug spending can hamper growth of drug sales in developed countries, global pharmaceutical sales are nonetheless expected to grow 5–7 percent in 2011, compared with 4–5 percent growth in 2010. IMS expects the global pharmaceutical market to reach $880 billion USD in 2011, up from $825 billion USD in 2010. Much of the rise will come from the 17 "pharmerging" markets2, where sales are forecast to rise 15–17 percent to $170–180 billion USD, boosted by greater government spending on healthcare. A great majority of the expansion is driven by explosive growth in China, now the world’s third largest market for pharmaceutical sales. Drug sales in that emerging market are expected to grow 25–27 percent in 2011, to more than $50 billion USD. Much slower growth in the five major European markets (France, Germany, Italy, Spain and the UK), along with Canada, is expected with 1–3 percent growth predicted. While the US is expected to remain the single largest pharmaceutical market, with sales of $320-330 billion USD, up 3-5 percent.
• Broadly, in 2011, products with sales of more than $30 billion USD are expected to face the prospect of generic competition.
1 IMS Health2 Emerging markets targeted by pharmaceutical companies (Pharm(aceutical) + (e)merg-
ing). List of countries includes Argentina, Brazil, China, Egypt, India, Indonesia, Mexico, Pakistan, Poland, Romania, Russia, South Africa, Thailand, Turkey, Ukraine, Venezuela, and Vietnam.
However, the full impact of patients shifting to lower-cost generics, as well as other brands in their therapy classes, will be mostly felt in 2012.
• Payers will continue to aim for limiting drug expenditure in 2011. Noticeable examples include sizeable cuts in the cost of generics. There will also be new price negotiations in Germany and cost cuts for branded products in Greece and Turkey. It will also be a crucial year for understanding how healthcare reform efforts in prominent markets.
In the long run, the global pharmaceutical market sales is expected to grow at a 5-8 percent CAGR through 2014, taking into account the impact of the global macro-economy, the changing mix of innovative and mature products, and the rising influence of healthcare access and funding on market demand. The global pharmaceutical market value is expected to expand over $1.1 trillion USD by 2014.• The effect of the innovation/patent loss misbalance will hamper
growth prospects in the next five years where a big misbalance is seen arising between new products and patent losses. This is the main factor that is limiting global pharmaceutical market growth to mid-single-digits up to 2014. While patent cliffs continue to hammer large sales-drivers, the newly launched products are not expected to generate the same amount of sales.
• Further, healthcare access and funding is under intensifying pressure as governments tackle ever rising healthcare costs. During the next five years, markets will be impacted by numerous payer actions, including the imposition of price cuts on existing drugs, the raising of standards required to achieve reimbursement of innovative therapies, and the use of economic incentives for prescribers and pharmacists to drive a shift to generic alternatives. Evidence of the value (in monetary terms) that medicines bring to healthcare systems will be required to achieve access and funding in both developed and emerging markets.
• However, the pharmerging markets in aggregate will grow strongly. The pharmerging countries are expected in aggregate to grow by 13-16 percent over the next five years. China's pharmaceutical market is expected to continue to grow at a 20+ percent pace annually, and contribute 21 percent of overall global growth through 2013. Russia and Turkey may be impacted significantly by new measures intended to reduce the level of healthcare spending in those two markets.
Appendix C: Pharmaceutical market overview and trends

IMAP’s Pharma & Biotech Industry Global Report — 2011: Appendix D-i
The generic drug industry has experienced substantial growth in the past few years. The global market for generic drugs was worth $107.8 billion USD in 2009 and is projected to reach $129.3 billion by 2014 with a CAGR of 9 percent. Rising healthcare costs have resulted in an increase in generic pharmaceutical usage.
United StatesThe US generics market is the world’s largest with generic penetration estimated at 68 percent by volume and 13 percent by value in the year to June 2008, making the US one of the most mature and saturated generics markets in the world1. An estimation of the US generics market size of $36.3 billion USD in 2009 is calculated2.• In 2008, generics accounted for more than 65 percent of all US
prescriptions and will be reaching almost 80 percent in the next few years.
• The key driver for the uptake of generics drugs is the cost-savings they bring, particularly as the US contemplates adoption of universal healthcare. In principle, savings derived from generics may be obtained both by increasing use and by extracting greater ‘value’ from current levels of utilization (such as greater pressure on prices). While both strategies are employed in the US, it is the former that dominates.
JapanAlthough Japan is the second largest pharmaceutical market in the world (after the US), the value of the Japanese generics market was estimated at a retail generics market size of $3.7 billion USD in 20093. Overall generics penetration remains low (estimated at 19 percent by volume in the year to June 2008).• The resistors to generics uptake include a lack of awareness of,
or trust in, generic drugs, and the absence of sufficient motivation to prescribe, dispense and use them, issues that both the government and industry are looking to address. Nonetheless, as is the case for most developed countries, the government is facing rising healthcare costs, and this is compounded by the fact that Japan is home to the most rapidly aging population in the world. Consequently, future generics reforms are expected which will impact brands in the world’s second largest pharmaceutical market.
Germany• Germany is Europe’s largest generic market. Generics represent
62 percent of the pharmaceutical market in terms of volume and 22 percent in value terms, with $6.1 billion USD sales in 20094.
United KingdomThe UK is the second largest generic market in Europe, with an estimated market size of $5 billion USD in 20085 with generics volume uptake in the UK recorded at 60 percent and value uptake 25 percent, in the year to June 2008.• Most (88 percent) prescriptions in the UK are dispensed free of
charge, with the minority of patients making a flat payment of £7.20 ($11.27). Prescription drug costs therefore put a significant strain on the healthcare budget, making generics utilization an increasingly important means of containing costs.
FranceIn France, generics represent 38 percent of the pharmaceutical market in terms of volume and 15 percent in value, with the French retail generics market valued at $4.1 billion USD in 20096.
1 Generic Pharmaceutical Association, 20102 MIDAS sales data, IMS Health, March 20103 Mylan, 20104 Mylan, 20105 Conmy, 2008 and IMS Health, March 20106 Mylan, 2010
ChinaChina is the largest generics market in Asia, and second largest in the world after the US, with an estimated market size of $13 billion USD in 20087. Generics drug use has been embraced by the Chinese healthcare market, with generics volume uptake recorded at 70 percent and value uptake at 62 percent in 20088.• The Chinese prescription pharmaceutical market generated $22.9
billion USD in 2009 which was a striking 26.5 percent increase over the previous year. One of the driving forces behind this rapid growth was the Chinese generics sector. According to the IMS China Hospital Audit released in June 2008, generics drug sales growth outperformed the overall pharmaceutical market, including traditional Chinese medicines.
• The generics share has grown from 54 percent in 1999 to 62 percent in 2008. The key driver for the uptake of generics drugs is the fact that the majority of pharmaceuticals available and covered by the Essential Drug List (EDL) and National Drug Reimbursement List (NDRL) in China are domestically manufactured generics, with a preference for cheap generics over more expensive branded drugs among poorer patients.
BrazilIn Brazil, retail sales of generic drugs were valued at $6.2 billion USD in 2008 with 83.2 percent of total pharmaceutical market sales. • Recently, the Brazilian generics market has become ever more
competitive, with 8.3 products on average registered per reference brand in September 2009 compared with just 2.2 in 20009. However, the market is dominated by domestic companies with the top seven companies in terms of number of approved generics in September 2009: EMS, Sigma Pharma, Nature’s Plus, Medley (acquired by Sanofi-Aventis in 2009), Eurofarma, Prati-Donaduzzi, and Teuto. Nevertheless, as exemplified by Sanofi-Aventis’ acquisition of Medley in 2009, multinational branded pharma companies are increasingly looking to penetrate this market.
IndiaThe Indian generics market is very heavily saturated, with generics making up 99.8 percent of the prescription sales market. Generics manufacturers in India benefit from the fact that intellectual property (IP) enforcement remains relatively lax. Uptake in the domestic generics market is and will continue to be driven primarily by the growing number of patients gaining access to affordable medicines.
Russia The generics industry in Russia is complex and fragmented, dominated by a small number of international generics manufacturers. Generics produced by these companies enjoy preferential uptake driven by their perceived superiority in terms of safety and efficacy to domestically manufactured generics, with Russians choosing to pay higher prices for guaranteed quality. While Russian generics producers do exist, they tend to be hampered by underfunding and poor manufacturing standards.• Despite the availability of Russian patent protection, enforceability
of patent laws is still weak and data exclusivity remains an unresolved issue. Consequently, in numerous cases, generics versions of branded drugs are available in Russia, even when the brand appears to be patent protected.
• In recent years, several different sets of legislation and policy decisions have been made which have had, and will continue to have both positive and negative impacts on the generics industry as a whole in Russia. The central theme of these decisions is to develop the domestic generics industry, and improve public confidence in Russian manufactured generics, however, significant investment will be required to achieve this, and with limited financial resources, progress is likely to be slow.
7 MIDAS sales data, IMS Health, March 20108 Chui, 2009a9 Business Monitor International, 2009
Appendix D: Generic market overview & trends

IMAP’s Pharma & Biotech Industry Global Report — 2011: Page 40
IMAP’s Healthcare Team
CroatiaJurgis Oniunas [email protected]
Czech RepublicMichal Misun [email protected]
DenmarkAndreas Lauth [email protected]
GermanyAlexander Bolz [email protected]
HungaryIstvan Preda [email protected]
IndiaShiraz Bugwadia [email protected]
ItalyAntonio Zecchino [email protected]
MexicoGabriel Millán [email protected]
SpainMireia Sauret [email protected]
Switzerland Christoph Bieri [email protected] Degen-Wick [email protected] Kurmann [email protected]
United Kingdom Mark Day [email protected] Jassal [email protected] Moore [email protected]
United StatesKurt [email protected] Cabrera [email protected] [email protected] Elahi [email protected]
Maegan Evans [email protected] Holland [email protected] Innes [email protected] Meyers [email protected] Steier [email protected] Mitchell Stern [email protected]
For a comprehensive list of IMAP advisors and to discover how IMAP can help you with your M&A transaction, go to www .imap .com.

Cross-border M&A requires local knowledge and experience . IMAP advisors located around the world have successfully completed thousands of M&A transactions . Let IMAP help you with your M&A project in 2011 .
Other industry reports available from IMAP: Automotive & Components Global Report, 2010 Alternative Energy Industry Global Report, 2010 Computing & Internet Software Global Report, 2010 Food & Beverage Industry Global Report, 2010 Retail Industry Global Report, 2010
For copies, visit the “Industries” page of www .imap .com.

www.imap.com© COPYRIGHT 2010 IMAP, INC. THIS REPORT AND THE INFORMATION HEREIN IS THE EXCLUSIVE DOMAIN OF IMAP AND MAY NOT BE USED OR REPRINTED WITHOUT PERMISSION. CONTACT [email protected].