Embed Size (px)
Citation preview

Pharmaceutical Misuse and its
Challenges:
Opioid Use in Ontario
Ontario Harm Reduction Conference
Tara Gomes
Tuesday January 31, 2012
Objectives
• To review the prescription opioid crisis
• To understand the extent of opioid-related harm in Ontario
• To review some potential strategies to reduce opioid-related harm

Opioid Prescribing and Safety
• Recent guidelines have suggested that the risks of long-term, high-dose opioid use for chronic non-cancer pain often exceed their benefits.
• Marketing:
– No intrinsic upper dose threshold
– OxyContin was initially marketed as being less likely to be abused due to its long-acting formulation.
• However:
– OxyContin can be crushed, and inhaled or injected
– Increasing trends in opioid-related mortality suggest that opioid use at high doses or in combination with other drugs is dangerous
• Many clinical guidelines now suggest 200 mg morphine (or
equivalent) as a ‘watchful’ dose.

Opioids : A Public Health Crisis
• Safety issues associated with opioids include:
– Abuse
– Addiction
– Diversion
– Opioid-related side effects including death
• There were over 20,000 prescription drug overdose deaths in the USA in 2008.
– Opioids were involved in 73.8% (14,800) of these deaths
– This has more than tripled since 1999

Objectives
• To review the prescription opioid crisis
• To understand the extent of opioid-related harm in Ontario
• To review some potential strategies to reduce opioid-related harm

How are Opioids being Prescribed in
Ontario?
• How has opioid prescribing changed in Ontario over the
past 20 years?
• Has opioid-related mortality increased over this time?
• How has dosing of opioids changed over time?
• Are higher doses associated with risk of mortality?

Methods: Data
• Prescribing data obtained from IMS Canada from 1991 to 2007 for all of Ontario
• ICES Administrative Datasets used to conduct linked analyses among ODB-eligible Ontarians
• Manual file review at Coroner’s office for deaths between 1991 and 2006
– All deaths flagged as involving drugs, alcohol or both were reviewed
Methods: Deaths
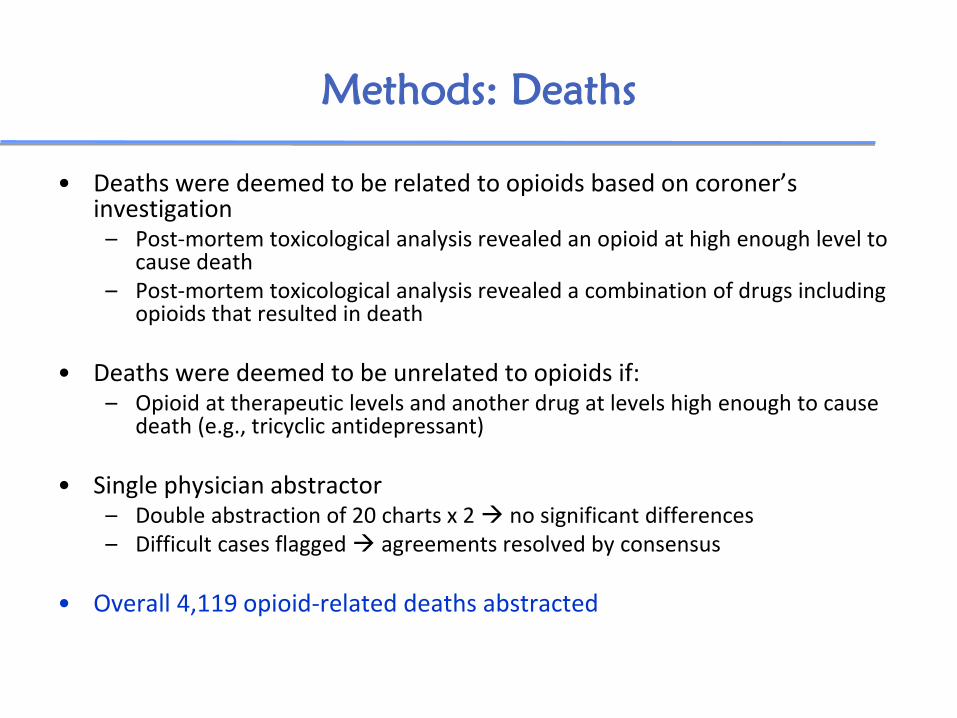
• Deaths were deemed to be related to opioids based on coroner’s investigation
– Post-mortem toxicological analysis revealed an opioid at high enough level to cause death
– Post-mortem toxicological analysis revealed a combination of drugs including opioids that resulted in death
• Deaths were deemed to be unrelated to opioids if: – Opioid at therapeutic levels and another drug at levels high enough to cause
death (e.g., tricyclic antidepressant)
• Single physician abstractor – Double abstraction of 20 charts x 2 no significant differences – Difficult cases flagged agreements resolved by consensus
• Overall 4,119 opioid-related deaths abstracted

4-fold increase in prescribing of opioids
385 380 391 384 386 374350 341 335
309 302 299 288 279 277 269 272
50 4652 54 59
5960 67 72
74 80 92 95 104 110 115 122
23 2526 31
3540
45 52 6274 89
106 129 146161 181
197
0
100
200
300
400
500
600
700
1991 1992 1993 1994 1995 1996 1997 1998 1999 2000 2001 2002 2003 2004 2005 2006 2007
Pre
sc
rip
tio
ns
pe
r th
ou
sa
nd
in
div
idu
als
pe
r y
ea
r
Oxycodone
Other opioid
Codeine
73 per
1000
319 per
1000
Dhalla I et al, Prescribing of opioid analgesics and related mortality before and after the introduction of long-acting oxycodone. CMAJ. 2009. 181(12):891-6.
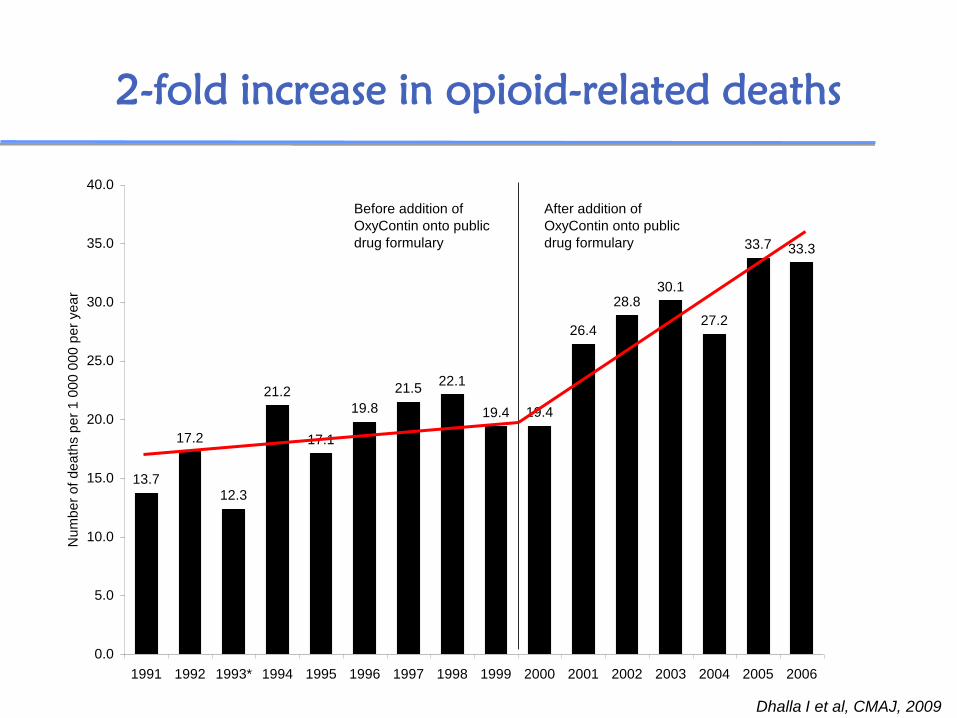
2-fold increase in opioid-related deaths
13.7
17.2
12.3
21.2
17.1
19.8
21.522.1
19.4 19.4
26.4
28.830.1
27.2
33.7 33.3
0.0
5.0
10.0
15.0
20.0
25.0
30.0
35.0
40.0
1991 1992 1993* 1994 1995 1996 1997 1998 1999 2000 2001 2002 2003 2004 2005 2006
Num
be
r o
f d
ea
ths p
er
1 0
00
00
0 p
er
ye
ar
Before addition of
OxyContin onto public
drug formulary
After addition of
OxyContin onto public
drug formulary
Dhalla I et al, CMAJ, 2009

9-fold increase in oxycodone-related deaths
0.10
0.76 0.651.02
1.64 1.711.51
1.94
1.39
2.91
4.03
5.78
8.40
7.17
11.24
12.93
0.00
2.00
4.00
6.00
8.00
10.00
12.00
14.00
1991 1992 1993* 1994 1995 1996 1997 1998 1999 2000 2001 2002 2003 2004 2005 2006
Num
be
r o
f d
ea
ths p
er
1 0
00
00
0 p
er
ye
ar
Before addition of
OxyContin onto public
drug formulary
After addition of
OxyContin onto public
drug formulary
Dhalla I et al, CMAJ, 2009
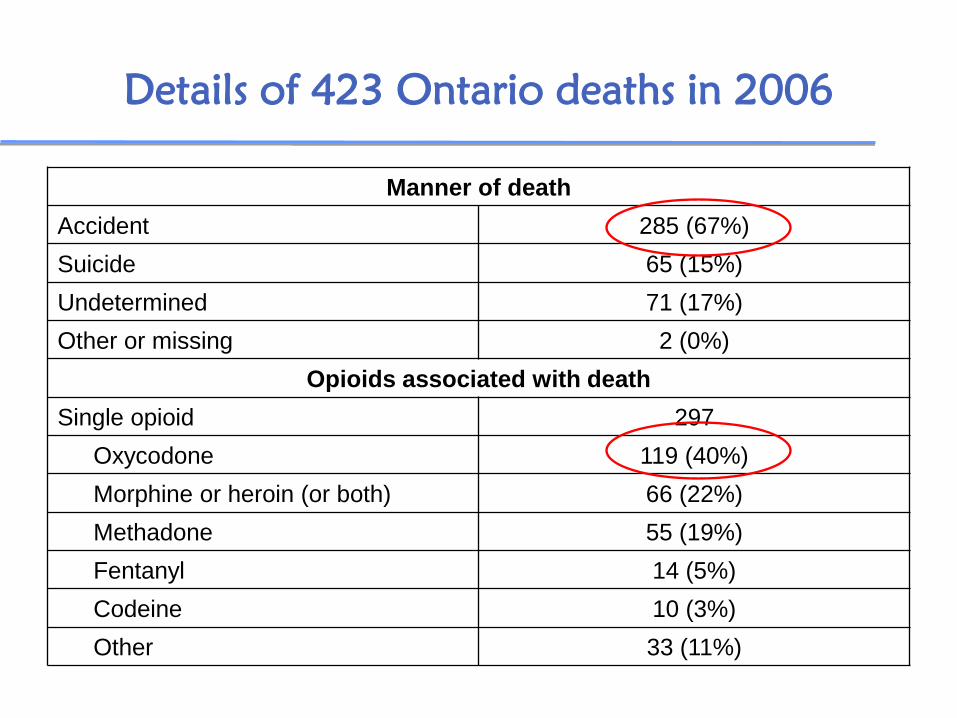
Details of 423 Ontario deaths in 2006
Manner of death
Accident 285 (67%)
Suicide 65 (15%)
Undetermined 71 (17%)
Other or missing 2 (0%)
Opioids associated with death
Single opioid 297
Oxycodone 119 (40%)
Morphine or heroin (or both) 66 (22%)
Methadone 55 (19%)
Fentanyl 14 (5%)
Codeine 10 (3%)
Other 33 (11%)

92% of deaths involve a non-opioid central
nervous system depressant
• 60% involved benzodiazepines
• 44% involved alcohol
• Also, antipsychotics, antihistamines, anticholinergics, antidepressants, etc.
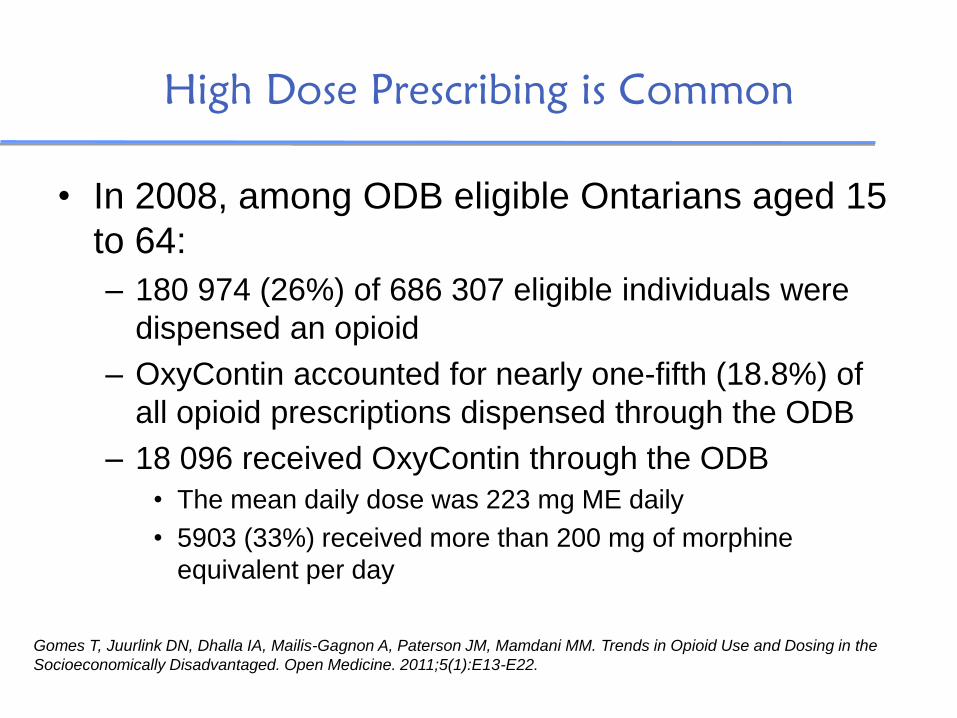
High Dose Prescribing is Common
• In 2008, among ODB eligible Ontarians aged 15
to 64:
– 180 974 (26%) of 686 307 eligible individuals were
dispensed an opioid
– OxyContin accounted for nearly one-fifth (18.8%) of
all opioid prescriptions dispensed through the ODB
– 18 096 received OxyContin through the ODB
• The mean daily dose was 223 mg ME daily
• 5903 (33%) received more than 200 mg of morphine
equivalent per day
Gomes T, Juurlink DN, Dhalla IA, Mailis-Gagnon A, Paterson JM, Mamdani MM. Trends in Opioid Use and Dosing in the
Socioeconomically Disadvantaged. Open Medicine. 2011;5(1):E13-E22.

Proportion of People prescribed >200mg
ME daily
Gomes T et al Open Medicine 2011
33%
22%

High-dose prescribing is associated with a 3-fold
increase risk of opioid-related death
Gomes T, Mamdani MM, Dhalla IA, Paterson JM, Juurlink DN. Opioid dose and drug-related mortality in patients with
nonmalignant pain. Arch Int Med. 2011. 171(7):686-691.

Objectives
• To review the prescription opioid crisis
• To understand the extent of opioid-related harm in Ontario
• To review some potential strategies to reduce opioid-related harm
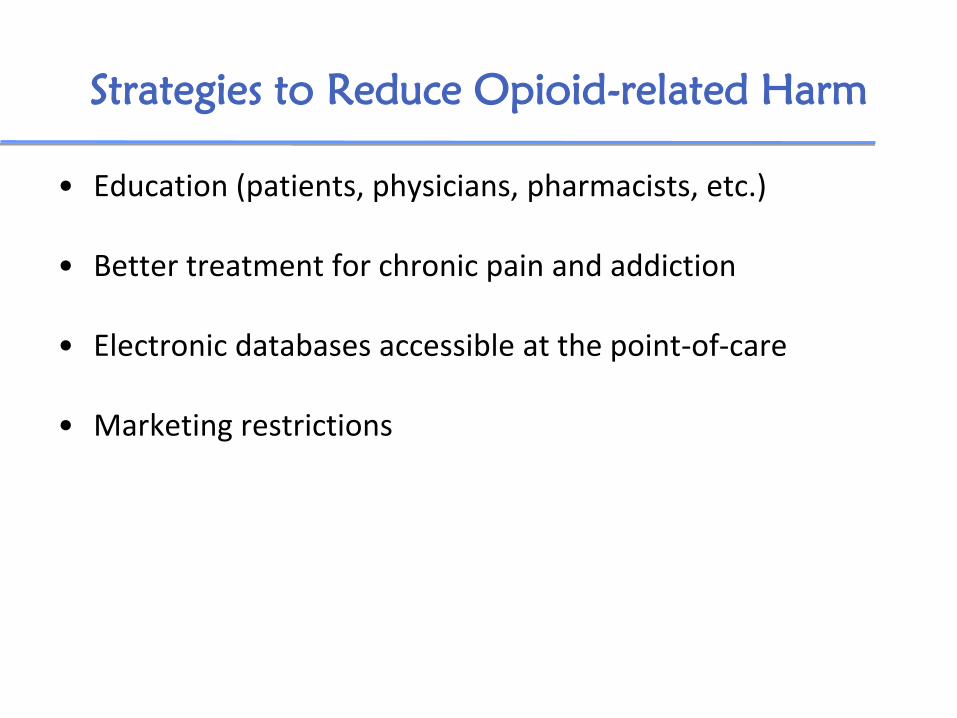
Strategies to Reduce Opioid-related Harm
• Education (patients, physicians, pharmacists, etc.)
• Better treatment for chronic pain and addiction
• Electronic databases accessible at the point-of-care
• Marketing restrictions

Strategies to Reduce Opioid-related Harm
• Education (patients, physicians, pharmacists, etc.)
• Better treatment for chronic pain and addiction
• Electronic databases accessible at the point-of-care
• Marketing restrictions

Educational interventions?
What will be the impact of educational
interventions?
• What was the effect of a course-based
intervention on physicians’ opioid prescribing
Where should they be targeted?
• How does opioid prescribing and related
mortality vary geographically in Ontario?

Would educating physicians reduce opioid-
related harm?
• Collaboration with the CPSO to evaluate the effectiveness of a CME course offered to Physicians focused on prescribing of drugs for chronic non-cancer pain
0
50000
100000
150000
200000
250000
-20 -18 -16 -14 -12 -10 -8 -6 -4 -2 1 3 5 7
Quarter
Am
ou
nt
of
Op
ioid
Dis
pe
ns
ed
(m
g M
E)
Control Non-Referred Referred
(a) (b) (c) (d)
Course
Completion
Prescribing among people aged 15-64
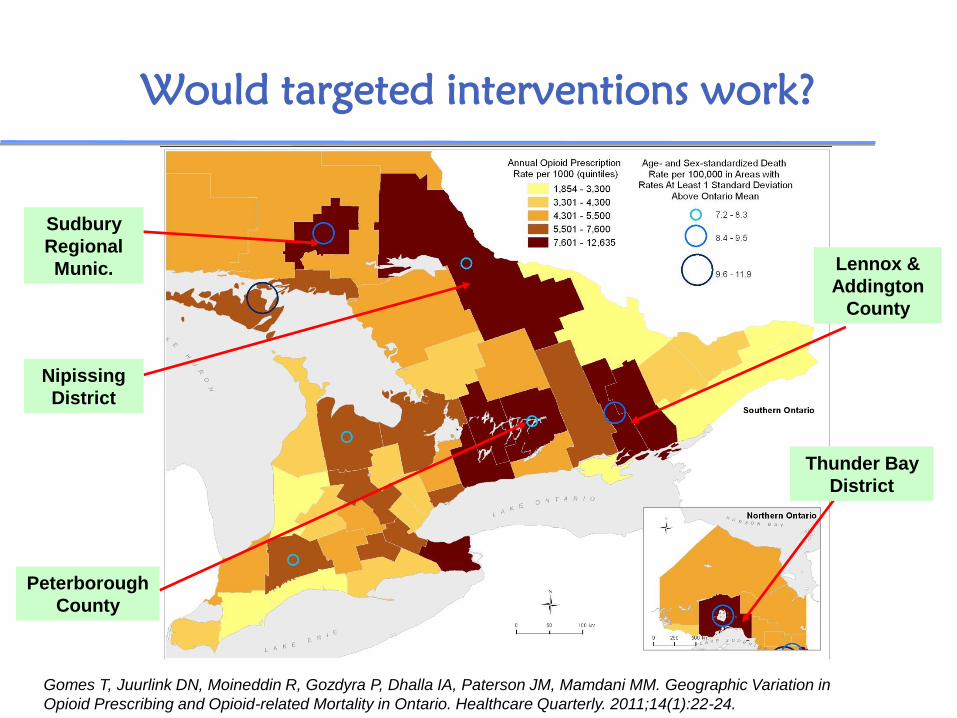
Would targeted interventions work?
Thunder Bay
District
Sudbury
Regional
Munic. Lennox &
Addington
County
Peterborough
County
Nipissing
District
Gomes T, Juurlink DN, Moineddin R, Gozdyra P, Dhalla IA, Paterson JM, Mamdani MM. Geographic Variation in
Opioid Prescribing and Opioid-related Mortality in Ontario. Healthcare Quarterly. 2011;14(1):22-24.

Should we Target Physicians?
Physicians prescribing high numbers of prescriptions tend
to be male, older and have been practicing longer than
those prescribing lower amounts of opioids
Dhalla I, Gomes T, Juurlink DN, Mamdani M. Clustering of opioid prescribing and opioid-related mortality among family
physicians in Ontario. Can Fam Phys. 2011. 57(3):e92-6.

Educational Interventions?
• One-time education (even if intensive) is likely to have little impact – Intervention by Colleges may be more impactful
• Given geographic variation, targeting of education (patients, prescribers and pharmacists) in specific regions should be considered

Strategies to Reduce Opioid-related Harm
• Education (patients, physicians, pharmacists, etc.)
• Better treatment for chronic pain and addiction
• Electronic databases accessible at the point-of-care
• Marketing restrictions

Methadone and Opioid Addiction
Sproule B et al. Changing patterns in opioid addiction: characterizing users of oxycodone and other opioids. Can Fam Phys. 2009. 55(1):68-69
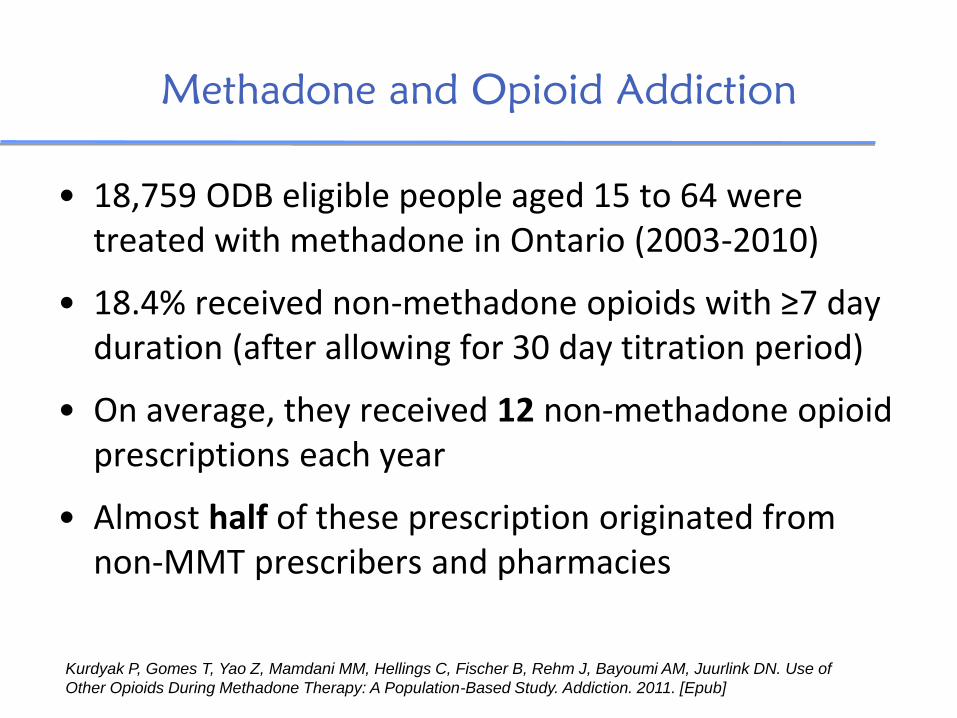
Methadone and Opioid Addiction
• 18,759 ODB eligible people aged 15 to 64 were treated with methadone in Ontario (2003-2010)
• 18.4% received non-methadone opioids with ≥7 day duration (after allowing for 30 day titration period)
• On average, they received 12 non-methadone opioid prescriptions each year
• Almost half of these prescription originated from non-MMT prescribers and pharmacies
Kurdyak P, Gomes T, Yao Z, Mamdani MM, Hellings C, Fischer B, Rehm J, Bayoumi AM, Juurlink DN. Use of
Other Opioids During Methadone Therapy: A Population-Based Study. Addiction. 2011. [Epub]

Strategies to Reduce Opioid-related Harm
• Education (patients, physicians, pharmacists, etc.)
• Better treatment for chronic pain and addiction • Electronic databases accessible at the point-of-care
• Marketing restrictions

Other Strategies
• Electronic databases accessible at the point-of-care – Current disconnect between prescribers and pharmacies
regarding patient prescribing history – Access to real-time data could allow for more rapid
identification of double-doctoring, potential diversion and drug-seeking behaviour
• Marketing/Funding restrictions – Maximum daily dose – Maximum quantity of medication – Removal of high dose formulations that are particularly
dangerous – Funding of patients through special programs (e.g. Exceptional
Access Program)