Embed Size (px)
Citation preview

Pharmaceutical Management for Malaria

PHARMACEUTICAL MANAGEMENT FOR MALARIA MANUAL
June 2000
Revised Edition 2004
Rational Pharmaceutical Management Plus Program USAID Cooperative Agreement Number:
HRN-A-00-00-00016-00
Management Sciences for Health 4301 North Fairfax Drive, Suite 400
Arlington, VA 22203 USA Telephone: 703-524-6575
Fax: 703-524-7898 E-mail: [email protected]
Web site: http://msh.org/rpmplus
PMM

Pharmaceutical Management for Malaria Manual
ii
This report was made possible through support provided by the U. S. Agency for International Development, under the terms of Cooperative Agreement Number HRN-A-00-00-00016-00. The opinions expressed herein are those of the authors and do not necessarily reflect the views of the U.S. Agency for International Development.
About RPM Plus
RPM Plus works in more than 20 developing countries to provide technical assistance to strengthen pharmaceutical and health commodity management systems. The program offers technical guidance and assists in strategy development and program implementation in improving the availability of health commodities—pharmaceuticals, vaccines, supplies, and basic medical equipment—of assured quality for maternal and child health, HIV/AIDS, infectious diseases, and family planning, as well as in promoting the appropriate use of health commodities in the public and private sectors.
Acknowledgments Cover photo, left (NI156_1): © 2000 Rebecca Janes. A young girl with malaria sits on her mother's lap at a hospital in Waslala, Nicaragua. Cover photo, right (433-14 Zambia): © 1999 Luke Mwanza/CCP, Courtesy of Photoshare. A woman feeds her infant a chloroquine tablet, an antimalarial drug used to treat and to prevent malaria; staged photo.
Recommended Citation
Rational Pharmaceutical Management Plus Program. 2004. Pharmaceutical Management for Malaria Manual. Prepared by Malcolm Clark 2002 and revised by Rima Shretta 2003. Submitted to the U.S. Agency for International Development by the Rational Pharmaceutical Management Plus Program. Arlington, VA: Management Sciences for Health.
Rational Pharmaceutical Management Plus Program Management Sciences for Health
4301 North Fairfax Drive, Suite 400 Arlington, VA 22203 USA Telephone: 703-524-6575
Fax: 703-524-7898 E-mail: [email protected]
Web site: http://msh.org/rpmplus

iii
CONTENTS
ACKNOWLEDGMENTS ............................................................................................................ vii
ACRONYMS................................................................................................................................. ix
GLOSSARY OF TERMS.............................................................................................................. xi
Chapter 1. INTRODUCTION........................................................................................................ 1 Background................................................................................................................................. 1 Cornerstones of Pharmaceutical Management: Selection, Procurement, Distribution, and Use .................................................................................................................. 3 Pharmaceutical Management in Support of Malaria Programs .................................................. 4 Objective..................................................................................................................................... 4 Purpose of the Assessment and Target Audience....................................................................... 5 Summary of the PMM Methodology.......................................................................................... 6 List of PMM Indicators............................................................................................................... 7 Limitations of the PMM Manual ................................................................................................ 9
Chapter 2. PREPARING FOR THE TWO-PART STUDY ....................................................... 13 Availability ............................................................................................................................... 13 Use ............................................................................................................................................ 13 Planning the Study .................................................................................................................... 14
Chapter 3. COLLECTING THE DATA...................................................................................... 35 Data Collection Methods .......................................................................................................... 35 Data Collection Techniques...................................................................................................... 37 Conducting the Survey.............................................................................................................. 42 Troubleshooting ........................................................................................................................ 44 Recording the Data ................................................................................................................... 47 Completing the Data Collection Instruments............................................................................ 48
Chapter 4. TRAINING FOR DATA COLLECTION.................................................................. 51 Preparatory Activities ............................................................................................................... 51 Training Tips............................................................................................................................. 52 Data Collection Teams.............................................................................................................. 55 Training Techniques ................................................................................................................. 56 Summary of Data Collection Forms ......................................................................................... 56 Data Collection in Health Facilities: Practice Session.............................................................. 61 Testing Reliability of Data Collected on Observation Checklists ............................................ 62
Chapter 5. ANALYZING DATA AND PRESENTING RESULTS........................................... 69 Calculating the Indicators and Summarizing the Information.................................................. 69 Interpreting the Results............................................................................................................. 70 Disseminating the Findings ...................................................................................................... 77 Preparing a Written Report ....................................................................................................... 77

Pharmaceutical Management for Malaria Manual
iv
Chapter 6. USING THE FINDINGS ........................................................................................... 81 Using the Findings to Develop Interventions ........................................................................... 81 Antimalarial Medicine Availability .......................................................................................... 82 Using the Findings to Monitor and Evaluate Programs............................................................ 87 Illustrative Indicator Targets..................................................................................................... 90
ANNEXES.................................................................................................................................... 91
Annex 1. PMM FORMS............................................................................................................... 93 DAS-1: Preparation Checklist for Data Collection................................................................... 93 DAS-2A: Inventory Data Form: Dispensary [page 1 of 1]....................................................... 94 DAS-2B: Inventory Data Form: Health Center [page 1 of 1]................................................... 95 DAS-2C: Inventory Data Form: District Hospital [page 1 of 1] .............................................. 96 DAS-2D: Inventory Data Form: Regional Hospital/Central and Regional Medical Stores [page 1 of 1]..................................................................................................... 97 DAS-2E: Inventory Data Form: Private Pharmacy/Retail Pharmaceutical Outlet [page 1 of 1] ......................................................................................... 98 DAS-3A: Stock-Out Data Form: Dispensary [page 1 of 1]...................................................... 99 DAS-3B. Stock-Out Data Form: Health Center [page 1 of 1]................................................ 100 DAS-3C: Stock-Out Data Form: District Hospital [page 1 of 1] ........................................... 101 DAS-3D: Stock-Out Data Form: Regional Hospital/Central and Regional Medical Stores [page 1 of 1]................................................................................................... 102 DAS-4: International Price Comparison Form [page 1 of 1].................................................. 103 DUS-1: Medical Records and Facility Review Form: Uncomplicated Malaria [page 1 of 3] .............................................................................................................. 104 DUS-1A: Medical Records and Facility Review Form: Uncomplicated Malaria [page 2 of 3] .............................................................................................................. 105 DUS-1B: Medical Records and Facility Review Form: Pregnant Women (Antenatal) [page 3 of 3] ........................................................................................... 106 DUS-2A: Observation of Health Worker Data Form [page 1 of 2]........................................ 107 DUS-2B: Observation of Health Worker Data Form [page 2 of 2]........................................ 108 DUS-3: Exit Poll Interview Form [page 1 of 1] ..................................................................... 109 DUS-4: Simulated Purchase Data Form for Uncomplicated Malaria in Private Pharmacies [page 1 of 1] ........................................................................................................ 110
Annex 2. PMM INDICATORS .................................................................................................. 111 List of PMM Indicators........................................................................................................... 111 Indicators Description Format ................................................................................................ 112 Drug Availability Study Indicators......................................................................................... 113 Drug Use Study Indicators...................................................................................................... 127 IPT Indicator ........................................................................................................................... 148 Supplemental Indicators ......................................................................................................... 151

Contents
v
Annex 3. SAMPLE FORMAT FOR PRESENTING PMM INDICATOR DATA.................... 161
Drug Availability Study Indicators......................................................................................... 161 Drug Use Study Indicators...................................................................................................... 163 IPT Indicator ........................................................................................................................... 165 Supplemental Indicators ......................................................................................................... 166
REFERENCES ........................................................................................................................... 169

Pharmaceutical Management for Malaria Manual
vi
vii
ACKNOWLEDGMENTS This manual was field-tested in South Africa in collaboration with the South East African Combination Antimalarial Therapy (SEACAT) Evaluation Team. Thanks to Dr. Karen Barnes for carrying out the field test and for reviewing this manual and the accompanying Data Collector’s Guide. Thank you also to John Chalker, Terry Green, Malcolm Clark, Grace Adeya, and Maria Miralles for reviewing the revised version.

Pharmaceutical Management for Malaria Manual
viii

ix
ACRONYMS
ACT artemisinin-based combination therapy BASICS Basic Support for Institutionalizing Child Survival CIF cost, insurance, and freight CMS Central Medical Store DAS Drug Availability Study DUS Drug Use Study EML Essential Medicines List FOB free on board GF Global Fund to Fight AIDS, Tuberculosis and Malaria HIV human immunodeficiency virus IMCI Integrated Management of Childhood Illness IPT intermittent preventive treatment INRUD International Network for Rational Use of Drugs MOH Ministry of Health MSH Management Sciences for Health NDF National Drug Formulary NGO nongovernmental organization OTC over-the-counter PMM Pharmaceutical Management for Malaria PMM Manual Pharmaceutical Management for Malaria Manual RBM Roll Back Malaria [Initiative] RMS Regional Medical Store RPM Rational Pharmaceutical Management [Program] STGs standard treatment guidelines SP sulfadoxine/pyrimethamine USAID U.S. Agency for International Development USD U.S. dollar VEN vital, essential, nonessential WHO World Health Organization

Pharmaceutical Management for Malaria Manual
x

xi
GLOSSARY OF TERMS Branded product Registered as a trademark by the manufacturer
Convenience sample Sample identified primarily by convenience; it is a nonprobability or nonrandom sampling technique that includes items without selecting known probabilities
Decentralized Removed from direct connection with the central authority
Denominator Term of a fraction usually written under the line; divisor
Exit poll interviews Interviews conducted with patients immediately upon the patient’s leaving the facility after an encounter with a provider to obtain information about the encounter
Generic Not registered as a trademark
Indicator Objective measure of conditions or functions of a pharmaceutical management system used to guide the evaluation of a program
Median Situated in or pertaining to the middle
Numerator Term of a fraction usually written above the line
Prevalent Widely existing or current
Prospective Looking forward in time
Proxy A substitute measurement or function used to give information about an actual function that cannot be feasibly measured
Retrospective Historical or in the past
Simulate Assume or give the appearance or effect of another
Troubleshooting Locating and presenting potential solutions to hypothetical problems

Pharmaceutical Management for Malaria Manual
xii

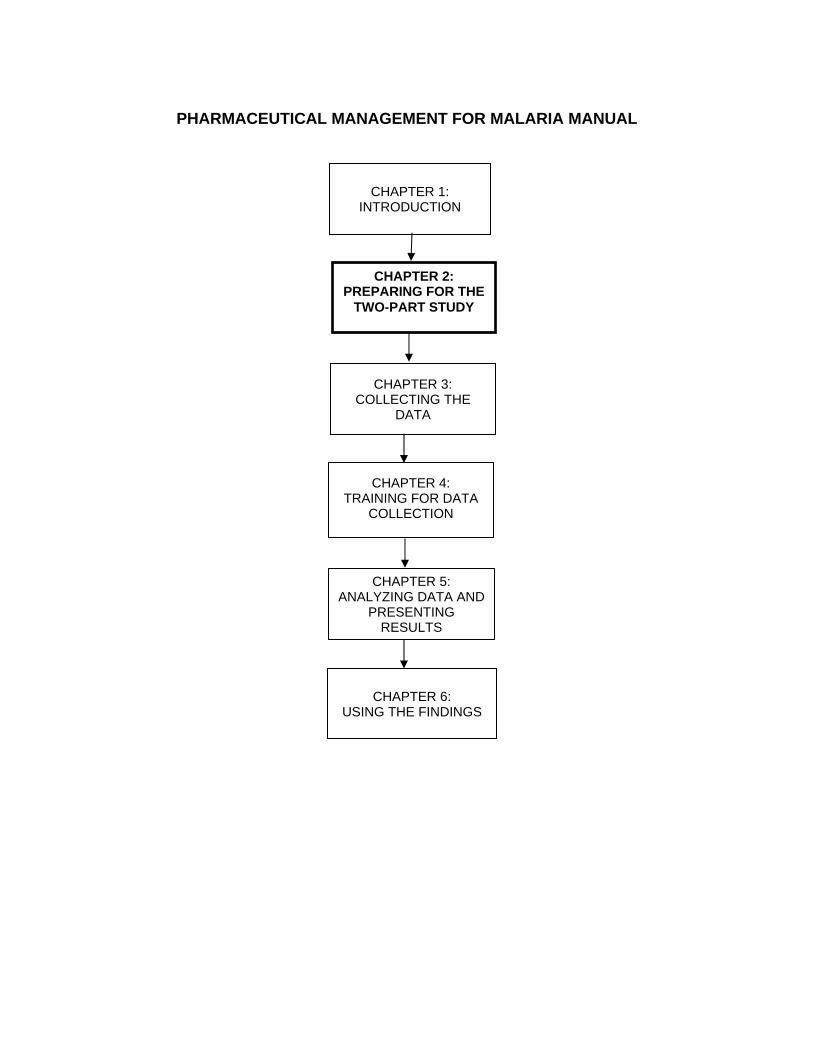
PHARMACEUTICAL MANAGEMENT FOR MALARIA MANUAL
CHAPTER 1:
INTRODUCTION
CHAPTER 6:
USING THE FINDINGS
CHAPTER 5: ANALYZING DATA AND
PRESENTING RESULTS
CHAPTER 3: COLLECTING THE
DATA
CHAPTER 2: PREPARING FOR THE
TWO-PART STUDY
CHAPTER 4: TRAINING FOR DATA
COLLECTION

Pharmaceutical Management for Malaria Manual
xiv

1
Chapter 1.
INTRODUCTION Background Every year, between 300 million and 500 million new cases of malaria infection lead to more than one million deaths, of which 75 percent occur in African children under five years of age.1 Malaria is endemic in more than 100 countries.2 It is estimated that 40 percent of the world’s population of 2.5 billion live in areas of malaria risk. Overall, countries in tropical Africa account for more than 90 percent of the total malaria incidence and the great majority of malaria deaths.3 The economic loss caused by malaria in Africa in 1989 was estimated at 800 million U.S. dollars (USD). By 1997 this figure had risen to USD 2 billion, an enormous health and socioeconomic burden to an already poor continent.4 The burden of malaria has been intensified by the appearance of chloroquine-resistant Plasmodium falciparum, which arose in Southeast Asia and was first documented in East Africa in 1979.5 Since then, there have been reports of chloroquine resistance in most countries in
1 R. W. Snow, M. Craig, U. Deichmann, and K. Marsh. 1999. Estimating Mortality, Morbidity and Disability due to Malaria among Africa’s Non-pregnant Population. Bulletin of the World Health Organization 77(8): 617–18. 2 World Health Organization (WHO). 1999. Malaria 1982–1997. Weekly Epidemiological Record 74: 265–70. 3 WHO and UNICEF. 2003. The Africa Malaria Report 2003. WHO/CDS/MAL/2003.1093. Geneva: WHO. 4 J. Sachs and P. Malaney. 2002. The Economic and Social Burden of Malaria. Nature 415(6872): 680–5 [Review]. 5 S. Fogh, S. Jepson, and P. Effersoe. 1979. Chloroquine Resistant Plasmodium falciparum Malaria in Kenya. Transactions of the Royal Society of Tropical Medicine & Hygiene 73: 228–9.

Pharmaceutical Management for Malaria Manual
2
Africa, with especially high resistance in East Africa.6 In addition, resistance to sulfadoxine/pyrimethamine (SP) is increasing.7,8,9 There is also growing evidence that shows the relationship between increased resistance to first-line antimalarial therapy and increased morbidity and mortality.10,11,12 To address these challenges, the World Health Organization (WHO) recommends that all countries revising their first-line treatment policies for malaria should opt for a combination treatment, preferably an artemisinin-based combination therapy (ACT).13 In recent years, the world donor community has stepped up its response to this crisis by creating several global initiatives. Efforts such as Roll Back Malaria (RBM), which was established in 1998 to support efforts to halve the global burden of malaria by 2010,14 and the Global Fund to Fight AIDS, Tuberculosis and Malaria (Global Fund, or GF) are helping to provide much-needed resources for the procurement of commodities. However, having adequate resources is only part of the solution. The Global Fund has urged countries that have signed grants against proposals for malaria recommending treatments other than ACTs to reprogram their funds to accommodate ACTs. As countries continue to receive GF awards for ACTs, the increased volume of antimalarial medicines will place more pressure on pharmaceutical systems to ensure proper pharmaceutical management and use than did the use of chloroquine. To address pharmaceutical management issues related to the essential medicines needed for treating and preventing malaria, the Rational Pharmaceutical Management (RPM) Project, in collaboration with the U.S. Agency for International Development (USAID), developed the Drug Management for Malaria Manual, an indicator-based assessment tool, and released the first edition in 2000. Renamed for this revised edition, the Pharmaceutical Management for Malaria Manual (PMM Manual) is designed to guide the review of availability and patterns of use of medicines for malaria treatment in public health facilities of the Ministry of Health (MOH) and in private facilities, pharmacies, and retail pharmaceutical outlets. Such reviews will help diagnose existing or emergent problems of malaria medicines and provide the evidence required for making decisions on how to improve access to, as well as the use of, antimalarial medicines in both the public and private sectors. 6 B. A. Rapuoda, J. H. Ouma, J. A. Otieno, B. Khan, and S. Omar. 1998. Status of Antimalarial Drugs Sensitivity in Kenya. Malaria and Infectious Diseases in Africa 8: 25–43. 7 M. A. Nzila, E. K. Mberu, J. Sulo, et al. 2000. Towards an Understanding of the Mechanism of Pyrimethamine/sulfadoxine Resistance in Plasmodium falciparum: The Genotyping of Dihydrofolate Reductase and Dihydropteroate Synthase of Kenyan Parasites. Antimicrobial Agents and Chemotherapy 44: 991–6. 8 A. O. Talisuna, A. Nalunkuma-Kazibwe, N. Bakyaita, et al. 2004. Efficacy of Sulphadoxine-Pyrimethamine Alone or Combined with Amodiaquine or Chloroquine for the Treatment of Uncomplicated falciparum Malaria in Ugandan Children. Tropical Medicine & International Health 9(2): 222–9. 9 East African Network for Monitoring Antimalarial Treatment (EANMAT). 2003. The Efficacy of Antimalarial Monotherapies, Sulphadoxine-pyrimethamine and Amodiaquine in East Africa: Implications for Sub-regional Policy. Tropical Medicine & International Health 8(10): 860–7. 10 J. F. Trape, et al. 1998. Impact of Chloroquine Resistance on Malaria Mortality. Comptes Rendus de l’Academie des Sciences serie III, 321(8): 689–97. 11 R. W. Snow, J. F. Trape, and K. Marsh. 2001. The Past, Present and Future of Childhood Malaria Mortality in Africa. Trends in Parasitology 17(12): 593–7. 12 K. Marsh. 1998. Malaria Disaster in Africa. Lancet 352: 924–25. 13 WHO. 2004. Position of WHO’s Roll Back Malaria Department on Malaria Treatment Policy. Geneva: WHO. <http://mosquito.who.int/malariacontrol> (accessed Oct. 14, 2004). 14 D. N. Nabarro and E. Taylor. 1998. The Roll Back Malaria Campaign. Science 280: 2067–8.

Chapter 1. Introduction
3
Cornerstones of Pharmaceutical Management: Selection, Procurement, Distribution, and Use Pharmaceutical management involves four basic functions: selection, procurement, distribution, and use. Selection involves reviewing the prevalent health problems, identifying treatments of choice, choosing individual medicines and dosage forms, and deciding which medicines will be available at each level of health care. Procurement includes quantifying pharmaceutical requirements, selecting procurement methods, managing tenders, establishing contract terms, assuring quality of medicines, and ensuring adherence to contract terms. Distribution includes the clearing of customs, stock control, stores management, and delivery to pharmaceutical depots and health facilities. Use includes diagnosing,15 prescribing, dispensing, and proper consumption by the patient. Each function builds on the next, forming the pharmaceutical management cycle. At the center of the pharmaceutical management cycle is a core of management support systems: organization, financing and sustainability, information management, and human resources management. These management support systems hold the pharmaceutical management cycle together. Finally, the entire cycle rests on a policy and legal framework that establishes and supports the public commitment to essential medicine supply. Figure 1 shows a graphic display of the pharmaceutical management cycle.
Figure 1. The Pharmaceutical Management Cycle
15 The PMM Manual does not evaluate appropriate diagnosis.
Selection
Management Support
Distribution
Procurement
Use
Policy and Legal Framework

Pharmaceutical Management for Malaria Manual
4
Pharmaceutical Management in Support of Malaria Programs Effective case management for malaria requires that effective antimalarials are available and used appropriately in the correct formulations and amounts and according to an appropriate regimen (dose, frequency, duration). Ineffective treatment can lead to recrudescent infections, thus requiring additional treatment, which can lead to increased cost and loss of productivity, complications or death, and the development of resistance to limited antimalarial medicines. In addition, lack of careful selection, incorrect quantification, high prices, poor quality, theft, improper storage, expiration of medicines, irrational prescribing, and incorrect use of medicines by providers and patients can result in losses totaling more than 70 percent of initial acquisition costs16 of medicines in general. One barrier to effective case management of malaria in the health system is that the medicines needed are often not available. Furthermore, access to reliable and consistent information about malaria prevention and treatment in most endemic countries is poor.17 Effective prevention and treatment of malaria require that health workers and consumers have access to a core group of medicines and supplies. Availability of these items may be influenced by a variety of factors, including poor stock control, provider experience, economic influences, cultural factors, community belief systems, and the complex interactions among these factors. A key barrier to access is affordability by the MOH for medicines intended for the public health system as well as affordability by the individual. Because much of the treatment seeking for malaria occurs in the private sector,18 the choice of strategy to be implemented actually may be determined by the individual’s ability to pay the absolute costs of a new medicine. It is important to note that the malaria pharmaceutical supply system should not be a separate supply system. Since the medicines for malaria are essential to public health care in most developing countries, they should be integrated into the national pharmaceutical supply system to avoid duplication.19 Objective The main objective of this manual is to provide an approach for conducting studies that will—
• Provide data on availability and prescribing practices of medicines used for preventing and treating malaria
16 Management Sciences for Health, in collaboration with the World Health Organization. 1997. Managing Drug Supply. 2nd ed. West Hartford, CT: Kumarian Press. 17 G. Krause, J. Benzler, R. Heinmuller, M. Borchert, E. Koob, K. Outtara, and H. J. Diesfeld. 1998. Performance of Village Pharmacies and Patient Compliance after Implementation of an Essential Drug Programme in Rural Burkina Faso. Health Policy and Planning 13(2): 159–66. 18 S. Foster. 1995. Treatment of Malaria outside the Formal Health Services. Journal of Tropical Medicine and Hygiene. 98(1): 29–34. 19 In some countries, however, particularly those that are epidemic-prone, the national drug supply system may be supplemented by the National Malaria Control Center or some other relevant body when demand for antimalarials increases.

Chapter 1. Introduction
5
• Identify ways of improving malaria pharmaceutical management (availability, treatment, and cost)
• Transfer self-assessment technology by creating operational research capacity within the
country Purpose of the Assessment and Target Audience Purpose of the Assessment The purpose of the PMM Manual is to assess the aspects of the pharmaceutical management system in the public and private sectors that are critical for ensuring the availability and proper use of effective medicines and supplies essential for treating malaria. The manual can also be used by midlevel program coordinators to approach senior personnel or sponsors when asking for funds to conduct Pharmaceutical Management for Malaria (PMM) studies. The PMM Manual is an indicator-based approach with a number of potential applications, including—
• Defining the status of the pharmaceutical system as it relates to antimalarial medicines, including strengths and weaknesses, for managers and donors
• Providing the evidence required for making decisions, beginning the process of selection, and designing interventions that are practical in terms of cost-effectiveness and feasibility (additional studies may be required for intervention design)
• Defining budget or resource requirements
• Monitoring changes in systems over time and evaluating the impact of interventions In addition, the PMM Manual assists in capacity building for operational research capacity within the country. Target Audience This manual is intended for use by health professionals with an interest in pharmaceutical management who work at the central, regional, and/or district level. The users of this manual may include the following—
• The World Health Organization and the Pan American Health Organization Essential Drugs Program staff in Latin America and the Caribbean, Africa, and Asia
• MOH decision makers, health planners, health economists, donor representatives, or
experts responsible for malaria activities

Pharmaceutical Management for Malaria Manual
6
• System managers at the national, regional, or district levels wishing to measure the performance of the malaria pharmaceutical management and supply system
• Social scientists and health project or facility managers who are interested in malaria
operational research and management tools Summary of the PMM Methodology The PMM tool consists of two components: this manual for the lead coordinator(s) and a companion PMM Data Collector’s Guide to assist with data collection and analysis in the field. In addition, computer discs containing a set of the generic PMM data collection forms are available to facilitate country-specific adaptation and printing. It is important for study organizers to thoroughly review the Data Collector’s Guide before training data collectors and beginning the studies. The PMM Manual is designed to take users step-by-step through the malaria pharmaceutical management process, beginning with introducing the concept of indicator-based assessments, then collecting the data using specifically designed forms to identify the particular strengths and weaknesses of the pharmaceutical supply system for malaria, and ending with recommendations for ongoing performance monitoring and possible strategies for improvement. The assessment is built around two complementary studies: the Drug Availability Study (DAS) and the Drug Use Study (DUS). The two studies assess various aspects of pharmaceutical management in the public and private sectors. The Drug Availability Study: The purpose of conducting the DAS is to determine the availability of antimalarial medicines required for treating and preventing malaria. The DAS indicators will help the coordinators identify possible reasons for the low availability of antimalarial medicines, as well as opportunities for improving the supply. These indicators will help identify specific strengths and weaknesses of the system and, in the process, gather information that will be useful in planning corrective interventions for weaknesses identified in the system. An important point to understand and remember while conducting the DAS is that malaria medicines and supplies may have different channels of distribution from other medicines and supplies. For example, in some countries the vertical malaria program may have a distribution system distinct from the MOH’s routine system for delivering medicines, particularly if malaria is seasonal. In other countries all medicines and supplies may go through only the MOH system. It is important, therefore, to be aware of these possibilities and to collect all the information that is needed to provide a complete picture of the logistics system for all PMM antimalarial medicines. Three data collection techniques will be used: document reviews, structured interviews, and physical inventory checks.

Chapter 1. Introduction
7
The Drug Use Study: The purpose of the DUS is to review prescribing and dispensing practices for malaria and assess their clinical and cost implications. This information will be used to involve prescribers in the initiative and to target specific behaviors through training and subsequent monitoring and supervisory activities. The DUS uses both retrospective and prospective data collection methods. For the retrospective component of the study (in MOH facilities or formal private sector facilities), the data collection technique used will be medical records review (or patient-held record cards, if appropriate). The prospective component will use the data collection techniques of direct observation and exit poll interviews in MOH and formal private sector facilities and simulated purchases in retail pharmaceutical outlets. The data collection techniques used in the DAS and DUS are described in Chapter 3. Each study uses specific indicators to measure the performance of a particular aspect of the malaria pharmaceutical supply system. Objective indicators provide concrete measures against which actual performance can be compared. There are four general criteria for useful indicators—
• Importance Each indicator must reflect an important dimension of performance. • Measurability Indicators must be measurable within the constraints of time and with
data of variable quality and availability. • Reliability Each indicator must be reliable and repeatable over time and with
different observers. • Validity Each indicator must allow a clear and consistent interpretation and have a
similar meaning across different environments. The indicators described in the next section, which are used in each of the two studies, meet these basic criteria. List of PMM Indicators Following is the list of 12 PMM indicators that will be used to assess the availability and use of antimalarial medicines for the treatment of malaria. The list includes 4 availability indicators, 6 drug use indicators, 1 observation indicator, and 1 intermittent preventive treatment (IPT) indicator. Detailed descriptions of the PMM indicators are included in Annex 2. In addition, 4 supplemental indicators may be helpful, but they are not generally essential to an understanding of the pharmaceutical management system for malaria. Three of these can be used to assess appropriate case management as part of drug use, and one can be used to address drug availability. Detailed descriptions of each supplemental indicator are also included in Annex 2. Annex 3 presents a sample format for presenting the indicator data.

Pharmaceutical Management for Malaria Manual
8
Drug Availability Study Indicators 1. Percentage of median international price paid for a set of PMM antimalarial medicines that
were part of the last regular MOH procurement
2. Average percentage of a set of unexpired PMM antimalarial medicines available in (a) MOH storage and health facilities, (b) formal private health facilities, and (c) retail pharmaceutical outlets
3. Average percentage of time out of stock for a set of PMM antimalarial medicines in MOH storage and health facilities
4. Average percentage of stock records that correspond with physical counts for a set of PMM antimalarial medicines in MOH storage and health facilities
Drug Use Study Indicators 5. Percentage of MOH health facilities visited that had a copy of the official treatment
guidelines for malaria 6. Percentage of encounters with patients diagnosed with uncomplicated malaria who are
prescribed an antimalarial consistent with treatment guidelines (public and private health facilities)
7. Percentage of encounters with patients diagnosed with uncomplicated malaria who are prescribed quantities of appropriate antimalarials sufficient to complete a full course of treatment (public and private health facilities)
8. Percentage of prescribed antimalarial medicines actually dispensed by public health facilities
9. Average cost of medicines prescribed as a percentage of costs if standard treatment guidelines (STGs) for treatment were followed
10. Percentage of patients/caregivers who could correctly describe how to take/give the prescribed antimalarial medicine
11. Percentage of health workers and retail pharmaceutical outlets that provided (some) information to patients/caregivers on how to give the recommended medicine(s)
In areas where a policy for IPT with antimalarials for the prevention of malaria in pregnancy exists—
12. Percentage of encounters with pregnant women living in endemic areas who are prescribed
an appropriate antimalarial for IPT at antenatal clinics

Chapter 1. Introduction
9
Supplemental Indicators Drug Availability 13. Average percentage of individual variation for a set of indicator antimalarial medicines in
MOH storage and health facilities Drug Use 14. Percentage of encounters where health workers asked one or more clinical questions to
determine severity of malaria
15. Percentage of health workers who told caregivers about any signs of progressive illness and recommended a referral visit to a doctor or clinic if the signs appear
16. Percentage of health workers who prescribed an ineffective antimalarial (one that is no longer recommended)
Limitations of the PMM Manual This manual is not intended for users who need or wish to conduct a complete assessment of the entire pharmaceutical system. Such an assessment is beyond the scope of this manual. RPM has developed the Rapid Pharmaceutical Management Assessment: An Indicator-Based Approach manual to serve as a guide for conducting a complete assessment. Appropriateness of Standard Treatment Guidelines The PMM approach is based on the assumption that the medicines in the country’s STGs are appropriate. This assumption may not always be correct. Because of the evolving epidemiology of the malaria disease and the emerging resistance of the malaria parasite to commonly used antimalarials, the chances of a new replacement treatment policy becoming rapidly obsolete are high. A country may not yet have reviewed its recommendations for malaria treatment. Moreover, experience has shown that the changing of antimalarial medicine policy is a complex process, from gathering of drug resistance data to policy formation to implementation, which can take several years. Background information collected before conducting the study looks at whether the guidelines have been reviewed in the last two years. This information should provide some evidence of whether evolving drug resistance has been addressed. However, it does not provide an assessment of clinical appropriateness of the guidelines themselves. To measure that would require an assessment of the results of in vivo drug resistance evaluations and a judgment call on the appropriateness or inappropriateness of the current guidelines as well as the treatments being prescribed by the evaluators, which is beyond the scope of this tool and requires a higher level of malaria technical knowledge by the users.
Pharmaceutical Management for Malaria Manual
10
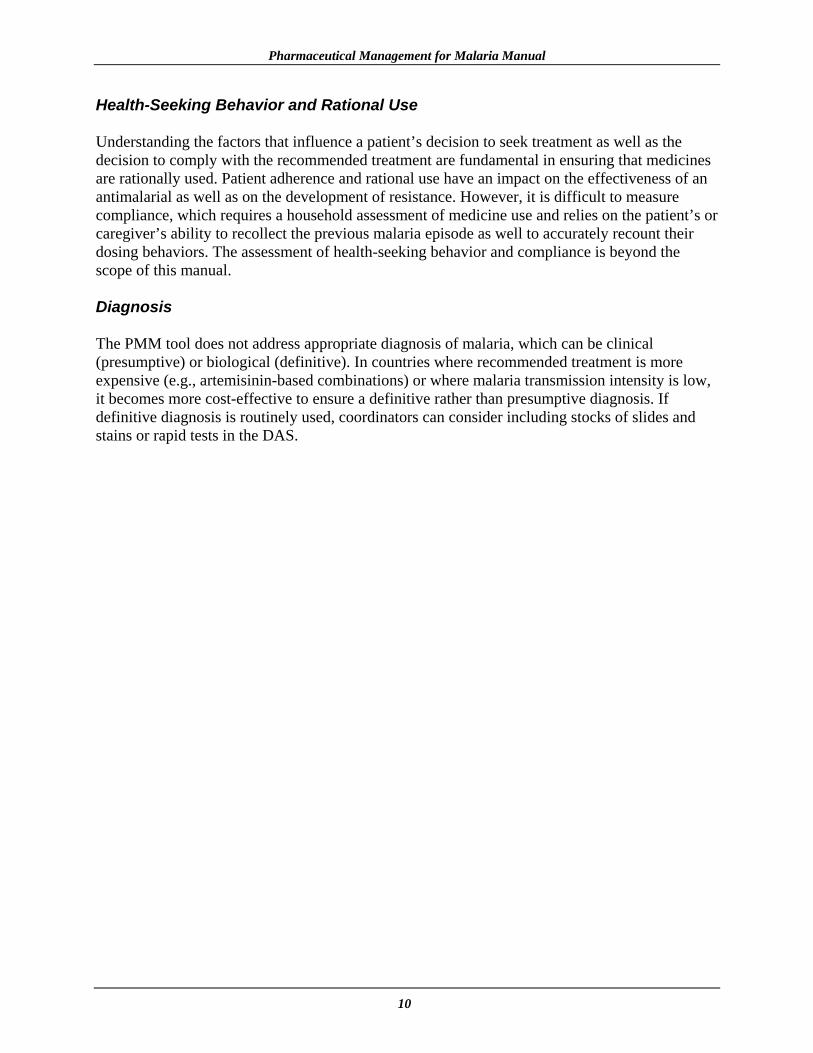
Health-Seeking Behavior and Rational Use Understanding the factors that influence a patient’s decision to seek treatment as well as the decision to comply with the recommended treatment are fundamental in ensuring that medicines are rationally used. Patient adherence and rational use have an impact on the effectiveness of an antimalarial as well as on the development of resistance. However, it is difficult to measure compliance, which requires a household assessment of medicine use and relies on the patient’s or caregiver’s ability to recollect the previous malaria episode as well to accurately recount their dosing behaviors. The assessment of health-seeking behavior and compliance is beyond the scope of this manual. Diagnosis The PMM tool does not address appropriate diagnosis of malaria, which can be clinical (presumptive) or biological (definitive). In countries where recommended treatment is more expensive (e.g., artemisinin-based combinations) or where malaria transmission intensity is low, it becomes more cost-effective to ensure a definitive rather than presumptive diagnosis. If definitive diagnosis is routinely used, coordinators can consider including stocks of slides and stains or rapid tests in the DAS.
PHARMACEUTICAL MANAGEMENT FOR MALARIA MANUAL
CHAPTER 1:
INTRODUCTION
CHAPTER 6:
USING THE FINDINGS
CHAPTER 5: ANALYZING DATA AND
PRESENTING RESULTS
CHAPTER 3: COLLECTING THE
DATA
CHAPTER 2: PREPARING FOR THE
TWO-PART STUDY
CHAPTER 4: TRAINING FOR DATA
COLLECTION
Pharmaceutical Management for Malaria Manual
12

13
Chapter 2.
PREPARING FOR THE TWO-PART STUDY
The general approach to this systematic assessment requires answers to the following questions— Availability 1. Are the medicines that are required to treat malaria and to treat and prevent malaria in
pregnancy available in the public and private health facilities?
2. What are the determinants of availability of antimalarial medicines in the public and private sectors and what can be done to bring about improvement?
3. Are medicines that are required to prevent and treat malaria available in the private sector and how do these prices compare with prices in the public sector?
Use 1. What are current prescribing practices for malaria?
2. Are the current prescribing practices in accordance with the treatment guidelines?

Pharmaceutical Management for Malaria Manual
14
3. How does the medicine cost of current practices for treating malaria compare to what the cost would be if malaria treatment guidelines were followed?
4. In areas where a policy for intermittent preventive treatment with antimalarials for the prevention of malaria in pregnancy exists, is an appropriate antimalarial prescribed to pregnant women to prevent malaria in pregnancy in the antenatal clinics of public health facilities?
The four supplemental indicators designed to answer questions about availability and use are discussed in detail in Annex 2. Planning the Study The two-part study (drug availability and drug use) collects data from four different settings: central level (C), regional level (R), health facilities (F), and retail pharmaceutical outlets (O). Conducting an assessment in all of these sites may look difficult, but, in practice, the entire set of 12 PMM indicators (and 4 supplemental indicators) can be sorted into two groups that constitute two distinct data collection efforts—
• At the central and regional levels, data are collected for 4 DAS indicators (and 1 supplemental availability indicator), of which 1 is collected through structured interviews and document review, and 3 through physical inventory and stock record review at the medical stores and health facilities.
• At the health facility and retail outlet levels, data for 3 DAS indicators (and 1
supplemental indicator) and 8 DUS indicators (and 3 supplemental drug use indicators) are collected through sample surveys. The survey includes physical inventory and stock record review, patient record reviews, direct observations, exit poll interviews, simulated patient encounters, and simulated purchases. Similarly, a sample of retail pharmaceutical outlets is surveyed through interviews and simulated purchases.
Each part of the study (DAS and DUS) addresses some aspect of the questions listed at the beginning of this chapter and, when viewed together, they provide a comprehensive assessment of the malaria pharmaceutical management situation. Coordinators may decide to conduct only one part of the study at a time to reduce the financial and human resource requirements. However, in general, it is more cost-efficient to consolidate the data collection for the two studies into one overall process. This manual provides guidance for planning and carrying out both studies at the same time. Planning the study consists of the following 10 steps—
1. Selecting coordinators for the assessment 2. Gathering background information
Chapter 2. Preparing for the Two-Part Study
15
3. Preparing an overview of MOH pharmaceutical management operations 4. Developing the budget 5. Developing the sample design 6. Selecting data collection sites 7. Preparing the tracer list of PMM antimalarial medicines 8. Recruiting data collectors 9. Arranging logistics 10. Planning data collection, adapting the tool, and preparing the PMM forms
1. Selecting Coordinators for the Assessment The most practical way to carry out this type of study is for two or more experienced coordinators to work together, managing and coordinating the study over a period of four to six weeks. An ideal combination of skills and experience for the coordinators would include the following—
• Coordinator 1 A pharmaceutical management specialist or a pharmacist or a health worker with management experience to take charge of study coordination and data collection for logistics at the central and regional levels. For this job, familiarity with pharmaceutical policy, logistics management, procurement, and budget issues would be most useful.
• Coordinator 2
A health care provider such as a physician, pharmacist, or nurse to take charge of the surveys to be carried out at the health facility and retail outlet levels. For this job, familiarity with pharmaceutical products and work routines in health facilities would be an asset.
The coordinators will spend one or two weeks planning the study, three to four days in training, two to three weeks in data collection, and three to four weeks analyzing data and writing the report. The basic organizational strategy is to approach the assessment as two separate data collection efforts—
• Collection of data at central and regional levels • Sample survey of health facilities and retail pharmaceutical outlets
Each of the coordinators should be responsible for carrying out the planning steps for their respective data collection areas, as described earlier in this chapter. Recruitment of data collectors is discussed under item 8 later in this chapter. 2. Gathering Background Information Background information is useful in training data collectors and in putting the findings in the proper context. Certain figures, rates, and malaria statistics are important to the study of malaria pharmaceutical management. Coordinators should collect and record the data shown in Table 1

Pharmaceutical Management for Malaria Manual
16
at the very outset of the work and before the start of data collection. This information may be obtained at the central level and should be the responsibility of Coordinator 1. Table 1. Background Information
Background Information Prevalence of malariaa Prevalence of drug resistancea Geographic malaria endemicity Malaria seasonality patterns Existence of STGs for malaria Date of last revision of the STGs for malaria Dates covered by the government fiscal year Exchange rates of local currency for U.S. dollars for the data collection periods Inflation rates for the previous five years National and regional population figures Rates of population increase a Include date of survey, geographic region(s), and age group(s) covered. 3. Preparing an Overview of MOH Pharmaceutical Management Operations To efficiently carry out the two-part study, including interpreting the results and making recommendations for supply system improvement, a good understanding of current pharmaceutical management operations is essential. At a minimum, this knowledge should include qualitative descriptions of major problems that affect the movement of medicines through the procurement and distribution system and the information listed in Table 2. This information may be obtained at the central level and should be the responsibility of Coordinator 1.

Chapter 2. Preparing for the Two-Part Study
17
Table 2. MOH Pharmaceutical Management Operations
MOH Pharmaceutical Management Operations Number and distribution of MOH health facilities, pharmacies, and warehouses Number and distribution of retail pharmaceutical outlets Number and distribution of pharmaceutical wholesalers, distributors, and manufacturers Diagram showing system of pharmaceutical procurement and distribution for malaria medicines. The diagram should also include the offices responsible for managing procurement of malaria products (by both purchase and donation), storage facilities, and health facilities. List of sources of malaria medicines flowing through the distribution system and estimated values for each source, including budgets and contributions of donors and nongovernmental organizations (NGOs) Summary of transport arrangements linking storage and health facilities. This should be as specific as possible, indicating numbers and types of vehicles available by geographic zone. If transport is through contract arrangements with parastatal or commercial agencies, describe those arrangements and indicate the budgets. Copy of National Drug Formulary (NDF), Essential Medicines List (EML), or a list of the malaria medicine products and whether these are consistent with the standard treatment guidelines Copy of standard treatment guidelines for malaria Copy of any recent or proposed changes made to antimalarial medicine policy not reflected in STGs/NDF/EMLa Identification of system(s), if any, for recovering the cost of medicines dispensed in MOH health facilities Major problems that affect the movement of medicines through the procurement and distribution system a This information may be available through announcements made in the government Gazette or newspapers or other forms of media. In most countries, coordinators will gather all of these items through interviews and document review. The best approach is to prepare a plan for collecting this information (Table 3). The information should be distributed to the data collectors at the start of the training.
Pharmaceutical Management for Malaria Manual
18
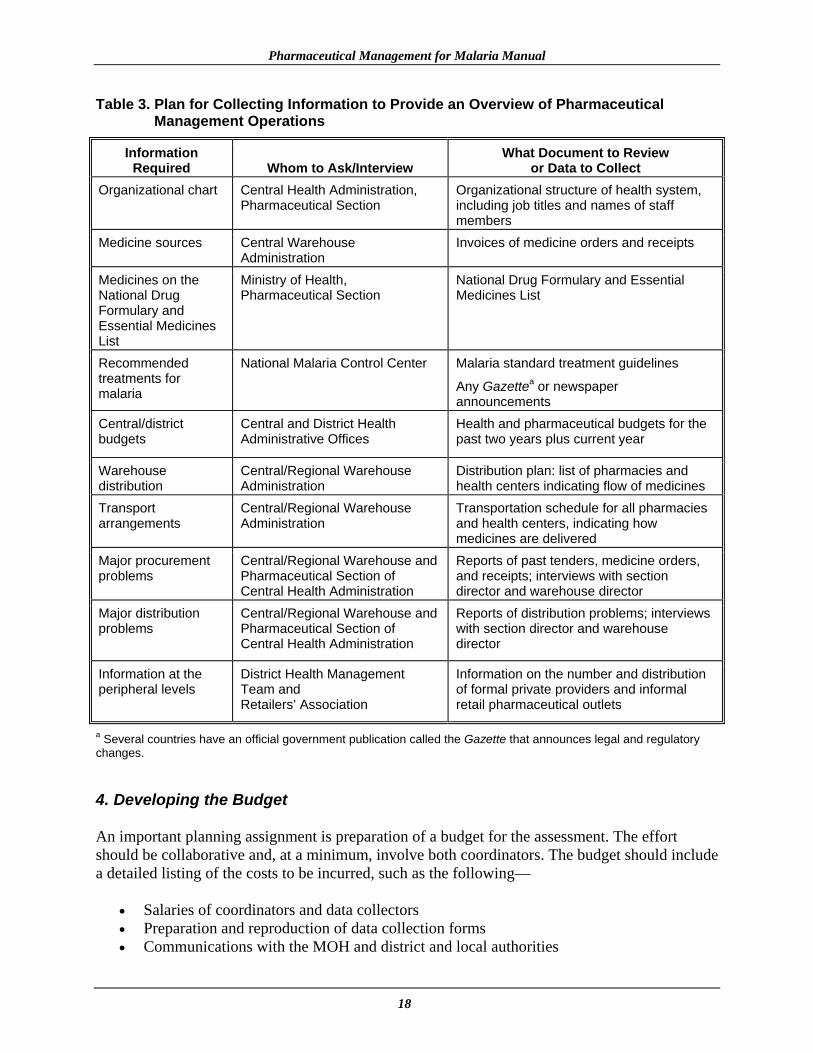
Table 3. Plan for Collecting Information to Provide an Overview of Pharmaceutical Management Operations
Information Required Whom to Ask/Interview
What Document to Review or Data to Collect
Organizational chart Central Health Administration, Pharmaceutical Section
Organizational structure of health system, including job titles and names of staff members
Medicine sources Central Warehouse Administration
Invoices of medicine orders and receipts
Medicines on the National Drug Formulary and Essential Medicines List
Ministry of Health, Pharmaceutical Section
National Drug Formulary and Essential Medicines List
Recommended treatments for malaria
National Malaria Control Center Malaria standard treatment guidelines
Any Gazettea or newspaper announcements
Central/district budgets
Central and District Health Administrative Offices
Health and pharmaceutical budgets for the past two years plus current year
Warehouse distribution
Central/Regional Warehouse Administration
Distribution plan: list of pharmacies and health centers indicating flow of medicines
Transport arrangements
Central/Regional Warehouse Administration
Transportation schedule for all pharmacies and health centers, indicating how medicines are delivered
Major procurement problems
Central/Regional Warehouse and Pharmaceutical Section of Central Health Administration
Reports of past tenders, medicine orders, and receipts; interviews with section director and warehouse director
Major distribution problems
Central/Regional Warehouse and Pharmaceutical Section of Central Health Administration
Reports of distribution problems; interviews with section director and warehouse director
Information at the peripheral levels
District Health Management Team and Retailers’ Association
Information on the number and distribution of formal private providers and informal retail pharmaceutical outlets
a Several countries have an official government publication called the Gazette that announces legal and regulatory changes. 4. Developing the Budget An important planning assignment is preparation of a budget for the assessment. The effort should be collaborative and, at a minimum, involve both coordinators. The budget should include a detailed listing of the costs to be incurred, such as the following—
• Salaries of coordinators and data collectors • Preparation and reproduction of data collection forms • Communications with the MOH and district and local authorities

Chapter 2. Preparing for the Two-Part Study
19
• Room hired for training • Training of data collectors and meals • Travel and per diem for coordinators • Travel and per diem for data collectors • Possible accommodation costs • Data entry costs • Supplies such as pens, notebooks, bags for the data collectors • Other costs during the study, such as medicines for simulated patient purchases and
photocopies 5. Developing the Sample Design Sampling It is usually too expensive and difficult to collect information from all patient encounters in all health facilities and retail outlets in all the districts in the country. The goal of the sampling process is to collect enough data, in terms of the actual number of patient encounters and variety and number of sites, for the results to be considered representative of current availability and use within the country of medicines for malaria. This aspect of the planning process is very important and deserves careful consideration by organizers of the assessment. Failure to ensure that the data set collected is a large enough and varied enough sample to be considered representative will introduce bias and could seriously limit the utility of the data analysis and conclusions, because the findings will not be generally representative of the country’s malaria pharmaceutical management situation. The selection of facilities should generally be limited to sites where more than five cases of malaria can be expected per day. The PMM tool is a descriptive survey intended to provide an overview of the situation, and the sampling procedure described below is indicative of this approach. If a comparison between two or more districts in a country is required, a different method of sampling would be required, which is not discussed in this manual. The following sections address the four areas of sampling that are critical to the malaria pharmaceutical management assessment process. To understand the approach for the study design proposed in this manual, it is important to review the purpose and intent of the malaria pharmaceutical management assessment. To summarize—
• The purpose of the assessment is to identify high-priority problem areas that might hinder the achievement of malaria program objectives and to point to appropriate follow-up activities.
• The study design is a cross-sectional descriptive survey to establish the baseline for
monitoring of future interventions.
• The study design is not intended to compare regions, districts, or facilities (comparative survey20) but rather to describe a reasonably representative national-level pharmaceutical management profile for the sample as a whole.
20 A separate tool must be used for conducting a comparative study (this tool is in preparation).

Pharmaceutical Management for Malaria Manual
20
• The study design is intended to facilitate the logistics of the data collection effort within a
reasonably short time (one day per health facility) and with limited financial resources. The next step in the design process is the selection of central and regional sites, sites for patient encounters, and health facilities and retail pharmaceutical outlets.
REMEMBER Step 1: Selection of Central and Regional Sites Sample Note: This sample is required for the overview of MOH pharmaceutical management operations. Important variations within a procurement and distribution system may exist between regions, facilities, and prescribers, and these differences may affect the supply of antimalarial medicines. They may be caused by variations in factors such as climate, endemicity, financing, sources of medicine supply, ease of access to facilities, condition of inventory records, or patterns of prescribing practices. In selecting a suitable sample, it is important to include facilities representing all significant variants of the overall system in the sample. One way to do this is to divide the country into groups determined by such variables as geography, intensity of malaria transmission, socioeconomic factors, population density, urban and rural areas, or key features of the health care system. Four geographic areas (that is, districts or regions) may then be chosen in which to work, based on these groupings.21 Following are some criteria for selecting four areas in a country—
• The capital city and the main population center (if different) should always be included as one or two of the study areas.
• If the country is relatively homogeneous, geographically and epidemiologically, simply
choose the capital city and three other regions or districts at random.
• If you expect varying conditions in different areas of the country to influence the way pharmaceuticals are managed (e.g., malaria endemic, non-endemic areas, and areas with
21 Four regions are selected as a representative sample that is not too large to handle in the time available.
This survey design task is divided into four steps—
1. Selection of the central and regional sites sample 2. Selection of the public health facilities sample 3. Selection of the private facilities and retail pharmaceutical outlet sample 4. Selection of the patient encounter sample

Chapter 2. Preparing for the Two-Part Study
21
seasonal transmission), first organize all regions or districts into groups based on these characteristics, then select the capital city and three study areas at random from these groups.
The following three examples show how geographic considerations may be used to develop a sample that is representative of the country— Example 1: (1) capital city (urban area); (2) highland agricultural district; (3) lowland
agricultural district; and (4) arid district Example 2: (1 and 2) capital city (urban area) and one other densely settled urban area; and
(3 and 4) two rural agricultural districts Example 3: (1) capital city (urban area); (2 and 3) two rural districts with reasonably good
transportation links; and (4) one relatively inaccessible rural district Step 2: Selection of the Public Health Facilities Sample The sample size used in this manual is a total of 20 health facilities, 5 from each of the four selected geographic regions of the country. The rationale for selecting a sample size of 20 health facilities is based on previous studies and methodologies extrapolated from WHO Expanded Programme on Immunization and International Network for Rational Use of Drugs (INRUD) studies and the study design factors and assumptions previously discussed. After the health facilities are selected, a nearby “backup facility” should be selected for each geographical region, which the team will visit only if the selected facility is closed. A code should be assigned for each clinic for data collectors to use in place of the facility name on the PMM forms to ensure confidentiality of the data source. To make the actual site selections, follow these procedures—
• First, select the district hospital outpatient unit, which should always be one of the facilities selected in each study district. Select randomly22 (see Random Sampling: The Interval Approach, below) if there is more than one district hospital in the district.
• Then, randomly select four other health facilities from the list of health centers in the
selected district.
• For systems organized with only one basic tier of outpatient facilities below the district hospital (for example, rural health centers), select the other four as follows—
If geographic distances and transportation logistics are such that all facilities can be
visited and all data can be collected in one day, select four of these second-level units at random, from all of those in the district.
22 Random selection is a technique used to eliminate bias from the process of choosing units to be included in a study. These techniques are designed to give every unit in a particular set an equal opportunity of being selected.

Pharmaceutical Management for Malaria Manual
22
If transportation is more difficult, select two facilities at random, and then choose two
other facilities that are geographically close to them so that the paired facilities may be visited in one trip.
• For systems with two tiers below the district hospital level (for example, polyclinics
staffed by physicians and lower-level health posts staffed by paramedics), select the other four facilities as follows—
Choose two second-level health facilities at random.
For each of those two second-level health facilities, choose one site from among the
group of third-level facilities that are geographically close. The result is paired sets of second- and third-tier facilities.
• For systems that are organized in a different way, distribute the five facilities to be
studied in each district among the possible types of health facilities, according to such factors as their geographic location or patient load.
Random Sampling: The Interval Approach. The simplest approach to random selection is to apply the interval method to lists of sites. Make sure that the site lists are complete and organized alphabetically, and select every nth site, where n is determined by dividing the total number of available sites by the desired sample size. For example, if 40 sites are available, and 4 are needed for the study, select the 10th site (n = 10) on the list as the first site and then every 10th site thereafter. For practicality purposes, it may be a good idea to limit the sites chosen to those likely to encounter more than five malaria cases a day. Step 3: Selection of the Private Facilities and Retail Pharmaceutical Outlet Sample The private facilities and retail pharmaceutical outlet sample includes private health facilities such as private hospitals, mission hospitals and clinics, and retail pharmaceutical outlets such as pharmacies as well as other types, such as “over-the-counter” (OTC) and informal medicine shops. While gathering the background information, it is important to obtain a clear idea of the different types of outlets operating, their relative proportions and geographic distributions, and regulations that affect what may be sold. The sample size to be used is a total of 20 facilities, 5 from each of the four geographical regions of the country. The sample should be selected to include proportional numbers of all major types of facilities and outlets (pharmacies and other outlets). To do this, apply the principles described previously for sampling different types of health facilities. In selecting the private facilities and retail pharmaceutical outlet site sample, one of two methods may be used—
• Choose a site that is geographically close to each randomly selected health facility visited. To choose the outlet to be visited, the data collector will leave the study health

Chapter 2. Preparing for the Two-Part Study
23
facility, turn right, and walk to the nearest retail pharmaceutical outlet or private health facility.
Should it be necessary to survey two private health facilities or retail pharmaceutical outlets per public health care facility (e.g., increased proportional sampling in urban areas to compensate for the scarcity of data in rural areas), then the data collector can return to the study health facility and, this time, turn left and walk to the nearest outlet. If working in teams of two, one data collector should be allocated to go to the nearest pharmaceutical outlet to the right of the health care facility, and the other to the nearest pharmaceutical outlet to the left.
The disadvantage of this method is that in some settings where rural health facilities are located, there may be no private facilities, pharmacies, or other retail pharmaceutical outlets.
• A better approach, from the point of view of representative sampling, is random selection
within each of the four geographic areas in the sample design. The best way to accomplish this is to use the interval approach, as described in Step 2: Selection of the Health Facilities Sample. If the interest were in studying private clinics, pharmacies, and OTC stores, a list of these would be compiled and a sample of one hospital or clinic, two pharmacies, and two OTC stores would be selected randomly from the list using the method described.
As in the selection of the public health facilities, after the private facilities and retail pharmaceutical outlets are selected, a nearby “backup outlet” should be selected for each, which the team will visit only if the selected outlet is closed. Again, each outlet is assigned a code for data collectors to use on the PMM forms to ensure confidentiality of the data source. Selection of Retail Pharmaceutical Outlets for the Simulated Purchases Scenario: The same retail pharmaceutical outlets used for the sample may be used for the simulated purchase scenarios, but a different data collector must carry out the simulations. Step 4: Selection of the Patient Encounter Sample The patient encounter sample is important for the Drug Use Study. These encounters can be carried out only for public health facilities and formal private health facilities (hospitals and clinics). A minimum of 600 patient encounter records must be reviewed for each category of malaria. This number is achieved by randomly selecting 30 medical records for malaria in each of the 20 health facilities (public and private). The interval approach described above may be used here for the random selection. Examples of patient encounter records include daily registers, medical records, prescription slips, or patient-held record cards. The rationale for selecting a sample size of 600 malaria patient encounters is that experience has shown that, generally, the results of collecting larger samples are not more useful for identifying the main problems and, therefore, do not justify the increased time, cost, and effort.

Pharmaceutical Management for Malaria Manual
24
For the main DUS indicators, uncomplicated malaria alone is included for study (except for Indicator 12, described below). Selection of Patient Encounter Samples for IPT: If Indicator 12 (intermittent preventive treatment given to pregnant women during antenatal care) is included for use in countries where this form of treatment is in line with government policy, a further 200 antenatal records for pregnant women will be needed for this indicator in the drug use study. The interval approach may be used for the random selection.
REMEMBER
6. Selecting Data Collection Sites The data collection takes place at the central level, Central Medical Stores (CMSs), Regional Medical Stores (RMSs), health facilities, and retail outlets. Table 4 provides a list of data collection sites that should be included in conducting both studies. Table 4. Data Collection Sites for Each Part of the Assessment
Study Data Collection Sites Drug Availability Study Ministry of Health Central Office Ministry of Health/Central Medical Store Regional Medical Stores Health facilities (hospitals and primary health care facilities) Drug Use Study Health facilities (hospitals and primary health care facilities) Retail pharmaceutical outlets (formal and informal) 7. Preparing the Tracer List of PMM Antimalarial Medicines Some of the availability indicators are measured on the basis of a list of selected antimalarial medicines (“tracer list”). There is no “universal” tracer list. The PMM antimalarial medicine list will be used at the central, regional, health facility, and retail levels to collect data for deriving inventory management and price indicators. The PMM medicine list in Table 5 is a sample antimalarial medicine list. The list is meant only as an example. The sample PMM antimalarial medicine list should be adapted to the country-specific setting, taking into account recent pharmaceutical policy changes and restrictions.
The most important principle to remember in each phase of this process is random selection.

Chapter 2. Preparing for the Two-Part Study
25
Table 5. Sample List of PMM Antimalarial Medicines
1. Chloroquine phosphate 150 mg tablet 2a. Chloroquine injection 40 mg/mL 30 mL vial 2b. Chloroquine injection 40 mg/mL 5 mL vial 3. Chloroquine syrup 50 mg/5 mL 4. Sulfadoxine/pyrimethamine (Fansidar) 500 mg/25 mg 5. Amodiaquine 200 mg tablet 6. Quinine 300 mg tablet 7. Quinine 300 mg/mL injection 8. Sulfametopyrazine + pyrimethamine (Metakelfin) 500 mg/25 mg tablet 9. Mefloquine 250 mg tablet 10. Artesunate 50 mg tablet + mefloquine 250 mg tablet blister packs 11. Artemether + lumefantrine (Coartem) 100 mg/20 mg tablet
To prepare a PMM antimalarial medicine list, gather a group of local malaria experts to review the sample list and prepare a list of commonly used antimalarial medicines that should be available in the stores, at each level of MOH health facilities, in the private health facilities, and in the retail pharmaceutical outlets. For some of the medicines presented in the sample antimalarial list, more than one strength and/or formulation of the medicine is presented. For example, chloroquine 150 mg tablets and chloroquine 50 mg/5 mL syrup are included. When preparing the PMM antimalarial medicine list and the data collection forms, if more than one strength and/or dosage form of a medicine is included on the antimalarial list, each one should be listed as a separate medicine on a separate line to ensure accuracy of the data. After the process of preparing the antimalarial list has been completed, the data collection forms should be revised to reflect the country-specific PMM antimalarial medicine list. Data collection forms DAS-2, DAS-3, and DAS-4 use the PMM antimalarial list. Where there are different sizes of the same medicine presentation (e.g., chloroquine injection in Table 5), they should be treated as variations of a single item. Hence, chloroquine injection in 30 mL and 5 mL vials is listed as 2a and 2b. In assessing availability, they would be treated as a single item. For example, chloroquine injection 40 mg/mL would be considered available if the 30 mL vial was available while the 5 mL vial was out of stock. However, the availability of tablets does not replace the availability of syrup.
REMEMBER
This sample PMM antimalarial medicine list must be adapted and finalized in terms of local products used, dosage forms, and strengths before using it in your studies.
Pharmaceutical Management for Malaria Manual
26
8. Recruiting Data Collectors The work of the coordinators is supplemented by a team of data collectors who visit medical stores, health facilities, and retail pharmaceutical outlets and actually carry out the data collection.
It is necessary to recruit two groups of data collectors as follows—
• One group to collect data at the central and regional warehouses and another group to collect data in health facilities and to obtain availability and price data in formal public and private facilities and retail pharmaceutical outlets
OR
• One group to collect data at the central and regional warehouses and in health facilities and to obtain availability and price data in formal public and private facilities and retail pharmaceutical outlets and another group to carry out the simulated purchases
OR
• One group to do the drug availability study and another group to do the drug use study The number of data collectors to be recruited will depend on the number of sites to be visited and their geographical distribution. Assuming that data will be collected in four sites with average distances between facilities within these sites, a total of 12 data collectors (four teams of 3 data collectors) will be needed. Skills and Criteria for Selection of Data Collectors For the first group, the most effective data collectors will usually be doctors, pharmacists, nurses, or paramedical personnel who have worked in health facilities and have some knowledge or experience in medicine, pharmacy, or nursing. Such a background is needed to adequately manage data on medicines and to be familiar with the organization of local health systems. There is some risk in using students or other parties who have no practical experience in working with the record-keeping systems that they will encounter. The risks are that the students will have difficulty identifying the required data and that the work will be unduly slow and frustrating; these factors could negatively affect the quality of the data. A related problem lies in recruiting doctors, who may consider themselves too senior to carry out the relatively tedious work required. In general, the use of public health officials should be avoided because some facilities may be less compliant if they fear being reported for expired or inappropriate medicines and practices. The data collectors should have good communication skills so that they can work effectively with health providers. They must also be flexible enough to adapt the data collection process to suit a variety of sites. When recruiting the data collectors, it is important to ensure that they are

Chapter 2. Preparing for the Two-Part Study
27
available through the whole of the proposed study period and are willing to stay behind each day after data collection for daily debriefings. It may be useful to prepare, in advance, a checklist of skills that are required for the data collectors to ease and facilitate the process of selection. Teams should generally include a mix of clinical (nurses, doctors, clinical officers) and pharmaceutical (pharmacists, pharmacy technicians) personnel because both of these groups have specific skills that can be applied to the various data collection techniques. A responsibility of data collectors is to get data that is of the highest quality and is reliable and consistent. The calculation of indicators is based on the data collected; therefore, the data required, if available, must be collected completely. Data collectors must pay close attention to detail and fill out the forms in ink. The completed forms must be neat and able to be read by the study coordinator and the data entry personnel. It is important to carry out thorough training of all the data collectors (discussed in Chapter 4). Role of Team Managers Depending on the context (size of region, number of data collectors, etc.), it may be useful to build a team of managers. The team managers should meet at least one day in advance of the training in order to—
• Be briefed on all aspects of the study (background, objectives, methods) • Review the role and responsibilities of the team managers (these points should be
written)
• Review assignments of sites and data collectors
• Review the training program The role of the team managers is to act as supervisors to clarify any questions or problems in the field, assist with language if there is a need, and check the completeness and quality of the data collection forms submitted. Managers should be doctors, pharmacists, nurses, or paramedical personnel who have worked in health facilities and have some knowledge or experience in medicine, pharmacy, or nursing as well as some supervisory skills. 9. Arranging Logistics Arranging Timetables Scheduling and arranging timetables are complicated issues that are affected by factors such as the average time required to collect data in each site, the number of data collectors available, distances between sites, and transport arrangements. It is best to begin by thinking in terms of averages and then make refinements by considering the geographic implications of the site sample of the study.

Pharmaceutical Management for Malaria Manual
28
Experience suggests that, on average, about one day of data collection time and one to two days of travel time are required for completing work at one public health facility. Thus, in each district or geographical region, a total of 11 days will be needed to cover five facilities (an average of 5 days of data collection and 5 or 6 days of travel to and from the sites). The time required at private clinics and retail outlets is much shorter because no patient encounters will be reviewed at retail outlets and the main variable is geographic distribution. Assuming two outlets can be covered in one day, a total of six days will be needed including travel time (three days of data collection and three days of travel). Data can be collected at the CMS level in two days, after which the teams can split up and go to the four different geographical regions selected. Assuming that while in the field, two public health facilities and two private facilities can be visited, data collection in the field can be completed in three weeks using a team of 12 data collectors. Other Staffing Thus far, discussions have covered the roles of the study coordinators, data collectors, and data collection managers to supervise and coordinate groups of data collectors. Other persons who may be needed are administration support staff, persons to enter or process collected data, and drivers. It should be clear that the practical problems of managing a data collection schedule will be greatly simplified by employing these types of workers. Not employing them to save money will be false economy in most cases. Transport It may be faster to chauffeur data collectors directly to sites, but buses or other public transport can also be used. In some cases, combination approaches will be useful, in which some data collectors working in closely grouped sites are taken around by drivers, while others, who are going to remote sites, take the bus. Letters of Authorization One important detail that can cause serious problems if overlooked is letters of authorization. Authorization to conduct the study must be obtained prior to the study. Each data collector, team manager, and coordinator should be provided with letters from the appropriate authority (such as the MOH), which introduce the bearer, request cooperation, and authorize data release. Letters from different authorities may be required for visits to health facilities and retail pharmaceutical outlets. It may also be necessary to obtain authorization from the district in which the study is being carried out. Whenever possible, central- or district-level officials should inform the health facility authorities by telephone or radio prior to the arrival of the data collectors. Purchasing Supplies Supplies such as pens, clipboards, notebooks, and bags for the data collectors to carry forms in should be purchased in advance and ready for the first day of training.
Chapter 2. Preparing for the Two-Part Study
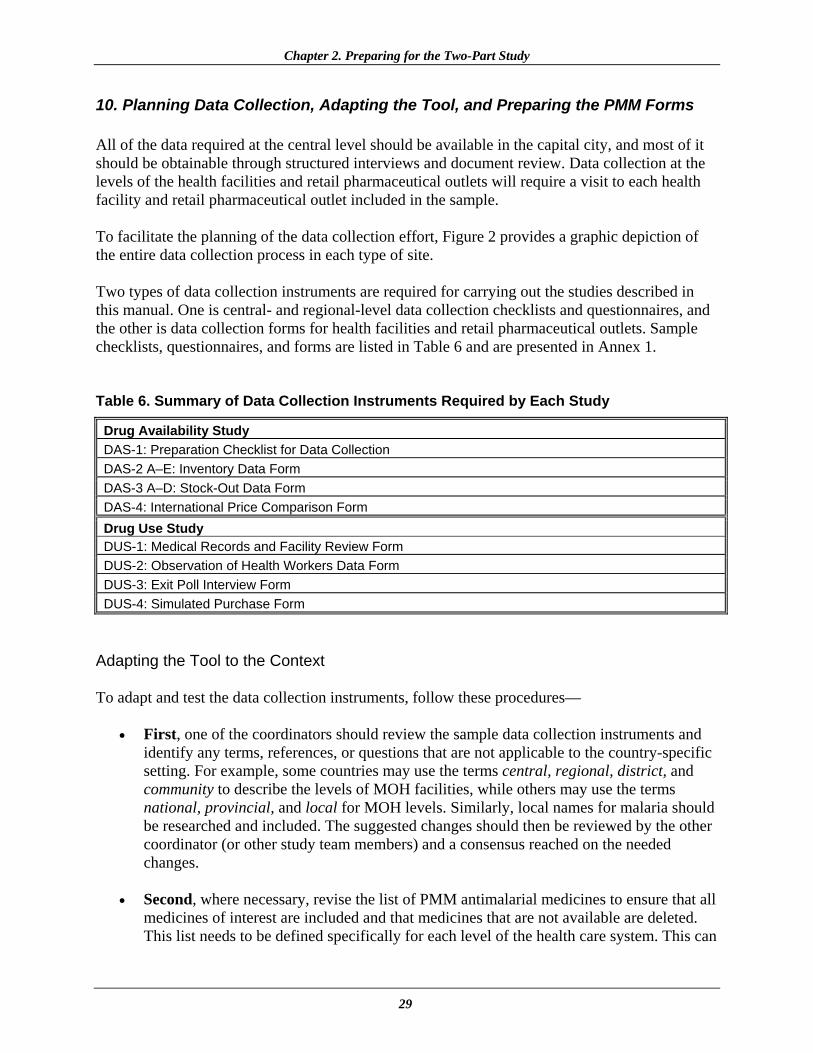
29
10. Planning Data Collection, Adapting the Tool, and Preparing the PMM Forms All of the data required at the central level should be available in the capital city, and most of it should be obtainable through structured interviews and document review. Data collection at the levels of the health facilities and retail pharmaceutical outlets will require a visit to each health facility and retail pharmaceutical outlet included in the sample. To facilitate the planning of the data collection effort, Figure 2 provides a graphic depiction of the entire data collection process in each type of site. Two types of data collection instruments are required for carrying out the studies described in this manual. One is central- and regional-level data collection checklists and questionnaires, and the other is data collection forms for health facilities and retail pharmaceutical outlets. Sample checklists, questionnaires, and forms are listed in Table 6 and are presented in Annex 1. Table 6. Summary of Data Collection Instruments Required by Each Study
Drug Availability Study DAS-1: Preparation Checklist for Data Collection DAS-2 A–E: Inventory Data Form DAS-3 A–D: Stock-Out Data Form DAS-4: International Price Comparison Form Drug Use Study DUS-1: Medical Records and Facility Review Form DUS-2: Observation of Health Workers Data Form DUS-3: Exit Poll Interview Form DUS-4: Simulated Purchase Form
Adapting the Tool to the Context To adapt and test the data collection instruments, follow these procedures—
• First, one of the coordinators should review the sample data collection instruments and identify any terms, references, or questions that are not applicable to the country-specific setting. For example, some countries may use the terms central, regional, district, and community to describe the levels of MOH facilities, while others may use the terms national, provincial, and local for MOH levels. Similarly, local names for malaria should be researched and included. The suggested changes should then be reviewed by the other coordinator (or other study team members) and a consensus reached on the needed changes.
• Second, where necessary, revise the list of PMM antimalarial medicines to ensure that all
medicines of interest are included and that medicines that are not available are deleted. This list needs to be defined specifically for each level of the health care system. This can

Pharmaceutical Management for Malaria Manual
30
be done by consulting the STGs for malaria, visiting these facilities, and recording the antimalarial medicines that are most commonly stocked and prescribed.
• Third, visit a few health facilities and test the data collection instruments and the
methods for collecting the data as described in this chapter. Relevant cost data should be collected to assist with budget planning. For example, pharmaceutical cost information would help prepare a budget for purchasing medicines during simulated purchase exercises.
• Fourth, revise the data collection instruments and, if necessary, the data collection
methodology to ensure familiarity with the entire data collection process and confirm readiness to train data collectors to do their job. The revised data collection forms should be distributed to the data collectors during the training.
• Fifth, decide whether data on the supplemental indicators is required. The forms in
Annex 1 have been designed to collect data on the supplemental indicators. If this information is not needed, these optional sections must be deleted from the forms.
REMEMBER This chapter has described the preparatory activities that need to be carried out in the different target sites when planning the two-part assessment. As depicted in Figure 2, data from the central MOH and MOH warehouses/medical stores can be collected before the field data collection at health facilities and retail pharmaceutical outlets. The data collector numbers (1, 2, and 3) refer to the three teams of data collectors and their possible roles in the morning (AM) and afternoon (PM).
It is essential to understand that the forms supplied in this PMM Manual are sample forms, and although they have been used in a number of countries, they still must be tested and adapted prior to launching data collection activities.

Chapter 2. Preparing for the Two-Part Study
31
Central MOH
MOHWarehouses/
Medical Stores
Health Facility
PharmaceuticalRetail Outlet
Document Review
Interviews
Background Information
Physical Inventory Count(DMM Tracer Medicines)
Interviews
Record Prices
12 months ofStock Records
½ day
Physical Inventory Count
Review Inventory Records
Direct Observation
Exit Poll Interviews
Patient Medical Record Review
Data Collector #3 in AM
Data Collector #1 in AM
Data Collector #2 in AM
Data Collectors #1 and #2 in PM
Simulated Purchase
Collect Medicine Prices
Chloroquine TabletData Collectors#1 and #2 in PM
Data Collector#3 in PM
Figure 2. PMM Data Collection Process Flow Chart
Sulfametopyrazine + Pyrimethamine
Review Inventory Records
Background Interviews
½ day

Pharmaceutical Management for Malaria Manual
32

PHARMACEUTICAL MANAGEMENT FOR MALARIA MANUAL
CHAPTER 1:
INTRODUCTION
CHAPTER 6:
USING THE FINDINGS
CHAPTER 5: ANALYZING DATA AND PRESENTING
RESULTS
CHAPTER 3: COLLECTING THE
DATA
CHAPTER 2: PREPARING FOR THE
TWO-PART STUDY
CHAPTER 4: TRAINING FOR DATA
COLLECTION

Pharmaceutical Management for Malaria Manual
34

35
Chapter 3.
COLLECTING THE DATA
Data Collection Methods Data for calculating the 12 indicators (and the 4 supplemental indicators) are collected using six different data collection techniques at central, regional, health facility, and retail pharmaceutical outlet levels. The six techniques are document review, physical inventory check, record review, simulated purchase, direct observation, and exit poll. Some of the techniques will be used at more than one level. Collecting Data in Medical Stores To obtain information for Drug Availability Study Indicators 1 through 4 and Supplemental Indicator 13, data collection will involve structured interviews, retrospective document reviews, and inventory checks in the medical stores. Collecting Data in Public Health Facilities Retrospective Data Collection in Public Health Facilities To gather information for Drug Use Study Indicators 5 through 9, data collection will involve a retrospective review of patient records in MOH health facilities. The retrospective method of data collection requires that adequate sources of data exist. For the purposes of this study, the records should allow selection of a random sample of patient encounters within a defined period of time.

Pharmaceutical Management for Malaria Manual
36
The records should also include the specific names, strengths, and routes of administration of all medicines prescribed.
As discussed in Chapter 2, for each category of malaria studied through retrospective data collection, a minimum of 600 patient encounter records must be reviewed.
REMEMBER
Organizers should also discuss as a group and reach consensus on a list of local terms that may be used in health facility records to describe symptoms that denote malaria. This list can be used as a reference by data collectors.
Prospective Data Collection in Public Health Facilities
To gather information for Drug Use Study Indicators 10, 11, and 12 (and Supplemental Indicators 14, 15, and 16), a prospective method will be used. Structured observation will be the data collection technique used with the prospective method.23 Collecting Data in Private Health Facilities and Retail Pharmaceutical Outlets Retrospective Data Collection in Private Health Facilities To gather information for Drug Use Study Indicators 6 through 9, data collection will involve a retrospective review of patient records in private health facilities as in public health facilities. For each category of malaria studied through retrospective data collection, 30 medical records for each malaria category problem in each of the health facilities must be obtained. Prospective Data Collection in Private Health Facilities To gather information for Drug Use Study indicators 10, 11, and 12 (and Supplemental Indicators 14, 15, and 16), a prospective method will be used. Structured observation will be the data collection technique used with the prospective method.24 23 International Network for Rational Use of Drugs (INRUD) Social Scientists Working Group. December 1996. How to Use Qualitative Methods to Design Drug Use Interventions (Working Draft). Arlington, VA: Management Sciences for Health. 24 Ibid.
Two malaria categories are potentially part of the study: uncomplicated malaria and intermittent preventive treatment of pregnant women. Therefore, a total of 800 patient encounter records (30 randomly selected records from each facility for uncomplicated malaria and 10 for IPT given to pregnant women during antenatal care) are needed. Indicator 12 (pregnancy) should be used only if it is in line with government policy.

Chapter 3. Collecting the Data
37
Prospective Data Collection in Retail Pharmaceutical Outlets The data on the prescribing practices in retail pharmaceutical outlets will be collected prospectively. The data collection technique used will be simulated purchases. The trained data collectors will have the task of presenting the scenario for uncomplicated malaria (see box later in this chapter). Data Collection Techniques Document Review
Chapter 2 outlines several planning activities to conduct the two-part study (see Table 3). Reviewing documents to collect country-specific vital statistics and background information, as well as data on MOH pharmaceutical operations, is an important part of the planning. Tables 1, 2, and 3 provide guidance on what information to collect. It is important to remember that information gathered during face-to-face interviews should be confirmed or supported through documentation. Also, always make sure to note the date of the interview and have an understanding of the context (e.g., regional versus national, public versus private) for the data or documents collected. Physical Inventory Checks The physical inventory and review of records take place in MOH storage and health facilities as well as retail pharmaceutical outlets. The physical inventory and review of stock records serve as a “single point in time” check that is carried out by examining the bin card and the stock card records of each PMM tracer medicine item in stock. A physical count of stock on hand will be necessary to check that the stock balance records are correct. Conducting the physical inventory check in MOH facilities will provide an additional form of evaluation that may reveal defects in the warehousing system and identify surplus, expired, and obsolete stock. Patient Medical Records Review
Patient medical records serve as the primary source of retrospective data on the prescribing practices used to treat malaria. Chapter 2, Preparing for the Two-Part Study, describes how the records will be selected.
The following steps are suggested—
Step 1: Begin by extracting, from the facility’s patient register, a list of names of at least
five patients per month for malaria (to allow for patients on whom insufficient data are available and for seasonal variation) for the 12 months prior to the time of the study. Start with the most recent full month and work backward (e.g., October 2002, September 2002, August 2002, etc.).

Pharmaceutical Management for Malaria Manual
38
Step 2: To use a random process for selecting names from malaria encounters recorded in the facility’s patient register, follow the interval method of sampling described in Chapter 2. To summarize, for each month (using the list of local terms the study team has developed to identify malaria), group the encounters relating to malaria. For each month—
• Note the total the number of encounters for malaria.
• Select every nth encounter, where n is determined by dividing the number
of encounters identified for that month by three. For example, if 25 malaria encounters were identified for the month of October, divide 25 by 3 for a quotient of 8.3. Then, using the nearest whole number to the quotient, select every eighth encounter to randomly identify the three malaria encounters needed for the month of October.
• Carry out this same process for each of the remaining 11 months.
Step 3: Starting from the most recent case, fill out the data collection forms, recording
information until complete data on all indicators are collected for 30 outpatient contacts for malaria at each site.
In rare cases, most or all of the data required to fill out the forms may be found in the register. More commonly, however, it is necessary to consult the individual patient records and/or dispensary records. Make sure to check that at least the medicine name and dose are included in the records before selecting the record as an encounter to include in the data sample.
Step 4: In either case, select from the list of names the records that contain information
(that is as complete as possible) for at least two patients per month during the low season and four patients per month during the high season for malaria. For instance, where the high-season malaria months are from March to June, the data collectors will randomly choose four records (as described above), while for the months from July to February, the data collectors will randomly choose two records. If there is no seasonality involved in the occurrence of malaria, the data collectors will randomly choose three records per month, that is, a total of 36 records.
REMEMBER
The reason for beginning with the larger list of names (36 rather than the required 30) is that very often the records do not contain complete data for every contact, so a certain number of names for which data are incomplete will have to be discarded.

Chapter 3. Collecting the Data
39
Direct Observation Direct observation, a data collection technique used in the Drug Use Study, requires that data collectors directly observe the behavior of the health worker(s) for the purpose of describing particular prescribing practices. For this study, the data collector will conduct a nonparticipatory observation; the data collector will observe the health worker without interacting with or interrupting the person being observed. The data collector will observe events using a guide that has been planned in advance (i.e., based on the specific prescribing practices described in the indicators). The data collector will record, as inconspicuously as possible, whether or not the events described in the guide take place during the session. To work, this technique requires qualified (see Chapter 2, Recruiting Data Collectors) and reliable data collectors to serve as observers, a clear and informative observational guide, and the cooperation of those being observed. One factor that limits the objectivity of the process is the presence of the “noninteracting” observer. This person’s presence may influence the behaviors of the person or events being observed. Thus, there is a level of bias in the process on the part of both the observer (subjective judgment regarding events being recorded) and the health workers being observed (who may alter their usual performance to impress the observer). Data collectors should be trained to be neutral and nonjudgmental toward the person being observed. Before observing a consultation, the data collector must obtain permission to conduct these observations from the administration of the health facility and develop a method of identifying the patient’s health problem as malaria. This can be done by asking each of the patients or caregivers directly about the nature of their complaint or ailment as they wait in the lobby. All patients must be assured of the confidentiality of the information provided. Another option would be for the data collector to first develop a master patient list that identifies each patient’s age and chief complaint from the patient register and then observe each of those consultations. Some methods may be applied more easily in larger facilities, while other methods may be more efficient in smaller facilities. Whatever approach is selected, it should first be discussed among study team members as a group and agreed upon jointly with a member of heath center staff prior to the start of the actual observations. One of the challenges in using the prospective method in this setting is collecting data for a large enough sample size within the short time frame available for observation. For this particular aspect of the study, a convenience sample25 of patients will serve as the data set, which may make it difficult to identify a large enough sample of cases. Therefore, the data collectors should include in the sample all malaria patients attending each health facility. Although random selection would eliminate potential biases, given the limited data collection time period, using malaria as the only selection criteria is necessary to obtain a large enough sample size. Spending half a day of observation in each health facility should provide a representative data set to review the prescribing practices of health workers for malaria patients. Although no firm rule exists, data
25 As its name implies, a convenience sample is a sample identified primarily by convenience. That is, it is a nonprobability or nonrandom sampling technique whereby items are included without known probabilities being selected.

Pharmaceutical Management for Malaria Manual
40
collectors should try to observe 10 to 15 patient encounters in each of the 20 health facility sites to adequately describe the prescribing practices (for a total sample of 200–300).
Two data collectors should work as a team. One data collector should be located in the examination room or area to observe and hear the health workers’ interactions with patients. The data collector must be as unobtrusive as possible and not disrupt the consultation or bias the responses of the caregiver or the behavior of the health worker. A new observation questionnaire should be completed for each patient seen. The other data collector should be stationed outside the facility to conduct exit poll interviews of patients as they leave. To conduct the structured observations, follow these steps—
Step 1: As part of the study preparation, the study coordinators, in collaboration with the data collectors, should develop the observation guide and exit poll interview guide. These guides should include a checklist of the specific prescribing practices to look for during the observation or to ask about during the exit poll interview. Forms DUS-2 and DUS-3 in Annex 1 can serve as models.
Step 2: Carefully select the data collectors who will serve as observers. To help ensure accurate data, observers should be familiar with the cultural background of the people being observed and able to understand their language. They should also be familiar with pharmaceutical and general medical terms, and they should be able to sit quietly and observe without interfering.
Step 3: Train observers/interviewers and conduct a practice session to test the data collector’s observation technique and exit poll interview skills, as well as the observation guide and exit poll interview survey. A sample observation guide (DUS-2) and exit poll interview survey form (DUS-3) are included in Annex 1.
Step 4: Determine the encounter to be observed by identifying patients either in the health facility waiting area or as they are registered according to the description of the chief complaint. The selection criterion is that the patient has the symptoms of uncomplicated malaria.26 After the patient has been identified, one of the observers should follow the patient/caregiver through the screening, examination, and treatment process until the patient leaves the health facility.
Step 5: Give the patients/caregivers a colored slip of paper with the encounter number to carry until they exit the facility. This “tag” will enable the data collector conducting the exit poll interviews to identify which patients/caregivers to interview. As the patient/caregiver leaves the facility, the other data collection team member should ask the patient/caregiver for the paper, record the same encounter number on the exit poll interview survey form, and conduct the exit poll interview. This process will allow data collectors to match the observation with the exit poll interview and assist in comparing what was said (or not said) to the patient/caregiver by the health worker and what was understood by the patient/caregiver.
Step 6: Analyze and interpret the observational findings.
26 These symptoms are fever, chills, and vomiting.

Chapter 3. Collecting the Data
41
Exit Poll Interviews
Exit poll interviews are used in the Drug Use Study. Malaria patients and caregivers of children and adults who are sick with malaria are the target audience for the exit poll interviews. The purpose of the exit poll interviews is to determine how well each patient/caregiver understood the instructions given by the health worker or medicine dispenser about the medicine prescribed and about follow-up care in case of worsening conditions, as well as whether the patient/caregiver has obtained the prescribed medication. Medicine Price Data in Retail Pharmaceutical Outlets As part of the process of conducting reviews of medical records in health facilities (DUS-1 Medical Records and Facility Review Form), a record of the medicines prescribed will be developed. To collect data on the retail prices for these medicines, a data collector should follow these instructions: visit the retail pharmaceutical outlets, ask the medicine seller the price for each medicine, and record the sales prices on DUS-1. If an item is not stocked, skip that medicine and go on to the next one. Where a site stocks more than one brand of the same product, record the name and price of the least expensive product. For medicines that are repeated on DUS-1 (i.e., same formulation of medicine with the same concentration), record the price only the first time it appears on the form. The prices collected on this form will be used to calculate the costs for Indicator 9 (average cost of medicines prescribed as a percentage of costs if STGs for treating malaria were followed) (see also Chapter 5 in Data Collector’s Guide). Simulated Purchases in Retail Pharmaceutical Outlets In the simulated purchases technique, data collectors pose as ordinary customers and attempt to purchase treatment for a certain condition. Simulated purchases are used rather than direct observation because observation requires the observer to stay at the site for a substantial period of time. In a retail setting, this presence may be disruptive to customer service and would probably cause the medicine sellers to modify their behavior. Also, if asked directly, medicine sellers are likely to inaccurately report their practices. Experience in a number of countries shows that there are usually significant differences between medicine sellers’ reported and observed prescribing practices.
Using simulated purchases should minimize both the problems of bias in the study and the inconvenience to the medicine seller or medicine shop manager. However, this technique does raise some ethical concerns because informed consent is not obtained from the medicine seller before the study is conducted. These issues must be dealt with in the country, and the benefits of obtaining this information versus the ethical concerns must be weighed. One method of handling some of the ethical concerns may be for a central or district authority to send a letter a few weeks in advance of the study indicating that a group a researchers may be conducting a study in their area and that their facility may be one of the ones visited. Make sure each data collector is familiar with the specific retail pharmaceutical outlets to be surveyed and has a timetable of when the simulated purchases will occur. Each data collector

Pharmaceutical Management for Malaria Manual
42
should have enough money to make the purchases and the transportation and accommodation arrangements.
Data collection forms and checklists are provided in Annex 1 of this manual. Table 9 lists the data collection techniques, sites, techniques, and forms used in each Conducting the Survey As part of the planning process, a workplan should be completed that includes all the specific sites, facilities, departments, and personnel to be visited, a timetable of when the visits will occur, the assignment of teams to specific locations or areas, and transportation and accommodation arrangements. In preparation for conducting the survey of MOH offices, facilities, and private health centers and retail pharmaceutical outlets, it is important to review the work plan with the whole study team. Maintaining a high level of open communication among study team members and making sure that all team members know their respective responsibilities will help minimize problems during the data collection process.
Scenario for Simulated Purchases: Uncomplicated Malaria Present yourself as the caregiver of a 12-year-old girl who has had a fever on and off for a week. Use local terms to describe the symptoms of the child. Request advice regarding which products to give the child. Do not provide any additional information unless directly asked for more information. Purchase the drugs recommended by the retail drug seller and leave the shop. If the medicine seller asks these questions, reply as follows— The condition of the girl: In addition to the fever, the child has complained of a headache and aches and pains since last week. She has been feeling generally unwell for a week. Whether the girl took medication: Say that she took a full course of chloroquine a week ago. The fever went away after this, but returned three days later. Can the girl take food and/or liquids: Say she is able to take both liquids and food. Actions Notice and remember the following (you can ask the drug seller to repeat questions)—
• What questions the medicine seller asked (e.g., about severity of disease, recent treatment)
• Whether the medicine seller gave instructions on how to administer the medication
• Whether the medicine seller told you about the warnings associated with the product
• Whether the medicine seller gave other advice or information on how to care for the child and treat the fever episode
• The name(s) and cost of the product(s) recommended for purchase This information should be written on data form DUS-4 after exiting and leaving the area, but before conducting the next simulated purchase.

Chapter 3. Collecting the Data
43
Before sending data collectors into the field, study coordinators should make sure that each person is familiar with and has enough copies of all the data collection instruments he or she will need for the site(s) that person is responsible for. In addition to the Data Collector’s Guide, explicit, written instructions for using the data collection instruments should be given to each data collector. Samples of written instructions are included with the respective samples of data collection instruments in Annex 1. Study coordinators should develop a system for collecting, grouping, and storing completed data collection forms. Supplies such as pens, notebooks, and bags for carrying forms should be given to each data collector. Study coordinators should make sure that all the site visits have been approved and scheduled by the MOH. As mentioned previously, facilities should be notified in advance with letters from the MOH. Data collectors should be given copies of letters of introduction that confirm their identity and authorization to survey a site as well as the letter of authorization from the MOH, if possible. Table 7. Data Collection Sites and Techniques for the Studies
Study Techniques Site PMM Form
Interviews MOH offices/CMS
Document review MOH offices DAS-4
Records review CMS/RMSs/HFs DAS-3
Drug Availability
Inventory check CMS/RMSs/HFs/DOs DAS-2
Patient medical record review Health facilities DUS-1
Direct observation Health facilities DUS-2
Exit poll interviews Health facilities DUS-3
Drug Use
Simulated purchases Pharmaceutical
outlets DUS-4 Case Management Study
Direct observation Health facilities DUS-2
Simulated purchases Pharmaceutical
outlets DUS-4 Supplemental Indicators
Exit poll interviews Health facilities DUS-3
Note: MOH = Ministry of Health, CMS = Central Medical Store; RMS=Regional Medical Store; HF = Health facility; PO = Pharmaceutical outlet Several of the drug availability and drug use indicators are based on a retrospective review of stock records and patient medical records. For the pharmaceutical management assessment, the coordinators should select a study time period to cover the last consecutive 12 months. It is important for all data collectors to use the same 12-month period to ensure that the data received from all sites are comparable.

Pharmaceutical Management for Malaria Manual
44
Troubleshooting Drug Availability Study Troubleshooting As mentioned earlier, the key to successful data collection is good planning. However, no matter how thorough the planning, problems can always arise. Such unexpected problems can be minimized if good, open communication among study team members is maintained and all participants remain flexible and willing to adapt to new situations. Table 8 presents a few typical problems, along with suggested solutions, that can occur while conducting the Drug Availability Study. Remember, these examples are only illustrative. Every country is different and can present the coordinator with different, country-specific problems. Table 8. Illustrative Examples of Potential Problems and Possible Solutions
in Drug Availability Studies
Potential Problems Possible Solutions Key informants do not keep scheduled appointments.
Reconfirm meeting times, clinic hours, and retail outlet hours. Create backup options and, if possible, try to schedule meetings in the same geographic area on the same day.
Data collectors do not show up for training and work.
Recruit a few extra data collectors to anticipate any transportation or personal emergencies among data collectors. Also, pairing data collectors into teams will ensure having a backup option.
PMM antimalarial medicines are not available in the country.
As mentioned in Chapter 2, the study team should adapt the sample list of PMM antimalarial medicines (Table 5) to the country setting. If a product on the list is not available, select the best alternative available in-country (this should be done at the level of the survey organization and not at the level of the data collection).
The dosage form of the medicine is different from that indicated on the sample data collection form.
The sample data collection forms should also be adapted and tested as outlined in Chapter 2. This step should catch any inconsistencies before the data collection begins.
Health facility and retail medicine managers are skeptical or resistant to permitting someone to go through confidential patient records.
Sometimes having an “official government letter of authorization” may not be enough to gain cooperation of managers. Try to gain support for the study from health professional groups such as associations for doctors or pharmacists. Also talk to the managers about the study and the ultimate benefit to the country. Emphasize that you are evaluating neither the health staff personally nor the specific health facility, but that instead you are trying to assess how well the health system as a whole is functioning with respect to management of malaria medicines.
A sample facility is closed or not functioning for some reason.
Have a defined list of “substitute” facilities in anticipation of any closings. Data collectors should not be left to make the decision on their own about selecting sites.
Data collectors are not completing the data forms correctly and some are not legible.
Make sure that the data collectors use pens, not pencils, to fill out the data collection forms. Conduct spot checks of the forms to catch any problems early in the process. Make pay contingent upon receiving acceptable forms.
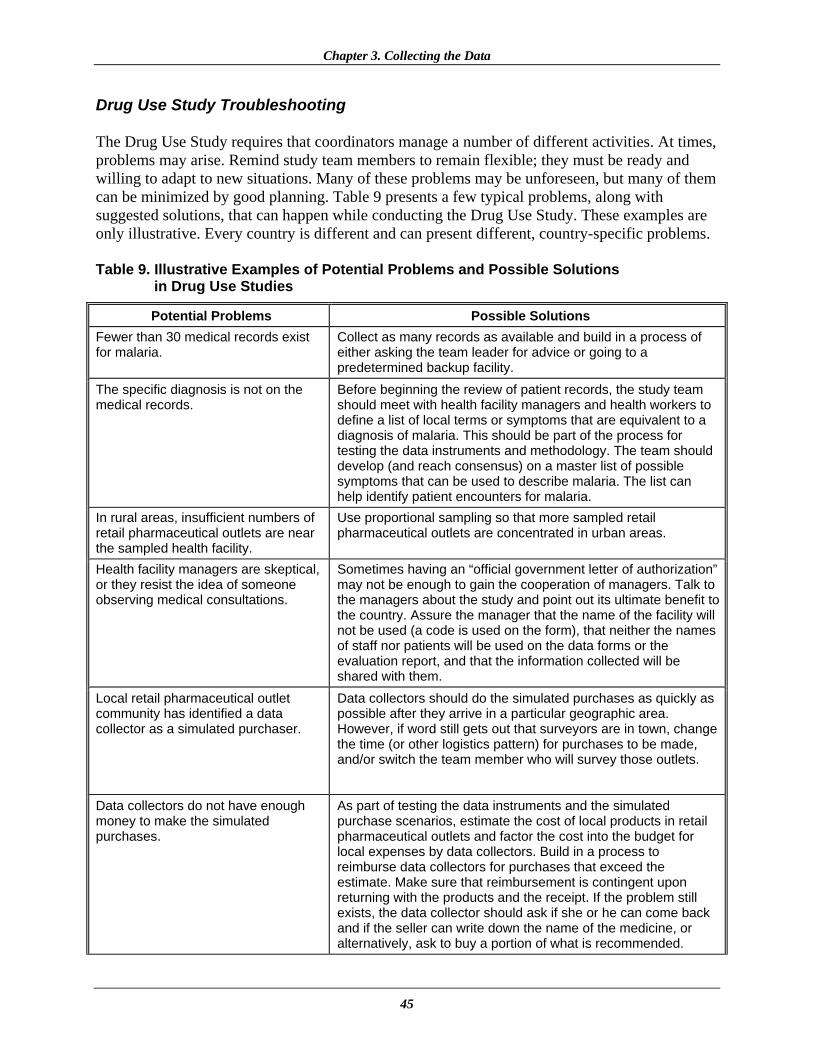
Chapter 3. Collecting the Data
45
Drug Use Study Troubleshooting The Drug Use Study requires that coordinators manage a number of different activities. At times, problems may arise. Remind study team members to remain flexible; they must be ready and willing to adapt to new situations. Many of these problems may be unforeseen, but many of them can be minimized by good planning. Table 9 presents a few typical problems, along with suggested solutions, that can happen while conducting the Drug Use Study. These examples are only illustrative. Every country is different and can present different, country-specific problems. Table 9. Illustrative Examples of Potential Problems and Possible Solutions
in Drug Use Studies
Potential Problems Possible Solutions Fewer than 30 medical records exist for malaria.
Collect as many records as available and build in a process of either asking the team leader for advice or going to a predetermined backup facility.
The specific diagnosis is not on the medical records.
Before beginning the review of patient records, the study team should meet with health facility managers and health workers to define a list of local terms or symptoms that are equivalent to a diagnosis of malaria. This should be part of the process for testing the data instruments and methodology. The team should develop (and reach consensus) on a master list of possible symptoms that can be used to describe malaria. The list can help identify patient encounters for malaria.
In rural areas, insufficient numbers of retail pharmaceutical outlets are near the sampled health facility.
Use proportional sampling so that more sampled retail pharmaceutical outlets are concentrated in urban areas.
Health facility managers are skeptical, or they resist the idea of someone observing medical consultations.
Sometimes having an “official government letter of authorization” may not be enough to gain the cooperation of managers. Talk to the managers about the study and point out its ultimate benefit to the country. Assure the manager that the name of the facility will not be used (a code is used on the form), that neither the names of staff nor patients will be used on the data forms or the evaluation report, and that the information collected will be shared with them.
Local retail pharmaceutical outlet community has identified a data collector as a simulated purchaser.
Data collectors should do the simulated purchases as quickly as possible after they arrive in a particular geographic area. However, if word still gets out that surveyors are in town, change the time (or other logistics pattern) for purchases to be made, and/or switch the team member who will survey those outlets.
Data collectors do not have enough money to make the simulated purchases.
As part of testing the data instruments and the simulated purchase scenarios, estimate the cost of local products in retail pharmaceutical outlets and factor the cost into the budget for local expenses by data collectors. Build in a process to reimburse data collectors for purchases that exceed the estimate. Make sure that reimbursement is contingent upon returning with the products and the receipt. If the problem still exists, the data collector should ask if she or he can come back and if the seller can write down the name of the medicine, or alternatively, ask to buy a portion of what is recommended.

Pharmaceutical Management for Malaria Manual
46
Potential Problems Possible Solutions Prescribed medicines are recorded by brand names that are unfamiliar to the data collectors.
Information should be written on the data forms exactly as written in the patient encounter record, even if the terms are unfamiliar to the data collector. Data collectors should be instructed to avoid any interpretation. Team managers should review the forms before leaving the health facility. Any unavailable data should be obtained by interviewing the head of the facility and circling the response.
Prescribed medicines are identified, but numbers of units are not.
The data needed for a particular patient encounter may not be in the same record source. Start with the patient register and then move to the medical records. If data on antimalarial medicines are still missing, see if the facility has pharmacy or dispensing records. If all else fails, ask the staff, during the completion of the medical personnel questionnaire, how many units of each medicine they would normally provide for a child of that age, with the symptom(s) listed in the record. Then write this information on the form, but draw a circle around it. The circle means that information missing from the record came from an interview.
Data collectors are not completing the data forms correctly and some are not legible.
Make sure that the data collectors use pens, not pencils, to fill out the data collection forms. Conduct spot checks of the forms to catch any problems early in the process. Make pay contingent upon receiving acceptable forms. Someone on the study team, usually the data collection team manager, should be designated to review each data collection instrument when it is completed before leaving the facility, to check the data for completeness and correctness.
What to Do if Retrospective Data in Health Facilities Are Incomplete
Very often, data from records are incomplete. This is particularly true for prescribing data such as the dosage regimen and duration of therapy. It will be rare to find retrospective data that contain all the information needed. The following algorithm is an approach that can be used to collect “proxy” data to fill in incomplete retrospective data. However, the obvious drawback to this approach is that with each progressive step the data collected are probably less close to the actual prescription pattern. The boxes contain the possible situations while the text beneath indicates what course of action could be followed. Annex 1 includes data collection instruments that can be used to collect the data described below.
Use retrospective method.
Retrospective data available in records over a period of 12 months, containing all necessary details.

Chapter 3. Collecting the Data
47
Use retrospective method and interview the prescriber on what his or her normal prescribing practices are for each of the prescribed medicines, when prescribing for each of the categories. Apply his or her normal prescription pattern to all encounters and medicines where details are missing. Information collected through interviews should be circled to clarify the source of each piece of data. This step should be emphasized during training.
Use retrospective method and interview the head of the outpatient department on what the recommended prescribing practices are for each of the prescribed medicines. Apply his or her recommended prescription pattern to all encounters and medicines where details are missing. Information collected through interviews should be circled to clarify the source of each piece of data. Recording the Data It is important to instruct data collectors to write legibly with a pen (not pencil) and to use marks or phrases that indicate a complete thought or response when filling out the data collection instruments. Depending on the data collection instrument, the collector may need to use a check mark, write “YES” or “NO,” circle a response, or write a phrase or sentence to explain a particular finding. Careful marking is important because the person completing the form may not be the same person who will enter the data or tabulate the results. Someone on the study team, usually the data collection team manager, should be designated to review each data collection instrument when it is completed before leaving the facility, to check the data for completeness and correctness. The team manager should sign or initial and date each form checked to ensure that this crucial step is not skipped. The review of data collection instruments is useful because it will allow identification of any problems early in the data collection phase, and corrective interventions can be implemented to prevent future mistakes. To avoid confusion, it is advisable to collate and prepare data for analysis as the data are collected. The most efficient approach for data entry is to identify and use experienced data entry clerks. Although this method represents an additional expense, it is more cost-effective over time. The data entry person should be instructed to put his or her initials on each data collection form in a designated spot to indicate that the data entry is completed for that form.
Records available over a period of 12 months, not containing all necessary details; prescriber can be interviewed.
Records available over a period of 12 months, not containing all necessary details; prescriber cannot be interviewed, but head of the outpatient clinic can be interviewed.
Pharmaceutical Management for Malaria Manual
48
Completing the Data Collection Instruments At the end of each site visit, every data collection questionnaire, checklist, or form completed during the visit should be examined by the data collector for incomplete data. The responsible data collector should make every attempt to collect the incomplete data before leaving the site. Before beginning the process of deriving the specific indicators, a complete recheck and editing are necessary to clean the data. If data for a particular item on the data collection form are missing or incomplete, that item (not the entire data collection form) should be eliminated. The number of eliminated items should be counted and discussed in the final report.

49
PHARMACEUTICAL MANAGEMENT FOR MALARIA MANUAL
CHAPTER 1:
INTRODUCTION
CHAPTER 6:
USING THE FINDINGS
CHAPTER 5: ANALYZING DATA AND PRESENTING
RESULTS
CHAPTER 3: COLLECTING THE
DATA
CHAPTER 2: PREPARING FOR THE
TWO-PART STUDY
CHAPTER 4: TRAINING FOR DATA
COLLECTION

Pharmaceutical Management for Malaria Manual
50

51
Chapter 4.
TRAINING FOR DATA COLLECTION
The qualifications and skills required by the data collectors are discussed in Chapter 2. A companion document, PMM Data Collector’s Guide, is available to facilitate the training of data collectors and can serve as a guide to data collectors in their fieldwork. Preparatory Activities To ensure that the training activity is carried out properly, the study coordinator should do the following in advance—
• Select team managers and brief them before the training. The team managers are usually senior personnel who have extensive knowledge of the health system or who have worked or are still working in health facilities.
• Hire data collectors. • Identify a training venue that allows for flexibility in breaking up into small groups and
gathering for lecture-style presentations. • Make any necessary travel arrangements for data collectors to get to the training venue.
• Identify at least one health facility and one retail pharmaceutical outlet convenient to the
venue where data collectors can practice their work.

Pharmaceutical Management for Malaria Manual
52
• Make sufficient copies of all data collection forms and create individualized packets (see below).
• Prepare practice data for use in practical exercises and role playing. • Schedule training dates to allow sufficient time for all aspects of training.
Each data collector’s packet, which should be distributed at the start of the training, should include the following (contents may vary depending on the country-specific situation)—
• A copy of the Data Collector’s Guide and a complete set of the modified data collection forms
• A letter of introduction from a recognized authority to introduce the data collectors to the
health facilities
• The contact information of the team manager (name, telephone number)
• The data collection schedule
• A clipboard, a notebook for taking field notes, two pens, paper clips for securing forms Training Tips It is essential that all recruits be trained and that the training include actual practice in filling out all forms required for both health facility and retail pharmaceutical outlet data collection. Role-plays on interview techniques should also be carried out. This process helps build the necessary skills and confidence for the upcoming activities. In addition, using the data collection forms during training serves several purposes—
• Identifies and corrects questions that are inappropriate or unclear for the health setting • Familiarizes data collectors with the questionnaires • Provides a medium for learning and practicing data collection techniques
It is important to plan within the schedule for time required to practice in the field at a predetermined training site. The amount of training will vary depending upon the caliber and previous experience of personnel employed. Although all the data collectors are trained together with respect to the forms and data collection techniques, they should break up into teams for practice sessions and role-plays. Table 10 illustrates a model training course that may be adapted to suit local circumstances.

Chapter 4. Training for Data Collection
53
Table 10. Illustrative Four-Day Training Course for Data Collectors in Health Facilities and Retail Pharmaceutical Outlets
Day Training Activities Time
1
1. Opening—Introduction of the data collectors 2. General presentation— • Purpose of the survey: to document drug availability and drug use for
malaria • Training objectives: to familiarize data collectors with survey
questionnaires and data collection techniques • Introduction of the Data Collector’s Guide • Where to collect data: health facilities and retail pharmaceutical outlets • Data collection techniques to use: direct observation, interviews, simulated
purchases, record reviews • Discuss data collectors’ expectations or concerns • Explain that some data collectors may be eliminated after the training 3. Work schedule and compensation 4. Location of sites to be surveyed
1 to 2 hours
5. Review survey form DAS-1: Preparation Checklist for Data Collection 6. With the remaining survey forms grouped according to where data are to
be collected, review them one by one as follows— Central Medical Store/Regional Medical Stores • DAS-2D: Inventory Data Form • DAS-3: Stock-Out Data Form • DAS-4: International Price Comparison Form MOH Health Facilities • DAS-2A–D: Inventory Data Form • DAS-3: Stock-Out Data Form • DAS-4: International Price Comparison Form (optional) • DUS-1: Medical Records and Facility Review Form • DUS-2: Observation of Health Workers Data Form • DUS-3: Exit Poll Interview Form Retail Pharmaceutical Outlets • DAS-2E: Inventory Data Form • DUS-1: Medical Records and Facility Review Form (medicine price
information) • DUS-4: Simulated Purchase Form
2 to 3 hours

Pharmaceutical Management for Malaria Manual
54
Day Training Activities Time
7. Central Medical Store/Regional Medical Stores visits— • Practice filling out survey forms DAS-2, DAS-3, and DAS-4 • Practice role-plays for forms DAS-2, DAS-3, and DAS-4 8. MOH health facility visits— • Practice filling out survey forms DAS-2, DAS-3, DAS-4, DUS-1, DUS-2,
and DUS-3 • Practice role-plays for forms DAS-2, DAS-3, DAS-4, DUS-1, DUS-2, and
DUS-3 in small groups 9. Retail pharmaceutical outlet visits— • Practice filling out survey forms DAS-2E and DUS-4 • Practice role-plays for forms DAS-2E and DUS-4 in small groups 10. Discuss policy of patient confidentiality
2 to 3 hours
1. Practice how to draw a sample of patient encounters from health facility records 1 hour
2 2. Visit predetermined health facilities and collect a complete set of data
using survey forms: DAS-2, DAS-3, DAS-4, DUS-1, DUS-2, and DUS-3 5 to 6 hours
3
1. Debrief on health center practice visits: critique performances and troubleshoot problems
2. Discuss revisions of forms if any are necessary as a result of practice visits
3. Role-play in small groups: check reliability (quality) of data collector knowledge, skills, and abilities for filling in the data collection forms
3 to 4 hours
4. Assign data collectors to teams
5. Discuss purpose of regular team meetings during data collection: to discuss successes, problems, and how to overcome data collection problems
6. General review and open questions
3 to 4 hours
1. Visit predetermined retail pharmaceutical outlets and collect a complete set of data using DAS-2E, DUS-1 (prices), DUS-4 2 to 3 hours
4
2. Debrief on retail pharmaceutical outlet practice visits: critique performance and troubleshoot problems
3. Discuss revision of forms if any are necessary as a result of the practice visits
4. Role-play in small groups: check reliability (quality) of data collector knowledge, skills, and abilities for filling in the data collection forms
1 to 2 hours

Chapter 4. Training for Data Collection
55
Day Training Activities Time
5. Review supervisory role with all team managers. They should— • Observe data collectors periodically • Ensure completeness of data collection forms before leaving the facility • Know how to fill out shaded areas of data collection forms and establish
standardized coding for identifying individual data collectors, patient records, encounters, etc.
• Know how to select an alternate health center when one becomes inaccessible to data collectors
• Clean up data forms before data entry
1 to 2 hours
One option for a three-member team’s division of data collection responsibilities in a health facility is shown in Figure 2 (see Chapter 2). One person is team manager. He or she preselects patients with uncomplicated malaria or presenting with symptoms thereof (or in the case of intermittent preventive treatment, pregnant women) and reviews the forms for completeness. Another data collector observes the consultation of the preselected patients, and the third conducts the exit interview with the same patients. The team manager can collect the availability data and interview the clinic staff on standard treatments while the two other surveyors collect simulated purchase data at the retail pharmaceutical outlet. It is a good idea to carry out the simulated purchases as soon as the team arrives in a particular area, before their presence becomes known. It may be useful to have nurses or clinical staff collect the information from the review of medical records, while pharmacists and pharmacy technicians may be better at collecting stock information. The coordinators may find it advantageous to increase the size of the team and use data collectors in pairs (except for review of medical records) to improve the reliability of the results. In this case, a team of five persons will be required. Data Collection Teams After the first day of training, the relative strengths and weaknesses of the data collectors should become apparent and they may be divided into teams for practice sessions. These groups will be retained for the actual data collection. The preselected team managers are assigned to each team. In addition to the team manager, each team will have three or four data collectors. The decision to have data collection teams of three or four people should depend on the country-specific situation and should be determined by the study coordinator. Having an even number is useful because it is often helpful to have the data collectors go out in pairs to collect the data. To both minimize risks and increase productivity, a useful strategy would be to pair health care providers (doctors or nurses) with other workers who have experience in pharmaceutical management systems and storage facilities (pharmacists and pharmaceutical technicians). This strategy would create a team that has practical experience with product names as well as with both stock and clinical record-keeping.

Pharmaceutical Management for Malaria Manual
56
Training Techniques To assist in the training process, following are a few general points about training. Help Data Collectors Use the Forms Correctly The data collector may need only a small bit of information to use a particular form correctly. However, if the data collector is not familiar with certain terms or items on the forms, clarify them. There is a good chance that if one data collector is not familiar with the terms or items, others are having the same problem. Check the Data Collector’s Understanding A data collector may not understand a procedure and may need individualized help. The data collector may be inexperienced, tired, or less educated than the other data collectors. Be patient, and—
• Show the data collector where to find the material in the PMM Data Collector’s Guide. Explain that all the necessary information can be found in the Guide. Ask him or her to read the appropriate part again.
• Ask the data collector why he or she is having a problem. Listen carefully. Help the data
collector think through the problem and propose his or her own solutions. • Encourage the data collector to ask specific questions about how to perform a particular
data collection technique.
• Data collectors should be encouraged to read the Data Collector’s Guide during the training period.
Give Feedback The data collectors will be involved in active learning throughout the workshop. Give them feedback as they review the forms and practice the different data collection techniques. Always give constructive feedback. The feedback should occur while or after the participant does the activity, such as completing a question-and-answer exercise, using a checklist, or acting in a role play. It should include showing the participant how to do the activity correctly and giving the participant practice doing the activity himself or herself. Summary of Data Collection Forms Table 11 describes the data collection forms and at which levels they should be used in the data collection exercise.

Chapter 4. Training for Data Collection
57
Table 11. Summary of Data Collection Forms
Name of Form Description Central Medical Store and Regional Medical Stores DAS-2D Inventory Data Form DAS-3 Stock-Out Data Form DAS-4 International Price Comparison Form (optional for the Regional Stores) MOH health facilities DAS-2A–D Inventory Data Form DAS-3 Stock-Out Data Form DAS-4 International Price Comparison Form (optional) DUS-1 Medical Records and Facility Review Form DUS-2 Observation of Health Worker Data Form DUS-3 Exit Poll Interview Form Private hospitals and clinics DAS-2A–D Inventory Data Form DAS-3 Stock-Out Data Form DUS-1 Medical Records and Facility Review Form DUS-2 Observation of Health Worker Data Form DUS-3 Exit Poll Interview Form Retail pharmaceutical outlets DAS-2E Inventory Data Form: Private Pharmacy/Retail Pharmaceutical Outlet DUS-1 Medical Records and Facility Review Form DUS-4 Simulated Purchase Form Following are brief “how to” instructions for data collectors. Review these instructions with the data collectors. The simulation and/or role-play exercises can be used to test how well data collectors perform different data collection techniques. Direct Observation (DUS-2) To collect data using the direct observation technique—
1. Review the DUS-2: Observation of Health Worker Data Form before the consultation begins.
2. Ask the health worker whom you will observe to explain to the patient and caregiver that
you are in the examination room to conduct a health care survey. 3. Fill in the information at the top of the form to identify the facility, patient, and data
collector.

Pharmaceutical Management for Malaria Manual
58
4. Once the consultation begins, do not speak, because it might interfere with the patient-provider relationship.
5. The form includes a place to fill in the start time and the end time for the consultation.
Fill in these sections.
6. Record the health problem that is the patient’s reason for coming to the health center.
7. During the consultation, indicate which questions the health worker asked the patient or caregiver.
8. During the consultation, record the information about all medicines prescribed by the health
worker.
9. Record the diagnosis made by the health worker.
10. Record the total amount of time required for the consultation.
11. Do not leave any blank spaces or unanswered questions on the forms. If the health worker did not ask the question or provide the information to the patient or caregiver, enter “not asked” in the space provided.
12. Record any problems encountered.
13. Give the completed data forms to the team manager for quality checking before leaving
the facility for each data collection method and record any refusals or problems.
Exit Poll Interview (DUS-3) To collect data using the interview technique—
1. Review the DUS-3: Exit Poll Interview Form before the interview begins. 2. Wait for the patient/caregiver to leave the health center.
3. It is preferred to interview those patients who were participants in the health care study.
4. Explain that the interview is for a health care survey.
5. Fill in the information at the top of the form indicating the facility, patient, and data
collector.
6. Ask the patient/caregiver what health problem was the chief complaint or reason for the consultation.
Chapter 4. Training for Data Collection
59
7. Ask the patient/caregiver, “What medicines were prescribed during the consultation and how are you going to take/give the medicines to your patient/child?”
8. Record each medicine mentioned by the patient/caregiver and how they will be taken
by/given to the patient.
9. For each medicine mentioned, ask if the caregiver already received the medicine from the health center or pharmacy and record the answer on the form.
10. Do not leave any spaces blank or questions unanswered on the forms. If the caregiver
does not know some of the information, enter “not known” in the space provided.
11. Record any problems encountered.
12. Give the completed data forms to the team manager for quality checking before leaving the facility for each data collection method and record any refusals or problems.
Record Review (DAS-2, DAS-3, DAS-4, DUS-1) To collect data using the record review technique—
1. Review the forms DAS-2, DAS-3, DAS-4, and DUS-1 before starting data collection.
2. Based on sample size and time frame of the study, select the MOH records to be studied.
3. Record the facility, data collector, and record system information at the top of the forms.
4. For each antimalarial medicine on the list, record all requested information.
5. On form DUS-1, fill in each medicine and the requested prescribing information on the form as ordered in the patient record.
6. Do not leave any spaces blank. If the information is not documented in the records you are reviewing, ask the health care provider or head of the health center for clarification. If it is still not available for use in the study, enter “not available.”
7. Record any problems encountered.
8. Give the completed data forms to the team manager for quality checking before leaving the facility for each data collection method and record any refusals or problems.
Steps for Leading a Simulation or Role Play Several of the data collection techniques will require data collectors to observe and interview health care workers and patients or caregivers. Some data collectors will also be required to pose as patients or caregivers to conduct the simulated purchases. Role-play can be a useful training
Pharmaceutical Management for Malaria Manual
60
tool to help data collectors become familiar with such data collection situations. To conduct the simulation or role-play—
1. Introduce the activity and state its purpose. Give data collectors as much instruction and background information as necessary. Tell them to refer to their Data Collector’s Guide. If necessary, demonstrate how to perform the activity.
2. Assign individual roles and responsibilities. Hand out any necessary supplies or props. 3. Give data collectors enough time to prepare. You can estimate the time if you have
practiced the activity yourself prior to the training workshop. Remind data collectors to work together to develop simulations and role-plays.
4. Arrange the room so that the presenting group is separated from the others. Make sure
everyone is able to see the simulation or role-play. 5. After groups are prepared, introduce the simulation or role-play.
• In a simulation, describe the order in which the groups will present their work. • In a role-play, introduce the players and their parts. Remind those data collectors
involved in a role-play to speak loudly so everyone can hear. 6. Begin the activity. Ask the groups to present the simulation or role-play. 7. Instruct data collectors observing the activity and take notes during the activity for later
discussion. Interrupt only if participants are not able to complete the activity. 8. When the activity is finished, thank the group. Ask participants to comment on aspects of
the activity that were successful. Then ask about and discuss those parts of the activity that could be improved. Be supportive.
9. Lead a discussion among the data collectors. Conclude the activity by asking data
collectors what they have learned. Simulated Purchase in Retail Pharmaceutical Outlets (DUS-4)
To collect data using the simulated purchase technique—
1. Review form DUS-4 before beginning data collection. 2. Review the scenario for uncomplicated malaria located in the Data Collector’s Guide
before beginning data collection.
3. Based on the sampling plan established for the study, go to the retail pharmaceutical outlet.

Chapter 4. Training for Data Collection
61
4. Make sure you have enough money to purchase any medicines recommended by the
medicine seller.
5. Enter the pharmaceutical outlet as would any normal client.
6. Describe the condition of your patient to the medicine seller and ask for recommendations.
7. Purchase any medicines or supplies recommended by the medicine seller.
8. Immediately upon leaving the pharamaceutical outlet, record the questions asked and
recommendations made by the medicine seller on form DUS-4 as appropriate.
9. For each medicine recommended, record the medicine’s name and how the seller recommended giving the medicine to the patient, for example, dosage, frequency, duration, and special considerations.
10. Answer all questions on the forms and do not leave any spaces blank about how to give a
medicine. If the medicine seller did not give that information, check the box marked “no information given.”
11. Record any problems encountered.
12. Give the completed data forms to the team manager for quality checking before leaving
the location for each data collection method and record any refusals or problems. It is very important to train the data collectors through role playing, and to verify that they understand what to do by observing their performance in two or three encounters in retail pharmaceutical outlets. This observation can be set up with the help of a sympathetic store owner whose store could be used as a training site. Data Collection in Health Facilities: Practice Session Half a day may be dedicated to practicing data collection in a local facility. Data collectors should be split up into small groups and assigned the task of completing some of the forms. Afterward, they should be required to debrief the other data collectors on the experience. Once back in the training venue, the groups should present their “findings” with respect to ease of finding the required data, data entry, time required to complete the task, and other observations. After all groups have completed this presentation, groups should exchange their completed data collection forms. Groups will review the forms and critique them for completeness, legibility, and other relevant observations. This information is for the purposes of training only and should not be used as part of the results.

Pharmaceutical Management for Malaria Manual
62
Testing Reliability of Data Collected on Observation Checklists Even though you may have confidence in the ability of the data collectors who have been selected to participate in a study, accurately recording the data collected can be a major problem. For example, when recording data on an observation checklist, the data collectors may check off what they think they see and hear, instead of what is actually taking place or being said. For that reason, initial training should include checking for intra- and inter-reliability of data collectors. The challenge of training data collectors is twofold—
• To ensure that one data collector consistently checks the same thing every time he or she observes the same thing (intra-reliability)
• To ensure that different data collectors consistently check the same answer every time
they observe the same thing (inter-reliability) The goal of reliability checking is to obtain more than 90 percent intra- and inter-reliability in three consecutive role-plays before the data collectors start collecting data. Use the Reliability Check Form (Figure 3) to record results of role playing during data collector reliability checks. Instructions for using the Reliability Check Form—
1. On the copies of form DUS-2 that will be used for training, number the individual items observed.
2. Write the numbers of all the observation questions in the far left column of the form,
which is labeled Quest. No. 3. Place the code or name of each data collector in the columns immediately below Data
Collector Code or Name, one per column.
4. Record the number of the role-play (each time the role-play is repeated, use another number) in the space at the bottom of the form after the words Number of the reliability check, since the role-play will be repeated three times.
5. Have the data collectors observe a role-play while filling out the Observation of Health
Worker Data Form (DUS-2). A team manager observes the same role-play and fills out a DUS-2 form that will serve as reference or standard for comparing the data collector’s answers.
6. Collect all forms.
7. Write the team manager’s answer to each question in the column labeled Man. Ans. The
team manager should be experienced in observation of health workers.
8. For each question, write each data collector’s answer to the question in the column under his or her code or number.

Chapter 4. Training for Data Collection
63
Calculate the inter-reliability of data collectors as follows— For each question, count how many data collectors gave the same answer as the team manager (the referee), and count the total number of collectors. Calculate the inter-reliability (Q%) for each question using the following formula— Q% = Number of Data Collectors with the Same Answer as the Referee × 100 Total Number of Data Collectors Place the result for each question in the column labeled Q%. A question with less than 90 percent reliability should be reviewed with the group for clarity of the instructions. It may be necessary to adapt the question. This procedure should be repeated until all questions get an acceptable percentage (usually >90%). Calculate the intra-reliability of data collectors as follows— For each data collector, count the number of questions that the data collector answered in the same way as the team manager, and count the total number of questions on the form. Calculate the intra-reliability (S%) for each question using the following formula— S% = Number of Questions That Data Collector Answered Same as Team Manager × 100 Total Number of Questions on the Form Place the result in the row labeled S%. This is the intra-reliability for each data collector. A data collector whose reliability S% is less than 90 percent should receive additional training before continuing. Calculate the average reliability for the group of data collectors as follows— Average % = Sum of All S% __ × 100 (reliability) Total Number of Data Collectors Place the average percentage in the space at the bottom of the form following the words Reliability (avg. % for the group). The role-plays should be repeated a total of three times, and each data collector should obtain more than 90 percent for three consecutive simulations before the trainer can assume that the observation form is well understood. At the end of the training, a data collector who does not have a score of 90 percent either should not be used as a data collector or should be assigned to tasks that do not involve filling out checklists.

Pharmaceutical Management for Malaria Manual
64
Because reliability checking is practically the only measure for the quality of data obtained during the direct observation technique, it pays to spend a little more time during training to reach the necessary reliability level before going to the field for data collection. The same reliability exercise can be applied during training for other data collection techniques such as interviews and record reviews. In these cases, the inter- and intra-reliability of data collectors should be close to 100 percent for these techniques before data collectors are sent to the field.

Chapter 4. Training for Data Collection
65
Data Collector Code or Name Quest.
No. Man. Ans. Q%
S% Number of the reliability check: Reliability (avg. % for the group):
Figure 3. Reliability Check Form for Data Collector Training

Pharmaceutical Management for Malaria Manual
66

PHARMACEUTICAL MANAGEMENT FOR MALARIA MANUAL
CHAPTER 1:
INTRODUCTION
CHAPTER 6:
USING THE FINDINGS
CHAPTER 5: ANALYZING DATA AND PRESENTING
RESULTS
CHAPTER 3: COLLECTING THE
DATA
CHAPTER 2: PREPARING FOR THE
TWO-PART STUDY
CHAPTER 4: TRAINING FOR DATA
COLLECTION
Pharmaceutical Management for Malaria Manual
68

69
Chapter 5.
ANALYZING DATA AND PRESENTING RESULTS
Now that the data have been collected, the next steps are the analysis and the presentation of the results. Analyzing the data will help to identify strengths and weaknesses in the pharmaceutical management process and highlight areas that need specific action to improve management capabilities for malaria medicines. Analysis should proceed in a systematic fashion by (1) calculating the indicators and summarizing the information; (2) interpreting the results; (3) disseminating the findings; and (4) preparing a written report. Calculating the Indicators and Summarizing the Information When the data have been collected, the results for each specific indicator can be derived manually from the appropriate data collection instrument. Annex 2 of this manual provides specific instructions and examples on how to calculate each indicator. A computer database package using Microsoft Access accompanies this manual. Alternatively, the following computerized methods may be used for collating the survey results and deriving the indicators—
• Spreadsheet • Database • EPI Info

Pharmaceutical Management for Malaria Manual
70
The instructions and examples in Annex 2 provide the information needed to design the structure of the computerized tool chosen. Some thought should be given to how the data should be grouped or summarized. It is important to distill the large volume of data into a few key findings that capture the study results. Summarize the data by indicator, noting subgroupings that may be useful to the analysis, such as geographic region or type of health facility. When the data are summarized, they will be easier to review and interpret. Interpreting the Results At the end of the analysis and before implementing a particular intervention, it is important to spend time as a team to interpret the findings. No matter how well the assessment was designed and planned, the data obtained may not be totally reliable or repeatable, for any number of reasons (see below). Part of the job of the study team when analyzing data is to determine what biases, inaccuracies, or inconsistencies may exist, and what precautions are necessary in interpreting the results. Problems encountered while collecting the data should be recorded on the data collection forms in the space provided for this information. Researchers and study team members should all play an active role in examining data and considering what type of additional analyses may be appropriate. One strategy is to hold a synthesis meeting of everyone involved in the investigation after the analysis has been completed. If not everyone at the meeting is familiar with all aspects of the data collection, the first activity should be to present separate reports on each study. The reports should be brief and cover the specific study questions addressed, methods used, results, and conclusions. Written summaries of findings, along with tables and graphs, should be distributed. Through the analysis, specific pharmaceutical management problems will become more apparent, as will the group of prescribers or patients most likely to benefit most from an intervention. On the basis of this understanding of the problems to be addressed, the synthesis group should then direct its attention to designing an intervention. Tables 12 and 13 present the PMM indicators for the Drug Availability and Drug Use Studies, their interpretation, and the potential actions that can be taken as next steps. It is important to understand that none of the PMM indicators should be viewed in isolation or taken at face value. It is the complete set of indicators that helps give a meaningful picture of the pharmaceutical management situation. The results become even more indicative when they can be compared to a baseline over time (see Chapter 6, Using the Findings). Reliability of Data The underlying issue of reliability is whether the process of the study is consistent and reasonably stable over time and across data collectors. Data may not be reliable if different data collectors asking the same person the same question get different results. One cause of unreliable data is that the respondent does not clearly understand the question. A method of determining respondent difficulties in understanding the question is for the data

Chapter 5. Analyzing Data and Presenting Results
71
collector to note if she or he had to repeat the question more than twice, or if the respondent actually mentions that she or he did not understand the question. A way of minimizing unreliable data is to send data collectors out in pairs. Relevant Queries to Determine Reliability
• Are the research questions clear? • Is the researcher’s role and status at the site explicitly described? • Do findings show meaningful parallelism across data sources (informants, contexts,
time)? • Were data collected across the full range of appropriate settings, times, respondents, and
so on suggested by the research questions? • Do data collectors have comparable data collection protocols? • Were coding checks made and did they show adequate agreement? • Were quality checks (for bias, informant knowledgeability, etc.) made? • Do multiple observers’ accounts converge in instances, settings, or time when they might
be expected to? • Was any type of peer or colleague review in place? Triangulation and Verification The results obtained should be verified. Verification can be done through comparisons with other studies. In addition, random quality checks can be performed to verify the results. Each team leader can randomly check the numbers recorded on the forms by the data collectors before leaving facilities.
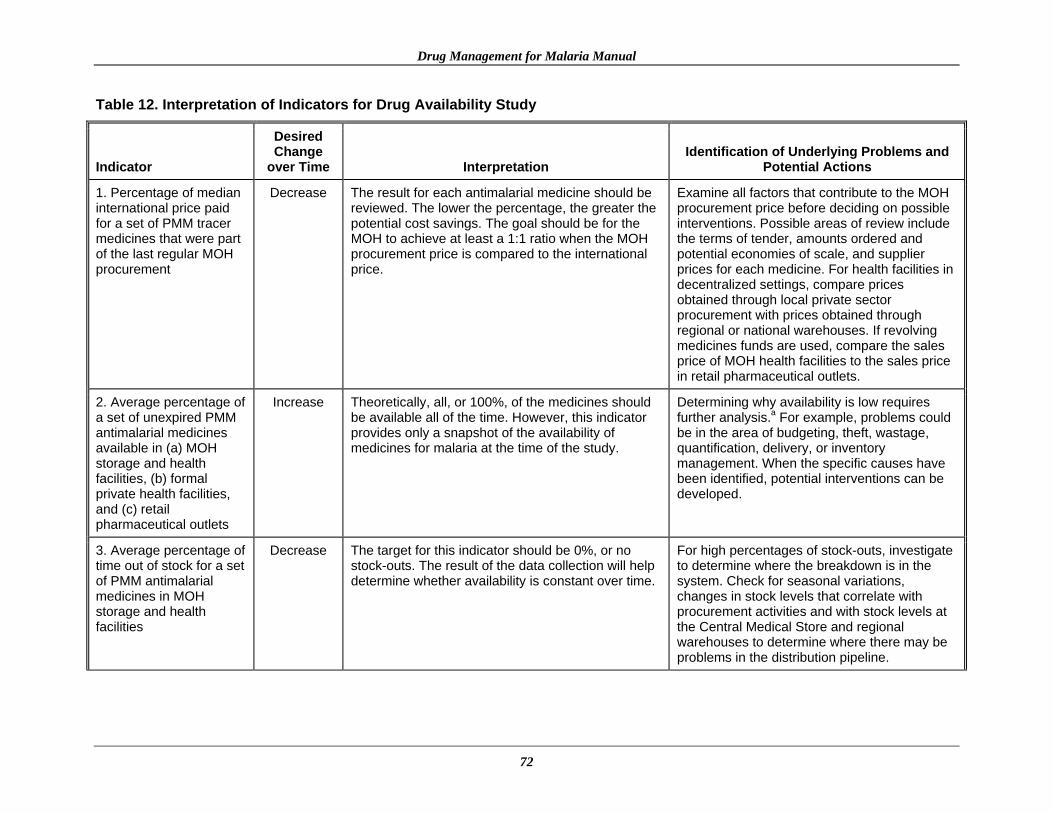
Drug Management for Malaria Manual
72
Table 12. Interpretation of Indicators for Drug Availability Study
Indicator
Desired Change
over Time Interpretation Identification of Underlying Problems and
Potential Actions
1. Percentage of median international price paid for a set of PMM tracer medicines that were part of the last regular MOH procurement
Decrease The result for each antimalarial medicine should be reviewed. The lower the percentage, the greater the potential cost savings. The goal should be for the MOH to achieve at least a 1:1 ratio when the MOH procurement price is compared to the international price.
Examine all factors that contribute to the MOH procurement price before deciding on possible interventions. Possible areas of review include the terms of tender, amounts ordered and potential economies of scale, and supplier prices for each medicine. For health facilities in decentralized settings, compare prices obtained through local private sector procurement with prices obtained through regional or national warehouses. If revolving medicines funds are used, compare the sales price of MOH health facilities to the sales price in retail pharmaceutical outlets.
2. Average percentage of a set of unexpired PMM antimalarial medicines available in (a) MOH storage and health facilities, (b) formal private health facilities, and (c) retail pharmaceutical outlets
Increase Theoretically, all, or 100%, of the medicines should be available all of the time. However, this indicator provides only a snapshot of the availability of medicines for malaria at the time of the study.
Determining why availability is low requires further analysis.a For example, problems could be in the area of budgeting, theft, wastage, quantification, delivery, or inventory management. When the specific causes have been identified, potential interventions can be developed.
3. Average percentage of time out of stock for a set of PMM antimalarial medicines in MOH storage and health facilities
Decrease The target for this indicator should be 0%, or no stock-outs. The result of the data collection will help determine whether availability is constant over time.
For high percentages of stock-outs, investigate to determine where the breakdown is in the system. Check for seasonal variations, changes in stock levels that correlate with procurement activities and with stock levels at the Central Medical Store and regional warehouses to determine where there may be problems in the distribution pipeline.
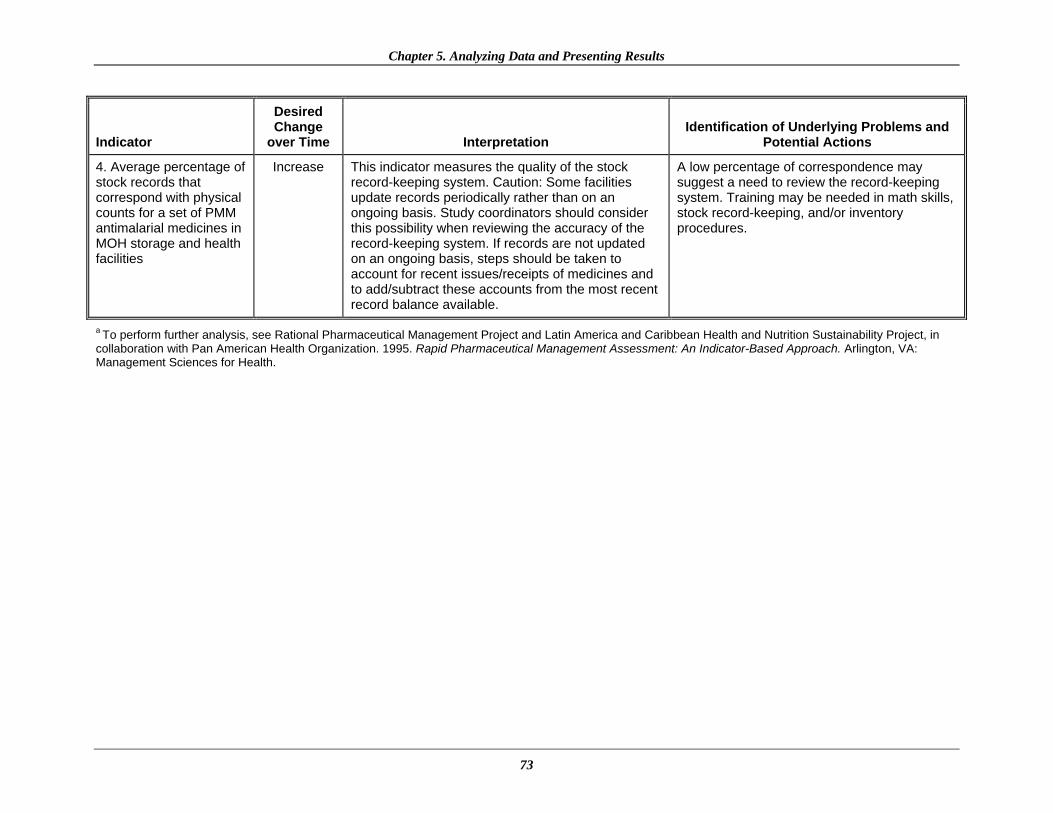
Chapter 5. Analyzing Data and Presenting Results
73
Indicator
Desired Change
over Time Interpretation Identification of Underlying Problems and
Potential Actions
4. Average percentage of stock records that correspond with physical counts for a set of PMM antimalarial medicines in MOH storage and health facilities
Increase This indicator measures the quality of the stock record-keeping system. Caution: Some facilities update records periodically rather than on an ongoing basis. Study coordinators should consider this possibility when reviewing the accuracy of the record-keeping system. If records are not updated on an ongoing basis, steps should be taken to account for recent issues/receipts of medicines and to add/subtract these accounts from the most recent record balance available.
A low percentage of correspondence may suggest a need to review the record-keeping system. Training may be needed in math skills, stock record-keeping, and/or inventory procedures.
a To perform further analysis, see Rational Pharmaceutical Management Project and Latin America and Caribbean Health and Nutrition Sustainability Project, in collaboration with Pan American Health Organization. 1995. Rapid Pharmaceutical Management Assessment: An Indicator-Based Approach. Arlington, VA: Management Sciences for Health.

Drug Management for Malaria Manual
74
Table 13. Interpretation of Indicators for Drug Use Study
Indicator
Desired Change
over Time Interpretation Identification of Underlying Problems and
Potential Actions
5. Percentage of MOH health facilities visited that had a copy of the official treatment guidelines for malaria
Increase Theoretically, all, or 100%, of facilities should have an official copy of treatment guidelines. Although the presence of guidelines does not mean that staff use them nor that rational prescribing is ensured, treatment guidelines do provide a reference source that supports more appropriate prescribing.
Identify resources to provide at least one copy of treatment guidelines per facility. Distribution of the guidelines should be accompanied by training in their use.
6. Percentage of encounters with patients diagnosed with uncomplicated malaria who are prescribed an antimalarial consistent with treatment guidelines
Increase This indicator measures adherence to malaria treatment guidelines. High percentages identify a positive behavior that should be reinforced or encouraged. Low percentages identify the need for improvement.
For low percentages, investigate to determine why the behavior exists and which factors contribute to it. Then design appropriate interventions to correct the behavior.
7. Percentage of encounters with patients diagnosed with uncomplicated malaria who are prescribed quantities of appropriate antimalarials sufficient to complete a full course of treatment
Increase This indicator measures adherence to malaria treatment guidelines. High percentages identify a positive behavior that should be reinforced or encouraged. Low percentages identify the need for improvement. Low percentages could indicate that the patient does not complete a course of treatment. This behavior could have potentially serious consequences for the patient as well as contributing to drug resistance.
For low percentages, investigate to determine why the behavior exists and which factors contribute to it. Then design appropriate interventions to correct the behavior.
8. Percentage of prescribed antimalarial medicines actually dispensed by public health facilities
Increase Theoretically, all, or 100%, of medicines prescribed should be dispensed. Low percentages identify problems of availability or poor dispensing practices.
Investigate to determine specific reasons why prescriptions presented for dispensing are not filled with the prescribed medicine. The most common reasons are that medicines are not affordable to the patient/caregiver and that medicines are not available.

Chapter 5. Analyzing Data and Presenting Results
75
Indicator
Desired Change
over Time Interpretation Identification of Underlying Problems and
Potential Actions
9. Average cost of medicines prescribed as a percentage of costs if STGs for treatment were followed
Decrease This indicator is used to quantify the financial burden of not complying with STGs to encourage provision of resources needed for interventions to improve medicine use.
For large differences, investigate to determine what the differences are and why they exist. After a specific problematic practice is identified, interventions can be designed to address the problem.
10. Percentage of patients/caregivers who could correctly describe how to take/give the prescribed antimalarial medicine
Increase This indicator, together with Indicator 11, can help pinpoint communication problems between the health worker and the patient/caregiver. A low percentage indicates that health workers are not providing enough information to patients/caregivers about medications, which could be a reason for nonadherence to treatment.
Identify the specific communication problems and investigate the usefulness of alternative communication strategies such as the use of local language, pictograms, demonstrations, and so on.
11. Percentage of health workers and retail pharmaceutical outlets that provided (some) information to patients/caregivers on how to give the recommended medicine(s)
Increase A low percentage indicates that health workers or medicine dispensers are not providing enough information to patients about medications, which can lead to nonadherence and treatment failure.
Investigate the problem to determine why practitioners are not following the guidelines. Malaria training may need to be reinforced to improve communication between the health worker and the patient/caregiver.
IPT Indicator
12. Percentage of encounters with pregnant women living in endemic areas who are prescribed an appropriate antimalarial for intermittent preventive treatment at antenatal clinics
Increase This indicator measures adherence to malaria treatment guidelines. High percentages identify a positive behavior that should be reinforced or encouraged. Low percentages identify the need for improvement.
For low percentages, investigate to determine why the behavior exists and which factors contribute to the behavior. Then design appropriate interventions to correct the behavior.

Drug Management for Malaria Manual
76
Indicator
Desired Change
over Time Interpretation Identification of Underlying Problems and
Potential Actions
Supplemental Indicators
13. Average percentage of individual variation for a set of indicator medicines in MOH storage and health facilities
Decrease This indicator measures the extent to which the stocks of a set of indicator medicines vary from the inventory in MOH storage and health facilities. It gives some information on the extent of the problem. High percentages indicate major problems and the need for improvement.
For high percentages, investigate the reason for the large variation and what factors contribute to the poor inventory system. Then design appropriate interventions to correct this problem.
14. Percentage of encounters where health workers asked one or more clinical questions to determine severity of malaria
Increase This indicator helps identify whether the health worker has tried to distinguish between uncomplicated and severe malaria. A low percentage indicates need for improvement.
For low percentages, investigate to determine why the behavior exists and which factors contribute to the behavior. Then design appropriate interventions to correct the behavior.
15. Percentage of health workers who told caregivers about any signs of progressive illness and recommended a referral visit to a doctor or clinic if the signs appear
Increase This indicator can help identify whether the health worker is providing enough information to the caregiver about what to do in case of treatment failure. A low percentage indicates that not enough information is being provided and a need for improvement.
For low percentages, investigate to determine why the behavior exists and which factors contribute to the behavior. Then design appropriate case management interventions to correct the behavior.
16. Percentage of health workers who prescribed an ineffective antimalarial (one that is no longer recommended)
Decrease This indicator can help identify whether health workers are still prescribing and providing an antimalarial that may no longer be effective (e.g., if the treatment guidelines have been changed). A high percentage means that many patients are receiving an incorrect and ineffective antimalarial and there is a need for improving the prescribing practices.
For high percentages, investigate to determine why this behavior exists and what factors contribute to this behavior. Prescribers may still be prescribing an ineffective antimalarial that is no longer recommended because they may not know that the recommendations have changed, or because they believe this old antimalarial is still effective. Then design appropriate interventions, including information, education, and training to correct this behavior.

Chapter 5. Analyzing Data and Presenting Results
77
Disseminating the Findings Dissemination Workshop for Stakeholders Until this point in the process, only the few people involved in the data collection process were aware of the study findings. Health facility managers, MOH representatives, and others now also need to be informed. To share the findings with this larger group, there should be a formal presentation or workshop that encourages in-depth discussions about the meaning of the results, specific pharmaceutical management concerns, and potential interventions. The participants of the workshop should be carefully chosen to include implementers and decision makers. Among those attending should be representatives from the malaria control program and the pharmaceutical division of the MOH. The workshop agenda should take into consideration both the intended audience and the specific results the audience should understand. When presenting the findings, give equal attention to both strengths and weaknesses. The goal of the presentation is to determine a course of action for building on the strengths and for increasing capabilities in the weaker pharmaceutical management areas. Presentations for Policy Makers When developing presentations for policy makers, it is advisable to present a very clear executive summary and, to the extent possible, key findings, recommendations, and projections of impact. Visual presentations of data in the form of tables, graphs, pie charts, and so forth work best, supported by the written report to explain details. Annex 3 includes a sample format for presenting the indicator data. The presentation should provide an overview of the goals and objectives of the pharmaceutical management study, the process undertaken, and the major indicators measured. This information will help people understand how the conclusions were reached. Emphasize how current pharmaceutical management practices affect the ability of the malaria program managers to achieve goals and to improve staff performance and the quality of services. The session can lead to increased support for improvement in prioritized areas, reinforcing the audience’s understanding of the need for and interest in improving pharmaceutical management for malaria. Preparing a Written Report A written report should be prepared to document the data collection experience and the findings. At a minimum, the report should include indicator tables; a list of the medicines most often prescribed, stating average proportions for each at each level of the health care system; observations made during data review; survey background; and the different methodologies used to collect the data. In general, the report should include the following sections—
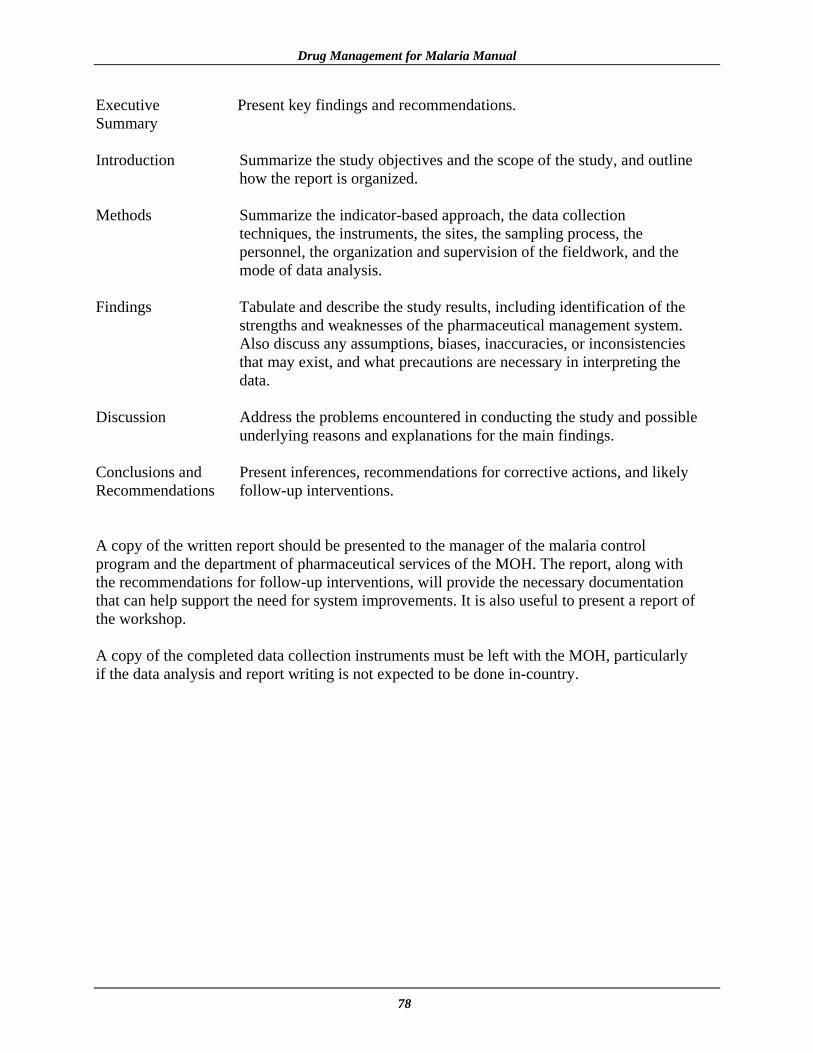
Drug Management for Malaria Manual
78
Executive Present key findings and recommendations. Summary Introduction Summarize the study objectives and the scope of the study, and outline
how the report is organized. Methods Summarize the indicator-based approach, the data collection
techniques, the instruments, the sites, the sampling process, the personnel, the organization and supervision of the fieldwork, and the mode of data analysis.
Findings Tabulate and describe the study results, including identification of the
strengths and weaknesses of the pharmaceutical management system. Also discuss any assumptions, biases, inaccuracies, or inconsistencies that may exist, and what precautions are necessary in interpreting the data.
Discussion Address the problems encountered in conducting the study and possible
underlying reasons and explanations for the main findings. Conclusions and Present inferences, recommendations for corrective actions, and likely Recommendations follow-up interventions. A copy of the written report should be presented to the manager of the malaria control program and the department of pharmaceutical services of the MOH. The report, along with the recommendations for follow-up interventions, will provide the necessary documentation that can help support the need for system improvements. It is also useful to present a report of the workshop. A copy of the completed data collection instruments must be left with the MOH, particularly if the data analysis and report writing is not expected to be done in-country.

PHARMACEUTICAL MANAGEMENT FOR MALARIA MANUAL
CHAPTER 1:
INTRODUCTION
CHAPTER 6:
USING THE FINDINGS
CHAPTER 5: ANALYZING DATA AND
PRESENTING RESULTS
CHAPTER 3:
TRAINING
CHAPTER 2: PREPARING FOR THE
TWO-PART STUDY
CHAPTER 4: COLLECTING THE
DATA
Pharmaceutical Management for Malaria Manual
80

81
Chapter 6.
USING THE FINDINGS Using the Findings to Develop Interventions Responding to the PMM indicator results and other assessment findings requires a strategic approach for selecting and implementing the most appropriate interventions to address malaria pharmaceutical management problems. The PMM indicators have been developed to measure key aspects of the pharmaceutical management system in both the public and private sectors, and they should be viewed as the first step of an investigation. Conducting the PMM studies should reveal specific problems that may be addressed and help identify and quantify the scale of the problems, but the studies may not provide enough information on the underlying causes and motivating factors that contribute to the problems. Therefore, each problem identified should be examined individually to ensure an in-depth understanding of the cause. Probing for a more in-depth understanding of a particular problem may require supplementing the findings with structured interviews, small focus groups, or other investigations. The information from the follow-up studies can be used to design interventions. Developing an intervention strategy involves the following seven major steps—
1. Identify the problem and recognize the need for action. 2. Identify underlying causes and motivating factors. 3. Develop and carry out additional studies, if needed, to explore the problem. 4. List possible interventions. 5. Assess resources available for action. 6. Choose a feasible intervention to test. 7. Monitor the impact of the intervention and restructure it if necessary.

Pharmaceutical Management for Malaria Manual
82
For example, some problems may result from the national or regional pharmaceutical management system and not be related specifically to malaria. This situation is especially likely in the availability portion of the assessment. In such cases, the data developed through the assessment will be significant in documenting the negative effects of such policies or procedures on the management of malaria. One intervention approach could possibly solve more than one problem, but in order to monitor for specific improvements it is important to have a clear perspective of what the intervention is intended to do, problem by problem. Following is a brief listing of some of the more common problems encountered in pharmaceutical management. Each problem statement is followed by a summary of key points that should be considered when developing an appropriate response. This list is not exhaustive and is only meant to be illustrative. Many problems may be unique to a specific country or region and thus require a unique solution. Selecting and implementing interventions requires time, teamwork, and commitment. The time spent in the planning and coordination phase will help ensure a successful outcome. Antimalarial Medicine Availability Procurement An effective procurement process ensures the availability of the right medicines in the right quantities, at reasonable prices, and at recognized standards of quality. Effective procurement is a collaborative process between the procurement office and technical and policy officials. Problem: Too many medicines are on the procurement list. Key Points: Virtually no health program can afford or needs to purchase all of the medicines on the market. A limited medicine list or formulary, defining which medicines for malaria will be purchased, is one of the most effective ways to control procurement costs. It simplifies other supply management activities and reduces inventory-holding costs as well. Possible Response: The first step is to order all medicines for malaria by generic name, and the second step is to avoid generic duplication by ordering only one brand or label of each generic product. Another option for reducing the procurement list is to limit the purchase of therapeutically similar products by restricting the Essential Medicines List or national formulary to one of these medicines and combining the estimated purchase volume into a single, much larger quantity of the drug selected to take advantage of economies of scale. The health system needs to be prepared to counter resistance from some doctors, who prefer a wide range of choices, and from pharmaceutical suppliers, whose products may be removed from the list. Resistance to change can often be overcome by documenting the cost savings possible (through the use of indicators) with the restricted procurement list and by pointing out the benefits of year-round access to the limited list rather than sporadic access to a larger list of medicines.

Chapter 6. Using the Findings
83
Problem: There is too much stock of some medicines and not enough of others. Key Points: Accurate estimates of pharmaceutical requirements are needed to avoid stock-outs of some medicines and overstocks of others. One way to quantify pharmaceutical needs is to start with accurate past consumption data from all units being supplied. Unfortunately, in many countries, consumption data are incomplete or do not reflect real need because the supply pipeline has never been full. In addition, this method is less reliable in areas of seasonal malaria transmission, which are prone to unpredictable outbreaks. Another method to estimate pharmaceutical requirements is to base the estimate on morbidity data (e.g., the frequency of illness). The morbidity method estimates the need for specific items based on the expected number of visits to a clinic, the incidence of common diseases, and standard treatment guidelines for the diseases considered. This method requires data on the service population, accurate data on clinic visits, and use of malaria STGs for the target conditions. It may be more appropriate in areas of low or seasonal transmission. The issue of multiple sources for medicines complicates the problem of stock management even more. For example, in many countries, some medicines are procured centrally by the MOH, others are donated by international organizations, and still others are procured from the regional or district level independent from the central MOH. Possible Response: Expert technical assistance in how to quantify pharmaceutical needs for malaria may be useful in the initial phases of the procurement program, with local officials participating to gain an understanding of the methodology. Also, arranging meetings with the major donor organizations to discuss donor coordination for pharmaceutical procurement can improve the management of pharmaceutical supply. Donors can be encouraged to contribute to the procurement pool rather than provide actual antimalarial medicines. Problem: Financing mechanisms cause problems with the procurement cycle. Key Points: Inventory management improves when medicines can be ordered when needed rather than at an arbitrary point in the government fiscal year. When suppliers know that orders will be placed promptly after tendering and that payment will be made upon delivery, prices will be much more competitive. Possible Response: Decoupling the pharmaceutical procurement cycle from the government budget cycle has substantial management advantages. Strategies such as decentralized financial management and revolving medicines funds are increasingly being employed to separate pharmaceutical procurement from the annual MOH budget cycle. This separation also usually requires some form of cost recovery, such as revolving medicines funds. Alternative systems for supplying medicines to the public health systems include the CMS system,27 autonomous supply agency system,28 direct delivery system,29 prime vendor system,30
27CMS is a conventional pharmaceutical supply system in which medicines are procured and distributed by a centralized government unit. 28This system is an alternative to the CMS and is managed by an autonomous pharmaceutical supply agency.

Pharmaceutical Management for Malaria Manual
84
and private pharmacy system.31 Whichever system is used, checks and balances must be put in place for all major procurements, and the procurement officer, health practitioners, and other user representatives should be involved. Inventory Management Problem: Stock records are poor. Key Points: Accurate and current stock records are essential to good inventory management. Stock records are a key source of information used to calculate needs. Thus, inaccurate records will produce inaccurate needs estimations (and problems with stock-outs, leakage, and expiry). Possible Response: Each inventory system should monitor performance with indicators and produce regular reports on inventory and order status, operating costs, and consumption patterns. Staff training may be necessary as part of the plan to improve inventory management, such as the WHO/BASICS (Basic Support for Institutionalizing Child Survival [Program]) Drug Supply Management Training Workshop for First-Level Facilities or the International Dispensary Association/Management Sciences for Health (MSH) Managing Drug Supply for Primary Health Care course for middle- to higher-level facilities. Problem: Inadequate quantities of medicines are in storage. Key Points: The primary reason for holding stock in a pharmaceutical supply system is to ensure availability of essential items at all times. Possible Response: The selection of malaria items to stock should be based on their value to the treatment of the disease and on the regularity and volume of consumption. VEN (vital, essential, nonessential) and ABC32 analyses are useful tools for defining which malaria products on the essential medicines or formulary list must be held in stock. Most of the medicines for malaria should be promoted as vital (V) and, therefore, should always be available. Whichever formulas are used, it is necessary to adjust purchase quantities to take into account factors such as seasonal demand, disease patterns, expected changes in utilization or prices, currency fluctuations, and availability of storage space. One possible source for information on how to use ABC and VEN analysis is MSH’s book Managing Drug Supply: The Selection, Procurement, Distribution, and Use of Pharmaceuticals in Primary Health Care, 2nd edition (1997).
29In this decentralized, non-CMS system, medicines are delivered directly to districts and health facilities by suppliers following government procurement process. 30In this system, the government establishes a storage and distribution contract with a single company, the prime vendor, that is contracted to manage distribution to districts and health facilities. Suppliers deliver medicines and supplies directly to the prime vendor. 31In this system, medicines are provided by private pharmacies in or near government health facilities. 32 ABC is a method of ranking and analyzing pharmaceutical products to determine highest- and lowest-consumption products.
Chapter 6. Using the Findings
85
Distribution Problem: The pharmaceutical distribution system is unreliable. Key Points: Pharmaceutical distribution systems in some developing countries are constantly challenged by such problems as the lack of money for fuel, bad roads, poor communication, union strikes, and so on. A well-run distribution system should maintain a constant supply of medicines, keep medicines in good condition, minimize losses caused by spoilage and expiry of medicines, minimize shortage points of medicines, use available transport as effectively as possible, reduce theft and fraud, and provide information for forecasting medicine needs. Possible Response: A program of performance monitoring should ensure that the distribution system works as intended. Senior managers should regularly monitor the cost and performance of the distribution system as important indicators of the health system’s operations. In some countries, private or parastatal distribution companies can provide cost-effective alternatives for the storage and distribution of medicines, especially at the national and regional levels. Major alterations in the system should be introduced only after careful evaluation and planning, taking into account available human, financial, and material resources. Antimalarial Medicine Use Problem: Antimalarials are used inappropriately. Key Points: Effective case management means that antimalarials should be used appropriately by prescribers as well as patients or caregivers. Appropriate use means that the right medicine must be given/taken at the right time in the correct dosage for the correct duration of treatment. A number of factors constitute inappropriate use, including overuse of treatments that are no longer effective (e.g., chloroquine in chloroquine-resistant areas), as well as incorrect dosages and noncompletion of a full course of treatment. Possible Response: Training is the most common intervention implemented in response to inappropriate prescribing practices. Training can be conducted in many different ways with a broad range of objectives. In general, training interventions targeting health providers are most successful when the training—
• Is problem-oriented and focuses on a single health problem or practice at a time • Incorporates multiple training approaches (e.g., lectures, group problem-solving, role-
playing, opportunity to practice skills)
• Provides training at the work site
• Uses opinion leaders or district-level staff as trainers

Pharmaceutical Management for Malaria Manual
86
• Involves practical skills orientation
• Provides multiple sessions over time In addition, training interventions can be reinforced through the use of incentives and messages, and intensified through concurrent community and health worker education, supervision, and pharmaceutical supply management. For example, WHO recommends that the “messages should promote appropriate use of antimalarials through clear, concise, and culturally appropriate messages” sent through “existing channels of community communication ... such as religious organizations, NGOs, community leaders, and other social structures.”33 Before such interventions are identified, a more in-depth analysis of treatment-seeking for malaria and medicine use by households and providers must be conducted. Problem: Pharmaceutical treatment costs are high. Key Points: One of the basic tenets for promoting good pharmaceutical management practices for malaria is that the use of appropriate and continuously updated standardized treatment guidelines, if followed, will provide cost-effective, appropriate care that is likely to be cheaper and more effective than the cost of care if guidelines are not followed. The absolute cost of a new antimalarial medicine may be higher than that of an older, ineffective antimalarial; however, when the costs of treatment failure and return visits are taken into account, the new antimalarial becomes more cost-effective. Factors contributing to the high cost of pharmaceutical treatment include the unnecessary prescribing of multiple medicines, overprescribing of injections, and prescribing of brand-name products rather than generics. Also, because many consumers hold the belief that public health facilities have limited stocks of medicines, some consumers bypass the health facility and go directly to private sector medicine sellers for pharmaceutical treatment, choosing the likelihood of greater availability in spite of probable higher costs. Possible Response: As mentioned earlier, developing a limited medicine list or formulary is one of the most effective ways of controlling pharmaceutical costs. Promoting the use of generic medicines over brand-name products and monitoring prescribing practices for inappropriate use of antimalarials and instances of polypharmacy can also help gain control over pharmaceutical costs. Problem: Standard treatment guidelines are not followed. Key Points: Standard treatment guidelines help practitioners and prescribers make decisions about appropriate treatments for specific clinical conditions. STGs, together with an Essential Medicines List, are powerful tools to promote rational use of medicines. They can also assist
33 World Health Organization Regional Office for Africa, Division of Prevention and Control of Communicable Diseases Malaria Programme. December 1999. Framework for Developing, Implementing, and Updating Antimalarial Drug Policy in Africa. Malaria: Liaison Bulletin of the Malaria Programme WHO/AFRO 2:2.

Chapter 6. Using the Findings
87
in the standardization of prescribing patterns. The treatment guidelines should include only those medicines for malaria that are on the EML. This limitation will ensure that the supply system, based on the list of essential medicines, supports the treatment guidelines. A factor that must be taken into consideration is that rapid development of resistance to commonly used antimalarials often causes the STGs to be outdated and to recommend treatment that is no longer effective in the locality (e.g., chloroquine or SP). Possible Response: First, make sure that each facility has an official copy of the standard treatment guidelines and that they are updated and clinically appropriate. If not, the relevant group (e.g., Essential Medicines Program, Malaria Control Program) should be approached to consider updating these guidelines on the basis of the PMM findings and evidence of in vivo drug resistance. Group commitment to standards by the staff at a health facility or continuing involvement in peer monitoring may motivate and sustain change. Routine supervision and monitoring using indicators or simple protocols, as well as monthly audit and feedback of performance indicators, can be effective for improving specific practices. The reasons for clinically inappropriate use of medicines practices may be complex and multifactorial. In addition to outdated standard treatment guidelines, these reasons include perceived patient demand, cultural misconceptions about medicines, prescribers’ limited clinical experience, and the promotion practices of pharmaceutical company representatives. Such practices can also contribute to higher costs. Medicines use interventions should generally be targeted at improving a few specific aspects of medicines use. In addition, program managers should involve researchers in the design and implementation of national programs to strengthen and better evaluate the programs’ impacts on quality and use of medicines. Using the Findings to Monitor and Evaluate Programs After the PMM assessment has been completed and the data analyzed, the findings can represent a source of quantifiable baseline measures against which changes can be measured over time. Managers should always check to see whether the information from the assessment findings has been used and how it has been used. Having baseline measures is critical to facilitating the prioritization of interventions required by the relevant stakeholders and to monitoring progress and evaluating the impact of any intervention. Monitoring and Supervision It is important to monitor antimalarial medicine availability and use in evaluating the efficacy of a pharmaceutical management intervention. To determine whether adequate progress is being achieved, it is necessary to know what is expected. A well-designed monitoring and evaluation system can usually provide information on what happened or what did not happen when an intervention is implemented. The PMM can be used for three types of monitoring activities: progress monitoring, program monitoring, and performance monitoring.

Pharmaceutical Management for Malaria Manual
88
Progress monitoring is the periodic oversight of implementation, which seeks to establish the extent to which input deliveries, work schedules, and preparation of expected deliverables are being reached so that timely action can be taken to correct any deviation from plan. Program monitoring is the routine collection of data for a defined set of indicators and the observation of changes over time and across populations. The selection of indicators for monitoring is based on prior evidence that these indicators are sensitive and specific to program activities, assuming that effects observed are caused by these interventions. In general terms, monitoring includes the tracking of inputs, processes, outputs, and outcomes. Performance monitoring is the repeated measurement (baseline and follow-up) and comparison with expected results, which are formulated as performance targets and indicator benchmarks. The PMM indicators can also be used as a supervisory tool. In selecting indicators for monitoring, it is important to consider how the data will be collected. Data for some indicators may be routinely available from standard recording and reporting systems (such as percentage of PMM antimalarial medicines available), whereas data for other indicators may require a special survey (such as for the percentage of stock records that correspond with physical counts). Thus, the sources and the costs of collecting and processing these data must be carefully considered in selecting indicators to monitor. Monitoring and evaluation must be considered at the outset of the intervention so that procedures can be put in place to collect any additional information that may be needed. A few potential problems can develop when using indicators for monitoring. Such problems include failure to take action based on findings, overambitiousness (using too many indicators), failure to focus on key questions, selecting indicators that are too complex, lack of integration with work planning, failure to build on existing information, and lack of objectivity. Collecting data on a few specific indicators on a semiannual or annual basis should be a key management strategy to measure progress toward improvements in availability and use of malaria medicines. No monitoring system is complete without feedback. Giving feedback to individual units or staff members tells them how well the reporting has been done and how useful the information is. Feedback also demonstrates the value and importance of reports. As such, it represents one of the most powerful tools for motivating staff. Evaluation Evaluation is the observation of changes in selected indicators over time and across populations, plus a comprehensive assessment of program outcomes and impacts using qualitative and quantitative instruments. A program evaluation attempts to establish a causal relationship between effects and program interventions by describing what works and what does not work and why. It is an objective and systematic process for assessing the extent to which goals have been achieved, looking at relevance, effectiveness, efficiency, and impact of activities. Results are usually compared to baseline or midterm measurements. Evaluation is a learning and action-oriented management tool as well as an organizational process for improving both current activities and future planning, programming, and decision making.

Chapter 6. Using the Findings
89
After an intervention has been identified, performance targets should be established. A performance target is a desirable and, in principle, attainable standard of practice. The PMM indicators can be used to measure the extent to which the targets and objectives of an intervention are being attained. For example, the indicator may be the percentage of PMM antimalarial medicines in stock, and the performance target may be 80 percent availability at each level for this list of medicines. Locally appropriate performance targets should be set for each indicator. Evaluation measures the extent to which these targets have been reached. When choosing the most useful outcomes to measure, consider the following—
• Select outcomes that can be clearly and explicitly defined.
• Select outcomes that can be reliably measured by the indicator, preferably using routinely collected data.
• Prioritize monitoring to focus on a few important outcomes rather than measuring all
possible changes.
• Select the key behaviors targeted by the intervention and the most likely substitute behaviors.
• Measure more than one dimension of success, especially if some changes are
secondary—for example, changes in prescribing that follow changes in knowledge about resistance to specific antimalarial medicines.
• Decide how often to monitor and evaluate.
• Budget for human and financial resources needed for monitoring.
• Disseminate the results.
There are no universal targets of “acceptable” performance. Each country is unique, and setting performance targets will depend on many factors, such as the time frame of the intervention, the human and economic resources available, national policies, and the level of decentralization. Most important, however, is that targets should be established based on previously agreed-upon standards of performance and according to the local situation. By comparing indicator values among districts and among health facilities, it should be possible to measure the impact of an intervention over time and better identify areas of concern that warrant further action. Interventions should be evaluated by looking for both intended and unintended changes in specific outcomes, including cross-resistance with commonly used medicines. Monitoring with PMM alone will not detect these problems, so other methods of monitoring must be used in conjunction.

Pharmaceutical Management for Malaria Manual
90
Illustrative Indicator Targets Following is a list of suggested PMM indicators that can serve to monitor and evaluate performance, particularly at the health facility level. The performance target (included only for illustrative purposes) is noted in parentheses following the indicator. Availability Indicators 1. Percentage of median international price paid for a set of PMM antimalarial medicines that
was part of the last regular MOH procurement (110%) 2. Average percentage of a set of unexpired PMM antimalarial medicines available in (a)
MOH storage and health facilities, (b) formal private health facilities, and (c) retail pharmaceutical outlets (90%)
3. Average percentage of time out of stock for a set of PMM antimalarial medicines in MOH storage and health facilities (10%)
4. Average percentage of stock records that correspond with physical counts for a set of PMM antimalarial medicines in MOH storage and health facilities (90%)
Use Indicators 6. Percentage of encounters with patients diagnosed with uncomplicated malaria who are
prescribed an antimalarial consistent with treatment guidelines (90%) 7. Percentage of encounters with patients diagnosed with uncomplicated malaria who are
prescribed quantities of appropriate antimalarials sufficient to complete a full course of treatment (90%)
9. Average cost of medicines prescribed as a percentage of costs if STGs for treatment were
followed (±10%) 10. Percentage of patients/caregivers who could correctly describe how to take/give the
prescribed antimalarial medicine (90%) 12. Percentage of encounters with pregnant women living in endemic areas who are prescribed
an appropriate antimalarial for IPT at antenatal clinics (90%)
91
ANNEXES

Pharmaceutical Management for Malaria Manual
92

93
Annex 1. PMM FORMS DAS-1: Preparation Checklist for Data Collection
Item Collected ( )
1. List of data collection teams and the sites to be visited
2. Workplan and timetable for each data collection team
3. Samples of information source documents (clinic record or medical chart, stock cards, bin cards, etc.)
4. List of medical terms and symptoms used locally for diagnosing malaria
5. List of equivalent medicine names (brand and generic)
6. Contact information for data collectors, team managers, and study coordinators
7. Copies of letters of authorization or introduction
8. Set of data collection forms adequate for sites to be visited
9. Pens and other supplies
10. Per diem for local expenses (add enough to purchase medicines for simulated purchases)

Pharmaceutical Management for Malaria Manual
94
DAS-2A: Inventory Data Form: Dispensary [page 1 of 1] Facility code: Data collector code: Facility type: Location: Date: Existing inventory control systems: Computerized � Data collected from: Computerized � Manual ledger � Manual ledger � Stock record cards � Stock record cards � Tally sheets � Tally sheets � Other (specify) � Other (specify) �
Product Counting
Unit Record Count
Unposted Receipts
Unposted Issues
Adjusted Total
Physical Count
Expired Stock
Unexpired
Stock Available
Col. 1
Col. 2
Col. 3
Col. 4
Col. 5
Col. 6
Col. 7
Col. 8
Col. 9 1. Chloroquine phosphate 150 mg
tablet tablet 750 2000 140 2610 2350 0 Yes 2a. Chloroquine injection 40 mg/mL
30 mL vial* vial 346 0 0 346 338 15 Yes 2b. Chloroquine injection 40 mg/mL
5 mL vial* vial 0 0 0 0 0 0 Not
applicable 3. Chloroquine syrup 50 mg/5 mL 4. Sulfadoxine/pyrimethamine
(Fansidar) 500 mg/25 mg tablet
5. Amodiaquine 200 mg tablet 6. Quinine 300 mg tablet 7. Quinine 300 mg/mL injection 8. Artemether/lumefantrine 100 mg/
20 mg tablet
Row 1: Total number of products for which Col. 6 equals Col. 7: Row 2: % of records corresponding with physical counts: (number in Row 1 × 100) / total number of products stocked in Col. 1: Row 3: % of antimalarial medicines available:
*2a and 2b are counted as a single item.
DAS-2A: Use with Indicators 2 and 4 (and Supplemental Indicator 13). Data collectors should not fill in the shaded rows or columns.

Annex 1. PMM Forms
95
DAS-2B: Inventory Data Form: Health Center [page 1 of 1] Facility code: Data collector code: Facility type: Location: Date: Existing inventory control systems: Computerized � Data collected from: Computerized � Manual ledger � Manual ledger � Stock record cards � Stock record cards � Tally sheets � Tally sheets � Other (specify) � Other (specify) �
Product Counting
Unit Record Count
Unposted Receipts
Unposted Issues
Adjusted Total
Physical Count
Expired Stock
Unexpired Stock
Available Col. 1
Col. 2
Col. 3
Col. 4
Col. 5
Col. 6
Col. 7
Col. 8
Col. 9
1. Chloroquine phosphate 150 mg tablet tablet 750 2000 140 2610 2350 0 Yes 2a. Chloroquine injection 40 mg/mL 30 mL
vial* vial 0 0 0 0 0 0 Not Applicable
2b. Chloroquine injection 40 mg/mL 5 mL vial* vial 23 0 0 23 18 18 No 3. Chloroquine syrup 50 mg/5 mL 4. Sulfadoxine/pyrimethamine (Fansidar) 500 mg/25 mg
5. Amodiaquine 200 mg tablet 6. Quinine 300 mg tablet 7. Quinine 300 mg/mL injection 8. Artemether/lumefantrine 100 mg/20 mg
tablet
Row 1: Total number of products for which Col. 6 equals Col. 7: Row 2: % of records corresponding with physical counts: (number in Row 1 × 100) / total number of products stocked in Col. 1: Row 3: % of antimalarial medicines available: * 2a and 2b are counted as a single item.
Note: ALL blanks should be filled in on this data form. Enter N/Av if data for a particular item are not available from the records or from the health care workers. Also define how “not applicable” should be abbreviated to avoid confusion on every form. DAS-2B: Use with Indicators 2 and 4 (and Supplemental Indicator 13). Data collectors should not fill in the shaded rows or columns.

Pharmaceutical Management for Malaria Manual
96
DAS-2C: Inventory Data Form: District Hospital [page 1 of 1] Facility code: Data collector code: Facility type: Location: Date: Existing inventory control systems: Computerized � Data collected from: Computerized � Manual ledger � Manual ledger � Stock record cards � Stock record cards � Tally sheets � Tally sheets � Other (specify) � Other (specify) �
Product Counting
Unit Record Count
Unposted Receipts
Unposted Issues
Adjusted Total
Physical Count
Expired Stock
Unexpired Stock
Available Col. 1
Col. 2
Col. 3
Col. 4
Col. 5
Col. 6
Col. 7
Col. 8
Col. 9
1. Chloroquine phosphate 150 mg tablet
tablet
750
2000
140
2610
2350
0
Yes 2a. Chloroquine injection 40 mg/mL
30 mL vial*
2b. Chloroquine injection 40 mg/mL 5 mL vial*
3. Chloroquine syrup 50 mg/5 mL
4. Sulfadoxine/pyrimethamine (Fansidar) 500 mg/25 mg
5. Amodiaquine 200 mg tablet
6. Quinine 300 mg tablet
7. Quinine 300 mg/mL injection
8. Artemether/lumefantrine 100 mg/20 mg tablet
Row 1: Total number of products for which Col. 6 equals Col. 7: Row 2: % of records corresponding with physical counts: (number in Row 1 × 100) / total number of products stocked in Col. 1:
Row 3: % of antimalarial medicines available:
* 2a and 2b are counted as a single item. Note: ALL blanks should be filled in on this data form. Enter N/Av if data for a particular item are not available from the records or from the health care workers.
DAS-2C: Use with Indicators 2 and 4 (and Supplemental Indicator 13). Data collectors should not fill in the shaded rows or columns.

Annex 1. PMM Forms
97
DAS-2D: Inventory Data Form: Regional Hospital/Central and Regional Medical Stores [page 1 of 1] Facility code: Data collector code: Facility type: Location: Date: Existing inventory control systems: Computerized � Data collected from: Computerized � Manual ledger � Manual ledger � Stock record cards � Stock record cards � Tally sheets � Tally sheets � Other (specify) � Other (specify) �
Product Counting
Unit Record Count
Unposted Receipts
Unposted Issues
Adjusted Total
Physical Count
Expired Stock
Unexpired
Stock Available
Col. 1
Col. 2
Col. 3
Col. 4
Col. 5
Col. 6
Col. 7
Col. 8
Col. 9 1. Chloroquine phosphate 150 mg tablet tablet 750 2000 140 2610 2350 0 Yes
2a. Chloroquine injection 40 mg/mL 30 mL vial*
2b. Chloroquine injection 40 mg/mL 5 mL vial*
3. Chloroquine syrup 50 mg/5 mL 4. Sulfadoxine/pyrimethamine (Fansidar)
500 mg/25 mg
5. Amodiaquine 200 mg tablet
6. Quinine 300 mg tablet
7. Quinine 300 mg/mL injection
8. Artemether/lumefantrine 100 mg/20 mg tablet
Row 1: Total number of products where Col. 6 equals Col. 7:
Row 2: % of records corresponding with physical counts: (number in Row 1 × 100) / total number of products stocked in Col. 1:
Row 3: % of antimalarial medicines available:
* 2(a) and 2(b) are counted as a single item. Note: ALL blanks should be filled in on this data form. Enter NAv if data for a particular item are not available from the records or from the health care workers.)
DAS-2D: Use with Indicators 2 and 4 (and Supplemental Indicator 13). Data collectors should not fill in the shaded rows or columns.
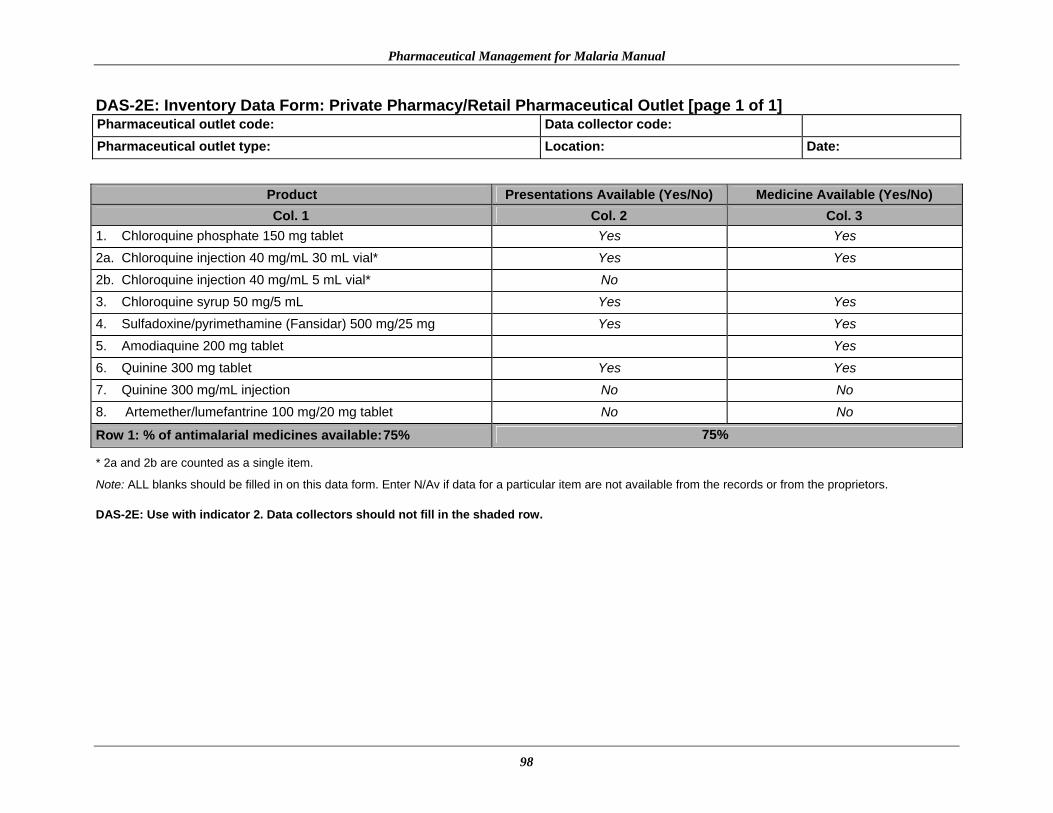
Pharmaceutical Management for Malaria Manual
98
DAS-2E: Inventory Data Form: Private Pharmacy/Retail Pharmaceutical Outlet [page 1 of 1] Pharmaceutical outlet code: Data collector code: Pharmaceutical outlet type: Location: Date:
Product Presentations Available (Yes/No) Medicine Available (Yes/No) Col. 1
Col. 2
Col. 3
1. Chloroquine phosphate 150 mg tablet Yes Yes 2a. Chloroquine injection 40 mg/mL 30 mL vial* Yes Yes 2b. Chloroquine injection 40 mg/mL 5 mL vial* No 3. Chloroquine syrup 50 mg/5 mL Yes Yes 4. Sulfadoxine/pyrimethamine (Fansidar) 500 mg/25 mg Yes Yes 5. Amodiaquine 200 mg tablet Yes 6. Quinine 300 mg tablet Yes Yes 7. Quinine 300 mg/mL injection No No 8. Artemether/lumefantrine 100 mg/20 mg tablet No No
Row 1: % of antimalarial medicines available: 75% 75%
* 2a and 2b are counted as a single item.
Note: ALL blanks should be filled in on this data form. Enter N/Av if data for a particular item are not available from the records or from the proprietors. DAS-2E: Use with indicator 2. Data collectors should not fill in the shaded row.

Annex 1. PMM Forms
99
DAS-3A: Stock-Out Data Form: Dispensary [page 1 of 1] Facility code: Data collector code: Facility type: Location: Date: Record type:
For each antimalarial, write the number of days out of stock for each month.
Oct Sep Aug Jul Jun May Apr Mar Feb Jan Dec Nov
Product 04 04 04 04 04 04 04 04 04 04 03 03
Total No. of Days Out of Stock
1. Chloroquine phosphate 150 mg tablet 0 0 1 0 0 5 0 3 2 0 0 0 11 2a. Chloroquine injection 40 mg/mL 30 mL vial* 2b. Chloroquine injection 40 mg/mL 5 mL vial* 3. Chloroquine syrup 50 mg/5 mL 4. Sulfadoxine/pyrimethamine (Fansidar)
500 mg/25 mg
5. Amodiaquine 200 mg tablet 6. Quinine 300 mg tablet 7. Quinine 300 mg/mL injection 8. Artemether/lumefantrine 100 mg / 20 mg tablet
Row 1: Add total number of days out of stock for all stocked medicines:
Row 2: Count total number of products stocked in Product column:
Row 3: Average % time out of stock = (number in Row 1 × 100) / (365 × number in Row 2):
* 2a and 2b are counted as a single item.
Note: ALL blanks should be filled in on this data form. Enter N/Av if data for a particular item are not available from the records or from the health care workers.
DAS-3A: Use with Indicator 3. Data collectors should not fill in the shaded rows, except for the years at the top of the table.

Pharmaceutical Management for Malaria Manual
100
DAS-3B. Stock-Out Data Form: Health Center [page 1 of 1] Facility code: Data collector code: Facility type: Location: Date: Record type:
For each product, write the number of days out of stock for each month.
Oct Sept Aug Jul Jun May Apr Mar Feb Jan Dec Nov
Product 04 04 04 04 04 04 04 04 04 04 03 03
Total No. of Days Out of Stock
1. Chloroquine phosphate 150 mg tablet 0 0 1 0 0 5 0 3 2 0 0 0 11 2a. Chloroquine injection 40 mg/mL 30 mL vial* 2b. Chloroquine injection 40 mg/mL 5 mL vial* 3. Chloroquine syrup 50 mg/5 mL 4. Sulfadoxine/pyrimethamine (Fansidar) 500
mg/25mg tablet
5. Amodiaquine 200 mg tablet 6. Quinine 300 mg tablet 7. Quinine 300 mg/mL injection 8. Artemether/lumefantrine 100 mg/20 mg
tablet
Row 1: Add total number of days out of stock for all stocked medicines:
Row 2: Count total number of products stocked under Product column:
Row 3: Average % time out of stock = (number in Row 1 × 100) / (365 × number in Row 2):
* 2a and 2b are counted as a single item. Note: ALL blanks should be filled in on this data form. Enter N/Av if data for a particular item are not available from the records or from the health care workers. DAS-3B: Use with Indicator 3. Data collectors should not fill out the shaded rows, except for the years at the top of the table.

Annex 1. PMM Forms
101
DAS-3C: Stock-Out Data Form: District Hospital [page 1 of 1] Facility code: Data collector code: Facility type: Location: Date: Record type:
For each product, write the number of days out of stock for each month.
Oct Sept Aug Jul Jun May Apr Mar Feb Jan Dec Nov
Product 04 04 04 04 04 04 04 04 04 04 03 03
Total No. of Days Out of Stock
1. Chloroquine phosphate 150 mg tablet 0 0 1 0 0 5 0 3 2 0 0 0 11
2a. Chloroquine injection 40 mg/mL 30 mL vial*
2b. Chloroquine injection 40 mg/mL 5 mL vial*
3. Chloroquine syrup 50 mg/5 mL 4. Sulfadoxine/pyrimethamine (Fansidar)
500 mg/25 mg tablet
5. Amodiaquine 200 mg tablet
6. Quinine 300 mg tablet
7. Quinine 300 mg/mL injection 8. Artemether/lumefantrine 100 mg/20 mg
tablet
Row 1: Add total number of days out of stock for all stocked medicines: Row 2: Count total number of products stocked in Product column: Row 3: Average % time out of stock = (number in Row 1 × 100) / (365 × number in Row 2):
* 2a and 2b are counted as a single item.
DAS-3C: Use with Indicator 3. Data collectors should not fill in the shaded rows, except for the years at the top of the table.

Pharmaceutical Management for Malaria Manual
102
DAS-3D: Stock-Out Data Form: Regional Hospital/Central and Regional Medical Stores [page 1 of 1] Facility code: Data collector code: Facility type: Location: Date: Record type:
For each product, write the number of days out of stock for each month.
Oct Sept Aug Jul Jun May Apr Mar Feb Jan Dec Nov
Product 04 04 04 04 04 04 04 04 04 04 03 03
Total No. of Days Out of Stock
1. Chloroquine phosphate 150 mg tablet 0 0 1 0 0 5 0 3 2 0 0 0 11
2a. Chloroquine injection 40 mg/mL 30 mL vial*
2b. Chloroquine injection 40 mg/mL 5 mL vial*
3. Chloroquine syrup 50 mg/5 mL 4. Sulfadoxine/pyrimethamine (Fansidar)
500 mg/25 mg tablet
5. Amodiaquine 200 mg tablet 6. Quinine 300 mg tablet 7. Quinine 300 mg/mL injection 8. Artemether/lumefantrine 100 mg/20 mg
tablet
Row 1: Sum total number of days out of stock for all stocked medicines: Row 2: Count total number of products stocked in Product column: Row 3: Average % time out of stock = (number in Row 1 × 100) / (365 × number in Row 2):
* 2a and 2b are counted as a single item. Note: ALL blanks should be filled in on this data form. Enter N/Av if data for a particular item are not available from the records or from the health care workers
DAS-3D: Use with Indicator 3. Data collectors should not fill out the shaded rows, except for the years at the top of the table.

Annex 1. PMM Forms
103
DAS-4: International Price Comparison Form [page 1 of 1]
Facility code: Data collector code: Facility type: Location: Date: Currency used: One U.S. dollar (USD) =
Product Date of Last Procurement
Other Names
(Brand or Generic)
Comparison Unit
Numberof Units per Pack
MOH Comparison Pack Price
MOH Comparison
Unit Price
Exchange Rate at Time of
Payment
MOH Comparison
Unit Price (USD)
International Unit Price (USD)
Col. 1 Col. 2 Col. 3 Col. 4 Col. 5 Col. 6 Col. 7 Col. 8 Col. 9 Col. 10 1. Chloroquine phosphate 150
mg tablet 6/04 Malara-
quin Tablet 1000 833 0.8330 600 0.0014 0.002
2a. Chloroquine injection 40 mg/mL 30 mL vial*
2b. Chloroquine injection 40 mg/mL 5 mL vial*
3. Chloroquine syrup 50 mg/ 5 mL
4. Sulfadoxine/pyrimethamine (Fansidar) 500 mg/25 mg tablet
5. Amodiaquine 200 mg tablet
6. Quinine 300 mg tablet
7. Quinine 300 mg/mL injection
8. Artemether/lumefantrine 100 mg/20 mg tablet
Note: Prices must be written to four decimal places because the units are very small. ALL blanks should be filled in on this data form. Enter N/Av if data for a particular item are not available from the records or from the health care workers.
DAS-4: Use with Indicator 1. Data collectors should not fill in the shaded columns.

Pharmaceutical Management for Malaria Manual
104
DUS-1: Medical Records and Facility Review Form: Uncomplicated Malaria [page 1 of 3]
Facility code: Data collector code: Facility type: Location: Date: Currency used: One U.S. dollar (USD) =
Does the facility have a copy of the national malaria treatment guidelines? Yes � No �
If yes, from what year? _____________
Data collected from: Medical records � Patient registry � Antenatal records � Health facility staff �
DUS-1: Use with Indicators 5, 6, 7, 8, 9, and 10.

Annex 1. PMM Forms
105
DUS-1A: Medical Records and Facility Review Form: Uncomplicated Malaria [page 2 of 3] Facility code: Data collector code:
Retail Outlets
Encounter Number
Age (Years)
Sex (M/F)
Pregnant (Yes/No) Date
Prescriber Type
Medicine Name,Strength, and Dosage Form
Quantity Prescribed
Quantity Dispensed
Number of Units
Retail Price
Full Course Prescribed
(Yes/No)
Full CourseDispensed (Yes/No)
Col. 1 Col. 2 Col. 3 Col. 4 Col. 5 Col. 6 Col. 7 Col. 8 Col. 9 Col. 10 Col. 11 Col. 12 Col. 13
1 24 F No 3/99 Clinical officer
Chloroquine 150 mg tabs 10 10 1 0.03 Yes Yes
DUS-1A: Use with Indicators 5, 6, 7, 8, 9, and 10. Data collectors should not fill in the shaded columns.

Pharmaceutical Management for Malaria Manual
106
DUS-1B: Medical Records and Facility Review Form: Pregnant Women (Antenatal) [page 3 of 3] Facility code: Data collector code:
Encounter Number
Age (Years)
Prescribed IPT (Yes/No) Date
Prescriber Type
Medicine Name,
Strength, and Dosage Form
Quantity Prescribed
Quantity Dispensed
Number of Units
Retail Price
Full Course Prescribed
(Yes/No)
Full Course Dispensed (Yes/No)
Col. 1 Col. 2 Col. 3 Col. 4 Col. 5 Col. 6 Col. 7 Col. 8 Col. 9 Col. 10 Col. 11 Col. 12
1 24 Yes 5/99 Nurse
Chloroquine 150 mg,
tabs 10 10 1 0.04 Yes Yes
DUS-1B: Use with Indicators 5, 6, 7, 8, 9, and 10. Data collectors should not fill in the shaded columns.

Annex 1. PMM Forms
107
DUS-2A: Observation of Health Worker Data Form [page 1 of 2]
Facility code: Data collector code: Facility type: Location: Date: Encounter number: Sex (M/F): Pregnant (Y/N): Age: Diagnosis:
Write down exactly any questions that the health worker asks the patient or caregiver about the illness or symptoms of illness.
Write down exactly what the health worker says about what to do if the illness does not get better.

Pharmaceutical Management for Malaria Manual
108
DUS-2B: Observation of Health Worker Data Form [page 2 of 2] For each medicine that the health worker/prescriber gives or prescribes, write down the following information:
Medicine Name, Strength, and Dosage
Form Dosage Quantity Frequency
Duration of Treatment
(Days) Administration
Full Course Prescribed (Yes, No,
N/Av)
Col. 1 Col. 2 Col. 3 Col. 4 Col. 5 Col. 6 Chloroquine 150 mg
tablet 4 tablets 1 time/day 2 with food Yes Chloroquine 150 mg
tablet 2 tablets 1 time/day 1 with food Yes
1. Did the health worker explain to the patient/caregiver how to take/give the medication?
YES � NO �
2. Was treatment consistent with STGs? YES � NO �
3. Did the health worker ask one or more clinical questions to determine the severity of malaria? (optional)
YES � NO �
4. Did the health worker tell the patient/caregiver about any signs of progressive illness and recommend a referral visit if the signs appear? (optional)
YES � NO �
5. Was the patient treated with an ineffective malarial? YES � NO �
DUS-2A–B: Use with Indicators 6, 7, and 12 (and supplemental Indicators 14, 15, and 16). Data collectors should not fill in the shaded rows or columns.

Annex 1. PMM Forms
109
DUS-3: Exit Poll Interview Form [page 1 of 1] Facility code: Data collector code: Facility type: Location: Date: Encounter number: Interview number: Age (years/months): Sex (M/F): Pregnant (Y/N): Ask the patient/caregiver: “What was the chief complaint or the reason for the consultation (i.e., the health problem)?” Ask the patient/caregiver: “What medicines were prescribed and how are you going to take them/give them to the patient?”
Name of Medicine
Dosage Quantity Frequency
Duration of Treatment
(Days) Administration
Did the Patient/Caregiver
Receive the Medicine?(Yes/No) Quantity Dispensed
Col. 1 Col. 2 Col. 3 Col. 4 Col. 5 Col. 6 Col. 7
Fansidar 3 tablets once 1 day with food yes 3 tablets
Row 1: Total number of medicines prescribed_____________
Row 2: Can patient/caregiver correctly describe how to take/give prescribed medication(s)? YES � NO �
Row 3: Total number of medicines dispensed______________
Row 4: Did the prescription cover a full course of treatment? YES � NO �
Row 5: Did the quantity dispensed cover a full course of treatment? YES � NO �
DUS-3: Use with Indicators 7, 8, 9, and 11. Data collectors should not fill in shaded areas.

Pharmaceutical Management for Malaria Manual
110
DUS-4: Simulated Purchase Data Form for Uncomplicated Malaria in Private Pharmacies [page 1 of 1]
Facility code: Data collector code: Location: Date: Currency used: One U.S. dollar (USD) =
For all medicines recommended for purchase by the medicine seller, write the following information.
Name, Strength, and Dosage Form
Dosage Quantity Frequency
Duration of Treatment (Days) Administration Price
Full Course Prescribed (Y/N/NAv)
Col. 1 Col. 2 Col. 3 Col. 4 Col. 5 Col. 6 Col. 7
Fansidar 2 tablets once 1 day with food 12 Yes
Row 1: Did the dispenser provide some information on how to take the medicines? YES � NO �
Row 2: Did the dispenser prescribe medicines in line with STGs? YES � NO �
Row 3: Total cost of prescribed treatment (Total of Column 6):
Row 4: STG cost:
Row 5: % of STG cost:
DUS-4: Use with Indicators 6, 7, 10, and 12. Data collectors should not fill in shaded areas.

111
Annex 2. PMM INDICATORS List of PMM Indicators Following is the list of 12 PMM indicators that will be used to assess the availability and use of antimalarial medicines for the treatment of malaria as well as 4 supplemental indicators. The list includes four drug availability indicators (plus one drug availability supplemental indicator), seven drug use indicators (plus one IPT indicator and three supplemental drug use and case management indicators). Drug Availability Study Indicators 1. Percentage of median international price paid for a set of PMM antimalarial medicines that
were part of the last regular MOH procurement 2. Average percentage of a set of unexpired PMM antimalarial medicines available in (a) MOH
storage and health facilities, (b) formal private health facilities, and (c) retail pharmaceutical outlets
3. Average percentage of time out of stock for a set of PMM antimalarial medicines in MOH
storage and health facilities 4. Average percentage of stock records that correspond with physical counts for a set of PMM
antimalarial medicines in MOH storage and health facilities Drug Use Study Indicators 5. Percentage of MOH health facilities visited that had a copy of the official treatment
guidelines for malaria 6. Percentage of encounters with patients diagnosed with uncomplicated malaria who are
prescribed an antimalarial consistent with treatment guidelines (public and private health facilities)
7. Percentage of encounters with patients diagnosed with uncomplicated malaria who are
prescribed quantities of appropriate antimalarials sufficient to complete a full course of treatment (public and private health facilities)
8. Percentage of prescribed antimalarial medicines actually dispensed by public health facilities 9. Average cost of medicines prescribed as a percentage of costs if standard treatment
guidelines for treatment were followed
Pharmaceutical Management for Malaria Manual
112
10. Percentage of patients/caregivers who could correctly describe how to take/give the prescribed antimalarial medicine
11. Percentage of health workers and retail pharmaceutical outlets that provided (some)
information to patients/caregivers on how to take/give the recommended medicine(s) Intermittent Preventive Treatment Indicator for Drug Use Study Use in areas where a policy for IPT with antimalarials for the prevention of malaria in pregnancy exists. 12. Percentage of encounters with pregnant women living in endemic areas who are prescribed
an appropriate antimalarial for IPT at antenatal clinics Supplemental Indicators Drug Availability 13. Average percentage of individual variation for a set of indicator medicines in MOH storage
and health facilities Drug Use and Case Management 14. Percentage of encounters where health workers asked one or more clinical questions to
determine severity of malaria 15. Percentage of health workers who told caregivers about any signs of progressive illness and
recommended a referral visit to a doctor or clinic if the signs appear 16. Percentage of health workers who prescribed an ineffective antimalarial (one that is no
longer recommended) Indicators Description Format This section presents detailed descriptions for each PMM indicator. Each description follows exactly the same format, which is summarized below. Indicator data can be collected at four different levels of the health care system. Each indicator in the descriptions that follow is coded according to the level at which it is measured, with the code appearing in parentheses after the indicator title. The health system level codes used are— Indicator Name: The name of the indicator, along with the different system levels that may
be examined.

Annex 2. PMM Indicators
113
C Central level: under direct supervision of the central government R Regional or district level: acts as the intermediary; provides supplies to the health facilities and not directly to patients F Health facility level: provides direct care to the patient population O Retail pharmaceutical outlet level: usually serves as the patient’s primary private sector source for medicines For example, C/R/F indicates that the indicator may be applied at the central, regional, and health facility levels.
Rationale: The reason that the indicator is important. Definition: The meaning of the indicator and the terms used to describe the indicator. Data Collection: The most likely sources of information are summarized in a table
indicating where the data are to be collected, whom to ask for assistance, and what documents and records to review.
Brief discussions of methods and issues related to data collection. Citations of the data collection forms to be used, if any.
Computation Computations, if any are needed, are accompanied by an example using & Example: illustrative data. Presentation: Brief example of how results may be presented. Notes: Suggestions for additional information or discussion required to put the
indicator in proper context or to provide more detail. Drug Availability Study Indicators An accurate and systematic assessment of the logistics supply system is a prerequisite for planning improvements to the malaria pharmaceutical supply system. The DAS indicators (1 through 4) focus on procurement and distribution of antimalarials. The most important methods for collecting information for this availability study are likely to be document review, key informant interviews, and physical inventory checks. Data collection sites will include MOH central offices, Central and Regional Medical Stores, and health facilities. The findings of the study will be useful to identify specific problems in the system, plan corrective interventions, monitor progress, and compare the performance of one system with another.

Pharmaceutical Management for Malaria Manual
114
1. Percentage of median international price paid for a set of PMM antimalarial medicines that were part of the last regular MOH procurement (C/R/F)
Rationale: This indicator helps determine the potential savings that the MOH could achieve
if procurement practices were improved and, in this way, supports changes in the pharmaceutical supply system.
Definition: Median international price is the median free on board (FOB)34 price from a set of
international suppliers, adjusted to reflect estimated CIF35 prices. One source of price information is the MSH International Drug Price Indicator Guide. The last regular procurement price refers to the CIF price paid during the last regular MOH procurement. If there was no procurement in the fiscal year being studied, use figures from the last regular procurement.
Data Collection:
Where to Go Whom to Ask What to Get
MOH Procurement Unit Officer in charge of pharmaceutical purchases
Central Medical Store Manager or Reception Officer
Regional government administration or Medical Store Manager
List of most recent prices paid for a set of PMM antimalarial medicines Tender documents, supplier invoices
Health facilities Pharmacist or Procurement Officer Supplier invoices
This indicator is based on the list, developed by study organizers, of PMM antimalarial medicines used to treat malaria (see Chapter 2). Information on CIF prices paid by the MOH for the antimalarial medicines should apply to the last regular procurement. Any more recent ad hoc or emergency procurements that may have taken place should be compared separately to international prices. The median international prices for the antimalarial medicines may be determined by reference to the international unit prices in the MSH International Drug Price Indicator Guide. Do not use the average cost listed in the Guide. Instead, use the median price for each antimalarial medicine.
The prices in the International Drug Price Indicator Guide are FOB and should be adjusted upward by 20 percent to reflect average shipping and insurance costs, that is, CIF. Specify the source of international prices and the year of both data sets. If all purchases are not made by one central agency, compile information
34FOB, which stands for free on board, is an International Commercial Term (INCOTERM) that indicates a price including transportation to a designated point of departure. 35CIF, which stands for cost, insurance, and freight, is another INCOTERM that includes the cost of the goods purchased plus the shipping and insurance costs of getting them to the designated port of entry of the destination country.
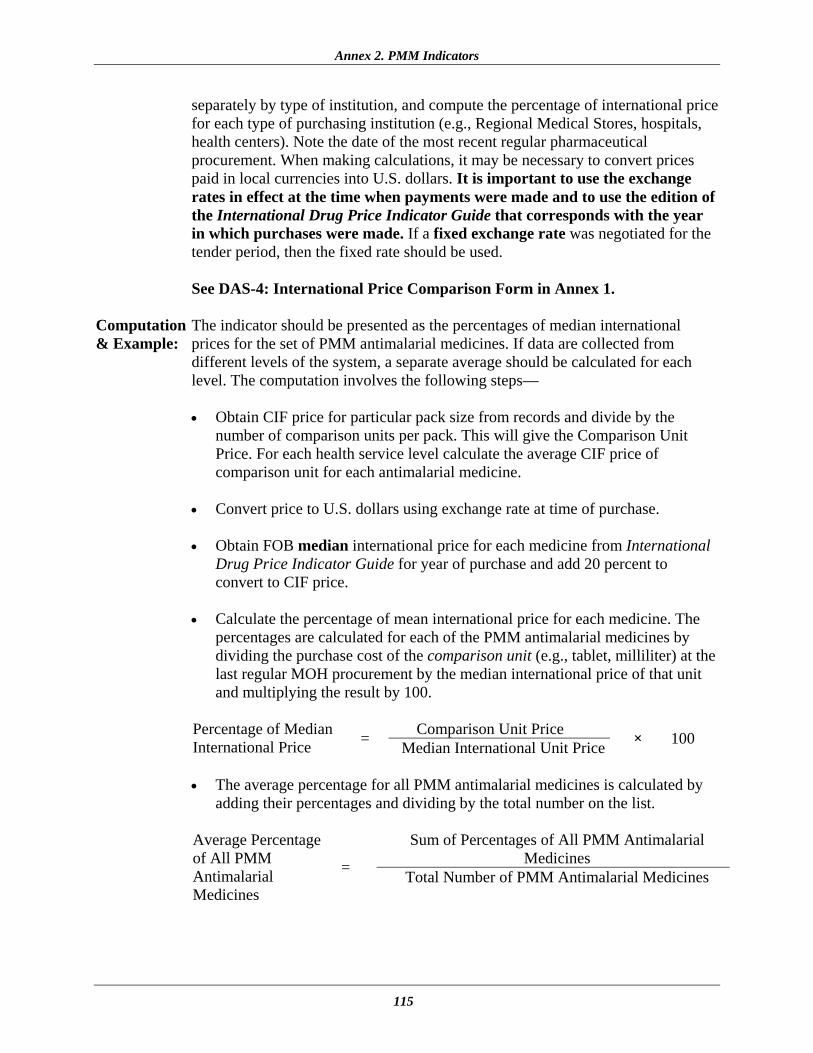
Annex 2. PMM Indicators
115
separately by type of institution, and compute the percentage of international price for each type of purchasing institution (e.g., Regional Medical Stores, hospitals, health centers). Note the date of the most recent regular pharmaceutical procurement. When making calculations, it may be necessary to convert prices paid in local currencies into U.S. dollars. It is important to use the exchange rates in effect at the time when payments were made and to use the edition of the International Drug Price Indicator Guide that corresponds with the year in which purchases were made. If a fixed exchange rate was negotiated for the tender period, then the fixed rate should be used.
See DAS-4: International Price Comparison Form in Annex 1.
Computation The indicator should be presented as the percentages of median international & Example: prices for the set of PMM antimalarial medicines. If data are collected from
different levels of the system, a separate average should be calculated for each level. The computation involves the following steps—
• Obtain CIF price for particular pack size from records and divide by the
number of comparison units per pack. This will give the Comparison Unit Price. For each health service level calculate the average CIF price of comparison unit for each antimalarial medicine.
• Convert price to U.S. dollars using exchange rate at time of purchase. • Obtain FOB median international price for each medicine from International
Drug Price Indicator Guide for year of purchase and add 20 percent to convert to CIF price.
• Calculate the percentage of mean international price for each medicine. The
percentages are calculated for each of the PMM antimalarial medicines by dividing the purchase cost of the comparison unit (e.g., tablet, milliliter) at the last regular MOH procurement by the median international price of that unit and multiplying the result by 100.
Comparison Unit Price Percentage of Median
International Price = Median International Unit Price × 100
• The average percentage for all PMM antimalarial medicines is calculated by
adding their percentages and dividing by the total number on the list.
Sum of Percentages of All PMM Antimalarial Medicines
Average Percentage of All PMM Antimalarial Medicines
= Total Number of PMM Antimalarial Medicines

Pharmaceutical Management for Malaria Manual
116
For purposes of illustrating the computation of the result at the CMS, assume an indicator list of three products:
Product Comparison Unit Price Adjusted Median International Unit Pricea
Chloroquine 150 mg tablet 0.008/tab 0.009/tab
Quinine 300 mg tablet 0.034/tab 0.041/tab
Fansidar 500 mg/25 mg tablet 0.037/tab 0.033/tab
a The figures in this column have been adjusted to reflect estimated CIF prices. 1. The first step is to calculate the percentage of median international price
for each product.
For chloroquine, the first product on the list, this is done as follows—
0.008 Percentage of Median International Price = 0.009 × 100 = 89%
Using the data in the table, the percentages for quinine and Fansidar are calculated as 83% and 112%, respectively. 2. Next, the average percentage for all three products is calculated as
follows—
89 + 83 + 112 Average Percentage of All PMM Antimalarial Medicines
= 3 = 95%
Presentation: In the example country, comparisons of medicine purchase prices with median
international prices were made at both the Central Medical Store and at a sample of one national hospital and three regional hospitals. In 1992, the CMS paid an average of 95 percent of the median international price, while the hospitals paid 206 percent for the set of antimalarial medicines.
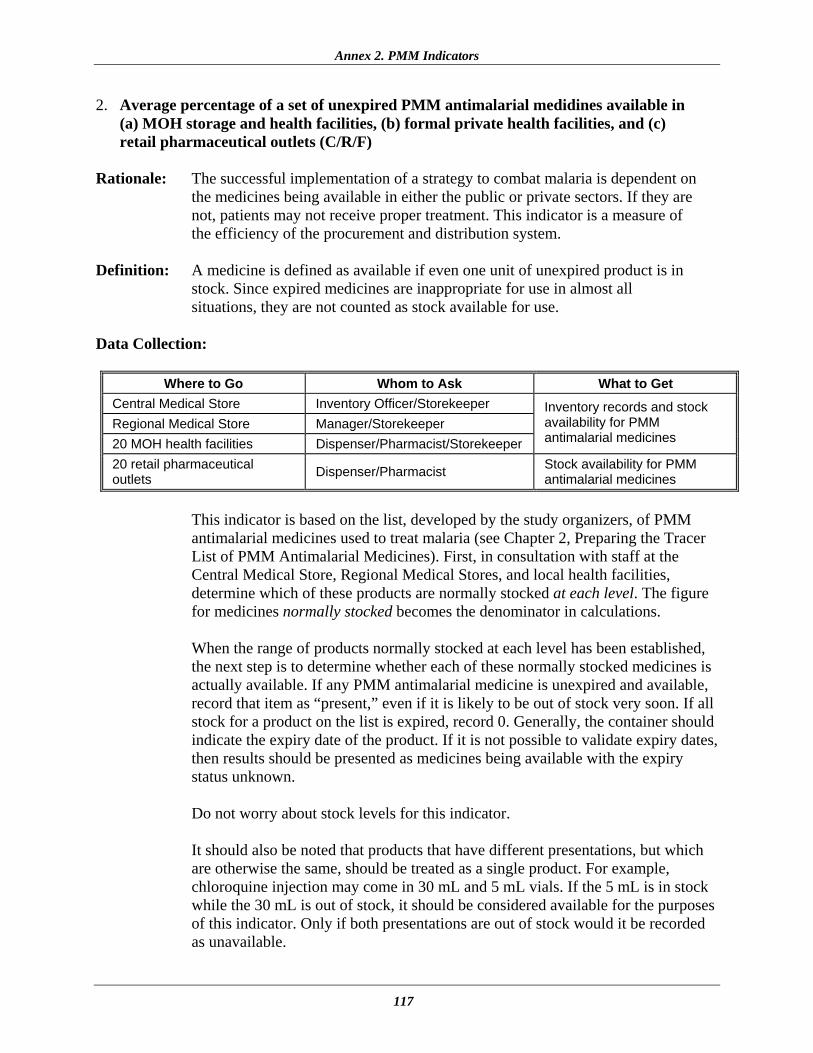
Annex 2. PMM Indicators
117
2. Average percentage of a set of unexpired PMM antimalarial medidines available in (a) MOH storage and health facilities, (b) formal private health facilities, and (c) retail pharmaceutical outlets (C/R/F)
Rationale: The successful implementation of a strategy to combat malaria is dependent on
the medicines being available in either the public or private sectors. If they are not, patients may not receive proper treatment. This indicator is a measure of the efficiency of the procurement and distribution system.
Definition: A medicine is defined as available if even one unit of unexpired product is in
stock. Since expired medicines are inappropriate for use in almost all situations, they are not counted as stock available for use.
Data Collection:
Where to Go Whom to Ask What to Get Central Medical Store Inventory Officer/Storekeeper Regional Medical Store Manager/Storekeeper 20 MOH health facilities Dispenser/Pharmacist/Storekeeper
Inventory records and stock availability for PMM antimalarial medicines
20 retail pharmaceutical outlets Dispenser/Pharmacist Stock availability for PMM
antimalarial medicines
This indicator is based on the list, developed by the study organizers, of PMM antimalarial medicines used to treat malaria (see Chapter 2, Preparing the Tracer List of PMM Antimalarial Medicines). First, in consultation with staff at the Central Medical Store, Regional Medical Stores, and local health facilities, determine which of these products are normally stocked at each level. The figure for medicines normally stocked becomes the denominator in calculations. When the range of products normally stocked at each level has been established, the next step is to determine whether each of these normally stocked medicines is actually available. If any PMM antimalarial medicine is unexpired and available, record that item as “present,” even if it is likely to be out of stock very soon. If all stock for a product on the list is expired, record 0. Generally, the container should indicate the expiry date of the product. If it is not possible to validate expiry dates, then results should be presented as medicines being available with the expiry status unknown. Do not worry about stock levels for this indicator. It should also be noted that products that have different presentations, but which are otherwise the same, should be treated as a single product. For example, chloroquine injection may come in 30 mL and 5 mL vials. If the 5 mL is in stock while the 30 mL is out of stock, it should be considered available for the purposes of this indicator. Only if both presentations are out of stock would it be recorded as unavailable.
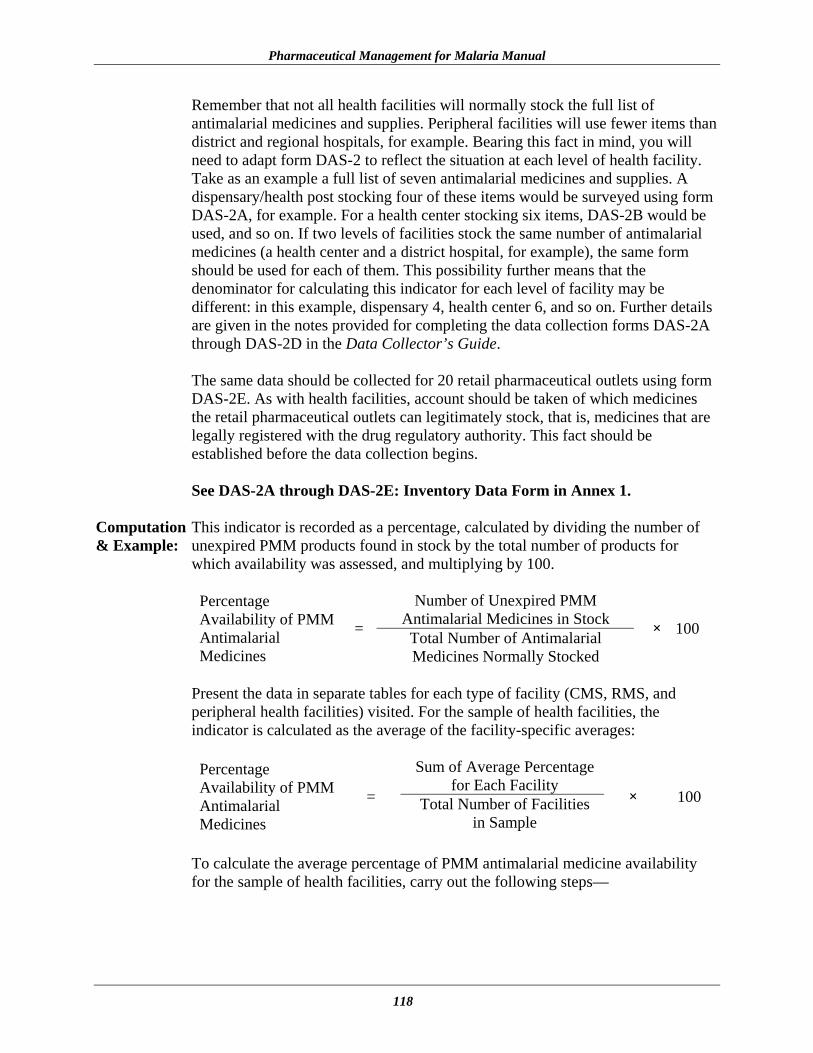
Pharmaceutical Management for Malaria Manual
118
Remember that not all health facilities will normally stock the full list of antimalarial medicines and supplies. Peripheral facilities will use fewer items than district and regional hospitals, for example. Bearing this fact in mind, you will need to adapt form DAS-2 to reflect the situation at each level of health facility. Take as an example a full list of seven antimalarial medicines and supplies. A dispensary/health post stocking four of these items would be surveyed using form DAS-2A, for example. For a health center stocking six items, DAS-2B would be used, and so on. If two levels of facilities stock the same number of antimalarial medicines (a health center and a district hospital, for example), the same form should be used for each of them. This possibility further means that the denominator for calculating this indicator for each level of facility may be different: in this example, dispensary 4, health center 6, and so on. Further details are given in the notes provided for completing the data collection forms DAS-2A through DAS-2D in the Data Collector’s Guide. The same data should be collected for 20 retail pharmaceutical outlets using form DAS-2E. As with health facilities, account should be taken of which medicines the retail pharmaceutical outlets can legitimately stock, that is, medicines that are legally registered with the drug regulatory authority. This fact should be established before the data collection begins. See DAS-2A through DAS-2E: Inventory Data Form in Annex 1.
Computation This indicator is recorded as a percentage, calculated by dividing the number of & Example: unexpired PMM products found in stock by the total number of products for
which availability was assessed, and multiplying by 100.
Number of Unexpired PMM Antimalarial Medicines in Stock
Percentage Availability of PMM Antimalarial Medicines
= Total Number of Antimalarial Medicines Normally Stocked
× 100
Present the data in separate tables for each type of facility (CMS, RMS, and peripheral health facilities) visited. For the sample of health facilities, the indicator is calculated as the average of the facility-specific averages:
Sum of Average Percentage
for Each Facility Percentage Availability of PMM Antimalarial Medicines
= Total Number of Facilities in Sample
× 100
To calculate the average percentage of PMM antimalarial medicine availability for the sample of health facilities, carry out the following steps—

Annex 2. PMM Indicators
119
1. For one health facility with four unexpired PMM antimalarial medicines in stock, from a list of seven antimalarial medicines normally stocked, the calculation is—
4Percentage Availability of
PMM Antimalarial Medicines
= 7 × 100 = 57%
2. For a sample of 20 health facilities, for which the sum of percentages of
antimalarial medicines in stock is 960%, the average percentage of antimalarial medicines in stock is calculated as—
960% Average Percentage Availability
of PMM Antimalarial Medicines = 20 = 48%
To calculate the average percentage of PMM antimalarial medicine availability for the sample of retail pharmaceutical outlets, carry out the following steps—
1. For one retail pharmaceutical outlet with three unexpired PMM antimalarial
medicines in stock, from a list of seven antimalarial medicines normally stocked, the calculation is—
3Percentage Availability of
PMM Antimalarial Medicines
= 7 × 100 = 43%
2. For a sample of 20 retail pharmaceutical outlets, for which the sum of
percentages of antimalarial medicines in stock is 1,060%, the average percentage of antimalarial medicines in stock is calculated as—
1,060%Average Percentage Availability
of PMM Antimalarial Medicines = 20 = 53%
Presentation: In a survey of 20 health facilities, where between three and five PMM tracer
products were confirmed to be normally stocked, an average of 48 percent of the listed products was found in stock. The range among facilities was 25 percent to 85 percent, with the lower end of the range being associated with more peripheral health facilities. The facility-specific averages are listed below.
• Central/Regional Medical Stores = 85% • District/regional hospitals = 64% • Health centers and posts = 48%

Pharmaceutical Management for Malaria Manual
120
In a survey of 20 retail pharmaceutical outlets, where between three and six PMM tracer products were confirmed to be normally stocked, an average of 53 percent of the listed products was found in stock. The range among outlets was 43 percent to 86 percent.
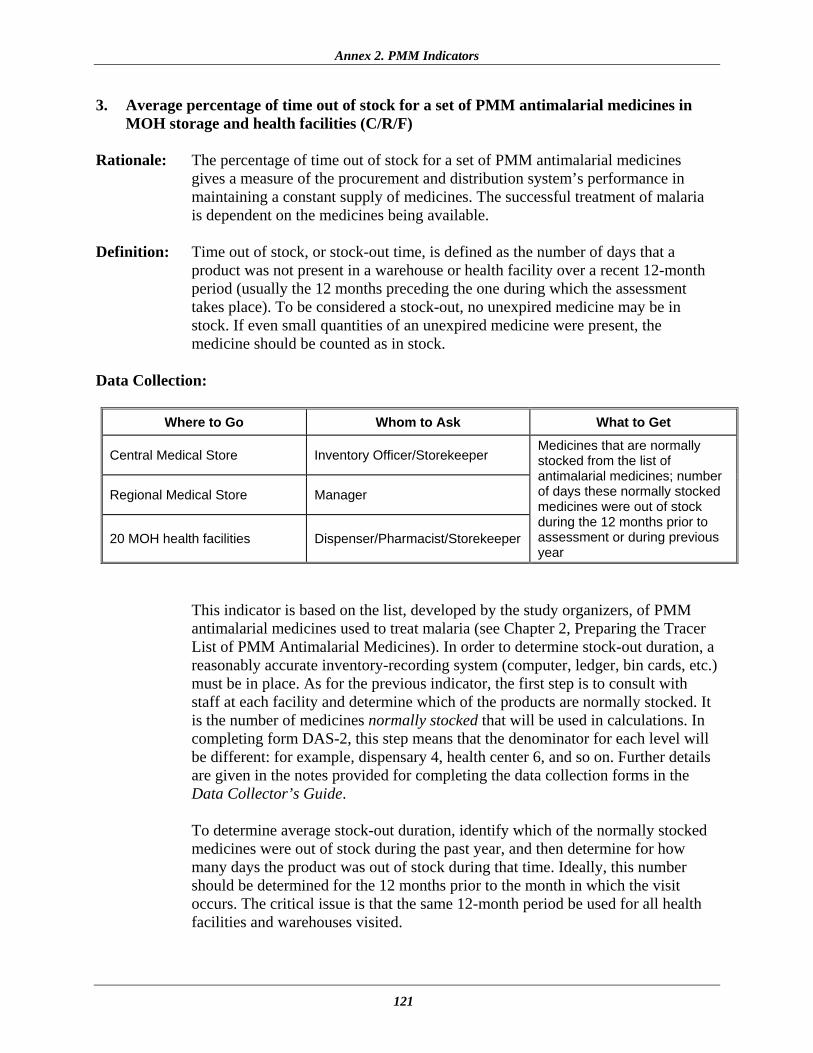
Annex 2. PMM Indicators
121
3. Average percentage of time out of stock for a set of PMM antimalarial medicines in MOH storage and health facilities (C/R/F)
Rationale: The percentage of time out of stock for a set of PMM antimalarial medicines
gives a measure of the procurement and distribution system’s performance in maintaining a constant supply of medicines. The successful treatment of malaria is dependent on the medicines being available.
Definition: Time out of stock, or stock-out time, is defined as the number of days that a
product was not present in a warehouse or health facility over a recent 12-month period (usually the 12 months preceding the one during which the assessment takes place). To be considered a stock-out, no unexpired medicine may be in stock. If even small quantities of an unexpired medicine were present, the medicine should be counted as in stock.
Data Collection:
Where to Go Whom to Ask What to Get
Central Medical Store Inventory Officer/Storekeeper
Regional Medical Store Manager
20 MOH health facilities Dispenser/Pharmacist/Storekeeper
Medicines that are normally stocked from the list of antimalarial medicines; number of days these normally stocked medicines were out of stock during the 12 months prior to assessment or during previous year
This indicator is based on the list, developed by the study organizers, of PMM antimalarial medicines used to treat malaria (see Chapter 2, Preparing the Tracer List of PMM Antimalarial Medicines). In order to determine stock-out duration, a reasonably accurate inventory-recording system (computer, ledger, bin cards, etc.) must be in place. As for the previous indicator, the first step is to consult with staff at each facility and determine which of the products are normally stocked. It is the number of medicines normally stocked that will be used in calculations. In completing form DAS-2, this step means that the denominator for each level will be different: for example, dispensary 4, health center 6, and so on. Further details are given in the notes provided for completing the data collection forms in the Data Collector’s Guide. To determine average stock-out duration, identify which of the normally stocked medicines were out of stock during the past year, and then determine for how many days the product was out of stock during that time. Ideally, this number should be determined for the 12 months prior to the month in which the visit occurs. The critical issue is that the same 12-month period be used for all health facilities and warehouses visited.

Pharmaceutical Management for Malaria Manual
122
As with Indicator 2, products that have different presentations, but which are otherwise the same, should be treated as a single product. For example, chloroquine injection may come in 30 mL and 5 mL vials. If the 5 milliliter is in stock while the 30 mL is out of stock, then chloroquine should be considered available for the purposes of this indicator. Only if both presentations are out of stock would it be recorded as unavailable. See DAS-3: Stock-Out Data Form in Annex 1.
Computation Enter the historical stock data in a table, recording the names of the PMM & Example: antimalarial medicines and the number of days of stock-out in the previous
year. To compute this indicator, carry out the following steps—
• First, for each PMM antimalarial medicine in the table, record the number of days out of stock for each of the past 12 months. Then add the total numbers of days out of stock over the past 12 months for all medicines.
• Second, to record this indicator, compute the average percentage of time
that all PMM antimalarial medicines were out of stock, within the 12-month period, by adding all the stock-out days for all medicines, dividing by 365 times the number of medicines, and multiplying by 100.
Total Number of Stock-Out Days
for All PMM Antimalarial Medicines
Average Percentage of Time That PMM Antimalarial Medicines Were Out of Stock
= 365 × Total Number of PMM Antimalarial Medicines Normally
Stocked
× 100
Present this data in tables, and report averages for each type of facility visited (CMS, RMS, and peripheral health facilities).
For purposes of illustrating the computation, assume a PMM antimalarial medicine list of three products:
Product Total No. of Days Out of Stock
Chloroquine phosphate 150 mg tablet 36 Sulfadoxine/pyrimethamine 500 mg/25 mg tablet 64 Quinine injection 40 mg/mL 123
Assume that in a CMS, all three of these antimalarial medicines are normally stocked.

Annex 2. PMM Indicators
123
36 + 64 + 123 × 100 Average Percentage of Time That PMM Antimalarial Medicines Were Out of Stock
= 365 × 3 = 20%
Presentation: In the example country, over a 12-month period, the PMM antimalarial medicines
were out of stock an average of 20 percent of the time at the Central Medical Store. In the Regional Medical Stores, the antimalarial medicines were out of stock an average of 30 percent of the time. In the sample of health clinics, the PMM antimalarial medicines were out of stock an average of 40 percent of the time.

Pharmaceutical Management for Malaria Manual
124
4. Average percentage of stock records that correspond with physical counts for a set of PMM antimalarial medicines in MOH storage and health facilities (C/R/F)
Rationale: The average percentage of stock records that correspond with physical counts is a
measure of the quality of the stock record-keeping system. This indicator will help reveal inventory management problems and may point to the need for further assessments of problems such as wastage, pilferage, and poor record-keeping, all of which contribute to poor service delivery and financial losses.
Definition: This indicator is the average percentage of in-stock PMM antimalarial medicine
inventory records that correspond exactly with a physical stock count for a set of PMM antimalarial medicines.
Note: Supplemental Indicator 13 provides the individual variation in stock levels. Data Collection:
Where to Go Whom to Ask What to Get
Central Medical Store Inventory Officer/Storekeeper
Regional Medical Store Manager
20 MOH health facilities Dispenser/Pharmacist/ Storekeeper
Most-accurate records of current stock levels for each PMM antimalarial medicine, issues and receipts not entered, method of recording stocks, and physical count of unexpired stock levels
This indicator is based on the list, developed by study organizers, of PMM antimalarial medicines used to treat malaria (see Chapter 2, Preparing the Tracer List of PMM Antimalarial Medicines). Visit the CMS, at least one regional store if they exist in this system, and a sample of 20 health facilities. At each site, carry out the following procedure—
• Ask staff to produce the most-accurate records of current stock levels for each
of the PMM antimalarial medicines. Ask them to produce their records for any recent issues or receipts that have not been posted in their stock-level records. Using recent stock receipt and issue figures, stock records should be adjusted to bring them up to date. The physical count should then be compared to the adjusted stock record figures.
• Take note of the means used to produce these estimates (computerized system,
manual ledgers, bin cards). If bin cards exist, and if they were not used to produce the best estimates, obtain a second set of data based on bin cards as a point of comparison. For reporting purposes, however, use the figures prepared by the staff for the data collection team.
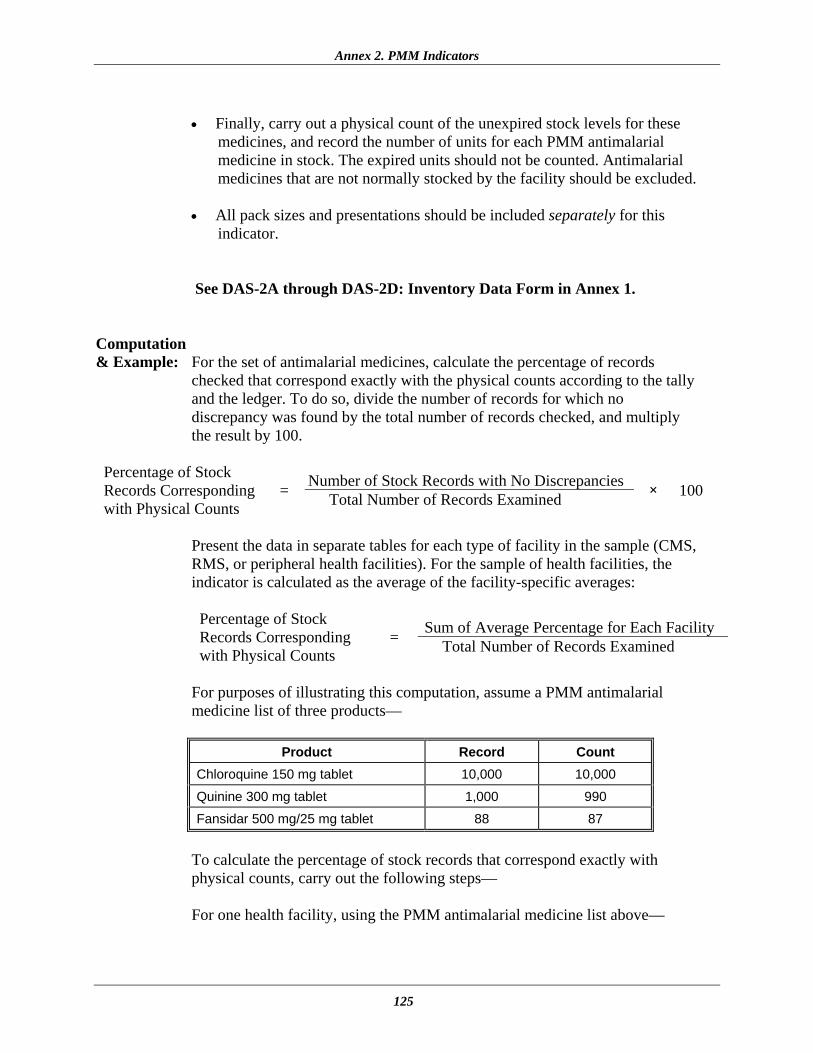
Annex 2. PMM Indicators
125
• Finally, carry out a physical count of the unexpired stock levels for these
medicines, and record the number of units for each PMM antimalarial medicine in stock. The expired units should not be counted. Antimalarial medicines that are not normally stocked by the facility should be excluded.
• All pack sizes and presentations should be included separately for this
indicator.
See DAS-2A through DAS-2D: Inventory Data Form in Annex 1. Computation & Example: For the set of antimalarial medicines, calculate the percentage of records
checked that correspond exactly with the physical counts according to the tally and the ledger. To do so, divide the number of records for which no discrepancy was found by the total number of records checked, and multiply the result by 100.
Number of Stock Records with No Discrepancies Percentage of Stock Records Corresponding with Physical Counts
= Total Number of Records Examined × 100
Present the data in separate tables for each type of facility in the sample (CMS, RMS, or peripheral health facilities). For the sample of health facilities, the indicator is calculated as the average of the facility-specific averages:
Sum of Average Percentage for Each Facility Percentage of Stock Records Corresponding with Physical Counts
= Total Number of Records Examined
For purposes of illustrating this computation, assume a PMM antimalarial medicine list of three products—
Product Record Count
Chloroquine 150 mg tablet 10,000 10,000
Quinine 300 mg tablet 1,000 990
Fansidar 500 mg/25 mg tablet 88 87
To calculate the percentage of stock records that correspond exactly with physical counts, carry out the following steps—
For one health facility, using the PMM antimalarial medicine list above—

Pharmaceutical Management for Malaria Manual
126
1. The number of records examined = 3
2. The number of records with no discrepancy = 1
1 Percentage of Stock Records Corresponding with Physical Stock Counts
= 3 × 100 = 33%
For a sample of 20 health facilities, for which the sum of percentages of stock records that correspond exactly with physical counts is 600 percent, the average percentage of PMM antimalarial medicines that correspond exactly with physical counts is calculated as—
600%Average Percentage of Stock Records Corresponding with Physical Counts = 20 = 30%
Presentation: After adjusting for issue tickets not yet entered in the records at the Central
Medical Store in the example country, the percentage of records for three PMM antimalarial medicines that corresponded exactly with physical counts was 33 percent. The average percentage of health facility records that corresponded exactly with physical counts was 30 percent, with the range among facilities from 10 percent to 60 percent.
If two sets of data are collected, for example, ledgers and bin cards, use the more reliable method in computation. Check with the health facility to find out which is the more accurate method for that facility.

Annex 2. PMM Indicators
127
Drug Use Study Indicators Indicators 5 through 12 focus on drug use practices for treating malaria as currently taking place in the health system. Most developing countries have adopted policies and treatment guidelines for malaria. However, despite years of promotion, health care providers frequently do not follow these guidelines when prescribing medicines. Whatever the intervention attempted in response to this problem, four needs are constant: identifying the specific prescribing behaviors to change, intervening to bring about positive change, assessing the extent to which change takes place, and periodically monitoring the status of problem behaviors. Data collection for this study involves a retrospective review of patient records in health facilities using standard data collection forms, copies of which are provided in Annex 1. Retrospective data collection requires that adequate sources of data exist (i.e., records that offer a method of selecting a random sample of patient encounters that took place within a defined period of time and the specific names and routes of administration of all medicines prescribed). To assess certain aspects of the interaction between health workers and patients/caregivers, direct observation will be used. This observation will be followed by exit poll interviews of the patients/caregivers to allow a comparison of what was told to the patient/caregiver caregiver by the health worker and what information concerning pharmaceutical treatment was actually understood or retained by the patient/caregiver. For the simulated purchase method, data collectors posing as customers seeking help for treating malaria will visit retail pharmaceutical outlets. The data collector will present himself or herself (without a prescription) as the caregiver of a child who has had, for example, a fever for two days. The data collector will ask the medicine seller for advice about what products are best to treat this condition or will ask the health worker for advice on treatment. All information is recorded on information sheets by the data collector after leaving the store. By using the indicators, the user will be able to develop a profile of current practices for treating malaria. The information gathered can be used as a basis for (1) identifying factors that influence particular behaviors and (2) designing interventions for bringing about improvements.

Pharmaceutical Management for Malaria Manual
128
5. Percentage of MOH health facilities visited that had a copy of the official treatment guidelines for malaria (F)
Rationale: This indicator is used to measure the level of access to information to promote
effective care and management of malaria based on treatment guidelines adopted by the MOH of the country involved.
Definition: To qualify as an official manual or standard treatment guidelines for the purposes
of this indicator, a document must be intended as a clinical reference for health care providers who see and sometimes treat malaria patients, and it must present information on the treatment of malaria in that particular country, including examination, care, and pharmaceutical therapy. This indicator measures the presence of the current edition of an official manual or STGs.
Data Collection:
Where to Go Whom to Ask What to Get
MOH Malaria Program Manager Most recent copy of manual or STGs
20 MOH health facilities Health Officer, Director or Manager Facility Manager
Most recent copy of manual or STGs
Such a manual or STGs must officially exist for this indicator to be meaningful. If so, obtain the most recent copy of the manual or STGs that has been prepared to provide impartial information about how to care for malaria sufferers. Evaluate whether the information in the manual or STGs meets all the following criteria, specified in the definition above—
• The document is intended as a clinical reference for health care providers. • The document presents information on examination and treatment
(including pharmaceutical therapy). Data for this indicator are collected by survey of a sample of 20 health facilities. At each site, staff are asked to produce a copy of a document that meets the cited criteria.
See DUS-1: Medical Records and Facility Review Form in Annex 1.
Computation This indicator is a percentage. It is computed as the number of facilities at & Example: which an official manual or STGs are found, divided by the total number of
facilities in the sample, and multiplied by 100 to convert the decimal to a percentage.

Annex 2. PMM Indicators
129
Number of Facilities with Official Manual or STGs Percentage of
Facilities with Official Manual or STGs
= Number of Facilities in Sample × 100
9 Percentage of Facilities with
Official Manual or STGs = 20 × 100 = 45%
Presentation: In the example country, a national manual exists that had been adopted in
1996. The manual is intended for use by physicians, nurses, and other health care personnel who treat malaria. It contains information on examination, care (including pharmaceutical therapy), and follow-up services for malaria sufferers. An indicator study carried out in this country revealed that in 45 percent of health facilities, or 9 health facilities out of a sample of 20 surveyed, staff could produce a copy of the 1996 edition of the manual.

Pharmaceutical Management for Malaria Manual
130
6. Percentage of encounters with patients diagnosed with uncomplicated malaria who are prescribed an antimalarial consistent with treatment guidelines (F/O)
Rationale: This indicator measures the degree of adherence to standard treatment guidelines
for malaria. Following STGs for treating uncomplicated malaria is important in order to treat the patient in a timely and effective manner, contain treatment costs, and reduce the risk of contributing to the development of drug resistance.
Definition: This indicator measures the degree of adherence with national guidelines for
treating uncomplicated malaria. There are no internationally agreed standards for the diagnosis of malaria. Patients may complain of fever that is often periodic and accompanied by headache, chills, nausea, vomiting, and joint and muscle aches. In general, the simple existence of a fever, even in high-risk areas, may not be enough to indicate malaria is present in many people sick enough to go to a clinic. Nevertheless, because uncomplicated malaria can rapidly progress to the severe disease, any diagnostic approach must have a high sensitivity in order to ensure that as many malaria patients as possible receive antimalaria treatment. The Integrated Management of Childhood Illness (IMCI) approach for children in endemic areas, for example, achieves this sensitivity by using fever or a recent history of fever as the diagnostic criterion. Although this approach certainly leads to substantial overtreatment of nonmalaria patients with malaria medicines, many countries judge it an acceptable price to pay as long as the medicines prescribed are cheap, safe, and effective. This reasoning holds especially true in areas with limited access to laboratory testing facilities. Based upon this rationale, and unless national guidelines for a particular country indicate otherwise, in endemic areas the existence of fever is adopted as the basis for this indicator.
Antimalarials listed in the national treatment guidelines of a particular country are appropriate for use. International norms include, for example, chloroquine and the combination sulfadoxine and pyrimethamine (Fansidar) as appropriate oral antimalarials for the treatment of uncomplicated malaria. Although the standard treatment guidelines may not have been recently updated and thus the treatments prescribed may be according to STGs but still inappropriate, evaluating whether the guidelines are appropriate is beyond the scope of this study. For the purposes of this assessment, an antimalarial that is not listed by the country as the treatment of choice for malaria will be considered inappropriate.
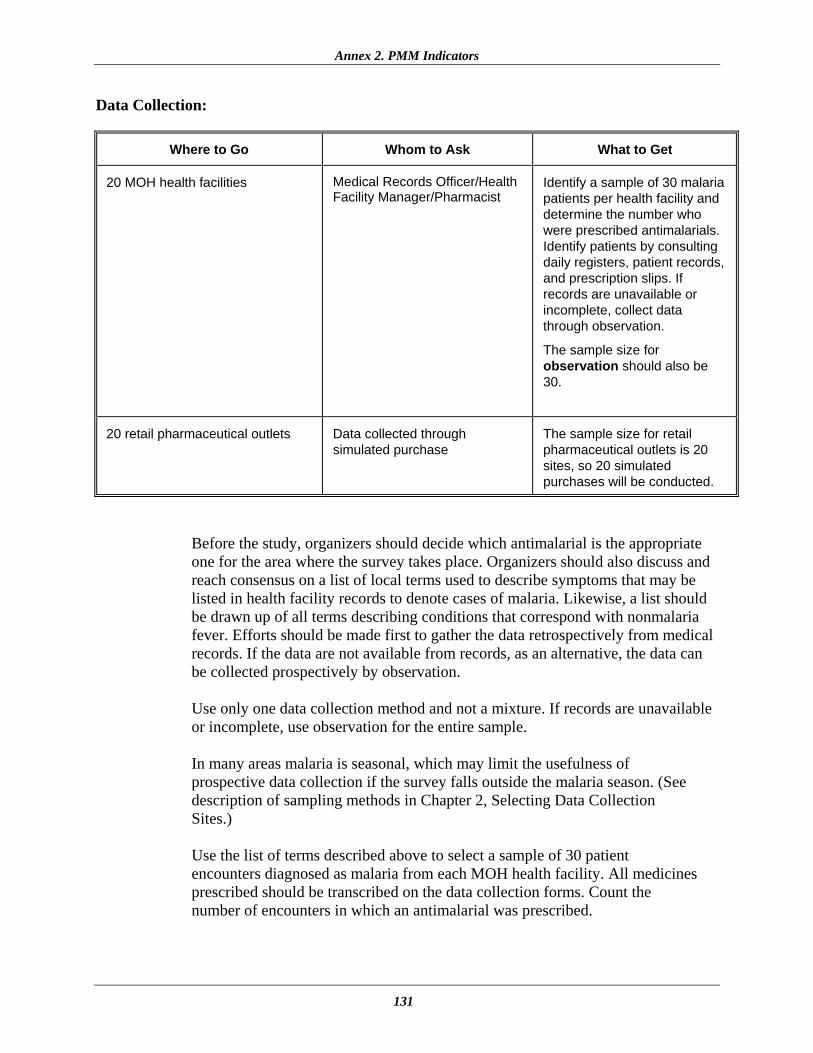
Annex 2. PMM Indicators
131
Data Collection:
Where to Go Whom to Ask What to Get
20 MOH health facilities Medical Records Officer/Health Facility Manager/Pharmacist
Identify a sample of 30 malaria patients per health facility and determine the number who were prescribed antimalarials. Identify patients by consulting daily registers, patient records, and prescription slips. If records are unavailable or incomplete, collect data through observation.
The sample size for observation should also be 30.
20 retail pharmaceutical outlets Data collected through simulated purchase
The sample size for retail pharmaceutical outlets is 20 sites, so 20 simulated purchases will be conducted.
Before the study, organizers should decide which antimalarial is the appropriate one for the area where the survey takes place. Organizers should also discuss and reach consensus on a list of local terms used to describe symptoms that may be listed in health facility records to denote cases of malaria. Likewise, a list should be drawn up of all terms describing conditions that correspond with nonmalaria fever. Efforts should be made first to gather the data retrospectively from medical records. If the data are not available from records, as an alternative, the data can be collected prospectively by observation. Use only one data collection method and not a mixture. If records are unavailable or incomplete, use observation for the entire sample. In many areas malaria is seasonal, which may limit the usefulness of prospective data collection if the survey falls outside the malaria season. (See description of sampling methods in Chapter 2, Selecting Data Collection Sites.)
Use the list of terms described above to select a sample of 30 patient encounters diagnosed as malaria from each MOH health facility. All medicines prescribed should be transcribed on the data collection forms. Count the number of encounters in which an antimalarial was prescribed.

Pharmaceutical Management for Malaria Manual
132
Note: Malaria encounters may be difficult to identify at the health facility level in areas with low malaria risk or in areas with a clear seasonal pattern for malaria. In these areas, review four months of records, starting from the last month of the malaria season. If fewer than five cases in total have been identified, abandon the process for malaria in that facility. If five or more cases have been identified, continue the selection process for the 12-month period and stop, even if fewer than 30 encounters have been identified. The time required to review 12 months of records for a probable data set of fewer than 15 cases is not efficient use of the limited time available.
For retail pharmaceutical outlets, follow the simulated purchase scenario for malaria outlined in Chapter 4.
See DUS-1A and DUS-1B: Medical Records and Facility Review Form; DUS-2: Observation of Health Worker Data Form; DUS-3. Exit Poll Interview Form; and DUS-4: Simulated Purchase Data Form for Uncomplicated Malaria in Private Pharmacies in Annex 1.
Computation For each facility in a sample, the indicator is recorded as a percentage of the & Example: total number of patient encounters surveyed. The percentage is computed by
dividing the number of malaria patient encounters during which an antimalarial is prescribed by the total number of malaria patient encounters surveyed, and multiplying by 100. The overall indicator is the average of the facility-specific percentages. Along with this average, provide range figures.
Total Number of Malaria Encounters Prescribed Antimalarials Consistent with STGs
Percentage of Malaria Encounters Prescribed an Appropriate Antimalarial
= Sum of Malaria Encounters where Antimalarials Were Not Prescribed according to STGs + Sum of Malaria Encounters
where Antimalarials Were Prescribed according to STGs
× 100
For example, results from one health facility are calculated as follows—
8 Percentage of Malaria Encounters Prescribed an Appropriate Antimalarial = 24 × 100 = 33%
If for 20 health facilities surveyed, data for a sample of 518 patient encounters showed that a total of 406 patients received an appropriate antimalarial for the treatment of uncomplicated malaria, the average for all facilities would be—
406 Percentage of Malaria Encounters Prescribed an Appropriate Antimalarial for All Facilities
= 518 × 100 = 78%

Annex 2. PMM Indicators
133
If a sample of 20 retail pharmaceutical outlets where simulated purchases were conducted showed that a total of 14 patients received appropriate antimalarials for the treatment of uncomplicated malaria, the average for the 20 retail pharmaceutical outlets would be—
Total Number of Malaria EncountersPrescribed Antimalarials Percentage of Malaria
Encounters Prescribed an Appropriate Antimalarial
= Total Number of Simulated Purchases
× 100
14 Percentage of Malaria Encounters Prescribed an Appropriate Antimalarial
= 20 × 100 = 70%
Presentation: In a survey of 20 health facilities in the sample country, an appropriate
antimalarial was prescribed for the treatment of malaria in 78 percent of 518 outpatient encounters, with a range of 38 percent to 89 percent among facilities. In a survey conducted through simulated purchases at 20 retail pharmaceutical outlets in the same country, an appropriate antimalarial was prescribed for 14 patients presenting with complaints compatible with uncomplicated malaria, or 70 percent of those surveyed.
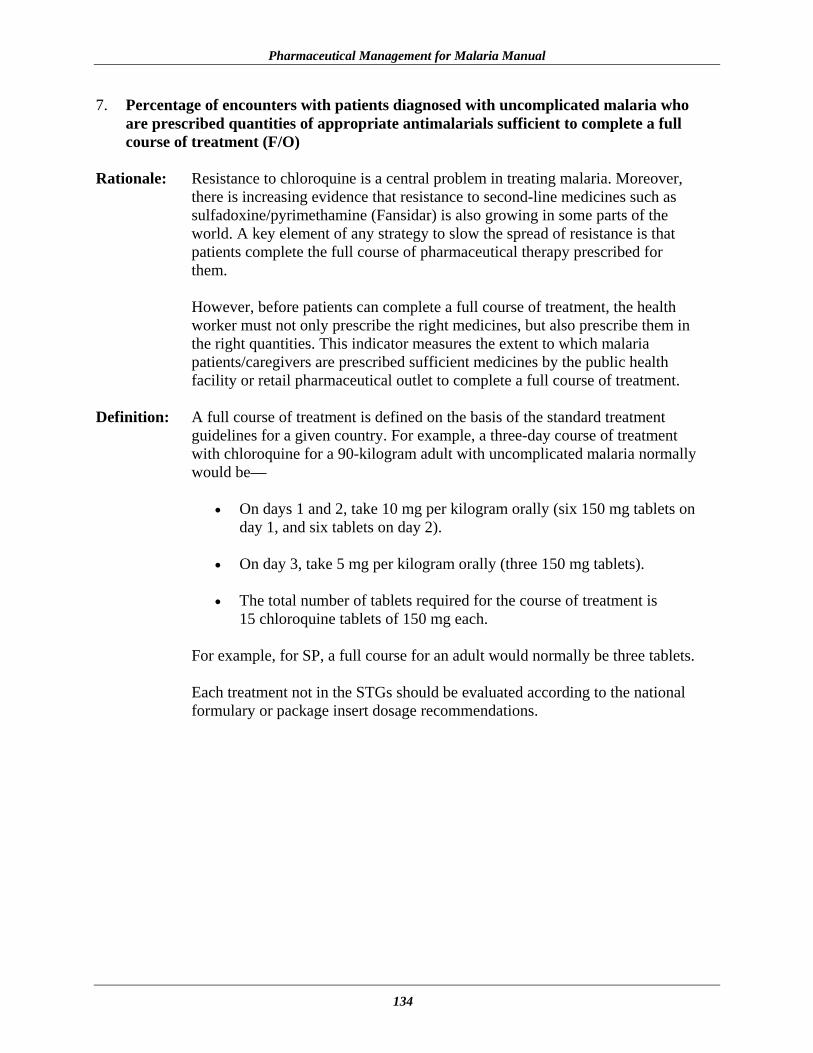
Pharmaceutical Management for Malaria Manual
134
7. Percentage of encounters with patients diagnosed with uncomplicated malaria who are prescribed quantities of appropriate antimalarials sufficient to complete a full course of treatment (F/O)
Rationale: Resistance to chloroquine is a central problem in treating malaria. Moreover,
there is increasing evidence that resistance to second-line medicines such as sulfadoxine/pyrimethamine (Fansidar) is also growing in some parts of the world. A key element of any strategy to slow the spread of resistance is that patients complete the full course of pharmaceutical therapy prescribed for them.
However, before patients can complete a full course of treatment, the health worker must not only prescribe the right medicines, but also prescribe them in the right quantities. This indicator measures the extent to which malaria patients/caregivers are prescribed sufficient medicines by the public health facility or retail pharmaceutical outlet to complete a full course of treatment.
Definition: A full course of treatment is defined on the basis of the standard treatment
guidelines for a given country. For example, a three-day course of treatment with chloroquine for a 90-kilogram adult with uncomplicated malaria normally would be—
• On days 1 and 2, take 10 mg per kilogram orally (six 150 mg tablets on day 1, and six tablets on day 2).
• On day 3, take 5 mg per kilogram orally (three 150 mg tablets). • The total number of tablets required for the course of treatment is
15 chloroquine tablets of 150 mg each.
For example, for SP, a full course for an adult would normally be three tablets. Each treatment not in the STGs should be evaluated according to the national formulary or package insert dosage recommendations.

Annex 2. PMM Indicators
135
Data Collection:
Where to Go Whom to Ask What to Get
20 MOH health facilities Health facility manager for permission to conduct exit poll interviews and to review health records
Identify a sample of 30 malaria encounters per health facility and determine the type and quantity of prescribed antimalarials. If possible, identify encounters retrospectively by consulting daily registers, patient records, and prescription slips. If exit polls are the data collection method used, gather data for 10 to 15 of the encounters at each health facility by conducting interviews. Use the same sample of malaria encounters as for Indicator 8. Compare quantities of each medicine prescribed to the recommendations made in the standard treatment guidelines.
20 retail pharmaceutical outlets Data collected through simulated purchase. Store managers should be unaware of the process, so no permission is needed.
Use simulated purchases to collect prescribing data. Compare quantities of each medicine prescribed to the recommendations made in the standard treatment guidelines.
See DUS-1A. Medical Records and Health Facility Review Form; DUS-3: Exit Poll Interview Form; and DUS-4: Simulated Purchase Data Form in Annex 1.
Computation For each MOH facility and retail pharmaceutical outlet in the sample, indicators are & Example: recorded as percentages, computed by dividing the number of malaria
prescriptions with quantities sufficient to complete a course of treatment by the total number of malaria prescriptions and multiplying the quotient by 100. The overall indicator is an average of these facility-specific percentages. Along with this average, provide the range of figures.
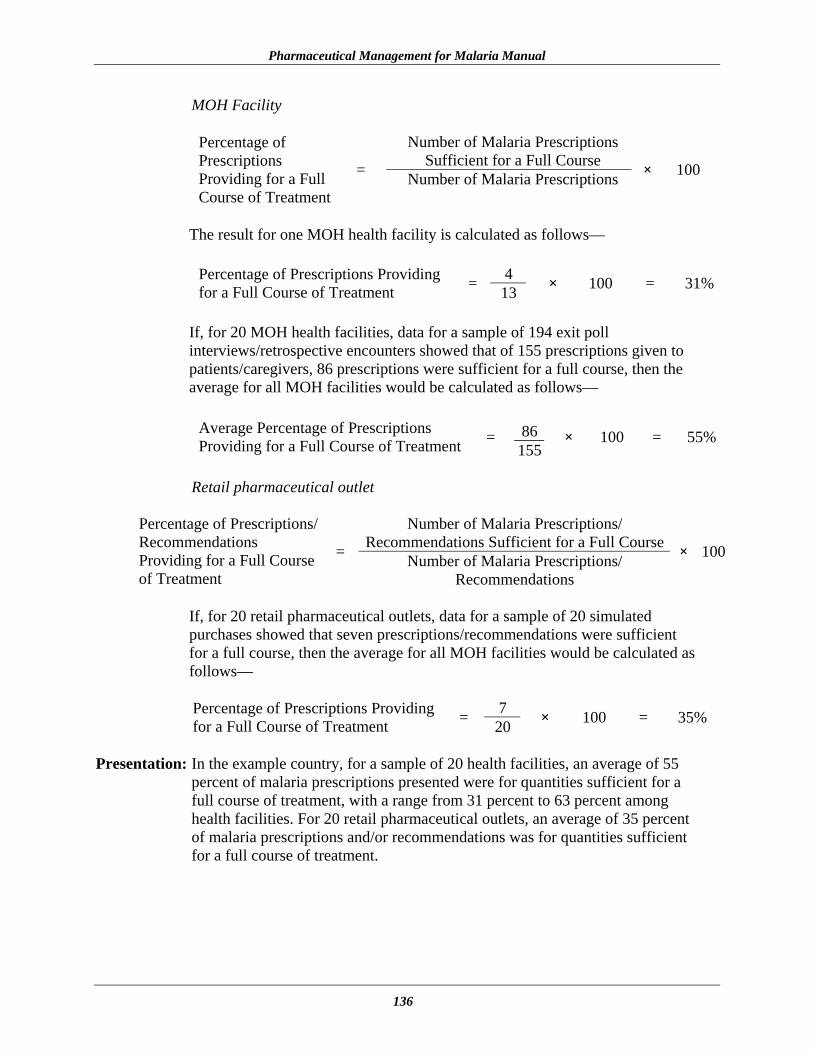
Pharmaceutical Management for Malaria Manual
136
MOH Facility
Number of Malaria Prescriptions Sufficient for a Full Course
Percentage of Prescriptions Providing for a Full Course of Treatment
= Number of Malaria Prescriptions × 100
The result for one MOH health facility is calculated as follows—
4 Percentage of Prescriptions Providing
for a Full Course of Treatment = 13 × 100 = 31%
If, for 20 MOH health facilities, data for a sample of 194 exit poll interviews/retrospective encounters showed that of 155 prescriptions given to patients/caregivers, 86 prescriptions were sufficient for a full course, then the average for all MOH facilities would be calculated as follows—
86Average Percentage of Prescriptions
Providing for a Full Course of Treatment = 155
× 100 = 55%
Retail pharmaceutical outlet
Number of Malaria Prescriptions/
Recommendations Sufficient for a Full CoursePercentage of Prescriptions/ Recommendations Providing for a Full Course of Treatment
= Number of Malaria Prescriptions/ Recommendations
× 100
If, for 20 retail pharmaceutical outlets, data for a sample of 20 simulated purchases showed that seven prescriptions/recommendations were sufficient for a full course, then the average for all MOH facilities would be calculated as follows—
7 Percentage of Prescriptions Providing
for a Full Course of Treatment = 20 × 100 = 35%
Presentation: In the example country, for a sample of 20 health facilities, an average of 55 percent of malaria prescriptions presented were for quantities sufficient for a full course of treatment, with a range from 31 percent to 63 percent among health facilities. For 20 retail pharmaceutical outlets, an average of 35 percent of malaria prescriptions and/or recommendations was for quantities sufficient for a full course of treatment.

Annex 2. PMM Indicators
137
8. Percentage of prescribed antimalarial medicines actually dispensed by public health facilities (F/O)
Rationale: This indicator measures the ability of health facilities to dispense the
prescribed antimalarial medicines to malaria patients or caregivers of malaria patients.
Definition: Medicines that are actually dispensed are defined as prescribed antimalarial
medicines that are dispensed from the health facility. This indicator is based only on the prescriptions for antimalarials presented for dispensing at public health facilities.
Data Collection:
Where to Go Whom to Ask What to Get
20 MOH health facilities Health facility supervisor for permission to conduct exit poll interviews
Using patient and/or dispensing records, identify the number of medicines dispensed and the total number of medicines that were prescribed in a sample of 30 malaria dispensing encounters at each health facility. Should records be unavailable or incomplete, collect the same information from a sample of 10 to 15 malaria dispensing encounters at each health facility by conducting exit poll interviews.
Note on At each of the 20 MOH health facilities, data collectors conducting the Exit Polls: exit poll interviews should use the same sample of malaria encounters used for
Indicator 7. Conduct the exit poll interviews as described in Chapter 4 of this manual and the Data Collector’s Guide. Include only malaria patients or caregivers of malaria patients needing curative care.
See DUS-1: Medical Records and Facility Review Form; DUS-3: Exit Poll Interview Form in Annex 1.

Pharmaceutical Management for Malaria Manual
138
Computation For each MOH facility in the sample, indicators are recorded as percentages, & Example: computed by dividing the number of medicines actually dispensed by the
total number of prescribed medicines that were presented for dispensing, and multiplying this quotient by 100. The overall indicator is an average of these pharmaceutical outlet–specific percentages. Along with this average, provide the range figures.
Number of Medicines Actually Dispensed
Percentage of Prescribed Medicines That Are Dispensed = Number of Prescribed Medicines
Presented for Dispensing
× 100
The result for one MOH health facility is calculated as follows—
7 Percentage of Prescribed MedicinesThat Are Dispensed = 13 × 100 = 54%
If, for 20 MOH health facilities, data for a sample of 194 exit poll interview encounters showed that of 155 prescriptions presented for dispensing, 115 prescribed medicines were actually dispensed, then the average for all MOH facilities would be calculated as follows—
115 Average Percentage of Prescribed
Medicines That Are Dispensed for All MOH Facilities
= 155 × 100 = 74%
Presentation: In the example country, for a sample of 20 MOH health facilities, an average
of 74 percent of prescribed medicines presented for dispensing were actually dispensed, with a range from 47 percent to 90 percent among health facilities.
Note: These data have limitations because the prescription may not be presented if
the patient has no money, has medicines at home, or prefers to go the retail sector. Furthermore, the prescription may not be filled with the quantity prescribed.

Annex 2. PMM Indicators
139
9. Average cost of medicines prescribed as a percentage of costs if standard treatment guidelines for treatment were followed (F/O)
Rationale: One of the basic tenets of rational pharmaceutical management is that the use of
standardized treatment guidelines, if followed, will provide cost-effective, appropriate care that is likely to be cheaper than the cost of care if guidelines are not followed. On the assumption that following STGs results in the optimal cost, this indicator is useful for monitoring and controlling pharmaceutical treatment costs.
Definition: This indicator measures the average cost of medicines prescribed currently for
different age groups with malaria in the public and private sectors and compares the average to what pharmaceutical treatment would cost if standard treatment guidelines were followed for those age groups. The comparison is depicted mathematically as a percentage for each age group in each sector.
Data Collection:
Where to Go Whom to Ask What to Get 20 MOH health facilities Medical Records Officer/
Health Facility Manager/ Pharmacist
Determine all medicines prescribed for a malaria encounter for a sample of 30 patients per patient group per facility by consulting daily registers, patient records, prescription slips. Use the same sample of malaria encounters identified for Indicators 6 and 7.
20 retail pharmaceutical outlets
Data collected through simulated purchase. Store managers should be unaware of the process, so no permission is needed.
Determine all medicines prescribed for a malaria encounter for a sample of 20 simulated purchases for malaria.
Before collecting the sample of encounters, organizers should meet with the data collectors to discuss the proper way to collect the data. All medicines per malaria encounter should be recorded. (To avoid confusion or the need for interpretation by data collectors, all medicines prescribed should be transcribed exactly as listed in the patient record in the data collection forms. In addition to the name of the medicine, it is important to record the dosage strength, dosage form, and length of pharmaceutical therapy or amount of medicine dispensed. Verifying cost information can be carried out during data analysis.) Include only outpatients seeking curative care for malaria. Efforts should be made first to gather the data retrospectively from daily registers, medical records, or prescription slips. If the data are not available from records, as an
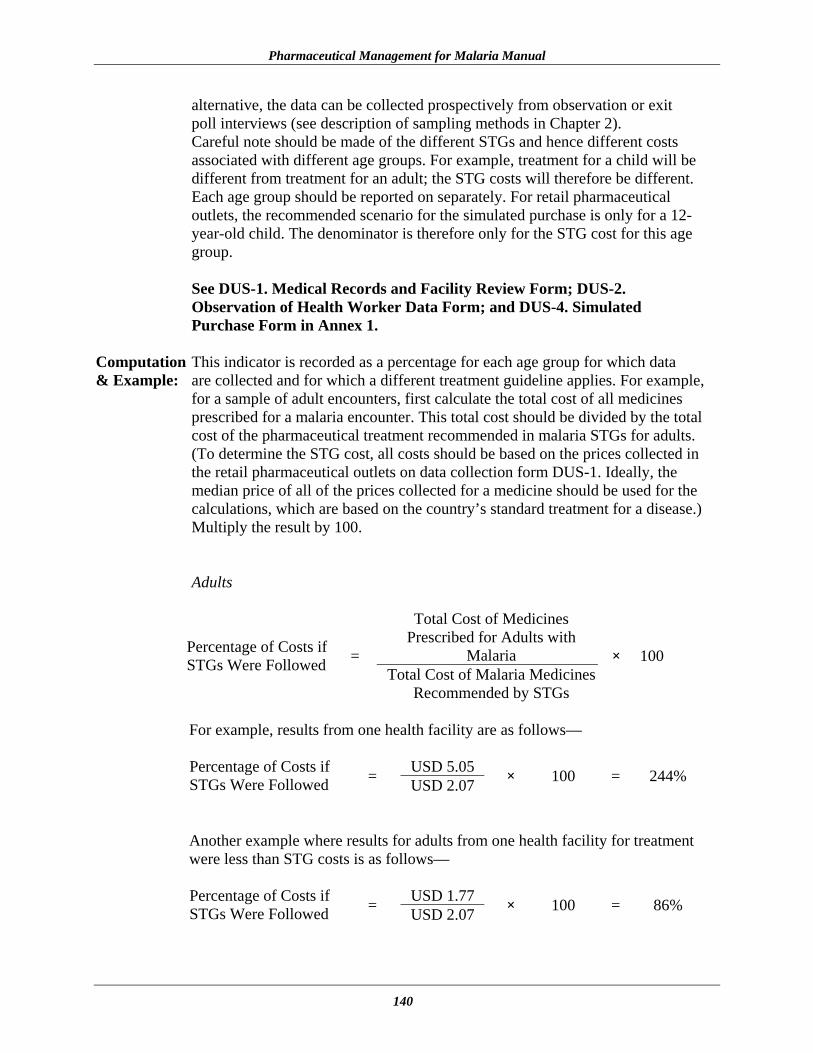
Pharmaceutical Management for Malaria Manual
140
alternative, the data can be collected prospectively from observation or exit poll interviews (see description of sampling methods in Chapter 2). Careful note should be made of the different STGs and hence different costs associated with different age groups. For example, treatment for a child will be different from treatment for an adult; the STG costs will therefore be different. Each age group should be reported on separately. For retail pharmaceutical outlets, the recommended scenario for the simulated purchase is only for a 12-year-old child. The denominator is therefore only for the STG cost for this age group. See DUS-1. Medical Records and Facility Review Form; DUS-2. Observation of Health Worker Data Form; and DUS-4. Simulated Purchase Form in Annex 1.
Computation This indicator is recorded as a percentage for each age group for which data & Example: are collected and for which a different treatment guideline applies. For example,
for a sample of adult encounters, first calculate the total cost of all medicines prescribed for a malaria encounter. This total cost should be divided by the total cost of the pharmaceutical treatment recommended in malaria STGs for adults. (To determine the STG cost, all costs should be based on the prices collected in the retail pharmaceutical outlets on data collection form DUS-1. Ideally, the median price of all of the prices collected for a medicine should be used for the calculations, which are based on the country’s standard treatment for a disease.) Multiply the result by 100.
Adults
Total Cost of Medicines Prescribed for Adults with
Malaria Percentage of Costs if STGs Were Followed =
Total Cost of Malaria Medicines Recommended by STGs
× 100
For example, results from one health facility are as follows—
USD 5.05 Percentage of Costs if
STGs Were Followed = USD 2.07 × 100 = 244%
Another example where results for adults from one health facility for treatment were less than STG costs is as follows—
USD 1.77 Percentage of Costs if
STGs Were Followed = USD 2.07 × 100 = 86%

Annex 2. PMM Indicators
141
If for 20 health facilities surveyed, data for a sample of 400 adult malaria patient encounters showed a total cost of USD 1,412 for pharamaceutical treatment, then the average for all facilities would be—
USD 1,412Average Cost of Medicines Prescribed for Malaria Treatment in All Facilities
= 400 = USD 3.53
USD 3.53 Percentage of Costs
if STGs Were Followed = USD 2.07 × 100 = 170%
Children between 1 and 5 Years
Total Cost of Medicines Prescribed for Children with
Malaria Percentage of Costs if STGs Were Followed =
Total Cost of Malaria Medicines Recommended by STGs
× 100
For example, results from one health facility for children are as follows—
USD 4.53 Percentage of Costs
if STGs Were Followed = USD 1.57 × 100 = 277%
Another example where results of treatment costs for children from one health facility were less than STG costs is as follows—
USD 1.14 Percentage of Costs
if STGs Were Followed = USD 1.57 × 100 = 73%
If for 20 health facilities surveyed, data for a sample of 200 childhood malaria encounters showed a total cost of USD 657 for pharmaceutical treatment, the average for all facilities would be—
USD 657 Average Cost of Medicines Prescribed for Malaria Treatment in All Facilities
= 200 = USD 3.29
USD 3.29 Percentage of Costs
if STGs Were Followed = USD 1.57 × 100 = 210%

Pharmaceutical Management for Malaria Manual
142
If a survey of 20 retail pharmaceutical outlets conducted through 20 simulated purchases for malaria showed a total cost of USD 162 for pharmaceutical treatment, the average for the 20 retail pharmaceutical outlets would be—
USD 162 Average Cost of Medicines Prescribed for Malaria Treatment in All Facilities
= 20 = USD 8.10
USD 8.10 Percentage of Costs
if STGs Were Followed = USD 2.07 × 100 = 391%
Presentation: In a survey of 20 health facilities in the example country, the average cost of medicines prescribed for the treatment of adult malaria was USD 3.53. This cost was 170 percent of the cost of pharmaceutical treatment recommended by the standard treatment guidelines. For children between one and five years treated at the same group of health facilities, the average cost of medicines was USD 3.29. This amount was more than double, 210 percent, the cost of treatment recommended by the STGs. For 20 retail pharmaceutical outlets in the same country, the cost for 12-year-old children was 391 percent higher.

Annex 2. PMM Indicators
143
10. Percentage of malaria patients/caregivers of malaria patients who could correctly describe how to take/give the prescribed antimalarial medicine (F)
Rationale: This indicator is useful to measure the potential for nonadherence and possible
treatment failure because of the lack of knowledge of patients and caregivers on how to administer medication correctly. It measures the effectiveness of communication between the health care worker and the patient.
Definition: Ideally, every patient and caregiver should know the name of the medicine;
what the medicine is prescribed for; the dose and frequency; how to administer the medicine; and the number of days the medicine should be given. However, a few key items are more critical than others. To correctly describe how to take the medication, the patient/caregiver should know the dose to administer, how many times a day, for how many days, and how to administer. All four of these items should be mentioned verbally by the patient/caregiver for the encounter to be considered correct.
Data Collection:
Where to Go Whom to Ask What to Get
20 MOH health facilities
Health facility for permission to conduct exit poll interviews with malaria patients/caregivers of malaria patients
Using exit poll interviews, ask 10 to 15 patients/caregivers needing curative care for malaria in each health facility to describe how they are going to take/give the medicines prescribed.
If exit poll interviews were used for Indicators 7, 8, and 9, the same sample should be used for this indicator.
Data from observations can be cross-checked with data collected from exit poll interviews.
At each of the 20 MOH health facilities, data collectors should conduct exit poll interviews with a sample of 10 to 15 patients. Where applicable, use the same sample of patient/caregiver encounters used for Indicators 7, 8, and 9. Conduct the exit poll interviews as described in Chapter 4 of this manual and the Data Collector’s Guide. Include only patients/caregivers of patients needing curative care for uncomplicated malaria.
See DUS-3: Exit Poll Interview Form in Annex 1.

Pharmaceutical Management for Malaria Manual
144
Computation For each MOH facility in the sample, indicators are recorded as percentages, & Example: computed by dividing the number of patients/caregivers who can correctly
describe how to take/give medication by the total number of patients/caregivers interviewed, and multiplying this quotient by 100. The overall indicator is an average of these pharmaceutical outlet–specific percentages. Along with this average, provide the range figures.
Number of Patients/Caregivers
Who Correctly Describe How to Take/Give Medication Number of Patients Who
Describe How to Take the Medication
= Number of Patients/Caregivers Interviewed
× 100
The result for one MOH health facility is calculated as follows—
7 Percentage of Patients Who Correctly Describe How to Take the Medication
= 13 × 100 = 54%
If, for 20 MOH health facilities, data for a sample of 194 exit poll interviews showed that 101 patients/caregivers described correctly how to take/give the medication, then the average for all MOH facilities would be calculated as follows—
101 Average Percentage of Patients Who Correctly Describe How to Take the Medication
= 194 × 100 = 52%
Presentation: In the example country, for a sample of 20 MOH health facilities, an average
of 52 percent of patients/caregivers correctly described how to give the medication, with a range from 37 percent to 90 percent among health facilities.

Annex 2. PMM Indicators
145
11. Percentage of health workers and retail pharmaceutical outlets that provided some information to malaria patients/caregivers on how to take/give the recommended medicine(s) (F/O)
Rationale: This indicator measures whether health workers are able to communicate to
patients how to take their medication. This component is important in gaining an understanding of patient use of medication and patient education.
Definition: The definition for “some information” includes the dose and the frequency of
medication use, how to prepare the medicine, whether to take the medicine with food, or any potential side effects or symptoms associated with the medicine. If the health worker explains at least one of these aspects to the patient, then, for this indicator, it will be considered that the health worker has provided information regarding the prescribed medicine. Failure to directly discuss any of these issues with the patient will be considered as not providing any information.
Data Collection:
Where to Go Whom to Ask What to Get
20 MOH health facilities Health facility for permission to observe patient encounters
Observation will be used to collect data. The sample size for this indicator is 20 sites, so 20 patient observations will be conducted.
20 retail pharmaceutical outlets Data collection is done as a simulation. Store managers should be unaware of the process so no permission is needed.
Determine the prescribing practice for a sample of 20 simulated purchases for malaria.
For each observation, the data collector will note whether any information regarding the medicine was given. The type of information the data collector should listen for is—
• What is the name of the medicine? • What is the dose? • What is the frequency of the dose? • How long should the patient take the medicine? • Are there any special instructions regarding the administration of the
medicine?

Pharmaceutical Management for Malaria Manual
146
For example, if a patient is prescribed chloroquine, the observer should expect to hear instructions about taking the medication with food and the importance of completing the full course of treatment. If the data collector did not hear any of the preceding questions addressed, then he or she can consider that during the encounter, the practitioner did not provide any information.
See DUS-2: Observation of Health Worker Data Form and DUS-4: Simulated Purchase Form in Annex 1.
Computation The data collector should note whether the practitioner provides any & Example: information regarding any of the medicines for each encounter. The indicator
is a percentage. Therefore, the number of practitioners providing information is divided by the total number of encounters, and the quotient should be multiplied by 100 to obtain a percentage. Along with this average, provide the range figures.
Total Number of Health
Workers Providing InformationPercentage of Health Workers Who Provided Information to Patient/ Caregiver on How to Take/Give the Recommended Medicine(s)
= Total Number of Encounters × 100
If, for 20 health facilities surveyed, data for a sample of 20 patient encounters showed that in 16 encounters, health workers provided some information to the patient on how to give the recommended medicine(s), then the average for all facilities would be calculated as follows—
16 Percentage of Health Workers Who Provided Information to Patient/ Caregiver on How to Take/Give the Recommended Medicine(s)
= 20 × 100 = 80%
If, for 20 retail pharmaceutical outlets surveyed, data for a sample of 20 patient/caregiver encounters showed that 15 were provided with some information on how to take/give the recommended medicine(s), then the average for all retail pharmaceutical outlets would be calculated as follows—
15Percentage of Health Workers Who Provided Information to Patient/ Caregiver on How to Take/Give the Recommended Medicine(s)
= 20 × 100 = 75%
Presentation: In a survey of 20 health facilities in the example country, an average of 80
percent of health workers provided some information to patients/caregivers on how to take/give the recommended medicine(s).

Annex 2. PMM Indicators
147
In a survey conducted at 20 retail pharmaceutical outlets in the same country, an average of 75 percent of health workers provided some information to patients/ caregivers on how to take/give the recommended medicine(s).
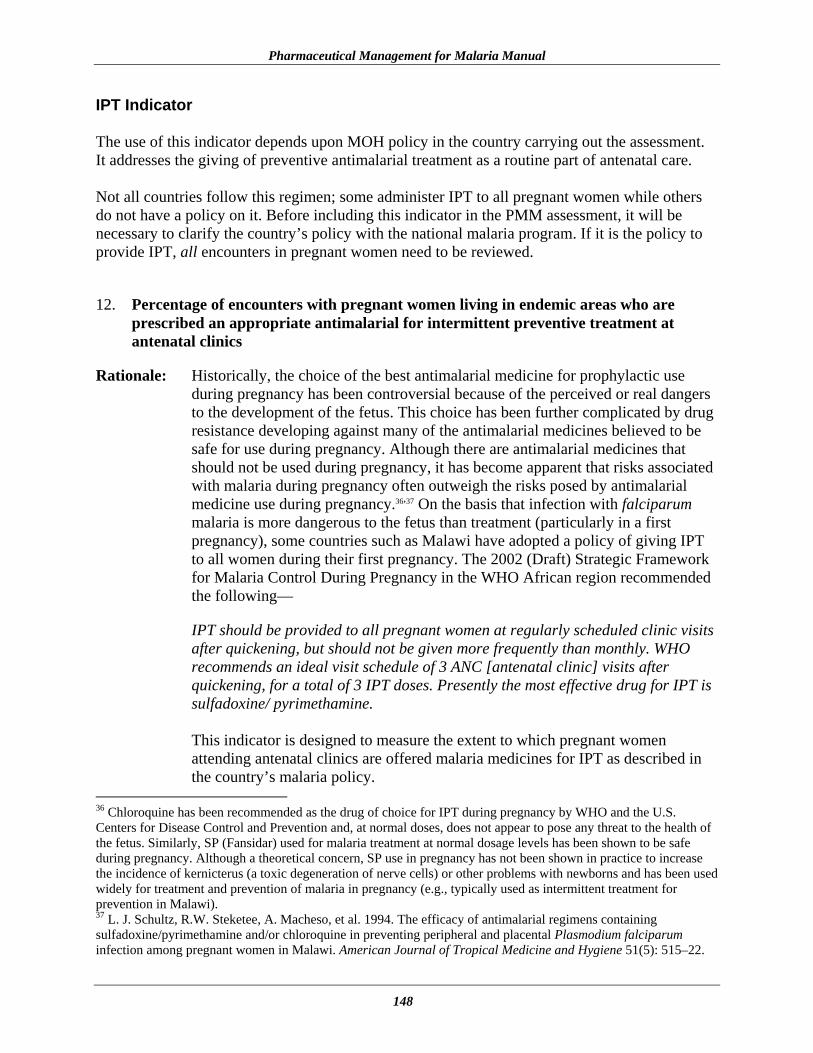
Pharmaceutical Management for Malaria Manual
148
IPT Indicator The use of this indicator depends upon MOH policy in the country carrying out the assessment. It addresses the giving of preventive antimalarial treatment as a routine part of antenatal care. Not all countries follow this regimen; some administer IPT to all pregnant women while others do not have a policy on it. Before including this indicator in the PMM assessment, it will be necessary to clarify the country’s policy with the national malaria program. If it is the policy to provide IPT, all encounters in pregnant women need to be reviewed.
12. Percentage of encounters with pregnant women living in endemic areas who are prescribed an appropriate antimalarial for intermittent preventive treatment at antenatal clinics
Rationale: Historically, the choice of the best antimalarial medicine for prophylactic use during pregnancy has been controversial because of the perceived or real dangers to the development of the fetus. This choice has been further complicated by drug resistance developing against many of the antimalarial medicines believed to be safe for use during pregnancy. Although there are antimalarial medicines that should not be used during pregnancy, it has become apparent that risks associated with malaria during pregnancy often outweigh the risks posed by antimalarial medicine use during pregnancy.36,37 On the basis that infection with falciparum malaria is more dangerous to the fetus than treatment (particularly in a first pregnancy), some countries such as Malawi have adopted a policy of giving IPT to all women during their first pregnancy. The 2002 (Draft) Strategic Framework for Malaria Control During Pregnancy in the WHO African region recommended the following—
IPT should be provided to all pregnant women at regularly scheduled clinic visits after quickening, but should not be given more frequently than monthly. WHO recommends an ideal visit schedule of 3 ANC [antenatal clinic] visits after quickening, for a total of 3 IPT doses. Presently the most effective drug for IPT is sulfadoxine/ pyrimethamine.
This indicator is designed to measure the extent to which pregnant women attending antenatal clinics are offered malaria medicines for IPT as described in the country’s malaria policy.
36 Chloroquine has been recommended as the drug of choice for IPT during pregnancy by WHO and the U.S. Centers for Disease Control and Prevention and, at normal doses, does not appear to pose any threat to the health of the fetus. Similarly, SP (Fansidar) used for malaria treatment at normal dosage levels has been shown to be safe during pregnancy. Although a theoretical concern, SP use in pregnancy has not been shown in practice to increase the incidence of kernicterus (a toxic degeneration of nerve cells) or other problems with newborns and has been used widely for treatment and prevention of malaria in pregnancy (e.g., typically used as intermittent treatment for prevention in Malawi). 37 L. J. Schultz, R.W. Steketee, A. Macheso, et al. 1994. The efficacy of antimalarial regimens containing sulfadoxine/pyrimethamine and/or chloroquine in preventing peripheral and placental Plasmodium falciparum infection among pregnant women in Malawi. American Journal of Tropical Medicine and Hygiene 51(5): 515–22.

Annex 2. PMM Indicators
149
Definition: Where there is a policy, the medicine of choice will probably be either chloroquine or SP. The recommended regimen for non-HIV-infected women is to administer the dosage for an initial treatment of malaria during the second trimester of the pregnancy and then to repeat this practice during the third trimester. For women in areas with a high incidence of HIV infection, the regimen is monthly. Before including this indicator in the PMM assessment, it will be necessary to clarify the country’s policy with the national malaria program.
Data Collection:
Where to Go Whom to Ask What to Get
20 MOH health facilities Medical Records Officer/Health Facility Manager/Pharmacist
Identify a sample of 30 antenatal encounters per health facility and determine the number of prescribed antimalarials. Identify encounters either retrospectively by consulting daily registers, patient records, and prescription slips, or prospectively through observation.
All encounters with pregnant women must be selected. National guidelines should be consulted and followed on this point to determine what is recommended in the country. Before the study, organizers should decide which antimalarial is the appropriate one for the area where the survey takes place. Efforts should be made first to gather the data retrospectively from medical records. If the data are not available from records, as an alternative, the data can be collected prospectively from observation. In many areas malaria is seasonal, which may limit the usefulness of the prospective data collection if the survey falls outside the malaria season. (See description of sampling methods in Chapter 2, Selecting Data Collection Sites.) All medicines prescribed should be transcribed on the data collection forms. Count the number of encounters in which an antimalarial was prescribed. See DUS-1B: Medical Records and Facility Review Form and DUS-2: Observation of Health Worker Data Form in Annex 1.
Computation For each facility in a sample, the indicator is recorded as a percentage of the & Example: total number of antenatal encounters surveyed. The percentage is computed by
dividing the number of antenatal encounters during which an antimalarial is prescribed for IPT by the total number of antenatal encounters surveyed, and
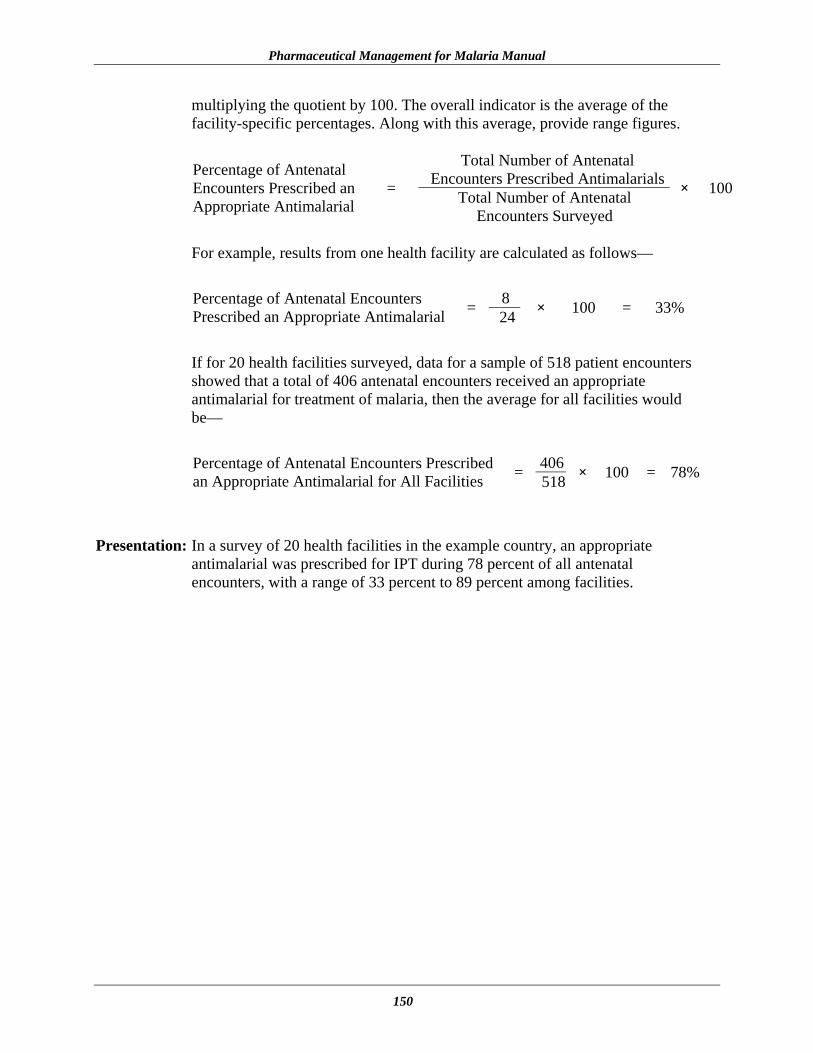
Pharmaceutical Management for Malaria Manual
150
multiplying the quotient by 100. The overall indicator is the average of the facility-specific percentages. Along with this average, provide range figures.
Total Number of Antenatal
Encounters Prescribed AntimalarialsPercentage of Antenatal Encounters Prescribed an Appropriate Antimalarial
= Total Number of Antenatal Encounters Surveyed
× 100
For example, results from one health facility are calculated as follows—
8 Percentage of Antenatal Encounters Prescribed an Appropriate Antimalarial = 24 × 100 = 33%
If for 20 health facilities surveyed, data for a sample of 518 patient encounters showed that a total of 406 antenatal encounters received an appropriate antimalarial for treatment of malaria, then the average for all facilities would be—
406Percentage of Antenatal Encounters Prescribed an Appropriate Antimalarial for All Facilities = 518 × 100 = 78%
Presentation: In a survey of 20 health facilities in the example country, an appropriate
antimalarial was prescribed for IPT during 78 percent of all antenatal encounters, with a range of 33 percent to 89 percent among facilities.

Annex 2. PMM Indicators
151
Supplemental Indicators For the purpose of this manual, supplemental indicators are defined as indicators that may be helpful but are not generally essential to an understanding of the pharmaceutical management system for malaria. Four supplemental indicators can be used, one as part of the Drug Availability Study and three Drug Use indicators that pertain to case management. These supplemental indicators are not to be considered as essential to understanding pharmaceutical management for malaria; however, they are useful for understanding the extent of the inventory control problems and how malaria is treated. The forms have been designed to collect information on these indicators. If these indicators are not used, some adjustments to the forms will be necessary. 13. Average percentage of individual variation for a set of indicator medicines in MOH
storage and health facilities (C/R/F) Rationale: Stock record-keeping systems that are significantly inaccurate are of limited use
for monitoring the status of inventory and for controlling leakage and wastage of stock. Average percentage of individual variation measures the degree to which stock record-keeping systems reflect the real status of medicines in stock. As a measure, it indicates the magnitude of discrepancy between records and the real stock levels of individual items.
Definition: The average percentage of individual variation is the weighted average of the
absolute differences between recorded stock levels and physical counts for the same list of indicator medicines.
Data Collection:
Where to Go Whom to Ask What to Get
Central Medical Store Inventory Officer/Storekeeper
Regional Medical Store Manager
20 MOH health facilities Dispenser/Pharmacist/ Storekeeper
Most-accurate records of current stock levels for each PMM antimalarial medicine, issues and receipts not entered, method of recording stocks, and physical count of unexpired stock levels
This indicator is based on the list of PMM antimalarial medicines used to treat malaria developed by study organizers (see Chapter 2, Preparing the Tracer List of PMM Antimalarial Medicines). Visit the CMS, at least one regional store if they exist in the system, and a sample of 20 health facilities. At each site, carry out the following procedure—

Pharmaceutical Management for Malaria Manual
152
• Ask staff to produce the most-accurate records of current stock level for each of the PMM antimalarial medicines. Ask them to produce their records for any recent issues or receipts that have not been posted in their stock level records. Using recent stock receipt and issue figures, stock records should be adjusted to bring them up to date. The physical count should then be compared to the adjusted stock record figures.
• Take note of the means used to produce these estimates (computerized
system, manual ledgers, bin cards). If bin cards exist, and if they were not used to produce the best estimates, obtain a second set of data based on bin cards as a point of comparison. For reporting purposes, however, use the figures prepared by the staff for the data collection team.
• Finally, carry out a physical count of the unexpired stock levels for these
medicines, and record the number of units for each PMM antimalarial medicine in stock. The expired units should not be counted. Antimalarial medicines that are not normally stocked by the facility should be excluded.
• All pack sizes and presentations should be included separately for this
indicator. See DAS-2A through DAS-2D: Inventory Data Forms in Annex 1. Computation To calculate the average percentage of individual variation, carry out the & Example: following steps.
For each medicine on the indicator list, determine the absolute value of individual variation, as follows— Subtract the physical count from the recorded quantity (ledger or bin cards). Record that result as an absolute value by removing any negative signs. All results should be expressed as positive numbers. Absolute Value of Variation = Recorded Quantity – Physical Count
Calculate the percentage of variation for each indicator medicine as follows— Divide the absolute variation by the recorded quantity, and multiply that quotient by 100 for the percentage of individual variation.
Percentage of Individual Variation Recorded Quantity = Absolute Value of Variation × 100
Determine the average percentage of individual variation by adding all of the percentages of individual variations and dividing by the total number of percentages of variation calculated.

Annex 2. PMM Indicators
153
Sum of Percentages of Individual Variations Average Percentage
of Individual Variation = Individual Total Number of Percentages Calculated
This indicator may be calculated for both computerized stock records/ledgers and bin cards at the Central Medical Store, at a sample of Regional or District Medical Stores, and at a sample of health facilities, depending on the state of the record-keeping systems. It is important, however, to record the following information for all data collected and all indicators computed: the site visited and which record-keeping systems (i.e., computerized systems, ledgers, or bin cards) have been assessed.
To calculate the percentage of stock records that correspond exactly with physical counts, carry out the following steps—
Product Record Count Recorded Quantity Physical Count Chloroquine 200 mg tablets 1000 900
The percentage of individual variation for chloroquine is calculated as: 1. 1000 – 900 = 100 2. 100 × 100 = 10% 1000 3. Finally, the average percentage of individual variation for all three products
(chloroquine, quinine, and Fansidar, as in the example for Indicator 4) is calculated as follows—
Average Percentage of Individual Variation = 10 + 12.5 + 71.4 = 31.3%
Presentation: At the Central Medical Store in the example country, the average percentage of
individual variation for the set of PMM indicator medicines was calculated as 31.3 percent.

Pharmaceutical Management for Malaria Manual
154
14. Percentage of encounters where health workers asked one or more clinical questions to determine severity of malaria (F)
Rationale: The management of malaria requires that health workers assess and treat every
sick child coming to the health facility in a comprehensive manner. Observing whether health workers ask clinical questions regarding the condition will allow identification of areas where training should focus.
Definition: An encounter is defined as a session in which the health worker is focusing on one
child. If a caregiver consults a health worker about each of her two children, the consultation regarding each child is considered a separate encounter.
This indicator targets instances where one or more clinical questions were asked.
Clinical questions include questions that assess whether the person is in critical condition, (e.g., is the patient vomiting or having convulsions).
Data Collection:
Where to Go Whom to Ask What to Get
20 MOH health facilities Health facility supervisor for permission to observe
Observe 10 to 15 encounters for children aged two months to five years for any health problem in each health facility.
Working in teams of two, follow the procedures outlined in Chapter 3, Collecting
the Data. The data collector as observer will be located in the examination room, close enough to the health worker to be able to hear and observe the interaction clearly and accurately. The data collector must be as unobtrusive as possible and not disrupt the consultation. Any active role by the data collector during the consultation could bias the responses of the caregiver or the behavior of the health worker. If the data collector is engaged in any interaction during a consultation, that observation should not be considered part of the study and another consultation should be surveyed in its place. A new observation questionnaire should be completed for each infant or child seen.
The data collector should listen to ensure that the health worker asks at least one
of the following questions (the wording of the questions may vary)38—
• Are you (or the child) vomiting? • Have you (or the child) had convulsions or attacks? • Were you (or the child) unconscious?
38WHO. September 1996. Integrated Management of Childhood Illness Process Course. (ODUS/HCP/HCT/ARI/CDD/96.4L); Assess and Classify the Sick Child.

Annex 2. PMM Indicators
155
If the data collector does not hear any of those questions or questions that are asking the same thing in different words, the encounter can be counted as one with no clinical questions.
See DUS-2: Observation of Health Workers Data Form in Annex 1. Computation This indicator is a percentage. It is computed by dividing the total number of & Example: health workers asking one or more clinical questions by the total number of
encounters and multiplying that quotient by 100, to convert the decimal to a percentage. Along with this average, provide the range figures.
Total Number of Practitioners Asking One or More Clinical Questions
Percentage of Health Workers Who Ask One or More Clinical Questions
= Total Number of Encounters × 100
Results from one health facility are calculated as follows—
7 Percentage of Health Workers Who Ask One or More Clinical Questions from IMCI Guidelines
= 13 × 100 = 53.8%
If a survey of 20 health facilities were conducted through observation of health workers, results from all health facilities would be calculated as follows—
185Percentage of Health Workers Who
Ask One or More Clinical Questions = 285 × 100 = 65.0%
Presentation: In a survey of 285 encounters in 20 health facilities, 65.0 percent of encounters
included one or more clinical questions, with a range from 34.5 to 86.7 percent.
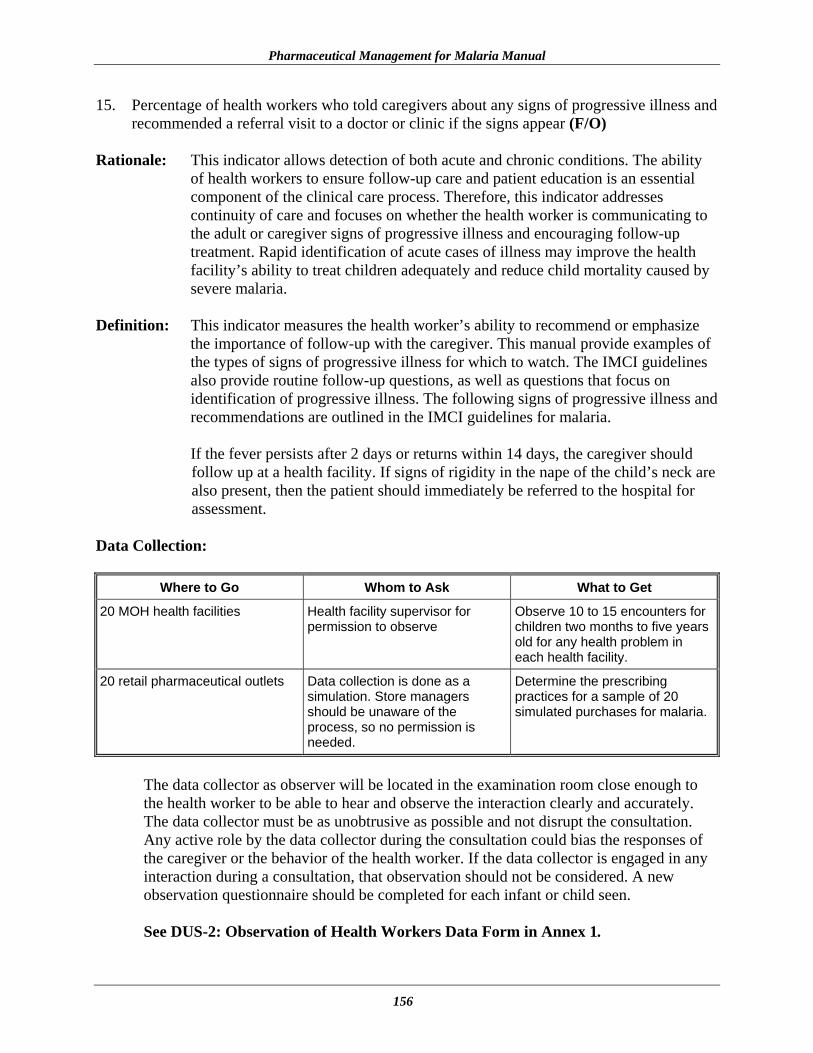
Pharmaceutical Management for Malaria Manual
156
15. Percentage of health workers who told caregivers about any signs of progressive illness and recommended a referral visit to a doctor or clinic if the signs appear (F/O)
Rationale: This indicator allows detection of both acute and chronic conditions. The ability
of health workers to ensure follow-up care and patient education is an essential component of the clinical care process. Therefore, this indicator addresses continuity of care and focuses on whether the health worker is communicating to the adult or caregiver signs of progressive illness and encouraging follow-up treatment. Rapid identification of acute cases of illness may improve the health facility’s ability to treat children adequately and reduce child mortality caused by severe malaria.
Definition: This indicator measures the health worker’s ability to recommend or emphasize
the importance of follow-up with the caregiver. This manual provide examples of the types of signs of progressive illness for which to watch. The IMCI guidelines also provide routine follow-up questions, as well as questions that focus on identification of progressive illness. The following signs of progressive illness and recommendations are outlined in the IMCI guidelines for malaria.
If the fever persists after 2 days or returns within 14 days, the caregiver should follow up at a health facility. If signs of rigidity in the nape of the child’s neck are also present, then the patient should immediately be referred to the hospital for assessment.
Data Collection:
Where to Go Whom to Ask What to Get
20 MOH health facilities Health facility supervisor for permission to observe
Observe 10 to 15 encounters for children two months to five years old for any health problem in each health facility.
20 retail pharmaceutical outlets Data collection is done as a simulation. Store managers should be unaware of the process, so no permission is needed.
Determine the prescribing practices for a sample of 20 simulated purchases for malaria.
The data collector as observer will be located in the examination room close enough to the health worker to be able to hear and observe the interaction clearly and accurately. The data collector must be as unobtrusive as possible and not disrupt the consultation. Any active role by the data collector during the consultation could bias the responses of the caregiver or the behavior of the health worker. If the data collector is engaged in any interaction during a consultation, that observation should not be considered. A new observation questionnaire should be completed for each infant or child seen.
See DUS-2: Observation of Health Workers Data Form in Annex 1.
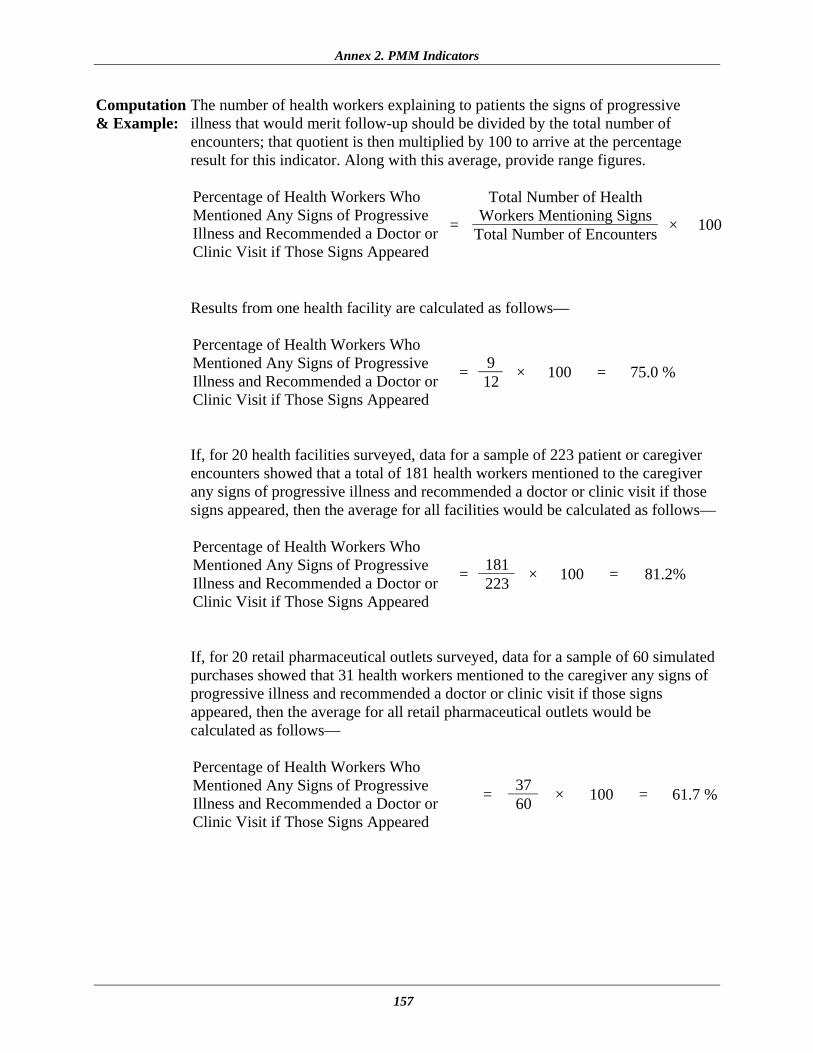
Annex 2. PMM Indicators
157
Computation The number of health workers explaining to patients the signs of progressive & Example: illness that would merit follow-up should be divided by the total number of
encounters; that quotient is then multiplied by 100 to arrive at the percentage result for this indicator. Along with this average, provide range figures.
Total Number of Health
Workers Mentioning Signs Percentage of Health Workers Who Mentioned Any Signs of Progressive Illness and Recommended a Doctor or Clinic Visit if Those Signs Appeared
= Total Number of Encounters × 100
Results from one health facility are calculated as follows—
9Percentage of Health Workers Who Mentioned Any Signs of Progressive Illness and Recommended a Doctor or Clinic Visit if Those Signs Appeared
= 12 × 100 = 75.0 %
If, for 20 health facilities surveyed, data for a sample of 223 patient or caregiver encounters showed that a total of 181 health workers mentioned to the caregiver any signs of progressive illness and recommended a doctor or clinic visit if those signs appeared, then the average for all facilities would be calculated as follows—
181Percentage of Health Workers Who Mentioned Any Signs of Progressive Illness and Recommended a Doctor or Clinic Visit if Those Signs Appeared
= 223 × 100 = 81.2%
If, for 20 retail pharmaceutical outlets surveyed, data for a sample of 60 simulated purchases showed that 31 health workers mentioned to the caregiver any signs of progressive illness and recommended a doctor or clinic visit if those signs appeared, then the average for all retail pharmaceutical outlets would be calculated as follows—
37Percentage of Health Workers Who Mentioned Any Signs of Progressive Illness and Recommended a Doctor or Clinic Visit if Those Signs Appeared
= 60 × 100 = 61.7 %

Pharmaceutical Management for Malaria Manual
158
Presentation: In a survey of 20 health facilities in the example country, an average of 81.2 percent of health workers communicated to patients or caregivers about signs of progressive illness and recommended a doctor or clinic visit if those signs appeared, with a range from 67 to 91 percent among health facilities.
In a survey conducted at 20 retail pharmaceutical outlets in the same country, an
average of 61.7 percent of health workers communicated to patients or caregivers about signs of progressive illness and recommended a doctor or clinic visit if those signs appeared.
The education of patients and caregivers is an important part of any malaria
control strategy. Follow-up with patients and caregivers will ensure that cases gain attention prior to becoming acute and will give the health facilities greater opportunity to reduce mortality.

Annex 2. PMM Indicators
159
16. Percentage of health workers who prescribed an ineffective antimalarial (one that is no longer recommended) (F/O)
Rationale: This indicator allows the detection of the use of an antimalarial that is no longer
recommended or is no longer used because of its ineffectiveness. The indicator assesses the percentage of patients who are receiving an outdated antimalarial from health workers. Identification of this inappropriate use will permit interventions to be instituted and improve case management of malaria.
Definition: This indicator measures the extent to which health workers are prescribing
ineffective antimalarials that are no longer recommended, such as use of chloroquine in areas where chloroquine resistance has developed.
Before embarking on this data collection exercise, the study coordinators are required to determine which medicines are considered ineffective and inappropriate. The classification of appropriate and inappropriate must be carried out by the study coordinators after the forms have been collected and before the analysis takes place. Data Collection:
Where to Go Whom to Ask What to Get
20 MOH health facilities Health facility supervisor for permission to observe
Observe 10 to 15 encounters for malaria in each health facility.
20 retail pharmaceutical outlets Data collection is done as a simulation. Store managers should be unaware of the process, so no permission is needed.
Determine the prescribing practices for a sample of 20 simulated purchases for malaria.
The data collector as observer will be located in the examination room close enough to the health worker to be able to hear and observe the interaction clearly and accurately. The data collector must be as unobtrusive as possible and not disrupt the consultation. Any active role by the data collector during the consultation could bias the responses of the caregiver or the behavior of the health worker. If the data collector is engaged in any interaction during a consultation, that observation should not be considered. A new observation questionnaire should be completed for each infant or child seen.
See DUS-2: Observation of Health Workers Data Form in Annex 1.
Computation The number of health workers who prescribe an ineffective antimalarial should be & Example: divided by the total number of encounters; that quotient is multiplied by 100 to
provide the percentage result for this indicator. Along with this average, provide range figures.

Pharmaceutical Management for Malaria Manual
160
Number of Health Workers Prescribing Ineffective Antimalarial Percentage of Health Workers
Who Prescribed an Ineffective Antimalarial
= Total Number of Encounters × 100
Results from one health facility are calculated as follows—
3 Percentage of Health Workers Who Prescribed an Ineffective Antimalarial = 12 × 100 = 25%
If, for 20 health facilities surveyed, data for a sample of 223 patient or caregiver encounters showed that a total of 50 health workers prescribed chloroquine when the first-line treatment for malaria has been changed to sulfadoxine/pyrimethamine, for example, then the average for all facilities would be calculated as follows—
50 Percentage of Health Workers Who
Prescribed an Ineffective Antimalarial = 223 × 100 = 22.4%
If, for 20 retail pharmaceutical outlets surveyed, data for a sample of 60 simulated purchases showed that 16 health workers recommended an antimalarial that is no longer effective, the average for all retail pharmaceutical outlets would be calculated as follows—
16 Percentage of Health Workers Who
Prescribed an Ineffective Antimalarial = 60 × 100 = 26.7%
Presentation: In a survey of 20 health facilities in the example country, an average of 22.4
percent of health workers prescribed an ineffective antimalarial, with a range from 15 to 29 percent among health facilities.
In a survey conducted at 20 retail pharmaceutical outlets in the same country, an
average of 26.7 percent of health workers prescribed an ineffective antimalarial. Providing information to and training for health workers is an important part of
any malaria control strategy. Programs must ensure that all health workers are aware of any changes in treatment guidelines to prevent mortality caused by continued prescribing of an ineffective antimalarial.

161
ANNEX 3. SAMPLE FORMAT FOR PRESENTING PMM INDICATOR DATA Drug Availability Study Indicators
Indicator Name Computation Rationale Results
(Example Only) 1. Percentage of median
international price paid for a set of PMM antimalarial medicines that were part of the last regular MOH procurement
(a) Individual medicine: MOH Unit Price × 100 Median International Unit Price (b) All medicines: Sum of Percentages of All Antimalarial Medicines Total Number of Antimalarial Medicines
To determine potential savings that the MOH could achieve with improved procurement practices
206.0%
2. Average percentage of a set of unexpired PMM antimalarial medicines available in (a) MOH storage and health facilities, (b) formal private health facilities, and (c) retail pharmaceutical outlets
(a) Each facility & retail pharmaceutical outlet: Number of Antimalarial Medicines with Unexpired Stock × 100 Total Number of Antimalarial Medicines Normally Stocked
(b) All facilities & retail pharmaceutical outlets: Sum of Average Percentage for Each Facility/Retail Outlet Total Number of Facilities/Outlets in Sample
To ensure successful implementation of a malaria medicine policy by having medicines available so that patients receive proper treatment
48% (MOH facility) 32% (retail outlet)
3. Average percentage of time out of stock for a set of PMM antimalarial medicines in MOH storage and health facilities
(a) Each medicine: Record the Number of Days Out of Stock for Past 12 Months (b) All medicines: Add Total Numbers of Days Out of Stock for Past 12 Months (c) Average Total Number of Stock-Out Days for All Antimalarial Medicines ×
100 365 × Total Number of Antimalarial Medicines Normally Stocked
To ensure successful implementation of a malaria medicine policy by maintaining medicine availability 40.5%
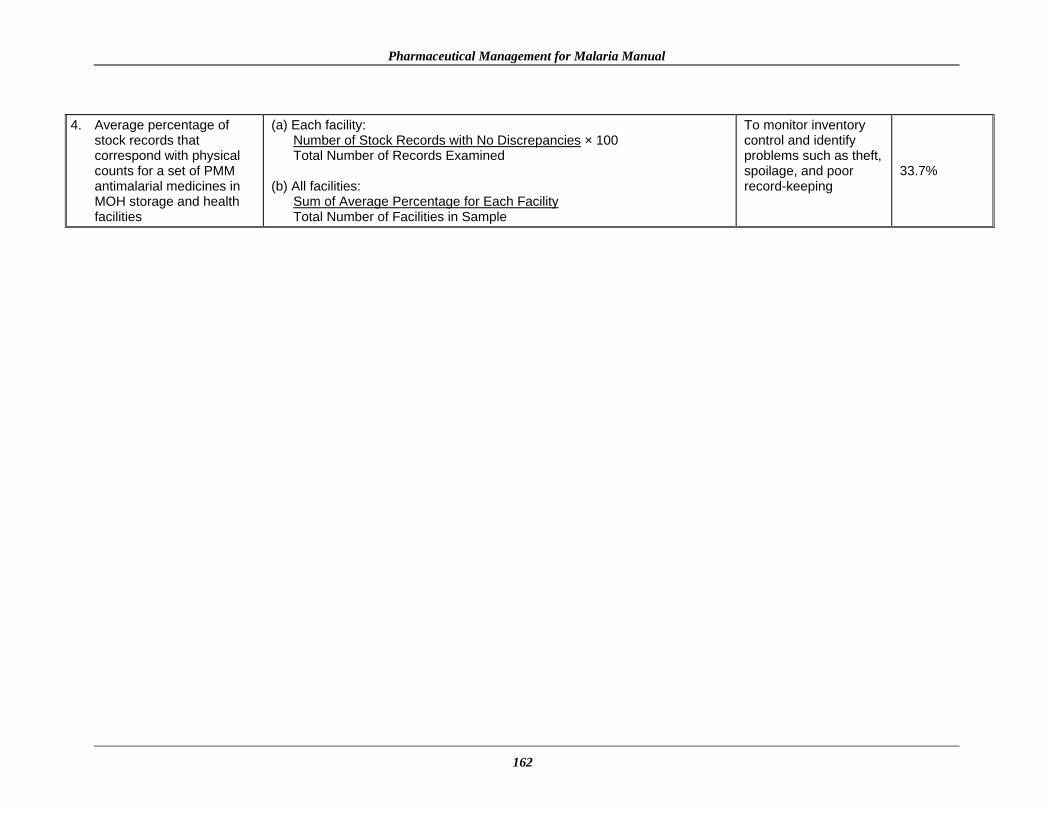
Pharmaceutical Management for Malaria Manual
162
4. Average percentage of
stock records that correspond with physical counts for a set of PMM antimalarial medicines in MOH storage and health facilities
(a) Each facility: Number of Stock Records with No Discrepancies × 100 Total Number of Records Examined
(b) All facilities:
Sum of Average Percentage for Each Facility Total Number of Facilities in Sample
To monitor inventory control and identify problems such as theft, spoilage, and poor record-keeping
33.7%

Annex 3. Sample Format for Presenting PMM Indicator Data
163
Drug Use Study Indicators
Indicator Name Computation Rationale Results
(Example Only) 5. Percentage of MOH health
facilities visited that had a copy of the official treatment guidelines for malaria
Number of Facilities with Manual × 100 Number of Facilities in Sample
To measure the level of access to information for promoting effective care and management of malaria based on national standard treatment guidelines
45.0%
6. Percentage of encounters with patients diagnosed with uncomplicated malaria who are prescribed an antimalarial consistent with treatment guidelines
Total Number of Malaria Encounters Prescribed Appropriate Antimalarial × 100 Total Number of Malaria Encounters
To identify whether practitioners are complying with treatment guidelines
MOH: 78.4% (n=518) Retail pharma-ceutical outlet: 70.0% (n=20)
7. Percentage of encounters with patients diagnosed with uncomplicated malaria who are prescribed quantities of appropriate antimalarials sufficient to complete a full course of treatment
(a) MOH facilities:
Number of Malaria Prescriptions Sufficient for a Full Course × 100 Number of Malaria Prescriptions
(b) Retail pharmaceutical outlets:
Number of Malaria Prescriptions/Recommendations Sufficient for a Full Course × 100 Number of Malaria Prescriptions/Recommendations
To measure the extent to which the quantity of medicines prescribed is sufficient to complete a full course of treatment, which is a key element of any strategy to slow the spread of resistance
MOH: 84% Retail pharma-ceutical outlets: 65%
8. Percentage of prescribed antimalarial medicines actually dispensed by public health facilities
Number of Prescribed Medicines Actually Dispensed × 100 Number of Prescribed Medicines Presented for Dispensing
To measure the ability of the health facility to dispense prescribed medicines to patients/caregivers, i.e., the availability of appropriate medicines in health facilities
MOH: 74.0% (n=155)

Pharmaceutical Management for Malaria Manual
164
Indicator Name Computation Rationale Results
(Example Only) 9. Average cost of medicines
prescribed as a percentage of costs if STGs were followed
(a) Total Cost of All Medicines Prescribed for Malaria Encounter × 100 Total Cost of Medicines Recommended by STGs
(b) Sum of Percentage of Costs of All Facilities × 100
Total Number of Facilities in Sample
To gain control over costs, assuming that malaria STGs represent the optimal cost
MOH: 335% Retail pharma-ceutical outlet: 410%
10. Percentage of malaria patients/caregivers who could correctly describe how to take/give the prescribed antimalarial medication
Total Number of Patients/Caregivers Who Correctly Describe How to Take/Give Medication × 100 Total Number of Patients/Caregivers Interviewed
To measure potential for nonadherence and treatment failure caused by patients/caregivers who do not know how to take/give the medicine properly
MOH: 52.1% (n=194)
11. Percentage of health workers and retail pharmaceutical outlets that provided some information to malaria patients/caregivers on how to take/give the recommended medicine(s)
(a) Health facilities: Total Number of Health Workers Providing Information × 100 Total Number of Encounters (b) Retail pharmaceutical outlets: Total Number of Retail Outlets Providing Information × 100 Total Number of Encounters
To determine whether malaria STGs are being followed by health care workers and monitor whether health workers are providing enough information to patients
MOH: 74.6% (n=245) Retail pharma-ceutical outlet: 58.3% (n=60)

Annex 3. Sample Format for Presenting PMM Indicator Data
165
IPT Indicator
Indicator Name Computation Rationale Results
(Example Only) 12. Percentage of encounters
with pregnant women living in endemic areas who are prescribed appropriate antimalarial IPT at antenatal clinics
Total Number of Antenatal Encounters Prescribed Antimalarials × 100 Total Number of Antenatal Encounters Surveyed
To measure the extent to which pregnant women attending antenatal clinics are offered malaria medicines consistent with STGs as a prophylactic as described in the country’s malaria policy (If giving prophylactics during pregnancy is not part of national policy then this indicator is not applicable.)
MOH: 35%
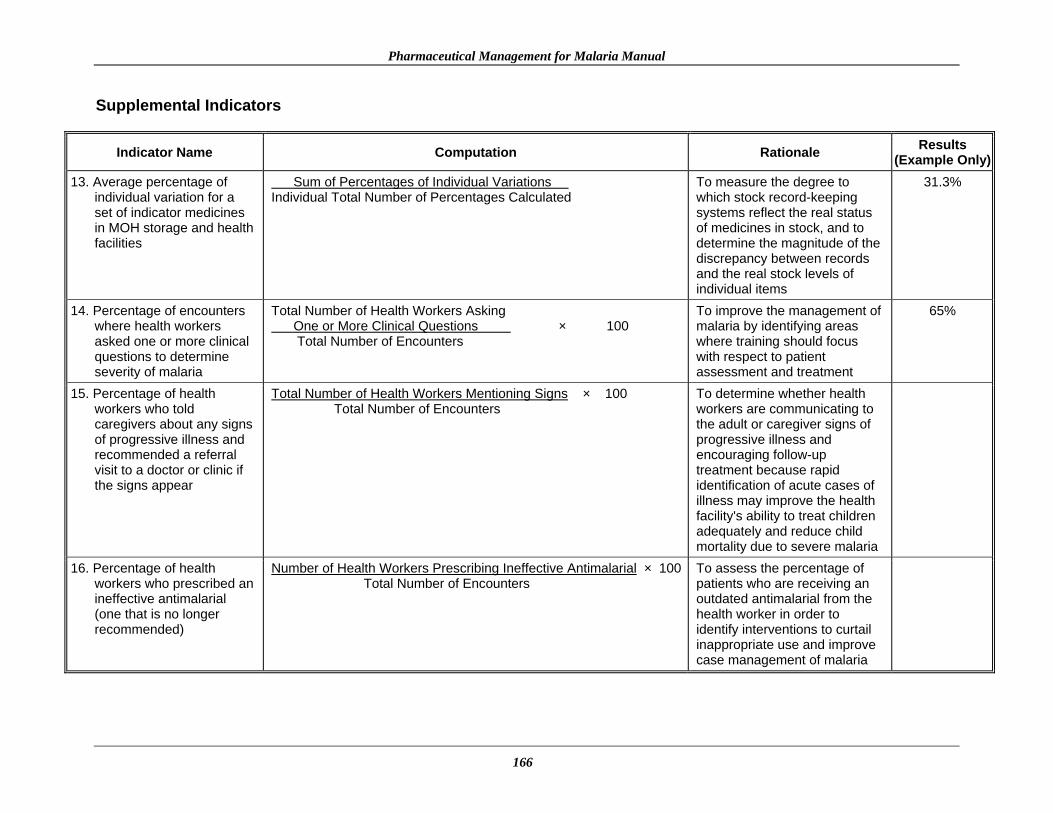
Pharmaceutical Management for Malaria Manual
166
Supplemental Indicators
Indicator Name Computation Rationale Results (Example Only)
13. Average percentage of individual variation for a set of indicator medicines in MOH storage and health facilities
Sum of Percentages of Individual Variations Individual Total Number of Percentages Calculated
To measure the degree to which stock record-keeping systems reflect the real status of medicines in stock, and to determine the magnitude of the discrepancy between records and the real stock levels of individual items
31.3%
14. Percentage of encounters where health workers asked one or more clinical questions to determine severity of malaria
Total Number of Health Workers Asking One or More Clinical Questions × 100 Total Number of Encounters
To improve the management of malaria by identifying areas where training should focus with respect to patient assessment and treatment
65%
15. Percentage of health workers who told caregivers about any signs of progressive illness and recommended a referral visit to a doctor or clinic if the signs appear
Total Number of Health Workers Mentioning Signs × 100 Total Number of Encounters
To determine whether health workers are communicating to the adult or caregiver signs of progressive illness and encouraging follow-up treatment because rapid identification of acute cases of illness may improve the health facility's ability to treat children adequately and reduce child mortality due to severe malaria
16. Percentage of health workers who prescribed an ineffective antimalarial (one that is no longer recommended)
Number of Health Workers Prescribing Ineffective Antimalarial × 100 Total Number of Encounters
To assess the percentage of patients who are receiving an outdated antimalarial from the health worker in order to identify interventions to curtail inappropriate use and improve case management of malaria
Annex 3. Sample Format for Presenting PMM Indicator Data
167

169
REFERENCES
International Network for Rational Use of Drugs (INRUD) Social Scientists Working Group.
December 1996. How to Use Qualitative Methods to Design Drug Use Interventions (Working Draft). Arlington, VA: Management Sciences for Health.
Management Sciences for Health. 1997. Managing Drug Supply: The Selection, Procurement,
Distribution, and Use of Pharmaceuticals in Primary Health Care. 2nd ed. West Hartford, CT: Kumarian Press.
Marsh, K. 1998. Malaria disaster in Africa. Lancet 352(9132): 924–25. McFadyen, Julie E., ed. 2004. International Drug Price Indicator Guide. 2003 edition. Boston,
MA: Management Sciences for Health. Schultz, L. J., R. W. Steketee, A. Macheso, P. Kazembe, L. Chitsulo, and J. J. Wirima. 1994. The
efficacy of antimalarial regimens containing sulfadoxine/pyrimethamine and/or chloroquine in preventing peripheral and placental Plasmodium falciparum infection among pregnant women in Malawi. Lancet 51 (5): 515–22.
Tanzania Ministry of Health (MOH). July 23, 1999. Report of the Task Force on Antimalarial
Drug Policy. Tanzania: MOH. Trape, J. F., G. Pison, M. P. Preziosi, C. Enel, A. Desgrees du Lou, V. Delaunay, B. Samb, E.
Lagarde, J. F. Molez, and F. Simondou. 1998. Impact of chloroquine resistance on malaria mortality. Comptes Rendus de l’Academie des Sciences, Serie III, Sciences de la Vie 321(8): 689–97.
White, N. J., F. Nosten, S. Looareesuwan, W. M. Watkins, K. Mars, R. W. Snow, G. Kokwaro, J.
Ouma, T. T. Hien, M. E. Molyneux, T. E. Taylor, C. I. Newbold, T. K. Ruebush II, M. Danis, B. M. Greenwood, R. M. Anderson, and P. Olliaro. 1999. Averting a malaria disaster. Lancet 353(9168): 1965–67.
World Health Organization, Malaria Programme DDC Division. May 1999. Framework for
developing, implementing, and updating antimalarial drug policy in Africa: A guide for country malaria control programmes, Draft 17, page 41. Harare, Zimbabe.
World Health Organization Expert Committee on Malaria. January 1999. Twentieth Report.
Geneva: WHO.

Pharmaceutical Management for Malaria Manual
170