Embed Size (px)
Citation preview

®
Trends In Global Relocation
G L O B A L M O B I L I T Y P O L I C Y & P R A C T I C E S P R O F I L E S
2016 SURVEY REPORT
PHARMAPharmaceuticals, Healthcare

CARTUS | 2016 GLOBAL MOBILITY POLICY & PRACTICES SURVEY | INDUSTRY PROFILES: PHARMA 2
I N D U S T R Y P R O F I L E S : P H A R M A
Industry Profiles examine the ways that individual industries approach key program practices and assignment policy features, based on data gathered in the
2016 Global Mobility Policy & Practices Survey.
A LOOK AT: THE PHARMA SECTOR
The Pharma industry is facing a number of challenges: less price flexibility, high consumer expectations, and slower adoption of new products are among the factors changing this industry. Overall, pricing is a leading factor changing the face of the industry globally, as different countries’ pricing guidelines change how companies focus their product development. The impact of pricing on profitability is key as well, as Pharma companies seek to stabilize market expectations in a continuously changing environment.
Mobility ActivityNine percent of the 176 respondents to Cartus’ 2016 Global Mobility Policy & Practices survey are companies in the Pharma industry. In terms of typical international relocation volume, Pharma industry companies differ from overall respondents in several areas—they have a greater concentration of smaller (25 or fewer) move volume (31% versus 21% of overall companies), and larger (251-500) move volume (19% versus 10% overall companies).
Based on survey results, Pharma industry companies outpaced companies overall in the growth of several move types over the past two years:
� 53% of Pharma sector respondents reported an increase in short-term assignments versus 44% overall
� 69% of Pharma companies reported an increase in the use of permanent transfers versus 54% overall
� 55% of Pharma companies reported an increase in the use of extended business travel versus 45% overall
� 63% of Pharma companies reported an increase in the use of commuter assignments versus 28% overall.
It is noteworthy that the pace of growth for Pharma companies that exceeds that of companies overall is the newer move types. For long-term assignments, the Pharma industry lagged behind overall companies, 13% vs 32%, respectively. All of this variability occurred during a time where the increase in overall global mobility activity was roughly the same in the Pharma industry (50%) as it was overall (52%).
9% of respondents were from the Pharma sector.
The pace of growth for Pharma companies exceeds that of companies overall in
the area of newer move types.

3 INDUSTRY PROFILES: PHARMA | 2016 GLOBAL MOBILITY POLICY & PRACTICES SURVEY | CARTUS
I N D U S T R Y P R O F I L E S : P H A R M A
Assignment Increases Higher Over Last Two Years Pharma Overall
Overall global mobility activity 50% 52%
Permanent transfer 69% 54%
Commuter assignments 63% 28%
Extended business travel 55% 45%
Short-term assignments 53% 44%
Localization 40% 42%
Sequential assignments 31% 18%
Developmental assignments 21% 35%
Rotational assignments 20% 32%
Long-term assignments 13% 32%
Overall company growth strategy was by far the most common reason for the increase in mobility activity overall for both the Pharma industry (75%) and companies overall (82%). The Pharma industry respondents, however, noted that expansion into emerging markets and merger & acquisition or divestment activity were the second and third most common factors contributing to growth in employee mobility over the past two years, at higher rates than companies overall. This may reflect the Pharma industry’s more mature position vis-à-vis employee mobility.
Factors Contributing to Increase Over Past Two Years Pharma Overall
Overall company growth strategy 75% 82%
Expansion into emerging markets 63% 45%
Merger & acquisition or divestment activity 50% 27%
Increased support for, or interest in, global mobility 38% 28%
Greater emphasis on career development 25% 34%
Talent not available locally 25% 55%
Trends in the Use of Leading Move Types in the Pharma IndustryFor Pharma industry respondents, the assignment form with the largest increase was permanent transfers, stated by 69% of respondents. The key driver of permanent transfers in the Pharma industry was lack of skills available locally, reported by 75% of Pharma industry respondents, much higher than the 58% of companies overall. In fact, all drivers except one were reported more frequently by Pharma industry respondents than by companies overall. Only employee initiated moves was cited as a reason for permanent relocation more frequently by companies overall (59%) than by Pharma industry respondents (50%).
For Pharma industry companies, the
assignment form with the largest increase
was permanent transfers, stated by
69% of respondents.

CARTUS | 2016 GLOBAL MOBILITY POLICY & PRACTICES SURVEY | INDUSTRY PROFILES: PHARMA 4
I N D U S T R Y P R O F I L E S : P H A R M A
Permanent Relocation Drivers Pharma Overall
Skills are not available locally 75% 58%
Containment of mobility costs 58% 51%
Employee initiated 50% 59%
New hire transfer 50% 43%
Part of a globalization strategy 50% 44%
Retention strategy 42% 24%
Permanent Transfers
As may be expected, employee resistance related to home country pension benefit plans led the list of challenges Pharma industry respondents reported when moving someone internationally on a permanent or indefinite basis, noted by 33% of Pharma industry participants versus 23% of respondents overall. Compensation challenges were roughly in line, reported by 25% of Pharma industry respondents and 29% of companies overall, and the third most common response—difference in taxation—was more significant challenge for overall companies (23%) than it was for Pharma industry respondents (17%).
Biggest Challenge for Permanent Relocation Pharma Overall
Employee resistance related to home country pension benefit plans
33% 23%
Compensation 25% 29%
Difference in taxation 17% 23%
Career development opportunities 8% 4%
Dealing with major expense items (e.g., sale of home residence)
8% 6%
Leaving extended family members behind 8% 6%
Identifying healthcare coverage 0% 2%
Commuter Assignments
Commuter assignments were the second most common assignment type identified by Pharma industry respondents over the past two years (63%), significantly higher than the 28% of overall companies that reported growth. Still, just 29% of Pharma industry respondents stated they have a commuter relocation policy, lower than companies overall at 39%, indicating that the growth may possibly have been unexpected.
Pharma industry respondents reported that 100% of their commuter assignments are within EMEA, which is the leading region for commuter assignments for companies overall (65%), with the Americas (20%) and APAC (15%) also having commuter assignment volume for overall companies.
While 63% of Pharma industry companies reported growth in
commuter assignments over the past two years, only 29% say they have a commuter relocation
policy in place.
5 INDUSTRY PROFILES: PHARMA | 2016 GLOBAL MOBILITY POLICY & PRACTICES SURVEY | CARTUS
I N D U S T R Y P R O F I L E S : P H A R M A
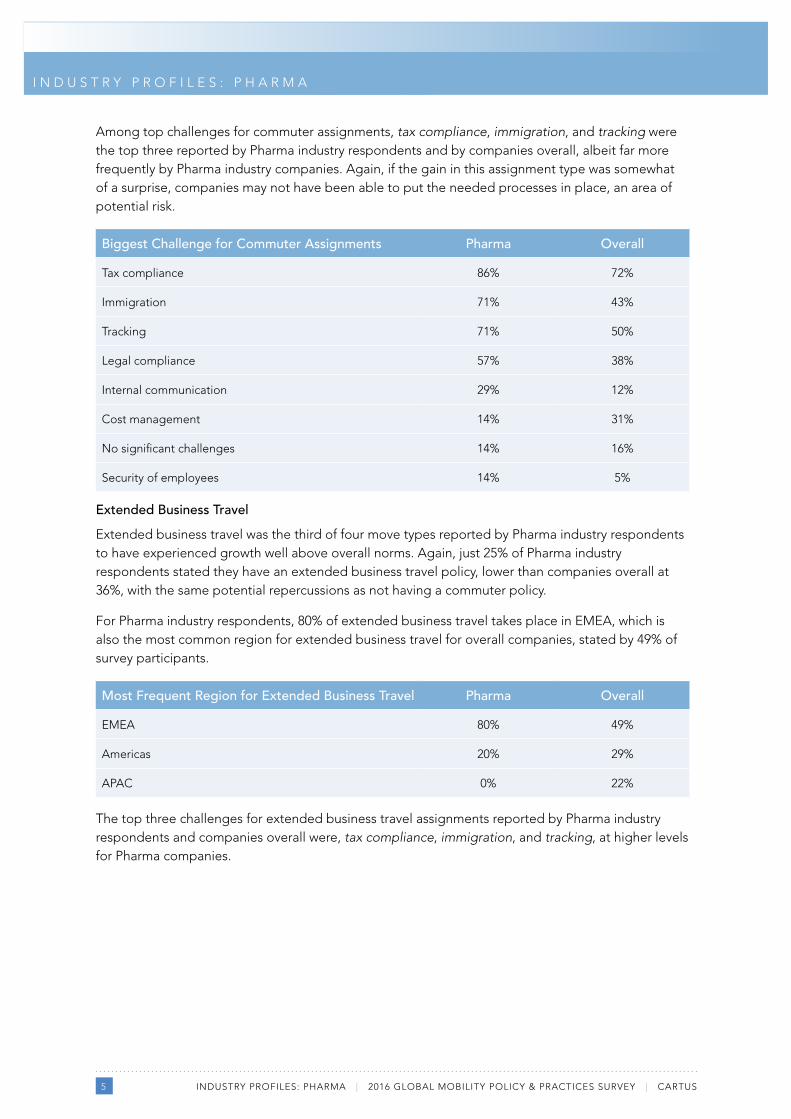
Among top challenges for commuter assignments, tax compliance, immigration, and tracking were the top three reported by Pharma industry respondents and by companies overall, albeit far more frequently by Pharma industry companies. Again, if the gain in this assignment type was somewhat of a surprise, companies may not have been able to put the needed processes in place, an area of potential risk.
Biggest Challenge for Commuter Assignments Pharma Overall
Tax compliance 86% 72%
Immigration 71% 43%
Tracking 71% 50%
Legal compliance 57% 38%
Internal communication 29% 12%
Cost management 14% 31%
No significant challenges 14% 16%
Security of employees 14% 5%
Extended Business Travel
Extended business travel was the third of four move types reported by Pharma industry respondents to have experienced growth well above overall norms. Again, just 25% of Pharma industry respondents stated they have an extended business travel policy, lower than companies overall at 36%, with the same potential repercussions as not having a commuter policy.
For Pharma industry respondents, 80% of extended business travel takes place in EMEA, which is also the most common region for extended business travel for overall companies, stated by 49% of survey participants.
Most Frequent Region for Extended Business Travel Pharma Overall
EMEA 80% 49%
Americas 20% 29%
APAC 0% 22%
The top three challenges for extended business travel assignments reported by Pharma industry respondents and companies overall were, tax compliance, immigration, and tracking, at higher levels for Pharma companies.

CARTUS | 2016 GLOBAL MOBILITY POLICY & PRACTICES SURVEY | INDUSTRY PROFILES: PHARMA 6
I N D U S T R Y P R O F I L E S : P H A R M A
Biggest Challenge for Extended Business Travel Pharma Overall
Tax compliance 100% 88%
Immigration 86% 76%
Tracking 86% 67%
Internal communication 57% 25%
Legal compliance 43% 35%
Cost management 29% 23%
Security of employees 14% 9%
Short-Term Assignments
Short-term assignments were identified by 53% of Pharma industry respondents as a high-growth move type over the past two years, higher than the 44% that reported this overall. Mirroring results from companies overall, top challenges for short-term assignments reported by Pharma industry respondents were tax compliance, immigration compliance, and managing assignment costs; however, several of these challenges are being experienced more acutely by the Pharma sector.
Biggest Challenge for Short-Term Assignments Pharma Overall
Tax compliance 69% 53%
Immigration compliance 54% 50%
Managing assignment costs 46% 35%
Controlling assignment duration 23% 23%
Establishing per diem/short-term allowances 23% 13%
Exception requests 23% 25%
Early return from assignments 8% 1%
Inconsistent policy application 8% 16%
Linking talent management with mobility 8% 17%
Repatriation 0% 5%
Tracking assignments 0% 10%
Top challenges for short-term assignments for
Pharma companies are tax compliance, immigration
compliance, and managing assignment costs.

7 INDUSTRY PROFILES: PHARMA | 2016 GLOBAL MOBILITY POLICY & PRACTICES SURVEY | CARTUS
I N D U S T R Y P R O F I L E S : P H A R M A
FlexibilityOf Pharma industry survey respondents, 67% see a demand for greater flexibility in their mobility programs, fewer than the 76% of companies that report this overall. More Pharma industry respondents reported that demand has stayed the same, which may be an indicator that the Pharma industry has already begun addressing a need for flexibility in their mobility programs. This may also be the reason why temporary assignment forms have seen the dramatic increases that they have.
Demand for Greater Flexibility Pharma Overall
Increase 67% 76%
Decrease 0% 2%
Stay the same 33% 22%
Both Pharma industry respondents and companies overall report that budget constraints/ economic climate is their dominant driver of interest in greater flexibility, stated by 67% of Pharma companies and 80% of companies overall. Similarly, 60% of Pharma industry respondents stated that changing employee needs is a key driver, significantly higher than the 42% of companies overall.
Drivers of Flexibility Pharma Overall
Budget constraints/economic climate 67% 80%
Changing employee needs (family, spouse, elder care, etc.) 60% 42%
Attracting qualified candidates 40% 29%
Changing employee expectations (Gen X, Gen Y, Millennials, etc.)
40% 42%
Emerging markets (housing, schools, etc.) 33% 22%
Regional need 33% 27%
Need to reduce policy exceptions 27% 34%
Pharma industry respondents have implemented new policy approaches to meet the need for more flexibility more frequently than companies overall. Of Pharma industry respondents, 67% of have implemented tiered mobility programs, versus just 40% of overall companies, and 53% of Pharma industry respondents are using a core/flex policy approach, compared with 40% of overall companies. In fact, other than using an ad hoc approach, Pharma industry respondents are consistently using approaches to address flexibility in their mobility programs at a higher rate than overall companies.
Meeting the Need for More Flexibility Pharma Overall
Tiered mobility programs by assignment type/purpose 67% 40%
Core/flex policy approach 53% 30%
Ad hoc solutions 47% 50%
Increased use of alternative policy forms (commuter, extended business travel)
33% 30%
Lump sum options 33% 29%
Shorter-term assignments 33% 25%

CARTUS | 2016 GLOBAL MOBILITY POLICY & PRACTICES SURVEY | INDUSTRY PROFILES: PHARMA 8
I N D U S T R Y P R O F I L E S : P H A R M A
Cost Savings FocusPharma industry respondents and respondents overall closely align in their focus on cost control over the past two years.
Focus On Cost Control Pharma Overall
Increased 50% 50%
Decreased 8% 3%
Stayed the same 42% 42%
Don’t know 0% 5%
In nine of the 11 cost savings measures listed below, Pharma industry respondents reported greater use than did companies overall. For example, all Pharma company respondents say they have made improvements to the administrative process to achieve cost savings, versus only 60% of overall companies. Also, 88% of Pharma industry respondents noted they had implemented tiered programs based on purpose or objectives of assignments, (27 percentage points higher than overall companies). This is notable, as Pharma companies are also using tiering much more frequently (67% versus 40% of overall companies) to achieve flexibility. On the other hand, 60% of overall companies had adopted reduced headcount in mobility administration as a cost saving measure, while no Pharma companies indicated that change was made.
This higher than average focus on changes made to achieve cost savings aligns with other findings about Pharma industry mobility programs. More mature programs such as those found in many Pharma industry companies tend to have addressed many cost control measures as they seek to ensure their mobility programs are in line with their business’ needs.
Changes Made to Achieve Cost Savings Pharma Overall
Administrative process improvements 100% 60%
Tiered programs based on purpose or objective of assignment
88% 61%
Outsourcing 80% 71%
Reduced number of assignments/transfers 75% 70%
Reduce benefits 67% 59%
Restructure policy 57% 52%
Better and more proactive assessment of local talent 50% 48%
IT enhancements 50% 46%
Insourcing (taking outsourced services in-house) 50% 38%
External provider changes/renegotiations 25% 45%
Reduced headcount in mobility program administration 0% 60%
100%of Pharma companies have made improvements to the
administrative process to achieve cost savings.

9 INDUSTRY PROFILES: PHARMA | 2016 GLOBAL MOBILITY POLICY & PRACTICES SURVEY | CARTUS
I N D U S T R Y P R O F I L E S : P H A R M A
Mobility Activity Outlook Looking ahead, the survey results confirm the Pharma industry’s leadership in mobility programs and policy development. This is evidenced in responses to queries where respondents are focusing on program changes. Pharma industry respondents reported more interest in the areas of return on investment (64% vs 51% overall), repatriation and career management (64% vs 47% overall), and performance measurement/evaluation of assignees (55% vs 33% overall). This focus on the talent management aspects of mobility is typically the mark of industries with more experience in global mobility.
Global Mobility Program Elements Most Interested in Changing Pharma Overall
Return on investment 64% 51%
Repatriation and career management 64% 47%
Performance measurement/evaluation of assignees 55% 33%
Upfront assignment planning (objectives, cost, value, repatriation)
46% 55%
Cost containment 36% 51%
Candidate assessment and selection 36% 46%
Compensation and benefits design and administration 27% 31%
Support services for assignees 27% 22%
Formal mentoring program while on assignment 18% 22%
Global leadership development 18% 22%
Family assistance 18% 14%
In looking specifically at how they expect their organization’s mobility activity will change over the next two years, Pharma industry responses vary significantly from overall findings. After having reported lower-than-average use of long-term assignments over the past two years (only 13% of Pharma companies said their use of long-term assignments was higher), 44% of Pharma industry respondents expect an increase in the use of long-term assignments over the next two years, higher than the 33% of companies overall that reported an expected increase.
Pharma industry respondents continue to expect a significant increase in permanent transfers, much higher than companies overall (63% versus 43%, respectively). Similarly, Pharma industry respondents also expect to see an increase in extended business travel, again much more so than companies overall (67% versus 47%, respectively).
Interestingly, Pharma industry respondents’ expectations for growth of overall global mobility activity in the next two years slightly lag overall companies, 44% versus 47%, respectively.
CARTUS | 2016 GLOBAL MOBILITY POLICY & PRACTICES SURVEY | INDUSTRY PROFILES: PHARMA 10
I N D U S T R Y P R O F I L E S : P H A R M A
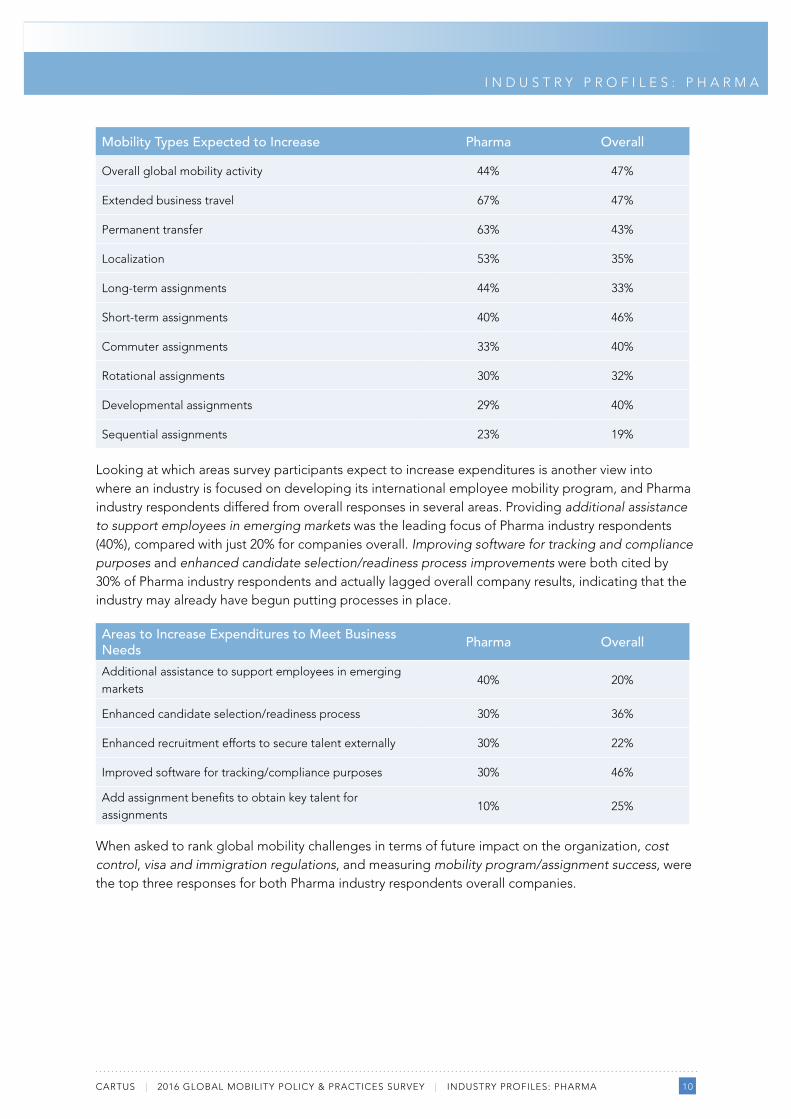
Mobility Types Expected to Increase Pharma Overall
Overall global mobility activity 44% 47%
Extended business travel 67% 47%
Permanent transfer 63% 43%
Localization 53% 35%
Long-term assignments 44% 33%
Short-term assignments 40% 46%
Commuter assignments 33% 40%
Rotational assignments 30% 32%
Developmental assignments 29% 40%
Sequential assignments 23% 19%
Looking at which areas survey participants expect to increase expenditures is another view into where an industry is focused on developing its international employee mobility program, and Pharma industry respondents differed from overall responses in several areas. Providing additional assistance to support employees in emerging markets was the leading focus of Pharma industry respondents (40%), compared with just 20% for companies overall. Improving software for tracking and compliance purposes and enhanced candidate selection/readiness process improvements were both cited by 30% of Pharma industry respondents and actually lagged overall company results, indicating that the industry may already have begun putting processes in place.
Areas to Increase Expenditures to Meet Business Needs Pharma Overall
Additional assistance to support employees in emerging markets
40% 20%
Enhanced candidate selection/readiness process 30% 36%
Enhanced recruitment efforts to secure talent externally 30% 22%
Improved software for tracking/compliance purposes 30% 46%
Add assignment benefits to obtain key talent for assignments
10% 25%
When asked to rank global mobility challenges in terms of future impact on the organization, cost control, visa and immigration regulations, and measuring mobility program/assignment success, were the top three responses for both Pharma industry respondents overall companies.

11 INDUSTRY PROFILES: PHARMA | 2016 GLOBAL MOBILITY POLICY & PRACTICES SURVEY | CARTUS
I N D U S T R Y P R O F I L E S : P H A R M A
Mobility Challenges with Greatest Future Impact on the Organization Pharma Overall
Cost control 75% 71%
Visa and immigration regulations 75% 63%
Measuring mobility program/assignment success 75% 53%
Mobility program/assignee tracking and reporting 63% 54%
Linking mobility to career development 58% 50%
Designing equitable compensation packages 42% 35%
Developing global competencies 34% 44%
Global versus local policy development 0% 39%
Pharma industry respondents’ findings indicate a more mature global mobility environment where companies have already embraced some emerging trends in policy design and cost savings, and are turning their focus to maximizing the integration of employee mobility and talent management. For a growth industry such as Pharma that is expanding into emerging markets and must address business environments that can vary significantly from country to country, as well as evolving competitive pressures, the Pharma industry is often at the forefront of global mobility program changes.

© 2017 Cartus Corporation | All rights reserved.Cartus and the Cartus logo are registered trademarks of Cartus Corporation.
www.cartus.com | connect with us
Cartus’ Industry Profiles series contains the following eight industry sectors. For these reports
and other Cartus research studies, including information on policy comparisons by industry,
please contact your Cartus representative or email us at [email protected].
Industry Description
FINANCIALBanking, Finance, Insurance, Real Estate
PHARMAPharmaceuticals, Healthcare
CONSUMER GOODSConsumer Goods, Food & Beverage
RAW MATERIALSEnergy, Utilities, Mining, Forest Products
MANUFACTURING/ CONSTRUCTIONManufacturing, Machinery, Aerospace, Instruments, Construction, Engineering
SERVICE/MEDIABusiness Services, Hospitality, Entertainment, Telecommunications, Media
OIL & GASPetroleum Products, Gasoline
TECHTechnology, Electronics, Computers, Software