Embed Size (px)
Citation preview
PROFILER USER'S GUIDE
Version 2020
Profiler User's Guide Version 2020 | ii
TABLE OF CONTENTS
Profiling Overview............................................................................................... viWhat's New......................................................................................................viTerminology.....................................................................................................vii
Chapter 1. Preparing An Application For Profiling........................................................11.1. Focused Profiling..........................................................................................11.2. Marking Regions of CPU Activity....................................................................... 21.3. Naming CPU and CUDA Resources..................................................................... 21.4. Flush Profile Data.........................................................................................21.5. Profiling CUDA Fortran Applications................................................................... 3
Chapter 2. Visual Profiling..................................................................................... 42.1. Getting Started............................................................................................4
2.1.1. Modify Your Application For Profiling............................................................ 42.1.2. Creating a Session...................................................................................42.1.3. Analyzing Your Application.........................................................................62.1.4. Exploring the Timeline............................................................................. 62.1.5. Looking at the Details..............................................................................62.1.6. Improve Loading of Large Profiles................................................................6
2.2. Sessions..................................................................................................... 82.2.1. Executable Session.................................................................................. 82.2.2. Import Session....................................................................................... 8
2.2.2.1. Import Single-Process the PGI Profiler Session............................................ 82.2.2.2. Import Multi-Process the PGI Profiler Session............................................. 9
2.3. Application Requirements............................................................................... 92.4. PGPROF Views........................................................................................... 10
2.4.1. Timeline View...................................................................................... 102.4.1.1. Timeline Controls............................................................................. 132.4.1.2. Navigating the Timeline..................................................................... 152.4.1.3. Timeline Refreshing.......................................................................... 162.4.1.4. Dependency Analysis Controls.............................................................. 16
2.4.2. Analysis View....................................................................................... 172.4.2.1. Guided Application Analysis................................................................ 182.4.2.2. Unguided Application Analysis..............................................................182.4.2.3. PC Sampling View............................................................................ 192.4.2.4. Memory Statistics............................................................................. 202.4.2.5. NVLink view................................................................................... 21
2.4.3. Source-Disassembly View......................................................................... 222.4.4. GPU Details View.................................................................................. 232.4.5. CPU Details View...................................................................................252.4.6. OpenACC Details View............................................................................ 282.4.7. OpenMP Details View..............................................................................29
Profiler User's Guide Version 2020 | iii
2.4.8. Properties View.....................................................................................292.4.9. Console View........................................................................................292.4.10. Settings View......................................................................................292.4.11. CPU Source View................................................................................. 31
2.5. Customizing the Profiler............................................................................... 312.5.1. Resizing a View.....................................................................................322.5.2. Reordering a View................................................................................. 322.5.3. Moving a View...................................................................................... 322.5.4. Undocking a View..................................................................................322.5.5. Opening and Closing a View..................................................................... 32
Chapter 3. Command-line Profiling......................................................................... 333.1. Command Line Options.................................................................................33
3.1.1. CUDA Profiling Options............................................................................333.1.2. CPU Profiling Options............................................................................. 393.1.3. Print Options........................................................................................403.1.4. IO Options........................................................................................... 42
3.2. Profiling Modes...........................................................................................443.2.1. Summary Mode..................................................................................... 443.2.2. GPU-Trace and API-Trace Modes.................................................................463.2.3. Event/metric Summary Mode.................................................................... 473.2.4. Event/metric Trace Mode.........................................................................48
3.3. Profiling Controls........................................................................................ 493.3.1. Timeout.............................................................................................. 493.3.2. Concurrent Kernels................................................................................ 493.3.3. Profiling Scope......................................................................................493.3.4. Multiprocess Profiling..............................................................................503.3.5. System Profiling.................................................................................... 503.3.6. Unified Memory Profiling......................................................................... 503.3.7. CPU Thread Tracing................................................................................51
3.4. Output.....................................................................................................513.4.1. Adjust Units.........................................................................................513.4.2. CSV................................................................................................... 513.4.3. Export/Import...................................................................................... 523.4.4. Demangling..........................................................................................523.4.5. Redirecting Output.................................................................................523.4.6. Dependency Analysis.............................................................................. 52
3.5. CPU Sampling............................................................................................ 533.5.1. CPU Sampling Limitations........................................................................ 54
3.6. OpenACC.................................................................................................. 543.6.1. OpenACC Options.................................................................................. 553.6.2. OpenACC Summary Modes........................................................................ 55
3.7. OpenMP....................................................................................................563.7.1. OpenMP Options....................................................................................56
Profiler User's Guide Version 2020 | iv
Chapter 4. Remote Profiling................................................................................. 57Chapter 5. NVIDIA Tools Extension..........................................................................62
5.1. NVTX API Overview..................................................................................... 625.2. NVTX API Events.........................................................................................63
5.2.1. NVTX Markers....................................................................................... 635.2.2. NVTX Range Start/Stop........................................................................... 645.2.3. NVTX Range Push/Pop.............................................................................645.2.4. Event Attributes Structure....................................................................... 655.2.5. NVTX Synchronization Markers...................................................................66
5.3. NVTX Domains............................................................................................675.4. NVTX Resource Naming.................................................................................685.5. NVTX String Registration............................................................................... 69
Chapter 6. MPI Profiling.......................................................................................706.1. Automatic MPI Annotation with NVTX............................................................... 706.2. Manual MPI Profiling.................................................................................... 716.3. Further Reading..........................................................................................72
Chapter 7. Dependency Analysis............................................................................ 737.1. Background............................................................................................... 737.2. Metrics.....................................................................................................747.3. Support....................................................................................................757.4. Limitations................................................................................................75
Chapter 8. Metrics Reference................................................................................778.1. Metrics for Capability 3.x..............................................................................778.2. Metrics for Capability 5.x..............................................................................838.3. Metrics for Capability 6.x..............................................................................888.4. Metrics for Capability 7.x..............................................................................95
Chapter 9. Warp State....................................................................................... 103Chapter 10. Profiler Known Issues........................................................................ 107Chapter 11. Changelog.......................................................................................113
Profiler User's Guide Version 2020 | v
LIST OF TABLES
Table 1 OpenACC Options ..................................................................................... 55
Table 2 OpenMP Options .......................................................................................56
Table 3 Capability 3.x Metrics ................................................................................77
Table 4 Capability 5.x Metrics ................................................................................83
Table 5 Capability 6.x Metrics ................................................................................88
Table 6 Capability 7.0 Metrics ................................................................................95
Profiler User's Guide Version 2020 | vi
PROFILING OVERVIEW
This document describes PGI profiling tools that enable you to understand and optimizethe performance of your CUDA, OpenACC or OpenMP applications. PGPROF's visualmode displays a timeline of your application's CPU and GPU activity, and includes anautomated analysis engine to identify optimization opportunities. PGPROF is availablein both visual mode (GUI) and command-line mode. Issuing the command pgprofwithout arguments launches the PGPROF visually. Otherwise PGPROF operates incommand-line mode.
Note that visual PGI Profiler and the PGI Profiler will be deprecated in a futureCUDA release. It is recommended to use next-generation tools NVIDIA NsightCompute for GPU profiling and NVIDIA Nsight Systems for GPU and CPU samplingand tracing.
NVIDIA Nsight Compute is an interactive kernel profiler for CUDA applications. Itprovides detailed performance metrics and API debugging via a user interface andcommand line tool. In addition, its baseline feature allows users to compare resultswithin the tool. Nsight Compute provides a customizable and data-driven user interfaceand metric collection and can be extended with analysis scripts for post-processingresults.
NVIDIA Nsight Systems is a system-wide performance analysis tool designed tovisualize an application’s algorithms, help you identify the largest opportunities tooptimize, and tune to scale efficiently across any quantity or size of CPUs and GPUs;from large server to our smallest SoC.
Blog posts Migrating to Nsight Tools from Visual Profiler and nvprof, Transitioning toNsight Systems from Visual Profiler and nvprof and Using Nsight Compute to Inspectyour Kernels describe how to move your development to the next-generation tools.
What's NewThe profiling tools contain below changes as part of this release.
‣ visual PGI Profiler and the PGI Profiler allow tracing features for non-root and non-admin users on desktop platforms. Note that events and metrics profiling is stillrestricted for non-root and non-admin users. More details about the issue and thesolutions can be found on this web page.
Profiling Overview
Profiler User's Guide Version 2020 | vii
‣ visual PGI Profiler and the PGI Profiler allow tracing features on the virtual GPUs(vGPU).
‣ Profilers no longer turn off the performance characteristics of CUDA Graph whentracing the application.
‣ Added an option to enable/disable the OpenMP profiling in visual PGI Profiler.‣ Fixed the incorrect timing issue for the asynchronous cuMemset/cudaMemset
activity.
TerminologyAn event is a countable activity, action, or occurrence on a device. It corresponds to asingle hardware counter value which is collected during kernel execution. To see a list ofall available events on a particular NVIDIA GPU, type pgprof --query-events.
A metric is a characteristic of an application that is calculated from one or more eventvalues. To see a list of all available metrics on a particular NVIDIA GPU, type pgprof--query-metrics. You can also refer to the metrics reference .

Profiling Overview
Profiler User's Guide Version 2020 | viii
Profiler User's Guide Version 2020 | 1
Chapter 1.PREPARING AN APPLICATION FORPROFILING
PGPROF does not require any application changes to enable profiling; however, bymaking some simple modifications and additions, you can greatly increase the usabilityand effectiveness profiling. This section describes these modifications and how they canimprove your profiling results.
1.1. Focused ProfilingBy default, PGPPROF collects profile data over the entire run of your application.But, as explained below, you typically only want to profile the region(s) of yourapplication containing some or all of the performance-critical code. Limiting profilingto performance-critical regions reduces the amount of profile data that both you and thetool must process, and focuses attention on the code where optimization will result inthe greatest performance gains.
There are several common situations where profiling a region of the application ishelpful.
1. The application is a test harness that contains a CUDA implementation of all or partof your algorithm. The test harness initializes the data, invokes the CUDA functionsto perform the algorithm, and then checks the results for correctness. Using a testharness is a common and productive way to quickly iterate and test algorithmchanges. When profiling, you want to collect profile data for the CUDA functionsimplementing the algorithm, but not for the test harness code that initializes the dataor checks the results.
2. The application operates in phases, where a different set of algorithms is activein each phase. When the performance of each phase of the application can beoptimized independently of the others, you want to profile each phase separately tofocus your optimization efforts.
3. The application contains algorithms that operate over a large number of iterations,but the performance of the algorithm does not vary significantly across thoseiterations. In this case you can collect profile data from a subset of the iterations.
Preparing An Application For Profiling
Profiler User's Guide Version 2020 | 2
To limit profiling to a region of your application, CUDA provides functions to startand stop profile data collection. cudaProfilerStart() is used to start profiling andcudaProfilerStop() is used to stop profiling (using the CUDA driver API, you getthe same functionality with cuProfilerStart() and cuProfilerStop()). To usethese functions you must include cuda_profiler_api.h (or cudaProfiler.h for thedriver API).
When using the start and stop functions, you also need to instruct the profiling toolto disable profiling at the start of the application. For pgprof you do this with the--profile-from-start off flag. For PGPROF in visual mode you use the Startexecution with profiling enabled checkbox in the Settings View.
1.2. Marking Regions of CPU ActivityThe Visual Profiler can collect a trace of the CUDA function calls made by yourapplication. The Visual Profiler shows these calls in the Timeline View, allowing youto see where each CPU thread in the application is invoking CUDA functions. Tounderstand what the application's CPU threads are doing outside of CUDA functioncalls, you can use the NVIDIA Tools Extension API (NVTX). When you add NVTXmarkers and ranges to your application, the Timeline View shows when your CPUthreads are executing within those regions.
the PGI Profiler also supports NVTX markers and ranges. Markers and ranges areshown in the API trace output in the timeline. In summary mode, each range is shownwith CUDA activities associated with that range.
1.3. Naming CPU and CUDA ResourcesThe Visual Profiler Timeline View shows default naming for CPU thread and GPUdevices, context and streams. Using custom names for these resources can improveunderstanding of the application behavior, especially for CUDA applications thathave many host threads, devices, contexts, or streams. You can use the NVIDIA ToolsExtension API to assign custom names for your CPU and GPU resources. Your customnames will then be displayed in the Timeline View.
the PGI Profiler also supports NVTX naming. Names of CUDA devices, contextsand streams are displayed in summary and trace mode. Thread names are displayed insummary mode.
1.4. Flush Profile DataTo reduce profiling overhead, the profiling tools collect and record profile informationinto internal buffers. These buffers are then flushed asynchronously to disk with lowpriority to avoid perturbing application behavior. To avoid losing profile informationthat has not yet been flushed, the application being profiled should make sure, beforeexiting, that all GPU work is done (using CUDA synchronization calls), and then
Preparing An Application For Profiling
Profiler User's Guide Version 2020 | 3
call cudaProfilerStop() or cuProfilerStop(). Doing so forces buffered profileinformation on corresponding context(s) to be flushed.
If your CUDA application includes graphics that operate using a display or main loop,care must be taken to call cudaProfilerStop() or cuProfilerStop() before thethread executing that loop calls exit(). Failure to call one of these APIs may result inthe loss of some or all of the collected profile data.
For some graphics applications like the ones use OpenGL, the application exits when theescape key is pressed. In those cases where calling the above functions before exit is notfeasible, use the PGI Profiler option --timeout or set the "Execution timeout" inthe visual PGI Profiler. The profiler will force a data flush just before the timeout.
1.5. Profiling CUDA Fortran ApplicationsCUDA Fortran applications compiled with the PGI CUDA Fortran compiler can beprofiled by the PGI Profiler. In cases where the profiler needs source file and lineinformation (kernel profile analysis, global memory access pattern analysis, divergentexecution analysis, etc.), use the "-Mcuda=lineinfo" option when compiling. This optionis supported on Linux 64-bit targets in PGI 2019 version 19.1 or later.
Profiler User's Guide Version 2020 | 4
Chapter 2.VISUAL PROFILING
The visual PGI Profiler allows you to visualize and optimize the performance of yourapplication. The visual PGI Profiler displays a timeline of your application's activityon both the CPU and GPU so that you can identify opportunities for performanceimprovement. In addition, the Visual Profiler will analyze your application to detectpotential performance bottlenecks and direct you on how to take action to eliminate orreduce those bottlenecks.
Before attempting to run Visual Profile, note that the Visual Profiler requires JavaRuntime Environment (JRE) 1.8 to be available on the local system.
2.1. Getting StartedThis section describes steps you might take as you begin profiling.
2.1.1. Modify Your Application For ProfilingThe visual PGI Profiler does not require any application changes; however, by makingsome simple modifications and additions, you can greatly increase its usability andeffectiveness. Section Preparing An Application For Profiling describes how you canfocus your profiling efforts and add extra annotations to your application that willgreatly improve your profiling experience.
2.1.2. Creating a SessionThe first step in using the visual PGI Profiler to profile your application is to create anew profiling session. A session contains the settings, data, and results associated withyour application. The Sessions section gives more information on working with sessions.
You can create a new session by selecting the Profile An Application link on theWelcome page, or by selecting New Session from the File menu. In the Create NewSession dialog enter the executable for your application. Optionally, you can also specifythe working directory, arguments, multi-process profiling option and environment.
Visual Profiling
Profiler User's Guide Version 2020 | 5
The muti-process profiling options are:
‣ Profile child processes - If selected, profile all processes launched by the specifiedapplication.
‣ Profile all processes - If selected, profile every CUDA process launched on thesame system by the same user who launched pgprof. In this mode the visualPGI Profiler will launch the PGI Profiler and user needs to run his application inanother terminal outside the visual PGI Profiler. User can exit this mode by pressing"Cancel" button on progress dialog in Visual Profiler to load the profile data
‣ Profile current process only - If selected, only profile specified application.
Press Next to choose some additional profiling options.
CUDA options:
‣ Start execution with profiling enabled - If selected profile data is collected fromthe start of application execution. If not selected profile data is not collected untilcudaProfilerStart() is called in the application. See Focused Profiling for moreinformation about cudaProfilerStart().
‣ Enable concurrent kernel profiling - This option should be selected for anapplication that uses CUDA streams to launch kernels that can execute concurrently.If the application uses only a single stream (and therefore cannot have concurrentkernel execution), deselecting this option may decrease profiling overhead.
‣ Enable CUDA API tracing in the timeline - If selected, the CUDA driver andruntime API call trace is collected and displayed on timeline.
‣ Enable power, clock, and thermal profiling - If selected, power, clock, and thermalconditions on the GPUs will be sampled and displayed on the timeline. Collection ofthis data is not supported on all GPUs. See the description of the Device timeline inTimeline View for more information.
‣ Enable unified memory profiling - If selected for the GPU that supports UnifiedMemory, the Unified Memory related memory traffic to and from each GPU iscollected on your system and displayed on timeline.
‣ Replay application to collect events and metrics - If selected, the whole applicationis re-run instead of replaying each kernel, in order to collect all events/metrics.
‣ Run guided analysis - If selected, the guided analysis is run immediately after thecreation of a new session. Uncheck this option to disable this behavior.
CPU (host) options:
‣ Profile execution on the CPU - If selected the CPU threads are sampled and datacollected about the CPU performance is shown in the CPU Details View.
‣ Enable OpenACC profiling - If selected and an OpenACC application is profiled,OpenACC activities will be recorded and displayed on a new OpenACC timeline.Collection of this data is only supported on Linux and PGI 19.1 or later. See thedescription of the OpenACC timeline in Timeline View for more information.
‣ Enable CPU thread tracing - If enabled, selected CPU thread API calls will berecorded and displayed on a new thread API timeline. This currently includes thePthread API, mutexes and condition variables. For performance reasons, only thoseAPI calls that influence concurrent execution are recorded and collection of this datais not supported on Windows. See the description of the thread timeline in Timeline
Visual Profiling
Profiler User's Guide Version 2020 | 6
View for more information. This option should be selected for dependency analysisof applications with multiple CPU threads using CUDA.
Timeline Options:
‣ Load data for time range - If selected the start and end time stamps for the range ofdata to be loaded can be specified. This option is useful to select a subset of a largedata.
‣ Enable timelines in the session - By default all timelines are enabled. If a timeline isun-checked, the data associated with that timeline will not be loaded and it will notbe displayed.
If some timelines are disabled by un-checking the option the analyses results whichuse this timeline data will be incorrect.
Press Finish.
2.1.3. Analyzing Your ApplicationIf the Don't run guided analysis option was not selected when you created your session,the visual PGI Profiler will immediately run your application to collect the data neededfor the first stage of guided analysis. As described in the Analysis View section, youcan use the guided analysis system to get recommendations on performance limitingbehavior in your application.
2.1.4. Exploring the TimelineIn addition to the guided analysis results, you will see a timeline for your applicationshowing the CPU and GPU activity that occurred as your application executed. ReadTimeline View and Properties View to learn how to explore the profiling informationthat is available in the timeline. Navigating the Timeline describes how you can zoomand scroll the timeline to focus on specific areas of your application.
2.1.5. Looking at the DetailsIn addition to the results provided in the Analysis View, you can also look at the specificmetric and event values collected as part of the analysis. Metric and event values aredisplayed in the GPU Details View. You can collect specific metric and event values thatreveal how the kernels in your application are behaving. You collect metrics and eventsas described in the GPU Details View section.
2.1.6. Improve Loading of Large ProfilesSome applications launch many tiny kernels, making them prone to very large (100s ofmegabytes or larger) output, even for application runs of only a few seconds. The visualPGI Profiler needs roughly the same amount of memory as the size of the profile it isopening/importing. The Java virtual machine may use a fraction of the main memory ifno "max heap size" setting is specified. So depending on the size of main memory, thevisual PGI Profiler may fail to load some large files.
Visual Profiling
Profiler User's Guide Version 2020 | 7
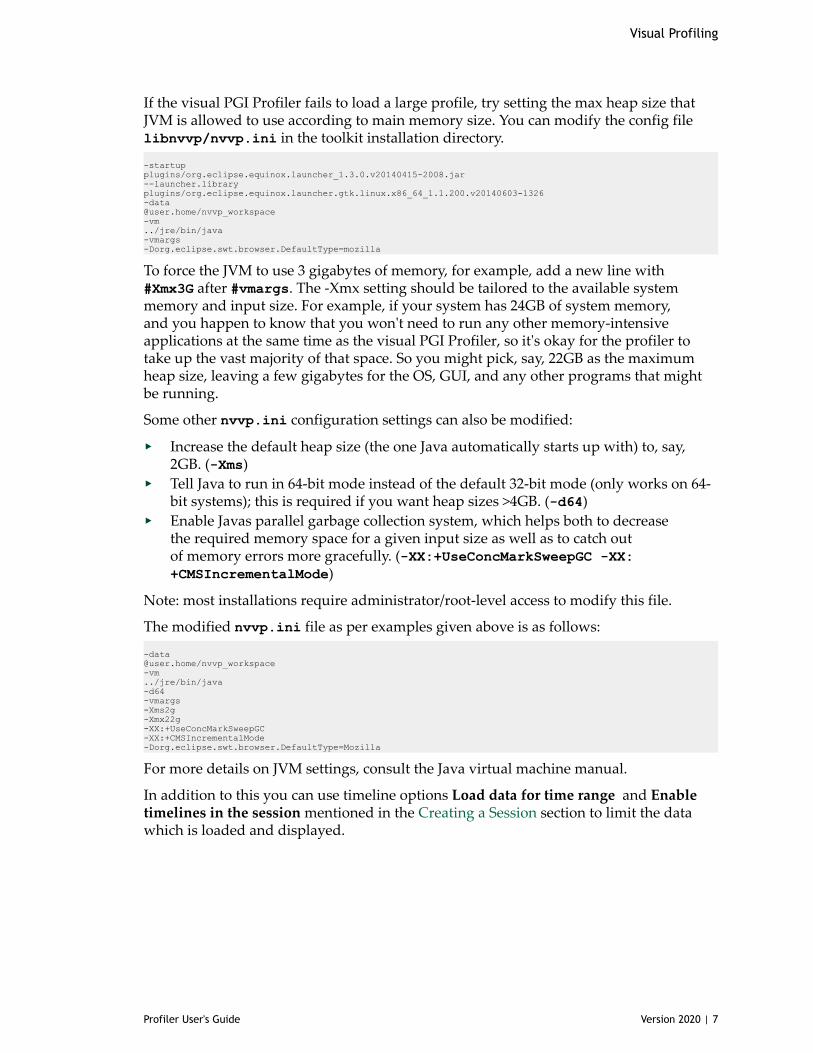
If the visual PGI Profiler fails to load a large profile, try setting the max heap size thatJVM is allowed to use according to main memory size. You can modify the config filelibnvvp/nvvp.ini in the toolkit installation directory.
-startupplugins/org.eclipse.equinox.launcher_1.3.0.v20140415-2008.jar--launcher.libraryplugins/org.eclipse.equinox.launcher.gtk.linux.x86_64_1.1.200.v20140603-1326-data@user.home/nvvp_workspace-vm../jre/bin/java-vmargs-Dorg.eclipse.swt.browser.DefaultType=mozilla
To force the JVM to use 3 gigabytes of memory, for example, add a new line with‑Xmx3G after ‑vmargs. The -Xmx setting should be tailored to the available systemmemory and input size. For example, if your system has 24GB of system memory,and you happen to know that you won't need to run any other memory-intensiveapplications at the same time as the visual PGI Profiler, so it's okay for the profiler totake up the vast majority of that space. So you might pick, say, 22GB as the maximumheap size, leaving a few gigabytes for the OS, GUI, and any other programs that mightbe running.
Some other nvvp.ini configuration settings can also be modified:
‣ Increase the default heap size (the one Java automatically starts up with) to, say,2GB. (-Xms)
‣ Tell Java to run in 64-bit mode instead of the default 32-bit mode (only works on 64-bit systems); this is required if you want heap sizes >4GB. (-d64)
‣ Enable Javas parallel garbage collection system, which helps both to decreasethe required memory space for a given input size as well as to catch outof memory errors more gracefully. (-XX:+UseConcMarkSweepGC -XX:+CMSIncrementalMode)
Note: most installations require administrator/root-level access to modify this file.
The modified nvvp.ini file as per examples given above is as follows:
[email protected]/nvvp_workspace-vm../jre/bin/java-d64-vmargs-Xms2g-Xmx22g-XX:+UseConcMarkSweepGC-XX:+CMSIncrementalMode-Dorg.eclipse.swt.browser.DefaultType=Mozilla
For more details on JVM settings, consult the Java virtual machine manual.
In addition to this you can use timeline options Load data for time range and Enabletimelines in the session mentioned in the Creating a Session section to limit the datawhich is loaded and displayed.
Visual Profiling
Profiler User's Guide Version 2020 | 8
2.2. SessionsA session contains the settings, data, and profiling results associated with yourapplication. Each session is saved in a separate file; so you can delete, move, copy, orshare a session by simply deleting, moving, copying, or sharing the session file.
There are two types of sessions: an executable session that is associated with anapplication that is executed and profiled from within the visual PGI Profiler, and animport session that is created by importing data generated by Command-line Profiling.
2.2.1. Executable SessionYou can create a new executable session for your application by selecting the ProfileAn Application link on the Welcome page, or by selecting New Session from the Filemenu. Once a session is created, you can edit the session's settings as described in theSettings View.
You can open and save existing sessions using the open and save options in the Filemenu.
To analyze your application and to collect metric and event values, the visual PGIProfiler will execute your application multiple times. To get accurate profiling results, itis important that your application conform to the requirements detailed in ApplicationRequirements.
2.2.2. Import SessionYou create an import session from the output of the command-line mode in PGPROF byusing the Import... option in the File menu. Selecting this option opens the import dialogwhich guides you through the import process.
Because an executable application is not associated with an import session, the visualPGI Profiler cannot execute the application to collect additional profile data. As a result,analysis can only be performed with the data that is imported. Also, the GPU DetailsView will show any imported event and metrics values but new metrics and eventscannot be selected and collected for the import session.
2.2.2.1. Import Single-Process the PGI Profiler SessionUsing the import dialog you can select one or more the PGI Profiler data files forimport into the new session.
You must have one the PGI Profiler data file that contains the timeline informationfor the session. This data file should be collected by running pgprof with the --export-profile option. You can optionally enable other options such as --system-profilingon, but you should not collect any events or metrics as that will distort the timeline sothat it is not representative of the applications true behavior.
You may optionally specify one or more event/metric data files that contain event andmetric values for the application. These data files should be collected by running pgprof
Visual Profiling
Profiler User's Guide Version 2020 | 9
with one or both of the --events and --metrics options. To collect all the events andmetrics that are needed for the analysis system, you can simply use the --analysis-metrics option along with the --kernels option to select the kernel(s) to collect eventsand metrics for. See Remote Profiling for more information.
If you are importing multiple the PGI Profiler output files into the session, it isimportant that your application conform to the requirements detailed in ApplicationRequirements.
2.2.2.2. Import Multi-Process the PGI Profiler SessionUsing the import wizard you can select multiple the PGI Profiler data files forimport into the new multi-process session.
Each the PGI Profiler data file must contain the timeline information for one of theprocesses. This data file should be collected by running pgprof with the --export-profile option. You can optionally enable other options such as --system-profilingon, but you should not collect any events or metrics as that will distort the timeline sothat it is not representative of the applications true behavior.
Select the Multiple Processes option in the Import the PGI Profiler Data dialog asshown in the figure below.
When importing timeline data from multiple processes you may not specify any event/metric data files for those processes. Multi-processes profiling is only supported fortimeline data.
2.3. Application RequirementsTo collect performance data about your application, the visual PGI Profiler must be ableto execute your application repeatedly in a deterministic manner. Due to software andhardware limitations, it is not possible to collect all the necessary profile data in a singleexecution of your application. Each time your application is run, it must operate onthe same data and perform the same kernel and memory copy invocations in the sameorder. Specifically,
‣ For a device, the order of context creation must be the same each time theapplication executes. For a multi-threaded application where each thread createsits own context(s), care must be taken to ensure that the order of those contextcreations is consistent across multiple runs. For example, it may be necessary tocreate the contexts on a single thread and then pass the contexts to the other threads.Alternatively, the NVIDIA Tools Extension API can be used to provide a customname for each context. As long as the same custom name is applied to the samecontext on each execution of the application, the visual PGI Profiler will be able tocorrectly associate those contexts across multiple runs.
‣ For a context, the order of stream creation must be the same each time theapplication executes. Alternatively, the NVIDIA Tools Extension API can be used toprovide a custom name for each stream. As long as the same custom name is applied
Visual Profiling
Profiler User's Guide Version 2020 | 10
to the same stream on each execution of the application, the visual PGI Profiler willbe able to correctly associate those streams across multiple runs.
‣ Within a stream, the order of kernel and memcpy invocations must be the same eachtime the application executes.
2.4. PGPROF ViewsThe visual PGI Profiler is organized into views. Together, the views allow you to analyzeand visualize the performance of your application. This section describes each view andhow you use it while profiling your application.
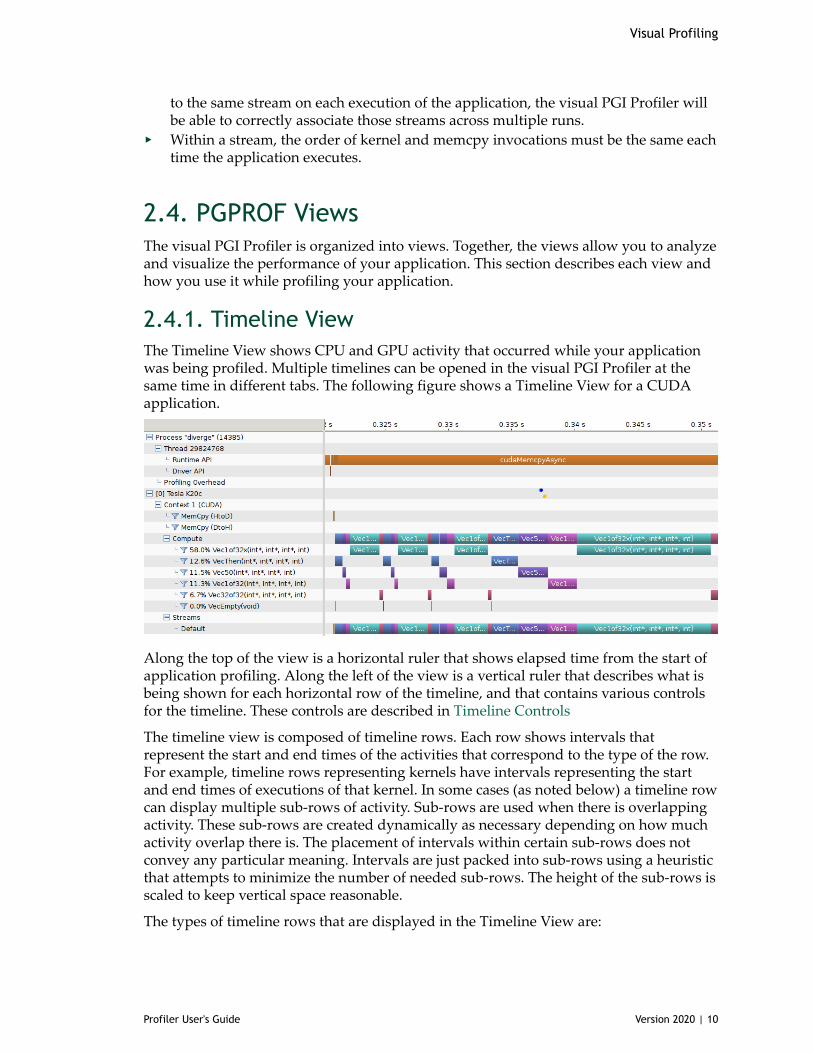
2.4.1. Timeline ViewThe Timeline View shows CPU and GPU activity that occurred while your applicationwas being profiled. Multiple timelines can be opened in the visual PGI Profiler at thesame time in different tabs. The following figure shows a Timeline View for a CUDAapplication.
Along the top of the view is a horizontal ruler that shows elapsed time from the start ofapplication profiling. Along the left of the view is a vertical ruler that describes what isbeing shown for each horizontal row of the timeline, and that contains various controlsfor the timeline. These controls are described in Timeline Controls
The timeline view is composed of timeline rows. Each row shows intervals thatrepresent the start and end times of the activities that correspond to the type of the row.For example, timeline rows representing kernels have intervals representing the startand end times of executions of that kernel. In some cases (as noted below) a timeline rowcan display multiple sub-rows of activity. Sub-rows are used when there is overlappingactivity. These sub-rows are created dynamically as necessary depending on how muchactivity overlap there is. The placement of intervals within certain sub-rows does notconvey any particular meaning. Intervals are just packed into sub-rows using a heuristicthat attempts to minimize the number of needed sub-rows. The height of the sub-rows isscaled to keep vertical space reasonable.
The types of timeline rows that are displayed in the Timeline View are:
Visual Profiling
Profiler User's Guide Version 2020 | 11
ProcessA timeline will contain a Process row for each application profiled. The processidentifier represents the pid of the process. The timeline row for a process does notcontain any intervals of activity. Threads within the process are shown as children ofthe process.
ThreadA timeline will contain a Thread row for each CPU thread in the profiled applicationthat performed either a CUDA driver or CUDA runtime API call. The threadidentifier is a unique id for that CPU thread. The timeline row for a thread is does notcontain any intervals of activity.
Runtime APIA timeline will contain a Runtime API row for each CPU thread that performs aCUDA Runtime API call. Each interval in the row represents the duration of the callon the corresponding thread.
Driver APIA timeline will contain a Driver API row for each CPU thread that performs a CUDADriver API call. Each interval in the row represents the duration of the call on thecorresponding thread.
OpenACCA timeline will contain one or multiple OpenACC rows for each CPU thread thatcalls OpenACC directives. Each interval in the row represents the duration of thecall on the corresponding thread. Each OpenACC timeline may consist of multiplerows. Within one timeline, OpenACC activities on rows further down are called fromwithin activities on the rows above.
OpenMPA timeline will contain one OpenMP row for each CPU thread that calls OpenMP.Each interval in the row represents how long the application spends in a givenOpenMP region or state. The application may be in multiple states at the same time,this is shown by drawing multiple rows where some intervals overlap.
PthreadA timeline will contain one Pthread row for each CPU thread that performs PthreadAPI calls, given that host thread API calls have been recorded during measurement.Each interval in the row represents the duration of the call. Note that for performancereasons, only selected Pthread API calls may have been recorded.
Markers and RangesA timeline will contain a single Markers and Ranges row for each CPU thread thatuses the NVIDIA Tools Extension API to annotate a time range or marker. Eachinterval in the row represents the duration of a time range, or the instantaneous pointof a marker. This row will have sub-rows if there are overlapping ranges.
Profiling OverheadA timeline will contain a single Profiling Overhead row for each process. Eachinterval in the row represents the duration of execution of some activity required forprofiling. These intervals represent activity that does not occur when the applicationis not being profiled.
DeviceA timeline will contain a Device row for each GPU device utilized by the applicationbeing profiled. The name of the timeline row indicates the device ID in squarebrackets followed by the name of the device. After running the Compute Utilizationanalysis, the row will contain an estimate of the compute utilization of the device
Visual Profiling
Profiler User's Guide Version 2020 | 12
over time. If power, clock, and thermal profiling are enabled, the row will also containpoints representing those readings.
Unified MemoryA timeline will contain a Unified Memory row for each CPU thread and device thatuses unified memory. The Unified memory may contain CPU Page Faults, GPU PageFaults, Data Migration (DtoH) and Data Migration (HtoD) rows. When creating asession user can select segment mode or non-segment mode for Unified Memorytimelines. In the segment mode the timeline is split into equal width segmentsand only aggregated data values for each time segment are shown. The number ofsegments can be changed. In non-segment mode each interval on the timeline willrepresent the actual data collected and the properties for each interval can be viewed.The segments are colored using a heat-map color scheme. Under properties for thetimeline the property which is used for selecting the color is given and also a legenddisplays the mapping of colors to different range of property values.
CPU Page FaultsThis will contain a CPU Page Faults row for each CPU thread. In the non-segmentmode each interval on the timeline corresponds to one CPU page fault.
Data Migration (DtoH)A timeline will contain Data Migration (DtoH) row for each device. In the non-segment mode each interval on the timeline corresponds to one data migration fromdevice to host.
GPU Page FaultsA timeline will contain GPU Page Faults . row for each CPU thread. In the non-segment mode each interval on the timeline corresponds to one GPU page faultgroup.
Data Migration (DtoH)A timeline will contain Data Migration (HtoD) row for each device. In the non-segment mode each interval on the timeline corresponds to one data migration fromhost to device.
ContextA timeline will contains a Context row for each CUDA context on a GPU device. Thename of the timeline row indicates the context ID or the custom context name if theNVIDIA Tools Extension API was used to name the context. The row for a contextdoes not contain any intervals of activity.
MemcpyA timeline will contain memory copy row(s) for each context that performs memcpys.A context may contain up to four memcpy rows for device-to-host, host-to-device,device-to-device, and peer-to-peer memory copies. Each interval in a row representsthe duration of a memcpy executing on the GPU.
ComputeA timeline will contain a Compute row for each context that performs computationon the GPU. Each interval in a row represents the duration of a kernel on the GPUdevice. The Compute row indicates all the compute activity for the context. Sub-rowsare used when concurrent kernels are executed on the context. All kernel activity,including kernels launched using CUDA Dynamic Parallelism, is shown on theCompute row. The Kernel rows following the Compute row show activity of eachindividual application kernel.
Visual Profiling
Profiler User's Guide Version 2020 | 13
KernelA timeline will contain a Kernel row for each kernel executed by the application.Each interval in a row represents the duration of execution of an instance of thatkernel in the containing context. Each row is labeled with a percentage that indicatesthe total execution time of all instances of that kernel compared to the total executiontime of all kernels. For each context, the kernels are ordered top to bottom by thisexecution time percentage. Sub-rows are used to show concurrent kernel execution.For CUDA Dynamic Parallelism applications, the kernels are organized in a hierarchythat represents the parent/child relationship between the kernels. Host-launchedkernels are shown as direct children of the Context row. Kernels that use CUDADynamic Parallelism to launch other kernels can be expanded using the '+' icon toshow the kernel rows representing those child kernels. For kernels that don't launchchild kernels, the kernel execution is represented by a solid interval, showing the timethat that instance of the kernel was executing on the GPU. For kernels that launchchild kernels, the interval can also include a hollow part at the end. The hollow partrepresents the time after the kernel has finished executing where it is waiting for childkernels to finish executing. The CUDA Dynamic Parallelism execution model requiresthat a parent kernel not complete until all child kernels complete and this is what thehollow part is showing. The Focus control described in Timeline Controls can be usedto control display of the parent/child timelines.
StreamA timeline will contain a Stream row for each stream used by the application(including both the default stream and any application created streams). Each intervalin a Stream row represents the duration of a memcpy or kernel execution performedon that stream.
2.4.1.1. Timeline ControlsThe Timeline View has several controls that you use to control how the timeline isdisplayed. Some of these controls also influence the presentation of data in the GPUDetails View and the Analysis View.
Resizing the Vertical Timeline Ruler
The width of the vertical ruler can be adjusted by placing the mouse pointer over theright edge of the ruler. When the double arrow pointer appears, click and hold the leftmouse button while dragging. The vertical ruler width is saved with your session.
Reordering Timelines
The Kernel and Stream timeline rows can be reordered. You may want to reorder theserows to aid in visualizing related kernels and streams, or to move unimportant kernelsand streams to the bottom of the timeline. To reorder a row, left-click and hold onto therow label. When the double arrow pointer appears, drag up or down to position the row.The timeline ordering is saved with your session.
Visual Profiling
Profiler User's Guide Version 2020 | 14
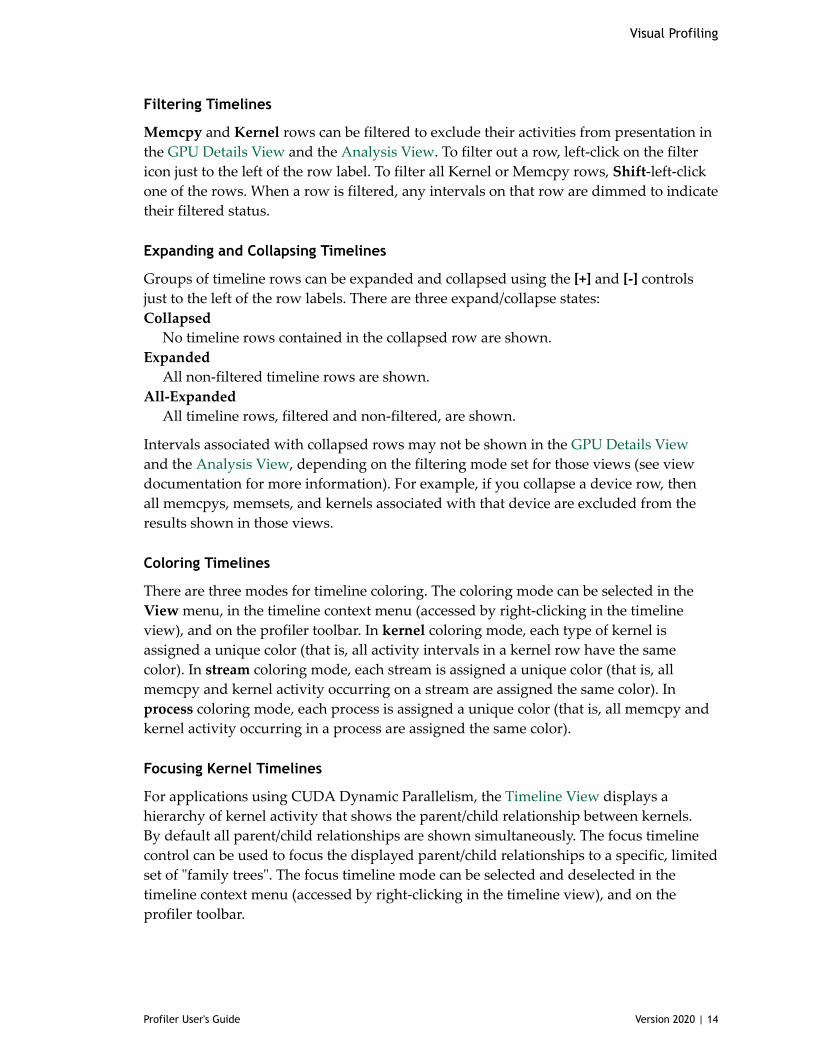
Filtering Timelines
Memcpy and Kernel rows can be filtered to exclude their activities from presentation inthe GPU Details View and the Analysis View. To filter out a row, left-click on the filtericon just to the left of the row label. To filter all Kernel or Memcpy rows, Shift-left-clickone of the rows. When a row is filtered, any intervals on that row are dimmed to indicatetheir filtered status.
Expanding and Collapsing Timelines
Groups of timeline rows can be expanded and collapsed using the [+] and [-] controlsjust to the left of the row labels. There are three expand/collapse states:Collapsed
No timeline rows contained in the collapsed row are shown.Expanded
All non-filtered timeline rows are shown.All-Expanded
All timeline rows, filtered and non-filtered, are shown.
Intervals associated with collapsed rows may not be shown in the GPU Details Viewand the Analysis View, depending on the filtering mode set for those views (see viewdocumentation for more information). For example, if you collapse a device row, thenall memcpys, memsets, and kernels associated with that device are excluded from theresults shown in those views.
Coloring Timelines
There are three modes for timeline coloring. The coloring mode can be selected in theView menu, in the timeline context menu (accessed by right-clicking in the timelineview), and on the profiler toolbar. In kernel coloring mode, each type of kernel isassigned a unique color (that is, all activity intervals in a kernel row have the samecolor). In stream coloring mode, each stream is assigned a unique color (that is, allmemcpy and kernel activity occurring on a stream are assigned the same color). Inprocess coloring mode, each process is assigned a unique color (that is, all memcpy andkernel activity occurring in a process are assigned the same color).
Focusing Kernel Timelines
For applications using CUDA Dynamic Parallelism, the Timeline View displays ahierarchy of kernel activity that shows the parent/child relationship between kernels.By default all parent/child relationships are shown simultaneously. The focus timelinecontrol can be used to focus the displayed parent/child relationships to a specific, limitedset of "family trees". The focus timeline mode can be selected and deselected in thetimeline context menu (accessed by right-clicking in the timeline view), and on theprofiler toolbar.

Visual Profiling
Profiler User's Guide Version 2020 | 15
To see the "family tree" of a particular kernel, select a kernel and then enable Focusmode. All kernels except those that are ancestors or descendants of the selected kernelwill be hidden. Ctrl-select can be used to select multiple kernels before enabling Focusmode. Use the "Don't Focus" option to disable focus mode and restore all kernels to theTimeline view.
Dependency Analysis Controls
There are two modes for visualizing dependency analysis results in the timeline: FocusCritical Path and Highlight Execution Dependencies. These modes can be selected inthe View menu, in the timeline context menu (accessed by right-clicking in the timelineview), and on the Visual Profiler toolbar.
These options become available after the Dependency Analysis application analysisstage has been run (see Unguided Application Analysis). A detailed explanation of thesemodes is given in Dependency Analysis Controls
2.4.1.2. Navigating the TimelineThe timeline can be scrolled, zoomed, and focused in several ways to help you betterunderstand and visualize your application's performance.
Zooming
The zoom controls are available in the View menu, in the timeline context menu(accessed by right-clicking in the timeline view), and on the profiler toolbar. Zoom-inreduces the timespan displayed in the view, zoom-out increases the timespan displayedin the view, and zoom-to-fit scales the view so that the entire timeline is visible.
You can also zoom-in and zoom-out with the mouse wheel while holding the Ctrl key.
Another useful zoom mode is zoom-to-region. Select a region of the timeline byholding Ctrl while left-clicking and dragging the mouse. The highlighted region will beexpanded to occupy the entire view when the mouse button is released.
Scrolling
The timeline can be scrolled vertically with the scrollbar of the mouse wheel. Thetimeline can be scrolled horizontally with the scrollbar or by using the mouse wheelwhile holding the Shift key.
Highlighting/Correlation
When you move the mouse pointer over an activity interval on the timeline, that intervalis highlighted in all places where the corresponding activity is shown. For example,if you move the mouse pointer over an interval representing a kernel execution, thatkernel execution is also highlighted in the Stream and in the Compute timeline row.When a kernel or memcpy interval is highlighted, the corresponding driver or runtime
Visual Profiling
Profiler User's Guide Version 2020 | 16
API interval will also highlight. This allows you to see the correlation between theinvocation of a driver or runtime API or OpenACC directive on the CPU and thecorresponding activity on the GPU. Information about the highlighted interval is shownin the Properties View.
Selecting
You can left-click on a timeline interval or row to select it. Multi-select is done usingCtrl-left-click. To unselect an interval or row simply Ctrl-left-click on it again. When asingle interval or row is selected, the information about that interval or row is pinned inthe Properties View. In the GPU Details View, the detailed information for the selectedinterval is shown in the table.
Measuring Time Deltas
Measurement rulers can be created by left-click dragging in the horizontal ruler at thetop of the timeline. Once a ruler is created it can be activated and deactivated by left-clicking. Multiple rulers can be activated by Ctrl-left-click. Any number of rulers canbe created. Active rulers are deleted with the Delete or Backspace keys. After a ruleris created, it can be resized by dragging the vertical guide lines that appear over thetimeline. If the mouse is dragged over a timeline interval, the guideline will snap to thenearest edge of that interval.
2.4.1.3. Timeline RefreshingThe profiler loads the timeline gradually as it reads the data. This is more apparent if thedata file being loaded is big, or the application has generated a lot of data. In such cases,the timeline may be partially rendered. At the same time, a spinning circle replaces theicon of the current session tab, indicating the timeline is not fully loaded. Loading isfinished when the icon changes back.
To reduce its memory footprint, the profiler may skip loading some timeline contentsif they are not visible at the current zoom level. These contents will be automaticallyloaded when they become visible on a new zoom level.
2.4.1.4. Dependency Analysis ControlsThe profiler allows the visualization of dependency analysis results in the timelineonce the respective analysis stage has been run. For a detailed description on howdependency analysis works, see Dependency Analysis.
Focus Critical Path visualizes the critical path through the application by focusing onall intervals on the critical path and fading others. When the mode is enabled and anytimeline interval is selected (by left-clicking it), the selected interval will have focus.However, the critical path will still be visible as hollow intervals. This allows you to"follow" the critical path through the execution and to inspect individual intervals.
Highlight Execution Dependencies allows you to analyze the execution dependenciesfor each interval (Note that for certain intervals, no dependency information is

Visual Profiling
Profiler User's Guide Version 2020 | 17
collected). When this mode is enabled, the highlighting color changes from yellow(representing correlated intervals) to red (representing dependencies). Both theselected interval as well as all incoming and outgoing dependencies are highlighted.
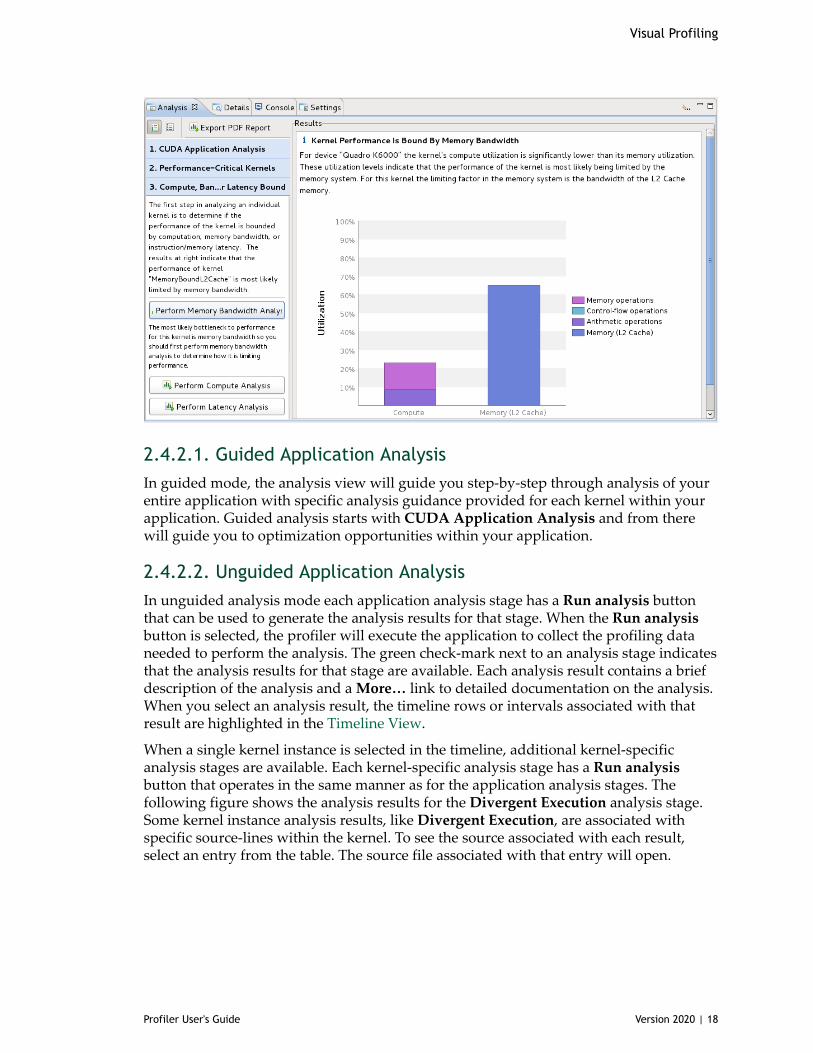
2.4.2. Analysis ViewThe Analysis View is used to control application analysis and to display the analysisresults. There are two analysis modes: guided and unguided. In guided mode the analysissystem will guide you through multiple analysis stages to help you understand thelikely performance limiters and optimization opportunities in your application. Inunguided mode you can manually explore all the analysis results collected for yourapplication. The following figure shows the analysis view in guided analysis mode. Theleft part of the view provides step-by-step directions to help you analyze and optimizeyour application. The right part of the view shows detailed analysis results appropriatefor each part of the analysis.
Visual Profiling
Profiler User's Guide Version 2020 | 18
2.4.2.1. Guided Application AnalysisIn guided mode, the analysis view will guide you step-by-step through analysis of yourentire application with specific analysis guidance provided for each kernel within yourapplication. Guided analysis starts with CUDA Application Analysis and from therewill guide you to optimization opportunities within your application.
2.4.2.2. Unguided Application AnalysisIn unguided analysis mode each application analysis stage has a Run analysis buttonthat can be used to generate the analysis results for that stage. When the Run analysisbutton is selected, the profiler will execute the application to collect the profiling dataneeded to perform the analysis. The green check-mark next to an analysis stage indicatesthat the analysis results for that stage are available. Each analysis result contains a briefdescription of the analysis and a More… link to detailed documentation on the analysis.When you select an analysis result, the timeline rows or intervals associated with thatresult are highlighted in the Timeline View.
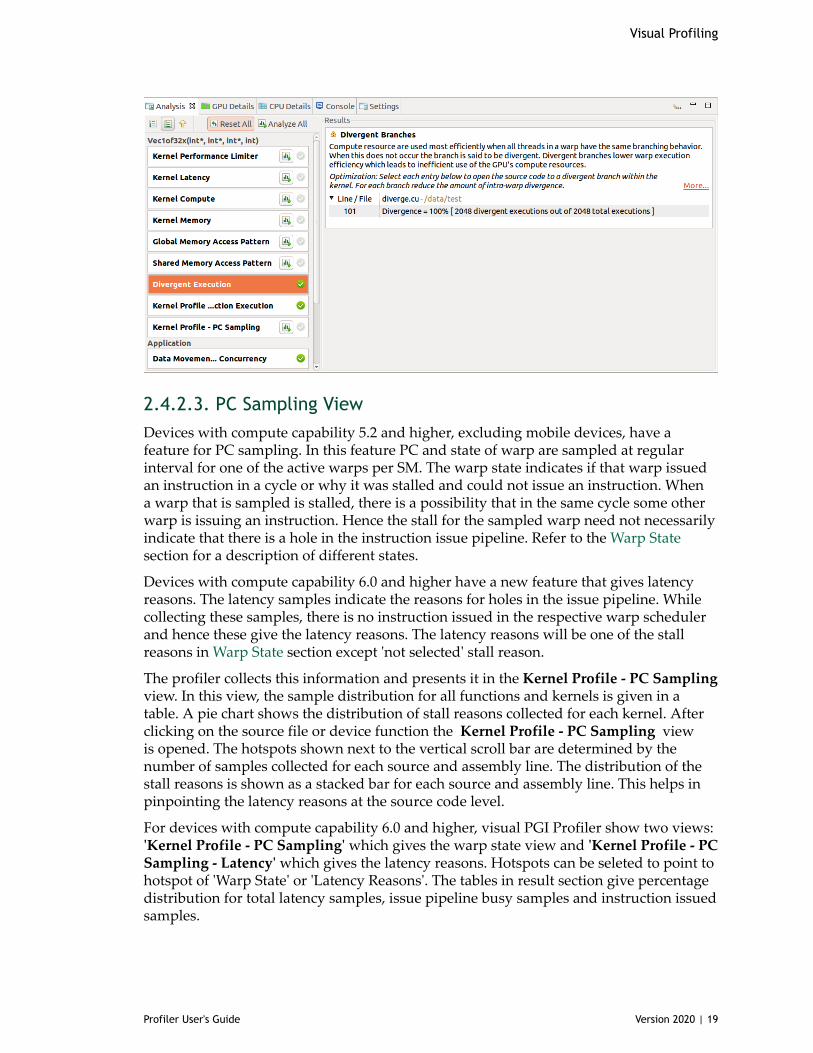
When a single kernel instance is selected in the timeline, additional kernel-specificanalysis stages are available. Each kernel-specific analysis stage has a Run analysisbutton that operates in the same manner as for the application analysis stages. Thefollowing figure shows the analysis results for the Divergent Execution analysis stage.Some kernel instance analysis results, like Divergent Execution, are associated withspecific source-lines within the kernel. To see the source associated with each result,select an entry from the table. The source file associated with that entry will open.
Visual Profiling
Profiler User's Guide Version 2020 | 19
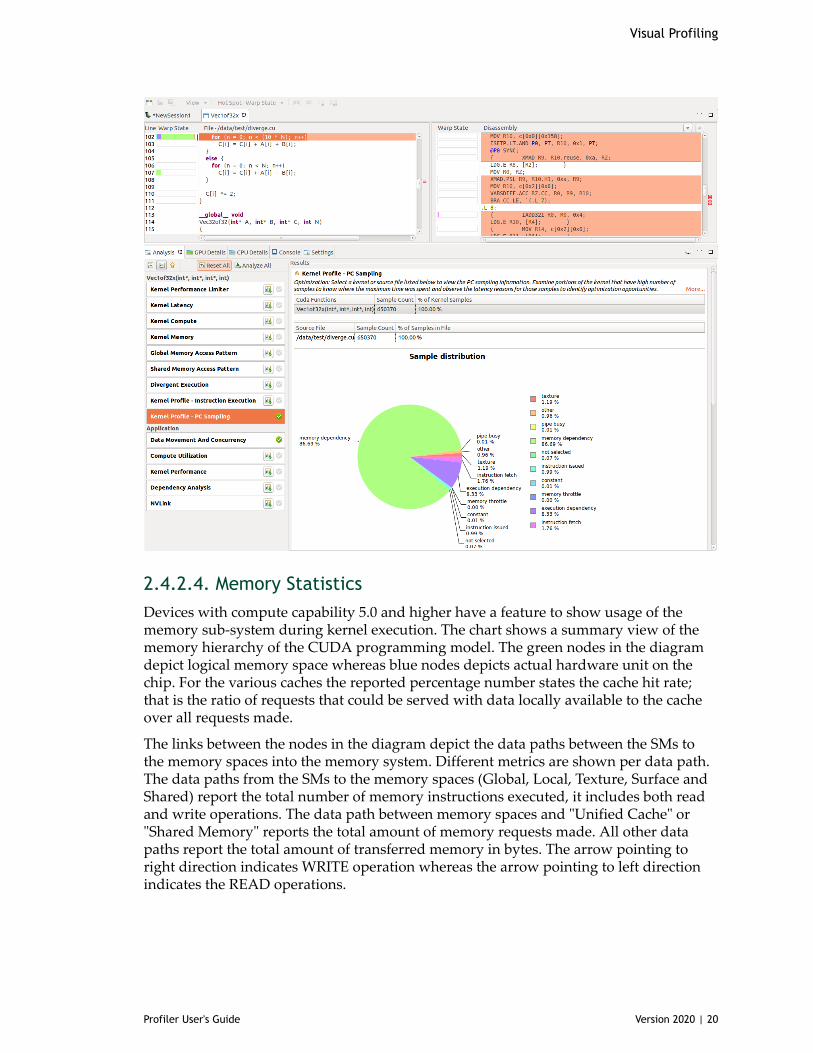
2.4.2.3. PC Sampling ViewDevices with compute capability 5.2 and higher, excluding mobile devices, have afeature for PC sampling. In this feature PC and state of warp are sampled at regularinterval for one of the active warps per SM. The warp state indicates if that warp issuedan instruction in a cycle or why it was stalled and could not issue an instruction. Whena warp that is sampled is stalled, there is a possibility that in the same cycle some otherwarp is issuing an instruction. Hence the stall for the sampled warp need not necessarilyindicate that there is a hole in the instruction issue pipeline. Refer to the Warp Statesection for a description of different states.
Devices with compute capability 6.0 and higher have a new feature that gives latencyreasons. The latency samples indicate the reasons for holes in the issue pipeline. Whilecollecting these samples, there is no instruction issued in the respective warp schedulerand hence these give the latency reasons. The latency reasons will be one of the stallreasons in Warp State section except 'not selected' stall reason.
The profiler collects this information and presents it in the Kernel Profile - PC Samplingview. In this view, the sample distribution for all functions and kernels is given in atable. A pie chart shows the distribution of stall reasons collected for each kernel. Afterclicking on the source file or device function the Kernel Profile - PC Sampling viewis opened. The hotspots shown next to the vertical scroll bar are determined by thenumber of samples collected for each source and assembly line. The distribution of thestall reasons is shown as a stacked bar for each source and assembly line. This helps inpinpointing the latency reasons at the source code level.
For devices with compute capability 6.0 and higher, visual PGI Profiler show two views:'Kernel Profile - PC Sampling' which gives the warp state view and 'Kernel Profile - PCSampling - Latency' which gives the latency reasons. Hotspots can be seleted to point tohotspot of 'Warp State' or 'Latency Reasons'. The tables in result section give percentagedistribution for total latency samples, issue pipeline busy samples and instruction issuedsamples.
Visual Profiling
Profiler User's Guide Version 2020 | 20
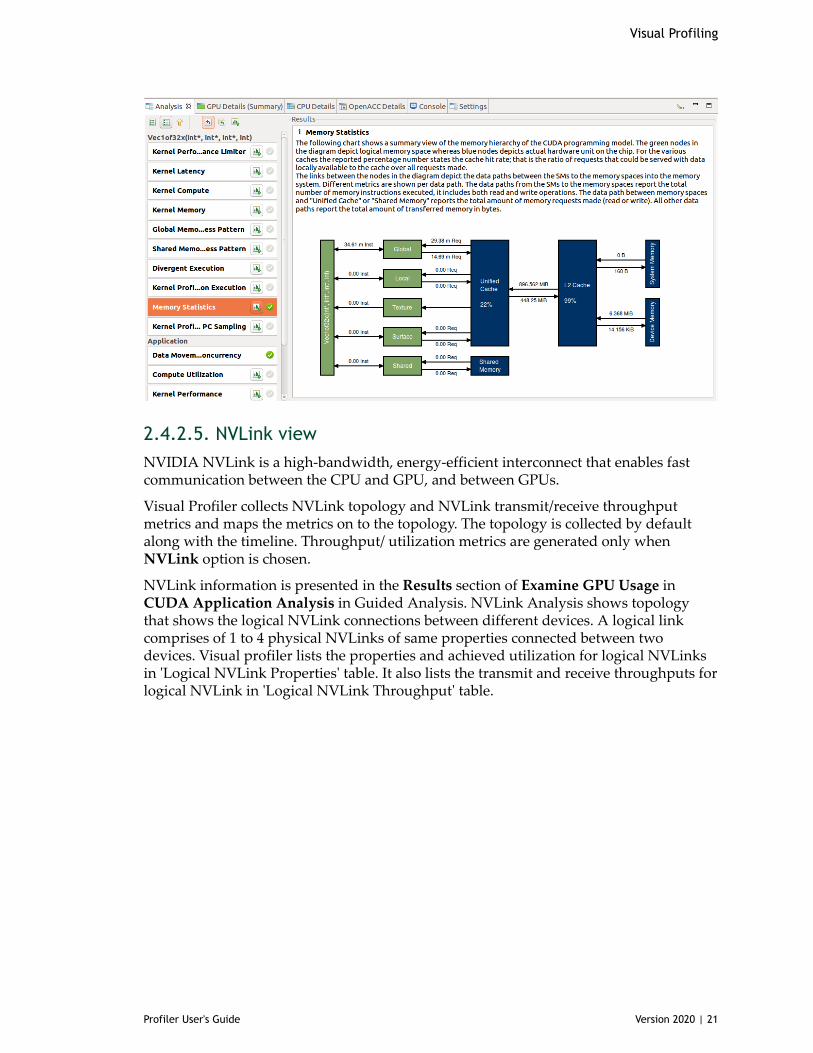
2.4.2.4. Memory StatisticsDevices with compute capability 5.0 and higher have a feature to show usage of thememory sub-system during kernel execution. The chart shows a summary view of thememory hierarchy of the CUDA programming model. The green nodes in the diagramdepict logical memory space whereas blue nodes depicts actual hardware unit on thechip. For the various caches the reported percentage number states the cache hit rate;that is the ratio of requests that could be served with data locally available to the cacheover all requests made.
The links between the nodes in the diagram depict the data paths between the SMs tothe memory spaces into the memory system. Different metrics are shown per data path.The data paths from the SMs to the memory spaces (Global, Local, Texture, Surface andShared) report the total number of memory instructions executed, it includes both readand write operations. The data path between memory spaces and "Unified Cache" or"Shared Memory" reports the total amount of memory requests made. All other datapaths report the total amount of transferred memory in bytes. The arrow pointing toright direction indicates WRITE operation whereas the arrow pointing to left directionindicates the READ operations.
Visual Profiling
Profiler User's Guide Version 2020 | 21
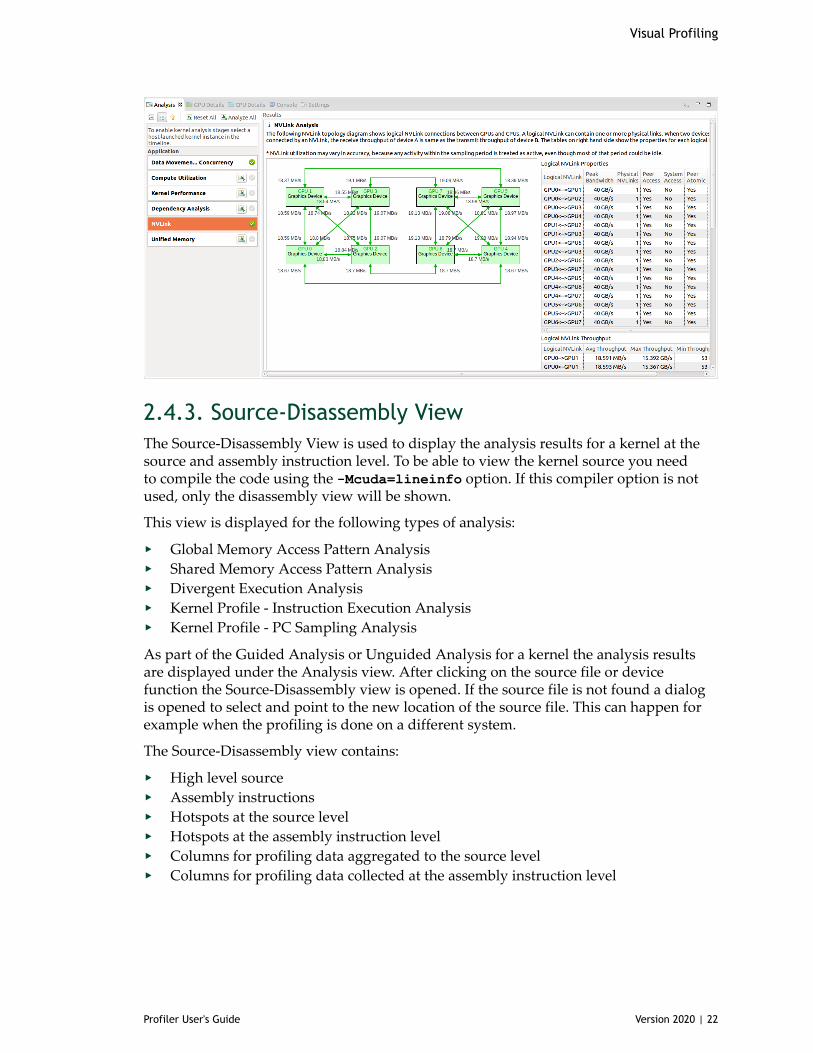
2.4.2.5. NVLink viewNVIDIA NVLink is a high-bandwidth, energy-efficient interconnect that enables fastcommunication between the CPU and GPU, and between GPUs.
Visual Profiler collects NVLink topology and NVLink transmit/receive throughputmetrics and maps the metrics on to the topology. The topology is collected by defaultalong with the timeline. Throughput/ utilization metrics are generated only whenNVLink option is chosen.
NVLink information is presented in the Results section of Examine GPU Usage inCUDA Application Analysis in Guided Analysis. NVLink Analysis shows topologythat shows the logical NVLink connections between different devices. A logical linkcomprises of 1 to 4 physical NVLinks of same properties connected between twodevices. Visual profiler lists the properties and achieved utilization for logical NVLinksin 'Logical NVLink Properties' table. It also lists the transmit and receive throughputs forlogical NVLink in 'Logical NVLink Throughput' table.
Visual Profiling
Profiler User's Guide Version 2020 | 22
2.4.3. Source-Disassembly ViewThe Source-Disassembly View is used to display the analysis results for a kernel at thesource and assembly instruction level. To be able to view the kernel source you needto compile the code using the -Mcuda=lineinfo option. If this compiler option is notused, only the disassembly view will be shown.
This view is displayed for the following types of analysis:
‣ Global Memory Access Pattern Analysis‣ Shared Memory Access Pattern Analysis‣ Divergent Execution Analysis‣ Kernel Profile - Instruction Execution Analysis‣ Kernel Profile - PC Sampling Analysis
As part of the Guided Analysis or Unguided Analysis for a kernel the analysis resultsare displayed under the Analysis view. After clicking on the source file or devicefunction the Source-Disassembly view is opened. If the source file is not found a dialogis opened to select and point to the new location of the source file. This can happen forexample when the profiling is done on a different system.
The Source-Disassembly view contains:
‣ High level source‣ Assembly instructions‣ Hotspots at the source level‣ Hotspots at the assembly instruction level‣ Columns for profiling data aggregated to the source level‣ Columns for profiling data collected at the assembly instruction level

Visual Profiling
Profiler User's Guide Version 2020 | 23
The information shown in the Source-Disassembly view can be customized by thefollowing toolbar options:
‣ View menu - Select one or more out of the available profiler data columns to display.This is chosen by default based on the analysis type.
‣ Hot Spot menu - Select which profiler data to use for hot spots. This is chosen bydefault based on the analysis type.
‣ Show the source and disassembly views side by side.‣ Show the source and disassembly views top to bottom.‣ Maximize the source view‣ Maximize the disassembly view
Hotspots are colored based on level of importance - low, medium or high. Hovering themouse over the hotspot displays the value of the profiler data, the level of importanceand the source or disassembly line. You can click on a hotspot at the source level orassembly instruction level to view the source or disassembly line corresponding to thehotspot.
In the disassembly view the assembly instructions corresponding to the selected sourceline are highlighted. You can click on the up and down arrow buttons displayed at theright of the disassembly column header to navigate to the next or previous instructionblock.
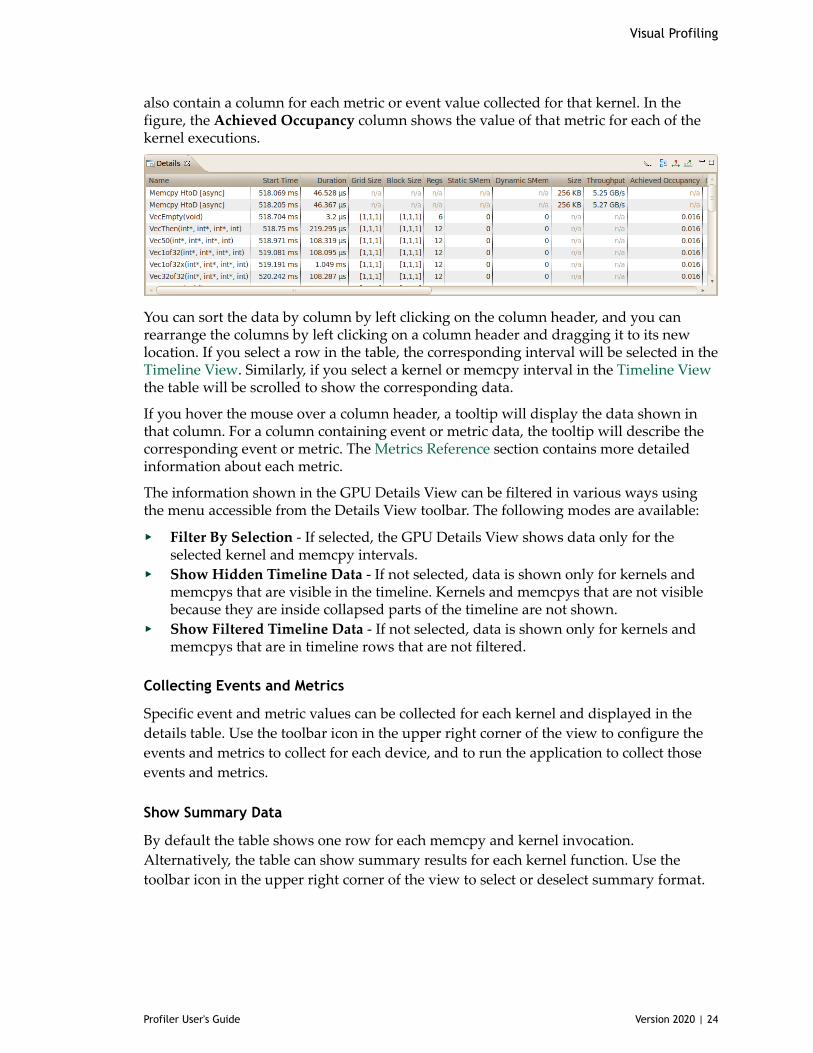
2.4.4. GPU Details ViewThe GPU Details View displays a table of information for each memory copy andkernel execution in the profiled application. The following figure shows the tablecontaining several memcpy and kernel executions. Each row of the table containsgeneral information for a kernel execution or memory copy. For kernels, the table will
Visual Profiling
Profiler User's Guide Version 2020 | 24
also contain a column for each metric or event value collected for that kernel. In thefigure, the Achieved Occupancy column shows the value of that metric for each of thekernel executions.
You can sort the data by column by left clicking on the column header, and you canrearrange the columns by left clicking on a column header and dragging it to its newlocation. If you select a row in the table, the corresponding interval will be selected in theTimeline View. Similarly, if you select a kernel or memcpy interval in the Timeline Viewthe table will be scrolled to show the corresponding data.
If you hover the mouse over a column header, a tooltip will display the data shown inthat column. For a column containing event or metric data, the tooltip will describe thecorresponding event or metric. The Metrics Reference section contains more detailedinformation about each metric.
The information shown in the GPU Details View can be filtered in various ways usingthe menu accessible from the Details View toolbar. The following modes are available:
‣ Filter By Selection - If selected, the GPU Details View shows data only for theselected kernel and memcpy intervals.
‣ Show Hidden Timeline Data - If not selected, data is shown only for kernels andmemcpys that are visible in the timeline. Kernels and memcpys that are not visiblebecause they are inside collapsed parts of the timeline are not shown.
‣ Show Filtered Timeline Data - If not selected, data is shown only for kernels andmemcpys that are in timeline rows that are not filtered.
Collecting Events and Metrics
Specific event and metric values can be collected for each kernel and displayed in thedetails table. Use the toolbar icon in the upper right corner of the view to configure theevents and metrics to collect for each device, and to run the application to collect thoseevents and metrics.
Show Summary Data
By default the table shows one row for each memcpy and kernel invocation.Alternatively, the table can show summary results for each kernel function. Use thetoolbar icon in the upper right corner of the view to select or deselect summary format.
Visual Profiling
Profiler User's Guide Version 2020 | 25
Formatting Table Contents
The numbers in the table can be displayed either with or without grouping separators.Use the toolbar icon in the upper right corner of the view to select or deselect groupingseparators.
Exporting Details
The contents of the table can be exported in CSV format using the toolbar icon in theupper right corner of the view.
2.4.5. CPU Details View
CPU Details view
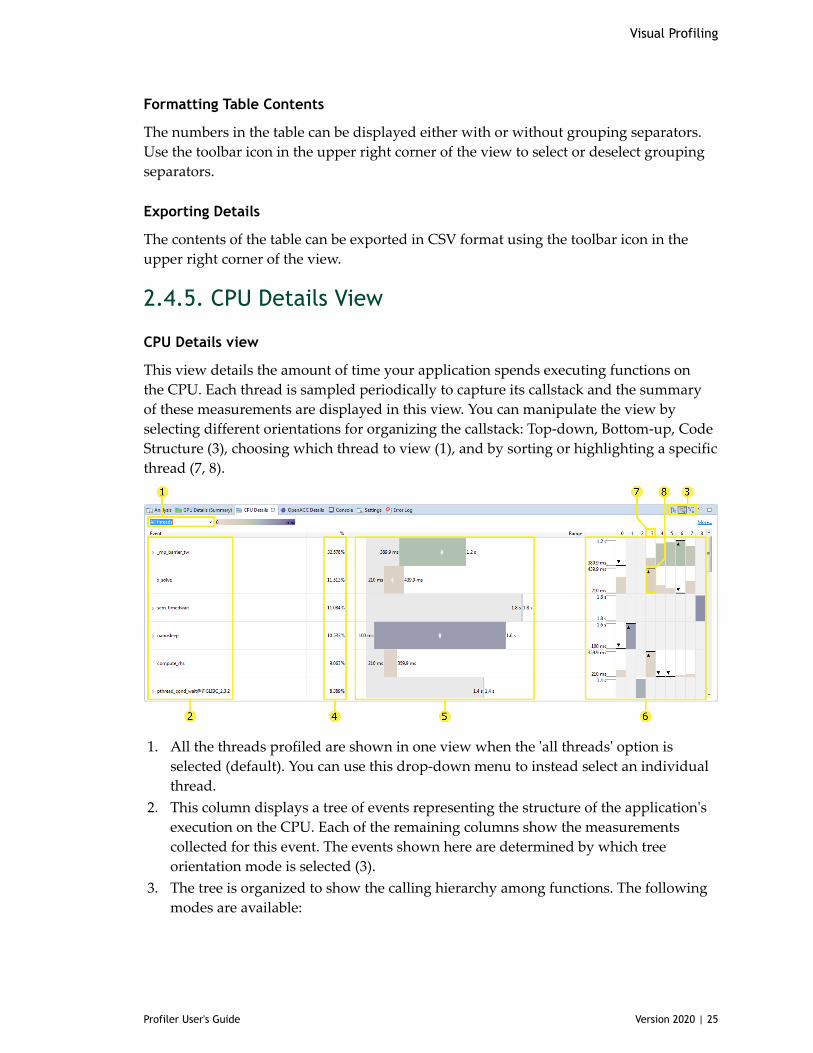
This view details the amount of time your application spends executing functions onthe CPU. Each thread is sampled periodically to capture its callstack and the summaryof these measurements are displayed in this view. You can manipulate the view byselecting different orientations for organizing the callstack: Top-down, Bottom-up, CodeStructure (3), choosing which thread to view (1), and by sorting or highlighting a specificthread (7, 8).
1. All the threads profiled are shown in one view when the 'all threads' option isselected (default). You can use this drop-down menu to instead select an individualthread.
2. This column displays a tree of events representing the structure of the application'sexecution on the CPU. Each of the remaining columns show the measurementscollected for this event. The events shown here are determined by which treeorientation mode is selected (3).
3. The tree is organized to show the calling hierarchy among functions. The followingmodes are available:
Visual Profiling
Profiler User's Guide Version 2020 | 26
‣ Top-down (callers first) call tree view - The CPU details tree is organized as acall tree with each function shown as a child of its caller. In this mode you cansee the callstack starting at the 'main' function.
‣ Bottom-up (callees first) call tree view - The CPU details tree is organized insuch a way that each function is shown as a child of any functions it calls. In thismode you can quickly identify the call path that contributes the most time to theapplication's execution.
‣ Code structure (file and line) tree view - The CPU details tree shows whichfunctions belong to each source file and library as well as how much of theapplication's execution is attributed to a given line of source code.
In every mode the time listed for each function is 'inclusive' and includes time spentboth in this function and any functions that it calls. For the code structure view theregion of code is inclusive (i.e. the file entry lists the time spent in every functioncontained within a file).
4. This column displays the total amount of time spent by all threads in this event as apercentage of the total amount of time spent in all events.
5. This column displays a bar denoting a range where the amount of time spent in anevent by any thread is always within this this range. On the left the minimum valueis written, and on the right the maximum value is written. Also, if there is space, asmall 'diamond' is drawn in the middle of the bar where the mean time is spent inthis event across all threads.
6. These columns display a distinct chart for each event. On the left is a vertical scaleshowing the same minimum and maximum values as shown on the range chart.The following columns each show the amount of time spent in this event by thread.If the cell for the given event / thread combination is greyed out then no time wasspent by this thread in this event (for this example both threads 1 and 2 spentno time in the event 'x_solve'). Furthermore, the thread(s) with the minimum ormaximum amount of time spent in the event across all threads are annotated withthe 'triangle / line'. In this example thread 3 spent the most and thread 6 the leastamount of time in the event 'x_solve'.
7. To reorder the rows by the time spent on a given thread click on the thread columnheader.
8. To highlight a given thread click on one of its bars in this chart.
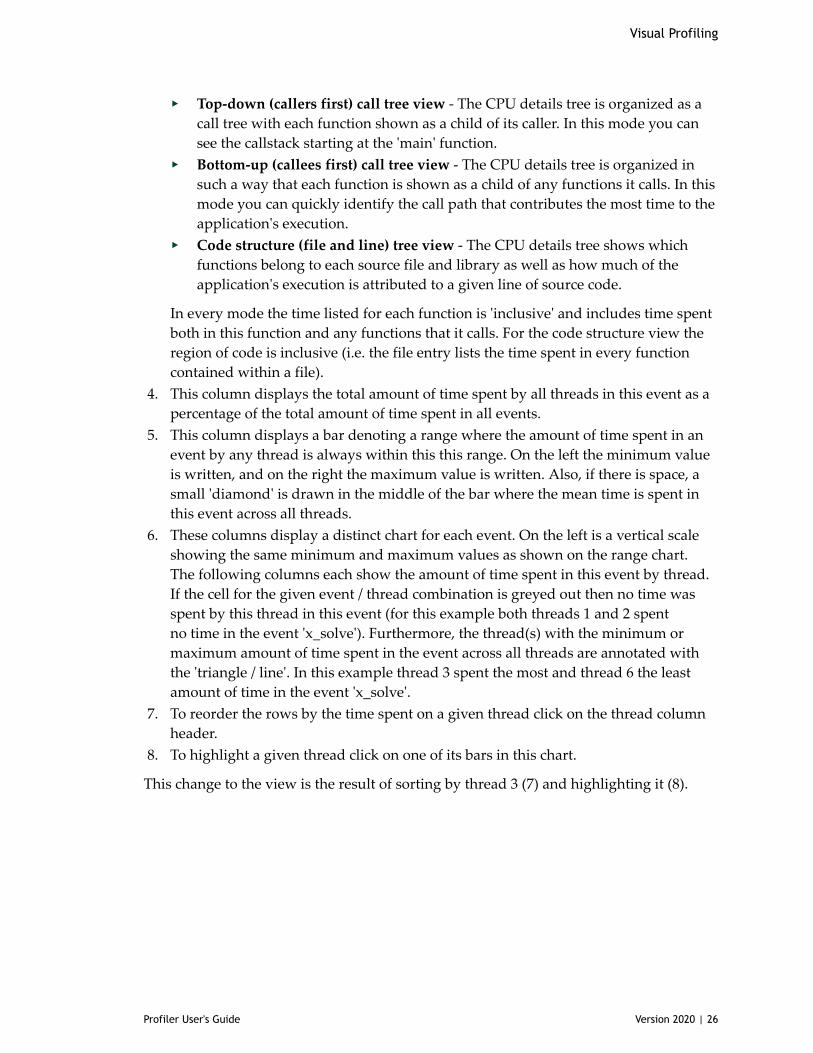
This change to the view is the result of sorting by thread 3 (7) and highlighting it (8).
Visual Profiling
Profiler User's Guide Version 2020 | 27
1. Having highlighted thread 3 we now see a vertical line on the range chart showingthe amount of time this thread spent in this event compared to the range across allthread.
2. This thread is also highlighted on each row.
CPU Threads
CPU Source Code
You can open the CPU Source View for any function by double-clicking on it in the tree.To be displayed the source files must be on the local file system. By default the directorycontaining the executable or profile file is searched. If the source file cannot be found aprompt will appear asking for its location. Sometimes a file within a specific directory isbeing sought, in this case you should give the path to where this directory resides.
Tip The CPU profile is gathered by periodically sampling the state of the runningapplication. For this reason a function will only appear in this view if it was sampledduring execution. Short-running or very infrequently called functions are less likelyto be sampled. If a function was not sampled the time it was running is accounted tothe function that called it. In order to gather a CPU profile that is representative ofthe application's performance the code of interest must execute for enough to gatherenough samples. Usually a minute of runtime is sufficient.
Tip The file and line information is gathered from the application's debug informationobtained by the compiler. To ensure that this information is available it isrecommended that you compile with '-g' or a similar option.
Visual Profiling
Profiler User's Guide Version 2020 | 28
2.4.6. OpenACC Details View
OpenACC table view
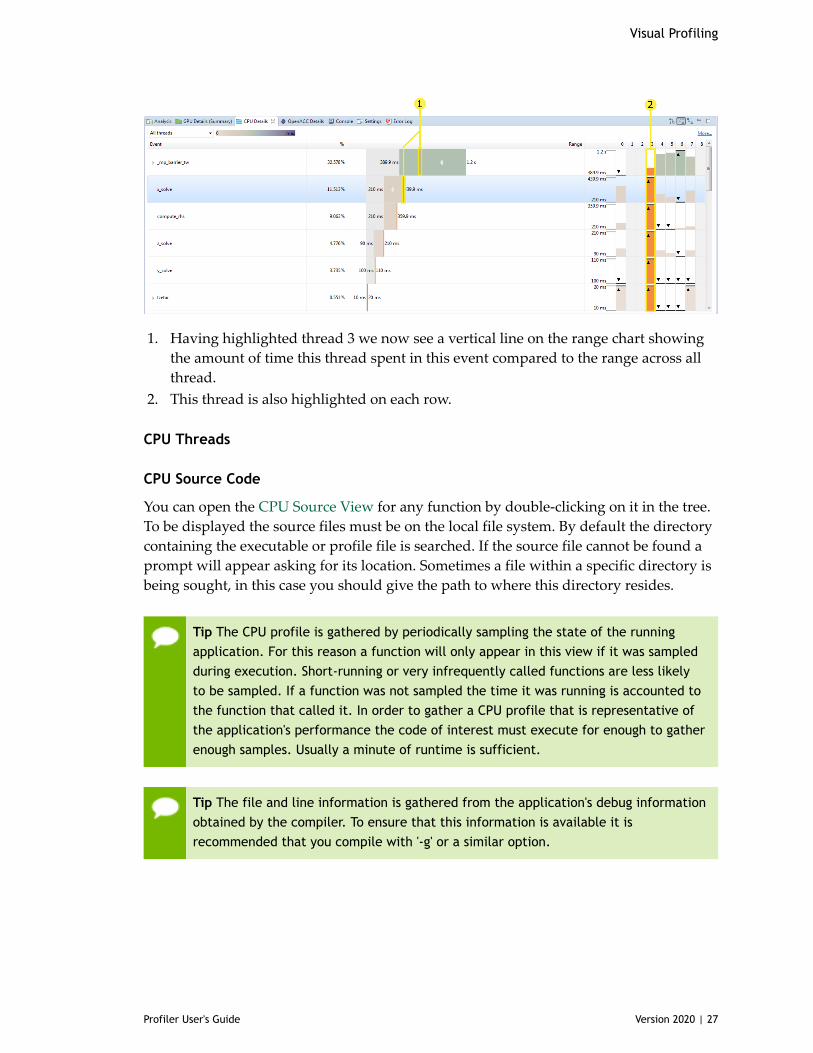
The OpenACC Details View displays each OpenACC runtime activity executed by theprofiled application. Each activity is grouped by source location: each activity whichoccurs at the same file and line number in the application's source code is placed undera node labeled with the source location. Each activity shows the amount of time spent bythe profiled application as both a unit of time and as a percentage of the total time thisapplication was executing any OpenACC activity. Also the number of times this activitywas called is shown. There are two ways to count how much time is spent in a particularOpenACC activity:
‣ Show the Inclusive durations (counting any other OpenACC activities running atthe same time) in the OpenACC details view - The OpenACC details view showsthe total time spent in each activity including any activities that were executed as theresult of this activity. In this case the amount of time spent in each activity occurringat a given application source location is totaled and displayed on the row displayingthe source location.
‣ Show the Exclusive durations (excluding any other OpenACC activities runningat the same time) in the OpenACC details view - The OpenACC details viewshows the time spent only in a given activity. In this case the amount of time spentat a given source location is always zero—time is attributed solely to each activityoccurring at this source location.
Visual Profiling
Profiler User's Guide Version 2020 | 29
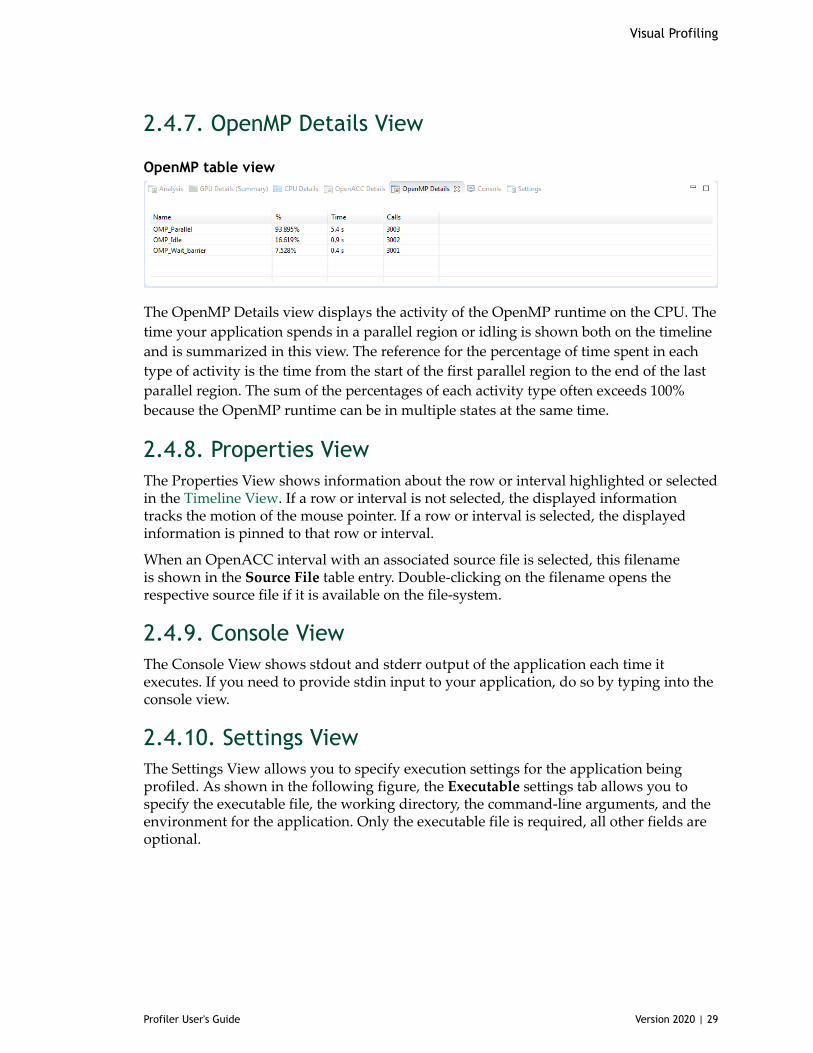
2.4.7. OpenMP Details View
OpenMP table view
The OpenMP Details view displays the activity of the OpenMP runtime on the CPU. Thetime your application spends in a parallel region or idling is shown both on the timelineand is summarized in this view. The reference for the percentage of time spent in eachtype of activity is the time from the start of the first parallel region to the end of the lastparallel region. The sum of the percentages of each activity type often exceeds 100%because the OpenMP runtime can be in multiple states at the same time.
2.4.8. Properties ViewThe Properties View shows information about the row or interval highlighted or selectedin the Timeline View. If a row or interval is not selected, the displayed informationtracks the motion of the mouse pointer. If a row or interval is selected, the displayedinformation is pinned to that row or interval.
When an OpenACC interval with an associated source file is selected, this filenameis shown in the Source File table entry. Double-clicking on the filename opens therespective source file if it is available on the file-system.
2.4.9. Console ViewThe Console View shows stdout and stderr output of the application each time itexecutes. If you need to provide stdin input to your application, do so by typing into theconsole view.
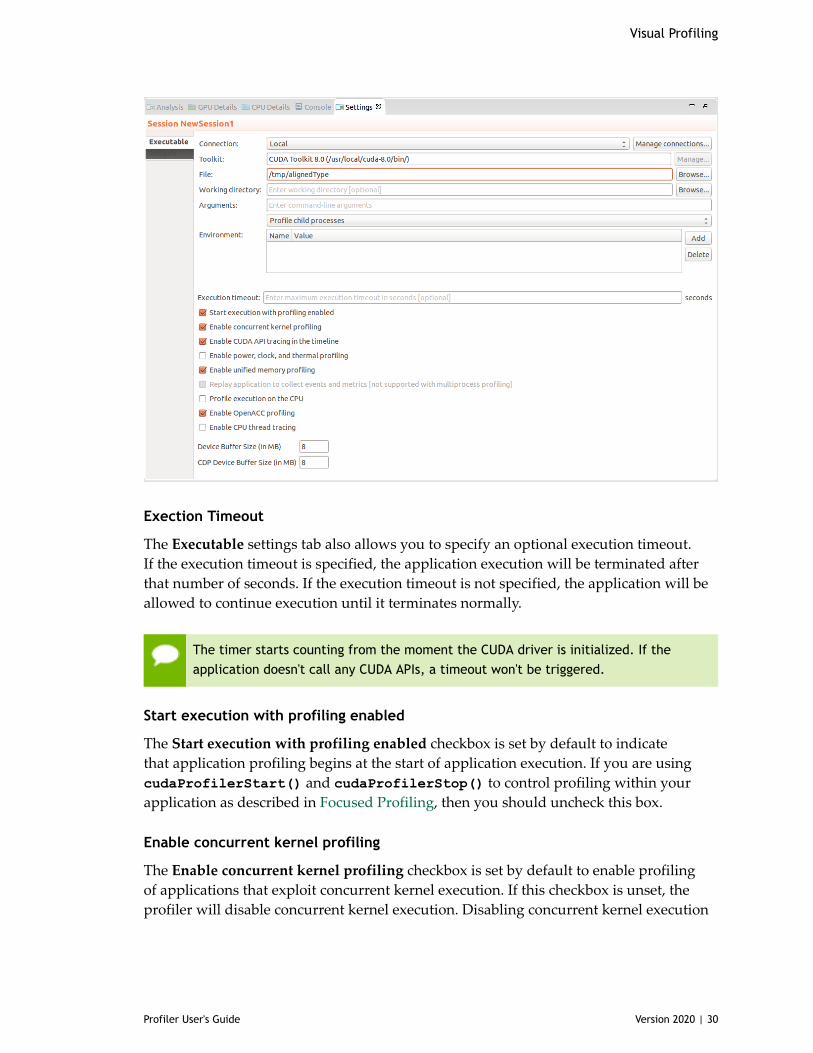
2.4.10. Settings ViewThe Settings View allows you to specify execution settings for the application beingprofiled. As shown in the following figure, the Executable settings tab allows you tospecify the executable file, the working directory, the command-line arguments, and theenvironment for the application. Only the executable file is required, all other fields areoptional.
Visual Profiling
Profiler User's Guide Version 2020 | 30
Exection Timeout
The Executable settings tab also allows you to specify an optional execution timeout.If the execution timeout is specified, the application execution will be terminated afterthat number of seconds. If the execution timeout is not specified, the application will beallowed to continue execution until it terminates normally.
The timer starts counting from the moment the CUDA driver is initialized. If theapplication doesn't call any CUDA APIs, a timeout won't be triggered.
Start execution with profiling enabled
The Start execution with profiling enabled checkbox is set by default to indicatethat application profiling begins at the start of application execution. If you are usingcudaProfilerStart() and cudaProfilerStop() to control profiling within yourapplication as described in Focused Profiling, then you should uncheck this box.
Enable concurrent kernel profiling
The Enable concurrent kernel profiling checkbox is set by default to enable profilingof applications that exploit concurrent kernel execution. If this checkbox is unset, theprofiler will disable concurrent kernel execution. Disabling concurrent kernel execution
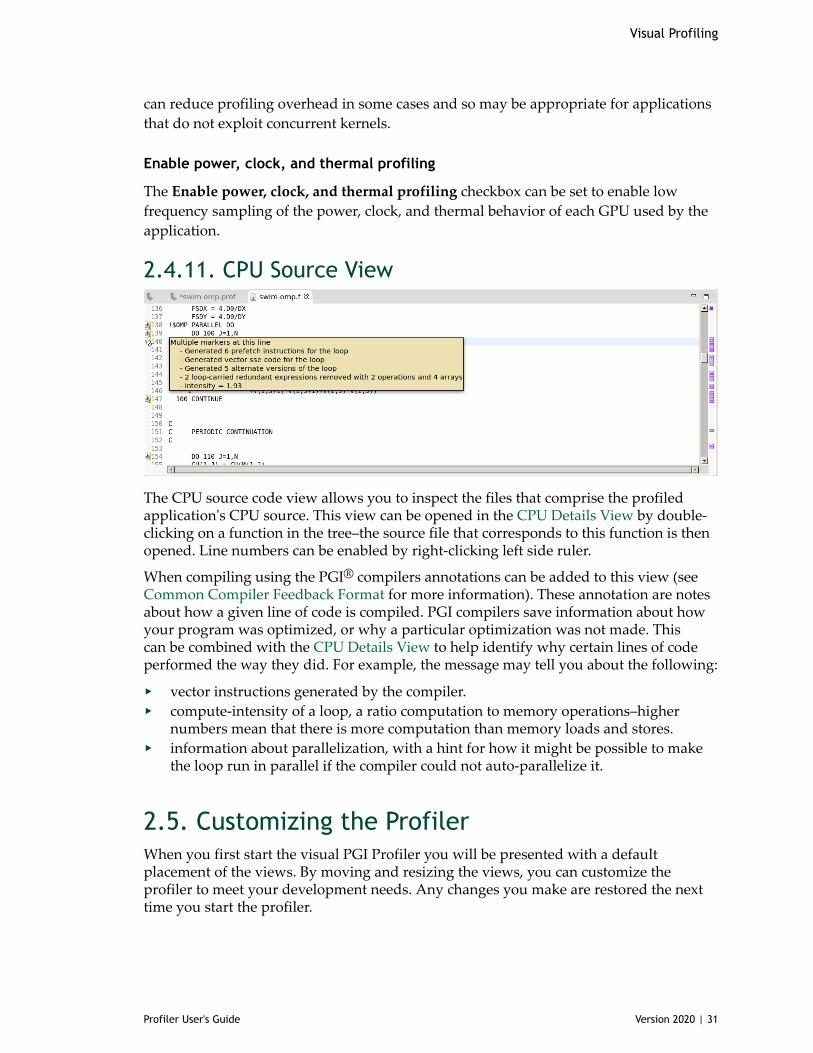
Visual Profiling
Profiler User's Guide Version 2020 | 31
can reduce profiling overhead in some cases and so may be appropriate for applicationsthat do not exploit concurrent kernels.
Enable power, clock, and thermal profiling
The Enable power, clock, and thermal profiling checkbox can be set to enable lowfrequency sampling of the power, clock, and thermal behavior of each GPU used by theapplication.
2.4.11. CPU Source View
The CPU source code view allows you to inspect the files that comprise the profiledapplication's CPU source. This view can be opened in the CPU Details View by double-clicking on a function in the tree–the source file that corresponds to this function is thenopened. Line numbers can be enabled by right-clicking left side ruler.
When compiling using the PGI® compilers annotations can be added to this view (seeCommon Compiler Feedback Format for more information). These annotation are notesabout how a given line of code is compiled. PGI compilers save information about howyour program was optimized, or why a particular optimization was not made. Thiscan be combined with the CPU Details View to help identify why certain lines of codeperformed the way they did. For example, the message may tell you about the following:
‣ vector instructions generated by the compiler.‣ compute-intensity of a loop, a ratio computation to memory operations–higher
numbers mean that there is more computation than memory loads and stores.‣ information about parallelization, with a hint for how it might be possible to make
the loop run in parallel if the compiler could not auto-parallelize it.
2.5. Customizing the ProfilerWhen you first start the visual PGI Profiler you will be presented with a defaultplacement of the views. By moving and resizing the views, you can customize theprofiler to meet your development needs. Any changes you make are restored the nexttime you start the profiler.
Visual Profiling
Profiler User's Guide Version 2020 | 32
2.5.1. Resizing a ViewTo resize a view, simply left click and drag on the dividing area between the views. Allviews stacked together in one area are resized at the same time.
2.5.2. Reordering a ViewTo reorder a view in a stacked set of views, left click and drag the view tab to the newlocation within the view stack.
2.5.3. Moving a Viewto move a view, left click the view tab and drag it to its new location. As you drag theview, an outline will show the target location for the view. You can place the view in anew location, or stack it in the same location as other views.
2.5.4. Undocking a ViewYou can undock a view from the profiler window so that the view occupies its ownstand-alone window. You may want to do this to take advantage of multiple monitorsor to maximum the size of an individual view. To undock a view, left click the view taband drag it outside of the profiler window. To dock a view, left click the view tab (not thewindow decoration) and drag it into the profiler window.
2.5.5. Opening and Closing a ViewUse the X icon on a view tab to close a view. To open a view, use the View menu.
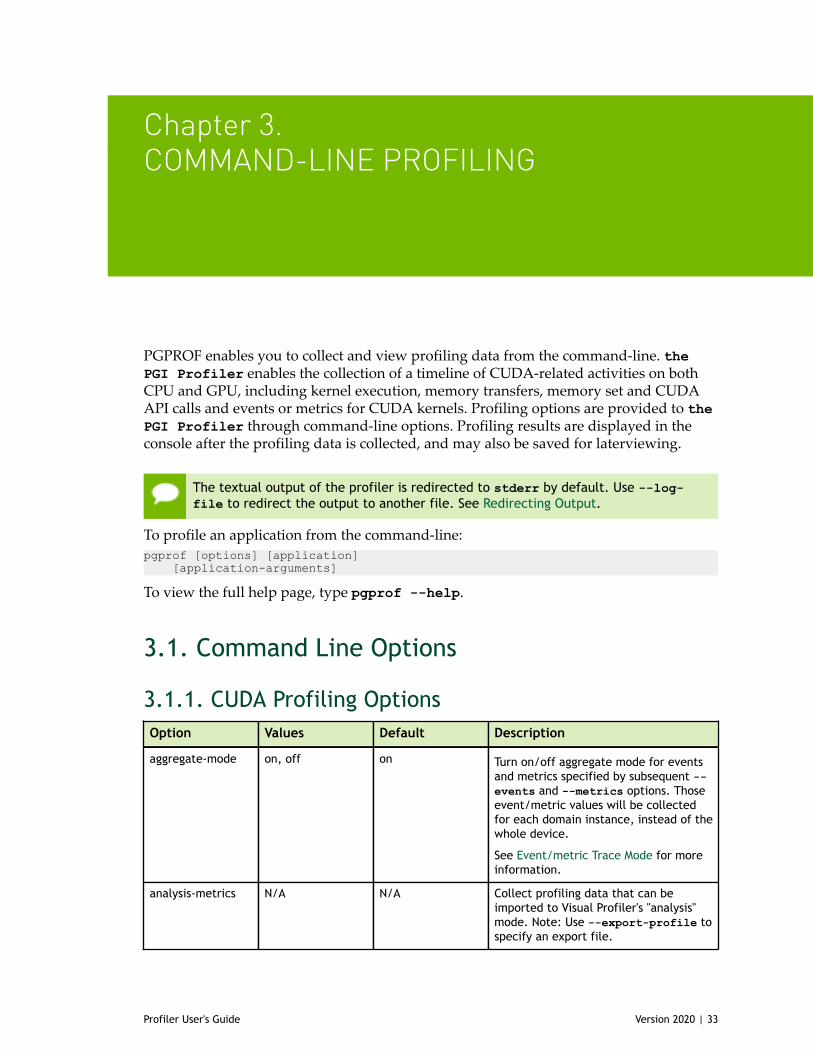
Profiler User's Guide Version 2020 | 33
Chapter 3.COMMAND-LINE PROFILING
PGPROF enables you to collect and view profiling data from the command-line. thePGI Profiler enables the collection of a timeline of CUDA-related activities on bothCPU and GPU, including kernel execution, memory transfers, memory set and CUDAAPI calls and events or metrics for CUDA kernels. Profiling options are provided to thePGI Profiler through command-line options. Profiling results are displayed in theconsole after the profiling data is collected, and may also be saved for laterviewing.
The textual output of the profiler is redirected to stderr by default. Use --log-file to redirect the output to another file. See Redirecting Output.
To profile an application from the command-line:pgprof [options] [application] [application-arguments]
To view the full help page, type pgprof --help.
3.1. Command Line Options
3.1.1. CUDA Profiling OptionsOption Values Default Description
aggregate-mode on, off on Turn on/off aggregate mode for eventsand metrics specified by subsequent --events and --metrics options. Thoseevent/metric values will be collectedfor each domain instance, instead of thewhole device.
See Event/metric Trace Mode for moreinformation.
analysis-metrics N/A N/A Collect profiling data that can beimported to Visual Profiler's "analysis"mode. Note: Use --export-profile tospecify an export file.
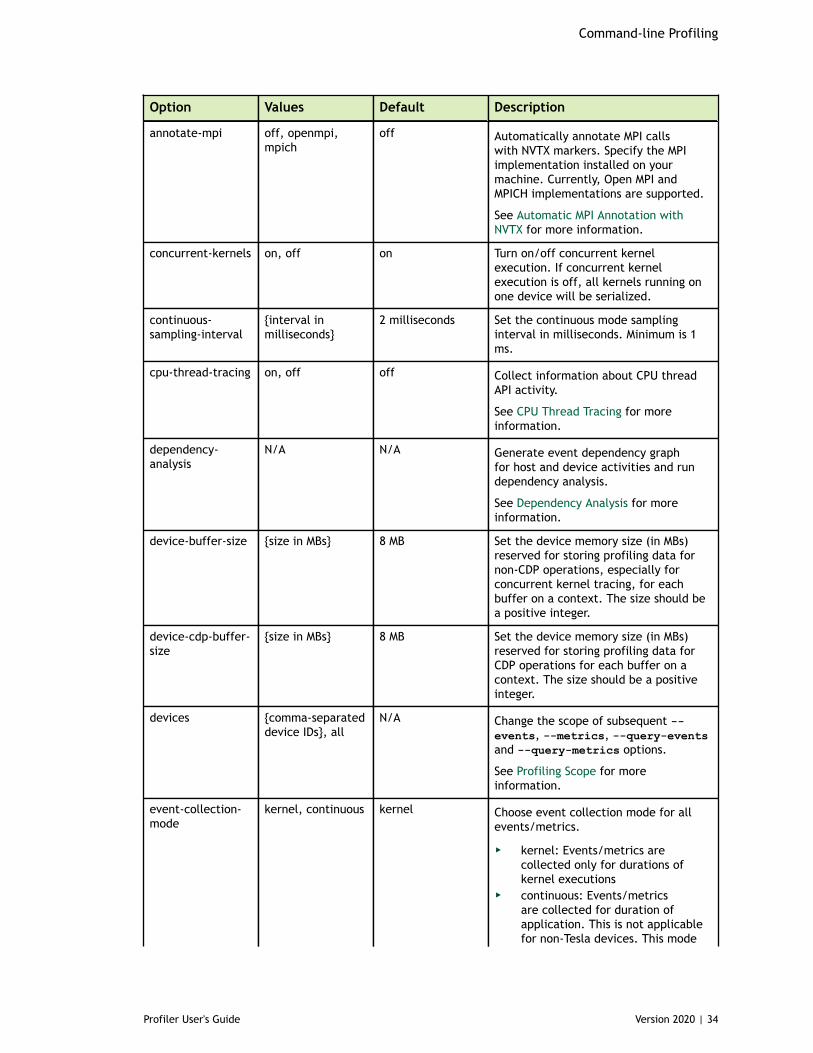
Command-line Profiling
Profiler User's Guide Version 2020 | 34
Option Values Default Description
annotate-mpi off, openmpi,mpich
off Automatically annotate MPI callswith NVTX markers. Specify the MPIimplementation installed on yourmachine. Currently, Open MPI andMPICH implementations are supported.
See Automatic MPI Annotation withNVTX for more information.
concurrent-kernels on, off on Turn on/off concurrent kernelexecution. If concurrent kernelexecution is off, all kernels running onone device will be serialized.
continuous-sampling-interval
{interval inmilliseconds}
2 milliseconds Set the continuous mode samplinginterval in milliseconds. Minimum is 1ms.
cpu-thread-tracing on, off off Collect information about CPU threadAPI activity.
See CPU Thread Tracing for moreinformation.
dependency-analysis
N/A N/A Generate event dependency graphfor host and device activities and rundependency analysis.
See Dependency Analysis for moreinformation.
device-buffer-size {size in MBs} 8 MB Set the device memory size (in MBs)reserved for storing profiling data fornon-CDP operations, especially forconcurrent kernel tracing, for eachbuffer on a context. The size should bea positive integer.
device-cdp-buffer-size
{size in MBs} 8 MB Set the device memory size (in MBs)reserved for storing profiling data forCDP operations for each buffer on acontext. The size should be a positiveinteger.
devices {comma-separateddevice IDs}, all
N/A Change the scope of subsequent --events, --metrics, --query-eventsand --query-metrics options.
See Profiling Scope for moreinformation.
event-collection-mode
kernel, continuous kernel Choose event collection mode for allevents/metrics.
‣ kernel: Events/metrics arecollected only for durations ofkernel executions
‣ continuous: Events/metricsare collected for duration ofapplication. This is not applicablefor non-Tesla devices. This mode
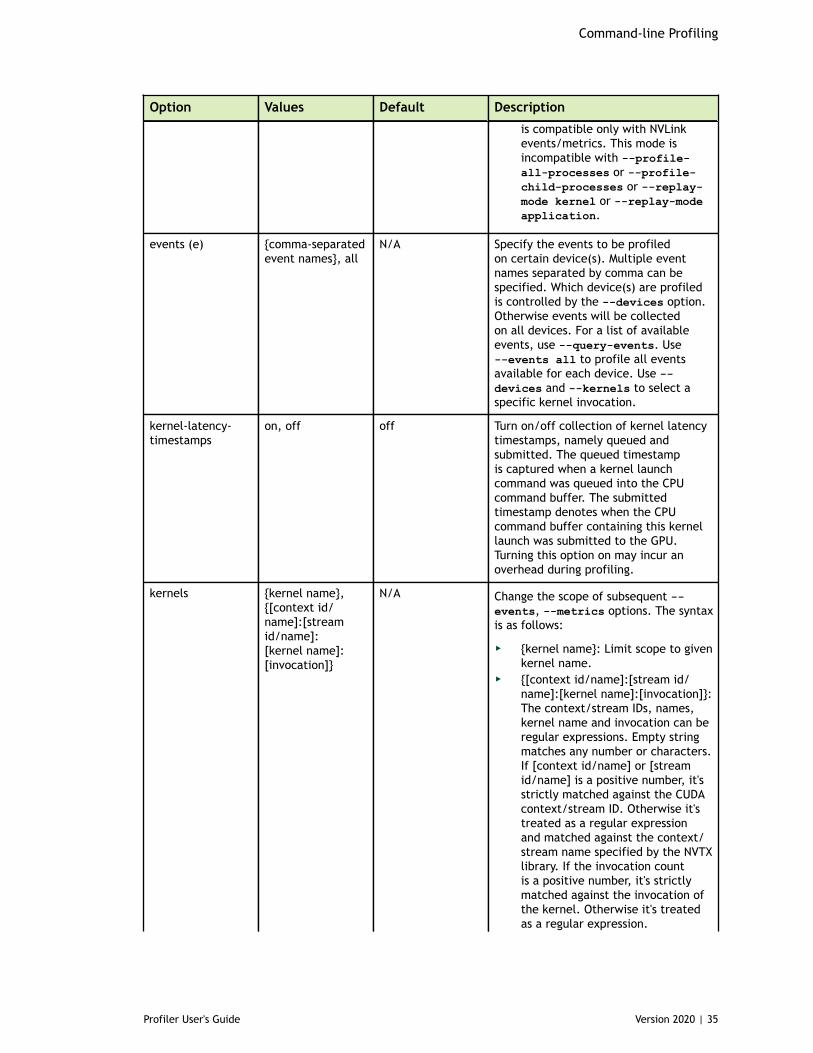
Command-line Profiling
Profiler User's Guide Version 2020 | 35
Option Values Default Description
is compatible only with NVLinkevents/metrics. This mode isincompatible with --profile-all-processes or --profile-child-processes or --replay-mode kernel or --replay-modeapplication.
events (e) {comma-separatedevent names}, all
N/A Specify the events to be profiledon certain device(s). Multiple eventnames separated by comma can bespecified. Which device(s) are profiledis controlled by the --devices option.Otherwise events will be collectedon all devices. For a list of availableevents, use --query-events. Use--events all to profile all eventsavailable for each device. Use --devices and --kernels to select aspecific kernel invocation.
kernel-latency-timestamps
on, off off Turn on/off collection of kernel latencytimestamps, namely queued andsubmitted. The queued timestampis captured when a kernel launchcommand was queued into the CPUcommand buffer. The submittedtimestamp denotes when the CPUcommand buffer containing this kernellaunch was submitted to the GPU.Turning this option on may incur anoverhead during profiling.
kernels {kernel name},{[context id/name]:[streamid/name]:[kernel name]:[invocation]}
N/A Change the scope of subsequent --events, --metrics options. The syntaxis as follows:
‣ {kernel name}: Limit scope to givenkernel name.
‣ {[context id/name]:[stream id/name]:[kernel name]:[invocation]}:The context/stream IDs, names,kernel name and invocation can beregular expressions. Empty stringmatches any number or characters.If [context id/name] or [streamid/name] is a positive number, it'sstrictly matched against the CUDAcontext/stream ID. Otherwise it'streated as a regular expressionand matched against the context/stream name specified by the NVTXlibrary. If the invocation countis a positive number, it's strictlymatched against the invocation ofthe kernel. Otherwise it's treatedas a regular expression.
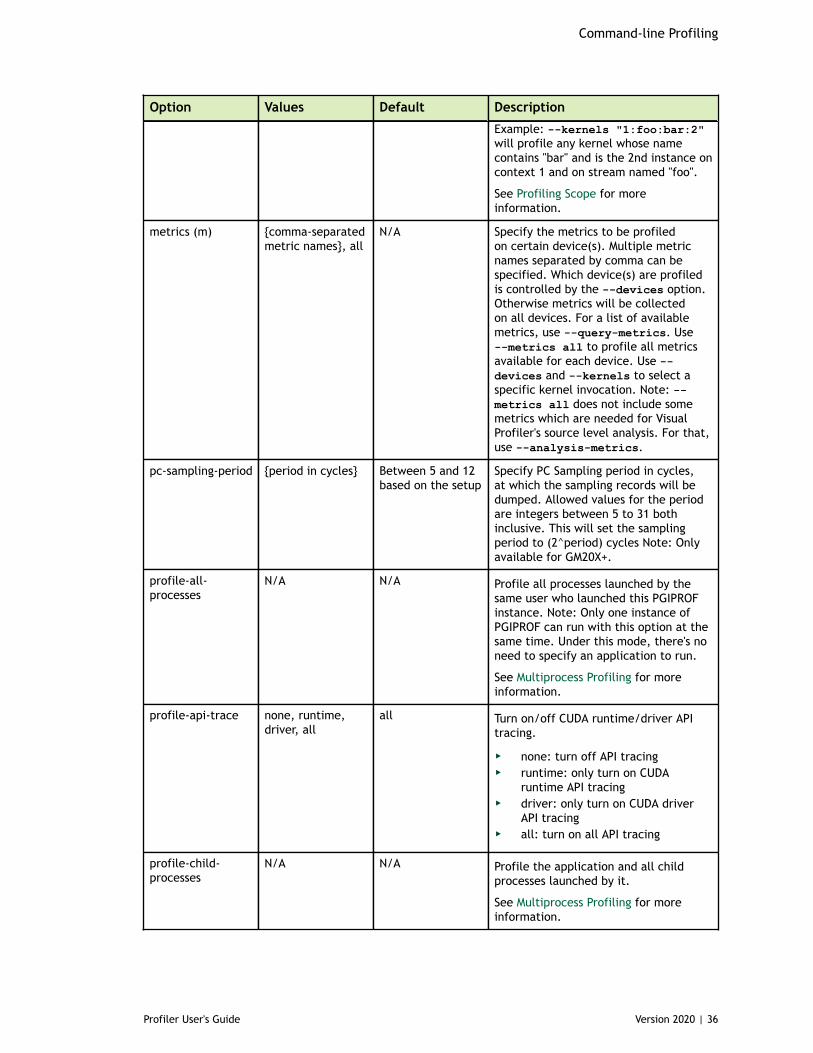
Command-line Profiling
Profiler User's Guide Version 2020 | 36
Option Values Default Description
Example: --kernels "1:foo:bar:2"will profile any kernel whose namecontains "bar" and is the 2nd instance oncontext 1 and on stream named "foo".
See Profiling Scope for moreinformation.
metrics (m) {comma-separatedmetric names}, all
N/A Specify the metrics to be profiledon certain device(s). Multiple metricnames separated by comma can bespecified. Which device(s) are profiledis controlled by the --devices option.Otherwise metrics will be collectedon all devices. For a list of availablemetrics, use --query-metrics. Use--metrics all to profile all metricsavailable for each device. Use --devices and --kernels to select aspecific kernel invocation. Note: --metrics all does not include somemetrics which are needed for VisualProfiler's source level analysis. For that,use --analysis-metrics.
pc-sampling-period {period in cycles} Between 5 and 12based on the setup
Specify PC Sampling period in cycles,at which the sampling records will bedumped. Allowed values for the periodare integers between 5 to 31 bothinclusive. This will set the samplingperiod to (2^period) cycles Note: Onlyavailable for GM20X+.
profile-all-processes
N/A N/A Profile all processes launched by thesame user who launched this PGIPROFinstance. Note: Only one instance ofPGIPROF can run with this option at thesame time. Under this mode, there's noneed to specify an application to run.
See Multiprocess Profiling for moreinformation.
profile-api-trace none, runtime,driver, all
all Turn on/off CUDA runtime/driver APItracing.
‣ none: turn off API tracing‣ runtime: only turn on CUDA
runtime API tracing‣ driver: only turn on CUDA driver
API tracing‣ all: turn on all API tracing
profile-child-processes
N/A N/A Profile the application and all childprocesses launched by it.
See Multiprocess Profiling for moreinformation.
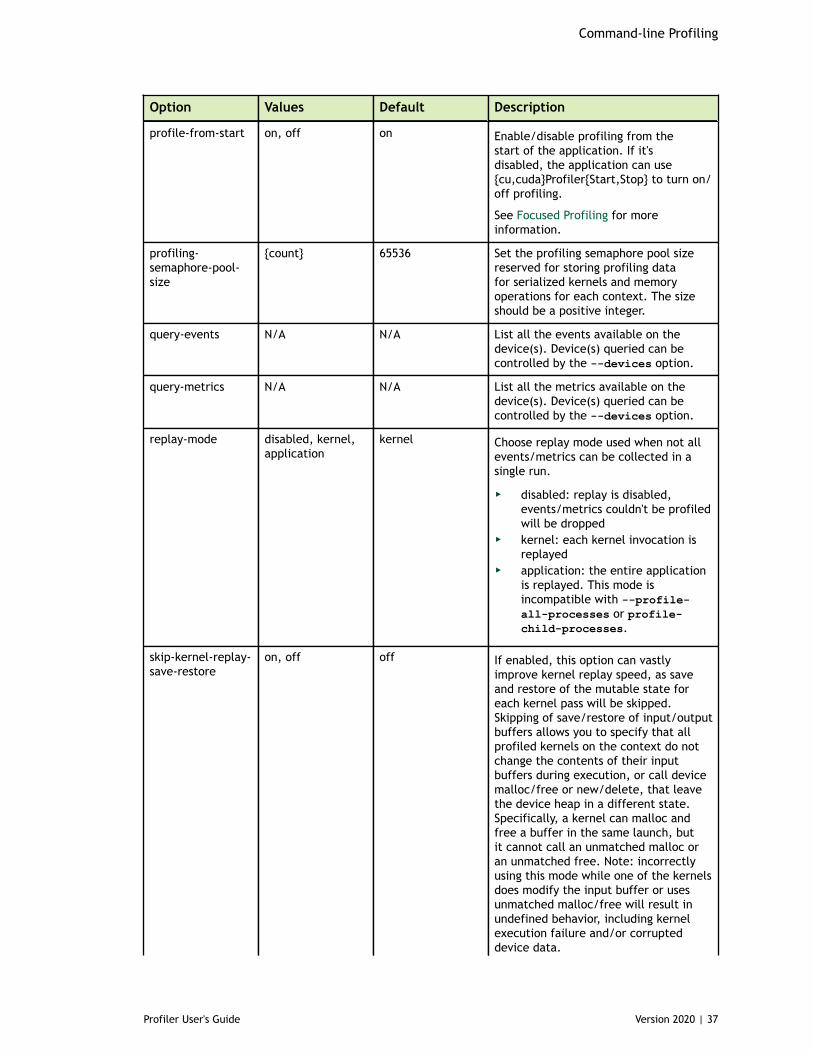
Command-line Profiling
Profiler User's Guide Version 2020 | 37
Option Values Default Description
profile-from-start on, off on Enable/disable profiling from thestart of the application. If it'sdisabled, the application can use{cu,cuda}Profiler{Start,Stop} to turn on/off profiling.
See Focused Profiling for moreinformation.
profiling-semaphore-pool-size
{count} 65536 Set the profiling semaphore pool sizereserved for storing profiling datafor serialized kernels and memoryoperations for each context. The sizeshould be a positive integer.
query-events N/A N/A List all the events available on thedevice(s). Device(s) queried can becontrolled by the --devices option.
query-metrics N/A N/A List all the metrics available on thedevice(s). Device(s) queried can becontrolled by the --devices option.
replay-mode disabled, kernel,application
kernel Choose replay mode used when not allevents/metrics can be collected in asingle run.
‣ disabled: replay is disabled,events/metrics couldn't be profiledwill be dropped
‣ kernel: each kernel invocation isreplayed
‣ application: the entire applicationis replayed. This mode isincompatible with --profile-all-processes or profile-child-processes.
skip-kernel-replay-save-restore
on, off off If enabled, this option can vastlyimprove kernel replay speed, as saveand restore of the mutable state foreach kernel pass will be skipped.Skipping of save/restore of input/outputbuffers allows you to specify that allprofiled kernels on the context do notchange the contents of their inputbuffers during execution, or call devicemalloc/free or new/delete, that leavethe device heap in a different state.Specifically, a kernel can malloc andfree a buffer in the same launch, butit cannot call an unmatched malloc oran unmatched free. Note: incorrectlyusing this mode while one of the kernelsdoes modify the input buffer or usesunmatched malloc/free will result inundefined behavior, including kernelexecution failure and/or corrupteddevice data.
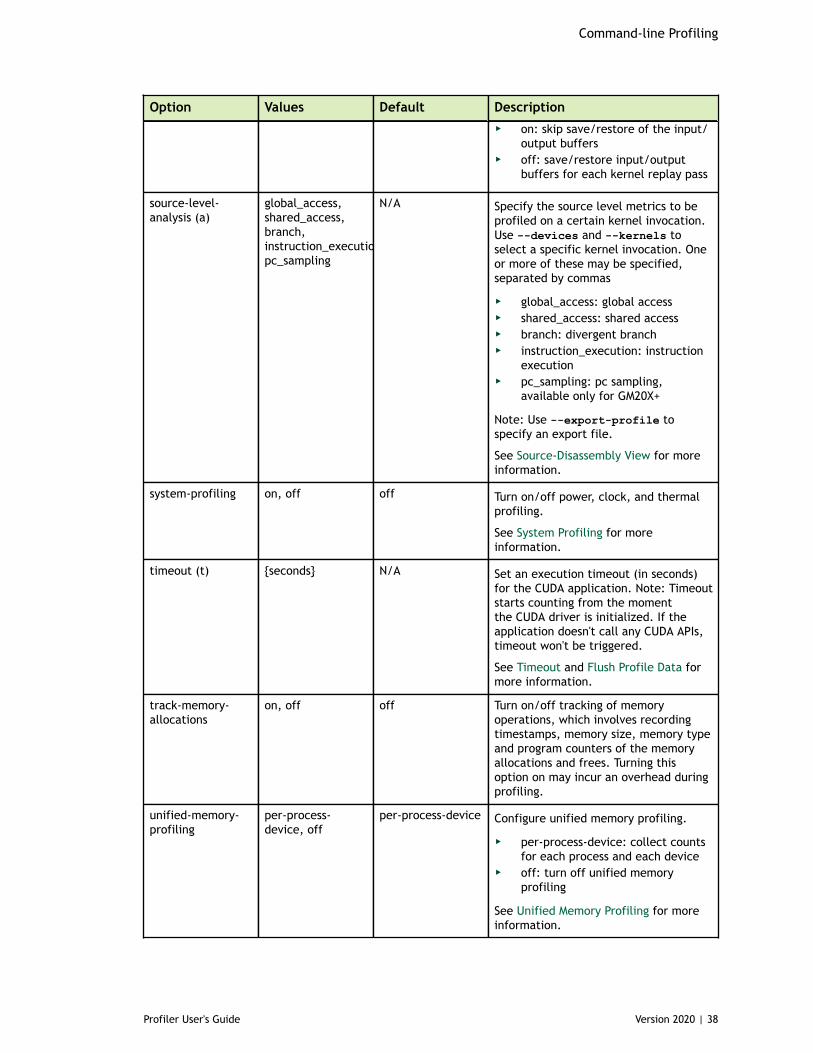
Command-line Profiling
Profiler User's Guide Version 2020 | 38
Option Values Default Description
‣ on: skip save/restore of the input/output buffers
‣ off: save/restore input/outputbuffers for each kernel replay pass
source-level-analysis (a)
global_access,shared_access,branch,instruction_execution,pc_sampling
N/A Specify the source level metrics to beprofiled on a certain kernel invocation.Use --devices and --kernels toselect a specific kernel invocation. Oneor more of these may be specified,separated by commas
‣ global_access: global access‣ shared_access: shared access‣ branch: divergent branch‣ instruction_execution: instruction
execution‣ pc_sampling: pc sampling,
available only for GM20X+
Note: Use --export-profile tospecify an export file.
See Source-Disassembly View for moreinformation.
system-profiling on, off off Turn on/off power, clock, and thermalprofiling.
See System Profiling for moreinformation.
timeout (t) {seconds} N/A Set an execution timeout (in seconds)for the CUDA application. Note: Timeoutstarts counting from the momentthe CUDA driver is initialized. If theapplication doesn't call any CUDA APIs,timeout won't be triggered.
See Timeout and Flush Profile Data formore information.
track-memory-allocations
on, off off Turn on/off tracking of memoryoperations, which involves recordingtimestamps, memory size, memory typeand program counters of the memoryallocations and frees. Turning thisoption on may incur an overhead duringprofiling.
unified-memory-profiling
per-process-device, off
per-process-device Configure unified memory profiling.
‣ per-process-device: collect countsfor each process and each device
‣ off: turn off unified memoryprofiling
See Unified Memory Profiling for moreinformation.
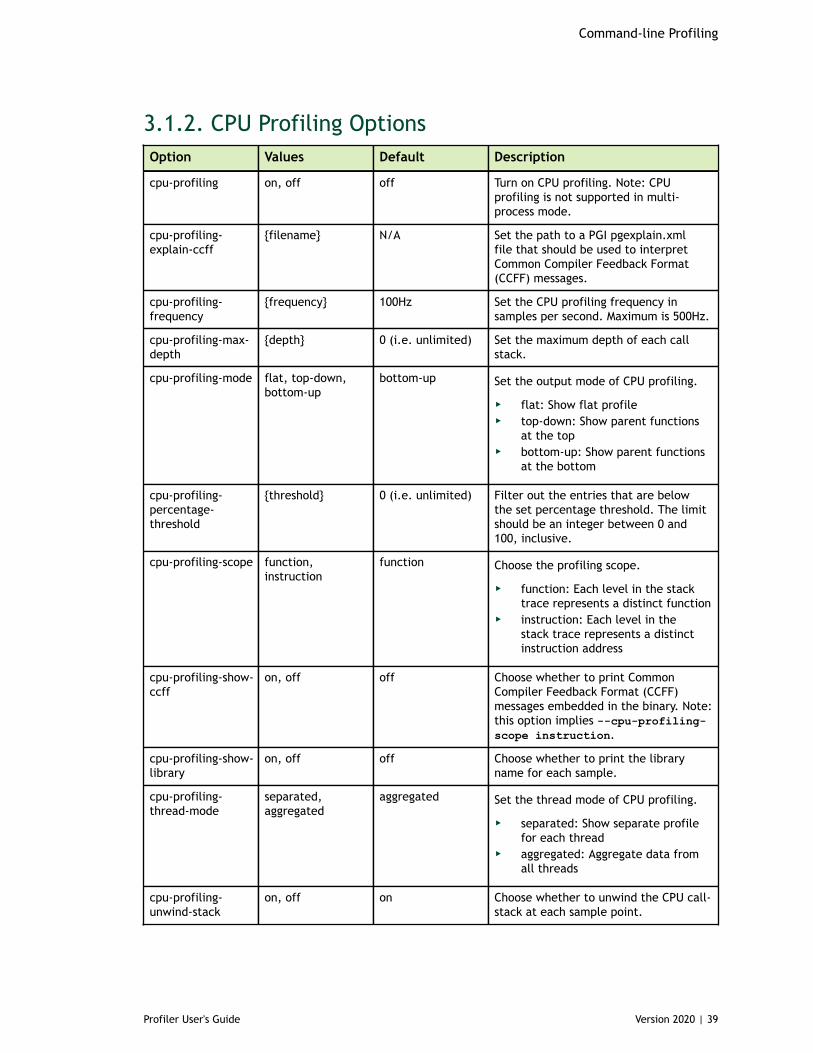
Command-line Profiling
Profiler User's Guide Version 2020 | 39
3.1.2. CPU Profiling OptionsOption Values Default Description
cpu-profiling on, off off Turn on CPU profiling. Note: CPUprofiling is not supported in multi-process mode.
cpu-profiling-explain-ccff
{filename} N/A Set the path to a PGI pgexplain.xmlfile that should be used to interpretCommon Compiler Feedback Format(CCFF) messages.
cpu-profiling-frequency
{frequency} 100Hz Set the CPU profiling frequency insamples per second. Maximum is 500Hz.
cpu-profiling-max-depth
{depth} 0 (i.e. unlimited) Set the maximum depth of each callstack.
cpu-profiling-mode flat, top-down,bottom-up
bottom-up Set the output mode of CPU profiling.
‣ flat: Show flat profile‣ top-down: Show parent functions
at the top‣ bottom-up: Show parent functions
at the bottom
cpu-profiling-percentage-threshold
{threshold} 0 (i.e. unlimited) Filter out the entries that are belowthe set percentage threshold. The limitshould be an integer between 0 and100, inclusive.
cpu-profiling-scope function,instruction
function Choose the profiling scope.
‣ function: Each level in the stacktrace represents a distinct function
‣ instruction: Each level in thestack trace represents a distinctinstruction address
cpu-profiling-show-ccff
on, off off Choose whether to print CommonCompiler Feedback Format (CCFF)messages embedded in the binary. Note:this option implies --cpu-profiling-scope instruction.
cpu-profiling-show-library
on, off off Choose whether to print the libraryname for each sample.
cpu-profiling-thread-mode
separated,aggregated
aggregated Set the thread mode of CPU profiling.
‣ separated: Show separate profilefor each thread
‣ aggregated: Aggregate data fromall threads
cpu-profiling-unwind-stack
on, off on Choose whether to unwind the CPU call-stack at each sample point.
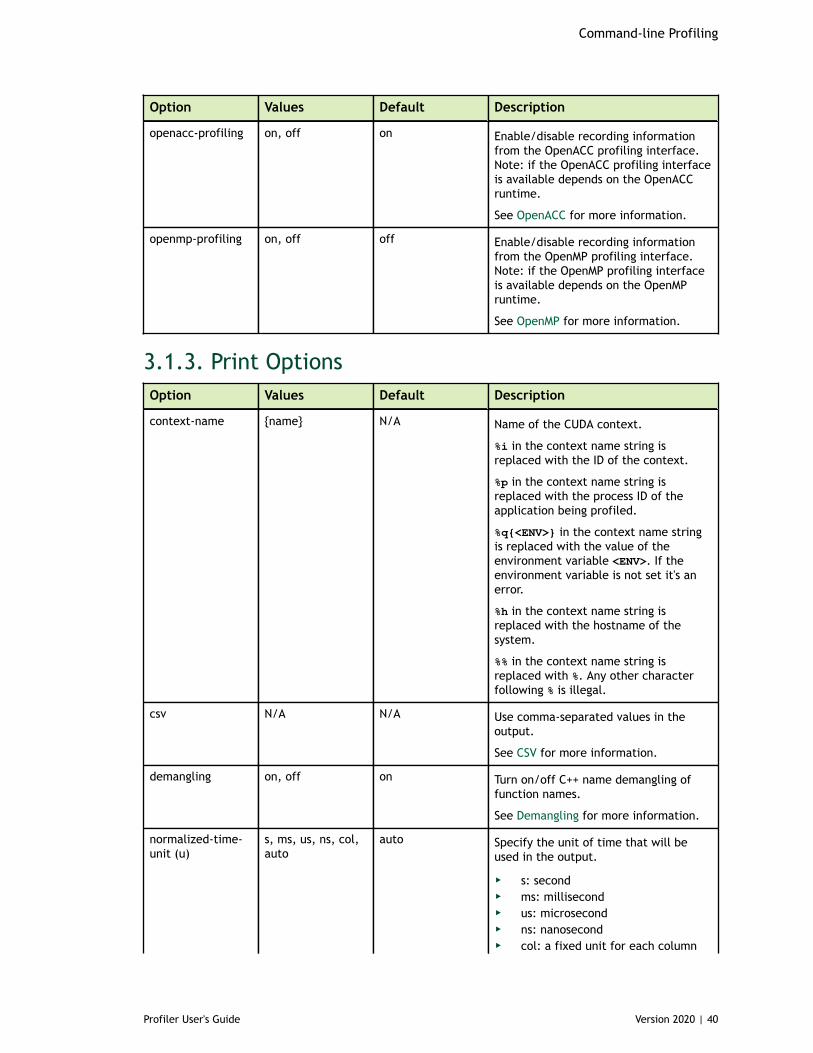
Command-line Profiling
Profiler User's Guide Version 2020 | 40
Option Values Default Description
openacc-profiling on, off on Enable/disable recording informationfrom the OpenACC profiling interface.Note: if the OpenACC profiling interfaceis available depends on the OpenACCruntime.
See OpenACC for more information.
openmp-profiling on, off off Enable/disable recording informationfrom the OpenMP profiling interface.Note: if the OpenMP profiling interfaceis available depends on the OpenMPruntime.
See OpenMP for more information.
3.1.3. Print OptionsOption Values Default Description
context-name {name} N/A Name of the CUDA context.
%i in the context name string isreplaced with the ID of the context.
%p in the context name string isreplaced with the process ID of theapplication being profiled.
%q{<ENV>} in the context name stringis replaced with the value of theenvironment variable <ENV>. If theenvironment variable is not set it's anerror.
%h in the context name string isreplaced with the hostname of thesystem.
%% in the context name string isreplaced with %. Any other characterfollowing % is illegal.
csv N/A N/A Use comma-separated values in theoutput.
See CSV for more information.
demangling on, off on Turn on/off C++ name demangling offunction names.
See Demangling for more information.
normalized-time-unit (u)
s, ms, us, ns, col,auto
auto Specify the unit of time that will beused in the output.
‣ s: second‣ ms: millisecond‣ us: microsecond‣ ns: nanosecond‣ col: a fixed unit for each column
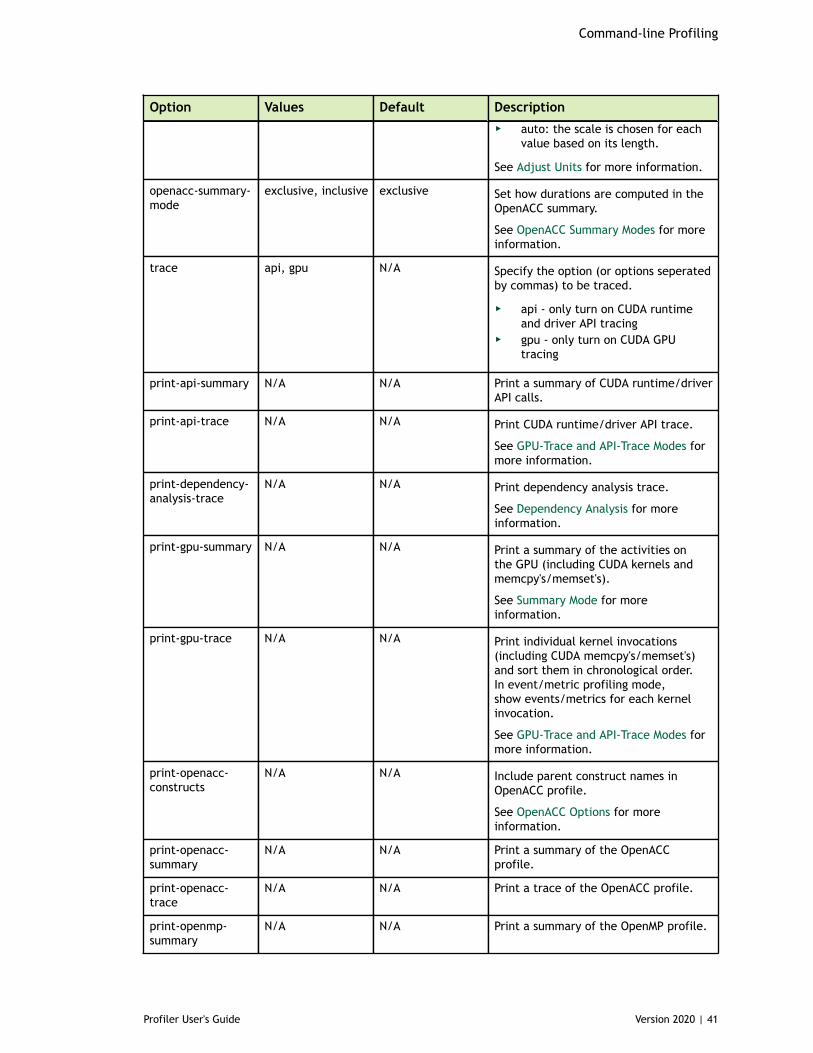
Command-line Profiling
Profiler User's Guide Version 2020 | 41
Option Values Default Description
‣ auto: the scale is chosen for eachvalue based on its length.
See Adjust Units for more information.
openacc-summary-mode
exclusive, inclusive exclusive Set how durations are computed in theOpenACC summary.
See OpenACC Summary Modes for moreinformation.
trace api, gpu N/A Specify the option (or options seperatedby commas) to be traced.
‣ api - only turn on CUDA runtimeand driver API tracing
‣ gpu - only turn on CUDA GPUtracing
print-api-summary N/A N/A Print a summary of CUDA runtime/driverAPI calls.
print-api-trace N/A N/A Print CUDA runtime/driver API trace.
See GPU-Trace and API-Trace Modes formore information.
print-dependency-analysis-trace
N/A N/A Print dependency analysis trace.
See Dependency Analysis for moreinformation.
print-gpu-summary N/A N/A Print a summary of the activities onthe GPU (including CUDA kernels andmemcpy's/memset's).
See Summary Mode for moreinformation.
print-gpu-trace N/A N/A Print individual kernel invocations(including CUDA memcpy's/memset's)and sort them in chronological order.In event/metric profiling mode,show events/metrics for each kernelinvocation.
See GPU-Trace and API-Trace Modes formore information.
print-openacc-constructs
N/A N/A Include parent construct names inOpenACC profile.
See OpenACC Options for moreinformation.
print-openacc-summary
N/A N/A Print a summary of the OpenACCprofile.
print-openacc-trace
N/A N/A Print a trace of the OpenACC profile.
print-openmp-summary
N/A N/A Print a summary of the OpenMP profile.
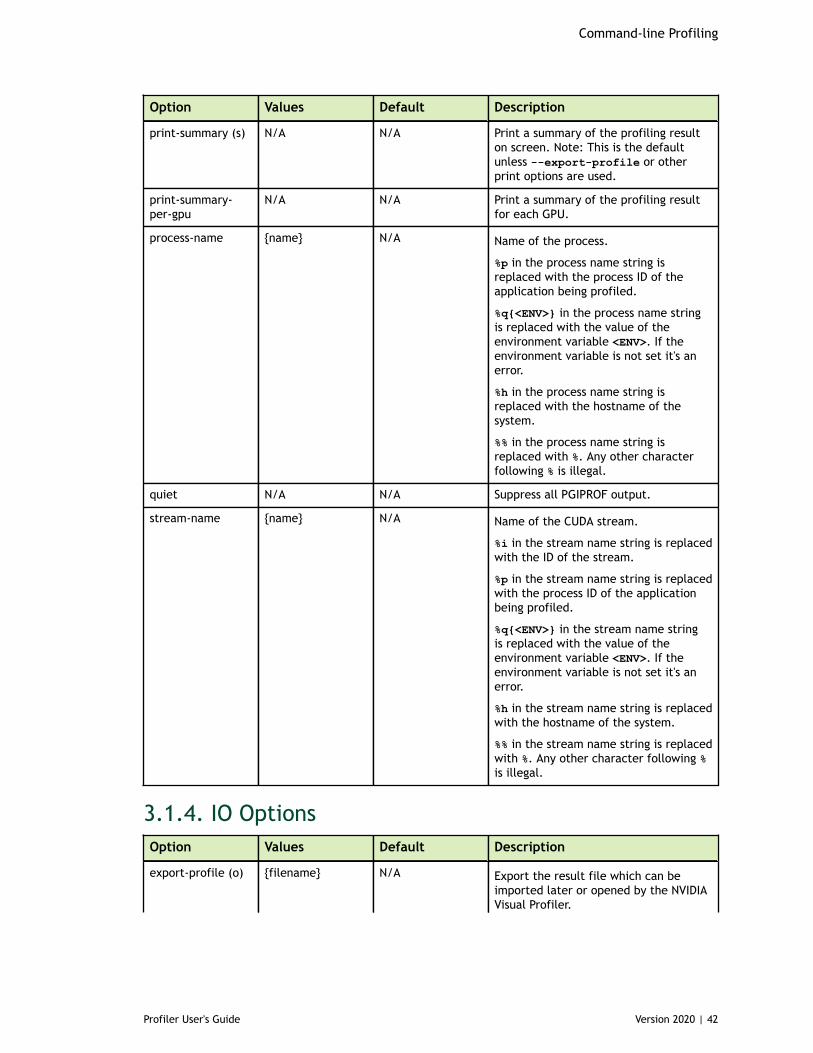
Command-line Profiling
Profiler User's Guide Version 2020 | 42
Option Values Default Description
print-summary (s) N/A N/A Print a summary of the profiling resulton screen. Note: This is the defaultunless --export-profile or otherprint options are used.
print-summary-per-gpu
N/A N/A Print a summary of the profiling resultfor each GPU.
process-name {name} N/A Name of the process.
%p in the process name string isreplaced with the process ID of theapplication being profiled.
%q{<ENV>} in the process name stringis replaced with the value of theenvironment variable <ENV>. If theenvironment variable is not set it's anerror.
%h in the process name string isreplaced with the hostname of thesystem.
%% in the process name string isreplaced with %. Any other characterfollowing % is illegal.
quiet N/A N/A Suppress all PGIPROF output.
stream-name {name} N/A Name of the CUDA stream.
%i in the stream name string is replacedwith the ID of the stream.
%p in the stream name string is replacedwith the process ID of the applicationbeing profiled.
%q{<ENV>} in the stream name stringis replaced with the value of theenvironment variable <ENV>. If theenvironment variable is not set it's anerror.
%h in the stream name string is replacedwith the hostname of the system.
%% in the stream name string is replacedwith %. Any other character following %is illegal.
3.1.4. IO OptionsOption Values Default Description
export-profile (o) {filename} N/A Export the result file which can beimported later or opened by the NVIDIAVisual Profiler.
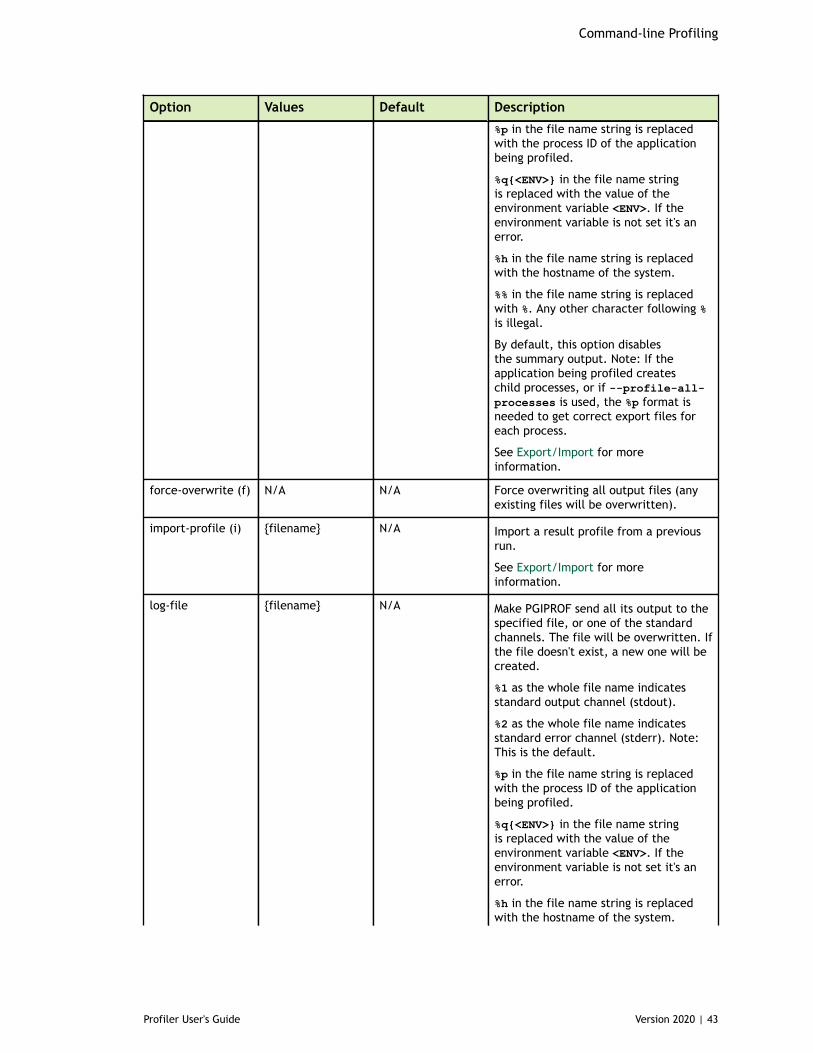
Command-line Profiling
Profiler User's Guide Version 2020 | 43
Option Values Default Description
%p in the file name string is replacedwith the process ID of the applicationbeing profiled.
%q{<ENV>} in the file name stringis replaced with the value of theenvironment variable <ENV>. If theenvironment variable is not set it's anerror.
%h in the file name string is replacedwith the hostname of the system.
%% in the file name string is replacedwith %. Any other character following %is illegal.
By default, this option disablesthe summary output. Note: If theapplication being profiled createschild processes, or if --profile-all-processes is used, the %p format isneeded to get correct export files foreach process.
See Export/Import for moreinformation.
force-overwrite (f) N/A N/A Force overwriting all output files (anyexisting files will be overwritten).
import-profile (i) {filename} N/A Import a result profile from a previousrun.
See Export/Import for moreinformation.
log-file {filename} N/A Make PGIPROF send all its output to thespecified file, or one of the standardchannels. The file will be overwritten. Ifthe file doesn't exist, a new one will becreated.
%1 as the whole file name indicatesstandard output channel (stdout).
%2 as the whole file name indicatesstandard error channel (stderr). Note:This is the default.
%p in the file name string is replacedwith the process ID of the applicationbeing profiled.
%q{<ENV>} in the file name stringis replaced with the value of theenvironment variable <ENV>. If theenvironment variable is not set it's anerror.
%h in the file name string is replacedwith the hostname of the system.
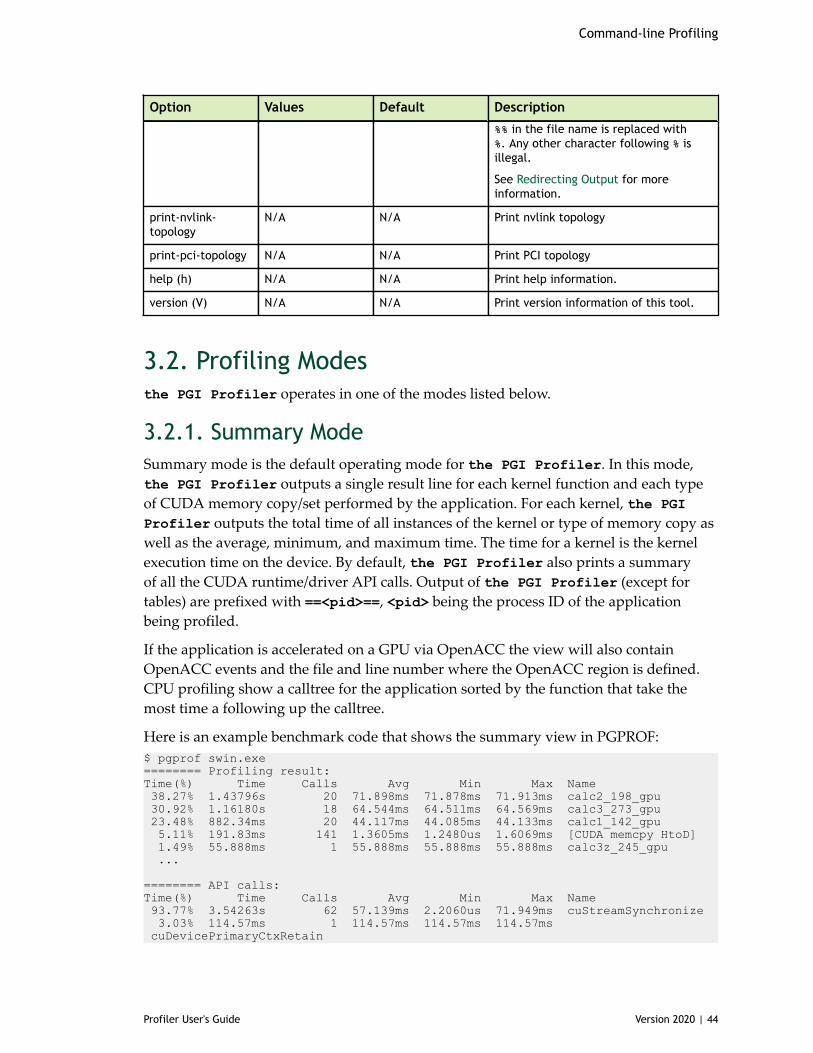
Command-line Profiling
Profiler User's Guide Version 2020 | 44
Option Values Default Description
%% in the file name is replaced with%. Any other character following % isillegal.
See Redirecting Output for moreinformation.
print-nvlink-topology
N/A N/A Print nvlink topology
print-pci-topology N/A N/A Print PCI topology
help (h) N/A N/A Print help information.
version (V) N/A N/A Print version information of this tool.
3.2. Profiling Modesthe PGI Profiler operates in one of the modes listed below.
3.2.1. Summary ModeSummary mode is the default operating mode for the PGI Profiler. In this mode,the PGI Profiler outputs a single result line for each kernel function and each typeof CUDA memory copy/set performed by the application. For each kernel, the PGIProfiler outputs the total time of all instances of the kernel or type of memory copy aswell as the average, minimum, and maximum time. The time for a kernel is the kernelexecution time on the device. By default, the PGI Profiler also prints a summaryof all the CUDA runtime/driver API calls. Output of the PGI Profiler (except fortables) are prefixed with ==<pid>==, <pid> being the process ID of the applicationbeing profiled.
If the application is accelerated on a GPU via OpenACC the view will also containOpenACC events and the file and line number where the OpenACC region is defined.CPU profiling show a calltree for the application sorted by the function that take themost time a following up the calltree.
Here is an example benchmark code that shows the summary view in PGPROF:$ pgprof swin.exe======== Profiling result:Time(%) Time Calls Avg Min Max Name 38.27% 1.43796s 20 71.898ms 71.878ms 71.913ms calc2_198_gpu 30.92% 1.16180s 18 64.544ms 64.511ms 64.569ms calc3_273_gpu 23.48% 882.34ms 20 44.117ms 44.085ms 44.133ms calc1_142_gpu 5.11% 191.83ms 141 1.3605ms 1.2480us 1.6069ms [CUDA memcpy HtoD] 1.49% 55.888ms 1 55.888ms 55.888ms 55.888ms calc3z_245_gpu ...
======== API calls:Time(%) Time Calls Avg Min Max Name 93.77% 3.54263s 62 57.139ms 2.2060us 71.949ms cuStreamSynchronize 3.03% 114.57ms 1 114.57ms 114.57ms 114.57ms cuDevicePrimaryCtxRetain
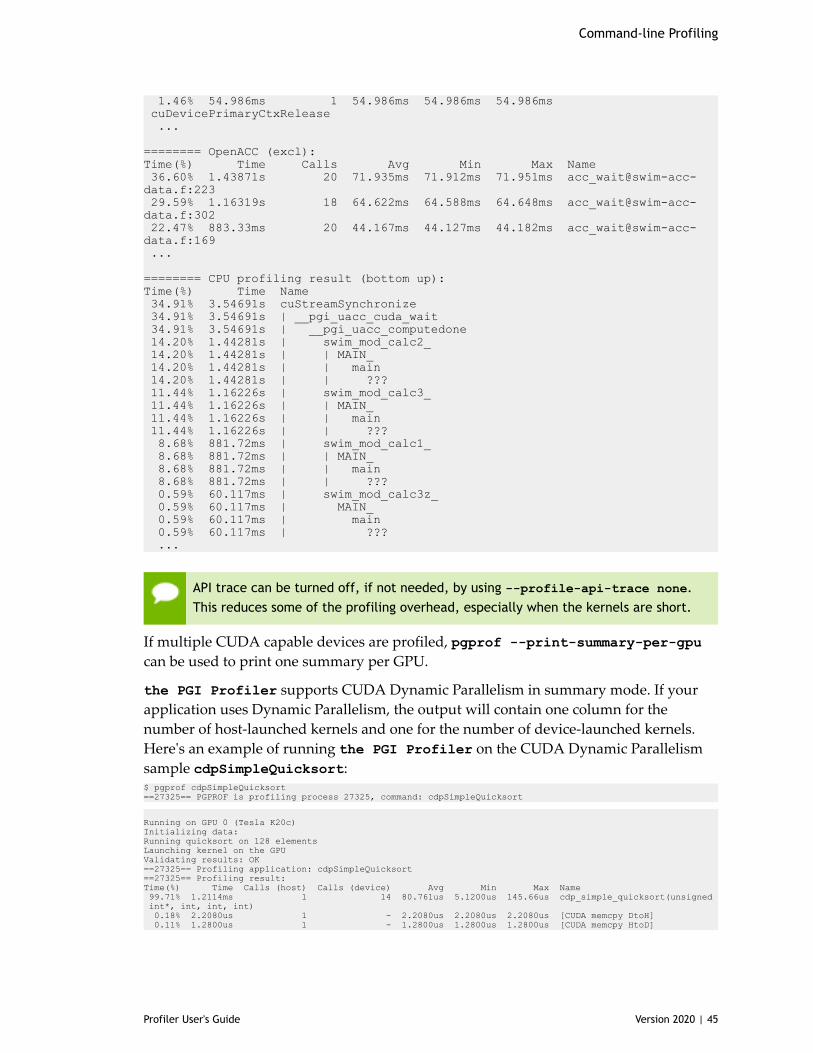
Command-line Profiling
Profiler User's Guide Version 2020 | 45
1.46% 54.986ms 1 54.986ms 54.986ms 54.986ms cuDevicePrimaryCtxRelease ...
======== OpenACC (excl):Time(%) Time Calls Avg Min Max Name 36.60% 1.43871s 20 71.935ms 71.912ms 71.951ms [email protected]:223 29.59% 1.16319s 18 64.622ms 64.588ms 64.648ms [email protected]:302 22.47% 883.33ms 20 44.167ms 44.127ms 44.182ms [email protected]:169 ...
======== CPU profiling result (bottom up):Time(%) Time Name 34.91% 3.54691s cuStreamSynchronize 34.91% 3.54691s | __pgi_uacc_cuda_wait 34.91% 3.54691s | __pgi_uacc_computedone 14.20% 1.44281s | swim_mod_calc2_ 14.20% 1.44281s | | MAIN_ 14.20% 1.44281s | | main 14.20% 1.44281s | | ??? 11.44% 1.16226s | swim_mod_calc3_ 11.44% 1.16226s | | MAIN_ 11.44% 1.16226s | | main 11.44% 1.16226s | | ??? 8.68% 881.72ms | swim_mod_calc1_ 8.68% 881.72ms | | MAIN_ 8.68% 881.72ms | | main 8.68% 881.72ms | | ??? 0.59% 60.117ms | swim_mod_calc3z_ 0.59% 60.117ms | MAIN_ 0.59% 60.117ms | main 0.59% 60.117ms | ??? ...
API trace can be turned off, if not needed, by using --profile-api-trace none.This reduces some of the profiling overhead, especially when the kernels are short.
If multiple CUDA capable devices are profiled, pgprof --print-summary-per-gpucan be used to print one summary per GPU.
the PGI Profiler supports CUDA Dynamic Parallelism in summary mode. If yourapplication uses Dynamic Parallelism, the output will contain one column for thenumber of host-launched kernels and one for the number of device-launched kernels.Here's an example of running the PGI Profiler on the CUDA Dynamic Parallelismsample cdpSimpleQuicksort:$ pgprof cdpSimpleQuicksort==27325== PGPROF is profiling process 27325, command: cdpSimpleQuicksort
Running on GPU 0 (Tesla K20c)Initializing data:Running quicksort on 128 elementsLaunching kernel on the GPUValidating results: OK==27325== Profiling application: cdpSimpleQuicksort==27325== Profiling result:Time(%) Time Calls (host) Calls (device) Avg Min Max Name 99.71% 1.2114ms 1 14 80.761us 5.1200us 145.66us cdp_simple_quicksort(unsigned int*, int, int, int) 0.18% 2.2080us 1 - 2.2080us 2.2080us 2.2080us [CUDA memcpy DtoH] 0.11% 1.2800us 1 - 1.2800us 1.2800us 1.2800us [CUDA memcpy HtoD]
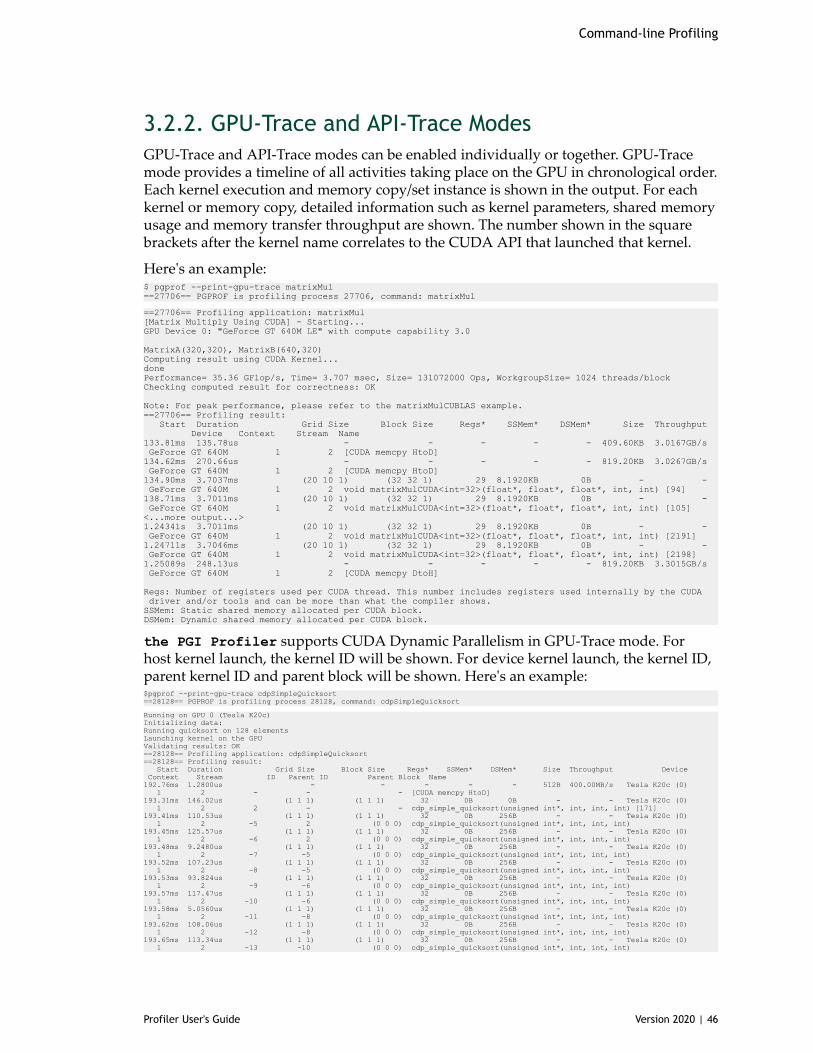
Command-line Profiling
Profiler User's Guide Version 2020 | 46
3.2.2. GPU-Trace and API-Trace ModesGPU-Trace and API-Trace modes can be enabled individually or together. GPU-Tracemode provides a timeline of all activities taking place on the GPU in chronological order.Each kernel execution and memory copy/set instance is shown in the output. For eachkernel or memory copy, detailed information such as kernel parameters, shared memoryusage and memory transfer throughput are shown. The number shown in the squarebrackets after the kernel name correlates to the CUDA API that launched that kernel.
Here's an example:$ pgprof --print-gpu-trace matrixMul==27706== PGPROF is profiling process 27706, command: matrixMul
==27706== Profiling application: matrixMul[Matrix Multiply Using CUDA] - Starting...GPU Device 0: "GeForce GT 640M LE" with compute capability 3.0
MatrixA(320,320), MatrixB(640,320)Computing result using CUDA Kernel...donePerformance= 35.36 GFlop/s, Time= 3.707 msec, Size= 131072000 Ops, WorkgroupSize= 1024 threads/blockChecking computed result for correctness: OK
Note: For peak performance, please refer to the matrixMulCUBLAS example.==27706== Profiling result: Start Duration Grid Size Block Size Regs* SSMem* DSMem* Size Throughput Device Context Stream Name133.81ms 135.78us - - - - - 409.60KB 3.0167GB/s GeForce GT 640M 1 2 [CUDA memcpy HtoD]134.62ms 270.66us - - - - - 819.20KB 3.0267GB/s GeForce GT 640M 1 2 [CUDA memcpy HtoD]134.90ms 3.7037ms (20 10 1) (32 32 1) 29 8.1920KB 0B - - GeForce GT 640M 1 2 void matrixMulCUDA<int=32>(float*, float*, float*, int, int) [94]138.71ms 3.7011ms (20 10 1) (32 32 1) 29 8.1920KB 0B - - GeForce GT 640M 1 2 void matrixMulCUDA<int=32>(float*, float*, float*, int, int) [105]<...more output...>1.24341s 3.7011ms (20 10 1) (32 32 1) 29 8.1920KB 0B - - GeForce GT 640M 1 2 void matrixMulCUDA<int=32>(float*, float*, float*, int, int) [2191]1.24711s 3.7046ms (20 10 1) (32 32 1) 29 8.1920KB 0B - - GeForce GT 640M 1 2 void matrixMulCUDA<int=32>(float*, float*, float*, int, int) [2198]1.25089s 248.13us - - - - - 819.20KB 3.3015GB/s GeForce GT 640M 1 2 [CUDA memcpy DtoH]
Regs: Number of registers used per CUDA thread. This number includes registers used internally by the CUDA driver and/or tools and can be more than what the compiler shows.SSMem: Static shared memory allocated per CUDA block.DSMem: Dynamic shared memory allocated per CUDA block.
the PGI Profiler supports CUDA Dynamic Parallelism in GPU-Trace mode. Forhost kernel launch, the kernel ID will be shown. For device kernel launch, the kernel ID,parent kernel ID and parent block will be shown. Here's an example:$pgprof --print-gpu-trace cdpSimpleQuicksort==28128== PGPROF is profiling process 28128, command: cdpSimpleQuicksort
Running on GPU 0 (Tesla K20c)Initializing data:Running quicksort on 128 elementsLaunching kernel on the GPUValidating results: OK==28128== Profiling application: cdpSimpleQuicksort==28128== Profiling result: Start Duration Grid Size Block Size Regs* SSMem* DSMem* Size Throughput Device Context Stream ID Parent ID Parent Block Name192.76ms 1.2800us - - - - - 512B 400.00MB/s Tesla K20c (0) 1 2 - - - [CUDA memcpy HtoD]193.31ms 146.02us (1 1 1) (1 1 1) 32 0B 0B - - Tesla K20c (0) 1 2 2 - - cdp_simple_quicksort(unsigned int*, int, int, int) [171]193.41ms 110.53us (1 1 1) (1 1 1) 32 0B 256B - - Tesla K20c (0) 1 2 -5 2 (0 0 0) cdp_simple_quicksort(unsigned int*, int, int, int)193.45ms 125.57us (1 1 1) (1 1 1) 32 0B 256B - - Tesla K20c (0) 1 2 -6 2 (0 0 0) cdp_simple_quicksort(unsigned int*, int, int, int)193.48ms 9.2480us (1 1 1) (1 1 1) 32 0B 256B - - Tesla K20c (0) 1 2 -7 -5 (0 0 0) cdp_simple_quicksort(unsigned int*, int, int, int)193.52ms 107.23us (1 1 1) (1 1 1) 32 0B 256B - - Tesla K20c (0) 1 2 -8 -5 (0 0 0) cdp_simple_quicksort(unsigned int*, int, int, int)193.53ms 93.824us (1 1 1) (1 1 1) 32 0B 256B - - Tesla K20c (0) 1 2 -9 -6 (0 0 0) cdp_simple_quicksort(unsigned int*, int, int, int)193.57ms 117.47us (1 1 1) (1 1 1) 32 0B 256B - - Tesla K20c (0) 1 2 -10 -6 (0 0 0) cdp_simple_quicksort(unsigned int*, int, int, int)193.58ms 5.0560us (1 1 1) (1 1 1) 32 0B 256B - - Tesla K20c (0) 1 2 -11 -8 (0 0 0) cdp_simple_quicksort(unsigned int*, int, int, int)193.62ms 108.06us (1 1 1) (1 1 1) 32 0B 256B - - Tesla K20c (0) 1 2 -12 -8 (0 0 0) cdp_simple_quicksort(unsigned int*, int, int, int)193.65ms 113.34us (1 1 1) (1 1 1) 32 0B 256B - - Tesla K20c (0) 1 2 -13 -10 (0 0 0) cdp_simple_quicksort(unsigned int*, int, int, int)
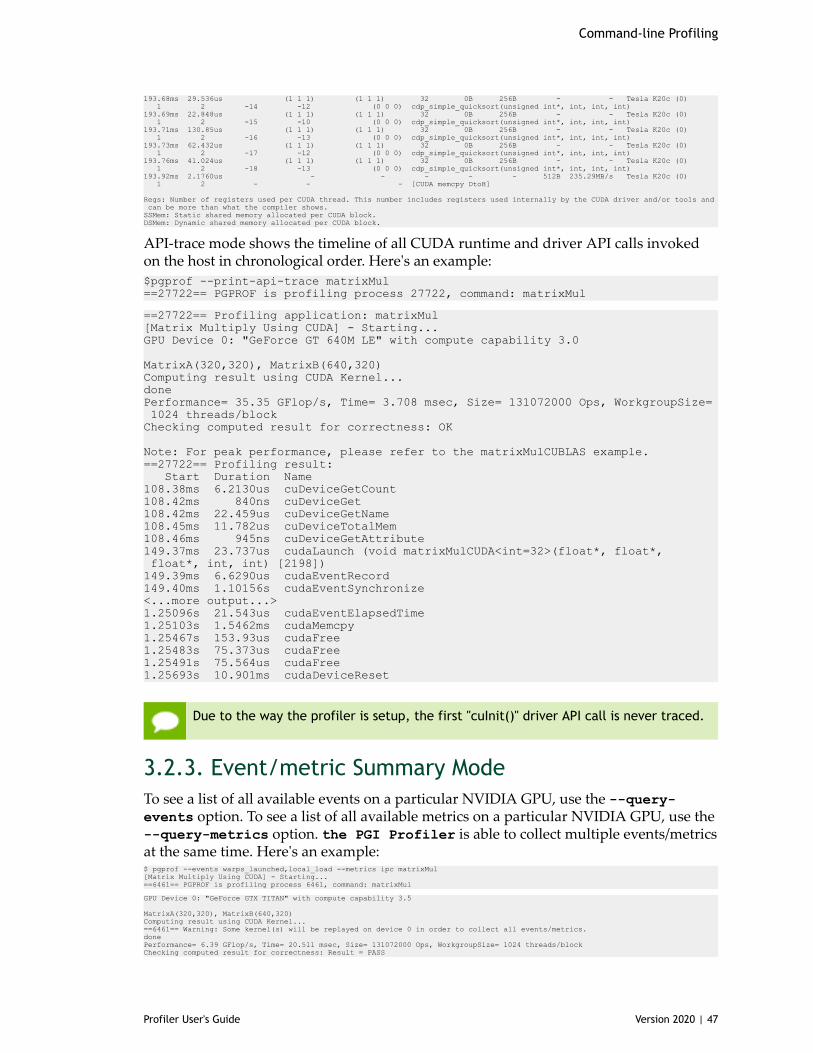
Command-line Profiling
Profiler User's Guide Version 2020 | 47
193.68ms 29.536us (1 1 1) (1 1 1) 32 0B 256B - - Tesla K20c (0) 1 2 -14 -12 (0 0 0) cdp_simple_quicksort(unsigned int*, int, int, int)193.69ms 22.848us (1 1 1) (1 1 1) 32 0B 256B - - Tesla K20c (0) 1 2 -15 -10 (0 0 0) cdp_simple_quicksort(unsigned int*, int, int, int)193.71ms 130.85us (1 1 1) (1 1 1) 32 0B 256B - - Tesla K20c (0) 1 2 -16 -13 (0 0 0) cdp_simple_quicksort(unsigned int*, int, int, int)193.73ms 62.432us (1 1 1) (1 1 1) 32 0B 256B - - Tesla K20c (0) 1 2 -17 -12 (0 0 0) cdp_simple_quicksort(unsigned int*, int, int, int)193.76ms 41.024us (1 1 1) (1 1 1) 32 0B 256B - - Tesla K20c (0) 1 2 -18 -13 (0 0 0) cdp_simple_quicksort(unsigned int*, int, int, int)193.92ms 2.1760us - - - - - 512B 235.29MB/s Tesla K20c (0) 1 2 - - - [CUDA memcpy DtoH]
Regs: Number of registers used per CUDA thread. This number includes registers used internally by the CUDA driver and/or tools and can be more than what the compiler shows.SSMem: Static shared memory allocated per CUDA block.DSMem: Dynamic shared memory allocated per CUDA block.
API-trace mode shows the timeline of all CUDA runtime and driver API calls invokedon the host in chronological order. Here's an example:$pgprof --print-api-trace matrixMul==27722== PGPROF is profiling process 27722, command: matrixMul
==27722== Profiling application: matrixMul[Matrix Multiply Using CUDA] - Starting...GPU Device 0: "GeForce GT 640M LE" with compute capability 3.0
MatrixA(320,320), MatrixB(640,320)Computing result using CUDA Kernel...donePerformance= 35.35 GFlop/s, Time= 3.708 msec, Size= 131072000 Ops, WorkgroupSize= 1024 threads/blockChecking computed result for correctness: OK
Note: For peak performance, please refer to the matrixMulCUBLAS example.==27722== Profiling result: Start Duration Name108.38ms 6.2130us cuDeviceGetCount108.42ms 840ns cuDeviceGet108.42ms 22.459us cuDeviceGetName108.45ms 11.782us cuDeviceTotalMem108.46ms 945ns cuDeviceGetAttribute149.37ms 23.737us cudaLaunch (void matrixMulCUDA<int=32>(float*, float*, float*, int, int) [2198])149.39ms 6.6290us cudaEventRecord149.40ms 1.10156s cudaEventSynchronize<...more output...>1.25096s 21.543us cudaEventElapsedTime1.25103s 1.5462ms cudaMemcpy1.25467s 153.93us cudaFree1.25483s 75.373us cudaFree1.25491s 75.564us cudaFree1.25693s 10.901ms cudaDeviceReset
Due to the way the profiler is setup, the first "cuInit()" driver API call is never traced.
3.2.3. Event/metric Summary ModeTo see a list of all available events on a particular NVIDIA GPU, use the --query-events option. To see a list of all available metrics on a particular NVIDIA GPU, use the--query-metrics option. the PGI Profiler is able to collect multiple events/metricsat the same time. Here's an example:$ pgprof --events warps_launched,local_load --metrics ipc matrixMul[Matrix Multiply Using CUDA] - Starting...==6461== PGPROF is profiling process 6461, command: matrixMul
GPU Device 0: "GeForce GTX TITAN" with compute capability 3.5
MatrixA(320,320), MatrixB(640,320)Computing result using CUDA Kernel...==6461== Warning: Some kernel(s) will be replayed on device 0 in order to collect all events/metrics.donePerformance= 6.39 GFlop/s, Time= 20.511 msec, Size= 131072000 Ops, WorkgroupSize= 1024 threads/blockChecking computed result for correctness: Result = PASS
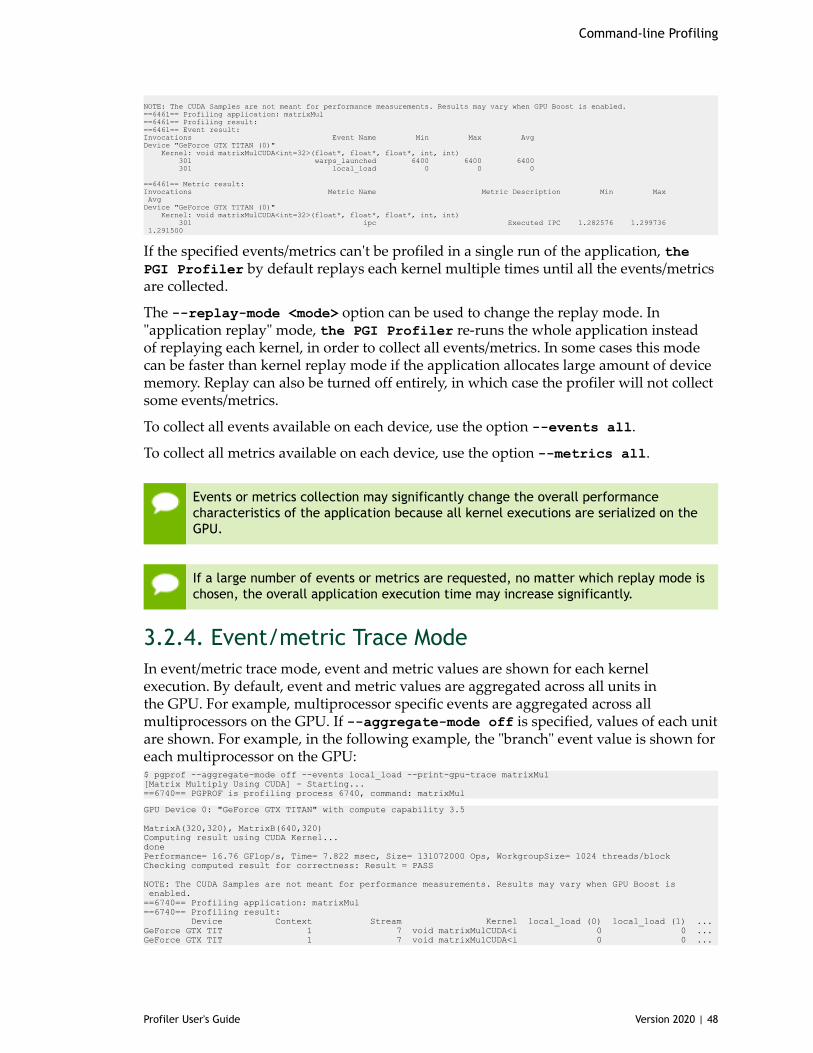
Command-line Profiling
Profiler User's Guide Version 2020 | 48
NOTE: The CUDA Samples are not meant for performance measurements. Results may vary when GPU Boost is enabled.==6461== Profiling application: matrixMul==6461== Profiling result:==6461== Event result:Invocations Event Name Min Max AvgDevice "GeForce GTX TITAN (0)" Kernel: void matrixMulCUDA<int=32>(float*, float*, float*, int, int) 301 warps_launched 6400 6400 6400 301 local_load 0 0 0
==6461== Metric result:Invocations Metric Name Metric Description Min Max AvgDevice "GeForce GTX TITAN (0)" Kernel: void matrixMulCUDA<int=32>(float*, float*, float*, int, int) 301 ipc Executed IPC 1.282576 1.299736 1.291500
If the specified events/metrics can't be profiled in a single run of the application, thePGI Profiler by default replays each kernel multiple times until all the events/metricsare collected.
The --replay-mode <mode> option can be used to change the replay mode. In"application replay" mode, the PGI Profiler re-runs the whole application insteadof replaying each kernel, in order to collect all events/metrics. In some cases this modecan be faster than kernel replay mode if the application allocates large amount of devicememory. Replay can also be turned off entirely, in which case the profiler will not collectsome events/metrics.
To collect all events available on each device, use the option --events all.
To collect all metrics available on each device, use the option --metrics all.
Events or metrics collection may significantly change the overall performancecharacteristics of the application because all kernel executions are serialized on theGPU.
If a large number of events or metrics are requested, no matter which replay mode ischosen, the overall application execution time may increase significantly.
3.2.4. Event/metric Trace ModeIn event/metric trace mode, event and metric values are shown for each kernelexecution. By default, event and metric values are aggregated across all units inthe GPU. For example, multiprocessor specific events are aggregated across allmultiprocessors on the GPU. If --aggregate-mode off is specified, values of each unitare shown. For example, in the following example, the "branch" event value is shown foreach multiprocessor on the GPU:$ pgprof --aggregate-mode off --events local_load --print-gpu-trace matrixMul[Matrix Multiply Using CUDA] - Starting...==6740== PGPROF is profiling process 6740, command: matrixMul
GPU Device 0: "GeForce GTX TITAN" with compute capability 3.5
MatrixA(320,320), MatrixB(640,320)Computing result using CUDA Kernel...donePerformance= 16.76 GFlop/s, Time= 7.822 msec, Size= 131072000 Ops, WorkgroupSize= 1024 threads/blockChecking computed result for correctness: Result = PASS
NOTE: The CUDA Samples are not meant for performance measurements. Results may vary when GPU Boost is enabled.==6740== Profiling application: matrixMul==6740== Profiling result: Device Context Stream Kernel local_load (0) local_load (1) ...GeForce GTX TIT 1 7 void matrixMulCUDA<i 0 0 ...GeForce GTX TIT 1 7 void matrixMulCUDA<i 0 0 ...
Command-line Profiling
Profiler User's Guide Version 2020 | 49
<...more output...>
Although --aggregate-mode applies to metrics, some metrics are only available inaggregate mode and some are only available in non-aggregate mode.
3.3. Profiling Controls
3.3.1. TimeoutA timeout (in seconds) can be provided to the PGI Profiler. The CUDA applicationbeing profiled will be killed by the PGI Profiler after the timeout. Profiling resultcollected before the timeout will be shown.
Timeout starts counting from the moment the CUDA driver is initialized. If theapplication doesn't call any CUDA APIs, timeout won't be triggered.
3.3.2. Concurrent KernelsConcurrent-kernel profiling is supported, and is turned on by default. To turn thefeature off, use the option --concurrent-kernels off. This forces concurrent kernelexecutions to be serialized when a CUDA application is run with the PGI Profiler.
3.3.3. Profiling ScopeWhen collecting events/metrics, the PGI Profiler profiles all kernels launched on allvisible CUDA devices by default. This profiling scope can be limited by the followingoptions.
--devices <device IDs> applies to --events, --metrics, --query-events and--query-metrics options that follows it. It limits these options to collect events/metrics only on the devices specified by <device IDs>, which can be a list of device IDnumbers separated by comma.
--kernels <kernel filter> applies to --events and --metrics options thatfollows it. It limits these options to collect events/metrics only on the kernels specifiedby <kernel filter>, which has the following syntax:
<kernel name>
or
<context id/name>:<stream id/name>:<kernel name>:<invocation>
Each string in the angle brackets can be a standard Perl regular expression. Empty stringmatches any number or character combination.
Invocation number n indicates the nth invocation of the kernel. If invocation is a positivenumber, it's strictly matched against the invocation of the kernel. Otherwise it's treated
Command-line Profiling
Profiler User's Guide Version 2020 | 50
as a regular expression. Invocation number is counted separately for each kernel. So forinstance :::3 will match the 3rd invocation of every kernel.
If the context/stream string is a positive number, it's strictly matched against the cudacontext/stream ID. Otherwise it's treated as a regular expression and matched againstthe context/stream name provided by the NVIDIA Tools Extension.
Both --devices and --kernels can be specified multiple times, with distinct events/metrics associated.
--events, --metrics, --query-events and --query-metrics are controlled by thenearest scope options before them.
As an example, the following command,
pgprof --devices 0 --metrics ipc --kernels "1:foo:bar:2" --events local_load a.out
collects metric ipc on all kernels launched on device 0. It also collects eventlocal_load for any kernel whose name contains bar and is the 2nd instance launchedon context 1 and on stream named foo on device 0.
3.3.4. Multiprocess ProfilingBy default, the PGI Profiler only profiles the application specified by the command-line argument. It doesn't trace child processes launched by that process. To profile allprocesses launched by an application, use the --profile-child-processes option.
the PGI Profiler cannot profile processes that fork() but do not then exec().
the PGI Profiler also has a "profile all processes" mode, in which it profiles everyCUDA process launched on the same system by the same user who launched the PGIProfiler. Exit this mode by typing "Ctrl-c".
CPU profiling is not supported in multi-process mode. use the option: --cpu-profiling off to turn off CPU profiling.
3.3.5. System ProfilingFor devices that support system profiling, the PGI Profiler can enable low frequencysampling of the power, clock, and thermal behavior of each GPU used by theapplication. This feature is turned off by default. To turn on this feature, use --system-profiling on. To see the detail of each sample point, combine the above option with--print-gpu-trace.
3.3.6. Unified Memory ProfilingFor GPUs that support Unified Memory, the PGI Profiler collects the UnifiedMemory related memory traffic to and from each GPU on your system. This featureis turned off by default. To turn on this feature, use --unified-memory-profiling
Command-line Profiling
Profiler User's Guide Version 2020 | 51
<per-process-device|off>. To see the detail of each memory transfer, combine theabove option with --print-gpu-trace.
On multi-GPU configurations without P2P support between any pair of devices thatsupport Unified Memory, managed memory allocations are placed in zero-copymemory. In this case Unified Memory profiling is not supported. In certain cases,the environment variable CUDA_MANAGED_FORCE_DEVICE_ALLOC can be set to forcemanaged allocations to be in device memory and to enable migration on these hardwareconfigurations. In this case Unified Memory profiling is supported. Normally, using theenvironment variable CUDA_VISIBLE_DEVICES is recommended to restrict CUDA toonly use those GPUs that have P2P support. Please refer to the environment variablessection in the CUDA C++ Programming Guide for further details.
3.3.7. CPU Thread TracingIn order to allow a correct Dependency Analysis, the PGI Profiler can collectinformation about CPU-side threading APIs. This can be enabled by specifying --cpu-thread-tracing on during measurement. Recording this information is necessary if
‣ the application uses multiple CPU threads and‣ at least two of these threads call the CUDA API.
Currently, only POSIX threads (Pthreads) are supported. For performance reasons, onlyselected Pthread API calls may be recorded. the PGI Profiler tries to detect whichcalls are necessary to model the execution behavior and filters others. Filtered callsinclude pthread_mutex_lock and pthread_mutex_unlock when those do not causeany concurrent thread to block.
CPU thread tracing is not available on Windows.
CPU thread tracing starts after the first CUDA API call, from the thread issuing thiscall. Therefore, the application must call e.g. cuInit from its main thread beforespawning any other user threads that call the CUDA API.
3.4. Output
3.4.1. Adjust UnitsBy default, the PGI Profiler adjusts the time units automatically to get the mostprecise time values. The --normalized-time-unit options can be used to get fixedtime units throughout the results.
3.4.2. CSVFor each profiling mode, option --csv can be used to generate output in comma-separated values (CSV) format. The result can be directly imported to spreadsheetsoftware such as Excel.
Command-line Profiling
Profiler User's Guide Version 2020 | 52
3.4.3. Export/ImportFor each profiling mode, option --export-profile can be used to generate a resultfile. This file is not human-readable, but can be imported back to the PGI Profilerusing the option --import-profile, or into the visual PGI Profiler.
The profilers use SQLite as the format of the export profiles. Writing files in suchformat may require more disk operations than writing a plain file. Thus, exportingprofiles to slower devices such as a network drive may slow down the execution of theapplication.
3.4.4. DemanglingBy default, the PGI Profiler demangles C++ function names. Use option --demangling off to turn this feature off.
3.4.5. Redirecting OutputBy default, the PGI Profiler sends most of its output to stderr. To redirect theoutput, use --log-file. --log-file %1 tells the PGI Profiler to redirect alloutput to stdout. --log-file <filename> redirects output to a file. Use %p in thefilename to be replaced by the process ID of the PGI Profiler, %h by the hostname ,%q{ENV} by the value of environment variable ENV, and %% by %.
3.4.6. Dependency Analysisthe PGI Profiler can run a Dependency Analysis after the application has beenprofiled, using the --dependency-analysis option. This analysis can also be appliedto imported profiles. It requires to collect the full CUDA API and GPU activity traceduring measurement. This is the default for the PGI Profiler if not disabled using--profile-api-trace none.
For applications using CUDA from multiple CPU threads, CPU Thread Tracing shouldbe enabled, too. The option --print-dependency-analysis-trace can be specifiedto change from a summary output to a trace output, showing computed metrics such astime on the critical path per function instance rather than per function type.
An example for dependency analysis summary output with all computed metricsaggregated per function type is shown below. The table is sorted first by time on thecritical path and second by waiting time. The summary contains an entry namedOther, referring to all CPU activity that is not tracked by the PGI Profiler (e.g. theapplication's main function).
==20704== Dependency Analysis:==20704== Analysis progress: 100%Critical path(%) Critical path Waiting time Name % s s 92.06 4.061817 0.000000 clock_block(long*, long) 4.54 0.200511 0.000000 cudaMalloc 3.25 0.143326 0.000000 cudaDeviceReset 0.13 5.7273280e-03 0.000000 <Other> 0.01 2.7200900e-04 0.000000 cudaFree 0.00 0.000000 4.062506 pthread_join 0.00 0.000000 4.061790 cudaStreamSynchronize
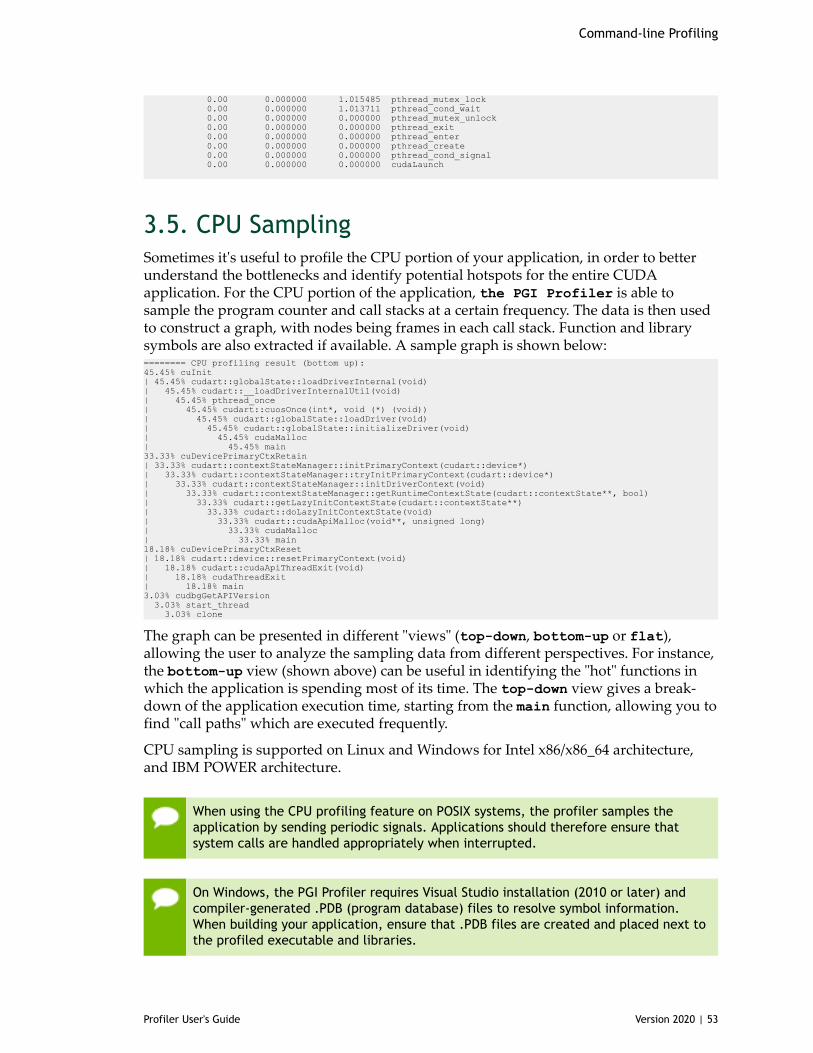
Command-line Profiling
Profiler User's Guide Version 2020 | 53
0.00 0.000000 1.015485 pthread_mutex_lock 0.00 0.000000 1.013711 pthread_cond_wait 0.00 0.000000 0.000000 pthread_mutex_unlock 0.00 0.000000 0.000000 pthread_exit 0.00 0.000000 0.000000 pthread_enter 0.00 0.000000 0.000000 pthread_create 0.00 0.000000 0.000000 pthread_cond_signal 0.00 0.000000 0.000000 cudaLaunch
3.5. CPU SamplingSometimes it's useful to profile the CPU portion of your application, in order to betterunderstand the bottlenecks and identify potential hotspots for the entire CUDAapplication. For the CPU portion of the application, the PGI Profiler is able tosample the program counter and call stacks at a certain frequency. The data is then usedto construct a graph, with nodes being frames in each call stack. Function and librarysymbols are also extracted if available. A sample graph is shown below:======== CPU profiling result (bottom up):45.45% cuInit| 45.45% cudart::globalState::loadDriverInternal(void)| 45.45% cudart::__loadDriverInternalUtil(void)| 45.45% pthread_once| 45.45% cudart::cuosOnce(int*, void (*) (void))| 45.45% cudart::globalState::loadDriver(void)| 45.45% cudart::globalState::initializeDriver(void)| 45.45% cudaMalloc| 45.45% main33.33% cuDevicePrimaryCtxRetain| 33.33% cudart::contextStateManager::initPrimaryContext(cudart::device*)| 33.33% cudart::contextStateManager::tryInitPrimaryContext(cudart::device*)| 33.33% cudart::contextStateManager::initDriverContext(void)| 33.33% cudart::contextStateManager::getRuntimeContextState(cudart::contextState**, bool)| 33.33% cudart::getLazyInitContextState(cudart::contextState**)| 33.33% cudart::doLazyInitContextState(void)| 33.33% cudart::cudaApiMalloc(void**, unsigned long)| 33.33% cudaMalloc| 33.33% main18.18% cuDevicePrimaryCtxReset| 18.18% cudart::device::resetPrimaryContext(void)| 18.18% cudart::cudaApiThreadExit(void)| 18.18% cudaThreadExit| 18.18% main3.03% cudbgGetAPIVersion 3.03% start_thread 3.03% clone
The graph can be presented in different "views" (top-down, bottom-up or flat),allowing the user to analyze the sampling data from different perspectives. For instance,the bottom-up view (shown above) can be useful in identifying the "hot" functions inwhich the application is spending most of its time. The top-down view gives a break-down of the application execution time, starting from the main function, allowing you tofind "call paths" which are executed frequently.
CPU sampling is supported on Linux and Windows for Intel x86/x86_64 architecture,and IBM POWER architecture.
When using the CPU profiling feature on POSIX systems, the profiler samples theapplication by sending periodic signals. Applications should therefore ensure thatsystem calls are handled appropriately when interrupted.
On Windows, the PGI Profiler requires Visual Studio installation (2010 or later) andcompiler-generated .PDB (program database) files to resolve symbol information.When building your application, ensure that .PDB files are created and placed next tothe profiled executable and libraries.
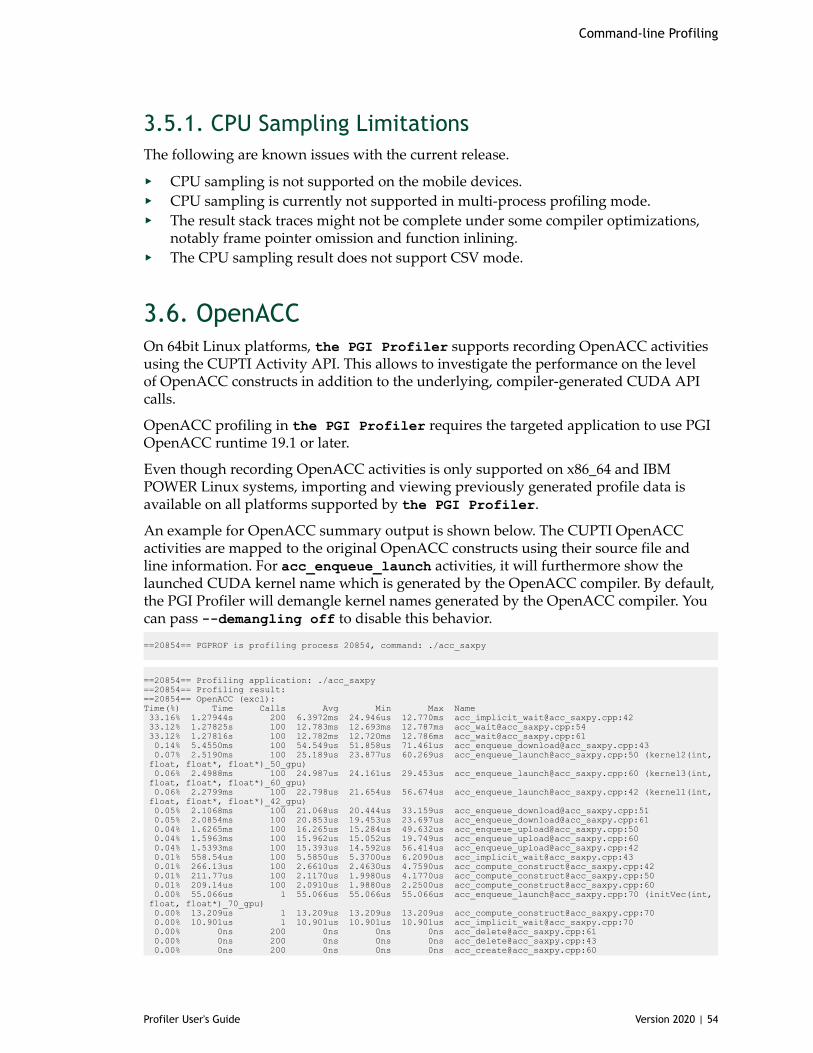
Command-line Profiling
Profiler User's Guide Version 2020 | 54
3.5.1. CPU Sampling LimitationsThe following are known issues with the current release.
‣ CPU sampling is not supported on the mobile devices.‣ CPU sampling is currently not supported in multi-process profiling mode.‣ The result stack traces might not be complete under some compiler optimizations,
notably frame pointer omission and function inlining.‣ The CPU sampling result does not support CSV mode.
3.6. OpenACCOn 64bit Linux platforms, the PGI Profiler supports recording OpenACC activitiesusing the CUPTI Activity API. This allows to investigate the performance on the levelof OpenACC constructs in addition to the underlying, compiler-generated CUDA APIcalls.
OpenACC profiling in the PGI Profiler requires the targeted application to use PGIOpenACC runtime 19.1 or later.
Even though recording OpenACC activities is only supported on x86_64 and IBMPOWER Linux systems, importing and viewing previously generated profile data isavailable on all platforms supported by the PGI Profiler.
An example for OpenACC summary output is shown below. The CUPTI OpenACCactivities are mapped to the original OpenACC constructs using their source file andline information. For acc_enqueue_launch activities, it will furthermore show thelaunched CUDA kernel name which is generated by the OpenACC compiler. By default,the PGI Profiler will demangle kernel names generated by the OpenACC compiler. Youcan pass --demangling off to disable this behavior.
==20854== PGPROF is profiling process 20854, command: ./acc_saxpy
==20854== Profiling application: ./acc_saxpy==20854== Profiling result:==20854== OpenACC (excl):Time(%) Time Calls Avg Min Max Name 33.16% 1.27944s 200 6.3972ms 24.946us 12.770ms acc_implicit_wait@acc_saxpy.cpp:42 33.12% 1.27825s 100 12.783ms 12.693ms 12.787ms acc_wait@acc_saxpy.cpp:54 33.12% 1.27816s 100 12.782ms 12.720ms 12.786ms acc_wait@acc_saxpy.cpp:61 0.14% 5.4550ms 100 54.549us 51.858us 71.461us acc_enqueue_download@acc_saxpy.cpp:43 0.07% 2.5190ms 100 25.189us 23.877us 60.269us acc_enqueue_launch@acc_saxpy.cpp:50 (kernel2(int, float, float*, float*)_50_gpu) 0.06% 2.4988ms 100 24.987us 24.161us 29.453us acc_enqueue_launch@acc_saxpy.cpp:60 (kernel3(int, float, float*, float*)_60_gpu) 0.06% 2.2799ms 100 22.798us 21.654us 56.674us acc_enqueue_launch@acc_saxpy.cpp:42 (kernel1(int, float, float*, float*)_42_gpu) 0.05% 2.1068ms 100 21.068us 20.444us 33.159us acc_enqueue_download@acc_saxpy.cpp:51 0.05% 2.0854ms 100 20.853us 19.453us 23.697us acc_enqueue_download@acc_saxpy.cpp:61 0.04% 1.6265ms 100 16.265us 15.284us 49.632us acc_enqueue_upload@acc_saxpy.cpp:50 0.04% 1.5963ms 100 15.962us 15.052us 19.749us acc_enqueue_upload@acc_saxpy.cpp:60 0.04% 1.5393ms 100 15.393us 14.592us 56.414us acc_enqueue_upload@acc_saxpy.cpp:42 0.01% 558.54us 100 5.5850us 5.3700us 6.2090us acc_implicit_wait@acc_saxpy.cpp:43 0.01% 266.13us 100 2.6610us 2.4630us 4.7590us acc_compute_construct@acc_saxpy.cpp:42 0.01% 211.77us 100 2.1170us 1.9980us 4.1770us acc_compute_construct@acc_saxpy.cpp:50 0.01% 209.14us 100 2.0910us 1.9880us 2.2500us acc_compute_construct@acc_saxpy.cpp:60 0.00% 55.066us 1 55.066us 55.066us 55.066us acc_enqueue_launch@acc_saxpy.cpp:70 (initVec(int, float, float*)_70_gpu) 0.00% 13.209us 1 13.209us 13.209us 13.209us acc_compute_construct@acc_saxpy.cpp:70 0.00% 10.901us 1 10.901us 10.901us 10.901us acc_implicit_wait@acc_saxpy.cpp:70 0.00% 0ns 200 0ns 0ns 0ns acc_delete@acc_saxpy.cpp:61 0.00% 0ns 200 0ns 0ns 0ns acc_delete@acc_saxpy.cpp:43 0.00% 0ns 200 0ns 0ns 0ns acc_create@acc_saxpy.cpp:60
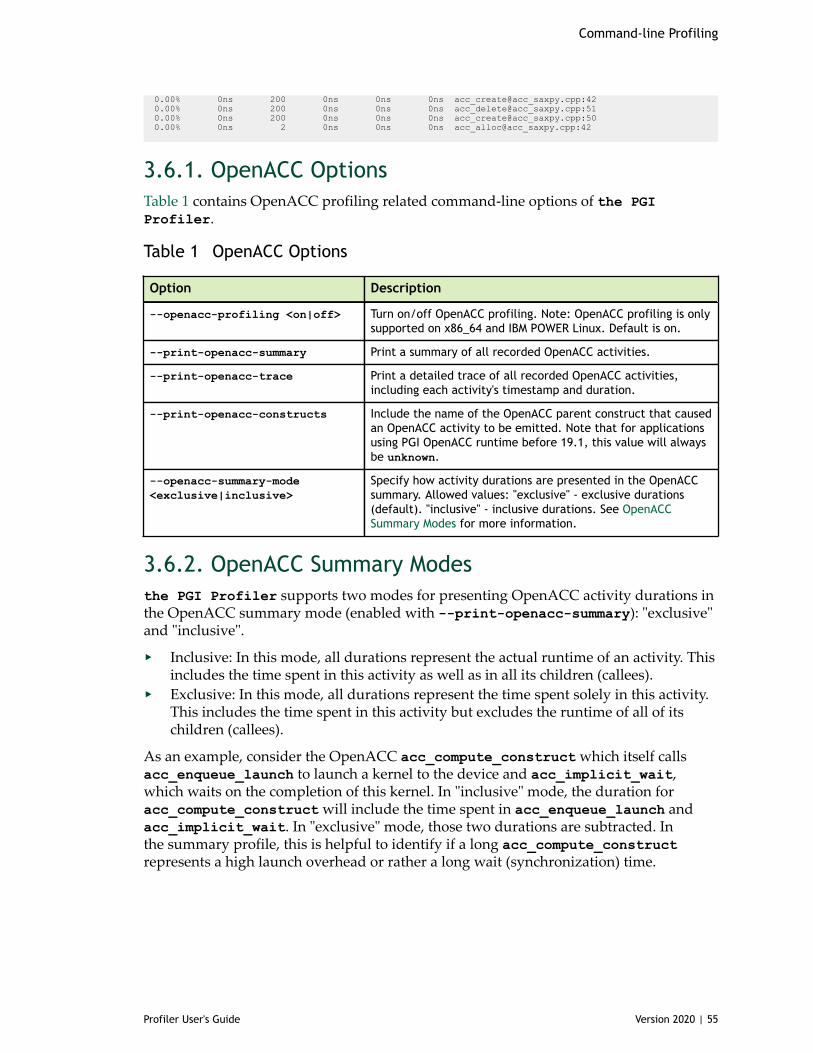
Command-line Profiling
Profiler User's Guide Version 2020 | 55
0.00% 0ns 200 0ns 0ns 0ns acc_create@acc_saxpy.cpp:42 0.00% 0ns 200 0ns 0ns 0ns acc_delete@acc_saxpy.cpp:51 0.00% 0ns 200 0ns 0ns 0ns acc_create@acc_saxpy.cpp:50 0.00% 0ns 2 0ns 0ns 0ns acc_alloc@acc_saxpy.cpp:42
3.6.1. OpenACC OptionsTable 1 contains OpenACC profiling related command-line options of the PGIProfiler.
Table 1 OpenACC Options
Option Description
--openacc-profiling <on|off> Turn on/off OpenACC profiling. Note: OpenACC profiling is onlysupported on x86_64 and IBM POWER Linux. Default is on.
--print-openacc-summary Print a summary of all recorded OpenACC activities.
--print-openacc-trace Print a detailed trace of all recorded OpenACC activities,including each activity's timestamp and duration.
--print-openacc-constructs Include the name of the OpenACC parent construct that causedan OpenACC activity to be emitted. Note that for applicationsusing PGI OpenACC runtime before 19.1, this value will alwaysbe unknown.
--openacc-summary-mode<exclusive|inclusive>
Specify how activity durations are presented in the OpenACCsummary. Allowed values: "exclusive" - exclusive durations(default). "inclusive" - inclusive durations. See OpenACCSummary Modes for more information.
3.6.2. OpenACC Summary Modesthe PGI Profiler supports two modes for presenting OpenACC activity durations inthe OpenACC summary mode (enabled with --print-openacc-summary): "exclusive"and "inclusive".
‣ Inclusive: In this mode, all durations represent the actual runtime of an activity. Thisincludes the time spent in this activity as well as in all its children (callees).
‣ Exclusive: In this mode, all durations represent the time spent solely in this activity.This includes the time spent in this activity but excludes the runtime of all of itschildren (callees).
As an example, consider the OpenACC acc_compute_construct which itself callsacc_enqueue_launch to launch a kernel to the device and acc_implicit_wait,which waits on the completion of this kernel. In "inclusive" mode, the duration foracc_compute_construct will include the time spent in acc_enqueue_launch andacc_implicit_wait. In "exclusive" mode, those two durations are subtracted. Inthe summary profile, this is helpful to identify if a long acc_compute_constructrepresents a high launch overhead or rather a long wait (synchronization) time.
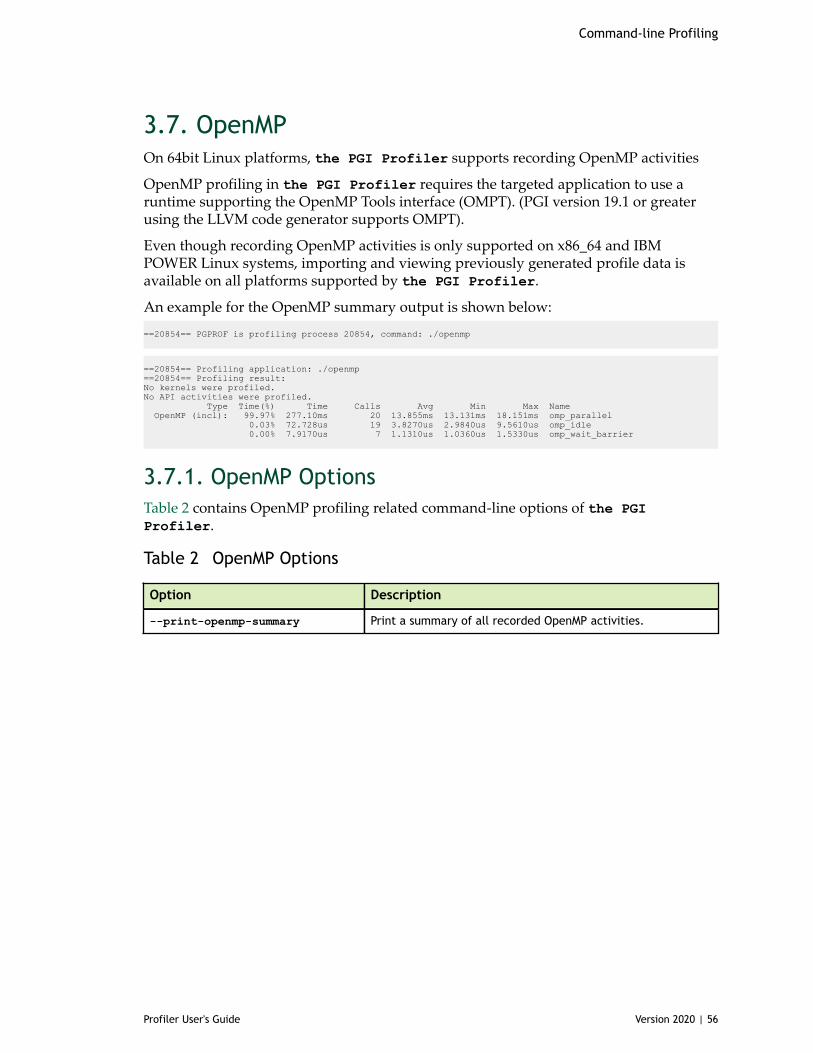
Command-line Profiling
Profiler User's Guide Version 2020 | 56
3.7. OpenMPOn 64bit Linux platforms, the PGI Profiler supports recording OpenMP activities
OpenMP profiling in the PGI Profiler requires the targeted application to use aruntime supporting the OpenMP Tools interface (OMPT). (PGI version 19.1 or greaterusing the LLVM code generator supports OMPT).
Even though recording OpenMP activities is only supported on x86_64 and IBMPOWER Linux systems, importing and viewing previously generated profile data isavailable on all platforms supported by the PGI Profiler.
An example for the OpenMP summary output is shown below:
==20854== PGPROF is profiling process 20854, command: ./openmp
==20854== Profiling application: ./openmp==20854== Profiling result:No kernels were profiled.No API activities were profiled. Type Time(%) Time Calls Avg Min Max Name OpenMP (incl): 99.97% 277.10ms 20 13.855ms 13.131ms 18.151ms omp_parallel 0.03% 72.728us 19 3.8270us 2.9840us 9.5610us omp_idle 0.00% 7.9170us 7 1.1310us 1.0360us 1.5330us omp_wait_barrier
3.7.1. OpenMP OptionsTable 2 contains OpenMP profiling related command-line options of the PGIProfiler.
Table 2 OpenMP Options
Option Description
--print-openmp-summary Print a summary of all recorded OpenMP activities.
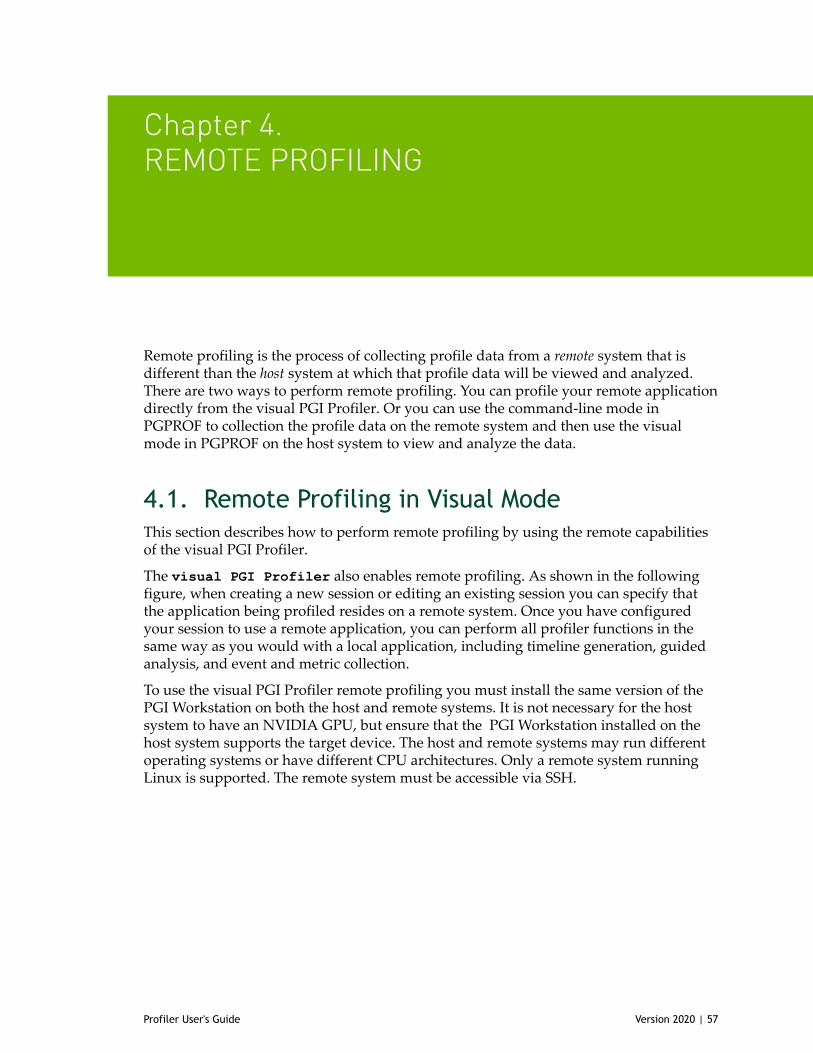
Profiler User's Guide Version 2020 | 57
Chapter 4.REMOTE PROFILING
Remote profiling is the process of collecting profile data from a remote system that isdifferent than the host system at which that profile data will be viewed and analyzed.There are two ways to perform remote profiling. You can profile your remote applicationdirectly from the visual PGI Profiler. Or you can use the command-line mode inPGPROF to collection the profile data on the remote system and then use the visualmode in PGPROF on the host system to view and analyze the data.
4.1. Remote Profiling in Visual ModeThis section describes how to perform remote profiling by using the remote capabilitiesof the visual PGI Profiler.
The visual PGI Profiler also enables remote profiling. As shown in the followingfigure, when creating a new session or editing an existing session you can specify thatthe application being profiled resides on a remote system. Once you have configuredyour session to use a remote application, you can perform all profiler functions in thesame way as you would with a local application, including timeline generation, guidedanalysis, and event and metric collection.
To use the visual PGI Profiler remote profiling you must install the same version of thePGI Workstation on both the host and remote systems. It is not necessary for the hostsystem to have an NVIDIA GPU, but ensure that the PGI Workstation installed on thehost system supports the target device. The host and remote systems may run differentoperating systems or have different CPU architectures. Only a remote system runningLinux is supported. The remote system must be accessible via SSH.
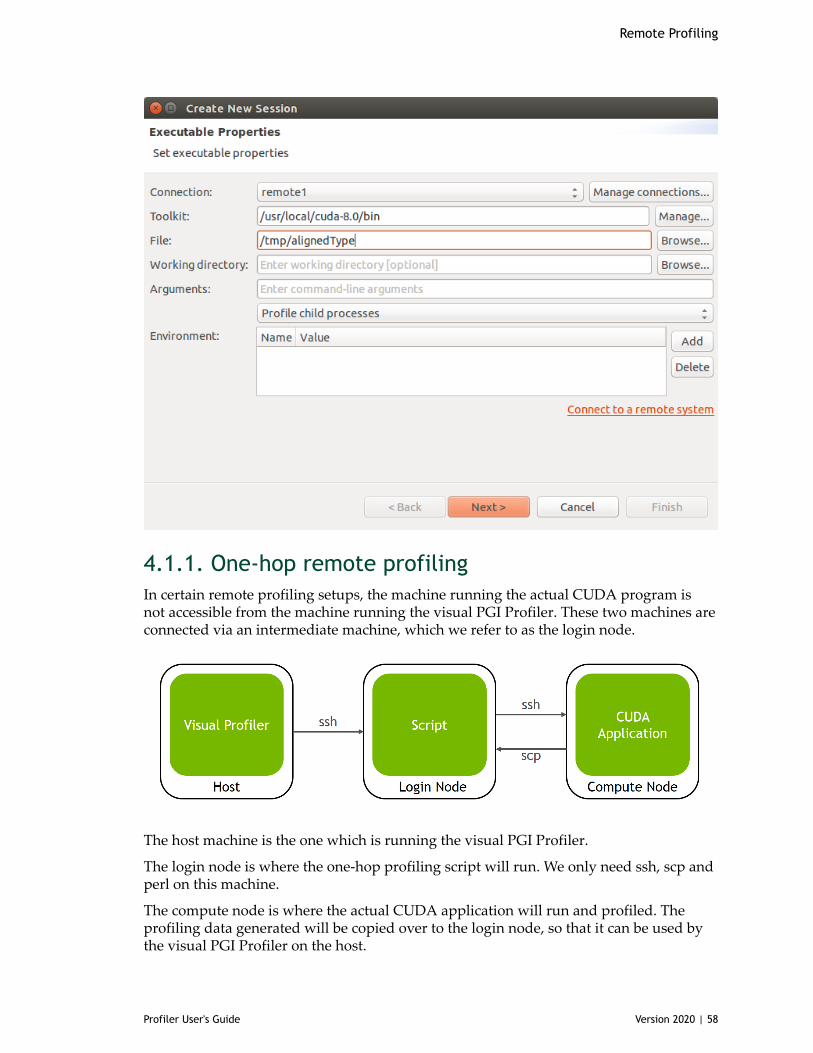
Remote Profiling
Profiler User's Guide Version 2020 | 58
4.1.1. One-hop remote profilingIn certain remote profiling setups, the machine running the actual CUDA program isnot accessible from the machine running the visual PGI Profiler. These two machines areconnected via an intermediate machine, which we refer to as the login node.
The host machine is the one which is running the visual PGI Profiler.
The login node is where the one-hop profiling script will run. We only need ssh, scp andperl on this machine.
The compute node is where the actual CUDA application will run and profiled. Theprofiling data generated will be copied over to the login node, so that it can be used bythe visual PGI Profiler on the host.
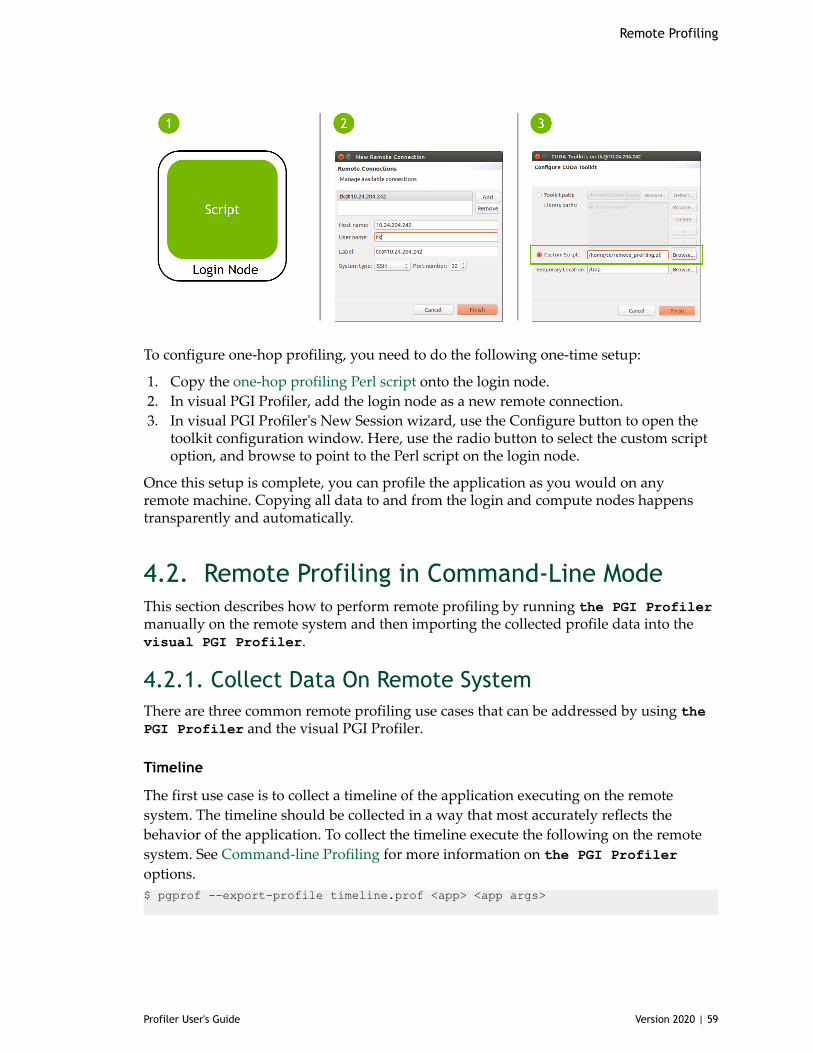
Remote Profiling
Profiler User's Guide Version 2020 | 59
To configure one-hop profiling, you need to do the following one-time setup:
1. Copy the one-hop profiling Perl script onto the login node. 2. In visual PGI Profiler, add the login node as a new remote connection. 3. In visual PGI Profiler's New Session wizard, use the Configure button to open the
toolkit configuration window. Here, use the radio button to select the custom scriptoption, and browse to point to the Perl script on the login node.
Once this setup is complete, you can profile the application as you would on anyremote machine. Copying all data to and from the login and compute nodes happenstransparently and automatically.
4.2. Remote Profiling in Command-Line ModeThis section describes how to perform remote profiling by running the PGI Profilermanually on the remote system and then importing the collected profile data into thevisual PGI Profiler.
4.2.1. Collect Data On Remote SystemThere are three common remote profiling use cases that can be addressed by using thePGI Profiler and the visual PGI Profiler.
Timeline
The first use case is to collect a timeline of the application executing on the remotesystem. The timeline should be collected in a way that most accurately reflects thebehavior of the application. To collect the timeline execute the following on the remotesystem. See Command-line Profiling for more information on the PGI Profileroptions.$ pgprof --export-profile timeline.prof <app> <app args>

Remote Profiling
Profiler User's Guide Version 2020 | 60
The profile data will be collected in timeline.prof. You should copy this file back tothe host system and then import it into the visual PGI Profiler as described in the nextsection.
Metrics And Events
The second use case is to collect events or metrics for all kernels in an application forwhich you have already collected a timeline. Collecting events or metrics for all kernelswill significantly change the overall performance characteristics of the applicationbecause all kernel executions will be serialized on the GPU. Even though overallapplication performance is changed, the event or metric values for individual kernelswill be correct and so you can merge the collected event and metric values onto apreviously collected timeline to get an accurate picture of the applications behavior. Tocollect events or metrics you use the --events or --metrics flag. The following showsan example using just the --metrics flag to collect two metrics.$ pgprof --metrics achieved_occupancy,ipc -o metrics.prof <app> <app args>
You can collect any number of events and metrics for each the PGI Profilerinvocation, and you can invoke the PGI Profiler multiple times to collect multiplemetrics.prof files. To get accurate profiling results, it is important that yourapplication conform to the requirements detailed in Application Requirements.
The profile data will be collected in the metrics.prof file(s). You should copy thesefiles back to the host system and then import it into the visual PGI Profiler as describedin the next section.
Analysis For Individual Kernel
The third common remote profiling use case is to collect the metrics needed by theanalysis system for an individual kernel. When imported into the visual PGI Profilerthis data will enable the analysis system to analyze the kernel and report optimizationopportunities for that kernel. To collect the analysis data execute the following onthe remote system. It is important that the --kernels option appear before the --analysis-metrics option so that metrics are collected only for the kernel(s) specifiedby kernel specifier. See Profiling Scope for more information on the --kernelsoption.$ pgprof --kernels <kernel specifier> --analysis-metrics -o analysis.prof <app> <app args>
The profile data will be collected in analysis.prof. You should copy this file back tothe host system and then import it into the visual PGI Profiler as described in the nextsection.
Remote Profiling
Profiler User's Guide Version 2020 | 61
4.2.2. View And Analyze DataThe collected profile data is viewed and analyzed by importing it into the visual PGIProfiler on the host system. See Import Session for more information about importing.
Timeline, Metrics And Events
To view collected timeline data, the timeline.prof file can be imported into thevisual PGI Profiler as described in Import Single-Process the PGI Profiler Session.If metric or event data was also collected for the application, the correspondingmetrics.prof file(s) can be imported into the visual PGI Profiler along with thetimeline so that the events and metrics collected for each kernel are associated with thecorresponding kernel in the timeline.
Guided Analysis For Individual Kernel
To view collected analysis data for an individual kernel, the analysis.prof file canbe imported into the visual PGI Profiler as described in Import Single-Process thePGI Profiler Session. The analysis.prof must be imported by itself. The timeline willshow just the individual kernel that we specified during data collection. After importing,the guided analysis system can be used to explore the optimization opportunities for thekernel.
Profiler User's Guide Version 2020 | 62
Chapter 5.NVIDIA TOOLS EXTENSION
NVIDIA Tools Extension (NVTX) is a C-based Application Programming Interface (API)for annotating events, code ranges, and resources in your applications. Applicationswhich integrate NVTX can use the visual PGI Profiler to capture and visualize theseevents and ranges. The NVTX API provides two core services:
1. Tracing of CPU events and time ranges. 2. Naming of OS and CUDA resources.
NVTX can be quickly integrated into an application. The sample program below showsthe use of marker events, range events, and resource naming.
void Wait(int waitMilliseconds) { nvtxNameOsThread(“MAIN”); nvtxRangePush(__FUNCTION__); nvtxMark("Waiting..."); Sleep(waitMilliseconds); nvtxRangePop(); }
int main(void) { nvtxNameOsThread("MAIN"); nvtxRangePush(__FUNCTION__); Wait(); nvtxRangePop(); }
5.1. NVTX API Overview
Files
The core NVTX API is defined in file nvToolsExt.h, whereas CUDA-specific extensionsto the NVTX interface are defined in nvToolsExtCuda.h and nvToolsExtCudaRt.h.On Linux the NVTX shared library is called libnvToolsExt.so. On Windows thelibrary (.lib) and runtime components (.dll) are named nvToolsExt[bitness=32|64]_[version].{dll|lib}.
NVIDIA Tools Extension
Profiler User's Guide Version 2020 | 63
Function Calls
All NVTX API functions start with an nvtx name prefix and may end with one of thethree suffixes: A, W, or Ex. NVTX functions with these suffixes exist in multiple variants,performing the same core functionality with different parameter encodings. Dependingon the version of the NVTX library, available encodings may include ASCII (A), Unicode(W), or event structure (Ex).
The CUDA implementation of NVTX only implements the ASCII (A) and eventstructure (Ex) variants of the API, the Unicode (W) versions are not supported and haveno effect when called.
Return Values
Some of the NVTX functions are defined to have return values. For example, thenvtxRangeStart() function returns a unique range identifier and nvtxRangePush()function outputs the current stack level. It is recommended not to use the returnedvalues as part of conditional code in the instrumented application. The returned valuescan differ between various implementations of the NVTX library and, consequently,having added dependencies on the return values might work with one tool, but may failwith another.
5.2. NVTX API EventsMarkers are used to describe events that occur at a specific time during the execution ofan application, while ranges detail the time span in which they occur. This information ispresented alongside all of the other captured data, which makes it easier to understandthe collected information. All markers and ranges are identified by a message string.The Ex version of the marker and range APIs also allows category, color, and payloadattributes to be associated with the event using the event attributes structure.
5.2.1. NVTX MarkersA marker is used to describe an instantaneous event. A marker can contain a textmessage or specify additional information using the event attributes structure. UsenvtxMarkA to create a marker containing an ASCII message. Use nvtxMarkEx()to create a marker containing additional attributes specified by the event attributestructure. The nvtxMarkW() function is not supported in the CUDA implementation ofNVTX and has no effect if called.
Code Example
nvtxMarkA("My mark");
nvtxEventAttributes_t eventAttrib = {0}; eventAttrib.version = NVTX_VERSION; eventAttrib.size = NVTX_EVENT_ATTRIB_STRUCT_SIZE; eventAttrib.colorType = NVTX_COLOR_ARGB; eventAttrib.color = COLOR_RED;
NVIDIA Tools Extension
Profiler User's Guide Version 2020 | 64
eventAttrib.messageType = NVTX_MESSAGE_TYPE_ASCII; eventAttrib.message.ascii = "my mark with attributes"; nvtxMarkEx(&eventAttrib);
5.2.2. NVTX Range Start/StopA start/end range is used to denote an arbitrary, potentially non-nested, time span.The start of a range can occur on a different thread than the end of the range. Arange can contain a text message or specify additional information using the eventattributes structure. Use nvtxRangeStartA() to create a marker containing an ASCIImessage. Use nvtxRangeStartEx() to create a range containing additional attributesspecified by the event attribute structure. The nvtxRangeStartW() function is notsupported in the CUDA implementation of NVTX and has no effect if called. Forthe correlation of a start/end pair, a unique correlation ID is created that is returnedfrom nvtxRangeStartA() or nvtxRangeStartEx(), and is then passed intonvtxRangeEnd().
Code Example
// non-overlapping range nvtxRangeId_t id1 = nvtxRangeStartA("My range"); nvtxRangeEnd(id1);
nvtxEventAttributes_t eventAttrib = {0}; eventAttrib.version = NVTX_VERSION; eventAttrib.size = NVTX_EVENT_ATTRIB_STRUCT_SIZE; eventAttrib.colorType = NVTX_COLOR_ARGB; eventAttrib.color = COLOR_BLUE; eventAttrib.messageType = NVTX_MESSAGE_TYPE_ASCII; eventAttrib.message.ascii = "my start/stop range"; nvtxRangeId_t id2 = nvtxRangeStartEx(&eventAttrib); nvtxRangeEnd(id2);
// overlapping ranges nvtxRangeId_t r1 = nvtxRangeStartA("My range 0"); nvtxRangeId_t r2 = nvtxRangeStartA("My range 1"); nvtxRangeEnd(r1); nvtxRangeEnd(r2);
5.2.3. NVTX Range Push/PopA push/pop range is used to denote nested time span. The start of a range must occur onthe same thread as the end of the range. A range can contain a text message or specifyadditional information using the event attributes structure. Use nvtxRangePushA()to create a marker containing an ASCII message. Use nvtxRangePushEx() to createa range containing additional attributes specified by the event attribute structure. ThenvtxRangePushW() function is not supported in the CUDA implementation of NVTXand has no effect if called. Each push function returns the zero-based depth of the rangebeing started. The nvtxRangePop() function is used to end the most recently pushedrange for the thread. nvtxRangePop() returns the zero-based depth of the range beingended. If the pop does not have a matching push, a negative value is returned to indicatean error.
NVIDIA Tools Extension
Profiler User's Guide Version 2020 | 65
Code Example
nvtxRangePushA("outer"); nvtxRangePushA("inner"); nvtxRangePop(); // end "inner" range nvtxRangePop(); // end "outer" range
nvtxEventAttributes_t eventAttrib = {0}; eventAttrib.version = NVTX_VERSION; eventAttrib.size = NVTX_EVENT_ATTRIB_STRUCT_SIZE; eventAttrib.colorType = NVTX_COLOR_ARGB; eventAttrib.color = COLOR_GREEN; eventAttrib.messageType = NVTX_MESSAGE_TYPE_ASCII; eventAttrib.message.ascii = "my push/pop range"; nvtxRangePushEx(&eventAttrib); nvtxRangePop();
5.2.4. Event Attributes StructureThe events attributes structure, nvtxEventAttributes_t, is used to describe theattributes of an event. The layout of the structure is defined by a specific version ofNVTX and can change between different versions of the Tools Extension library.
Attributes
Markers and ranges can use attributes to provide additional information for an event orto guide the tool's visualization of the data. Each of the attributes is optional and if leftunspecified, the attributes fall back to a default value.Message
The message field can be used to specify an optional string. The caller must set boththe messageType and message fields. The default value is NVTX_MESSAGE_UNKNOWN.The CUDA implementation of NVTX only supports ASCII type messages.
CategoryThe category attribute is a user-controlled ID that can be used to group events. Thetool may use category IDs to improve filtering, or for grouping events. The defaultvalue is 0.
ColorThe color attribute is used to help visually identify events in the tool. The caller mustset both the colorType and color fields.
PayloadThe payload attribute can be used to provide additional data for markers and ranges.Range events can only specify values at the beginning of a range. The caller mustspecify valid values for both the payloadType and payload fields.
Initialization
The caller should always perform the following three tasks when using attributes:
‣ Zero the structure‣ Set the version field
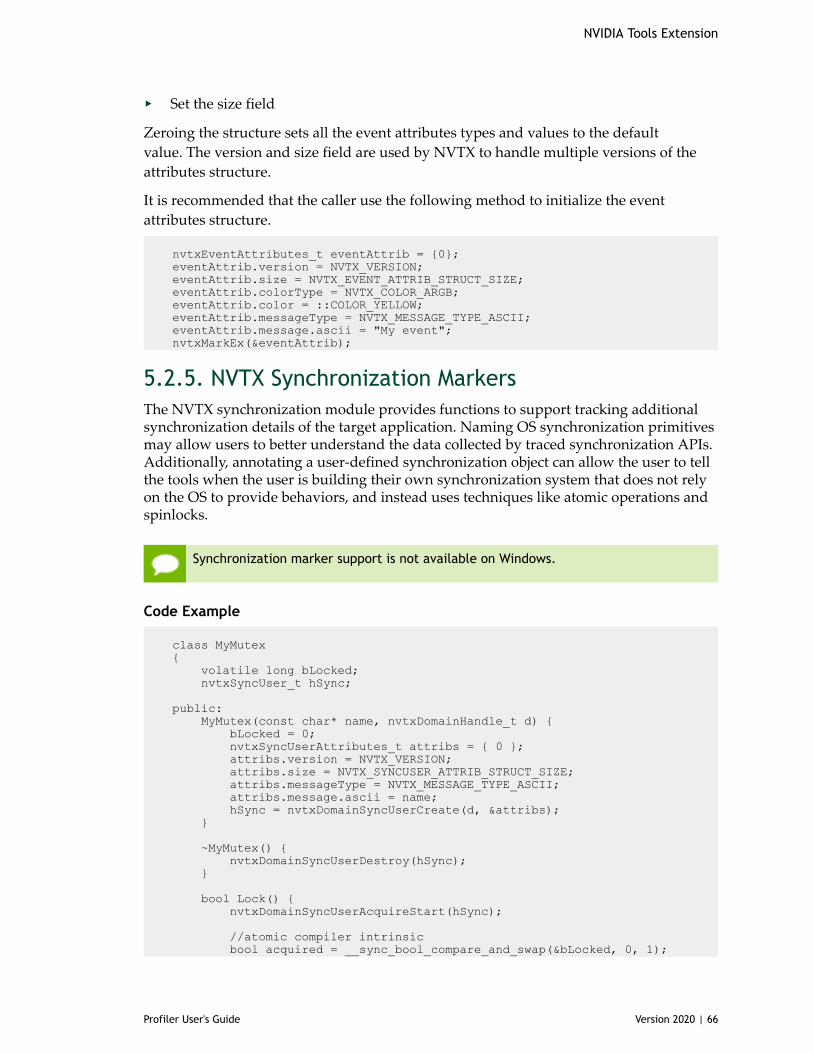
NVIDIA Tools Extension
Profiler User's Guide Version 2020 | 66
‣ Set the size field
Zeroing the structure sets all the event attributes types and values to the defaultvalue. The version and size field are used by NVTX to handle multiple versions of theattributes structure.
It is recommended that the caller use the following method to initialize the eventattributes structure.
nvtxEventAttributes_t eventAttrib = {0}; eventAttrib.version = NVTX_VERSION; eventAttrib.size = NVTX_EVENT_ATTRIB_STRUCT_SIZE; eventAttrib.colorType = NVTX_COLOR_ARGB; eventAttrib.color = ::COLOR_YELLOW; eventAttrib.messageType = NVTX_MESSAGE_TYPE_ASCII; eventAttrib.message.ascii = "My event"; nvtxMarkEx(&eventAttrib);
5.2.5. NVTX Synchronization MarkersThe NVTX synchronization module provides functions to support tracking additionalsynchronization details of the target application. Naming OS synchronization primitivesmay allow users to better understand the data collected by traced synchronization APIs.Additionally, annotating a user-defined synchronization object can allow the user to tellthe tools when the user is building their own synchronization system that does not relyon the OS to provide behaviors, and instead uses techniques like atomic operations andspinlocks.
Synchronization marker support is not available on Windows.
Code Example
class MyMutex { volatile long bLocked; nvtxSyncUser_t hSync;
public: MyMutex(const char* name, nvtxDomainHandle_t d) { bLocked = 0; nvtxSyncUserAttributes_t attribs = { 0 }; attribs.version = NVTX_VERSION; attribs.size = NVTX_SYNCUSER_ATTRIB_STRUCT_SIZE; attribs.messageType = NVTX_MESSAGE_TYPE_ASCII; attribs.message.ascii = name; hSync = nvtxDomainSyncUserCreate(d, &attribs); }
~MyMutex() { nvtxDomainSyncUserDestroy(hSync); }
bool Lock() { nvtxDomainSyncUserAcquireStart(hSync);
//atomic compiler intrinsic bool acquired = __sync_bool_compare_and_swap(&bLocked, 0, 1);
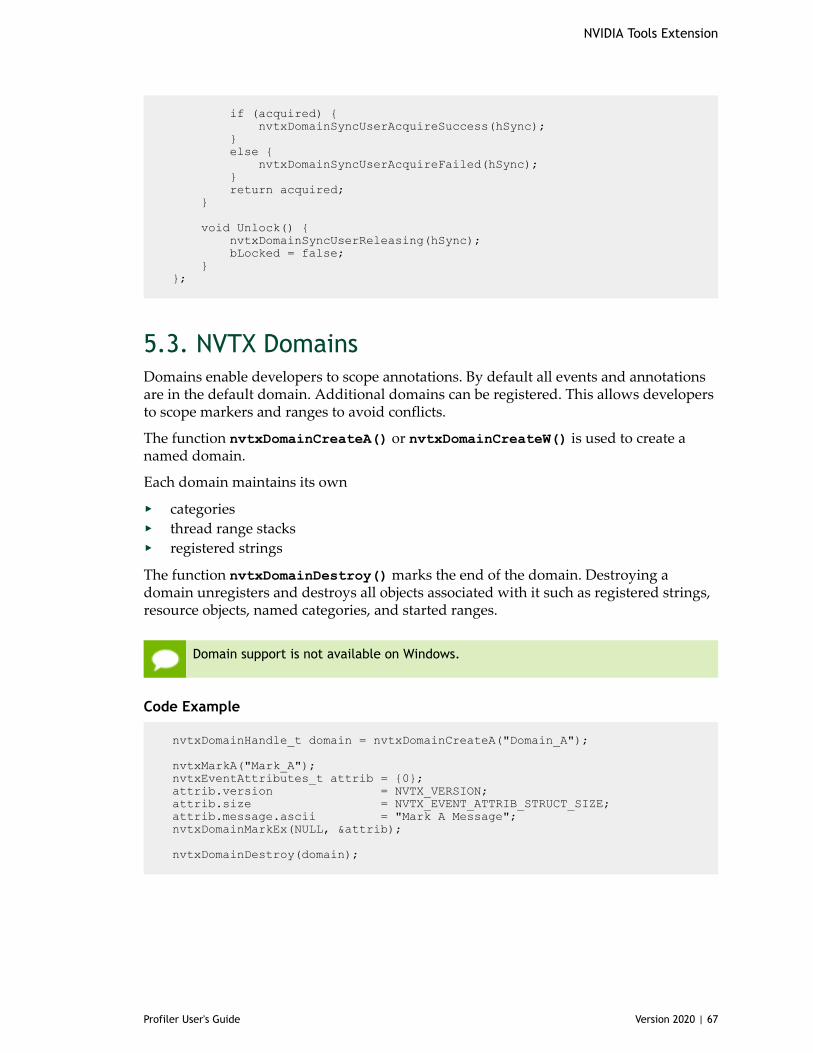
NVIDIA Tools Extension
Profiler User's Guide Version 2020 | 67
if (acquired) { nvtxDomainSyncUserAcquireSuccess(hSync); } else { nvtxDomainSyncUserAcquireFailed(hSync); } return acquired; }
void Unlock() { nvtxDomainSyncUserReleasing(hSync); bLocked = false; } };
5.3. NVTX DomainsDomains enable developers to scope annotations. By default all events and annotationsare in the default domain. Additional domains can be registered. This allows developersto scope markers and ranges to avoid conflicts.
The function nvtxDomainCreateA() or nvtxDomainCreateW() is used to create anamed domain.
Each domain maintains its own
‣ categories‣ thread range stacks‣ registered strings
The function nvtxDomainDestroy() marks the end of the domain. Destroying adomain unregisters and destroys all objects associated with it such as registered strings,resource objects, named categories, and started ranges.
Domain support is not available on Windows.
Code Example
nvtxDomainHandle_t domain = nvtxDomainCreateA("Domain_A");
nvtxMarkA("Mark_A"); nvtxEventAttributes_t attrib = {0}; attrib.version = NVTX_VERSION; attrib.size = NVTX_EVENT_ATTRIB_STRUCT_SIZE; attrib.message.ascii = "Mark A Message"; nvtxDomainMarkEx(NULL, &attrib);
nvtxDomainDestroy(domain);
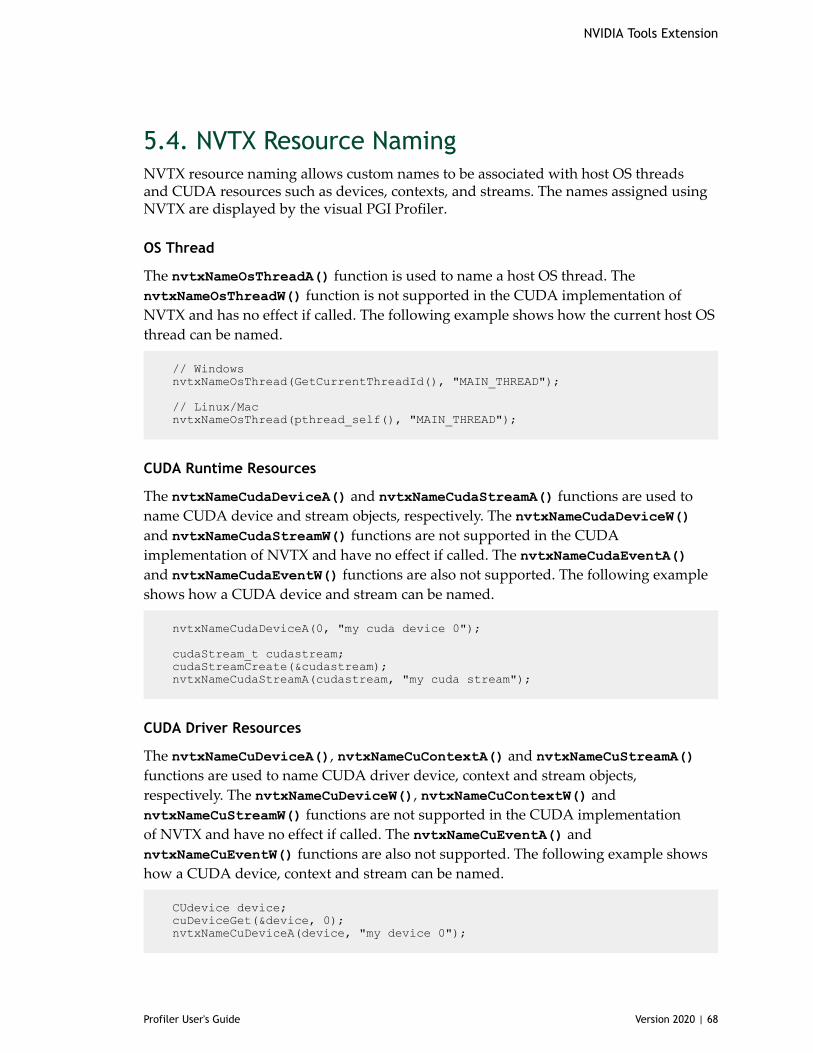
NVIDIA Tools Extension
Profiler User's Guide Version 2020 | 68
5.4. NVTX Resource NamingNVTX resource naming allows custom names to be associated with host OS threadsand CUDA resources such as devices, contexts, and streams. The names assigned usingNVTX are displayed by the visual PGI Profiler.
OS Thread
The nvtxNameOsThreadA() function is used to name a host OS thread. ThenvtxNameOsThreadW() function is not supported in the CUDA implementation ofNVTX and has no effect if called. The following example shows how the current host OSthread can be named.
// Windows nvtxNameOsThread(GetCurrentThreadId(), "MAIN_THREAD");
// Linux/Mac nvtxNameOsThread(pthread_self(), "MAIN_THREAD");
CUDA Runtime Resources
The nvtxNameCudaDeviceA() and nvtxNameCudaStreamA() functions are used toname CUDA device and stream objects, respectively. The nvtxNameCudaDeviceW()and nvtxNameCudaStreamW() functions are not supported in the CUDAimplementation of NVTX and have no effect if called. The nvtxNameCudaEventA()and nvtxNameCudaEventW() functions are also not supported. The following exampleshows how a CUDA device and stream can be named.
nvtxNameCudaDeviceA(0, "my cuda device 0");
cudaStream_t cudastream; cudaStreamCreate(&cudastream); nvtxNameCudaStreamA(cudastream, "my cuda stream");
CUDA Driver Resources
The nvtxNameCuDeviceA(), nvtxNameCuContextA() and nvtxNameCuStreamA()functions are used to name CUDA driver device, context and stream objects,respectively. The nvtxNameCuDeviceW(), nvtxNameCuContextW() andnvtxNameCuStreamW() functions are not supported in the CUDA implementationof NVTX and have no effect if called. The nvtxNameCuEventA() andnvtxNameCuEventW() functions are also not supported. The following example showshow a CUDA device, context and stream can be named.
CUdevice device; cuDeviceGet(&device, 0); nvtxNameCuDeviceA(device, "my device 0");

NVIDIA Tools Extension
Profiler User's Guide Version 2020 | 69
CUcontext context; cuCtxCreate(&context, 0, device); nvtxNameCuContextA(context, "my context");
cuStream stream; cuStreamCreate(&stream, 0); nvtxNameCuStreamA(stream, "my stream");
5.5. NVTX String RegistrationRegistered strings are intended to increase performance by lowering instrumentationoverhead. String may be registered once and the handle may be passed in place of astring where an the APIs may allow.
The nvtxDomainRegisterStringA() function is used to register a string.The nvtxDomainRegisterStringW() function is not supported in the CUDAimplementation of NVTX and has no effect if called.
nvtxDomainHandle_t domain = nvtxDomainCreateA("Domain_A"); nvtxStringHandle_t message = nvtxDomainRegisterStringA(domain, "registered string"); nvtxEventAttributes_t eventAttrib = {0}; eventAttrib.version = NVTX_VERSION; eventAttrib.size = NVTX_EVENT_ATTRIB_STRUCT_SIZE; eventAttrib.messageType = NVTX_MESSAGE_TYPE_REGISTERED; eventAttrib.message.registered = message;
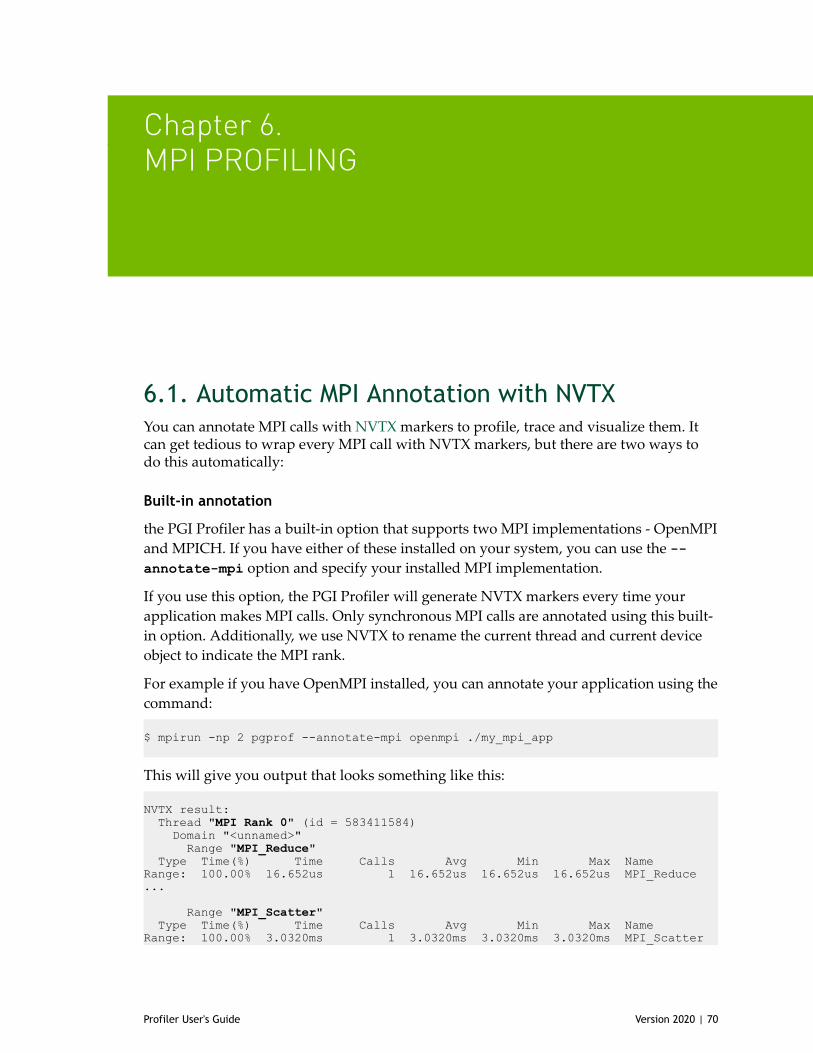
Profiler User's Guide Version 2020 | 70
Chapter 6.MPI PROFILING
6.1. Automatic MPI Annotation with NVTXYou can annotate MPI calls with NVTX markers to profile, trace and visualize them. Itcan get tedious to wrap every MPI call with NVTX markers, but there are two ways todo this automatically:
Built-in annotation
the PGI Profiler has a built-in option that supports two MPI implementations - OpenMPIand MPICH. If you have either of these installed on your system, you can use the --annotate-mpi option and specify your installed MPI implementation.
If you use this option, the PGI Profiler will generate NVTX markers every time yourapplication makes MPI calls. Only synchronous MPI calls are annotated using this built-in option. Additionally, we use NVTX to rename the current thread and current deviceobject to indicate the MPI rank.
For example if you have OpenMPI installed, you can annotate your application using thecommand: $ mpirun -np 2 pgprof --annotate-mpi openmpi ./my_mpi_app
This will give you output that looks something like this:
NVTX result: Thread "MPI Rank 0" (id = 583411584) Domain "<unnamed>" Range "MPI_Reduce" Type Time(%) Time Calls Avg Min Max NameRange: 100.00% 16.652us 1 16.652us 16.652us 16.652us MPI_Reduce...
Range "MPI_Scatter" Type Time(%) Time Calls Avg Min Max NameRange: 100.00% 3.0320ms 1 3.0320ms 3.0320ms 3.0320ms MPI_Scatter
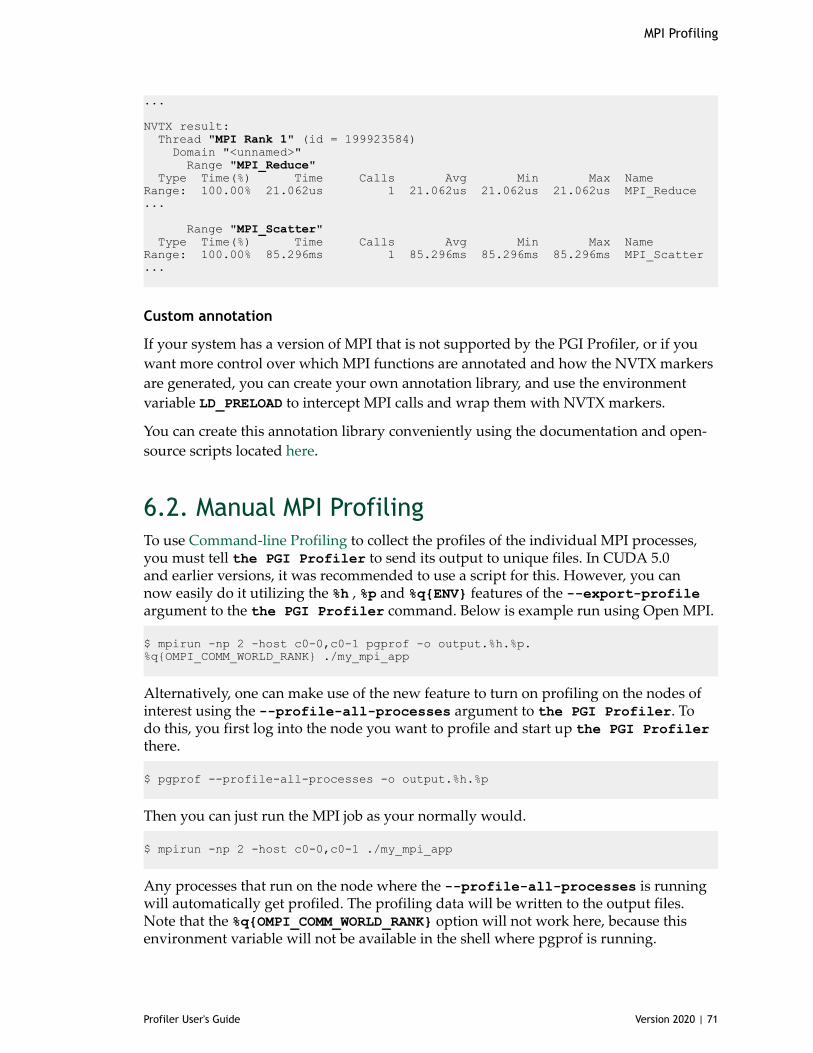
MPI Profiling
Profiler User's Guide Version 2020 | 71
...
NVTX result: Thread "MPI Rank 1" (id = 199923584) Domain "<unnamed>" Range "MPI_Reduce" Type Time(%) Time Calls Avg Min Max NameRange: 100.00% 21.062us 1 21.062us 21.062us 21.062us MPI_Reduce...
Range "MPI_Scatter" Type Time(%) Time Calls Avg Min Max NameRange: 100.00% 85.296ms 1 85.296ms 85.296ms 85.296ms MPI_Scatter...
Custom annotation
If your system has a version of MPI that is not supported by the PGI Profiler, or if youwant more control over which MPI functions are annotated and how the NVTX markersare generated, you can create your own annotation library, and use the environmentvariable LD_PRELOAD to intercept MPI calls and wrap them with NVTX markers.
You can create this annotation library conveniently using the documentation and open-source scripts located here.
6.2. Manual MPI ProfilingTo use Command-line Profiling to collect the profiles of the individual MPI processes,you must tell the PGI Profiler to send its output to unique files. In CUDA 5.0and earlier versions, it was recommended to use a script for this. However, you cannow easily do it utilizing the %h , %p and %q{ENV} features of the --export-profileargument to the the PGI Profiler command. Below is example run using Open MPI. $ mpirun -np 2 -host c0-0,c0-1 pgprof -o output.%h.%p.%q{OMPI_COMM_WORLD_RANK} ./my_mpi_app
Alternatively, one can make use of the new feature to turn on profiling on the nodes ofinterest using the --profile-all-processes argument to the PGI Profiler. Todo this, you first log into the node you want to profile and start up the PGI Profilerthere. $ pgprof --profile-all-processes -o output.%h.%p
Then you can just run the MPI job as your normally would. $ mpirun -np 2 -host c0-0,c0-1 ./my_mpi_app
Any processes that run on the node where the --profile-all-processes is runningwill automatically get profiled. The profiling data will be written to the output files.Note that the %q{OMPI_COMM_WORLD_RANK} option will not work here, because thisenvironment variable will not be available in the shell where pgprof is running.
MPI Profiling
Profiler User's Guide Version 2020 | 72
Starting CUDA 7.5, you can name threads and CUDA contexts just as you name outputfiles with the options --process-name and --context-name, by passing a string like "MPIRank %q{OMPI_COMM_WORLD_RANK}" as a parameter. This feature is useful to spotresources associated with a specific rank when user imports multiple files into the sametime-line in the visual PGI Profiler.
$ mpirun -np 2 -host c0-0,c0-1 pgprof --process-name "MPI Rank %q{OMPI_COMM_WORLD_RANK}" --context-name "MPI Rank %q{OMPI_COMM_WORLD_RANK}" -o output.%h.%p.%q{OMPI_COMM_WORLD_RANK} ./my_mpi_app
6.3. Further ReadingDetails about what types of additional arguments to use with the PGI Profilercan be found in the Multiprocess Profiling and Redirecting Output section. Additionalinformation about how to view the data with the visual PGI Profiler can be found in theImport Single-Process the PGI Profiler Session and Import Multi-Process the PGI ProfilerSession sections.
Profiler User's Guide Version 2020 | 73
Chapter 7.DEPENDENCY ANALYSIS
The dependency analysis feature enables optimization of the program runtime andconcurrency of applications utilizing multiple CPU threads and CUDA streams. Itallows to compute the critical path of a specific execution, detect waiting time andinspect dependencies between functions executing in different threads or streams.
7.1. BackgroundThe dependency analysis in the PGI Profiler and the visual PGI Profiler isbased on execution traces of applications. A trace captures all relevant activities suchas API function calls or CUDA kernels along with their timestamps and durations.Given this execution trace and a model of the dependencies between those activities ondifferent threads/streams, a dependency graph can be constructed. Typical dependenciesmodelled in this graph would be that a CUDA kernel can not start before its respectivelaunch API call or that a blocking CUDA stream synchronization call can not returnbefore all previously enqueued work in this stream has been completed. Thesedependencies are defined by the CUDA API contract.
From this dependency graph and the API model(s), wait states can be computed. A waitstate is the duration for which an activity such as an API function call is blocked waitingon an event in another thread or stream. Given the previous stream synchronizationexample, the synchronizing API call is blocked for the time it has to wait on any GPUactivity in the respective CUDA stream. Knowledge about where wait states occur andhow long functions are blocked is helpful to identify optimization opportunities formore high-level concurrency in the application.
In addition to individual wait states, the critical path through the captured event graphenables to pinpoint those function calls, kernel and memory copies that are responsiblefor the total application runtime. The critical path is the longest path through an eventgraph that does not contain wait states, i.e. optimizing activities on this path can directlyimprove the execution time.
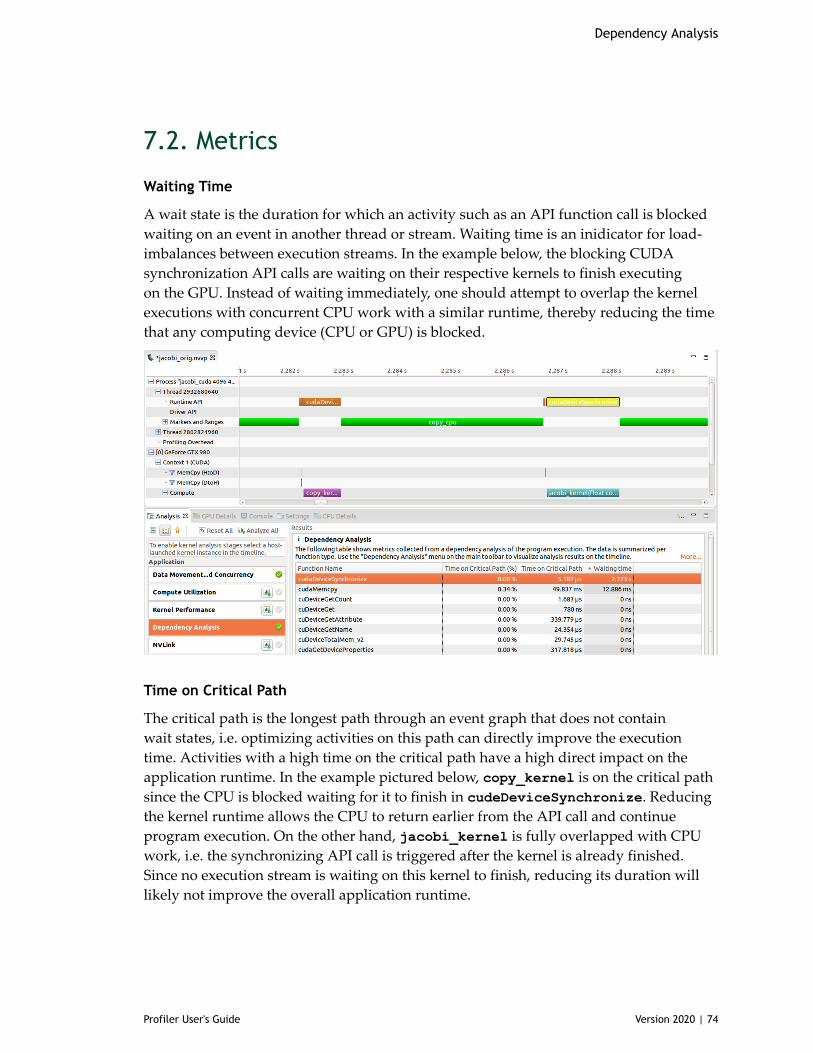
Dependency Analysis
Profiler User's Guide Version 2020 | 74
7.2. Metrics
Waiting Time
A wait state is the duration for which an activity such as an API function call is blockedwaiting on an event in another thread or stream. Waiting time is an inidicator for load-imbalances between execution streams. In the example below, the blocking CUDAsynchronization API calls are waiting on their respective kernels to finish executingon the GPU. Instead of waiting immediately, one should attempt to overlap the kernelexecutions with concurrent CPU work with a similar runtime, thereby reducing the timethat any computing device (CPU or GPU) is blocked.
Time on Critical Path
The critical path is the longest path through an event graph that does not containwait states, i.e. optimizing activities on this path can directly improve the executiontime. Activities with a high time on the critical path have a high direct impact on theapplication runtime. In the example pictured below, copy_kernel is on the critical pathsince the CPU is blocked waiting for it to finish in cudeDeviceSynchronize. Reducingthe kernel runtime allows the CPU to return earlier from the API call and continueprogram execution. On the other hand, jacobi_kernel is fully overlapped with CPUwork, i.e. the synchronizing API call is triggered after the kernel is already finished.Since no execution stream is waiting on this kernel to finish, reducing its duration willlikely not improve the overall application runtime.
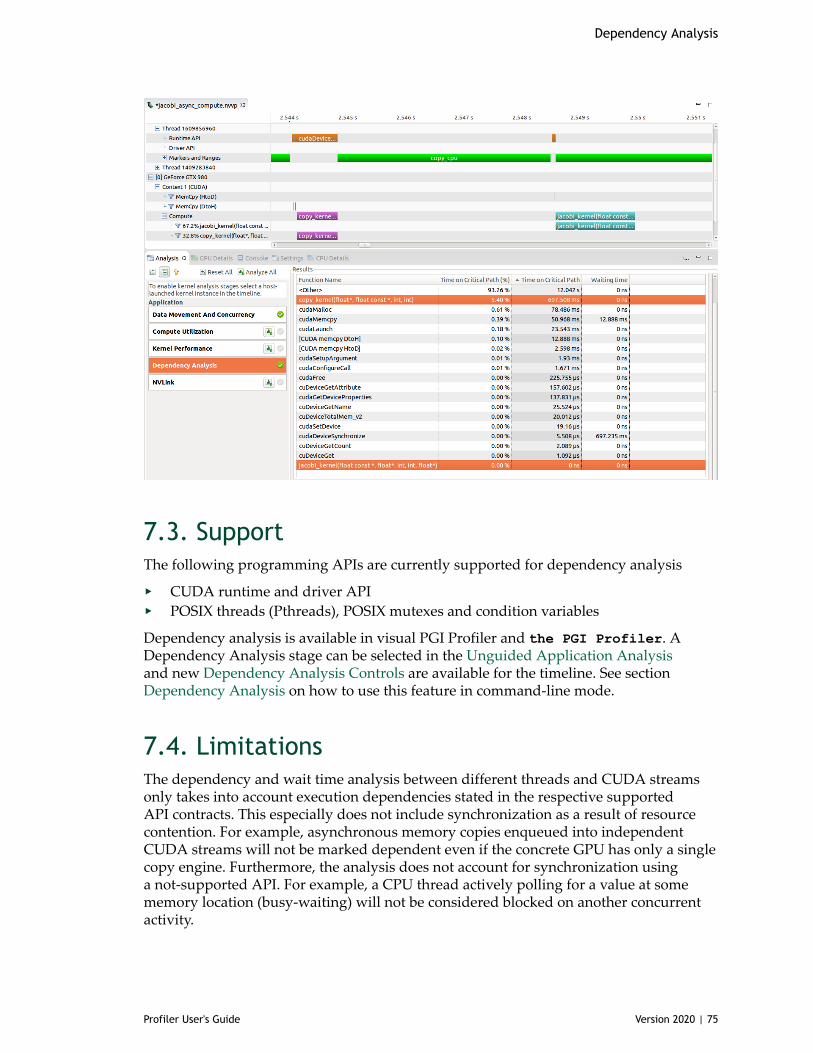
Dependency Analysis
Profiler User's Guide Version 2020 | 75
7.3. SupportThe following programming APIs are currently supported for dependency analysis
‣ CUDA runtime and driver API‣ POSIX threads (Pthreads), POSIX mutexes and condition variables
Dependency analysis is available in visual PGI Profiler and the PGI Profiler. ADependency Analysis stage can be selected in the Unguided Application Analysisand new Dependency Analysis Controls are available for the timeline. See sectionDependency Analysis on how to use this feature in command-line mode.
7.4. LimitationsThe dependency and wait time analysis between different threads and CUDA streamsonly takes into account execution dependencies stated in the respective supportedAPI contracts. This especially does not include synchronization as a result of resourcecontention. For example, asynchronous memory copies enqueued into independentCUDA streams will not be marked dependent even if the concrete GPU has only a singlecopy engine. Furthermore, the analysis does not account for synchronization usinga not-supported API. For example, a CPU thread actively polling for a value at somememory location (busy-waiting) will not be considered blocked on another concurrentactivity.
Dependency Analysis
Profiler User's Guide Version 2020 | 76
The dependency analysis has only limited support for applications using CUDADynamic Parallelism (CDP). CDP kernels can use CUDA API calls from the GPU whichare not tracked via the CUPTI Activity API. Therefore, the analysis cannot determinethe full dependencies and waiting time for CDP kernels. However, it utilizes the parent-child launch dependencies between CDP kernels. As a result the critical path will alwaysinclude the last CDP kernel of each host-launched kernel.
The POSIX semaphores API is currently not supported.
The dependency analysis does not support API functionscudaLaunchCooperativeKernelMultiDevice orcuLaunchCooperativeKernelMultiDevice. Kernel launched by either of these APIfunctions might not be tracked correctly.
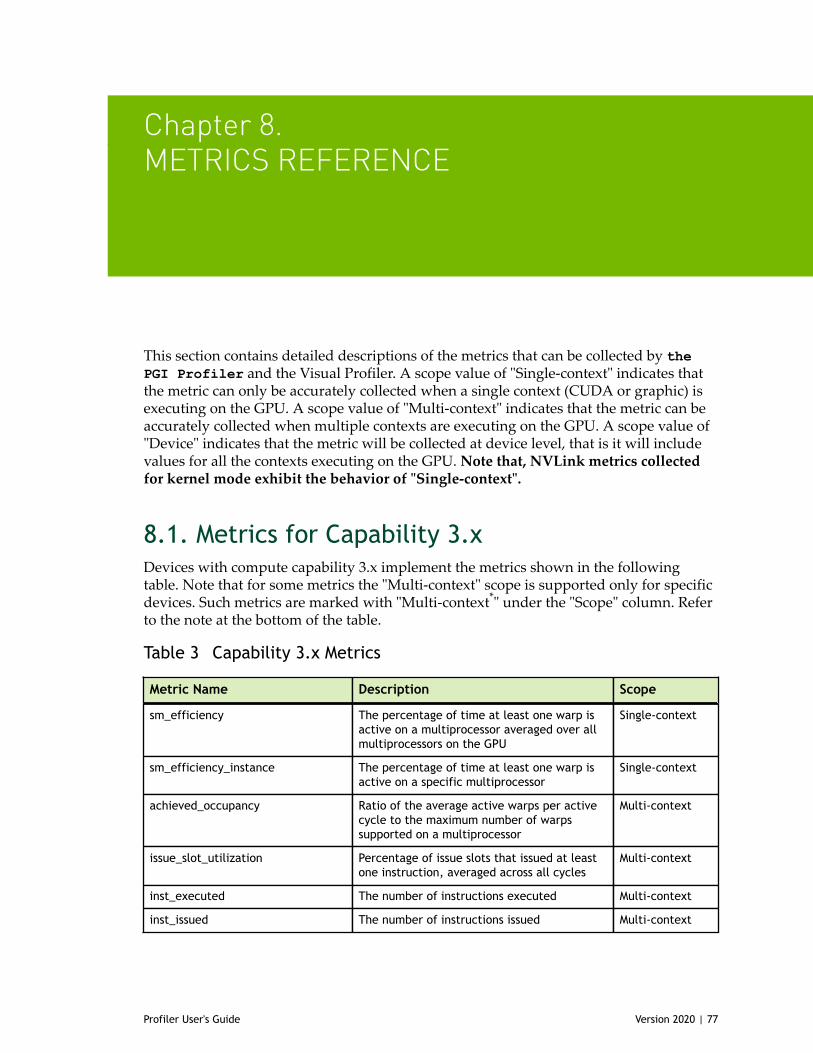
Profiler User's Guide Version 2020 | 77
Chapter 8.METRICS REFERENCE
This section contains detailed descriptions of the metrics that can be collected by thePGI Profiler and the Visual Profiler. A scope value of "Single-context" indicates thatthe metric can only be accurately collected when a single context (CUDA or graphic) isexecuting on the GPU. A scope value of "Multi-context" indicates that the metric can beaccurately collected when multiple contexts are executing on the GPU. A scope value of"Device" indicates that the metric will be collected at device level, that is it will includevalues for all the contexts executing on the GPU. Note that, NVLink metrics collectedfor kernel mode exhibit the behavior of "Single-context".
8.1. Metrics for Capability 3.xDevices with compute capability 3.x implement the metrics shown in the followingtable. Note that for some metrics the "Multi-context" scope is supported only for specificdevices. Such metrics are marked with "Multi-context*" under the "Scope" column. Referto the note at the bottom of the table.
Table 3 Capability 3.x Metrics
Metric Name Description Scope
sm_efficiency The percentage of time at least one warp isactive on a multiprocessor averaged over allmultiprocessors on the GPU
Single-context
sm_efficiency_instance The percentage of time at least one warp isactive on a specific multiprocessor
Single-context
achieved_occupancy Ratio of the average active warps per activecycle to the maximum number of warpssupported on a multiprocessor
Multi-context
issue_slot_utilization Percentage of issue slots that issued at leastone instruction, averaged across all cycles
Multi-context
inst_executed The number of instructions executed Multi-context
inst_issued The number of instructions issued Multi-context
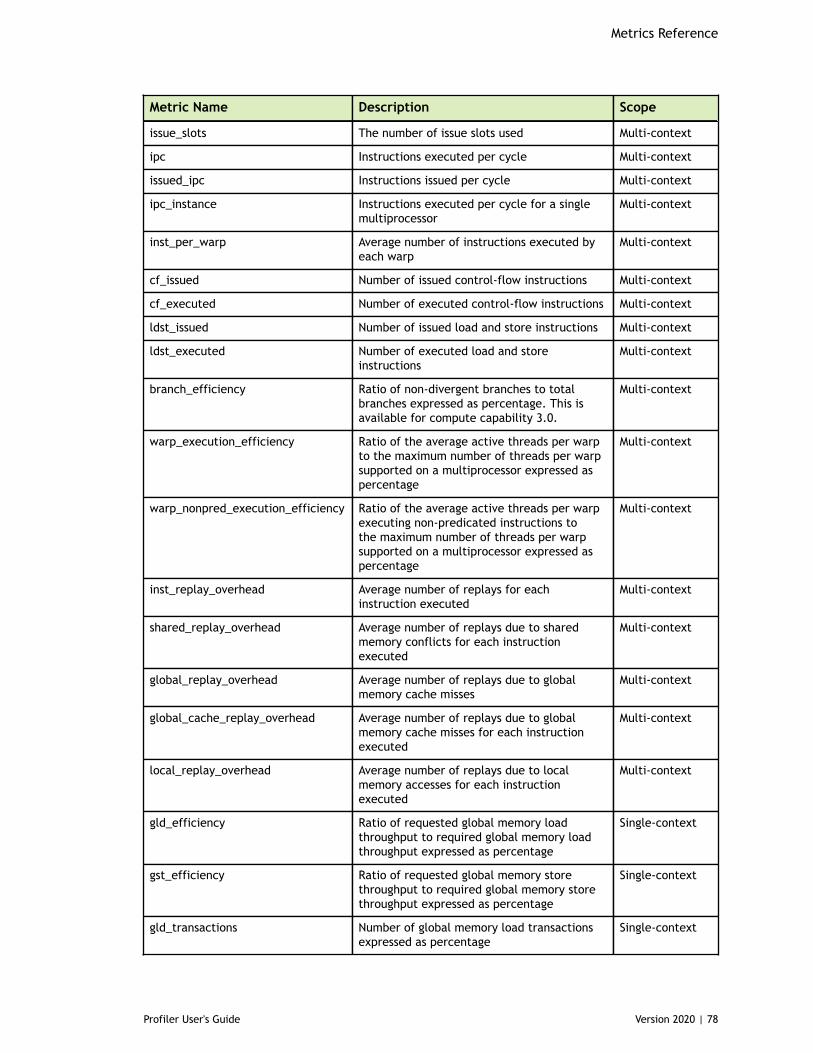
Metrics Reference
Profiler User's Guide Version 2020 | 78
Metric Name Description Scope
issue_slots The number of issue slots used Multi-context
ipc Instructions executed per cycle Multi-context
issued_ipc Instructions issued per cycle Multi-context
ipc_instance Instructions executed per cycle for a singlemultiprocessor
Multi-context
inst_per_warp Average number of instructions executed byeach warp
Multi-context
cf_issued Number of issued control-flow instructions Multi-context
cf_executed Number of executed control-flow instructions Multi-context
ldst_issued Number of issued load and store instructions Multi-context
ldst_executed Number of executed load and storeinstructions
Multi-context
branch_efficiency Ratio of non-divergent branches to totalbranches expressed as percentage. This isavailable for compute capability 3.0.
Multi-context
warp_execution_efficiency Ratio of the average active threads per warpto the maximum number of threads per warpsupported on a multiprocessor expressed aspercentage
Multi-context
warp_nonpred_execution_efficiency Ratio of the average active threads per warpexecuting non-predicated instructions tothe maximum number of threads per warpsupported on a multiprocessor expressed aspercentage
Multi-context
inst_replay_overhead Average number of replays for eachinstruction executed
Multi-context
shared_replay_overhead Average number of replays due to sharedmemory conflicts for each instructionexecuted
Multi-context
global_replay_overhead Average number of replays due to globalmemory cache misses
Multi-context
global_cache_replay_overhead Average number of replays due to globalmemory cache misses for each instructionexecuted
Multi-context
local_replay_overhead Average number of replays due to localmemory accesses for each instructionexecuted
Multi-context
gld_efficiency Ratio of requested global memory loadthroughput to required global memory loadthroughput expressed as percentage
Single-context
gst_efficiency Ratio of requested global memory storethroughput to required global memory storethroughput expressed as percentage
Single-context
gld_transactions Number of global memory load transactionsexpressed as percentage
Single-context
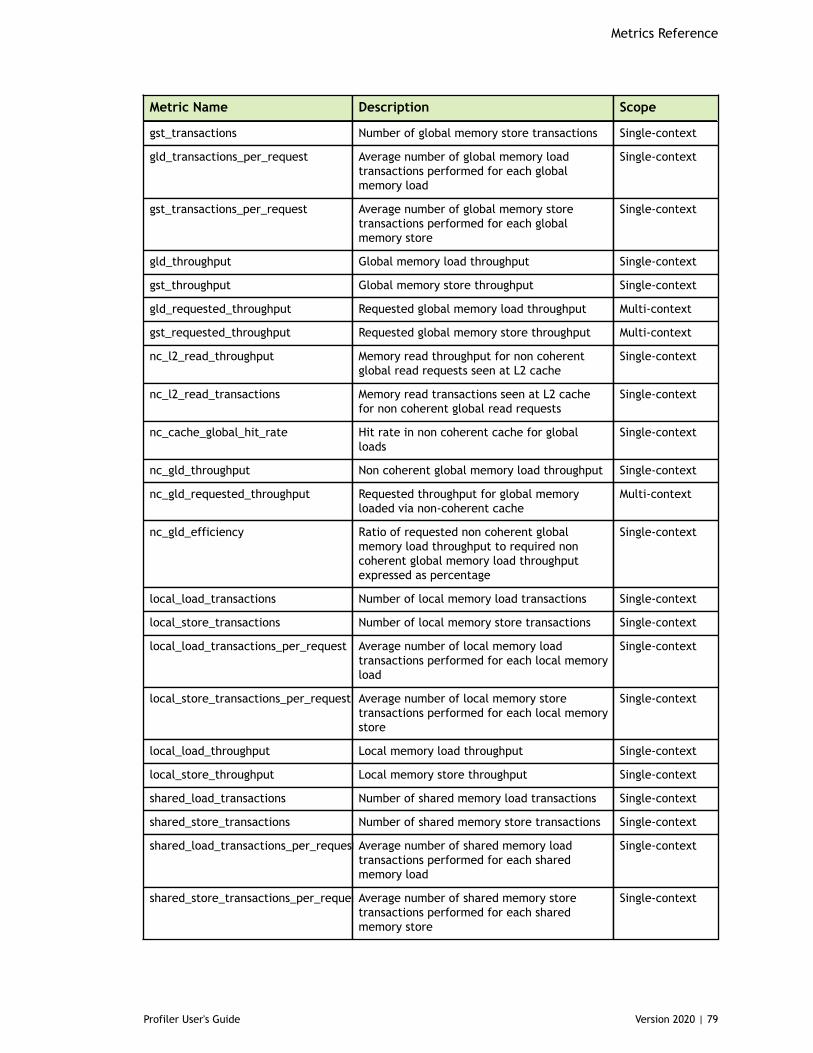
Metrics Reference
Profiler User's Guide Version 2020 | 79
Metric Name Description Scope
gst_transactions Number of global memory store transactions Single-context
gld_transactions_per_request Average number of global memory loadtransactions performed for each globalmemory load
Single-context
gst_transactions_per_request Average number of global memory storetransactions performed for each globalmemory store
Single-context
gld_throughput Global memory load throughput Single-context
gst_throughput Global memory store throughput Single-context
gld_requested_throughput Requested global memory load throughput Multi-context
gst_requested_throughput Requested global memory store throughput Multi-context
nc_l2_read_throughput Memory read throughput for non coherentglobal read requests seen at L2 cache
Single-context
nc_l2_read_transactions Memory read transactions seen at L2 cachefor non coherent global read requests
Single-context
nc_cache_global_hit_rate Hit rate in non coherent cache for globalloads
Single-context
nc_gld_throughput Non coherent global memory load throughput Single-context
nc_gld_requested_throughput Requested throughput for global memoryloaded via non-coherent cache
Multi-context
nc_gld_efficiency Ratio of requested non coherent globalmemory load throughput to required noncoherent global memory load throughputexpressed as percentage
Single-context
local_load_transactions Number of local memory load transactions Single-context
local_store_transactions Number of local memory store transactions Single-context
local_load_transactions_per_request Average number of local memory loadtransactions performed for each local memoryload
Single-context
local_store_transactions_per_request Average number of local memory storetransactions performed for each local memorystore
Single-context
local_load_throughput Local memory load throughput Single-context
local_store_throughput Local memory store throughput Single-context
shared_load_transactions Number of shared memory load transactions Single-context
shared_store_transactions Number of shared memory store transactions Single-context
shared_load_transactions_per_request Average number of shared memory loadtransactions performed for each sharedmemory load
Single-context
shared_store_transactions_per_requestAverage number of shared memory storetransactions performed for each sharedmemory store
Single-context
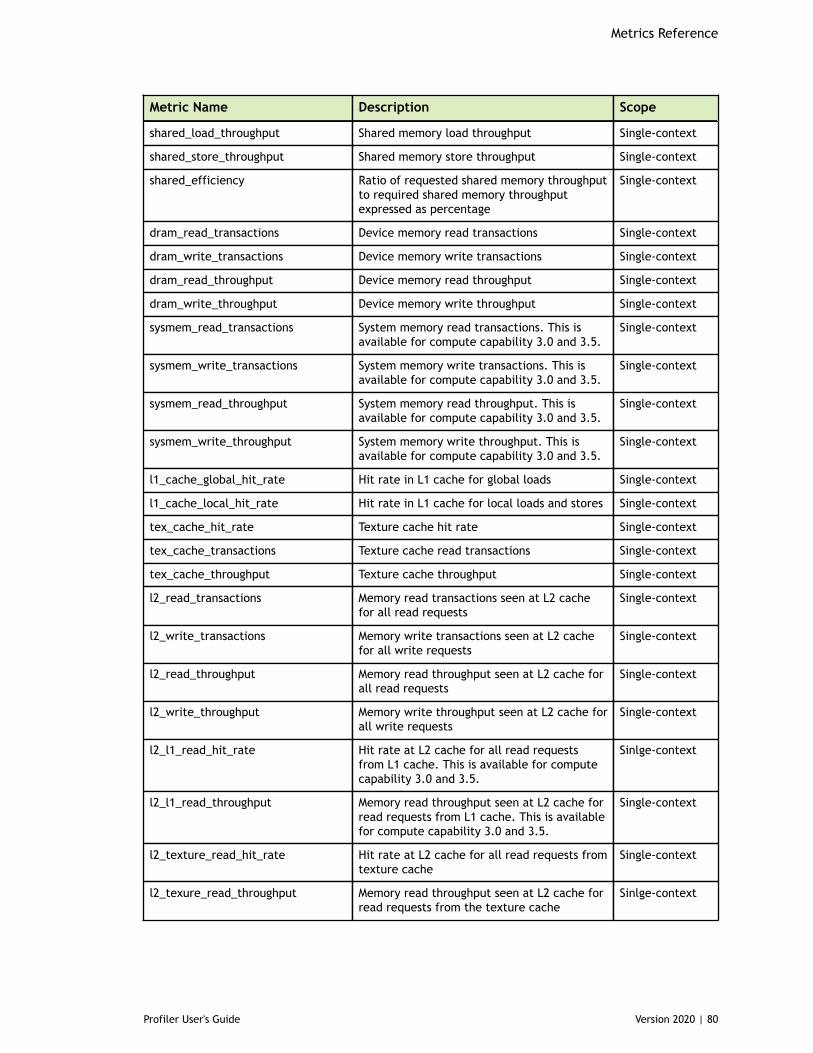
Metrics Reference
Profiler User's Guide Version 2020 | 80
Metric Name Description Scope
shared_load_throughput Shared memory load throughput Single-context
shared_store_throughput Shared memory store throughput Single-context
shared_efficiency Ratio of requested shared memory throughputto required shared memory throughputexpressed as percentage
Single-context
dram_read_transactions Device memory read transactions Single-context
dram_write_transactions Device memory write transactions Single-context
dram_read_throughput Device memory read throughput Single-context
dram_write_throughput Device memory write throughput Single-context
sysmem_read_transactions System memory read transactions. This isavailable for compute capability 3.0 and 3.5.
Single-context
sysmem_write_transactions System memory write transactions. This isavailable for compute capability 3.0 and 3.5.
Single-context
sysmem_read_throughput System memory read throughput. This isavailable for compute capability 3.0 and 3.5.
Single-context
sysmem_write_throughput System memory write throughput. This isavailable for compute capability 3.0 and 3.5.
Single-context
l1_cache_global_hit_rate Hit rate in L1 cache for global loads Single-context
l1_cache_local_hit_rate Hit rate in L1 cache for local loads and stores Single-context
tex_cache_hit_rate Texture cache hit rate Single-context
tex_cache_transactions Texture cache read transactions Single-context
tex_cache_throughput Texture cache throughput Single-context
l2_read_transactions Memory read transactions seen at L2 cachefor all read requests
Single-context
l2_write_transactions Memory write transactions seen at L2 cachefor all write requests
Single-context
l2_read_throughput Memory read throughput seen at L2 cache forall read requests
Single-context
l2_write_throughput Memory write throughput seen at L2 cache forall write requests
Single-context
l2_l1_read_hit_rate Hit rate at L2 cache for all read requestsfrom L1 cache. This is available for computecapability 3.0 and 3.5.
Sinlge-context
l2_l1_read_throughput Memory read throughput seen at L2 cache forread requests from L1 cache. This is availablefor compute capability 3.0 and 3.5.
Single-context
l2_texture_read_hit_rate Hit rate at L2 cache for all read requests fromtexture cache
Single-context
l2_texure_read_throughput Memory read throughput seen at L2 cache forread requests from the texture cache
Sinlge-context
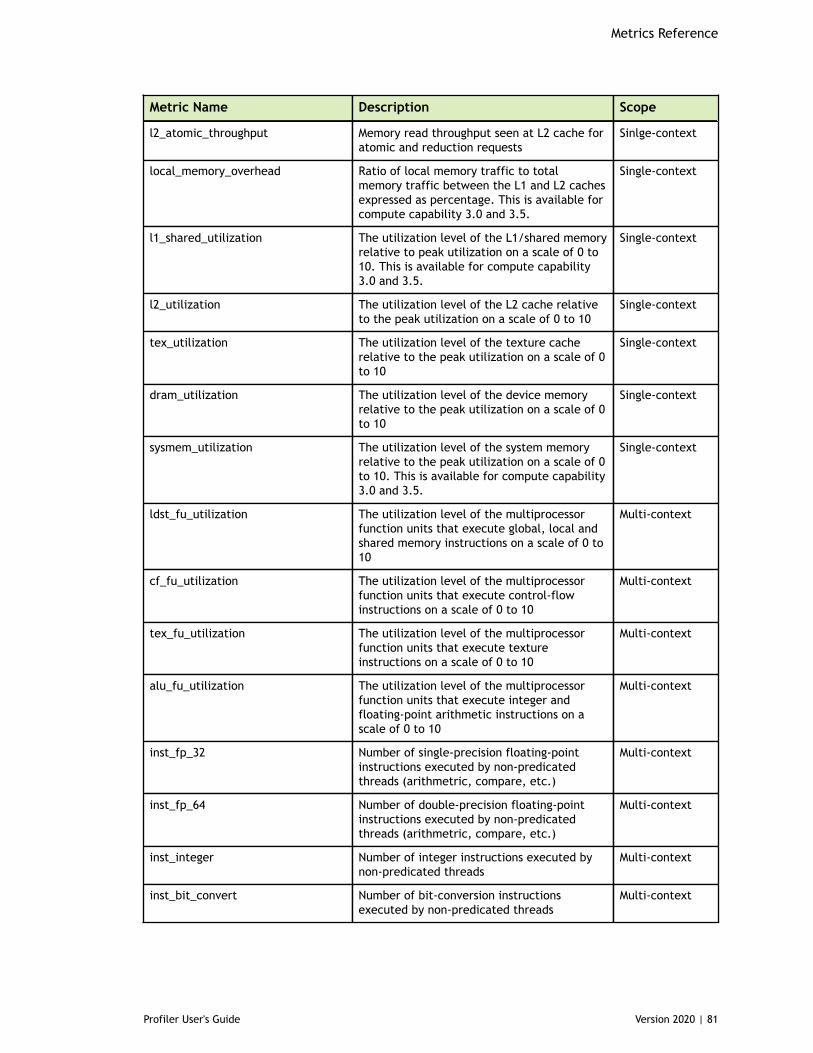
Metrics Reference
Profiler User's Guide Version 2020 | 81
Metric Name Description Scope
l2_atomic_throughput Memory read throughput seen at L2 cache foratomic and reduction requests
Sinlge-context
local_memory_overhead Ratio of local memory traffic to totalmemory traffic between the L1 and L2 cachesexpressed as percentage. This is available forcompute capability 3.0 and 3.5.
Single-context
l1_shared_utilization The utilization level of the L1/shared memoryrelative to peak utilization on a scale of 0 to10. This is available for compute capability3.0 and 3.5.
Single-context
l2_utilization The utilization level of the L2 cache relativeto the peak utilization on a scale of 0 to 10
Single-context
tex_utilization The utilization level of the texture cacherelative to the peak utilization on a scale of 0to 10
Single-context
dram_utilization The utilization level of the device memoryrelative to the peak utilization on a scale of 0to 10
Single-context
sysmem_utilization The utilization level of the system memoryrelative to the peak utilization on a scale of 0to 10. This is available for compute capability3.0 and 3.5.
Single-context
ldst_fu_utilization The utilization level of the multiprocessorfunction units that execute global, local andshared memory instructions on a scale of 0 to10
Multi-context
cf_fu_utilization The utilization level of the multiprocessorfunction units that execute control-flowinstructions on a scale of 0 to 10
Multi-context
tex_fu_utilization The utilization level of the multiprocessorfunction units that execute textureinstructions on a scale of 0 to 10
Multi-context
alu_fu_utilization The utilization level of the multiprocessorfunction units that execute integer andfloating-point arithmetic instructions on ascale of 0 to 10
Multi-context
inst_fp_32 Number of single-precision floating-pointinstructions executed by non-predicatedthreads (arithmetric, compare, etc.)
Multi-context
inst_fp_64 Number of double-precision floating-pointinstructions executed by non-predicatedthreads (arithmetric, compare, etc.)
Multi-context
inst_integer Number of integer instructions executed bynon-predicated threads
Multi-context
inst_bit_convert Number of bit-conversion instructionsexecuted by non-predicated threads
Multi-context
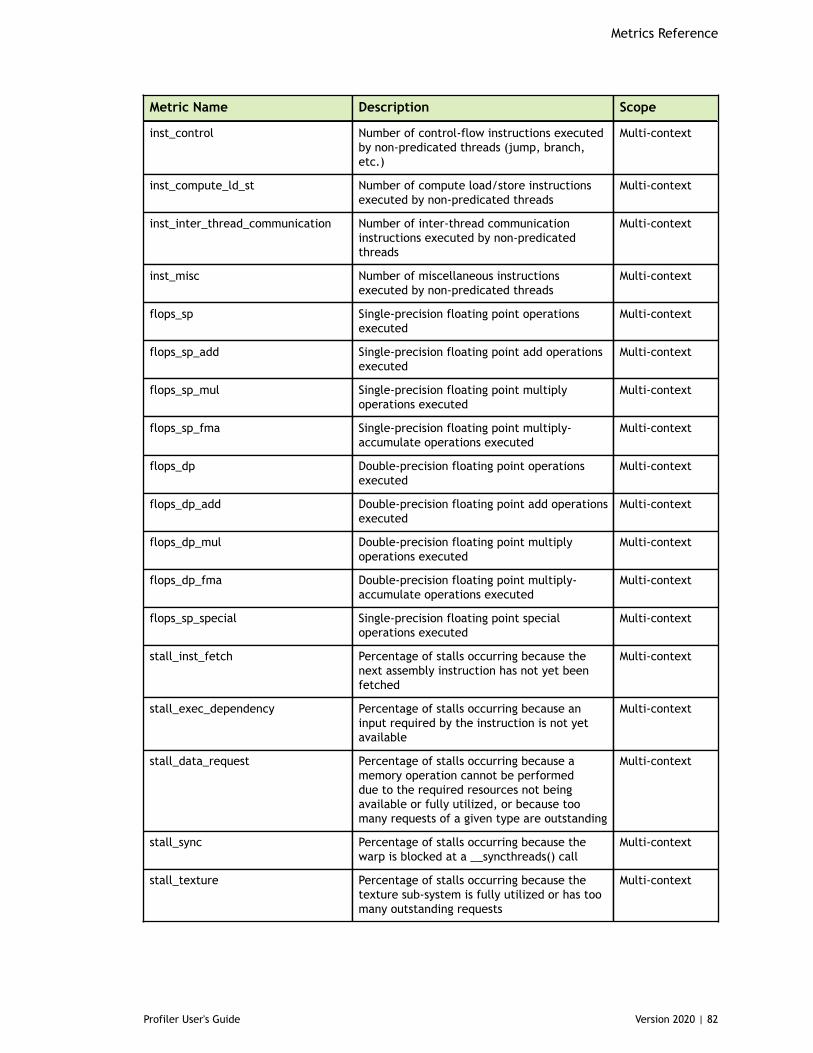
Metrics Reference
Profiler User's Guide Version 2020 | 82
Metric Name Description Scope
inst_control Number of control-flow instructions executedby non-predicated threads (jump, branch,etc.)
Multi-context
inst_compute_ld_st Number of compute load/store instructionsexecuted by non-predicated threads
Multi-context
inst_inter_thread_communication Number of inter-thread communicationinstructions executed by non-predicatedthreads
Multi-context
inst_misc Number of miscellaneous instructionsexecuted by non-predicated threads
Multi-context
flops_sp Single-precision floating point operationsexecuted
Multi-context
flops_sp_add Single-precision floating point add operationsexecuted
Multi-context
flops_sp_mul Single-precision floating point multiplyoperations executed
Multi-context
flops_sp_fma Single-precision floating point multiply-accumulate operations executed
Multi-context
flops_dp Double-precision floating point operationsexecuted
Multi-context
flops_dp_add Double-precision floating point add operationsexecuted
Multi-context
flops_dp_mul Double-precision floating point multiplyoperations executed
Multi-context
flops_dp_fma Double-precision floating point multiply-accumulate operations executed
Multi-context
flops_sp_special Single-precision floating point specialoperations executed
Multi-context
stall_inst_fetch Percentage of stalls occurring because thenext assembly instruction has not yet beenfetched
Multi-context
stall_exec_dependency Percentage of stalls occurring because aninput required by the instruction is not yetavailable
Multi-context
stall_data_request Percentage of stalls occurring because amemory operation cannot be performeddue to the required resources not beingavailable or fully utilized, or because toomany requests of a given type are outstanding
Multi-context
stall_sync Percentage of stalls occurring because thewarp is blocked at a __syncthreads() call
Multi-context
stall_texture Percentage of stalls occurring because thetexture sub-system is fully utilized or has toomany outstanding requests
Multi-context
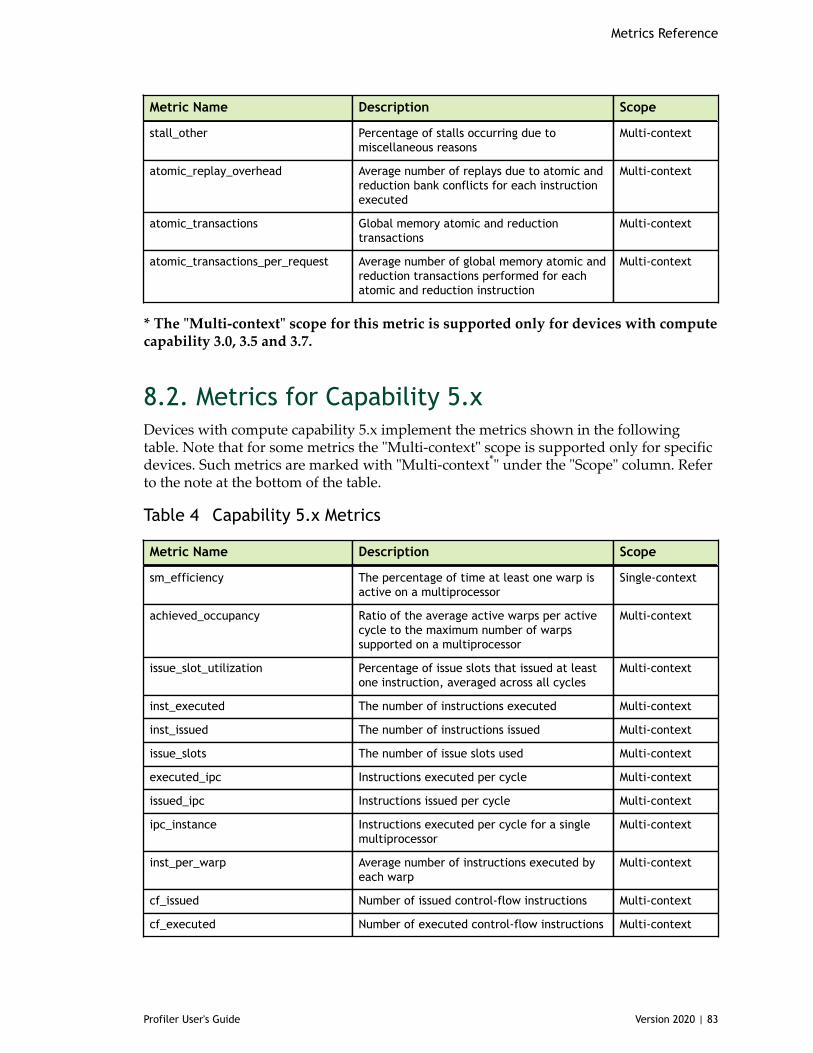
Metrics Reference
Profiler User's Guide Version 2020 | 83
Metric Name Description Scope
stall_other Percentage of stalls occurring due tomiscellaneous reasons
Multi-context
atomic_replay_overhead Average number of replays due to atomic andreduction bank conflicts for each instructionexecuted
Multi-context
atomic_transactions Global memory atomic and reductiontransactions
Multi-context
atomic_transactions_per_request Average number of global memory atomic andreduction transactions performed for eachatomic and reduction instruction
Multi-context
* The "Multi-context" scope for this metric is supported only for devices with computecapability 3.0, 3.5 and 3.7.
8.2. Metrics for Capability 5.xDevices with compute capability 5.x implement the metrics shown in the followingtable. Note that for some metrics the "Multi-context" scope is supported only for specificdevices. Such metrics are marked with "Multi-context*" under the "Scope" column. Referto the note at the bottom of the table.
Table 4 Capability 5.x Metrics
Metric Name Description Scope
sm_efficiency The percentage of time at least one warp isactive on a multiprocessor
Single-context
achieved_occupancy Ratio of the average active warps per activecycle to the maximum number of warpssupported on a multiprocessor
Multi-context
issue_slot_utilization Percentage of issue slots that issued at leastone instruction, averaged across all cycles
Multi-context
inst_executed The number of instructions executed Multi-context
inst_issued The number of instructions issued Multi-context
issue_slots The number of issue slots used Multi-context
executed_ipc Instructions executed per cycle Multi-context
issued_ipc Instructions issued per cycle Multi-context
ipc_instance Instructions executed per cycle for a singlemultiprocessor
Multi-context
inst_per_warp Average number of instructions executed byeach warp
Multi-context
cf_issued Number of issued control-flow instructions Multi-context
cf_executed Number of executed control-flow instructions Multi-context
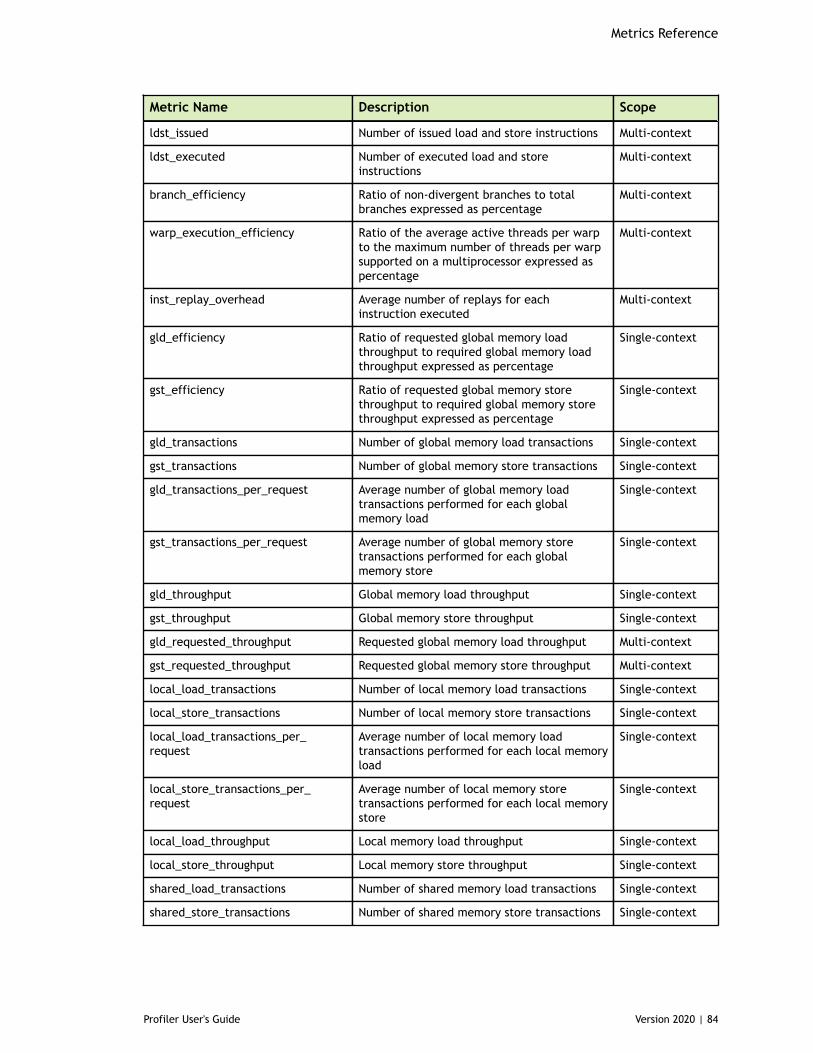
Metrics Reference
Profiler User's Guide Version 2020 | 84
Metric Name Description Scope
ldst_issued Number of issued load and store instructions Multi-context
ldst_executed Number of executed load and storeinstructions
Multi-context
branch_efficiency Ratio of non-divergent branches to totalbranches expressed as percentage
Multi-context
warp_execution_efficiency Ratio of the average active threads per warpto the maximum number of threads per warpsupported on a multiprocessor expressed aspercentage
Multi-context
inst_replay_overhead Average number of replays for eachinstruction executed
Multi-context
gld_efficiency Ratio of requested global memory loadthroughput to required global memory loadthroughput expressed as percentage
Single-context
gst_efficiency Ratio of requested global memory storethroughput to required global memory storethroughput expressed as percentage
Single-context
gld_transactions Number of global memory load transactions Single-context
gst_transactions Number of global memory store transactions Single-context
gld_transactions_per_request Average number of global memory loadtransactions performed for each globalmemory load
Single-context
gst_transactions_per_request Average number of global memory storetransactions performed for each globalmemory store
Single-context
gld_throughput Global memory load throughput Single-context
gst_throughput Global memory store throughput Single-context
gld_requested_throughput Requested global memory load throughput Multi-context
gst_requested_throughput Requested global memory store throughput Multi-context
local_load_transactions Number of local memory load transactions Single-context
local_store_transactions Number of local memory store transactions Single-context
local_load_transactions_per_request
Average number of local memory loadtransactions performed for each local memoryload
Single-context
local_store_transactions_per_request
Average number of local memory storetransactions performed for each local memorystore
Single-context
local_load_throughput Local memory load throughput Single-context
local_store_throughput Local memory store throughput Single-context
shared_load_transactions Number of shared memory load transactions Single-context
shared_store_transactions Number of shared memory store transactions Single-context
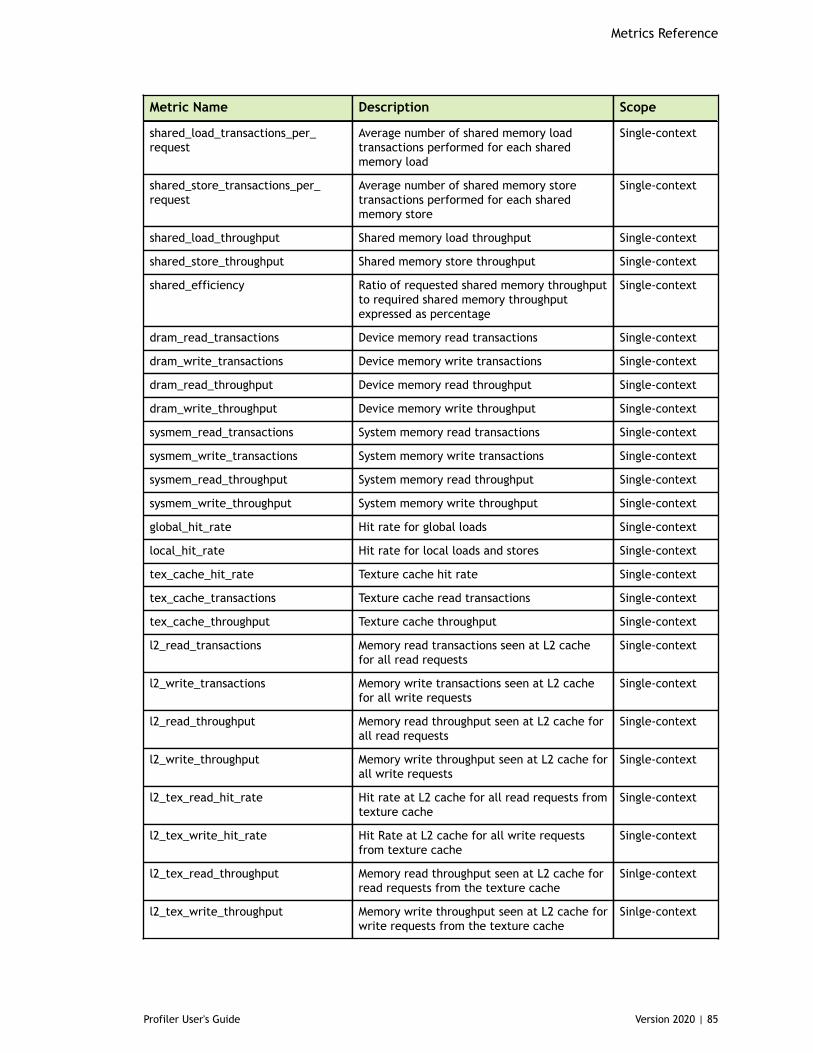
Metrics Reference
Profiler User's Guide Version 2020 | 85
Metric Name Description Scope
shared_load_transactions_per_request
Average number of shared memory loadtransactions performed for each sharedmemory load
Single-context
shared_store_transactions_per_request
Average number of shared memory storetransactions performed for each sharedmemory store
Single-context
shared_load_throughput Shared memory load throughput Single-context
shared_store_throughput Shared memory store throughput Single-context
shared_efficiency Ratio of requested shared memory throughputto required shared memory throughputexpressed as percentage
Single-context
dram_read_transactions Device memory read transactions Single-context
dram_write_transactions Device memory write transactions Single-context
dram_read_throughput Device memory read throughput Single-context
dram_write_throughput Device memory write throughput Single-context
sysmem_read_transactions System memory read transactions Single-context
sysmem_write_transactions System memory write transactions Single-context
sysmem_read_throughput System memory read throughput Single-context
sysmem_write_throughput System memory write throughput Single-context
global_hit_rate Hit rate for global loads Single-context
local_hit_rate Hit rate for local loads and stores Single-context
tex_cache_hit_rate Texture cache hit rate Single-context
tex_cache_transactions Texture cache read transactions Single-context
tex_cache_throughput Texture cache throughput Single-context
l2_read_transactions Memory read transactions seen at L2 cachefor all read requests
Single-context
l2_write_transactions Memory write transactions seen at L2 cachefor all write requests
Single-context
l2_read_throughput Memory read throughput seen at L2 cache forall read requests
Single-context
l2_write_throughput Memory write throughput seen at L2 cache forall write requests
Single-context
l2_tex_read_hit_rate Hit rate at L2 cache for all read requests fromtexture cache
Single-context
l2_tex_write_hit_rate Hit Rate at L2 cache for all write requestsfrom texture cache
Single-context
l2_tex_read_throughput Memory read throughput seen at L2 cache forread requests from the texture cache
Sinlge-context
l2_tex_write_throughput Memory write throughput seen at L2 cache forwrite requests from the texture cache
Sinlge-context
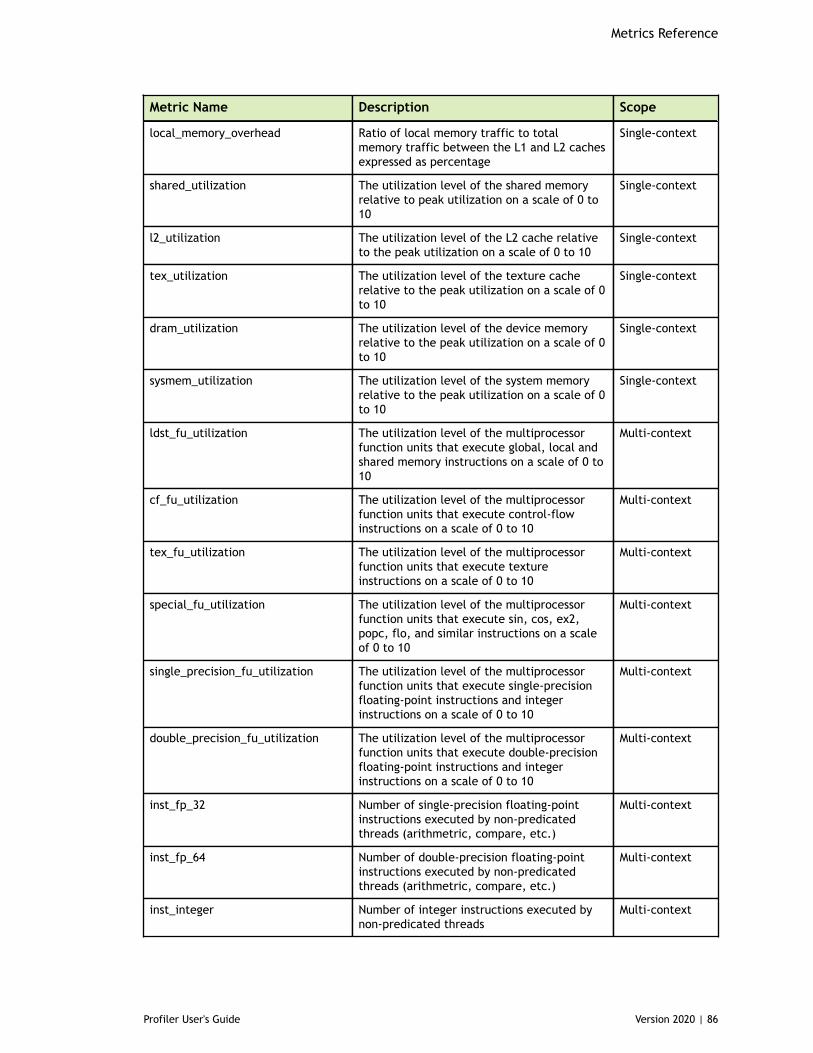
Metrics Reference
Profiler User's Guide Version 2020 | 86
Metric Name Description Scope
local_memory_overhead Ratio of local memory traffic to totalmemory traffic between the L1 and L2 cachesexpressed as percentage
Single-context
shared_utilization The utilization level of the shared memoryrelative to peak utilization on a scale of 0 to10
Single-context
l2_utilization The utilization level of the L2 cache relativeto the peak utilization on a scale of 0 to 10
Single-context
tex_utilization The utilization level of the texture cacherelative to the peak utilization on a scale of 0to 10
Single-context
dram_utilization The utilization level of the device memoryrelative to the peak utilization on a scale of 0to 10
Single-context
sysmem_utilization The utilization level of the system memoryrelative to the peak utilization on a scale of 0to 10
Single-context
ldst_fu_utilization The utilization level of the multiprocessorfunction units that execute global, local andshared memory instructions on a scale of 0 to10
Multi-context
cf_fu_utilization The utilization level of the multiprocessorfunction units that execute control-flowinstructions on a scale of 0 to 10
Multi-context
tex_fu_utilization The utilization level of the multiprocessorfunction units that execute textureinstructions on a scale of 0 to 10
Multi-context
special_fu_utilization The utilization level of the multiprocessorfunction units that execute sin, cos, ex2,popc, flo, and similar instructions on a scaleof 0 to 10
Multi-context
single_precision_fu_utilization The utilization level of the multiprocessorfunction units that execute single-precisionfloating-point instructions and integerinstructions on a scale of 0 to 10
Multi-context
double_precision_fu_utilization The utilization level of the multiprocessorfunction units that execute double-precisionfloating-point instructions and integerinstructions on a scale of 0 to 10
Multi-context
inst_fp_32 Number of single-precision floating-pointinstructions executed by non-predicatedthreads (arithmetric, compare, etc.)
Multi-context
inst_fp_64 Number of double-precision floating-pointinstructions executed by non-predicatedthreads (arithmetric, compare, etc.)
Multi-context
inst_integer Number of integer instructions executed bynon-predicated threads
Multi-context
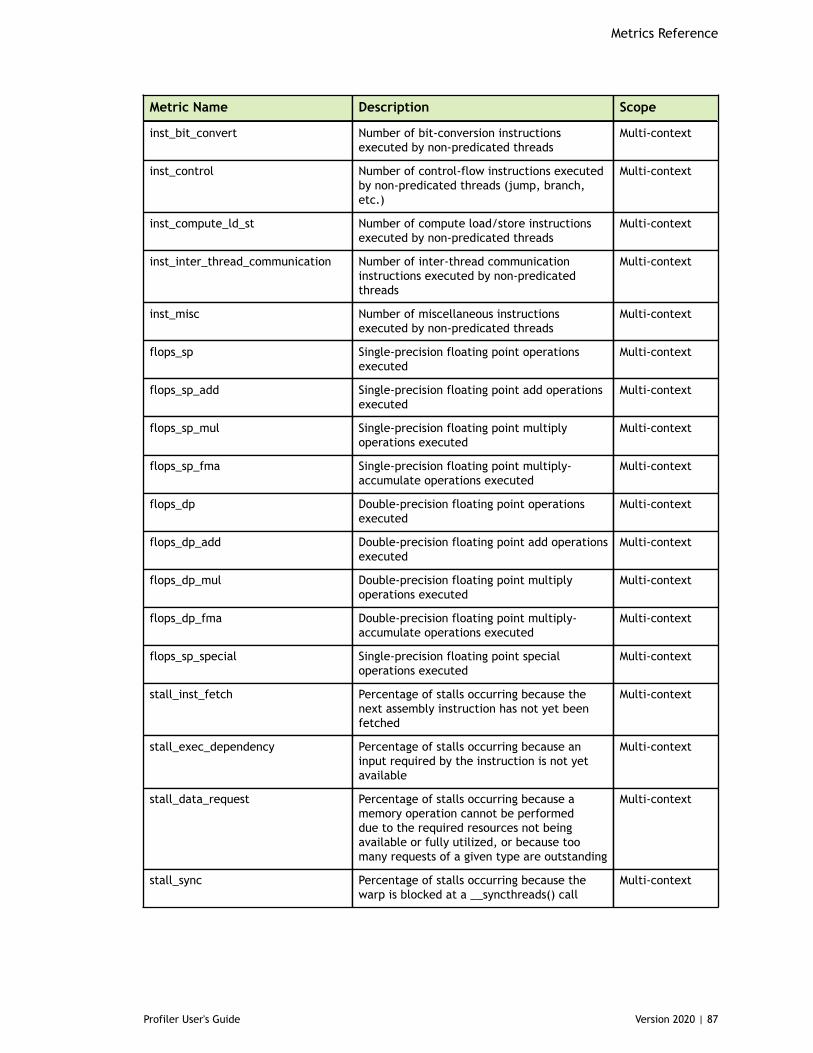
Metrics Reference
Profiler User's Guide Version 2020 | 87
Metric Name Description Scope
inst_bit_convert Number of bit-conversion instructionsexecuted by non-predicated threads
Multi-context
inst_control Number of control-flow instructions executedby non-predicated threads (jump, branch,etc.)
Multi-context
inst_compute_ld_st Number of compute load/store instructionsexecuted by non-predicated threads
Multi-context
inst_inter_thread_communication Number of inter-thread communicationinstructions executed by non-predicatedthreads
Multi-context
inst_misc Number of miscellaneous instructionsexecuted by non-predicated threads
Multi-context
flops_sp Single-precision floating point operationsexecuted
Multi-context
flops_sp_add Single-precision floating point add operationsexecuted
Multi-context
flops_sp_mul Single-precision floating point multiplyoperations executed
Multi-context
flops_sp_fma Single-precision floating point multiply-accumulate operations executed
Multi-context
flops_dp Double-precision floating point operationsexecuted
Multi-context
flops_dp_add Double-precision floating point add operationsexecuted
Multi-context
flops_dp_mul Double-precision floating point multiplyoperations executed
Multi-context
flops_dp_fma Double-precision floating point multiply-accumulate operations executed
Multi-context
flops_sp_special Single-precision floating point specialoperations executed
Multi-context
stall_inst_fetch Percentage of stalls occurring because thenext assembly instruction has not yet beenfetched
Multi-context
stall_exec_dependency Percentage of stalls occurring because aninput required by the instruction is not yetavailable
Multi-context
stall_data_request Percentage of stalls occurring because amemory operation cannot be performeddue to the required resources not beingavailable or fully utilized, or because toomany requests of a given type are outstanding
Multi-context
stall_sync Percentage of stalls occurring because thewarp is blocked at a __syncthreads() call
Multi-context
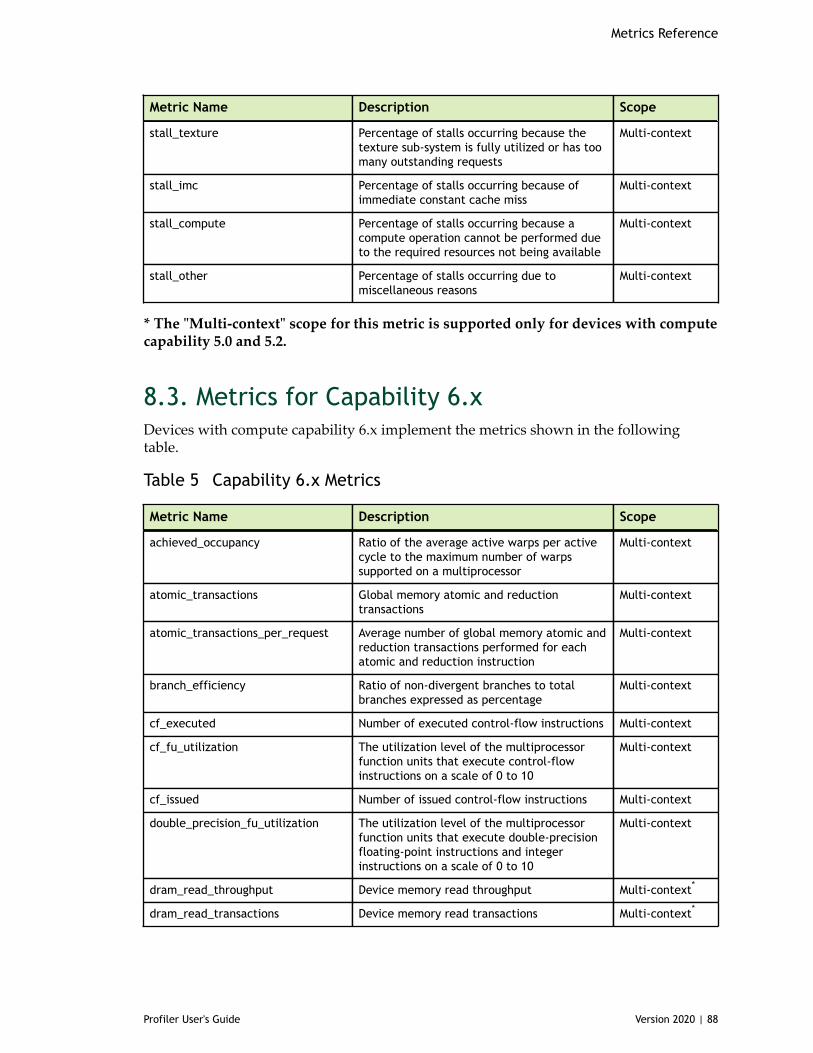
Metrics Reference
Profiler User's Guide Version 2020 | 88
Metric Name Description Scope
stall_texture Percentage of stalls occurring because thetexture sub-system is fully utilized or has toomany outstanding requests
Multi-context
stall_imc Percentage of stalls occurring because ofimmediate constant cache miss
Multi-context
stall_compute Percentage of stalls occurring because acompute operation cannot be performed dueto the required resources not being available
Multi-context
stall_other Percentage of stalls occurring due tomiscellaneous reasons
Multi-context
* The "Multi-context" scope for this metric is supported only for devices with computecapability 5.0 and 5.2.
8.3. Metrics for Capability 6.xDevices with compute capability 6.x implement the metrics shown in the followingtable.
Table 5 Capability 6.x Metrics
Metric Name Description Scope
achieved_occupancy Ratio of the average active warps per activecycle to the maximum number of warpssupported on a multiprocessor
Multi-context
atomic_transactions Global memory atomic and reductiontransactions
Multi-context
atomic_transactions_per_request Average number of global memory atomic andreduction transactions performed for eachatomic and reduction instruction
Multi-context
branch_efficiency Ratio of non-divergent branches to totalbranches expressed as percentage
Multi-context
cf_executed Number of executed control-flow instructions Multi-context
cf_fu_utilization The utilization level of the multiprocessorfunction units that execute control-flowinstructions on a scale of 0 to 10
Multi-context
cf_issued Number of issued control-flow instructions Multi-context
double_precision_fu_utilization The utilization level of the multiprocessorfunction units that execute double-precisionfloating-point instructions and integerinstructions on a scale of 0 to 10
Multi-context
dram_read_throughput Device memory read throughput Multi-context*
dram_read_transactions Device memory read transactions Multi-context*
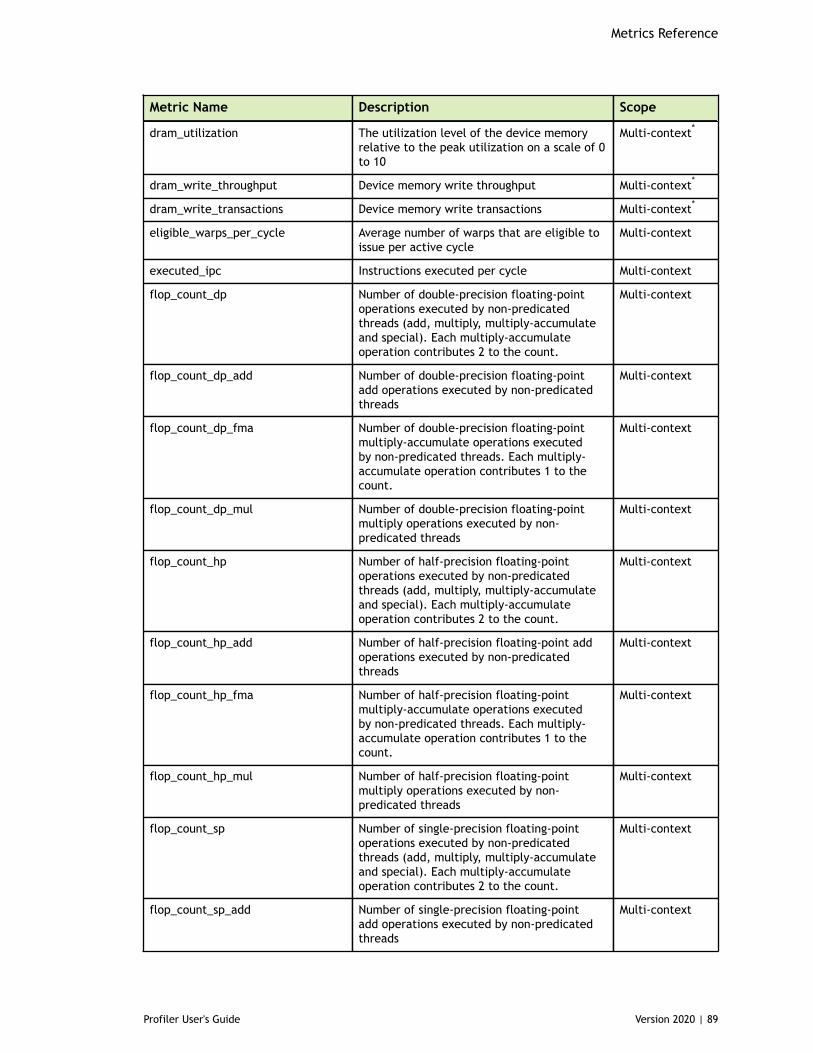
Metrics Reference
Profiler User's Guide Version 2020 | 89
Metric Name Description Scope
dram_utilization The utilization level of the device memoryrelative to the peak utilization on a scale of 0to 10
Multi-context*
dram_write_throughput Device memory write throughput Multi-context*
dram_write_transactions Device memory write transactions Multi-context*
eligible_warps_per_cycle Average number of warps that are eligible toissue per active cycle
Multi-context
executed_ipc Instructions executed per cycle Multi-context
flop_count_dp Number of double-precision floating-pointoperations executed by non-predicatedthreads (add, multiply, multiply-accumulateand special). Each multiply-accumulateoperation contributes 2 to the count.
Multi-context
flop_count_dp_add Number of double-precision floating-pointadd operations executed by non-predicatedthreads
Multi-context
flop_count_dp_fma Number of double-precision floating-pointmultiply-accumulate operations executedby non-predicated threads. Each multiply-accumulate operation contributes 1 to thecount.
Multi-context
flop_count_dp_mul Number of double-precision floating-pointmultiply operations executed by non-predicated threads
Multi-context
flop_count_hp Number of half-precision floating-pointoperations executed by non-predicatedthreads (add, multiply, multiply-accumulateand special). Each multiply-accumulateoperation contributes 2 to the count.
Multi-context
flop_count_hp_add Number of half-precision floating-point addoperations executed by non-predicatedthreads
Multi-context
flop_count_hp_fma Number of half-precision floating-pointmultiply-accumulate operations executedby non-predicated threads. Each multiply-accumulate operation contributes 1 to thecount.
Multi-context
flop_count_hp_mul Number of half-precision floating-pointmultiply operations executed by non-predicated threads
Multi-context
flop_count_sp Number of single-precision floating-pointoperations executed by non-predicatedthreads (add, multiply, multiply-accumulateand special). Each multiply-accumulateoperation contributes 2 to the count.
Multi-context
flop_count_sp_add Number of single-precision floating-pointadd operations executed by non-predicatedthreads
Multi-context
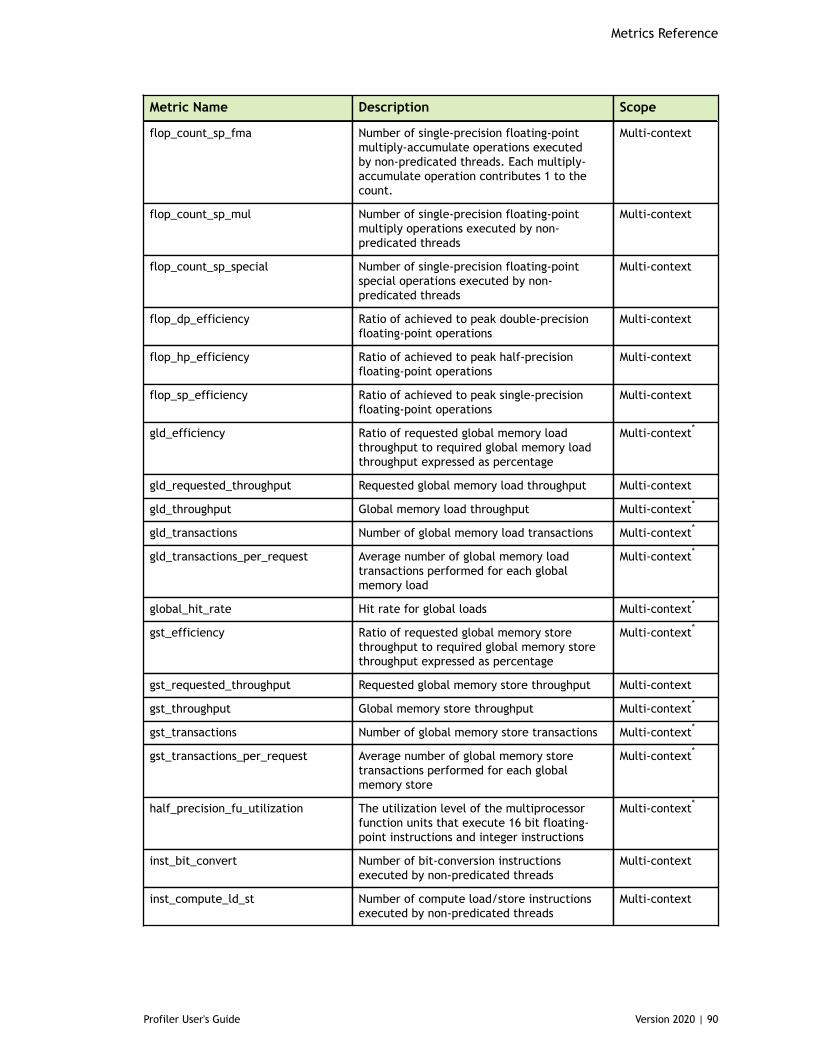
Metrics Reference
Profiler User's Guide Version 2020 | 90
Metric Name Description Scope
flop_count_sp_fma Number of single-precision floating-pointmultiply-accumulate operations executedby non-predicated threads. Each multiply-accumulate operation contributes 1 to thecount.
Multi-context
flop_count_sp_mul Number of single-precision floating-pointmultiply operations executed by non-predicated threads
Multi-context
flop_count_sp_special Number of single-precision floating-pointspecial operations executed by non-predicated threads
Multi-context
flop_dp_efficiency Ratio of achieved to peak double-precisionfloating-point operations
Multi-context
flop_hp_efficiency Ratio of achieved to peak half-precisionfloating-point operations
Multi-context
flop_sp_efficiency Ratio of achieved to peak single-precisionfloating-point operations
Multi-context
gld_efficiency Ratio of requested global memory loadthroughput to required global memory loadthroughput expressed as percentage
Multi-context*
gld_requested_throughput Requested global memory load throughput Multi-context
gld_throughput Global memory load throughput Multi-context*
gld_transactions Number of global memory load transactions Multi-context*
gld_transactions_per_request Average number of global memory loadtransactions performed for each globalmemory load
Multi-context*
global_hit_rate Hit rate for global loads Multi-context*
gst_efficiency Ratio of requested global memory storethroughput to required global memory storethroughput expressed as percentage
Multi-context*
gst_requested_throughput Requested global memory store throughput Multi-context
gst_throughput Global memory store throughput Multi-context*
gst_transactions Number of global memory store transactions Multi-context*
gst_transactions_per_request Average number of global memory storetransactions performed for each globalmemory store
Multi-context*
half_precision_fu_utilization The utilization level of the multiprocessorfunction units that execute 16 bit floating-point instructions and integer instructions
Multi-context*
inst_bit_convert Number of bit-conversion instructionsexecuted by non-predicated threads
Multi-context
inst_compute_ld_st Number of compute load/store instructionsexecuted by non-predicated threads
Multi-context
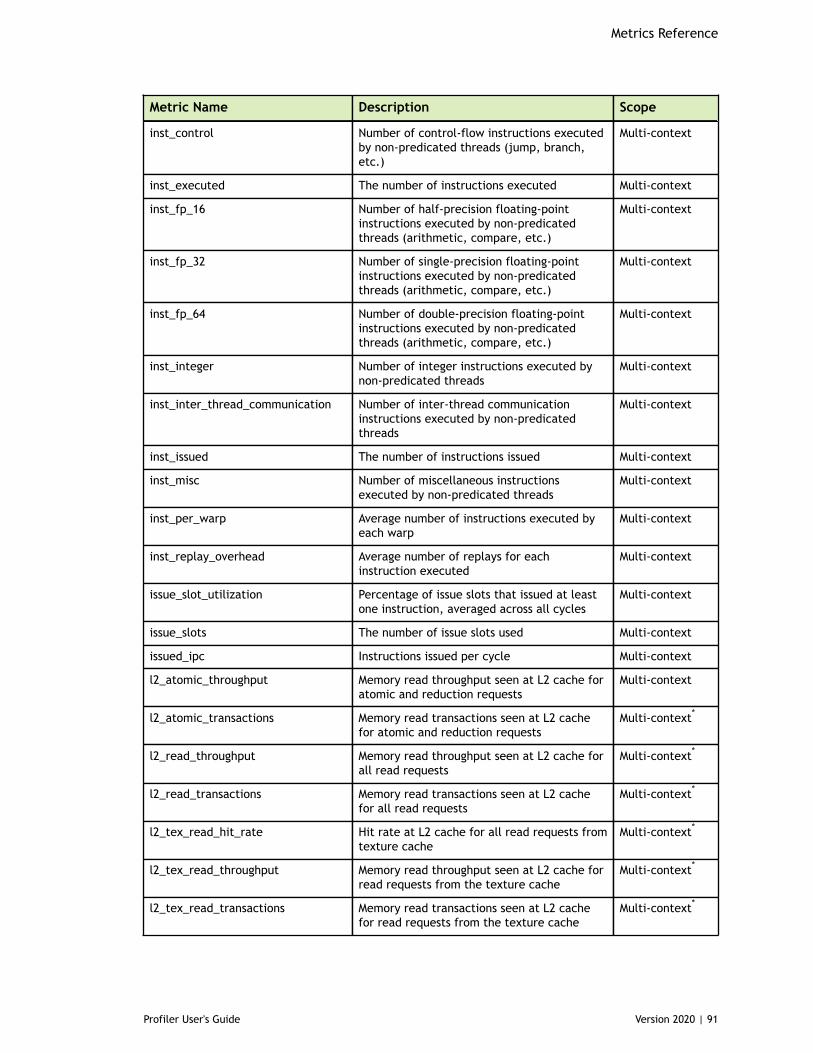
Metrics Reference
Profiler User's Guide Version 2020 | 91
Metric Name Description Scope
inst_control Number of control-flow instructions executedby non-predicated threads (jump, branch,etc.)
Multi-context
inst_executed The number of instructions executed Multi-context
inst_fp_16 Number of half-precision floating-pointinstructions executed by non-predicatedthreads (arithmetic, compare, etc.)
Multi-context
inst_fp_32 Number of single-precision floating-pointinstructions executed by non-predicatedthreads (arithmetic, compare, etc.)
Multi-context
inst_fp_64 Number of double-precision floating-pointinstructions executed by non-predicatedthreads (arithmetic, compare, etc.)
Multi-context
inst_integer Number of integer instructions executed bynon-predicated threads
Multi-context
inst_inter_thread_communication Number of inter-thread communicationinstructions executed by non-predicatedthreads
Multi-context
inst_issued The number of instructions issued Multi-context
inst_misc Number of miscellaneous instructionsexecuted by non-predicated threads
Multi-context
inst_per_warp Average number of instructions executed byeach warp
Multi-context
inst_replay_overhead Average number of replays for eachinstruction executed
Multi-context
issue_slot_utilization Percentage of issue slots that issued at leastone instruction, averaged across all cycles
Multi-context
issue_slots The number of issue slots used Multi-context
issued_ipc Instructions issued per cycle Multi-context
l2_atomic_throughput Memory read throughput seen at L2 cache foratomic and reduction requests
Multi-context
l2_atomic_transactions Memory read transactions seen at L2 cachefor atomic and reduction requests
Multi-context*
l2_read_throughput Memory read throughput seen at L2 cache forall read requests
Multi-context*
l2_read_transactions Memory read transactions seen at L2 cachefor all read requests
Multi-context*
l2_tex_read_hit_rate Hit rate at L2 cache for all read requests fromtexture cache
Multi-context*
l2_tex_read_throughput Memory read throughput seen at L2 cache forread requests from the texture cache
Multi-context*
l2_tex_read_transactions Memory read transactions seen at L2 cachefor read requests from the texture cache
Multi-context*
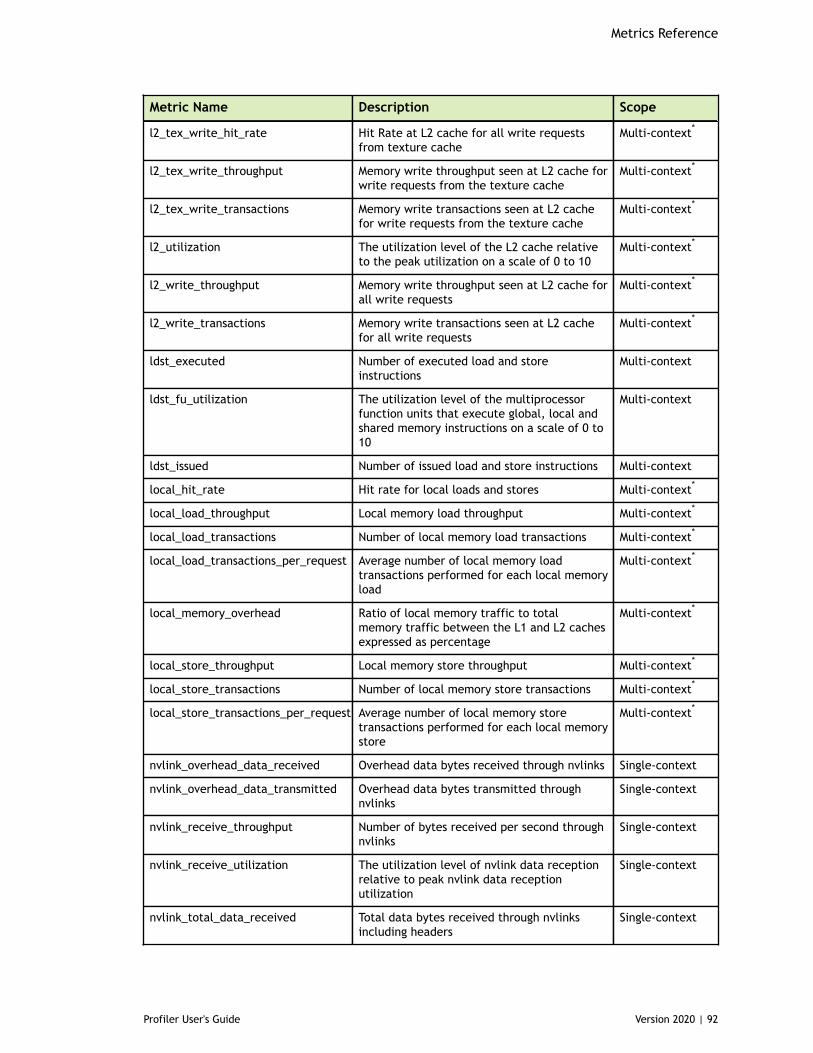
Metrics Reference
Profiler User's Guide Version 2020 | 92
Metric Name Description Scope
l2_tex_write_hit_rate Hit Rate at L2 cache for all write requestsfrom texture cache
Multi-context*
l2_tex_write_throughput Memory write throughput seen at L2 cache forwrite requests from the texture cache
Multi-context*
l2_tex_write_transactions Memory write transactions seen at L2 cachefor write requests from the texture cache
Multi-context*
l2_utilization The utilization level of the L2 cache relativeto the peak utilization on a scale of 0 to 10
Multi-context*
l2_write_throughput Memory write throughput seen at L2 cache forall write requests
Multi-context*
l2_write_transactions Memory write transactions seen at L2 cachefor all write requests
Multi-context*
ldst_executed Number of executed load and storeinstructions
Multi-context
ldst_fu_utilization The utilization level of the multiprocessorfunction units that execute global, local andshared memory instructions on a scale of 0 to10
Multi-context
ldst_issued Number of issued load and store instructions Multi-context
local_hit_rate Hit rate for local loads and stores Multi-context*
local_load_throughput Local memory load throughput Multi-context*
local_load_transactions Number of local memory load transactions Multi-context*
local_load_transactions_per_request Average number of local memory loadtransactions performed for each local memoryload
Multi-context*
local_memory_overhead Ratio of local memory traffic to totalmemory traffic between the L1 and L2 cachesexpressed as percentage
Multi-context*
local_store_throughput Local memory store throughput Multi-context*
local_store_transactions Number of local memory store transactions Multi-context*
local_store_transactions_per_request Average number of local memory storetransactions performed for each local memorystore
Multi-context*
nvlink_overhead_data_received Overhead data bytes received through nvlinks Single-context
nvlink_overhead_data_transmitted Overhead data bytes transmitted throughnvlinks
Single-context
nvlink_receive_throughput Number of bytes received per second throughnvlinks
Single-context
nvlink_receive_utilization The utilization level of nvlink data receptionrelative to peak nvlink data receptionutilization
Single-context
nvlink_total_data_received Total data bytes received through nvlinksincluding headers
Single-context
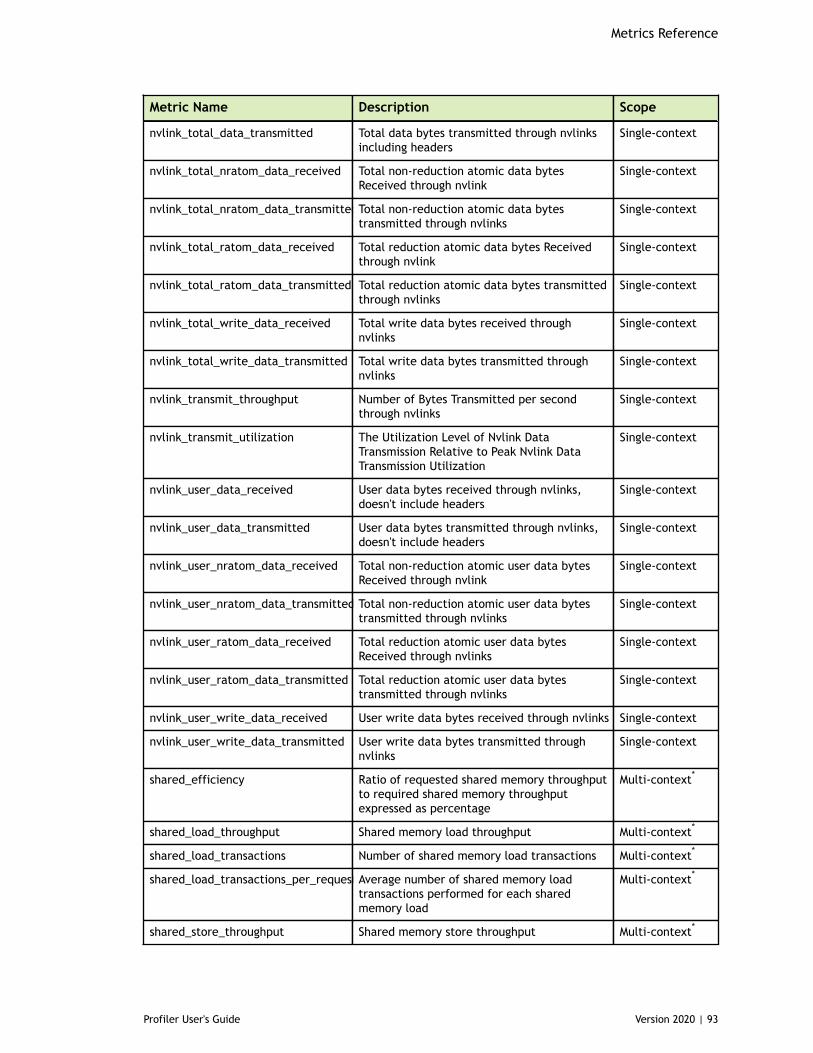
Metrics Reference
Profiler User's Guide Version 2020 | 93
Metric Name Description Scope
nvlink_total_data_transmitted Total data bytes transmitted through nvlinksincluding headers
Single-context
nvlink_total_nratom_data_received Total non-reduction atomic data bytesReceived through nvlink
Single-context
nvlink_total_nratom_data_transmittedTotal non-reduction atomic data bytestransmitted through nvlinks
Single-context
nvlink_total_ratom_data_received Total reduction atomic data bytes Receivedthrough nvlink
Single-context
nvlink_total_ratom_data_transmitted Total reduction atomic data bytes transmittedthrough nvlinks
Single-context
nvlink_total_write_data_received Total write data bytes received throughnvlinks
Single-context
nvlink_total_write_data_transmitted Total write data bytes transmitted throughnvlinks
Single-context
nvlink_transmit_throughput Number of Bytes Transmitted per secondthrough nvlinks
Single-context
nvlink_transmit_utilization The Utilization Level of Nvlink DataTransmission Relative to Peak Nvlink DataTransmission Utilization
Single-context
nvlink_user_data_received User data bytes received through nvlinks,doesn't include headers
Single-context
nvlink_user_data_transmitted User data bytes transmitted through nvlinks,doesn't include headers
Single-context
nvlink_user_nratom_data_received Total non-reduction atomic user data bytesReceived through nvlink
Single-context
nvlink_user_nratom_data_transmitted Total non-reduction atomic user data bytestransmitted through nvlinks
Single-context
nvlink_user_ratom_data_received Total reduction atomic user data bytesReceived through nvlinks
Single-context
nvlink_user_ratom_data_transmitted Total reduction atomic user data bytestransmitted through nvlinks
Single-context
nvlink_user_write_data_received User write data bytes received through nvlinks Single-context
nvlink_user_write_data_transmitted User write data bytes transmitted throughnvlinks
Single-context
shared_efficiency Ratio of requested shared memory throughputto required shared memory throughputexpressed as percentage
Multi-context*
shared_load_throughput Shared memory load throughput Multi-context*
shared_load_transactions Number of shared memory load transactions Multi-context*
shared_load_transactions_per_request Average number of shared memory loadtransactions performed for each sharedmemory load
Multi-context*
shared_store_throughput Shared memory store throughput Multi-context*
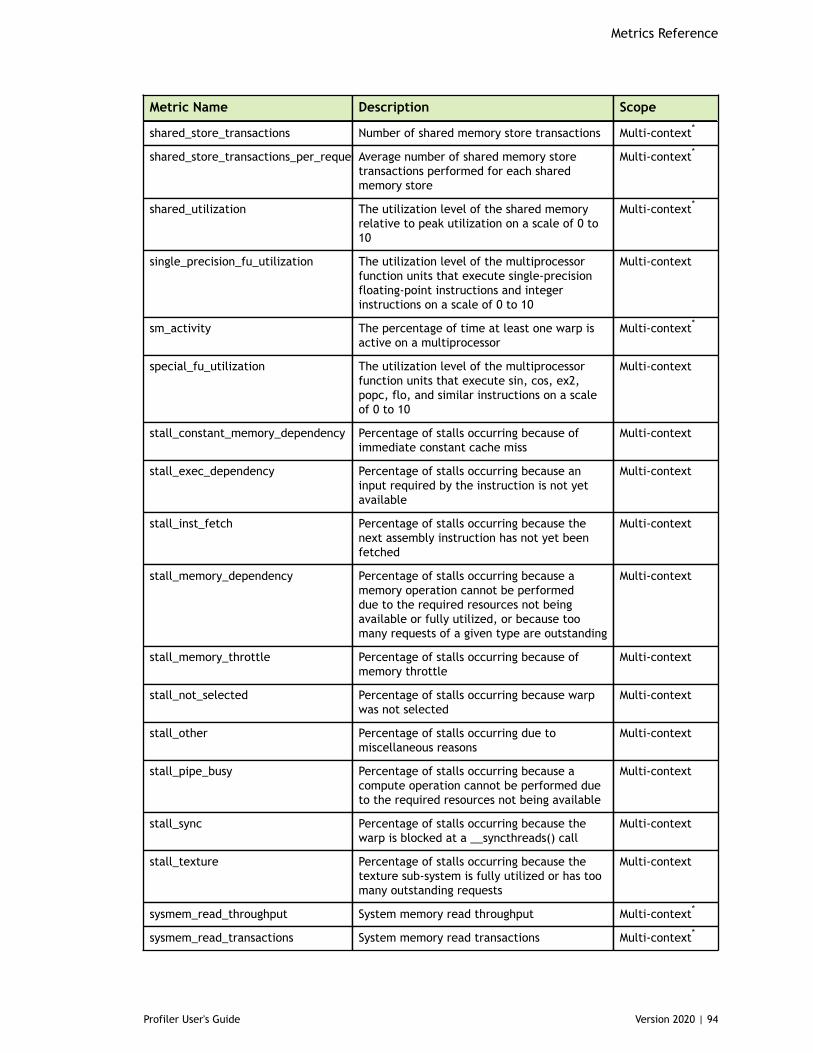
Metrics Reference
Profiler User's Guide Version 2020 | 94
Metric Name Description Scope
shared_store_transactions Number of shared memory store transactions Multi-context*
shared_store_transactions_per_requestAverage number of shared memory storetransactions performed for each sharedmemory store
Multi-context*
shared_utilization The utilization level of the shared memoryrelative to peak utilization on a scale of 0 to10
Multi-context*
single_precision_fu_utilization The utilization level of the multiprocessorfunction units that execute single-precisionfloating-point instructions and integerinstructions on a scale of 0 to 10
Multi-context
sm_activity The percentage of time at least one warp isactive on a multiprocessor
Multi-context*
special_fu_utilization The utilization level of the multiprocessorfunction units that execute sin, cos, ex2,popc, flo, and similar instructions on a scaleof 0 to 10
Multi-context
stall_constant_memory_dependency Percentage of stalls occurring because ofimmediate constant cache miss
Multi-context
stall_exec_dependency Percentage of stalls occurring because aninput required by the instruction is not yetavailable
Multi-context
stall_inst_fetch Percentage of stalls occurring because thenext assembly instruction has not yet beenfetched
Multi-context
stall_memory_dependency Percentage of stalls occurring because amemory operation cannot be performeddue to the required resources not beingavailable or fully utilized, or because toomany requests of a given type are outstanding
Multi-context
stall_memory_throttle Percentage of stalls occurring because ofmemory throttle
Multi-context
stall_not_selected Percentage of stalls occurring because warpwas not selected
Multi-context
stall_other Percentage of stalls occurring due tomiscellaneous reasons
Multi-context
stall_pipe_busy Percentage of stalls occurring because acompute operation cannot be performed dueto the required resources not being available
Multi-context
stall_sync Percentage of stalls occurring because thewarp is blocked at a __syncthreads() call
Multi-context
stall_texture Percentage of stalls occurring because thetexture sub-system is fully utilized or has toomany outstanding requests
Multi-context
sysmem_read_throughput System memory read throughput Multi-context*
sysmem_read_transactions System memory read transactions Multi-context*
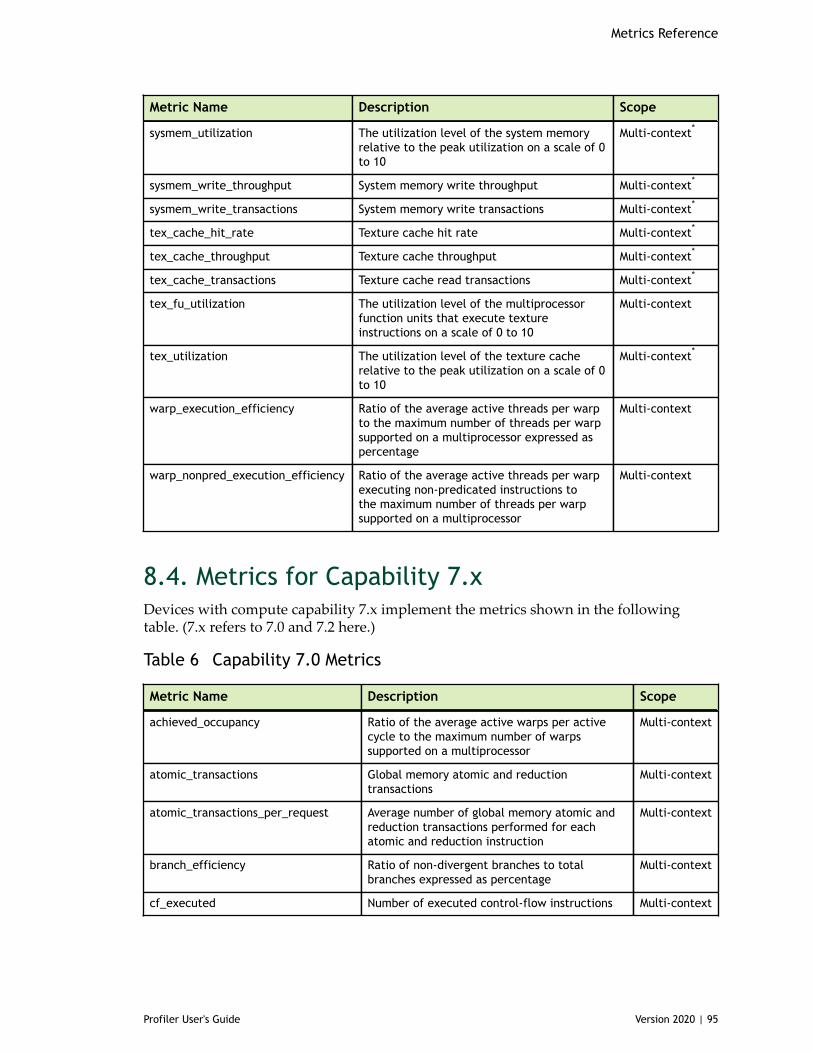
Metrics Reference
Profiler User's Guide Version 2020 | 95
Metric Name Description Scope
sysmem_utilization The utilization level of the system memoryrelative to the peak utilization on a scale of 0to 10
Multi-context*
sysmem_write_throughput System memory write throughput Multi-context*
sysmem_write_transactions System memory write transactions Multi-context*
tex_cache_hit_rate Texture cache hit rate Multi-context*
tex_cache_throughput Texture cache throughput Multi-context*
tex_cache_transactions Texture cache read transactions Multi-context*
tex_fu_utilization The utilization level of the multiprocessorfunction units that execute textureinstructions on a scale of 0 to 10
Multi-context
tex_utilization The utilization level of the texture cacherelative to the peak utilization on a scale of 0to 10
Multi-context*
warp_execution_efficiency Ratio of the average active threads per warpto the maximum number of threads per warpsupported on a multiprocessor expressed aspercentage
Multi-context
warp_nonpred_execution_efficiency Ratio of the average active threads per warpexecuting non-predicated instructions tothe maximum number of threads per warpsupported on a multiprocessor
Multi-context
8.4. Metrics for Capability 7.xDevices with compute capability 7.x implement the metrics shown in the followingtable. (7.x refers to 7.0 and 7.2 here.)
Table 6 Capability 7.0 Metrics
Metric Name Description Scope
achieved_occupancy Ratio of the average active warps per activecycle to the maximum number of warpssupported on a multiprocessor
Multi-context
atomic_transactions Global memory atomic and reductiontransactions
Multi-context
atomic_transactions_per_request Average number of global memory atomic andreduction transactions performed for eachatomic and reduction instruction
Multi-context
branch_efficiency Ratio of non-divergent branches to totalbranches expressed as percentage
Multi-context
cf_executed Number of executed control-flow instructions Multi-context
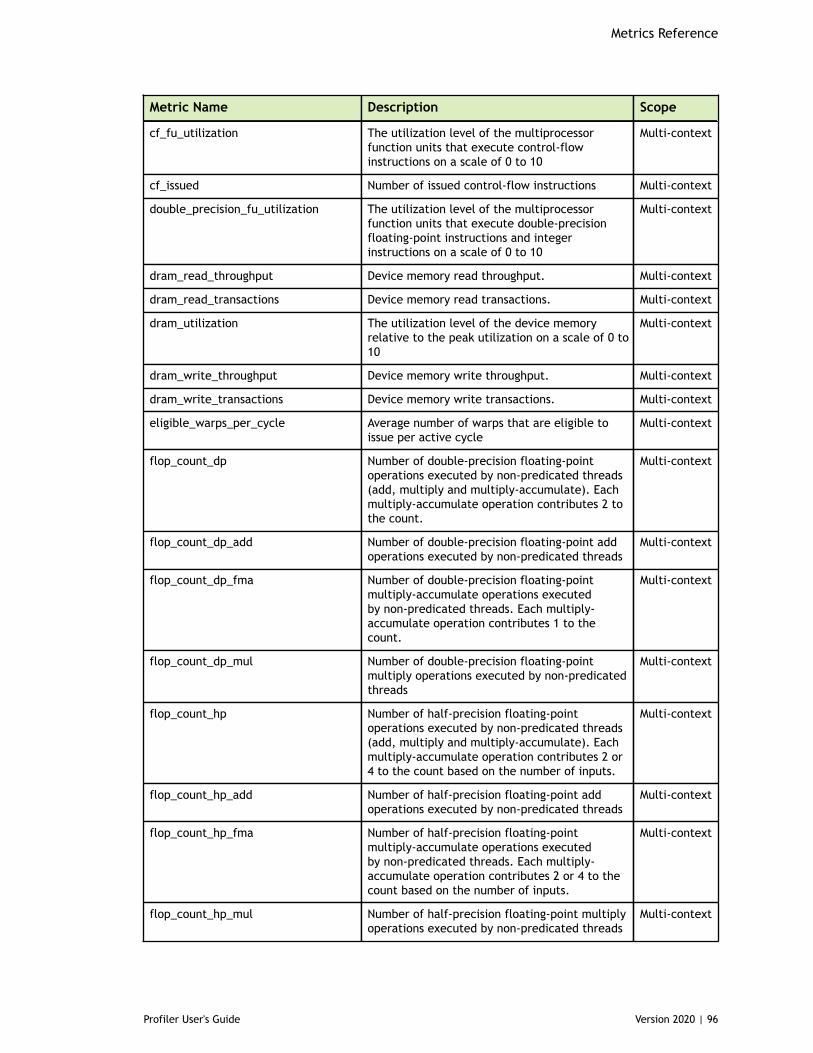
Metrics Reference
Profiler User's Guide Version 2020 | 96
Metric Name Description Scope
cf_fu_utilization The utilization level of the multiprocessorfunction units that execute control-flowinstructions on a scale of 0 to 10
Multi-context
cf_issued Number of issued control-flow instructions Multi-context
double_precision_fu_utilization The utilization level of the multiprocessorfunction units that execute double-precisionfloating-point instructions and integerinstructions on a scale of 0 to 10
Multi-context
dram_read_throughput Device memory read throughput. Multi-context
dram_read_transactions Device memory read transactions. Multi-context
dram_utilization The utilization level of the device memoryrelative to the peak utilization on a scale of 0 to10
Multi-context
dram_write_throughput Device memory write throughput. Multi-context
dram_write_transactions Device memory write transactions. Multi-context
eligible_warps_per_cycle Average number of warps that are eligible toissue per active cycle
Multi-context
flop_count_dp Number of double-precision floating-pointoperations executed by non-predicated threads(add, multiply and multiply-accumulate). Eachmultiply-accumulate operation contributes 2 tothe count.
Multi-context
flop_count_dp_add Number of double-precision floating-point addoperations executed by non-predicated threads
Multi-context
flop_count_dp_fma Number of double-precision floating-pointmultiply-accumulate operations executedby non-predicated threads. Each multiply-accumulate operation contributes 1 to thecount.
Multi-context
flop_count_dp_mul Number of double-precision floating-pointmultiply operations executed by non-predicatedthreads
Multi-context
flop_count_hp Number of half-precision floating-pointoperations executed by non-predicated threads(add, multiply and multiply-accumulate). Eachmultiply-accumulate operation contributes 2 or4 to the count based on the number of inputs.
Multi-context
flop_count_hp_add Number of half-precision floating-point addoperations executed by non-predicated threads
Multi-context
flop_count_hp_fma Number of half-precision floating-pointmultiply-accumulate operations executedby non-predicated threads. Each multiply-accumulate operation contributes 2 or 4 to thecount based on the number of inputs.
Multi-context
flop_count_hp_mul Number of half-precision floating-point multiplyoperations executed by non-predicated threads
Multi-context
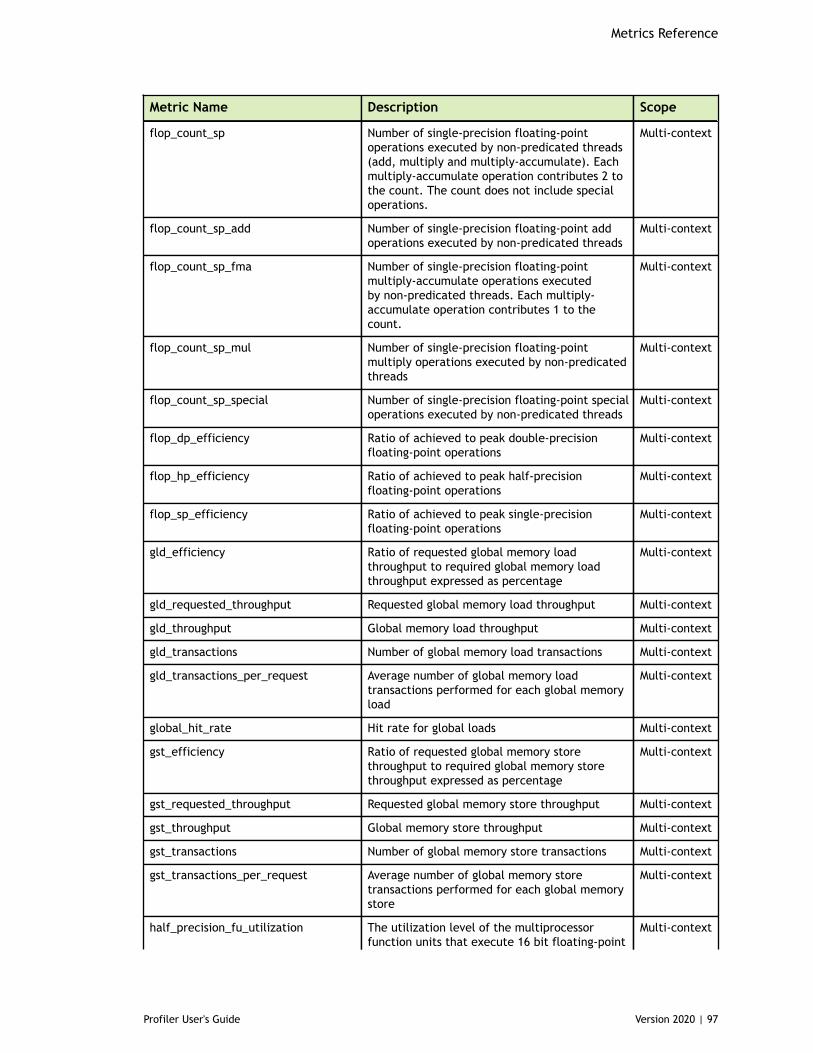
Metrics Reference
Profiler User's Guide Version 2020 | 97
Metric Name Description Scope
flop_count_sp Number of single-precision floating-pointoperations executed by non-predicated threads(add, multiply and multiply-accumulate). Eachmultiply-accumulate operation contributes 2 tothe count. The count does not include specialoperations.
Multi-context
flop_count_sp_add Number of single-precision floating-point addoperations executed by non-predicated threads
Multi-context
flop_count_sp_fma Number of single-precision floating-pointmultiply-accumulate operations executedby non-predicated threads. Each multiply-accumulate operation contributes 1 to thecount.
Multi-context
flop_count_sp_mul Number of single-precision floating-pointmultiply operations executed by non-predicatedthreads
Multi-context
flop_count_sp_special Number of single-precision floating-point specialoperations executed by non-predicated threads
Multi-context
flop_dp_efficiency Ratio of achieved to peak double-precisionfloating-point operations
Multi-context
flop_hp_efficiency Ratio of achieved to peak half-precisionfloating-point operations
Multi-context
flop_sp_efficiency Ratio of achieved to peak single-precisionfloating-point operations
Multi-context
gld_efficiency Ratio of requested global memory loadthroughput to required global memory loadthroughput expressed as percentage
Multi-context
gld_requested_throughput Requested global memory load throughput Multi-context
gld_throughput Global memory load throughput Multi-context
gld_transactions Number of global memory load transactions Multi-context
gld_transactions_per_request Average number of global memory loadtransactions performed for each global memoryload
Multi-context
global_hit_rate Hit rate for global loads Multi-context
gst_efficiency Ratio of requested global memory storethroughput to required global memory storethroughput expressed as percentage
Multi-context
gst_requested_throughput Requested global memory store throughput Multi-context
gst_throughput Global memory store throughput Multi-context
gst_transactions Number of global memory store transactions Multi-context
gst_transactions_per_request Average number of global memory storetransactions performed for each global memorystore
Multi-context
half_precision_fu_utilization The utilization level of the multiprocessorfunction units that execute 16 bit floating-point
Multi-context
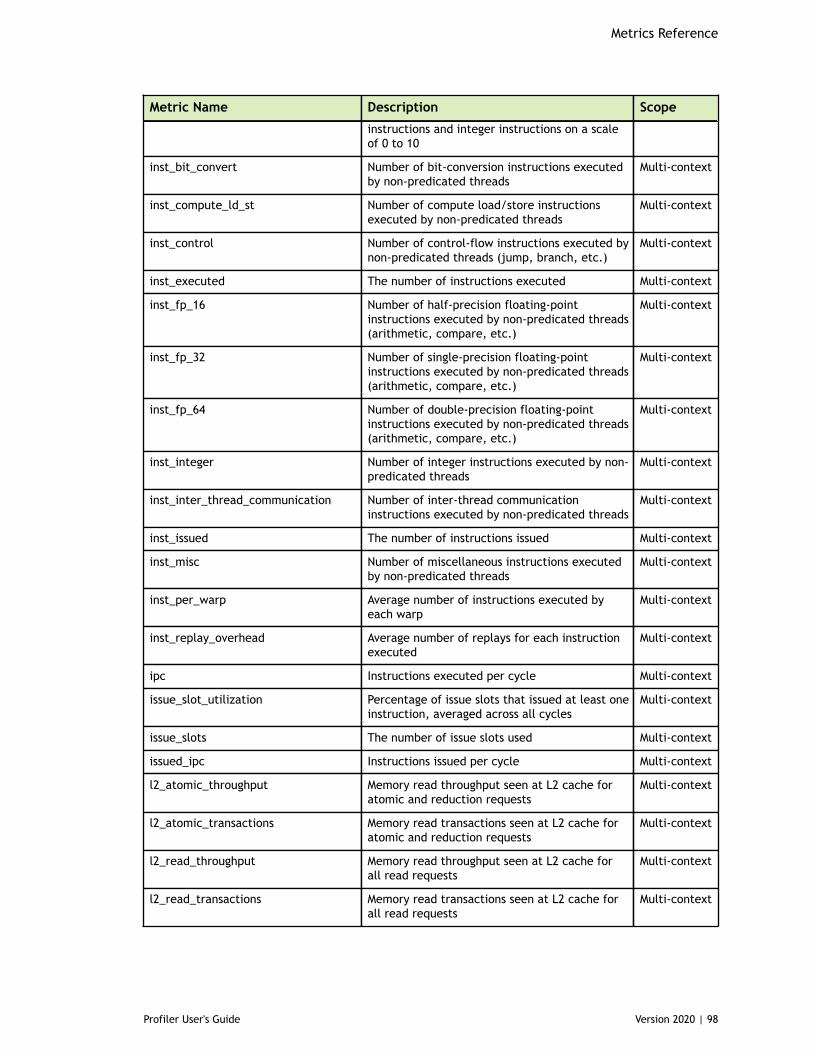
Metrics Reference
Profiler User's Guide Version 2020 | 98
Metric Name Description Scope
instructions and integer instructions on a scaleof 0 to 10
inst_bit_convert Number of bit-conversion instructions executedby non-predicated threads
Multi-context
inst_compute_ld_st Number of compute load/store instructionsexecuted by non-predicated threads
Multi-context
inst_control Number of control-flow instructions executed bynon-predicated threads (jump, branch, etc.)
Multi-context
inst_executed The number of instructions executed Multi-context
inst_fp_16 Number of half-precision floating-pointinstructions executed by non-predicated threads(arithmetic, compare, etc.)
Multi-context
inst_fp_32 Number of single-precision floating-pointinstructions executed by non-predicated threads(arithmetic, compare, etc.)
Multi-context
inst_fp_64 Number of double-precision floating-pointinstructions executed by non-predicated threads(arithmetic, compare, etc.)
Multi-context
inst_integer Number of integer instructions executed by non-predicated threads
Multi-context
inst_inter_thread_communication Number of inter-thread communicationinstructions executed by non-predicated threads
Multi-context
inst_issued The number of instructions issued Multi-context
inst_misc Number of miscellaneous instructions executedby non-predicated threads
Multi-context
inst_per_warp Average number of instructions executed byeach warp
Multi-context
inst_replay_overhead Average number of replays for each instructionexecuted
Multi-context
ipc Instructions executed per cycle Multi-context
issue_slot_utilization Percentage of issue slots that issued at least oneinstruction, averaged across all cycles
Multi-context
issue_slots The number of issue slots used Multi-context
issued_ipc Instructions issued per cycle Multi-context
l2_atomic_throughput Memory read throughput seen at L2 cache foratomic and reduction requests
Multi-context
l2_atomic_transactions Memory read transactions seen at L2 cache foratomic and reduction requests
Multi-context
l2_read_throughput Memory read throughput seen at L2 cache forall read requests
Multi-context
l2_read_transactions Memory read transactions seen at L2 cache forall read requests
Multi-context
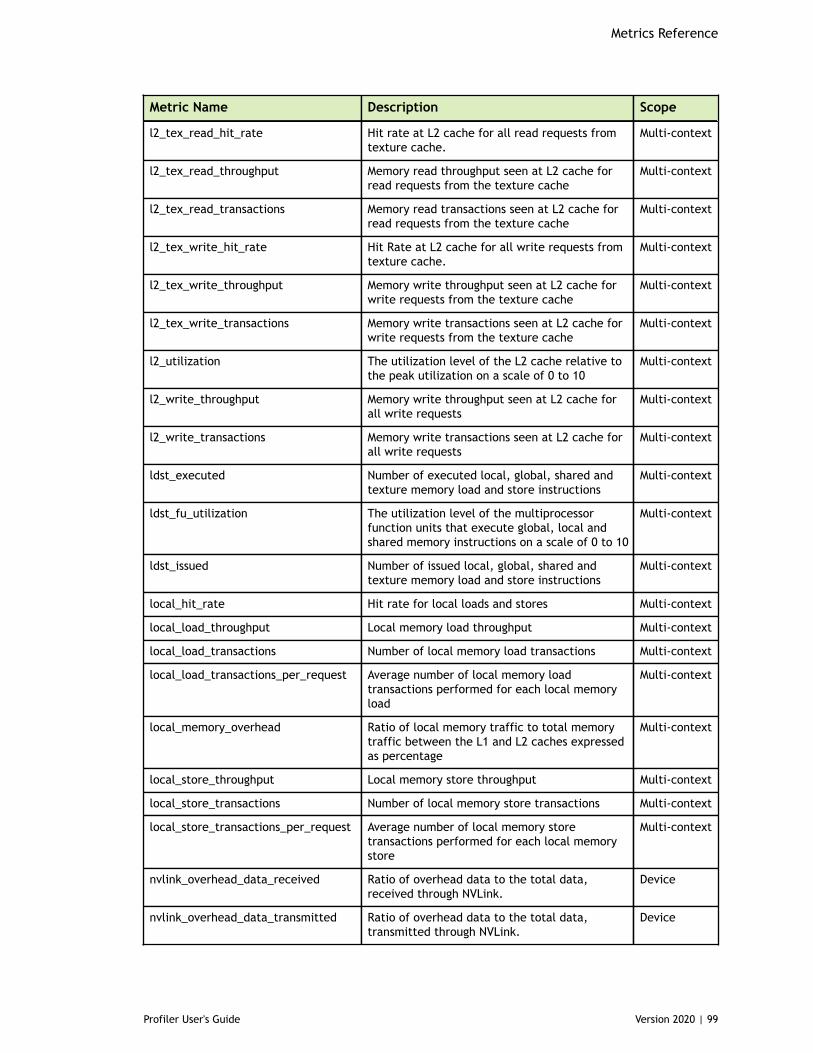
Metrics Reference
Profiler User's Guide Version 2020 | 99
Metric Name Description Scope
l2_tex_read_hit_rate Hit rate at L2 cache for all read requests fromtexture cache.
Multi-context
l2_tex_read_throughput Memory read throughput seen at L2 cache forread requests from the texture cache
Multi-context
l2_tex_read_transactions Memory read transactions seen at L2 cache forread requests from the texture cache
Multi-context
l2_tex_write_hit_rate Hit Rate at L2 cache for all write requests fromtexture cache.
Multi-context
l2_tex_write_throughput Memory write throughput seen at L2 cache forwrite requests from the texture cache
Multi-context
l2_tex_write_transactions Memory write transactions seen at L2 cache forwrite requests from the texture cache
Multi-context
l2_utilization The utilization level of the L2 cache relative tothe peak utilization on a scale of 0 to 10
Multi-context
l2_write_throughput Memory write throughput seen at L2 cache forall write requests
Multi-context
l2_write_transactions Memory write transactions seen at L2 cache forall write requests
Multi-context
ldst_executed Number of executed local, global, shared andtexture memory load and store instructions
Multi-context
ldst_fu_utilization The utilization level of the multiprocessorfunction units that execute global, local andshared memory instructions on a scale of 0 to 10
Multi-context
ldst_issued Number of issued local, global, shared andtexture memory load and store instructions
Multi-context
local_hit_rate Hit rate for local loads and stores Multi-context
local_load_throughput Local memory load throughput Multi-context
local_load_transactions Number of local memory load transactions Multi-context
local_load_transactions_per_request Average number of local memory loadtransactions performed for each local memoryload
Multi-context
local_memory_overhead Ratio of local memory traffic to total memorytraffic between the L1 and L2 caches expressedas percentage
Multi-context
local_store_throughput Local memory store throughput Multi-context
local_store_transactions Number of local memory store transactions Multi-context
local_store_transactions_per_request Average number of local memory storetransactions performed for each local memorystore
Multi-context
nvlink_overhead_data_received Ratio of overhead data to the total data,received through NVLink.
Device
nvlink_overhead_data_transmitted Ratio of overhead data to the total data,transmitted through NVLink.
Device
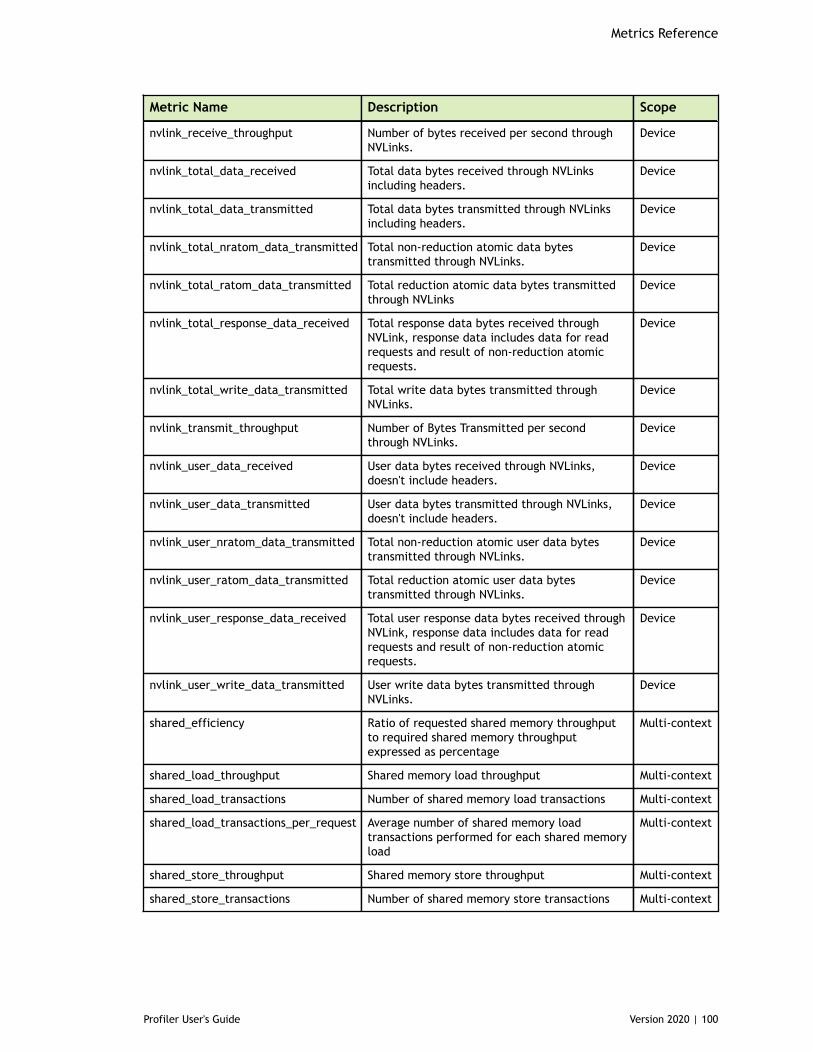
Metrics Reference
Profiler User's Guide Version 2020 | 100
Metric Name Description Scope
nvlink_receive_throughput Number of bytes received per second throughNVLinks.
Device
nvlink_total_data_received Total data bytes received through NVLinksincluding headers.
Device
nvlink_total_data_transmitted Total data bytes transmitted through NVLinksincluding headers.
Device
nvlink_total_nratom_data_transmitted Total non-reduction atomic data bytestransmitted through NVLinks.
Device
nvlink_total_ratom_data_transmitted Total reduction atomic data bytes transmittedthrough NVLinks
Device
nvlink_total_response_data_received Total response data bytes received throughNVLink, response data includes data for readrequests and result of non-reduction atomicrequests.
Device
nvlink_total_write_data_transmitted Total write data bytes transmitted throughNVLinks.
Device
nvlink_transmit_throughput Number of Bytes Transmitted per secondthrough NVLinks.
Device
nvlink_user_data_received User data bytes received through NVLinks,doesn't include headers.
Device
nvlink_user_data_transmitted User data bytes transmitted through NVLinks,doesn't include headers.
Device
nvlink_user_nratom_data_transmitted Total non-reduction atomic user data bytestransmitted through NVLinks.
Device
nvlink_user_ratom_data_transmitted Total reduction atomic user data bytestransmitted through NVLinks.
Device
nvlink_user_response_data_received Total user response data bytes received throughNVLink, response data includes data for readrequests and result of non-reduction atomicrequests.
Device
nvlink_user_write_data_transmitted User write data bytes transmitted throughNVLinks.
Device
shared_efficiency Ratio of requested shared memory throughputto required shared memory throughputexpressed as percentage
Multi-context
shared_load_throughput Shared memory load throughput Multi-context
shared_load_transactions Number of shared memory load transactions Multi-context
shared_load_transactions_per_request Average number of shared memory loadtransactions performed for each shared memoryload
Multi-context
shared_store_throughput Shared memory store throughput Multi-context
shared_store_transactions Number of shared memory store transactions Multi-context
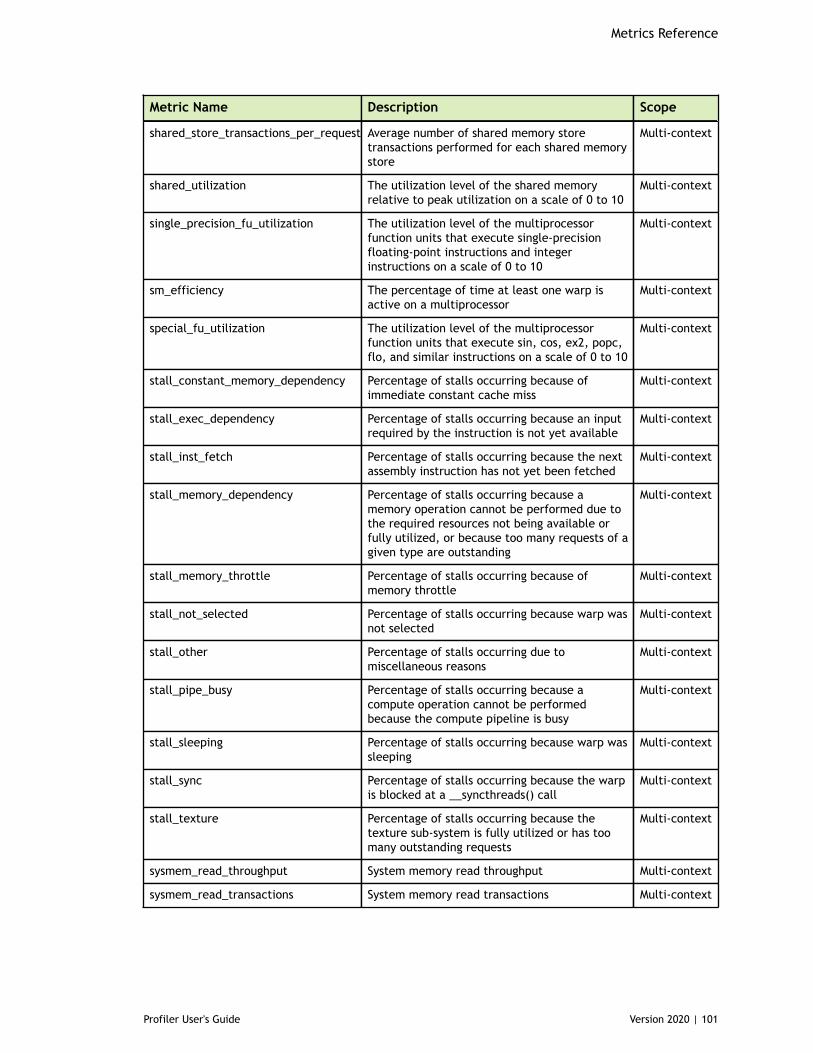
Metrics Reference
Profiler User's Guide Version 2020 | 101
Metric Name Description Scope
shared_store_transactions_per_request Average number of shared memory storetransactions performed for each shared memorystore
Multi-context
shared_utilization The utilization level of the shared memoryrelative to peak utilization on a scale of 0 to 10
Multi-context
single_precision_fu_utilization The utilization level of the multiprocessorfunction units that execute single-precisionfloating-point instructions and integerinstructions on a scale of 0 to 10
Multi-context
sm_efficiency The percentage of time at least one warp isactive on a multiprocessor
Multi-context
special_fu_utilization The utilization level of the multiprocessorfunction units that execute sin, cos, ex2, popc,flo, and similar instructions on a scale of 0 to 10
Multi-context
stall_constant_memory_dependency Percentage of stalls occurring because ofimmediate constant cache miss
Multi-context
stall_exec_dependency Percentage of stalls occurring because an inputrequired by the instruction is not yet available
Multi-context
stall_inst_fetch Percentage of stalls occurring because the nextassembly instruction has not yet been fetched
Multi-context
stall_memory_dependency Percentage of stalls occurring because amemory operation cannot be performed due tothe required resources not being available orfully utilized, or because too many requests of agiven type are outstanding
Multi-context
stall_memory_throttle Percentage of stalls occurring because ofmemory throttle
Multi-context
stall_not_selected Percentage of stalls occurring because warp wasnot selected
Multi-context
stall_other Percentage of stalls occurring due tomiscellaneous reasons
Multi-context
stall_pipe_busy Percentage of stalls occurring because acompute operation cannot be performedbecause the compute pipeline is busy
Multi-context
stall_sleeping Percentage of stalls occurring because warp wassleeping
Multi-context
stall_sync Percentage of stalls occurring because the warpis blocked at a __syncthreads() call
Multi-context
stall_texture Percentage of stalls occurring because thetexture sub-system is fully utilized or has toomany outstanding requests
Multi-context
sysmem_read_throughput System memory read throughput Multi-context
sysmem_read_transactions System memory read transactions Multi-context
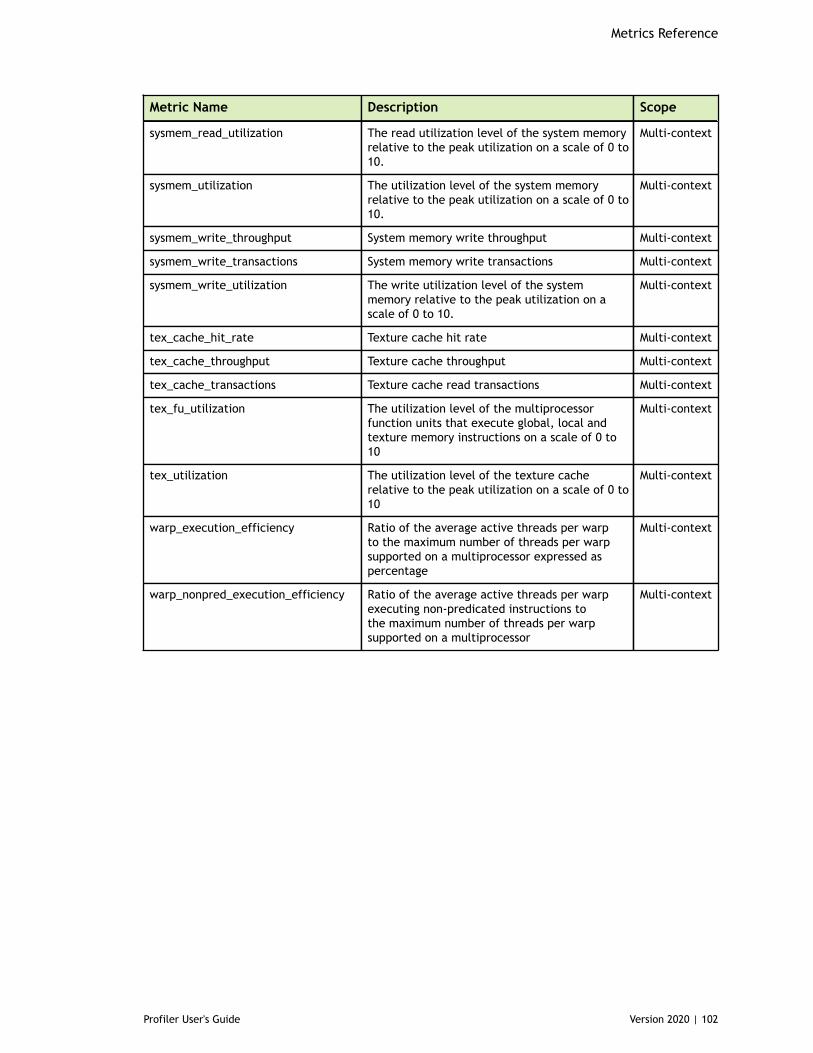
Metrics Reference
Profiler User's Guide Version 2020 | 102
Metric Name Description Scope
sysmem_read_utilization The read utilization level of the system memoryrelative to the peak utilization on a scale of 0 to10.
Multi-context
sysmem_utilization The utilization level of the system memoryrelative to the peak utilization on a scale of 0 to10.
Multi-context
sysmem_write_throughput System memory write throughput Multi-context
sysmem_write_transactions System memory write transactions Multi-context
sysmem_write_utilization The write utilization level of the systemmemory relative to the peak utilization on ascale of 0 to 10.
Multi-context
tex_cache_hit_rate Texture cache hit rate Multi-context
tex_cache_throughput Texture cache throughput Multi-context
tex_cache_transactions Texture cache read transactions Multi-context
tex_fu_utilization The utilization level of the multiprocessorfunction units that execute global, local andtexture memory instructions on a scale of 0 to10
Multi-context
tex_utilization The utilization level of the texture cacherelative to the peak utilization on a scale of 0 to10
Multi-context
warp_execution_efficiency Ratio of the average active threads per warpto the maximum number of threads per warpsupported on a multiprocessor expressed aspercentage
Multi-context
warp_nonpred_execution_efficiency Ratio of the average active threads per warpexecuting non-predicated instructions tothe maximum number of threads per warpsupported on a multiprocessor
Multi-context
Profiler User's Guide Version 2020 | 103
Chapter 9.WARP STATE
This section contains a description of each warp state. The warp can have followingstates:
‣ Instruction issued - An instruction or a pair of independent instructions was issuedfrom a warp.
‣ Stalled - Warp can be stalled for one of the following reasons. The stall reasondistribution can be seen at source level in PC Sampling View or at kernel level inLatency analysis using 'Examine Stall Reasons'
‣ Stalled for instruction fetch - The next instruction was not yet available.
To reduce instruction fetch stalls:
‣ If large loop have been unrolled in kernel, try reducing them.‣ If the kernel contains many calls to small function, try inlining more of them
with the __inline__ or __forceinline__ qualifiers. Conversely, if inliningmany functions or large functions, try __noinline__ to disable inlining ofthose functions.
‣ For very short kernels, consider fusing into a single kernels.‣ If blocks with fewer threads are used, consider using fewer blocks of more
threads. Occasional calls to __syncthreads() will then keep the warps in syncwhich may improve instruction cache hit rate.
‣ Stalled for execution dependency - The next instruction is waiting for one or
more of its inputs to be computed by earlier instruction(s).
To reduce execution dependency stalls, try to increase instruction-levelparallelism (ILP). This can be done by, for example, increasing loop unrollingor processing several elements per thread. This prevents the thread from idlingthrough the full latency of each instruction.
‣ Stalled for memory dependency - The next instruction is waiting for a previousmemory accesses to complete.
To reduce the memory dependency stalls
Warp State
Profiler User's Guide Version 2020 | 104
‣ Try to improve memory coalescing and/or efficiency of bytes fetched(alignment, etc.). Look at the source level analysis 'Global Memory AccessPattern' and/or the metrics gld_efficiency and gst_efficiency.
‣ Try to increase memory-level parallelism (MLP): the number ofindependent memory operations in flight per thread. Loop unrolling,loading vector types such as float4, and processing multiple elements perthread are all ways to increase memory-level parallelism.
‣ Consider moving frequently-accessed data closer to SM, such as by use ofshared memory or read-only data cache.
‣ Consider re-computing data where possible instead of loading it fromdevice memory.
‣ If local memory accesses are high, consider increasing register count perthread to reduce spilling, even at the expense of occupancy since localmemory accesses are cached only in L2 for GPUs with compute capabilitymajor = 5.
‣ Stalled for memory throttle - A large number of outstanding memory requests
prevents forward progress. On GPUs with compute capability major = 3,memory throttle indicates high number of memory replays.
To reduce memory throttle stalls:
‣ Try to find ways to combine several memory transactions into one (e.g., use64-bit memory requests instead of two 32-bit requests).
‣ Check for un-coalesced memory accesses using the source level analysis'Global Memory Access Pattern' and/or the profiler metrics gld_efficiencyand gst_efficiency; minimize them wherever possible.
‣ On GPUs with compute capability major >= 3, consider using read-only datacache using LDG for un-coalesced global reads
‣ Stalled for texture - The texture sub-system is fully utilized or has too many
outstanding requests.
To reduce texture stalls:
‣ Consider combining several texture fetch operations into one (e.g., packingdata in texture and unpacking in SM or using vector loads).
‣ Consider moving frequently-accessed data closer to SM by use of sharedmemory.
‣ Consider re-computing data where possible instead of fetching it frommemory.
‣ On GPUs with compute capability major < 5: Consider changing sometexture accesses into regular global loads to reduce pressure on thetexture unit, especially if you do not use texture-specific features such asinterpolation.
‣ On GPUs with compute capability major = 3: If global loads through theread-only data cache (LDG) are the source of texture accesses for this kernel,consider changing some of them back to regular global loads. Note that
Warp State
Profiler User's Guide Version 2020 | 105
if LDG is being generated due to use of the __ldg() intrinsic, this simplymeans changing back to a normal pointer dereference, but if LDG is beinggenerated automatically by the compiler due to the use of the const and__restrict__ qualifiers, this may be more difficult.
‣ Stalled for sync - The warp is waiting for all threads to synchronize after a
barrier instruction.
To reduce sync stalls:
‣ Try to improve load balancing i.e. try to increase work done betweensynchronization points; consider reducing thread block size.
‣ Minimize use of threadfence_*().‣ On GPUs with compute capability major >= 3: If __syncthreads() is
being used because of data exchange through shared memory within athreadblock, consider whether warp shuffle operations can be used in placeof some of these exchange/synchronize sequences.
‣ Stalled for constant memory dependency - The warp is stalled on a miss in the
cache for __constant__ memory and immediate.
This may be high the first time each constant is accessed (e.g., at the beginningof a kernel). To reduce these stalls,
‣ Consider reducing use of __constant__ or increase kernel runtime byincreasing block count
‣ Consider increasing number of items processed per thread‣ Consider merging several kernels that use the same __constant__ data to
amortize the cost of misses in the constant cache.‣ Try using regular global memory accesses instead of constant memory
accesses.
‣ Stalled for pipe busy - The warp is stalled because the functional unit required
to execute the next instruction is busy.
To reduce stalls due to pipe busy:
‣ Prefer high-throughput operations over low-throughput operations. Ifprecision doesn't matter, use float instead of double precision arithmetic.
‣ Look for arithmetic improvements (e.g., order-of-operations changes)that may be mathematically valid but unsafe for the compiler to doautomatically. Due to e.g. floating-point non-associativity.
‣ Stalled for not selected - Warp was ready but did not get a chance to issue as
some other warp was selected for issue. This reason generally indicates thatkernel is possibly optimized well but in some cases, you may be able to decreaseoccupancy without impacting latency hiding, and doing so may help improvecache hit rates.

Warp State
Profiler User's Guide Version 2020 | 106
‣ Stalled for other - Warp is blocked for an uncommon reason like compiler or
hardware reasons. Developers do not have control over these stalls.

Profiler User's Guide Version 2020 | 107
Chapter 10.PROFILER KNOWN ISSUES
The following are known issues with the current release.
‣ A security vulnerability issue required profiling tools to disable all the features fornon-root or non-admin users. As a result, visual PGI Profiler and the PGI Profilercannot profile the application when using a Windows 419.17 or Linux 418.43 or laterdriver. More details about the issue and the solutions can be found on this web page.
Starting with CUDA 10.2, visual PGI Profiler and the PGI Profiler allow tracingfeatures for non-root and non-admin users on desktop platforms. But events andmetrics profiling is still restricted for non-root and non-admin users.
‣ Use of the environment variable LD_PRELOAD to load some versions of MPIlibraries may result in a crash on Linux platforms. The workaround is to start theprofiling session as a root user. For the normal user, the SUID permission for thePGI Profiler must be set.
‣ To ensure that all profile data is collected and flushed to a file,cudaDeviceSynchronize() followed by either cudaProfilerStop() or cuProfilerStop()should be called before the application exits. Refer the section Flush Profile Data.
‣ Concurrent kernel mode can add significant overhead if used on kernels thatexecute a large number of blocks and that have short execution durations.
‣ If the kernel launch rate is very high, the device memory used to collect profilingdata can run out. In such a case some profiling data might be dropped. This will beindicated by a warning.
‣ When profiling an application that uses CUDA Dynamic Parallelism (CDP) there areseveral limitations to the profiling tools.
‣ Tracing and source level analysis are not supported on devices with computecapability 7.0 and higher.
‣ The visual PGI Profiler timeline does not display CUDA API calls invoked fromwithin device-launched kernels.
‣ The visual PGI Profiler does not display detailed event, metric, and source-level results for device-launched kernels. Event, metric, and source-level resultscollected for CPU-launched kernels will include event, metric, and source-levelresults for the entire call-tree of kernels launched from within that kernel.
Profiler Known Issues
Profiler User's Guide Version 2020 | 108
‣ The the PGI Profiler event/metric output does not include results fordevice-launched kernels. Events/metrics collected for CPU-launched kernels willinclude events/metrics for the entire call-tree of kernels launched from withinthat kernel.
‣ Profiling APK binaries is not supported.‣ visual PGI Profiler is not supported on the ARM architecture. You can use Remote
Profiling. Refer the Remote Profiling section for more information.‣ visual PGI Profiler doesn't support remote profiling for the Android target. The
workaround is to run the PGI Profiler on the target and load the the PGI Profileroutput in the visual PGI Profiler.
‣ Unified memory profiling is not supported on the ARM architecture.‣ When profiling an application in which a device kernel was stopped due to an
assertion the profiling data will be incomplete and a warning or error message isdisplayed. But the message is not precise as the exact cause of the failure is notdetected.
‣ For dependency analysis, in cases where activity timestamps in the trace areslightly distorted such that they violate the programming model constraints, nodependencies or waiting times can be analyzed.
‣ Devices with compute capability 6.0 and higher introduce a new feature, computepreemption, to give fair chance for all compute contexts while running long tasks.With compute preemption feature-
‣ If multiple contexts are running in parallel it is possible that long kernels willget preempted.
‣ Some kernels may get preempted occasionally due to timeslice expiry for thecontext.
If kernel has been preempted, the time the kernel spends preempted is still countedtowards kernel duration. This can affect the kernel optimization priorities given byvisual PGI Profiler as there is randomness introduced due to preemption.
Compute preemption can affect events and metrics collection. The following areknown issues with the current release:
‣ Events and metrics collection for a MPS client can result in higher counts thanexpected on devices with compute capability 7.0 and higher, since MPS clientmay get preempted due to termination of another MPS client.
‣ Events warps_launched and sm_cta_launched and metric inst_per_warp mightprovide higher counts than expected on devices with compute capability 6.0and 6.1. Metric unique_warps_launched can be used in place of warps_launchedto get correct count of actual warps launched as it is not affected by computepreemption.
To avoid compute preemption affecting profiler results try to isolate the contextbeing profiled:
‣ Run the application on secondary GPU where display is not connected.‣ On Linux if the application is running on the primary GPU where the display
driver is connected then unload the display driver.‣ Run only one process that uses GPU at one time.
Profiler Known Issues
Profiler User's Guide Version 2020 | 109
‣ Devices with compute capability 6.0 and higher support demand paging.When the kernel is scheduled for the first time, all the pages allocated usingcudaMallocManaged and that are required for execution of the kernel are fetchedin the global memory when GPU faults are generated. Profiler requires multiplepasses to collect all the metrics required for kernel analysis. The kernel state needsto be saved and restored for each kernel replay pass. For devices with computecapability 6.0 and higher and platforms supporting Unified memory, in the firstkernel iteration the GPU faults will be generated and all pages will be fetched in theglobal memory. Second iteration onwards GPU page faults will not occur. This willsignificantly affect the memory related events and timing. The time taken from tracewill include the time required to fetch the pages but most of the metrics profiledin multiple iterations will not include time/cycles required to fetch the pages. Thiscauses inconsistency in the profiler results.
‣ CUDA device enumeration and order, typically controlled through environmentvariables CUDA_VISIBLE_DEVICES and CUDA_DEVICE_ORDER, should remain thesame for the profiler and the application.
‣ CUDA profiling might not work on systems that contain a mixture of supportedand unsupported GPUs. On such systems, either set option --devicesto supported devices in the PGI Profiler, or set environment variableCUDA_VISIBLE_DEVICES before launching the PGI Profiler or the visual PGIProfiler.
‣ Because of the low resolution of the timer on Windows, the start and endtimestamps can be same for activities having short execution duration on Windows.As a result, the the PGI Profiler and visual PGI Profiler report the followingwarning: "Found N invalid records in the result."
‣ Profiler cannot interoperate with other Nvidia tools like cuda-gdb, cuda-memcheck, Nsight Systems and Nsight Compute.
‣ OpenACC profiling might fail when OpenACC library is linked statically in theuser application. This happens due to the missing definition of the OpenACC APIroutines needed for the OpenACC profiling, as compiler might ignore definitions forthe functions not used in the application. This issue can be mitigated by linking theOpenACC library dynamically.
visual PGI Profiler
The following are known issues related to visual PGI Profiler:
‣ To run the profiler you will need Java install on your system and to set theenvironment variable PGI_JAVA to the location of the java executable.
‣ Some analysis results require metrics that are not available on all devices. Whenthese analyses are attempted on a device where the metric is not available theanalysis results will show that the required data is "not available".
‣ Note that "Examine stall reasons" analysis does not work for compute capability 3.0.But in this case no results or message is displayed and so it can be confusing.
‣ Using the mouse wheel button to scroll does not work within the visual PGI Profileron Windows.
‣ visual PGI Profiler cannot load profiler data larger than the memory size limited byJVM or available memory on the system. Refer Improve Loading of Large Profilesfor more information.
Profiler Known Issues
Profiler User's Guide Version 2020 | 110
‣ visual PGI Profiler requires Java version 6 or later to be installed on the system.On some platforms the required Java version is installed as part of the CUDAToolkit installation. But in some cases you may need to install Java version 6 or laterseparately.
‣ visual PGI Profiler global menus do not show properly or are empty onsome versions of Ubuntu. One workaround is to set environment variable"UBUNTU_MENUPROXY=0" before running visual PGI Profiler
‣ In the visual PGI Profiler the NVLink Analysis diagram can be incorrect afterscrolling the diagram. This can be corrected by horizontally resizing the diagrampanel.
‣ visual PGI Profiler might not be able to show NVLink events on the timeline whenlarge number of samples are collected. To work around this issue, refresh thetimeline by doing zoom-in or zoom-out. Alternate solution is to save and open thesession.
‣ For unified memory profiling on a remote setup having different version of GCCthan host machine, visual PGI Profiler might not be able to show the source codelocation for CPU page fault events.
‣ For unified memory profiling on a remote setup having different architecture thanthe host machine (x86 versus POWER), visual PGI Profiler might not be able to showthe source code location for CPU page fault and allocation tracking events.
‣ For remote profiling, the PGI Workstation installed on the host system mustsupport the target device on the remote system.
‣ visual PGI Profiler might show strange symbol fonts on platforms which don't haverequired fonts installed.
the PGI Profiler
The following are known issues related to the PGI Profiler:
‣ the PGI Profiler cannot profile processes that fork() but do not then exec().‣ the PGI Profiler assumes it has access to the temporary directory on the system,
which it uses to store temporary profiling data. On Linux the default is /tmp. OnWindows it's specified by the system environment variables. To specify a customlocation, change $TMPDIR on Linux or %TMP% on Windows.
‣ When multiple the PGI Profiler processes are run simultaneously on the samenode, there is an issue of contention for files under the temporary directory. Oneworkaround is to set a different temporary directory for each process.
‣ Multiple the PGI Profiler processes running concurrently using applicationreplay may generate incorrect results or no results at all. To work around this issueyou need to set a unique temporary directory per process. Set NVPROF_TMPDIRbefore launching the PGI Profiler.
‣ To profile application on Android $TMPDIR environment variable has to be definedand point to a user-writable folder.
‣ Profiling results might be inconsistent when auto boost is enabled. the PGIProfiler tries to disable auto boost by default, it might fail to do so in someconditions, but profiling will continue. the PGI Profiler will report a warningwhen auto boost cannot be disabled. Note that auto boost is supported only oncertain Tesla devices from the Kepler+ family.
Profiler Known Issues
Profiler User's Guide Version 2020 | 111
‣ Profiling a C++ application which overloads the new operator at the global scopeand uses any CUDA APIs like cudaMalloc() or cudaMallocManaged() inside theoverloaded new operator will result in a hang.
‣ NVTX annotations will not work when profiling all processes using the thePGI Profiler option --profile-all-processes. It is advised to set theenvironment variable NVTX_INJECTION64_PATH to point to the profiler injectionlibrary, libcuinj64.so on Linux and cuinj64_*.dll on Windows, before launching theapplication.
Events and Metrics
The following are known issues related to Events and Metrics profiling:
‣ Profiling features for devices with compute capability 7.5 and higher are supportedin the NVIDIA Nsight Compute. visual PGI Profiler does not support GuidedAnalysis, some stages under Unguided Analysis and events and metrics collectionfor devices with compute capability 7.5 and higher. One can launch the NVIDIANsight Compute UI for devices with compute capability 7.5 and higher from visualPGI Profiler. Also the PGI Profiler does not support query and collection of eventsand metrics, source level analysis and other options used for profiling on deviceswith compute capability 7.5 and higher. The NVIDIA Nsight Compute commandline interface can be used for these features.
‣ Events or metrics collection may significantly change the overall performancecharacteristics of the application because all kernel executions are serialized on theGPU.
‣ In event or metric profiling, kernel launches are blocking. Thus kernelswaiting on updates from host or another kernel may hang. This includessynchronization between the host and the device build upon value-basedCUDA stream synchronization APIs such as cuStreamWaitValue32() andcuStreamWriteValue32().
‣ Event and metric collection requiring multiple passes will not work with thethe PGI Profiler kernel replay option for any kernel performing IPC or datacommunication between the kernel and CPU, kernel and regular CPU allocatedmemory, kernel and Peer GPU, or kernel and other Peer devices (e.g. GPU direct).
‣ For some metrics, the required events can only be collected for a single CUDAcontext. For an application that uses multiple CUDA contexts, these metrics willonly be collected for one of the contexts. The metrics that can be collected only for asingle CUDA context are indicated in the metric reference tables.
‣ Some metric values are calculated assuming a kernel is large enough to occupyall device multiprocessors with approximately the same amount of work. If akernel launch does not have this characteristic, then those metric values may not beaccurate.
‣ Some metrics are not available on all devices. To see a list of all available metrics ona particular NVIDIA GPU, type pgprof --query-metrics. You can also refer tothe metric reference tables.
‣ The profilers may fail to collect events or metrics when "application replay" modeis turned on. This is most likely to happen if the application is multi-threaded andnon-deterministic. Instead use "kernel replay" mode in this case.
Profiler Known Issues
Profiler User's Guide Version 2020 | 112
‣ For applications that allocate large amount of device memory, the profiler may takesignificant time to collect all events or metrics when "kernel replay" mode is used.Instead use "application replay" mode in this case.
‣ Here are a couple of reasons why visual PGI Profiler may fail to gather metric orevent information.
‣ More than one tool is trying to access the GPU. To fix this issue please makesure only one tool is using the GPU at any given point. Tools include NsightCompute, Nsight Systems, Nsight Graphics, and applications that use eitherCUPTI or PerfKit API (NVPM) to read event values.
‣ More than one application is using the GPU at the same time visual PGI Profileris profiling a CUDA application. To fix this issue please close all applicationsand just run the one with visual PGI Profiler. Interacting with the active desktopshould be avoided while the application is generating event information. Pleasenote that for some types of event visual PGI Profiler gathers events for only onecontext if the application is using multiple contexts within the same application.
‣ When collecting events or metrics with the --events, --metrics, or --analysis-metrics options, the PGI Profiler will use kernel replay to execute each kernelmultiple times as needed to collect all the requested data. If a large number of eventsor metrics are requested then a large number of replays may be required, resultingin a significant increase in application execution time.
‣ Some events are not available on all devices. To see a list of all available events on aparticular device, type pgprof --query-events.
‣ Enabling certain events can cause GPU kernels to run longer than the driver'swatchdog time-out limit. In these cases the driver will terminate the GPU kernelresulting in an application error and profiling data will not be available. Pleasedisable the driver watchdog time out before profiling such long running CUDAkernels
‣ On Linux, setting the X Config option Interactive to false is recommended.‣ For Windows, detailed information on disabling the Windows TDR is available
at http://msdn.microsoft.com/en-us/windows/hardware/gg487368.aspx#E2‣ the PGI Profiler can give out of memory error for event and metrics profiling, it
could be due to large number of instructions in the kernel.‣ Profiling results might be incorrect for CUDA applications compiled with nvcc
version older than 9.0 for devices with compute capability 6.0 and 6.1. It is advisedto recompile the application with nvcc version 9.0 or later. Ignore this warning ifcode is already compiled with the recommended nvcc version.
‣ PC Sampling is not supported on Tegra platforms.‣ Profiling is not supported for multidevice cooperative
kernels, that is, kernels launched by using the API functionscudaLaunchCooperativeKernelMultiDevice orcuLaunchCooperativeKernelMultiDevice.
‣ Profiling is not supported on virtual GPUs (vGPU).‣ Profiling is not supported for CUDA kernel nodes launched by a CUDA Graph.
Profiler User's Guide Version 2020 | 113
Chapter 11.CHANGELOG
Profiler changes in CUDA 10.2
List of changes done as part of the CUDA Toolkit 10.2 release.
‣ visual PGI Profiler and the PGI Profiler allow tracing features for non-root and non-admin users on desktop platforms. Note that events and metrics profiling is stillrestricted for non-root and non-admin users. More details about the issue and thesolutions can be found on this web page.
‣ visual PGI Profiler and the PGI Profiler allow tracing features on the virtual GPUs(vGPU).
‣ Profilers no longer turn off the performance characteristics of CUDA Graph whentracing the application.
‣ Added an option to enable/disable the OpenMP profiling in visual PGI Profiler.‣ Fixed the incorrect timing issue for the asynchronous cuMemset/cudaMemset
activity.
Profiler changes in CUDA 10.1 Update 2
List of changes done as part of the CUDA Toolkit 10.1 Update 2 release.
‣ This release is focused on bug fixes and stability of the profiling tools.‣ A security vulnerability issue required profiling tools to disable all the features for
non-root or non-admin users. As a result, visual PGI Profiler and the PGI Profilercannot profile the application when using a Windows 419.17 or Linux 418.43 or laterdriver. More details about the issue and the solutions can be found on this web page.
Profiler changes in CUDA 10.1
List of changes done as part of the CUDA Toolkit 10.1 release.
‣ This release is focused on bug fixes and stability of the profiling tools.‣ Support for NVTX string registration API nvtxDomainRegisterStringA().
Notice
ALL NVIDIA DESIGN SPECIFICATIONS, REFERENCE BOARDS, FILES, DRAWINGS,DIAGNOSTICS, LISTS, AND OTHER DOCUMENTS (TOGETHER AND SEPARATELY,"MATERIALS") ARE BEING PROVIDED "AS IS." NVIDIA MAKES NO WARRANTIES,EXPRESSED, IMPLIED, STATUTORY, OR OTHERWISE WITH RESPECT TO THEMATERIALS, AND EXPRESSLY DISCLAIMS ALL IMPLIED WARRANTIES OFNONINFRINGEMENT, MERCHANTABILITY, AND FITNESS FOR A PARTICULARPURPOSE.
Information furnished is believed to be accurate and reliable. However, NVIDIACorporation assumes no responsibility for the consequences of use of suchinformation or for any infringement of patents or other rights of third partiesthat may result from its use. No license is granted by implication of otherwiseunder any patent rights of NVIDIA Corporation. Specifications mentioned in thispublication are subject to change without notice. This publication supersedes andreplaces all other information previously supplied. NVIDIA Corporation productsare not authorized as critical components in life support devices or systemswithout express written approval of NVIDIA Corporation.
Trademarks
NVIDIA, the NVIDIA logo, Cluster Development Kit, PGC++, PGCC, PGDBG, PGF77,PGF90, PGF95, PGFORTRAN, PGHPF, PGI, PGI Accelerator, PGI CDK, PGI Server,PGI Unified Binary, PGI Visual Fortran, PGI Workstation, PGPROF, PGROUP, PVF,and The Portland Group are trademarks and/or registered trademarks of NVIDIACorporation in the U.S. and other countries. Other company and product namesmay be trademarks of the respective companies with which they are associated.
Copyright
© 2007–2020 NVIDIA Corporation. All rights reserved.
www.pgroup.com


![[NEXT] Android Profiler](https://img.dokumen.tips/doc/110x75/544522b8afaf9fdf2b8b46cb/next-android-profiler.jpg)