Embed Size (px)
Citation preview

Grant Number: 582-13-30089 Proposal for Grant Activities (PGA)/PCR No. 582-16-64136-19
Project Name: Flash Tank Emissions Tracking Number: 2016-27
Final Report
Prepared and Submitted by:
Vincent M. Torres, PE Principal Investigator
Associate Director, Center for Energy & Environmental Resources
The University of Texas at Austin Austin, Texas
September 26, 2017
Page 2 of 35
TableofContents
ExecutiveSummary................................................................................................................3
Introduction...........................................................................................................................4Background...................................................................................................................................................................................4Objectives......................................................................................................................................................................................4ApproachandWorkPerformed..............................................................................................5Approach........................................................................................................................................................................................5LiteratureSearch........................................................................................................................................................................6AcquisitionofData.................................................................................................................................................................13
Results..................................................................................................................................14AnalysisoftheData................................................................................................................................................................25ConclusionsandRecommendations......................................................................................27
References............................................................................................................................28
Appendices...........................................................................................................................31

Page 3 of 35
ExecutiveSummary The purpose of this project was to provide an assessment of the flash volatile organic compounds (VOC) emissions over the production lifetime of a hydrocarbon well including an analysis of whether and how the VOC flash rate (mass of VOC per barrel of production) changes over time. The objective would be to obtain results that could be used to improve emissions inventory estimates for relevant sources and source categories. Such an assessment requires crude oil and/or condensate composition and production data. There are no publicly available crude oil assay databases of oil extracted from the ground at production sites in Texas. This is most probably due to the fact this level of information would be costly to obtain on a routine basis and is not needed for most normal petroleum refining operations. The Texas Railroad Commission (RRC) collects monthly oil and gas production data from every oil and gas lease in Texas and makes it publicly available. Recent years’ data are maintained in digital format and are easier to access than earlier years’ data. An oil lease may contain several wells, so crude oil production data reported to the Texas RRC is only indicative of a single well’s production when there is only one producing oil well on a lease. For a gas well, there is a one-to-one correspondence between a gas well’s production and the lease production data reported to the Texas RRC. Neither crude oil condensate or gas composition nor the American Petroleum Institute (API) gravity data (for the oil/condensate) are reported to the Texas RRC as part of the required monthly production data reported by oil and gas producers in Texas. The Texas Comptroller’s office receives the same monthly production data as the Texas RRC when producers file monthly revenue reports. It also collects API data for the liquid hydrocarbon production reported. It is helpful to know that this data is reported and where it can be obtained for future work. The quality of these data should be assessed prior to use in future work. Using the monthly production data collected by the Texas Comptroller’s office for the period 2006 to 2016, gas/oil ratios (GORs) were calculated and examined for trends in the data. The GOR is defined as the ratio of the gas in standard cubic feet (SCF) produced to the oil/condensate produced in barrels and was calculated by dividing the gas produced in SCF by the oil/condensate produced in barrels. The GOR has units of SCFB. The GOR data graphed in Figures 1 through 12 show that the GOR did not remain constant for most of the oil producing counties and fields in RRC districts 1, 2, 3, 7C, 8 and 8A during the 2006 to 2016 period examined in this study. While determining the exact reason for these variations was not part of the study, it must be assumed they were economically strategic in nature. Accurate prediction of flash tank hydrocarbon and VOC emissions requires crude oil assays of the oil to be produced and a working knowledge of the production site’s operations. The GOR variations examined in this study cannot be used alone to improve prediction of the rate of flash tank hydrocarbon or VOC emissions or the nature of variability of the emissions profile at oil production sites over the life of the well.
Page 4 of 35
Introduction
BackgroundTank flashing, i.e., the release from the liquid phase of gas phase hydrocarbons when the hydrocarbon liquid is either elevated in temperature or decreased in pressure, is a key source of emissions at most upstream oil and gas sites. Storage tanks are at atmospheric pressure and temperature. They may receive high-pressure liquids that are transferred from production separators to the atmospheric storage tank. These high-pressure liquids can have entrained flash gases (depending upon separator operating pressure as well as other variables) and will also produce flash gases as the high-pressure liquid comes into equilibrium with the conditions in the storage tank. The models used to estimate flashing and the flash tank emissions depend on many factors including an assumption of the compositions of the hydrocarbon liquids that are transferred to the tanks. If the actual liquid compositions are significantly different than the modeled liquid compositions, the actual emissions will be different than the emission estimates. Therefore, to more accurately determine volatile organic compound (VOC) emissions from flash tanks, how and whether the actual oil/condensate composition and flash rate (mass of VOC per barrel of production) change significantly over the life of the well is important to know and understand.
ObjectivesThe purpose of this project was to provide an assessment of the flash volatile organic compounds (VOC) emissions over the production lifetime of a hydrocarbon well, including an analysis of whether and how the VOC flash rate (mass of VOC per barrel of production) changes over time. The objective would be to obtain results that could be used to improve emissions inventory estimates for relevant sources and source categories.
Page 5 of 35
ApproachandWorkPerformed
ApproachTo help identify the data and information necessary to determine the flash VOC emissions profile at any point in time, it is helpful to review the factors that drive the creation of flash hydrocarbon and VOC emissions. The United States Environmental Protection Agency (EPA) on its website (US EPA 2016) defines a VOC “as any compound of carbon, excluding carbon monoxide, carbon dioxide, carbonic acid, metallic carbides or carbonates and ammonium carbonate, which participates in atmospheric photochemical reactions, except those designated by EPA as having negligible photochemical reactivity.” Two compounds found in emissions from upstream oil and gas operations that meet the “negligible photochemical reactivity” criteria, and are therefore excluded by EPA as VOCs, are methane and ethane, major components of natural gas. EPA also states that “VOCs are organic chemical compounds whose composition makes it possible for them to evaporate under normal indoor atmospheric conditions of temperature and pressure.” From the latter statement, any other hydrocarbon that meets the VOC definition and exists as a gas at normal ambient temperature and pressure would fall into the category of compounds that are the focus of this project. Petroleum or liquid crude oil is a complex mixture of many naturally occurring hydrocarbon compounds found in underground reservoirs that are at very high pressures (typically 500 psi to more than 2,500 psi as the well depth increases) and temperatures on the order of 150 °F to 200 °F or more depending on well depth (Schlumberger 2016, Barriol 2005). There are two major mechanisms that can cause gases to evolve from the crude oil: flash liberation and differential liberation (Freyss 1989). Flash liberation occurs when there is a sudden pressure drop in the liquid and differential liberation occurs when the liquid’s pressure is reduced gradually. Flash liberation occurs as the oil flows up the well and through the separator(s), which is referred to as flash separation. Flash separation can also occur after the last separator as the oil flows from the last separator into the stock tank. So the factors determining the flash gas emissions rate are the composition of the oil entering the first separator (high pressure, HP), the oil mass flow rate, its pressure, and temperature. If a second or intermediate pressure (IP) separator were used prior to the oil flowing into the stock tank, then these same parameters for the IP separator would also be needed. The ideal approach to assessing the accuracy of estimates of flash gas emissions at a well site would be to have all of these and separator operations data and direct measurements of flash tank emissions for extended periods of time (continuously for a month, minimum) during the same month(s) each year and repeated annually at the same well in the same sampling and measurement locations. This search of the literature has not found any sources that have all of these data for one well. Over time, the oil flow rate will naturally decline as oil is extracted from a well if enhanced recovery is not employed. This is because the pressure in the reservoir will decrease as more and more oil is extracted from the well, causing the flow rate of the well to decrease as the reservoir pressure drops. This period is the primary (i.e., oil can be extracted from the well using only the reservoir’s pressure to generate the flow of oil to the surface) recovery phase of a well’s lifetime.
Page 6 of 35
The composition of the remaining oil in the reservoir will also change (Vo 2011) during this phase particularly if the reservoir drops below the bubble point pressure. The bubble point is the critical pressure and temperature at which the first bubbles of gas come out of solution of the oil. If the well requires enhanced (i.e., injection of steam or fluids is required to force the oil to flow to the surface) recovery also known as secondary recovery, then these same parameters will still be required (Schlumberger 2016). Therefore, due to changes in flow rate and composition, these same parameters on a monthly or annual basis would also be required for the well being analyzed to estimate how the emissions rate might change over the lifetime of well. In reviewing the purpose of the project, there are two key questions to answer: 1. If the well’s oil/condensate production rate (barrels/day) and composition are constant, A)
what could cause the flash VOC rate (mass of VOC/barrel) to change over the production life of the well and B) how does the flash VOC emission profile change over the production life of the well?
2. If the well’s oil/condensate production rate (barrels/day) and/or composition are found to change over the production life of the well, A) how does the flash VOC emission rate (mass of VOC/barrel) change over the production life of the well, and B) how does the flash VOC emission profile change over the production life of the well?
Ideally, to answer either question, at a minimum, data on the oil/condensate production rate over the lifetime of a well, oil/condensate composition over the lifetime of a well, and the rate and profile of flash VOC emissions that could be produced for a given oil/condensate composition is needed. Therefore, sources of publicly available data that may have one or more of these data or data that could be used to produce these data would be needed. The approach employed was to seek sources of the data needed though a literature search and then assess how to analyze the available data and whether it would be sufficient to answer the key questions.
LiteratureSearchA comprehensive literature search was conducted that focused on crude oil production data sources and included, but was not limited to, the following: • Academic research, including publications in major journals and reports • Texas Railroad Commission data • US Energy Information Agency data and publications, including information gathered during
the ongoing Sampling, Analysis, and Experiment Plan • Texas Bureau of Economic Geology • Academic contacts • Operators, industry groups, and their publications, e.g., the American Petroleum Institute,
Gas Processors Association, etc. Websites of the American Petroleum Institute, Gas Processors Association (now GPA Midstream Association), US Department of Energy including the National Energy Technology Laboratory, US Energy Information Administration, US EPA, the states of Colorado and California, California Air Resources Board, and the US Geological Survey were investigated at the national level as sources of potential publicly available well production and composition data. At the state level, websites from the TCEQ, Texas Bureau of Economic Geology and the Texas Railroad

Page 7 of 35
Commission (RRC) were investigated as well. The data search included published papers in major journals and reports in the public domain. The detailed results of the literature review are summarized below. The Texas Railroad Commission (RRC) collects monthly production data for all active oil and gas wells in Texas and makes it publicly available. They issue permit numbers and assign lease numbers. For gas wells, there is one well per lease so the production data reported is for an individual well. For oil wells, the production data reported is for all wells on the lease, whether one or multiple wells are present on the lease (York, 2016). For many oil well leases, there is more than one well per lease. The RRC assembles production data by RRC districts (see Appendix A), the county in which the production occurred, and the lease number associated with the oil or gas production for that county. Other information typically reported includes the field and reservoir of the well(s). A petroleum reservoir is a geological term that refers to a subsurface rock formation that is capable of holding and trapping the gas or oil whereas a petroleum field is the pool or group of pools of hydrocarbons contained in a reservoir (Schlumberger 2016). Fields tend to be assigned designations (names) by the landowner or owner of the mineral rights who developed the field site. Since reservoirs may be expansive and span multiple counties and RRC districts, there will be many fields associated with a reservoir owing to the mineral ownership rights and other economic factors. The RRC does not collect data on composition of the oil or condensate for Texas leases/wells. For leases with only one oil well, these data may be helpful in seeing how the production rate varies over the life of a well. Unfortunately, longitudinal production data over many decades may not be available in one format depending on the time period of interest. Therefore gathering these data and assembling them into one consistent format for analysis can be very resource-intensive and time consuming. Also, searching the RRC website and data is more efficient if all of the pertinent well identifying information is obtained prior to commencing the search. For large data sets, a request to the Research and Statistics department is the most cost-efficient approach. The Texas Bureau of Economic Geology (BEG) has information characterizing oil and gas fields/reservoirs in the state (BEG 2016). This information includes extensive information about the geology, estimates of the quantities of energy resources in these fields and reservoirs, and the potential profitability of extracting these resources. They do not maintain production data or information about characterization of the crude oil in these fields by well or lease. The US Energy Information Administration (EIA) records production data (comparable to that collected by the RRC) by state for every field in a state, as well as the total for the state, but not by lease or well (EIA-b 2016). They also do not collect or report composition data. The US Environmental Protection Agency (EPA) collects emission profile data for many sources and makes it available through their SPECIATE database. These emission profiles are not for specific well sites but are engineering evaluations of test and literature data. Further investigation into the specific source test and literature data is required to use these profiles. They have no information on the composition of the oil or condensate that may have produced these emission profiles.
Page 8 of 35
The National Oil & Gas Emissions Committee (NOGEC) is an outgrowth from the Eastern Regional Technical Advisory Committee (ERTAC) area emissions process with participants from EPA offices, states, and multijurisdictional organizations (MJOs). There is also the Western Regional Air Partnership (WRAP), a voluntary partnership of states, tribes, federal land managers, local air agencies and the US EPA, whose purpose is to understand current and evolving regional air quality issues in the West (WRAP 2016). They have an Oil & Gas Workgroup. Their website was reviewed in detail, specifically the titles of all of the reports and presentations archived there that might be relevant to this project. In general, the primary focus of their work has been on improving emissions inventories by improving emission factors. Most recently, most of their work has focused on natural gas and methane emissions. They have not focused on characterization of the sources of these emissions. The work of both NOEGEC and WRAP were monitored as a possible source of data for this project but neither had production or crude oil composition data at the individual lease/well level. Contact was also made with EPA Region 8, Cindy Beeler (Beeler 2016), to determine if the Noble Energy enforcement project would provide pressurized liquid sample analysis data in sufficient time to be useful for this project. This source of data will not be available in time to be of use on this project. The Department of Energy (DOE), Office of Fossil Energy, is interested in obtaining a science-based understanding of outstanding questions associated with production, treatment and transportation of various types of crude oil (DOE-b 2016). As part of this effort and in collaboration with the US Department of Transportation, they funded a literature survey of crude oil properties relevant to handling and fire safety in transport. This project’s report was reviewed for possible leads to sources of crude oil characterization data. DOE and DOT have learned from this literature survey that there are gaps in important crude oil characterization data. In response they asked Sandia National Laboratories to develop the Crude Oil Characteristics Research Sampling, Analysis and Experiment (SAE) Plan. This project started the summer of 2016 and has not yet published results. The American Petroleum Institute (API) and the Gas Processors Association (GPA) websites were also searched and inquiries made seeking any information that may be relevant to any part of this project. From reviews of their respective websites, it did not appear that data needed for this project is collected and made publicly available by these organizations (API 2016). The National Technical Reports Library (NTRL) was searched for publications and reports available. Titles and/or abstracts from more than 500 publications were reviewed (NTRL 2016). The titles from these publications did not provide indications that they contained the data being sought. The US DOE National Energy Technology Laboratory (NETL) has a Crude Oil Assay (COA) database with property and analysis information in Bartlesville, Oklahoma (NETL 2016). The National Institute for Petroleum and Energy Research (NIPER) performed these analyses. It has collected oil composition data based on different geographic locations. It is not collected based on production but rather to characterize the crude oils in the federal government’s storage reservoirs.

Page 9 of 35
The website of the California Air Resources Board (CARB) was reviewed as they have conducted projects on emissions from gas wells, particularly methane emissions. This site has procedures for collection and analysis of crude oil samples that may inform the importance of how samples are collected and analyzed (CARB 2016). The CARB does not have or collect longitudinal crude oil production or composition data. The published literature was also searched to determine if there were reports from studies of flash emissions rate and/or composition at production sites. While there has been considerable work performed, most of the work has focused on measurement of methane emissions and not VOCs. For example, a study conducted by UT in 2012 focused on methane emissions at 150 production sites. No VOCs are reported in this study. A study conducted by HARC (H51C) in 2006 made measurements of emissions from condensate tanks. However, the report indicates a high level of uncertainty in the condensate tank emissions measurements at some of the sites and temperatures were much higher than yearly averages. If used, the conditions under which these data were obtained would have to be examined on a case-by-case basis for each well to determine their representativeness. During the literature survey, it was learned that prorationing may influence how much oil is produced from a well. Prorationing is the practice of limiting the production of a well based on a number of factors, size of the reservoir being one of them. This restriction effectively artificially controls the production rate of the well month-to-month. So one cannot look to a natural production rate change over the life of the well as many wells in Texas are subject to a proration schedule that dictates their maximum allowable production. Additionally, the practice of injecting fluids into a well based on the typical stages of production life, i.e., primary, secondary, and tertiary recovery, to enhance oil/gas recovery may also impact the composition of the oil/condensate and its flash characteristics at different times in the life of a well. Therefore, in general, one cannot look to change in production rate as a possible indicator of a change in composition of the oil/condensate. The most accurate indicator of potential flash emissions and changes in the crude oil flash rate and composition over a well’s production life will be obtained using actual composition analysis (assay) of periodic crude oil samples with a speciation of at least all of its hydrocarbons containing carbon counts of 12 or less obtained at the separator(s) and/or prior to entering the storage tank, locations in the liquid flow just prior to where flashing will occur. Some times in the course of operations the crude oil composition is desired. When this occurs, a sample of the crude oil is obtained, e.g., from the separator, and a compositional fluid analysis (Schlumberger 2016), sometimes referred to as a crude oil assay, is performed to characterize the components in the oil. The analysis is performed to speciate the fluid up to hydrocarbons containing eleven carbon atoms, i.e., C11. A complete analysis of 100% of the composition is expensive because crude oil can have hundreds of hydrocarbon compounds, is therefore difficult and time consuming to analyze, and speciation beyond C11 may not be needed. So most analyses are conducted to identify hydrocarbons containing compounds up through C11. These types of analyses are not required by regulatory agencies so when needed they are for business purposes and are usually funded privately by owners or potential purchasers of a well. Hence these results are usually not publicly available. Due to project budget constraints, a limited search of privately

Page 10 of 35
funded crude oil compositional fluid analyses that have been collected/assembled into databases by companies was conducted. A very credible source for composition analysis from the high-pressure separator was identified. Examples of crude oil assays were obtained with well identification information redacted for the five major oil and gas formations in Texas (Barnett Shale, Eagle Ford Shale, Granite Wash, Haynesville/Bossier Shale and the Permian Basin). No production data were available for these assays. Also investigated was information in privately maintained databases, such as those owned by IHS, Drillinginfo, Inc. or Rigdata. Commercial database providers IHS Markit and Haverly Systems were contacted by phone to understand the content of their databases. The Haverly Systems product includes the Chevron Crude Oil Assay database (Friedrich, 2016). They reiterated that only the RRC maintains a publicly available database of well production data by month for every well (gas)/lease (oil) in Texas. In speaking with Drillinginfo, Inc. (Barefoot 2017), it was learned that they could assemble API gravity data for most oil leases from revenue reports submitted monthly to the Texas Comptroller’s office (Comptroller). The Comptroller receives monthly the same production data (gas and oil by lease) reported to the RRC in the revenue reports. The Comptroller’s office (Smith 2017) confirmed that the API gravity reported is for the oil sold during the reporting period. The API gravity is an arbitrary scale expressing the gravity or density of liquid petroleum products relative to the gravity of water; the standard temperature for the specific gravity measurement used in calculating API gravity is 60 degrees Fahrenheit. The measuring scale is calibrated in terms of degrees API; it is calculated as follows: Degrees (°) API = (141.5 / (sp. gr. at 60ºF)) - 131.5 The higher the API gravity, the lighter the compound. Light crudes generally exceed 38 degrees API and heavy crudes are commonly labeled as all crudes with API gravity of 22 degrees or less. Intermediate crudes fall in the range of 22 degrees to 38 degrees API gravity (US EIA 2017). From the literature search, any composition data from Texas leases/wells that may be available in the public domain will typically not be full assays of periodically analyzed crude oil samples from each well. There are multiple reasons why this data may not be publicly available: the sampling data is not always required to be directly reported from a regulatory standpoint; it can be costly to perform; and in general, lease owners and petroleum refiners routinely need only boiling-point distribution, density in °API gravity, and viscosity data for processing of crude oil. (Websites from Colorado and California were also reviewed but do not include complete assays from oil wells either.) (CARB 2016, COGCC 2016) It was also concluded that for any leases/wells included in this study, any assessment of flash emissions would most likely be based on limited crude oil property data, most probably density in °API gravity. After several conversations with the TCEQ Project Manager focusing on the type and availability of data, a plan was developed to examine the gas/oil ratio (GOR) data by lease for the years 2006 to 2016 for six RRC districts 1, 2, 3, 7C, 8 and 8a. These six RRC districts
Page 11 of 35
represent different geographic areas of Texas, which in total typically represent as much as 80% of the oil produced in any given year as shown in Tables 1 and 2. The GOR is defined as the ratio of the gas in standard cubic feet (SCF) produced to the oil/condensate produced in barrels and was calculated by dividing the gas produced in SCF by the oil/condensate produced in barrels. The GOR has units of SCFB. It was agreed that the services of Drillinginfo, Inc. should be obtained to assemble API gravity, gas and oil production data, and the gas/oil ratio (calculated from these production data) from their database developed from the Comptroller’s Office revenue data for leases in RRC districts 1, 2, 3, 7C, 8 and 8a.

Page 12 of 35
Table 1 Texas Oil & Condensate Production, 2006
ProductionYear–2006
District Oil(BBL) Condensate(BBL)
Total(BBL) %ofState Cumulative%
8A 121,820,958 93,617 121,914,575 31.06% 31.06%8 110,065,183 1,024,809 111,089,992 28.30% 59.37%
3 26,488,208 12,503,548 38,991,756 9.93% 69.30%
7C 20,247,280 2,100,470 22,347,750 5.69% 75.00%6 10,943,949 8,720,697 19,664,646 5.01% 80.01%
9 13,400,221 1,939,001 15,339,222 3.91% 83.91%4 3,965,381 10,413,301 14,378,682 3.66% 87.58%
2 7,801,752 3,266,090 11,067,842 2.82% 90.40%
1 9,955,738 489,334 10,445,072 2.66% 93.06%10 6,288,335 3,799,053 10,087,388 2.57% 95.63%
7B 9,411,805 291,512 9,703,317 2.47% 98.10%6E 4,325,487 0 4,325,487 1.10% 99.20%
5 2,641,583 481,673 3,123,256 0.80% 100.00%Totals 347,355,880 45,123,105 392,478,985 100.00%
Production data from 2006 Texas Railroad Commission Annual Production Data (TRC 2016)
Table 2 Texas Oil & Condensate Production, 2016
ProductionYear–2016
District Oil(BBL) Condensate(BBL) Total(BBL) %ofState Cumulative%
8 369,980,528 25,094,479 395,075,007 34.18% 34.18%1 192,489,571 44,203,699 236,693,270 20.48% 54.66%
2 157,896,237 41,342,850 199,239,087 17.24% 71.90%8A 99,339,214 66,467 99,405,681 8.60% 80.50%
7C 98,504,078 660,686 99,164,764 8.58% 89.08%
3 33,888,980 7,831,421 41,720,401 3.61% 92.69%10 14,290,080 10,144,076 24,434,156 2.11% 94.80%
6 8,829,098 5,317,279 14,146,377 1.22% 96.02%9 11,107,952 2,523,895 13,631,847 1.18% 97.20%
4 3,032,193 7,567,730 10,599,923 0.92% 98.12%
7B 10,430,042 138,497 10,568,539 0.91% 99.04%5 8,157,287 188,789 8,346,076 0.72% 99.76%
6E 2,800,016 0 2,800,016 0.24% 100.00%Totals 1,010,745,276 145,079,868 1,155,825,144 100.00%
Production data from 2016 Texas Railroad Commission Annual Production Data (TRC 2016)
Page 13 of 35
AcquisitionofDataDrillingInfo obtained production and API gravity data for RRC districts 1, 2, 3, 7C, 8 and 8a reported each month in revenue reports submitted to the Texas Comptroller’s Office for the purpose of assessing taxes (Drillinginfo, Inc. 2017). The oil/condensate production data is reported in barrels (BBL) and the gas data is reported in thousands of standard cubic feet (MCF). These are the same data reported to the RRC on a lease basis using the same lease numbers assigned by the RRC. The API gravity is in units of °API. Drillinginfo, Inc. provided these data by RRC districts in Excel files. The record (row) in the file for each of the six RRC districts represents a lease in that district and includes an entity number (ID), a lease name and number, the field, reservoir, production report date, liquid gravity (°API), liquid produced (BBL), gas produced (MCF), GOR, latitude, longitude, county, and RRC district. DrillingInfo calculated GOR using each month’s oil and gas production. DrillingInfo provided a total of 3,265,948 records for the six districts (District 1 – 340,423; District 2 – 156,289; District 3 – 458,156; District 7C – 468,230; District 8A – 507,092; District 8 – 1,335,758). Electronic copies of these files can be obtained upon request from the TCEQ Project Manager.
Page 14 of 35
Results The data set that was used in this analysis excludes any month’s production data for a lease if the API gravity was not provided. As the data in this analysis is only from leases where the API gravity was reported, these data totals may not align directly with RRC production records. There were also some leases that did not report or for which the Texas Comptroller’s Office did not reflect production data for some months. Due to the time constraints on the project, no attempt was made to locate these data or reconcile them with the RRC files and the missing months of production data were excluded from the data used in this report. Due to the large number of active leases and months of production data (number of records in the data files) for each of the six RRC district files and the project time available to analyze the data, a phased approach was developed for analyzing the data. Phase 1 involved sorting the records in each district first by lease and then by the number of months of reports available and the time period covered. This tabulation of leases was then sorted chronologically by the reporting month. Subsequent phases of analysis would be developed based on the results obtained from Phase 1 and the remaining project budget. In consideration of the volume of data and in concert with the TCEQ Project Manager, it was decided that the data would be examined in two ways for each of the six RRC districts: annually on a county basis and annually on a production field basis. It was further decided the geographical basis used for production data would be the sum of the production for all leases in a county for the reporting year for the county analysis and the sum of the production for all leases in a production field for the reporting year for the production field analysis. Therefore, for any of the six RRC districts
𝐺𝑂𝑅 𝑐𝑜𝑢𝑛𝑡𝑦!,! = 𝑎𝑛𝑛𝑢𝑎𝑙 𝑔𝑎𝑠 𝑝𝑟𝑜𝑑𝑢𝑐𝑡𝑖𝑜𝑛 𝑙𝑒𝑎𝑠𝑒 𝑖 𝑖𝑛 𝑐𝑜𝑢𝑛𝑡𝑦 (𝑥)!!!
!!! ,𝑦𝑒𝑎𝑟 (𝑦), 𝑆𝐶𝐹
𝑎𝑛𝑛𝑢𝑎𝑙 𝑜𝑖𝑙 𝑝𝑟𝑜𝑑𝑢𝑐𝑡𝑖𝑜𝑛 𝑙𝑒𝑎𝑠𝑒 𝑖 𝑖𝑛 𝑐𝑜𝑢𝑛𝑡𝑦 𝑥 ,𝑦𝑒𝑎𝑟 (𝑦),𝐵𝐵𝐿!!!!!!
𝐺𝑂𝑅 𝑓𝑖𝑒𝑙𝑑!,! = 𝑎𝑛𝑛𝑢𝑎𝑙 𝑔𝑎𝑠 𝑝𝑟𝑜𝑑𝑢𝑐𝑡𝑖𝑜𝑛 𝑙𝑒𝑎𝑠𝑒 𝑖 𝑖𝑛 𝑓𝑖𝑒𝑙𝑑 (𝑥)!!!
!!! ,𝑦𝑒𝑎𝑟 (𝑦), 𝑆𝐶𝐹
𝑎𝑛𝑛𝑢𝑎𝑙 𝑜𝑖𝑙 𝑝𝑟𝑜𝑑𝑢𝑐𝑡𝑖𝑜𝑛 𝑙𝑒𝑎𝑠𝑒 𝑖 𝑖𝑛 𝑓𝑖𝑒𝑙𝑑 𝑥 ,𝑦𝑒𝑎𝑟 (𝑦),𝐵𝐵𝐿!!!!!!
where x represents a county within the RRC y is the reporting year and field is the production field. The graphs of GOR for years 2012 to 2016 for RRC districts 1, 2 and 3 are shown in Figures 1 through 3, respectively, and of GOR for years 2006 to 2016 for RRC districts 7C, 8 and 8a are shown in Figures 4 through 6, respectively, for the top five oil producing counties in each district based on the 2012 year’s oil (oil and condensate) annual production data. The graphs of GOR and annual oil production for years 2012 to 2016 for RRC districts 1, 2 and 3 are shown in Figures 7 through 9, respectively, and of GOR and annual oil production for years 2006 to 2016 for RRC districts 7C, 8 and 8a are shown in Figures 10 through 12, respectively, for the top ten oil producing fields in each district. In addition to these figures, Table 3 lists the counties of each of the top ten fields by district for RRC districts 1, 2, 3, 7C, 8 and 8a. All of the data for Figures 1 through 12 are based on information provided by Drillinginfo, Inc. (Drillinginfo, Inc. 2017).

Page 15 of 35
Figure 1. Gas/Oil Ratio (GOR) Years 2012 to 2016 for 2012 Top Five RRC District 1 Oil
Producing Counties
Figure 2. Gas/Oil Ratio (GOR) Years 2012 to 2016 for 2012 Top Five RRC District 2 Oil
Producing Counties
0
500
1,000
1,500
2,000
2,500
3,000
3,500
2011 2012 2013 2014 2015 2016 2017
GOR,SCFB
Year
ATASCOSA(TX)
DIMMIT(TX)
GONZALES(TX)
LASALLE(TX)
MCMULLEN(TX)
0.00E+00
5.00E+02
1.00E+03
1.50E+03
2.00E+03
2.50E+03
3.00E+03
3.50E+03
4.00E+03
4.50E+03
2011 2012 2013 2014 2015 2016 2017
GOR,SCFB
Year
DEWITT(TX)
KARNES(TX)
LAVACA(TX)
LIVEOAK(TX)
REFUGIO(TX)

Page 16 of 35
Figure 3. Gas/Oil Ratio (GOR) Years 2012 to 2016 for 2012 Top Five RRC District 3 Oil
Producing Counties
Figure 4. Gas/Oil Ratio (GOR) Years 2006 to 2016 for 2012 Top Five RRC District 7C Oil
Producing Counties
0
500
1,000
1,500
2,000
2,500
3,000
3,500
2011 2012 2013 2014 2015 2016 2017
GOR,SCFB
Year
BRAZORIA(TX)
BRAZOS(TX)
CHAMBERS(TX)
FORTBEND(TX)
MADISON(TX)
0
2,000
4,000
6,000
8,000
10,000
12,000
2005 2007 2009 2011 2013 2015 2017
GOR,SCFB
Year
CROCKETT(TX)
IRION(TX)
REAGAN(TX)
COKE(TX)
UPTON(TX)

Page 17 of 35
Figure 5. Gas/Oil Ratio (GOR) Years 2006 to 2016 for 2012 Top Five RRC District 8 Oil
Producing Counties
Figure 6. Gas/Oil Ratio (GOR) Years 2006 to 2016 for 2012 Top Five RRC District 8A Oil
Producing Counties
0
1,000
2,000
3,000
4,000
5,000
6,000
7,000
2005 2007 2009 2011 2013 2015 2017
GOR,SCFB
Year
ANDREWS(TX)
CRANE(TX)
ECTOR(TX)
MIDLAND(TX)
PECOS(TX)
0
500
1,000
1,500
2,000
2,500
3,000
2005 2007 2009 2011 2013 2015 2017
GOR,SCFB
Year
GAINES(TX)
HOCKLEY(TX)
KENT(TX)
SCURRY(TX)
YOAKUM(TX)

Page 18 of 35
Figure 7. RRC District 1, Top 10 Fields, Gas/Oil Ratio (GOR) Top Figure and Annual Oil
Production Bottom Figure for Years 2012 to 2016
0
1,000
2,000
3,000
4,000
5,000
6,000
7,000
8,000
2011 2012 2013 2014 2015 2016 2017
GOR,SCFB
Year
EAGLEVILLE
BRISCOERANCH
PEARSALL
LULING-BRANYON
A.W.P.
COMANCHE-HALSELL
SACATOSA
DARSTCREEK
SALTFLAT
GIDDINGS
0.00E+00
2.00E+01
4.00E+01
6.00E+01
8.00E+01
1.00E+02
1.20E+02
1.40E+02
1.60E+02
1.80E+02
2011 2012 2013 2014 2015 2016 2017
Annu
alProdu
cSon
,MMBB
L
Year
EAGLEVILLE
BRISCOERANCH
PEARSALL
LULING-BRANYON
A.W.P.
COMANCHE-HALSELL
SACATOSA
DARSTCREEK
SALTFLAT
GIDDINGS

Page 19 of 35
Figure 8. RRC District 2, Top 10 Fields, Gas/Oil Ratio (GOR) Top Figure and Annual Oil
Production Bottom for Years 2012 to 2016
0
2,000
4,000
6,000
8,000
10,000
12,000
14,000
2011 2012 2013 2014 2015 2016 2017
GOR,SCFB
Year
EAGLEVILLE
TOMO'CONNOR
SUGARKANE
LAKEPASTURE
DEWITT
WESTRANCH
ANAQUA
SINORNEST
GRETA
KOONTZ
0.00E+00
2.00E+01
4.00E+01
6.00E+01
8.00E+01
1.00E+02
1.20E+02
1.40E+02
1.60E+02
1.80E+02
2.00E+02
2011 2012 2013 2014 2015 2016 2017
Annu
alProdu
cSon
,MMBB
L
Year
EAGLEVILLE
TOMO'CONNOR
SUGARKANE
LAKEPASTURE
DEWITT
WESTRANCH
ANAQUA
SINORNEST
GRETA
KOONTZ
Page 20 of 35
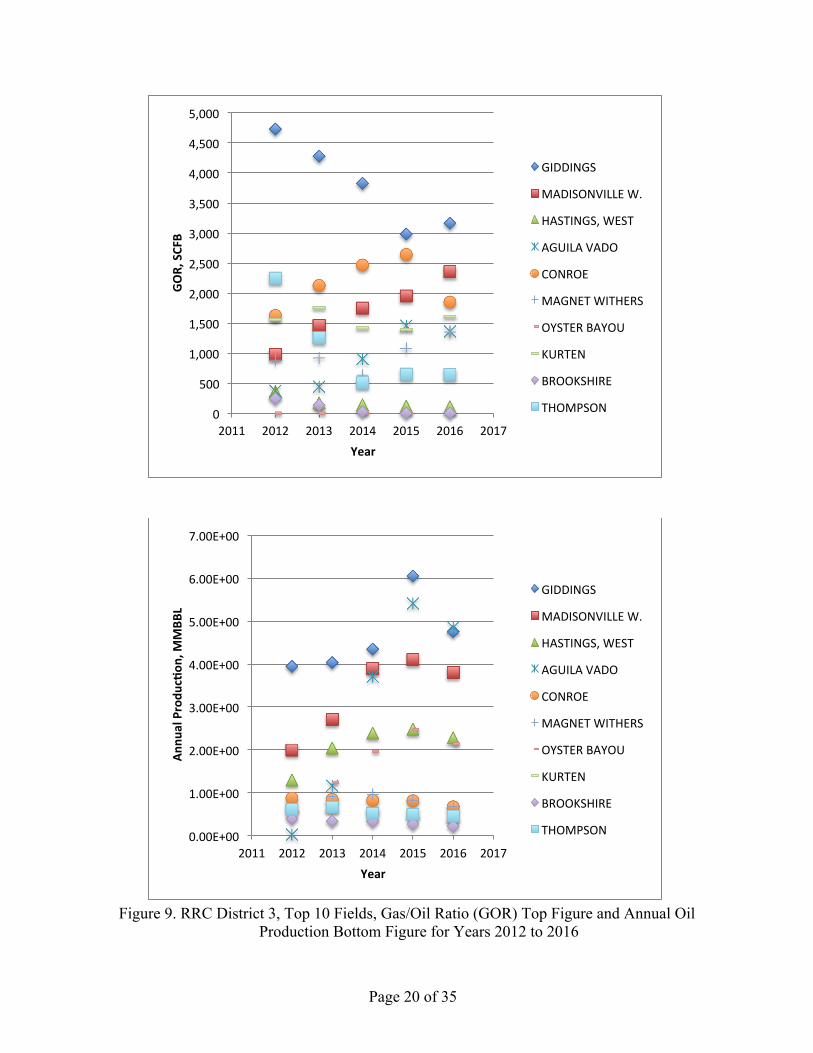
Figure 9. RRC District 3, Top 10 Fields, Gas/Oil Ratio (GOR) Top Figure and Annual Oil
Production Bottom Figure for Years 2012 to 2016
0
500
1,000
1,500
2,000
2,500
3,000
3,500
4,000
4,500
5,000
2011 2012 2013 2014 2015 2016 2017
GOR,SCFB
Year
GIDDINGS
MADISONVILLEW.
HASTINGS,WEST
AGUILAVADO
CONROE
MAGNETWITHERS
OYSTERBAYOU
KURTEN
BROOKSHIRE
THOMPSON
0.00E+00
1.00E+00
2.00E+00
3.00E+00
4.00E+00
5.00E+00
6.00E+00
7.00E+00
2011 2012 2013 2014 2015 2016 2017
Annu
alProdu
cSon
,MMBB
L
Year
GIDDINGS
MADISONVILLEW.
HASTINGS,WEST
AGUILAVADO
CONROE
MAGNETWITHERS
OYSTERBAYOU
KURTEN
BROOKSHIRE
THOMPSON

Page 21 of 35
Figure 10. RRC District 7C, Top 10 Fields, Gas/Oil Ratio (GOR) Top Figure and Annual Oil
Production Bottom Figure for Years 2006 to 2016
0
2,000
4,000
6,000
8,000
10,000
12,000
14,000
2005 2007 2009 2011 2013 2015 2017
GOR,SCFB
Year
SPRABERRY
LIN
CROSSETT,S.
MCELROY
HOLTRANCH
NOELKE
KETCHUMMT.
SUGGRANCH
AMACKER-TIPPET,SW
FARMER
0.00E+00
1.00E+01
2.00E+01
3.00E+01
4.00E+01
5.00E+01
6.00E+01
2005 2007 2009 2011 2013 2015 2017
Annu
alProdu
cSon
,MMBB
L
Year
SPRABERRY
LIN
CROSSETT,S.
MCELROY
HOLTRANCH
NOELKE
KETCHUMMT.
SUGGRANCH
AMACKER-TIPPET,SW
FARMER
Page 22 of 35
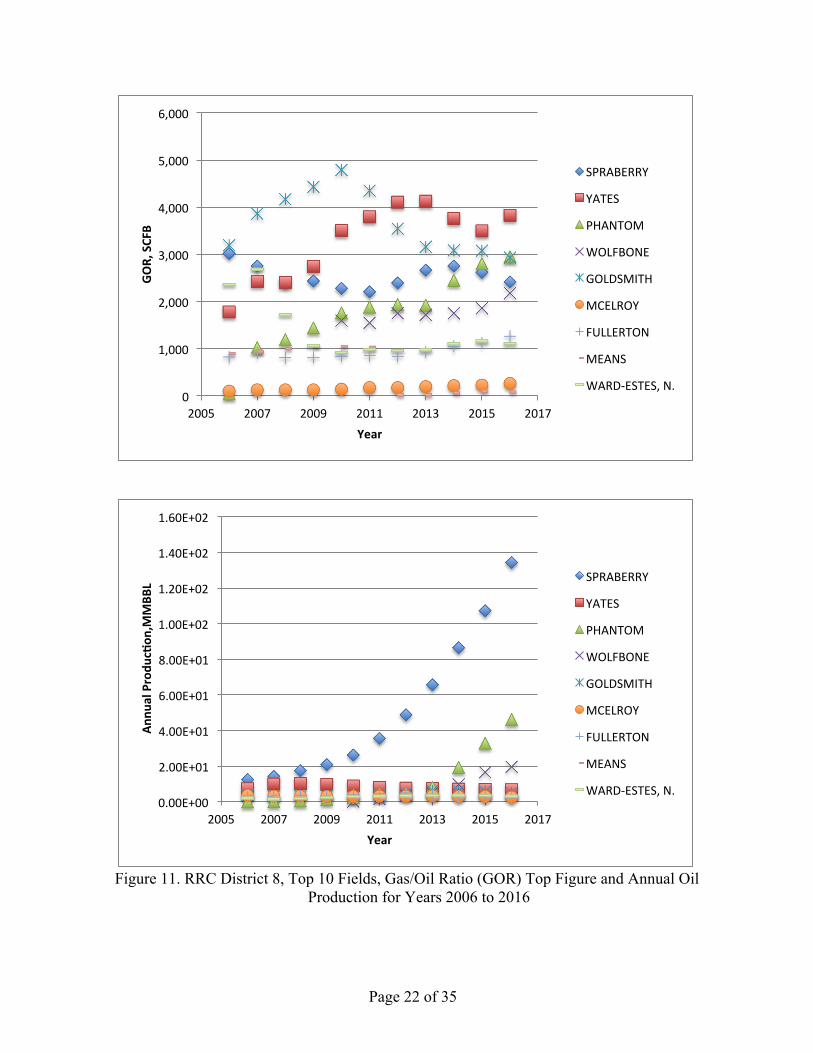
Figure 11. RRC District 8, Top 10 Fields, Gas/Oil Ratio (GOR) Top Figure and Annual Oil
Production for Years 2006 to 2016
0
1,000
2,000
3,000
4,000
5,000
6,000
2005 2007 2009 2011 2013 2015 2017
GOR,SCFB
Year
SPRABERRY
YATES
PHANTOM
WOLFBONE
GOLDSMITH
MCELROY
FULLERTON
MEANS
WARD-ESTES,N.
0.00E+00
2.00E+01
4.00E+01
6.00E+01
8.00E+01
1.00E+02
1.20E+02
1.40E+02
1.60E+02
2005 2007 2009 2011 2013 2015 2017
Annu
alProdu
cSon
,MMBB
L
Year
SPRABERRY
YATES
PHANTOM
WOLFBONE
GOLDSMITH
MCELROY
FULLERTON
MEANS
WARD-ESTES,N.

Page 23 of 35
Figure 12. RRC District 8A, Top 10 Fields, Gas/Oil Ratio (GOR) Top Figure and Annual Oil
Production Bottom Figure for Years 2006 to 2016
0
500
1,000
1,500
2,000
2,500
3,000
3,500
2005 2007 2009 2011 2013 2015 2017
GOR,SCFB
Year
WASSON
KELLY-SNYDER
SLAUGHTER
SEMINOLE
LEVELLAND
ROBERTSON,N.
SALTCREEK
ANTON-IRISH
WASSON72
JO-MILL
0.00E+00
5.00E+00
1.00E+01
1.50E+01
2.00E+01
2.50E+01
2005 2007 2009 2011 2013 2015 2017
AnnualProduction,MMBBL
Year
WASSON
KELLY-SNYDER
SLAUGHTER
SEMINOLE
LEVELLAND
ROBERTSON,N.
SALTCREEK
ANTON-IRISH
WASSON72
JO-MILL
Page 24 of 35
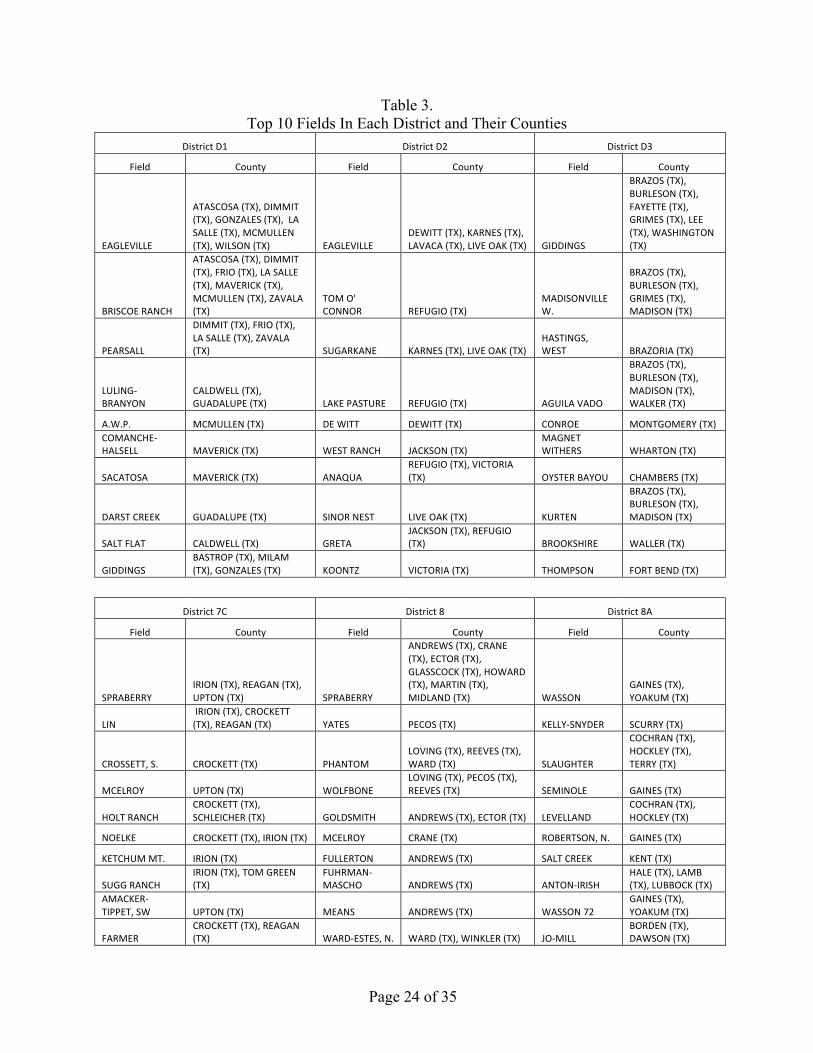
Table 3. Top 10 Fields In Each District and Their Counties
DistrictD1 DistrictD2 DistrictD3
Field County Field County Field County
EAGLEVILLE
ATASCOSA(TX),DIMMIT(TX),GONZALES(TX),LASALLE(TX),MCMULLEN(TX),WILSON(TX) EAGLEVILLE
DEWITT(TX),KARNES(TX),LAVACA(TX),LIVEOAK(TX) GIDDINGS
BRAZOS(TX),BURLESON(TX),FAYETTE(TX),GRIMES(TX),LEE(TX),WASHINGTON(TX)
BRISCOERANCH
ATASCOSA(TX),DIMMIT(TX),FRIO(TX),LASALLE(TX),MAVERICK(TX),MCMULLEN(TX),ZAVALA(TX)
TOMO'CONNOR REFUGIO(TX)
MADISONVILLEW.
BRAZOS(TX),BURLESON(TX),GRIMES(TX),MADISON(TX)
PEARSALL
DIMMIT(TX),FRIO(TX),LASALLE(TX),ZAVALA(TX) SUGARKANE KARNES(TX),LIVEOAK(TX)
HASTINGS,WEST BRAZORIA(TX)
LULING-BRANYON
CALDWELL(TX),GUADALUPE(TX) LAKEPASTURE REFUGIO(TX) AGUILAVADO
BRAZOS(TX),BURLESON(TX),MADISON(TX),WALKER(TX)
A.W.P. MCMULLEN(TX) DEWITT DEWITT(TX) CONROE MONTGOMERY(TX)COMANCHE-HALSELL MAVERICK(TX) WESTRANCH JACKSON(TX)
MAGNETWITHERS WHARTON(TX)
SACATOSA MAVERICK(TX) ANAQUAREFUGIO(TX),VICTORIA(TX) OYSTERBAYOU CHAMBERS(TX)
DARSTCREEK GUADALUPE(TX) SINORNEST LIVEOAK(TX) KURTEN
BRAZOS(TX),BURLESON(TX),MADISON(TX)
SALTFLAT CALDWELL(TX) GRETAJACKSON(TX),REFUGIO(TX) BROOKSHIRE WALLER(TX)
GIDDINGSBASTROP(TX),MILAM(TX),GONZALES(TX) KOONTZ VICTORIA(TX) THOMPSON FORTBEND(TX)
District7C District8 District8A
Field County Field County Field County
SPRABERRYIRION(TX),REAGAN(TX),UPTON(TX) SPRABERRY
ANDREWS(TX),CRANE(TX),ECTOR(TX),GLASSCOCK(TX),HOWARD(TX),MARTIN(TX),MIDLAND(TX) WASSON
GAINES(TX),YOAKUM(TX)
LINIRION(TX),CROCKETT(TX),REAGAN(TX) YATES PECOS(TX) KELLY-SNYDER SCURRY(TX)
CROSSETT,S. CROCKETT(TX) PHANTOMLOVING(TX),REEVES(TX),WARD(TX) SLAUGHTER
COCHRAN(TX),HOCKLEY(TX),TERRY(TX)
MCELROY UPTON(TX) WOLFBONELOVING(TX),PECOS(TX),REEVES(TX) SEMINOLE GAINES(TX)
HOLTRANCHCROCKETT(TX),SCHLEICHER(TX) GOLDSMITH ANDREWS(TX),ECTOR(TX) LEVELLAND
COCHRAN(TX),HOCKLEY(TX)
NOELKE CROCKETT(TX),IRION(TX) MCELROY CRANE(TX) ROBERTSON,N. GAINES(TX)
KETCHUMMT. IRION(TX) FULLERTON ANDREWS(TX) SALTCREEK KENT(TX)
SUGGRANCHIRION(TX),TOMGREEN(TX)
FUHRMAN-MASCHO ANDREWS(TX) ANTON-IRISH
HALE(TX),LAMB(TX),LUBBOCK(TX)
AMACKER-TIPPET,SW UPTON(TX) MEANS ANDREWS(TX) WASSON72
GAINES(TX),YOAKUM(TX)
FARMERCROCKETT(TX),REAGAN(TX) WARD-ESTES,N. WARD(TX),WINKLER(TX) JO-MILL
BORDEN(TX),DAWSON(TX)
Page 25 of 35
AnalysisoftheDataThe RRC district 1 GOR data are shown in Figures 1 (top five oil producing counties) and 7 (top ten oil producing fields). From Figure 1 it is seen that the GORs increased for the top five counties in this district during the period 2012 to 2016. An increase in GOR can be the result of an increase in gas or decrease in oil production or a proportionately greater increase in gas production relative to the increase in oil production. The variation in the increase in county GORs ranged from about 200 SCFB (Atascosa and McMullen counties) to more than 1,500 SCFB (Dimmit county). From Figure 7, it is seen that the oil production increased in only the Eagleville and Briscoe Ranch fields. The other fields have much smaller annual production but none appear to have decreased. The GORs for six (Luling-Branyon, Comanche-Halsell, Sacatosa, Darst Creek, Salt Flat, and Giddings) of the top 10 fields in this district remained approximately constant over this five-year period and increased for only four (Eagleville, Pearsall, Briscoe Ranch, and A. W. P.) of the fields, with the A. W. P. field varying by more than 2,000 SCFB over the five year period. The GOR data for RRC district 2 as shown in Figures 2 (top five oil producing counties) and 8 (top ten oil producing fields), reflects gas production activity across the district with the GOR increasing more than 700 SCFB in Dewitt county (Eagleville and Dewitt fields). It is observed that four of the counties’ (Dewitt, Karnes, Lavaca and Live Oak) GOR increased during the five-year period. The Lake Pasture field as seen in Figure 8 has seen significant fluctuation, varying over a range of about 4,000 SCFB during the five-year period. No other fields in this district’s top ten fields varied near as much. Oil production is also shown in Figure 8 for the top ten oil producing fields. The Eagleville field has clearly outpaced the others peaking at annual production of more than 170 MMBBL. The GOR data for RRC district 3 as shown in Figures 3 (top five oil producing counties) and 9 (top ten oil producing fields), indicates some gas production in most counties, the largest GOR being in Madison county (3,100 SCFB). The GOR showed moderate variability over the five-year period on a field basis with the exception of the Giddings field. The Giddings field as seen in Figure 9 saw a GOR decrease of more than 1,500 SCFB during the five-year period. There was significant variability in the other top ten fields in this district but not to the degree of the Giddings field. Oil Production is also shown in Figure 9 for the top ten oil producing fields. The Giddings field has led the other fields peaking at annual production of more than 6 MMBBL followed closely by the Aguila Vado field with peak annual production of about 5.4 MMBBL. The GOR data for RRC district 7C as shown in Figures 4 (top five oil producing counties) and 10 (top ten oil producing fields), has shown minor variability during the eleven-year period except for Irion county, which varied by more than 7,000 SCFB. The Holt Ranch, Amacker-Tippet, SW, and Lin fields saw the greatest range of variability of the top ten fields in this district by about 10,000 SCFB, 4,000 SCFB and more than 6,000 SCFB, respectively. Oil production is also shown in Figure 10 for the top ten oil producing fields. The Spraberry field has clearly led the other fields peaking at annual production of more than 54 MMBBL, followed closely by the Lin Field with peak annual production of about 22 MMBBL. The GOR data for RRC district 8 as shown in Figures 5 (top five oil producing counties) and 11 (top ten oil producing fields), shows great variability throughout the district. The two counties
Page 26 of 35
with the greatest range of variability are Crane and Pecos counties, with GOR variability of 1,500 SCFB and 1,900 SCFB, respectively during the eleven-year period. The Yates and Phantom fields as shown in Figure 11 experienced the greatest GOR variability with more than 2,200 SCFB and 1,900 SCFB, respectively, range of variation followed by the Goldsmith and Ward-Estes, N. fields with about 1,800 SCFB and almost 1,400 SCFB, respectively. While there was some variability in all the top ten fields in this district, none was as great as these fields. Oil production is also shown in Figure 11 for the top ten oil producing fields. The Spraberry field has clearly led the other fields peaking at an annual production of more than 130 MMBBL followed by the Phantom Field with peak annual production of about 45 MMBBL. The GOR data for RRC district 8A as shown in Figures 6 (top five oil producing counties) and 12 (top ten oil producing fields), shows significant variability in GOR during the eleven-year period, with Scurry county showing an increase in GOR more than 1,000 SCFB. The Kelly-Snyder and Salt Creek fields as seen in Figure 12 saw the greatest variability in GOR of the top ten fields in this district with variability of about 1,400 SCFB and more than 1,000 SCFB, respectively. The other fields in this district experienced minimal variability in GOR during this period. Oil production is also shown in Figure 12 for the top ten oil producing fields. The Wasson field has led the other fields peaking at annual production of about 22 MMBBL, followed closely by the Kelly-Snyder field with peak annual production of about 12 MMBBL.
Page 27 of 35
ConclusionsandRecommendations There are no publicly available crude oil assay databases of oil extracted from the ground at production sites in Texas. There are multiple reasons why these data may not be publicly available: this information can be costly to obtain on a routine basis, and is not needed for most normal petroleum refining operations. The Texas Railroad Commission (RRC) collects monthly oil and gas production data from every oil and gas lease in Texas and makes it publicly available. Later year’s data are easier to access than earlier years. An oil lease may contain several wells, so crude oil production data reported to the Texas RRC is only indicative of a single well’s production when there is only one producing oil well on a lease. There is a one-to-one correspondence between a gas well’s production and the lease production data reported to the Texas RRC. Neither crude oil or gas composition nor the API data are reported to the Texas RRC as part of the monthly production data reported to the Texas RRC by oil and gas producers in Texas. The Texas Comptroller’s office collects monthly the same production data as the Texas RRC. It also collects API data for the liquid hydrocarbon production reported. It is helpful to know that this data is reported and where it can be obtained for future work. The quality of these data should be assessed prior to use in future work. Using the monthly production data for the period 2006 to 2016, gas/oil ratios (GORs) were calculated and examined for trends in the data. The GOR data graphed in Figures 1 through 12 show that the GOR did not remain constant for most of the oil producing leases in RRC districts 1, 2, 3, 7C, 8 and 8A during the 2006 to 2016 period examined in this study. While determining the exact reason for these variations was not part of the study, it must be assumed they were economically strategic in nature. Accurate prediction of flash tank hydrocarbon and VOC emissions requires crude oil assays of the oil to be produced and a working knowledge of the production site’s operations. The GOR variations examined in this study cannot be used alone to improve prediction of the rate of flash tank hydrocarbon or VOC emissions or the nature of variability of the emissions profile at oil production sites over the life of the well. Further study should be conducted to determine if the API gravity of the crude oil extracted from the ground and the API gravity exiting the flash tank can be related to the flash tank emissions rate. While the API gravity cannot by itself be used to predict flash tank emissions rate and profile, the measurement of the API gravity is a much easier and less expensive measurement to make than obtaining a crude oil assay and it may provide one parameter needed in improving emissions estimates.

Page 28 of 35
References American Petroleum Institute (API) August 2016, Main Website, http://www.api.org/, Accessed: July and August 2016. Barefoot, C., March 2017, Drillinginfo, Inc, , March 28, 2017, Personal Communication. Barriol, Y., et al, 2005, The Pressures of Drilling and Production, Oilfield Review, Autumn 2005. Beeler, C., August 2016, U. S. Environmental Protection Agency, Region 8, Email August 8, 2016. California Environmental Protection Agency (CARB), October 2016, Air Resources Board Website, https://www.arb.ca.gov/homepage.htm, Accessed: September and October 2016. Colorado Oil & Gas Conservation Commission (COGCC), October 2016, COGIS Website, http://cogcc.state.co.us/data.html#/cogis, Accessed: September and October 2016. Drillinginfo, Inc, June 2017, Historical Liquid Gravity and Oil & Gas Production Data for Texas RRC Districts 1, 2, 3, 7C, 8 and 8A, electronic transfer of data, June 8, 2017. Eastern Research Group, Inc., October 2012, Condensate Tank Oil and Gas Activities, October 10, 2012, ERG No. 0292.01.011.001. Environ International Corporation, August 2010, Upstream Oil and Gas Tank Emissions Measurements, Environ Project No06-17477X. Freyss, H., et al, !989, PVT Analysis for Oil Reservoirs, The Technical Review, Vol. 37, No.1. January 1989. Friedrich, A., November 2016, Haverly Systems, November 30, 2016, Personal Communication. Hy-Bon Engineering Company, July 2009, Upstream Oil and Gas Storage Tank Project Flash Emissions Models Evaluation, July 16, 2009, https://www.tceq.texas.gov/airquality/airmod/project/pj_report_ei.html, Accessed: October 1, 2016. Kipper, J., January 2017, Associate Director, Texas Bureau of Economic Geology, Email January 16, 2017. Schlumberger, October 2016, Oilfield Glossary, http://www.glossary.oilfield.slb.com/ , Accessed: October 1, 2016. Smith, S., June 2017, Texas Comptroller’s Office Examiner, June 19, 2017, Personal Communication.

Page 29 of 35
Texas Bureau of Economic Geology (BEG), October 2016, Public Resources Website, http://www.beg.utexas.edu/public-resources, Accessed: September and October 2016. Texas Commission on Environmental Quality, May 2012, “Calculating Volatile Organic Compounds (VOC) Flash Emissions from Crude Oil and Condensate Tanks at Oil and Gas Production Sites”, APDG 5942, May 2012, http://www.tceq.texas.gov/assets/public/permitting/air/Guidance/NewSourceReview/guidance_flashemission.pdf Texas Railroad Commission, November 2016, Production Data Query Website, http://webapps2.rrc.texas.gov/EWA/ewaPdqMain.do, Accessed: November 15, 2016. URS Corporation, April 2009, VOC Emissions from Oil and Condensate Storage Tanks, October 31, 2006, Revised April 2, 2009, https://www.tceq.texas.gov/airquality/airmod/project/pj_report_ei.html, Accessed: October 1, 2016. U.S. Department of Commerce National Technology Reports Library (NTRL), October 2016, Main Website, https://ntrl.ntis.gov/NTRL/, Accessed: September and October 2016. U.S. Department of Energy (DOE-a), September 2016, Office of Fossil Energy Website, https://energy.gov/fe/office-fossil-energy, Accessed: August and September 2016. U.S. Department of Energy (DOE-b), September 2016, Crude Oil Characteristics Research Website, https://energy.gov/fe/articles/crude-oil-characteristics-research, Accessed: September 2016. U.S. Department of Energy National Energy Technology Laboratory (NETL), September 2016, Databases Website, https://www.netl.doe.gov/research/oil-and-gas/software/databases, Accessed: August and September 2016. U.S. Energy Information Administrations (EIA-a), June 2017, Definitions, Sources and Explanations on Website, https://www.eia.gov/dnav/pet/tbldefs/pet_pri_wco_tbldef2.asp, Accesed: June 29, 2017. U.S. Energy Information Administration (EIA-b), September 2016, Crude Oil Production Website, https://www.eia.gov/petroleum/production/, Accessed: August and September 2016. U.S. Environmental Protection Agency (EPA), February 2016, Technical Overview of Volatile Organic Compounds, available at https://www.epa.gov/indoor-air-quality-iaq/technical-overview-volatile-organic-compounds#definition, accessed February 2016. Vo, H. and R. Horne, September 2011, Composition Variation During Flow of Gas-Condensate Wells, Final Report, Project No. 07122-29, Department of Energy, National Technology Energy Laboratory, September 2011

Page 30 of 35
Western Regional Air Partnership (WRAP), August 2016, Homepage, https://www.wrapair2.org/NatOilGas.aspx, Accessed: August and September 2016. York, JoLynne, Website Support Specialist, August 2016, Texas Railroad Commission, Email Communication.

Page 31 of 35
Appendices
Page 32 of 35
AppendixA
TexasRailroadCommissionDistricts

Page 33 of 35

Page 34 of 35
AppendixB
OilandGasProductionDataFiles
Page 35 of 35
The oil and gas production data files used in this report are too voluminous to print with this report. However, an electronic copy of the data files may be obtained by contacting the TCEQ Project Manager.