Embed Size (px)
Citation preview

8/3/2019 Pew Global Attitudes Balance of Power U.S. Image Report FINAL July 13 2011
http://slidepdf.com/reader/full/pew-global-attitudes-balance-of-power-us-image-report-final-july-13-2011 1/160
WEDNESDAY, JULY 13, 2011, 9PM EDT
U.S. Favorability Ratings Remain Positive
China Seen Overtaking U.S. as GlobalSuperpower
23- Na t ion Pew Globa l At t i t u des Surv ey
Pew Global Attitudes Project:
Andrew Kohut,
President, Pew Research Center
Richard Wike, Associate Director
Juliana Menasce Horowitz,
Senior Researcher
Jacob Poushter, Research Analyst
Cathy Barker, Research Assistant
Pew Research Center:
James Bell,
Director of International Survey Research,
Pew Research Center
Elizabeth Mueller Gross,
Vice President, Pew Research Center
For Media Inquiries Contact:
Richard Wike
Vidya Krishnamurthy
202.419.4372
http://pewglobal.org

8/3/2019 Pew Global Attitudes Balance of Power U.S. Image Report FINAL July 13 2011
http://slidepdf.com/reader/full/pew-global-attitudes-balance-of-power-us-image-report-final-july-13-2011 2/160
July 13, 2011
TABLE OF CONTENTS
Copyright © 2011 Pew Research Center
www.pewresearch.org
PAGE
Overview: China Seen Overtaking U.S. as Global
Superpower 1
About the Project 11
Roadmap to the Report 12
Chapter 1: The Global Balance of Power 14
Chapter 2: Views of the U.S. and American Foreign Policy 20
Chapter 3: Global Opinion of President Barack Obama 29
Chapter 4: Views of China 36
Chapter 5: Economic Issues 42
Chapter 6: Views of Iran 51
Chapter 7: Ratings of World Leaders 55
Chapter 8: Rating Countries and Institutions 61
Survey Methods 67
Survey Topline 77

8/3/2019 Pew Global Attitudes Balance of Power U.S. Image Report FINAL July 13 2011
http://slidepdf.com/reader/full/pew-global-attitudes-balance-of-power-us-image-report-final-july-13-2011 3/160
1
U.S. Favorability Ratings Remain PositiveChina Seen Overtaking U.S. as Global Superpower
In most regions of the world, opinion of the
United States continues to be more favorable
than it was in the Bush years, but U.S. image
now faces a new challenge: doubts about
America’s superpower status. In 15 of 22
nations, the balance of opinion is that China
either will replace or already has replaced the
United States as the world’s leading
superpower. This view is especially
widespread in Western Europe, where at least
six-in-ten in France (72%), Spain (67%),
Britain (65%) and Germany (61%) see China
overtaking the U.S.
Majorities in Pakistan, the Palestinian
territories, Mexico and China itself also foresee
China supplanting the U.S. as the world’sdominant power. In most countries for which
there are trends, the view that China will
overtake the U.S. has increased substantially
over the past two years, including by 10 or
more percentage points in Spain, France,
Pakistan, Britain, Jordan, Israel, Poland and
Germany. Among Americans, the percentage
saying that China will eventually overshadow
or has already overshadowed the U.S. has
increased from 33% in 2009 to 46% in 2011.
At least some of this changed view of the global balance of power may reflect the fact that
the U.S. is increasingly seen as trailing China economically. This is especially the case in
Western Europe, where the percentage naming China as the top economic power has
increased by double digits in Spain, Germany, Britain and France since 2009.
Will China Replace U.S. as World’sLeading Superpower?
Hasalready
replacedU.S.
Willeventually
replaceU.S.
Total hasor will
replaceU.S.
Willnever
replaceU.S.
% % % %
U.S. 12 34 46 45
France 23 49 72 28
Spain 14 53 67 30
Britain 11 54 65 26
Germany 11 50 61 34
Poland 21 26 47 31
Russia 15 30 45 30
Lithuania 11 29 40 40
Ukraine 14 23 37 36
Turkey 15 21 36 41
Palest. ter. 17 37 54 38
Jordan 17 30 47 45
Israel 15 32 47 44
Lebanon 15 24 39 54
China 6 57 63 17
Pakistan 10 47 57 10
Japan 12 25 37 60
Indonesia 8 25 33 46
India 13 19 32 17
Mexico 19 34 53 31
Brazil 10 27 37 47
Kenya 7 37 44 43
Not asked in Egypt.
PEW RESEARCH CENTER Q28.

8/3/2019 Pew Global Attitudes Balance of Power U.S. Image Report FINAL July 13 2011
http://slidepdf.com/reader/full/pew-global-attitudes-balance-of-power-us-image-report-final-july-13-2011 4/160
Pew Research Center’s Global Attitudes Project – www.pewglobal.org
2
In other parts of the globe, fewer are convinced
that China is the world’s leading economic
power. Majorities or pluralities in Eastern
Europe, Asia, and Latin America still name theU.S. as the world’s dominant economic power.
In the Middle East, Palestinians and Israelis
agree that America continues to sit atop the
global economy, while in Jordan and Lebanon
more see China in this role. Notably, by an
almost 2-to-1 margin the Chinese still believe
the U.S. is the world’s dominant economic
power.
These are among the key findings from a survey by the Pew Research Center’s Global Attitudes Project, conducted March 18 to May 15.1 The survey also finds that, in the U.S.,
France, Germany, Spain and Japan, those who see China as the world’s leading economic
power believe this is a bad thing. By contrast, those who name the U.S. tend to think it is
good that America is still the top global economy. In developing countries those who
believe China has already overtaken the U.S. economically generally view this as a
positive development. Meanwhile, in China, those who believe the U.S. is still the
world’s leading economy tend to see this as a negative.
Compared with reaction to China’s economic rise, global opinion is more consistently
negative when it comes to the prospect of China equaling the U.S. militarily. Besides the
Chinese themselves, only in Pakistan, Jordan, the Palestinian territories and Kenya do
majorities see an upside to China matching the U.S. in terms of military power.
Meanwhile, the prevailing view in Japan and India is that it would not be in their
country’s interest if China were to equal the U.S. militarily; majorities across Western
and Eastern Europe, and in Turkey and Israel, share this view.
1 Throughout this report results for Pakistan are from interviews conducted in May 2011, following the death of Osamabin Laden. In all other countries, interviews were concluded in April 2011. A survey was also conducted in Pakistan priorto bin Laden’s death. For more information, see ” U.S. Image in Pakistan Falls No Further Following bin Laden Killing,” June 21, 2011.
More Western Europeans
Convinced China Is World’s
Leading Economy
Name China as world’s leadingeconomic power
2009 2010 201109-11Change
% % %
Spain 22 34 49 +27
Germany 28 51 48 +20
Britain 34 44 47 +13
France 35 47 47 +12
PEW RESEARCH CENTER Q26.

8/3/2019 Pew Global Attitudes Balance of Power U.S. Image Report FINAL July 13 2011
http://slidepdf.com/reader/full/pew-global-attitudes-balance-of-power-us-image-report-final-july-13-2011 5/160
Pew Research Center’s Global Attitudes Project – www.pewglobal.org
3
U.S. Image Largely Favorable
Despite the view in many
countries that China eitherhas or will surpass the U.S.
as the leading superpower,
opinion of America remains
favorable, on balance. The
median percentage offering a
positive assessment of the
U.S. is 60% among the 23
countries surveyed. The U.S.
receives high marks in
Western Europe, where atleast six-in-ten in
France, Spain, Germany and
Britain rate the U.S.
positively. Opinion of the
U.S. is also consistently
favorable across Eastern
Europe, as well as in Japan,
Kenya, Israel, Brazil and
Mexico.
As in years past, U.S. image
continues to suffer among
predominantly Muslim
countries, with the exception
of Indonesia, where a
majority expresses positive
views of the U.S. One-in-five or fewer in Egypt, the Palestinian territories, Jordan,
Pakistan and Turkey view America favorably. In Lebanon, opinion of the U.S. is split,
reflecting a religious and sectarian divide; the country’s Shia community hasoverwhelmingly negative views of America, while Lebanese Sunnis and Christians are
more positive.
Views of the U.S. in the Muslim world reflect, at least in part, opposition to the war in
Afghanistan and U.S. efforts to fight terrorism. Moreover, few in predominantly Muslim
U.S. Favorability Rating
1999/
2000 2002 2003 2005 2006 2007 2008 2009 2010 2011
% % % % % % % % % %
U.S. -- -- -- 83 76 80 84 88 85 79
Britain 83 75 70 55 56 51 53 69 65 61
France 62 62 42 43 39 39 42 75 73 75
Germany 78 60 45 42 37 30 31 64 63 62
Spain 50 -- 38 41 23 34 33 58 61 64
Lithuania -- -- -- -- -- -- -- -- -- 73
Poland 86 79 -- 62 -- 61 68 67 74 70
Russia 37 61 37 52 43 41 46 44 57 56
Ukraine 70 80 -- -- -- 54 -- -- -- 60
Turkey 52 30 15 23 12 9 12 14 17 10
Egypt -- -- -- -- 30 21 22 27 17 20
Jordan -- 25 1 21 15 20 19 25 21 13
Lebanon -- 36 27 42 -- 47 51 55 52 49
Palest. ter. -- -- 0 -- -- 13 -- 15 -- 18
Israel -- -- 78 -- -- 78 -- 71 -- 72
China -- -- -- 42 47 34 41 47 58 44
India -- -- -- -- -- -- -- -- -- 41
Indonesia 75 61 15 38 30 29 37 63 59 54
Japan 77 72 -- -- 63 61 50 59 66 85
Pakistan 23 10 13 23 27 15 19 16 17 12
Brazil -- -- -- -- -- -- -- -- 62 62Mexico 68 64 -- -- -- 56 47 69 56 52
Kenya 94 80 -- -- -- 87 -- 90 94 83
1999/2000 survey trends provided by the U.S. Department of State.
Survey results are based on national samples except in China. See the SurveyMethods section for more information.
PEW RESEARCH CENTER Q3a.

8/3/2019 Pew Global Attitudes Balance of Power U.S. Image Report FINAL July 13 2011
http://slidepdf.com/reader/full/pew-global-attitudes-balance-of-power-us-image-report-final-july-13-2011 6/160
Pew Research Center’s Global Attitudes Project – www.pewglobal.org
4
countries say the U.S. takes a multilateral approach to foreign policy. Fewer than a
quarter in Lebanon, Jordan, Egypt, Pakistan and Turkey say the U.S. takes the interests
of countries like theirs into account when making foreign policy decisions.
In Western Europe, fewer than half in Britain (40%), France (32%) and Spain (19%) say
the U.S. takes the interests of other countries into account when making foreign policy
decisions. Only in Germany does a majority feel otherwise. In Eastern Europe, a third
or less believe America acts multilaterally.
Interestingly, a majority of Chinese (57%) credit America with considering the interests
of other nations, although last year more (76%) held this view. Elsewhere, majorities in
Israel, India, Japan, Brazil and Kenya describe the U.S. as multilateral in its approach to
foreign policy.
Majorities or pluralities in nearly every country
surveyed say the U.S. and NATO should
remove their troops from Afghanistan as soon
as possible; the only exceptions are Spain,
Israel, India, Japan and Kenya, where more
say troops should remain in that country until
the situation is stabilized than say they should
be removed. However, in many parts of the
world, there is strong support for the broader,
American-led effort to combat terrorism.
About seven-in-ten in France (71%), two-thirds
in Germany, 59% in Britain and 58% in Spain
back U.S. anti-terrorism efforts. Majorities in
Eastern Europe also support the U.S.-led fight
against terrorism, as do most in Israel and Kenya.
Western European Views on
Afghanistan and Anti-Terrorism
Efforts
U.S., NATO troops
in Afghanistan
U.S.-led effort
to fight terrorism
Keeptroops
Removetroops Favor Oppose
% % % %
Britain 41 51 59 32
France 41 58 71 29Germany 41 58 67 30
Spain 51 44 58 38
PEW RESEARCH CENTER Q52 & Q62.

8/3/2019 Pew Global Attitudes Balance of Power U.S. Image Report FINAL July 13 2011
http://slidepdf.com/reader/full/pew-global-attitudes-balance-of-power-us-image-report-final-july-13-2011 7/160
Pew Research Center’s Global Attitudes Project – www.pewglobal.org
5
U.S. Viewed More Favorably Than China
Across the nations surveyed,
the U.S. generally receivesmore favorable marks than
China: the median
percentage rating China
favorably is 52%, eight points
lower than the median
percentage offering a positive
assessment of the U.S.
However, the number of
people expressing positive views of China has grown in
a number of countries,
including the four Western
European countries
surveyed. China’s image has
also improved in Indonesia,
Japan, Egypt and Poland.
Opinion of China has
worsened substantially in
only two countries surveyed:
Kenya (down 15 percentage
points from last year) and
Jordan (9 points lower than
in 2010).
U.S. image, meanwhile, has declined in most countries for which there are trends.
Compared with last year, favorable views of America are lower in Kenya (11 percentage
points), Jordan (8 points), Turkey (7 points), Indonesia (5 points), Pakistan (5 points),
Mexico (4 points), Poland (4 points) and Britain (4 points). However, the largestdownward shift has occurred in China, where the number expressing a positive view of
the U.S. has fallen 14 points – from 58% in 2010 to 44% today.
In Japan, by contrast, opinion of the U.S. has improved dramatically. A year ago,
roughly two-thirds (66%) held a favorable view of America; today, more than eight-in-
Views of U.S. and ChinaU.S. Favorability China Favorability
2010 2011 Change 2010 2011 Change
% % % %
U.S. 85 79 -6 49 51 +2
Britain 65 61 -4 46 59 +13
France 73 75 +2 41 51 +10
Germany 63 62 -1 30 34 +4
Spain 61 64 +3 47 55 +8
Lithuania -- 73 -- -- 52 --
Poland 74 70 -4 46 51 +5
Russia 57 56 -1 60 63 +3
Ukraine -- 60 -- -- 63 --
Turkey 17 10 -7 20 18 -2
Egypt 17 20 +3 52 57 +5
Jordan 21 13 -8 53 44 -9
Lebanon 52 49 -3 56 59 +3
Palest. ter. -- 18 -- -- 62 --
Israel -- 72 -- -- 49 --
China 58 44 -14 97 95 -2
India -- 41 -- -- 25 --
Indonesia 59 54 -5 58 67 +9
Japan 66 85 +19 26 34 +8
Pakistan 17 12 -5 85 82 -3
Brazil 62 62 0 52 49 -3
Mexico 56 52 -4 39 39 0
Kenya 94 83 -11 86 71 -15
PEW RESEARCH CENTER Q3a & Q3c.

8/3/2019 Pew Global Attitudes Balance of Power U.S. Image Report FINAL July 13 2011
http://slidepdf.com/reader/full/pew-global-attitudes-balance-of-power-us-image-report-final-july-13-2011 8/160
Pew Research Center’s Global Attitudes Project – www.pewglobal.org
6
ten (85%) assess the U.S. favorably. This huge boost in U.S. image is attributable in part
to America’s role in helping Japan respond to the devastating earthquake and tsunami
that struck the island nation’s northeast coast in March. A majority (57%) of Japanese
say the U.S. has done a great deal to assist their country in responding to this dualdisaster.
Views of Obama
Assessments of President Obama track fairly closely with
overall U.S. ratings. Obama is viewed most positively in
Western Europe, where solid majorities say they have
confidence in the U.S. president to do the right thing when it
comes to world affairs. At least two-thirds in Kenya, Japan andLithuania also express confidence in Obama, as do smaller
majorities in Brazil, Indonesia and Poland.
As is the case with the overall U.S. image, Obama receives his
most negative ratings among predominantly Muslim countries.
In the Arab world, majorities in the Palestinian territories
(84%), Jordan (68%), Egypt (64%) and Lebanon (57%) lack
confidence in the president. Roughly seven-in-ten in Turkey
(73%) and Pakistan (68%) say the same. Indonesians are the
exception, with 62% saying they have confidence in Obama to
do the right thing in world affairs.
Overall, the U.S. president continues to inspire more
confidence than any of the other world leaders tested in the
survey. German Chancellor Angela Merkel is next most
trusted, at least in Europe and Israel. Majorities across
Western Europe endorse the German leader’s handling of
world affairs, as do most in Eastern Europe. In fact, in Russia
and Ukraine she is more trusted than Obama; this is also thecase in Israel.
Broad trust in Obama’s leadership does not mean foreign publics necessarily agree with
the U.S. president’s policies. For example, in nearly every nation surveyed majorities or
pluralities disapprove of Obama’s handling of the Israeli-Palestinian conflict. Many also
Confidence in Obama
A lot/Some
Not much/None
% %
U.S. 61 38
Germany 88 12
France 84 15
Britain 75 22
Spain 67 32
Lithuania 68 23
Poland 52 32
Russia 41 43
Ukraine 37 42
Turkey 12 73
Israel 49 51
Lebanon 43 57
Egypt 35 64
Jordan 28 68
Palest. ter. 14 84
Japan 81 13
Indonesia 62 35
India 48 11
China 44 33
Pakistan 8 68
Brazil 63 31
Mexico 38 54
Kenya 86 10
PEW RESEARCH CENTER Q48a.

8/3/2019 Pew Global Attitudes Balance of Power U.S. Image Report FINAL July 13 2011
http://slidepdf.com/reader/full/pew-global-attitudes-balance-of-power-us-image-report-final-july-13-2011 9/160
Pew Research Center’s Global Attitudes Project – www.pewglobal.org
7
disapprove of Obama’s handling of Iran and Afghanistan, while reactions to the way he
has dealt with the recent calls for political change in the Middle East are mixed.
In general, Obama receives his highest marks for his handling of global economicproblems. Majorities across Western Europe, for example, endorse Obama’s approach to
economic issues, with the highest approval (68%) found in Germany. Large numbers in
Kenya, Japan, Indonesia, Brazil and Lithuania also approve of how the U.S. president is
dealing with the challenges facing the global economy.
Reactions to China’s Growing Power
Across the globe, public reactions to China’s
growing economy are far more positive thanopinions about the country’s growing military
power. Positive assessments of China’s
growing economy are most widespread in the
Middle East, where majorities in the Arab
countries surveyed, as well as Israel, agree that
China’s economic growth benefits their
country.
Most in Kenya, Pakistan, Indonesia, Japan,
Britain, Brazil and Spain also say China’s
growing economy is good for their country.
Within Asia, only Indians offer negative views,
with just 29% describing an expanding
Chinese economy as a good thing and 40%
saying it is a bad thing for their country.
When China’s emerging power is framed in
military terms, publics in most surveyed
nations react less favorably. Majorities orpluralities in all but four of the nations
surveyed say China’s increasing military might
is a bad thing for their country. This is
especially the case in Japan, the U.S., Western
Europe and Russia, where at least seven-in-ten
How China’s Growing PowerAffects Your Country
Growingmilitary power
Growingeconomy
Goodthing
Badthing
Goodthing
Badthing
% % % %
U.S. 11 79 37 53
Britain 13 71 53 32
France 16 83 41 59
Germany 12 79 46 50
Spain 12 74 52 40
Lithuania 11 62 47 27Poland 13 68 32 46
Russia 12 74 37 41
Ukraine 12 57 37 33
Turkey 9 66 13 64
Jordan 28 52 65 28
Lebanon 24 57 57 29
Palest. ter. 62 29 66 24
Israel 19 66 53 30
India 22 50 29 40
Indonesia 44 36 62 25
Japan 7 87 57 35
Pakistan 72 5 79 5
Brazil 29 51 53 30
Mexico 26 55 39 43
Kenya 62 29 85 12
Not asked in Egypt.
PEW RESEARCH CENTER Q63 & Q64.

8/3/2019 Pew Global Attitudes Balance of Power U.S. Image Report FINAL July 13 2011
http://slidepdf.com/reader/full/pew-global-attitudes-balance-of-power-us-image-report-final-july-13-2011 10/160
Pew Research Center’s Global Attitudes Project – www.pewglobal.org
8
have negative views of China’s growing military power.
In contrast, about seven-in-ten Pakistanis (72%) see China’s growing military might as a
good thing for their country, as do 62% of Kenyans and Palestinians. Indonesians, by aslim margin (44% to 36%), concur with this view.
Economic Concerns
Opinions as to whether the U.S. or China is the world’s leading
economic power, and whether China will supplant America as
the dominant superpower, are taking shape against a backdrop
of widespread uncertainty about the future and unhappiness
with economic conditions at home. In most of the nationssurveyed, people say their country’s economy is in bad shape
and express dissatisfaction with the way things are going in
their country. Moreover, few expect economic conditions to
improve in the next year.
Frustration is especially intense in Pakistan, where roughly
nine-in-ten say they are displeased with the way things are
going in their country, but large majorities across the globe are
also dissatisfied. For example, in Spain, dissatisfaction with
the country’s direction is at its highest level (83%) since 2003.
Meanwhile, the number of Americans who think their country
is headed in the wrong direction has swelled from 62% to 73%
over the past year.
Only in a handful of countries do more than half express
satisfaction with their country’s direction. Among these
exceptions are China, Brazil, and India – all dynamic, emerging
economic powerhouses, regionally and globally. In Egypt, too,
there is substantial satisfaction with the country’s direction(65%), likely reflecting renewed optimism about the country’s
future, following the democratic uprising earlier this year.
In many instances, levels of overall satisfaction are linked to
assessments of the economy. In the U.S., France, Britain and Spain, eight-in-ten or more
Few Upbeat About
Country Direction or
Economy
Satisfiedwithcountrydirection
Goodcurrenteconomicsituation
% %
U.S. 21 18
Britain 32 15
France 25 17
Germany 43 67
Spain 15 10
Lithuania 14 9
Poland 30 26
Russia 32 29
Ukraine 9 6Turkey 48 49
Egypt 65 34
Jordan 44 33
Lebanon 11 13
Palest. ter. 13 35
Israel 39 54
China 85 88
India 51 56
Indonesia 36 38
Japan 25 10
Pakistan 6 12
Brazil 52 54
Mexico 22 30
Kenya 19 26
PEW RESEARCH CENTER Q2 & Q4.

8/3/2019 Pew Global Attitudes Balance of Power U.S. Image Report FINAL July 13 2011
http://slidepdf.com/reader/full/pew-global-attitudes-balance-of-power-us-image-report-final-july-13-2011 11/160
Pew Research Center’s Global Attitudes Project – www.pewglobal.org
9
offer a negative assessment of the national economy, and majorities in these countries
see rising prices and a lack of jobs as very big problems.
Inflation worries are especially pronounced outside the industrialized West.Overwhelming majorities in Pakistan, Kenya, Lebanon, the Palestinian territories, India
and Indonesia describe price increases as a major problem. In Spain, Britain and the
U.S., unemployment weighs more heavily than rising prices on the minds of average
citizens.
The Chinese public is the most upbeat about economic conditions, with nearly nine-in-
ten describing the domestic economy as good. In Germany, two-thirds echo this view,
while smaller majorities in India, Israel and Brazil favorably assess the economic
situation in their country.
Inflation and a lack of job opportunities are also seen as less urgent issues among
Chinese and German respondents. In Germany, for instance, only about a third of the
public describes either price increases or unemployment as very big problems. In China,
37% say a lack of jobs is a major concern, while about half are worried about inflation.
Despite economic concerns, publics in all regions express substantial support for
growing international trade and business ties with other countries. No fewer than two-
thirds in each country say increased international trade is very or somewhat good for
their country.
Also of Note:
• Among those who describe the economic situation in their country as bad, most
place the primary blame on government. To a greater degree than others,
Western Europeans fault banks and other financial institutions for economic
troubles at home, with as many as 75% of those who say the economy is bad in
Britain and Spain taking this view.
• Worldwide, people tend to blame outside forces, rather than individuals
themselves for unemployment in their country. In Western Europe and the U.S.,
roughly seven-in-ten or more attribute unemployment to forces beyond the
control of individuals.
8/3/2019 Pew Global Attitudes Balance of Power U.S. Image Report FINAL July 13 2011
http://slidepdf.com/reader/full/pew-global-attitudes-balance-of-power-us-image-report-final-july-13-2011 12/160
Pew Research Center’s Global Attitudes Project – www.pewglobal.org
10
• The United Nations generally receives positive marks among the 23 nations
surveyed. However, opinion of the international body is negative in Israel (69%),
the Palestinian territories (67%), Jordan (64%) and Turkey (61%).
• In most predominantly Muslim countries there is widespread opposition to Iran
acquiring nuclear weapons. Only in Pakistan does a majority (61%) support
Iran’s nuclear ambitions, although significant numbers of Palestinians (38%) and
Lebanese (34%) back Iran’s acquisition of a nuclear arsenal.

8/3/2019 Pew Global Attitudes Balance of Power U.S. Image Report FINAL July 13 2011
http://slidepdf.com/reader/full/pew-global-attitudes-balance-of-power-us-image-report-final-july-13-2011 13/160
11
About the Pew Global Attitudes Project
The Pew Research Center’s Global Attitudes Project conducts public opinion surveys around the
world on a broad array of subjects ranging from people’s assessments of their own lives to their
views about the current state of the world and important issues of the day. The project is directed by Andrew Kohut, president of the Pew Research Center, a nonpartisan “fact tank” in
Washington, DC, that provides information on the issues, attitudes, and trends shaping America
and the world. The Pew Global Attitudes Project is principally funded by The Pew Charitable
Trusts.
The Pew Global Attitudes Project is co-chaired by
former U.S. Secretary of State Madeleine K.
Albright, currently principal, the Albright
Stonebridge Group, and by former Senator John C.
Danforth, currently partner, Bryan Cave LLP.
Since its inception in 2001, the Pew Global Attitudes Project has released numerous major
reports, analyses, and other releases, on topics
including attitudes toward the U.S. and American
foreign policy, globalization, terrorism, and
democracy.
Pew Global Attitudes Project team members
include Richard Wike, Juliana Menasce Horowitz,
Jacob Poushter, and Cathy Barker. Other
contributors to the project include Pew Research
Center staff members Director of International
Survey Research James Bell and Vice PresidentElizabeth Mueller Gross, as well as Neha Sahgal,
Carroll Doherty, and Michael Dimock. Additional
members of the team include Mary McIntosh,
president of Princeton Survey Research Associates International, and Jodie T. Allen. The Pew
Global Attitudes Project team regularly consults with survey and policy experts, regional and
academic experts, journalists, and policymakers whose expertise provides tremendous guidance
in shaping the surveys.
All of the project’s reports and commentaries are available at www.pewglobal.org. The data are
also made available on our website within two years of publication. Findings from the project are
also analyzed in America Against the World: How We Are Different and Why We Are Disliked by
Andrew Kohut and Bruce Stokes, published by Times Books. A paperback edition of the book wasreleased in May 2007.
For further information, please contact:
Richard Wike
Associate Director, Pew Global Attitudes Project
202.419.4400 / [email protected]
Pew Global Attitudes Project
Public Opinion Surveys
Survey Sample Interviews
Summer 2002 44 Nations 38,263
November 2002 6 Nations 6,056
March 2003 9 Nations 5,520
May 2003 21 Publics* 15,948
March 2004 9 Nations 7,765
May 2005 17 Nations 17,766
Spring 2006 15 Nations 16,710
Spring 2007 47 Publics* 45,239
Spring 2008 24 Nations 24,717
Spring 2009 25 Publics* 26,397
Fall 2009 14 Nations 14,760
Spring 2010 22 Nations 24,790Spring 2011 23 Publics* 29,100
* Includes the Palestinian territories.

8/3/2019 Pew Global Attitudes Balance of Power U.S. Image Report FINAL July 13 2011
http://slidepdf.com/reader/full/pew-global-attitudes-balance-of-power-us-image-report-final-july-13-2011 14/160
12
Roadmap to the Report
The first chapter explores the global balance of power, including reactions to the rise of
China as a potential superpower. The second chapter examines international attitudes
toward the United States and its people, including views on American foreign policy,
cooperation with the U.S., and views of specific policies, such as anti-terrorism efforts
and the war in Afghanistan. The next chapter focuses on views about U.S. President
Barack Obama and his policies. Chapter 4 looks at attitudes toward China, its
president, and evaluations of its status as a rising economic and military power.
Chapter 5 explores economic issues, including views toward national conditions,
inflation, unemployment, and trade. Chapter 6 examines views toward Iran while
Chapter 7 looks at ratings of major world leaders. Finally, Chapter 8 focuses on rating
major countries and institutions across the globe. A summary of the survey’s
methodology, followed by complete topline results, can be found at the end of thereport.
Pew Global Attitudes Interactive: Key Indicators Database
With the release of this report, the Pew Global Attitudes Project is also updating its Key
Indicators Database. This interactive database allows users to explore public opinion
trends from countries surveyed by the Pew Global Attitudes Project since 2002,
including the 23 nations in the current survey.
Data can be searched by question, by topic or by country – and results can be displayed
in map, table or chart formats. The database includes findings from this report, as well
as findings from previous Pew Global Attitudes reports.
Explore the database online at: www.pewglobal.org/database
8/3/2019 Pew Global Attitudes Balance of Power U.S. Image Report FINAL July 13 2011
http://slidepdf.com/reader/full/pew-global-attitudes-balance-of-power-us-image-report-final-july-13-2011 15/160
Pew Research Center’s Global Attitudes Project – www.pewglobal.org
13
Previously Released Reports from Spring 2011 Pew Global Attitudes
Project Survey
June 21, 2011
U.S. Image in Pakistan Falls No Further Following bin Laden Killing
Support for Campaign Against Extremists Wanes
June 7, 2011
On Eve of Elections, a More Upbeat Mood in Turkey
PM Erdogan Gets High Marks for Foreign Policy
June 1, 2011
Japanese Resilient, but See Economic Challenges Ahead
U.S. Applauded for Relief Efforts
May 17, 2011
Arab Spring Fails to Improve U.S. Image
Obama’s Challenge in the Muslim World
May 2, 2011
Osama bin Laden Largely Discredited Among Muslim Publics in
Recent Years
April 25, 2011
Egyptians Embrace Revolt Leaders, Religious Parties and Military, As
Well
U.S. Wins No Friends, End of Treaty With Israel Sought

8/3/2019 Pew Global Attitudes Balance of Power U.S. Image Report FINAL July 13 2011
http://slidepdf.com/reader/full/pew-global-attitudes-balance-of-power-us-image-report-final-july-13-2011 16/160
14
40
4744
36
Has already or will eventually replace U.S.
Will never replace U.S.
2009 2011
1. The Global Balance of Power
Many around the world believe the global balance of power is shifting. In 15 of 22
nations, majorities or pluralities say China either will replace or already has replaced theUnited States as the world’s leading superpower.
This view is widespread in many nations where the U.S. is popular, as well as in nations
where anti-Americanism runs high. And it has become considerably more common
across much of the globe over the last two years.
Looking just at the 18 countries surveyed in
both 2009 and 2011, the median percentage
saying China will replace or already has
supplanted the U.S. as the world’s dominantpower increased from 40% in 2009 to 47% two
years later. Meanwhile, the median percentage
saying China will never replace the U.S. fell
from 44% to 36%.
Of course, the U.S. is still the world’s largest
national economy, and majorities or pluralities
in 15 of 22 countries say the U.S. is currently
the top economic power. However, the view
that China occupies the top position is much
more prevalent now than it was in 2009. In
particular, Western Europeans increasingly see
China as the economic frontrunner – and they
generally consider this a negative
development.
In addition to concerns about China’s economic prominence, many in Western Europe
and elsewhere react negatively to the idea of China as a military superpower. Majorities
in most of the nations surveyed say it would be a bad thing if China became as powerfulmilitarily as the U.S. However, this view is not shared everywhere – for instance, more
than six-in-ten Palestinians and at least seven-in-ten Pakistanis and Jordanians would
welcome a world where China’s military strength matched America’s.
More Say China Has or WillReplace U.S.
Median % across 18 countries surveyed in 2009 and 2011.
PEW RESEARCH CENTER Q28.

8/3/2019 Pew Global Attitudes Balance of Power U.S. Image Report FINAL July 13 2011
http://slidepdf.com/reader/full/pew-global-attitudes-balance-of-power-us-image-report-final-july-13-2011 17/160
Pew Research Center’s Global Attitudes Project – www.pewglobal.org
15
Will China Become the Leading Power?
Relatively few people in the countries polled
believe China has already replaced the U.S. asthe leading global superpower, although more
than one-in-five hold this opinion in France
(23%) and Poland (21%). But large numbers in
many countries believe China will eventually
supplant the U.S.
Adding together those who think China either
will or already has overtaken the U.S. produces
solid majorities in Western Europe, and this
view has become much more common since2009. Two-thirds in Spain think China will or
already has become the dominant power, up
from 48% two years ago. Similar increases
have taken place in France (+17 percentage
points) and Britain (+16 points).
Nearly half of Poles (47%, up from 36% in
2009) and Russians (45%) think China has or
will become the leading superpower.
In the Middle East, over the last two years,
Jordanians and Israelis have become much
more likely to see China in the leading role.
Currently, 47% in both countries express this
view, as does a majority of Palestinians (54%).
The percentage of Pakistanis who believe China will replace or has already replaced the
U.S. has also grown significantly, rising from 40% to 57%. Not all of China’s Asian
neighbors believe it will assume the top spot, however. Most Japanese (60%) and aplurality of Indonesians (46%) think China will never replace the U.S.
Similarly, a 47%-plurality of Brazilians says the U.S. will never be replaced by China.
However, a majority (53%) of Mexicans now see China supplanting their neighbor to the
north.
More Say China Has or WillReplace U.S.
% Will or has already replaced U.S.
2009 2011 Change
% %
U.S. 33 46 +13
Spain 48 67 +19
France 55 72 +17
Britain 49 65 +16
Germany 51 61 +10
Poland 36 47 +11
Russia 41 45 +4
Lithuania -- 40 --
Ukraine -- 37 --
Turkey 29 36 +7
Jordan 34 47 +13
Israel 35 47 +12
Palest. ter. 50 54 +4
Lebanon 36 39 +3
Pakistan 40 57 +17
Indonesia 31 33 +2
Japan 35 37 +2
China 67 63 -4
India -- 32 --
Mexico 47 53 +6
Brazil -- 37 --
Kenya 40 44 +4
Not asked in Egypt.
PEW RESEARCH CENTER Q28.
8/3/2019 Pew Global Attitudes Balance of Power U.S. Image Report FINAL July 13 2011
http://slidepdf.com/reader/full/pew-global-attitudes-balance-of-power-us-image-report-final-july-13-2011 18/160
Pew Research Center’s Global Attitudes Project – www.pewglobal.org
16
In China itself, a strong 63%-majority believes their country already has or will become
the leading global power, although this is down slightly from 67% in 2009. The
American public is divided on this issue: 46% think China has or will overtake the U.S.,
while 45% say this will never happen. Republicans (48% never) and Democrats (46%)are slightly more likely than independents (40%) to say China will never replace the U.S.
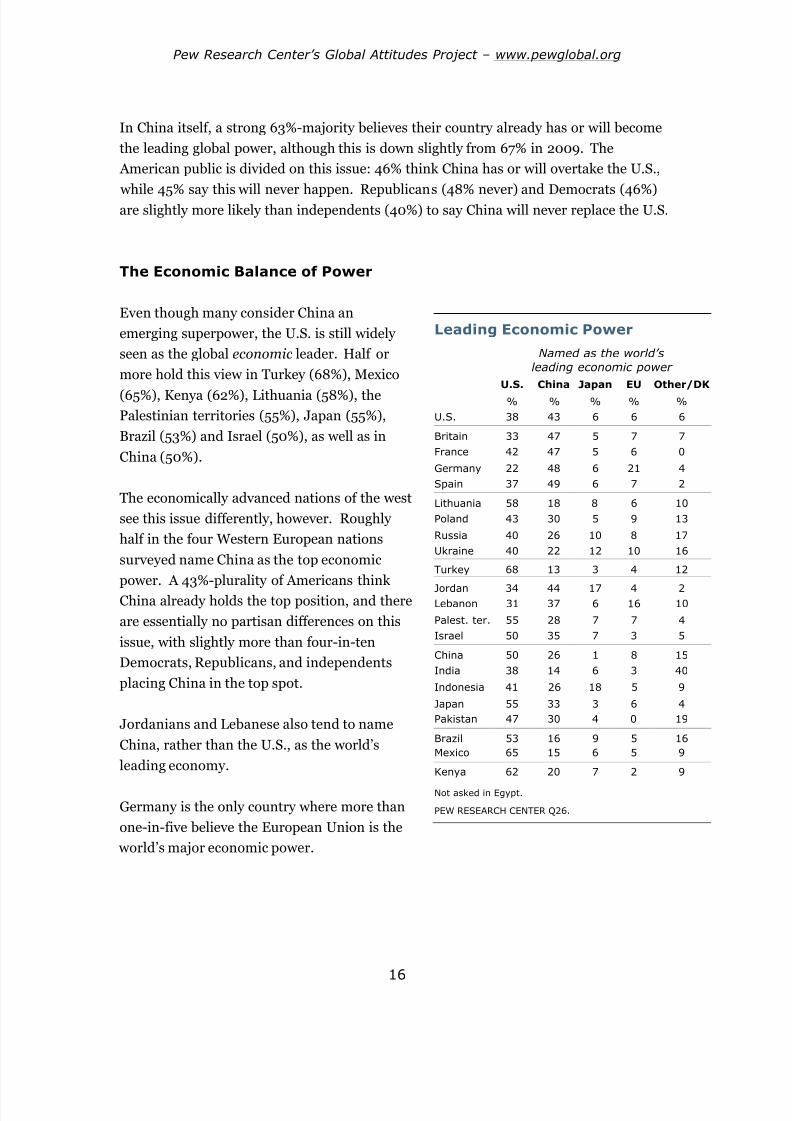
The Economic Balance of Power
Even though many consider China an
emerging superpower, the U.S. is still widely
seen as the global economic leader. Half or
more hold this view in Turkey (68%), Mexico
(65%), Kenya (62%), Lithuania (58%), thePalestinian territories (55%), Japan (55%),
Brazil (53%) and Israel (50%), as well as in
China (50%).
The economically advanced nations of the west
see this issue differently, however. Roughly
half in the four Western European nations
surveyed name China as the top economic
power. A 43%-plurality of Americans think
China already holds the top position, and there
are essentially no partisan differences on this
issue, with slightly more than four-in-ten
Democrats, Republicans, and independents
placing China in the top spot.
Jordanians and Lebanese also tend to name
China, rather than the U.S., as the world’s
leading economy.
Germany is the only country where more than
one-in-five believe the European Union is the
world’s major economic power.
Leading Economic Power
Named as the world’s
leading economic power
U.S. China Japan EU Other/DK
% % % % %
U.S. 38 43 6 6 6
Britain 33 47 5 7 7
France 42 47 5 6 0
Germany 22 48 6 21 4
Spain 37 49 6 7 2
Lithuania 58 18 8 6 10
Poland 43 30 5 9 13
Russia 40 26 10 8 17
Ukraine 40 22 12 10 16
Turkey 68 13 3 4 12
Jordan 34 44 17 4 2Lebanon 31 37 6 16 10
Palest. ter. 55 28 7 7 4
Israel 50 35 7 3 5
China 50 26 1 8 15
India 38 14 6 3 40
Indonesia 41 26 18 5 9
Japan 55 33 3 6 4
Pakistan 47 30 4 0 19
Brazil 53 16 9 5 16
Mexico 65 15 6 5 9
Kenya 62 20 7 2 9
Not asked in Egypt.
PEW RESEARCH CENTER Q26.

8/3/2019 Pew Global Attitudes Balance of Power U.S. Image Report FINAL July 13 2011
http://slidepdf.com/reader/full/pew-global-attitudes-balance-of-power-us-image-report-final-july-13-2011 19/160
Pew Research Center’s Global Attitudes Project – www.pewglobal.org
17
26
3532
47
41 42
2009 2010 2011
China U.S.
34
44
47
35
4747
28
51
48
22
34
49
2009 2010 2011
Britain France
Germany Spain
There is no country in which at least 20%
name Japan as the leading economic power,
although 18% express this view in Indonesia
and 17% in Jordan. In 2010, a quarter of Russians placed Japan in the top position, but
only 10% do so now.
Overall, there have been relatively few notable
changes on this question since last year,
although the Spanish have become
significantly more likely to name China as the
leading economy (34% in 2010, 49% in 2011).
The Chinese themselves are now less likely to
believe their own country occupies the topspot (36% in 2010, 26% in 2011). Meanwhile,
Russians (23% in 2010, 40% in 2011),
Japanese (40% in 2010, 55% in 2011), and
Mexicans (53% in 2010, 65% in 2011) have
become more likely to name the U.S.
Big changes have taken place, however, since
2009. Looking at the 16 nations surveyed in
each of the last three years, the medianpercentage naming China as the world’s
leading economic power has risen from 26% in
2009 to 32% today. The percentage naming
the U.S. has declined from 47% to 42%.
The shift since 2009 has been especially large
in Western Europe. The percentage naming
China as the top economic power has more
than doubled in Spain and has risen by 20
percentage points in Germany.
Shift in Economic Balance of Power
Median % naming China and the U.S. as the world's leadingeconomic power across 16 nations surveyed in 2009, 2010,and 2011.
PEW RESEARCH CENTER Q26.
Western Europeans Increasingly
Name China as Top Economy
PEW RESEARCH CENTER Q26.

8/3/2019 Pew Global Attitudes Balance of Power U.S. Image Report FINAL July 13 2011
http://slidepdf.com/reader/full/pew-global-attitudes-balance-of-power-us-image-report-final-july-13-2011 20/160
Pew Research Center’s Global Attitudes Project – www.pewglobal.org
18
Views About American and Chinese Economic Power
Generally, American economic might is viewed positively. In 15 countries, those who
name the U.S. as the leading economy tend to say this is a good thing. There are only four nations – Turkey, the Palestinian territories, Pakistan and China – where those who
name the U.S. tend to believe America’s status
as the top economy is a bad thing.
Views about Chinese economic power are more
mixed. In 12 countries, those who name China
as the leading economy on balance think this is
a good thing, while in 9 countries they tend to
see this in negative terms.
Throughout Western Europe, those who see
China as the top economic power tend to
believe this is a bad thing. In contrast, in
France and Spain, those who name the U.S.
generally think it is good that America
occupies the top spot, while in Britain and
Germany views on this are divided.
Similarly, Japanese respondents who name
China as the top power generally see this as a
negative development, while those who name
the U.S. believe it is good that America is the
economic leader.
The pattern is reversed in Pakistan and the
Palestinian territories: Those who say China is
the leader tend to say this is good, while those
who name the U.S. generally see American
economic power in a negative light.
Who is World’s Leading Economic
Power?
Say U.S.
…and it is?*
Say China
…and it is?*
Goodthing
Badthing
Goodthing
Badthing
% % % % % %
U.S. 38 34 2 43 4 37
Britain 33 14 14 47 16 20
France 42 27 15 47 14 31
Germany 22 10 9 48 12 30
Spain 37 17 13 49 14 26
Lithuania 58 33 3 18 7 4
Poland 43 27 4 30 9 14
Russia 40 10 12 26 10 6
Ukraine 40 16 7 22 9 5
Turkey 68 6 52 13 3 8
Jordan 34 13 13 44 24 12
Lebanon 31 16 9 37 26 6
Palest. ter. 55 17 36 28 21 6
Israel 50 36 5 35 14 14
China 50 15 21 26 23 1
India 38 23 11 14 5 7
Indonesia 41 24 11 26 19 6
Japan 55 38 10 33 9 19
Pakistan 47 6 35 30 28 0
Brazil 53 32 18 16 10 4
Mexico 65 34 22 15 8 6
Kenya 62 52 6 20 18 1
* Based on total sample. Neither/DK not shown.
Not asked in Egypt.
PEW RESEARCH CENTER Q26, Q27US & Q27CHI.

8/3/2019 Pew Global Attitudes Balance of Power U.S. Image Report FINAL July 13 2011
http://slidepdf.com/reader/full/pew-global-attitudes-balance-of-power-us-image-report-final-july-13-2011 21/160
Pew Research Center’s Global Attitudes Project – www.pewglobal.org
19
85
83
79
72
89
47
57
64
69
54
17
28
36
70
6
5
31
44
87
5453
30
8
17
14
13
6
20
19
12
12
20
70
62
43
17
84
73
47
23
7
3130
61
U.S.
France
Spain
Britain
Germany
Ukraine
Russia
Lithuania
Poland
Turkey
Jordan
Palest. ter.
Lebanon
Israel
China
Pakistan
Indonesia
India
Japan
MexicoBrazil
Kenya
Bad thing Good thing
China as a Military Superpower
In most of the nations surveyed, there is little
enthusiasm for China becoming as militarily powerful as the U.S. Majorities or pluralities
in 15 of 22 nations say this would be a bad
thing.
In the U.S., Japan, Israel and all four Western
European countries surveyed, at least seven-
in-ten hold this view, as do more than six-in-
ten in NATO members Poland and Lithuania.
However, in five of the six predominantly Muslim nations where this question was asked,
majorities or pluralities embrace the idea of
China matching America’s military strength.
The exception is Turkey, where a 54%-majority
says it would be bad if China became America’s
military equal, up steeply from just 29% in
2005.
Most Kenyans (61%) think it would be good if
China rivaled the U.S. militarily, as does an
overwhelming majority in China itself (84%).
Would It Be Good or Bad if China
Became as Powerful Militarily asthe U.S.?
Not asked in Egypt.
PEW RESEARCH CENTER Q29.

8/3/2019 Pew Global Attitudes Balance of Power U.S. Image Report FINAL July 13 2011
http://slidepdf.com/reader/full/pew-global-attitudes-balance-of-power-us-image-report-final-july-13-2011 22/160
20
26
2935
28
20
19
3034
77
284979
80
84
14
4046
10
73
28
41
11
75
6462
61
73
70
6056
10
724920
18
13
85
5444
41
12
62
52
83
France
SpainGermany
Britain
Lithuania
Poland
UkraineRussia
Turkey
IsraelLebanon
Egypt
Palest. ter.
Jordan
Japan
IndonesiaChina
India
Pakistan
Brazil
Mexico
Kenya
FavorableUnfavorable
2. Views of the U.S. and American Foreign Policy
America’s image remains positive in most of
the nations surveyed, and favorable ratings areparticularly high in Europe. In most
predominantly Muslim countries, however,
views of the United States continue to be
overwhelmingly negative.
For the most part, opinions of the U.S. have
changed little, if at all, in most countries for
which trends are available. However,
America’s image is far more negative than it
was in 2010 in China, while the Japanese givethe U.S. considerably higher marks. The rise
in favorable views of the U.S. in Japan is
undoubtedly driven in part by highly positive
reactions to American relief efforts following
the March 11th earthquake and tsunami in that
country.
In most countries, there is a perception that
the U.S. acts unilaterally in world affairs. Only
in seven countries do majorities say the U.S.
considers the interests of countries like theirs
when making foreign policy decisions.
When asked whether their governments cooperate with the U.S. government too much,
not enough, or the about the right amount, people in most countries say they are
satisfied with the amount of cooperation. In most Muslim nations, however, many say
their countries cooperate too much with the U.S.; this is also a common opinion in
Britain and Mexico. Only in Poland and Kenya is there a desire for more cooperation
with the U.S.
The survey also finds that, while there is support for U.S.-led efforts to fight terrorism in
many parts of the world, the war in Afghanistan, a cornerstone of these efforts, remains
unpopular. Majorities or pluralities in 17 of 22 countries believe the U.S. and NATO
troops should remove troops from Afghanistan as soon as possible.
U.S. Favorability
PEW RESEARCH CENTER Q3a.

8/3/2019 Pew Global Attitudes Balance of Power U.S. Image Report FINAL July 13 2011
http://slidepdf.com/reader/full/pew-global-attitudes-balance-of-power-us-image-report-final-july-13-2011 23/160
Pew Research Center’s Global Attitudes Project – www.pewglobal.org
21
U.S. Image Remains Largely Positive In the Obama Years
Majorities in 14 of 23 countries have a very or
somewhat favorable opinion of the UnitedStates. In Europe, at least seven-in-ten in
France (75%), Lithuania (73%) and Poland
(70%) give the U.S. high marks; 64% in Spain,
62% in Germany, 61% in Britain, 60% in
Ukraine and 56% in Russia also express
positive opinions.
America’s image is most positive in Japan,
where more than eight-in-ten (85%) have a
favorable view of the U.S. Favorable ratingsfor the U.S. have improved markedly since last
year, when 66% of Japanese expressed a
positive view. This improvement is due at least
in part to American relief efforts following the
earthquake and tsunami that struck Japan in
March; 57% in Japan say the U.S. has done a
great deal to assist their country with the
impact of the twin disasters. (For more on
Japanese views of the effect of the March 11
earthquake and tsunami, see “ Japanese
Resilient, but See Economic Challenges
Ahead ,” released June 1, 2011.)
In contrast, in China, the image of the U.S. is more negative than it was in 2010.
Currently, Chinese respondents are nearly evenly split; 44% have a favorable view and
46% have an unfavorable opinion of the U.S. A year ago, Chinese opinion of the U.S. was
decidedly positive, with 58% offering a favorable assessment and 37% giving the U.S. a
negative rating.
The U.S. favorability rating is, on balance, positive in India. About four-in-ten (41%)
offer a favorable assessment while just 10% have a negative view of the U.S.; however,
49% of Indians do not offer an opinion.
U.S. Favorability Rating
2009 2010 2011
10-11
Change
% % %
Britain 69 65 61 -4
France 75 73 75 +2
Germany 64 63 62 -1
Spain 58 61 64 +3
Lithuania -- -- 73 --
Poland 67 74 70 -4
Russia 44 57 56 -1
Ukraine -- -- 60 --
Turkey 14 17 10 -7 Egypt 27 17 20 +3
Jordan 25 21 13 -8
Lebanon 55 52 49 -3
Palest. ter. 15 -- 18 --
Israel 71 -- 72 --
China 47 58 44 -14
India -- -- 41 --
Indonesia 63 59 54 -5
Japan 59 66 85 +19
Pakistan 16 17 12 -5
Brazil -- 62 62 0
Mexico 69 56 52 -4
Kenya 90 94 83 -11
PEW RESEARCH CENTER Q3a.

8/3/2019 Pew Global Attitudes Balance of Power U.S. Image Report FINAL July 13 2011
http://slidepdf.com/reader/full/pew-global-attitudes-balance-of-power-us-image-report-final-july-13-2011 24/160
Pew Research Center’s Global Attitudes Project – www.pewglobal.org
22
21
16
2427
15
1922
25
74
23
35
6159
74
10
38
1447
68
30
52
14
78
73
7064
74
7368
63
12
75
62
3736
24
87
52
4942
12
58
42
81
France
Britain
GermanySpain
Poland
LithuaniaUkraine
Russia
Turkey
Israel
Lebanon
JordanEgypt
Palest. ter.
Japan
Indonesia
IndiaChina
Pakistan
Brazil
Mexico
Kenya
FavorableUnfavorable
Kenyans continue to give the U.S. high marks, as was the case during George W. Bush’s
presidency, although fewer now have a favorable opinion than did so a year ago. About
eight-in-ten (83%) Kenyans give the U.S. a positive evaluation, compared with 94% in
2010. Ratings are also largely positive in Brazil, where about six-in-ten (62%) offer afavorable assessment of the U.S. A slim majority (52%) of Mexicans also express positive
opinions of the U.S.; 41% have an unfavorable view.
The U.S. receives its most negative ratings in the predominantly Muslim countries
surveyed. Only about one-in-ten in Turkey (10%) and Pakistan (12%) have a favorable
opinion of the U.S.; 13% in Jordan, 18% in the Palestinian territories and 20% in Egypt
offer positive assessments. Opinions of the U.S. are more positive in Indonesia, where
54% have a favorable view, and Lebanon, where about half (49%) give the U.S. high
marks. (For a more detailed analysis of America’s image in predominantly Muslim
countries, including religious and sectarian divisions in Lebanon, see “ Arab Spring Fails to Improve U.S. Image,” released May 17, 2011.)
Rating the American People
The American people continue to receive
positive ratings in most of the countries
surveyed. Majorities in 14 of 22 countries say
they have a favorable opinion of Americans,
including at least eight-in-ten in Japan (87%)
and Kenya (81%).
Attitudes toward Americans are also
overwhelmingly positive in Europe. Nearly
eight-in-ten (78%) in France and about three-
quarters in Poland (74%), Britain (73%) and
Lithuania (73%) view the American people
favorably. Seven-in-ten in Germany, 68% in
Ukraine, 64% in Spain and 63% in Russia alsoexpress positive opinions of Americans.
Majorities in Israel (75%), Lebanon (62%),
Brazil (58%) and Indonesia (52%) give
Views of the American People
PEW RESEARCH CENTER Q3b.

8/3/2019 Pew Global Attitudes Balance of Power U.S. Image Report FINAL July 13 2011
http://slidepdf.com/reader/full/pew-global-attitudes-balance-of-power-us-image-report-final-july-13-2011 25/160
Pew Research Center’s Global Attitudes Project – www.pewglobal.org
23
Americans favorable ratings; in India, a 49%-plurality shares this view.
In five of the seven predominantly Muslim countries surveyed, however, few express
positive opinions of the American people. This is especially the case in Turkey andPakistan, where only 12% have a favorable opinion of Americans; 24% of Palestinians,
36% of Egyptians and 37% of Jordanians hold a positive view.
U.S. Unilateralism
The perception that the U.S.
does not take the interests of
other countries into account
when making foreign policy decisions remains
widespread. Only in Kenya
(74%), Israel (67%), India
(57%), China (57%),
Germany (56%), Japan (51%)
and Brazil (51%) do
majorities say the U.S. takes
a multilateral approach.
Germans are more likely
than they were a year ago to
say the U.S. considers their
interests; 47% said that was
the case in 2010. In the
other Western European
countries surveyed, fewer
than half currently say the
U.S. takes a multilateral
approach, although this
opinion is now more
common in Britain than it
was in 2010. Four-in-ten
British say the U.S. considers
other countries’ interests,
How Much Does the U.S. ConsiderYour Country’s Interests?
% Great deal/Fair amount
2002 2003 2004 2005 2007 2009 2010 2011
% % % % % % % %U.S.* 75 73 70 67 59 79 76 76
Britain 44 44 36 32 24 43 35 40
France 21 14 14 18 11 34 29 32
Germany 52 32 29 38 27 54 47 56
Spain -- 22 -- 19 17 19 20 19
Lithuania -- -- -- -- -- -- -- 9
Poland 29 -- -- 13 31 34 38 33
Russia 21 22 20 21 19 31 30 23
Ukraine 29 -- -- -- 28 -- -- 15
Turkey 17 9 14 13 14 15 9 17
Egypt -- -- -- -- 24 20 15 21
Jordan 28 19 16 17 23 16 26 23
Lebanon 20 18 -- 35 34 21 19 23
Israel -- 73 -- -- 74 70 -- 67
China -- -- -- 52 44 61 76 57
India -- -- -- -- -- -- -- 57
Indonesia 41 25 -- 59 45 44 50 43
Japan 35 -- -- -- 35 36 31 51
Pakistan 23 23 18 39 21 22 19 20
Brazil -- -- -- -- -- -- 56 51
Mexico 42 -- -- -- 47 48 33 49
Kenya 53 -- -- -- 67 74 75 74
Due to an administrative error, results for the Palestinian territories are not shown.
“In making international policy decisions, to what extent do you think the UnitedStates takes into account the interests of countries like (survey country) – a greatdeal, a fair amount, not too much, or not at all?”
*In the U.S. the question asks: “In making international policy decisions, to whatextent do you think the United States takes into account the interests of othercountries around the world – a great deal, a fair amount, not too much, or not atall?”
PEW RESEARCH CENTER Q51 & Q51US.

8/3/2019 Pew Global Attitudes Balance of Power U.S. Image Report FINAL July 13 2011
http://slidepdf.com/reader/full/pew-global-attitudes-balance-of-power-us-image-report-final-july-13-2011 26/160
Pew Research Center’s Global Attitudes Project – www.pewglobal.org
24
compared with 35% a year ago. About a third (32%) in France and just 19% in Spain
share this view, virtually unchanged from 2010.
Eastern Europeans also give the U.S. low ratings on this issue, and this is especially truein Lithuania and Ukraine. Just 9% of Lithuanians and 15% of Ukrainians say the U.S.
considers the interests of countries like theirs when making foreign policy decisions;
about a quarter (23%) in Russia and one-third in Poland share this view. Russians and
Poles were more likely to say the U.S. took a multilateral approach a year ago (30% and
38%, respectively); in Ukraine, 28% said the U.S. considered their interests in 2007,
when the question was last asked in that country.
The opinion that the U.S. acts multilaterally when making foreign policy decisions is also
far less widespread in China; 57% say the U.S. takes their interests into account,
compared with 76% in 2010. In contrast, Japanese respondents are much more likely tosay the U.S. considers the interests of other countries than they were a year ago, when
just 31% said that was the case.
In the predominantly Muslim countries surveyed, fewer than a quarter in Lebanon
(23%), Jordan (23%), Egypt (21%), Pakistan (20%) and Turkey (17%) say the U.S. takes
into account the interests of other countries. The U.S. receives more positive marks in
Indonesia; 43% believe the U.S. takes a multilateral approach, but about half (49%) say
the U.S. does not consider the interests of other countries when making foreign policy
decisions.
Americans offer a much different assessment of their country’s approach to foreign
policy than any other public surveyed. About three-quarters (76%) say the U.S.
considers the interests of other countries around the world a great deal or a fair amount.

8/3/2019 Pew Global Attitudes Balance of Power U.S. Image Report FINAL July 13 2011
http://slidepdf.com/reader/full/pew-global-attitudes-balance-of-power-us-image-report-final-july-13-2011 27/160
Pew Research Center’s Global Attitudes Project – www.pewglobal.org
25
Cooperation With the U.S.
Majorities or pluralities in 11 of 21 nations are
satisfied with the amount of cooperation between their countries and the U.S. In six
countries, more say their government
cooperates too much than say it cooperates
about the right amount or too little. Only in
Poland and Kenya would pluralities like to see
more cooperation with the U.S.
About seven-in-ten (72%) in Germany, 65% in
France and 59% in Spain say their
governments cooperate about the right amount with the U.S. government. In Britain, however,
a 45%-plurality believes their country
cooperates too much with the U.S.; another
40% are satisfied with the amount of
cooperation between the two countries and
10% say the British government does not
cooperate enough with the U.S.
Opinions about cooperation with the U.S. are
more mixed across the Eastern European
countries surveyed. While a 45%-plurality in
Poland believes their government does not
cooperate with the U.S. enough, pluralities in
Russia (45%) and Lithuania (42%) say their
countries cooperate about the right amount. In Ukraine, the same number express
satisfaction with the amount of cooperation between their country and the U.S. as say
Ukraine does not cooperate enough (35% each); 9% say their country cooperates too
much with the U.S. government.
In Mexico, 44% say their country cooperates too much with their neighbor to the north,
while about a quarter say Mexico does not cooperate enough (25%) or that it cooperates
about the right amount (27%) with the U.S.
Government Cooperation With the
U.S.
Toomuch
Notenough
About
the rightamount DK
% % % %
Britain 45 10 40 5
France 19 16 65 0
Germany 16 11 72 2
Spain 15 23 59 3
Lithuania 7 38 42 12
Poland 9 45 34 13
Russia 17 23 45 16
Ukraine 9 35 35 22
Turkey 26 26 32 15
Egypt 39 24 31 6
Jordan 57 16 22 6
Lebanon 54 18 25 3
Israel 31 23 41 5
China 11 28 36 26
India 22 26 14 38
Indonesia 19 18 54 9
Japan 32 11 53 4
Pakistan 52 11 16 21
Brazil 23 25 40 12
Mexico 44 25 27 3
Kenya 30 44 21 4
Due to an administrative error, results for the Palestinianterritories are not shown.
PEW RESEARCH CENTER Q30.
8/3/2019 Pew Global Attitudes Balance of Power U.S. Image Report FINAL July 13 2011
http://slidepdf.com/reader/full/pew-global-attitudes-balance-of-power-us-image-report-final-july-13-2011 28/160
Pew Research Center’s Global Attitudes Project – www.pewglobal.org
26
Majorities in Jordan (57%), Lebanon (54%) and Pakistan (52%) and a plurality (39%) in
Egypt believe their countries cooperate too much with the U.S. In Indonesia, however, a
majority (54%) is satisfied with the amount of cooperation between their country and the
U.S. Views are more mixed in Turkey, where the same number say there is too muchcooperation with the U.S. as say there is not enough (26% each); 32% say their country
cooperates with the U.S. about the right amount.
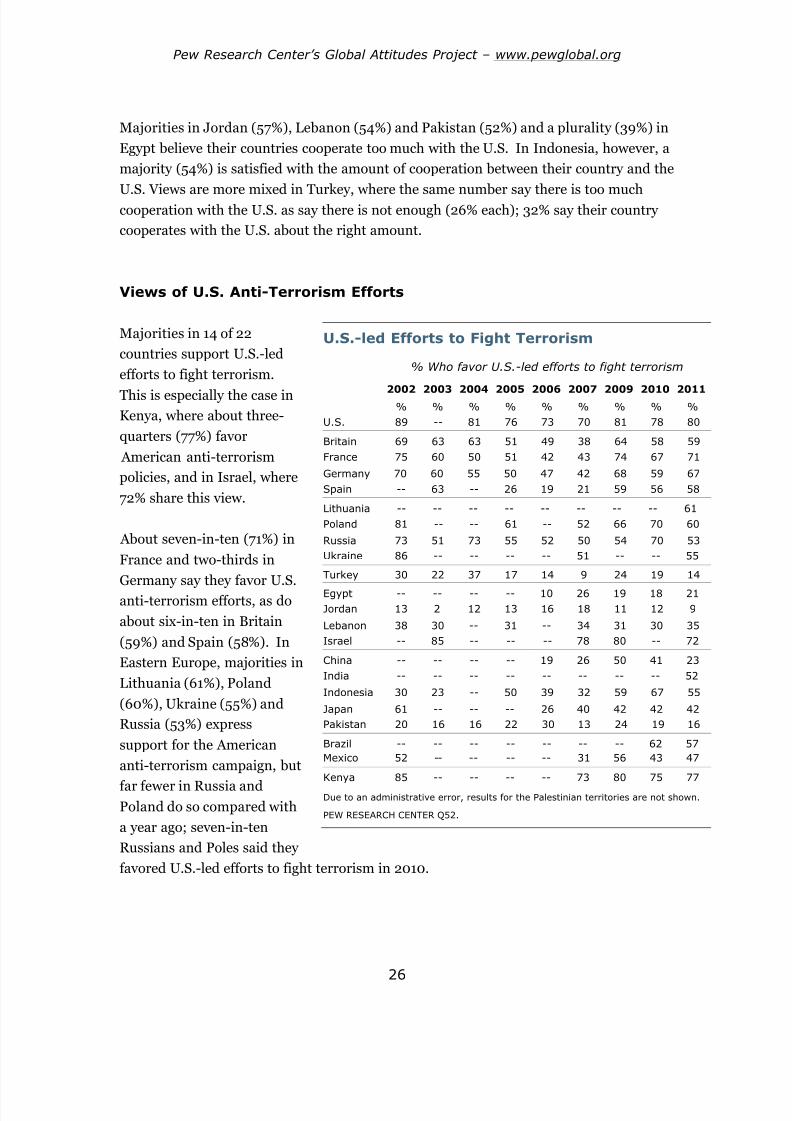
Views of U.S. Anti-Terrorism Efforts
Majorities in 14 of 22
countries support U.S.-led
efforts to fight terrorism.
This is especially the case inKenya, where about three-
quarters (77%) favor
American anti-terrorism
policies, and in Israel, where
72% share this view.
About seven-in-ten (71%) in
France and two-thirds in
Germany say they favor U.S.
anti-terrorism efforts, as do
about six-in-ten in Britain
(59%) and Spain (58%). In
Eastern Europe, majorities in
Lithuania (61%), Poland
(60%), Ukraine (55%) and
Russia (53%) express
support for the American
anti-terrorism campaign, but
far fewer in Russia andPoland do so compared with
a year ago; seven-in-ten
Russians and Poles said they
favored U.S.-led efforts to fight terrorism in 2010.
U.S.-led Efforts to Fight Terrorism
% Who favor U.S.-led efforts to fight terrorism
2002 2003 2004 2005 2006 2007 2009 2010 2011% % % % % % % % %
U.S. 89 -- 81 76 73 70 81 78 80
Britain 69 63 63 51 49 38 64 58 59
France 75 60 50 51 42 43 74 67 71
Germany 70 60 55 50 47 42 68 59 67
Spain -- 63 -- 26 19 21 59 56 58
Lithuania -- -- -- -- -- -- -- -- 61
Poland 81 -- -- 61 -- 52 66 70 60
Russia 73 51 73 55 52 50 54 70 53
Ukraine 86 -- -- -- -- 51 -- -- 55
Turkey 30 22 37 17 14 9 24 19 14
Egypt -- -- -- -- 10 26 19 18 21
Jordan 13 2 12 13 16 18 11 12 9
Lebanon 38 30 -- 31 -- 34 31 30 35
Israel -- 85 -- -- -- 78 80 -- 72
China -- -- -- -- 19 26 50 41 23
India -- -- -- -- -- -- -- -- 52
Indonesia 30 23 -- 50 39 32 59 67 55
Japan 61 -- -- -- 26 40 42 42 42
Pakistan 20 16 16 22 30 13 24 19 16
Brazil -- -- -- -- -- -- -- 62 57
Mexico 52 -- -- -- -- 31 56 43 47
Kenya 85 -- -- -- -- 73 80 75 77
Due to an administrative error, results for the Palestinian territories are not shown.
PEW RESEARCH CENTER Q52.

8/3/2019 Pew Global Attitudes Balance of Power U.S. Image Report FINAL July 13 2011
http://slidepdf.com/reader/full/pew-global-attitudes-balance-of-power-us-image-report-final-july-13-2011 29/160
Pew Research Center’s Global Attitudes Project – www.pewglobal.org
27
41
51414141
3231
16
13
6
5722119
4434
1298
41
25
62
52
44515858
505359
64
75
28717887
4019716569
46
53
26
U.S.
SpainBritainFrance
Germany
LithuaniaPolandRussia
Ukraine
Turkey
IsraelLebanon
EgyptJordan
JapanIndia
IndonesiaChina
Pakistan
Brazil
Mexico
Kenya
Keep troopsRemove troops
Support for American anti-terrorism efforts has also declined considerably in China.
Currently, about a quarter (23%) favor and 60% oppose U.S. efforts to combat terrorism.
In 2010, Chinese respondents were nearly evenly split, with 41% expressing support and
40% saying they opposed these efforts.
Publics in the predominantly Muslim countries surveyed continue to give the U.S.-led
anti-terrorism campaign low marks. Just 9% in Jordan, 14% in Turkey and 16% in
Pakistan say they favor American efforts to fight terrorism; 21% in Egypt and 35% in
Lebanon share this view. Indonesia is the only Muslim country surveyed where a
majority (55%) expresses support for these efforts; in 2010, two-thirds of Indonesians
favored U.S.-led efforts to fight terrorism.
War in Afghanistan
The war in Afghanistan remains unpopular in
most of the countries surveyed. Majorities or
pluralities in 17 of 22 countries believe U.S.
and NATO troops should be withdrawn from
Afghanistan as soon as possible. Only in
Kenya, Israel, Japan, Spain and India do more
say that these troops should remain in
Afghanistan until the situation is stabilized
than say troops should be removed.
Support for the war is especially low in
predominantly Muslim countries. Nearly
nine-in-ten (87%) Jordanians and at least
three-quarters of Egyptians (78%) and Turks
(75%) say troops should leave Afghanistan as
soon as possible; about seven-in-ten in
Indonesia (71%), Lebanon (71%) and Pakistan
(69%) share this view.
Chinese respondents are also overwhelmingly
in favor of troop withdrawal; 65% say U.S. and
NATO troops should be removed as soon as
possible, while just 9% believe these troops
Keep or Remove U.S. and NATOTroops from Afghanistan
Due to an administrative error, results for the Palestinianterritories are not show.
PEW RESEARCH CENTER Q62.
8/3/2019 Pew Global Attitudes Balance of Power U.S. Image Report FINAL July 13 2011
http://slidepdf.com/reader/full/pew-global-attitudes-balance-of-power-us-image-report-final-july-13-2011 30/160
Pew Research Center’s Global Attitudes Project – www.pewglobal.org
28
should stay in Afghanistan.
In France and Britain, where support for the war rebounded somewhat between fall
2009 and spring 2010, the balance of opinion is once again on the side of troop withdrawal. Nearly six-in-ten (58%) in France say the U.S. and NATO should remove
troops from Afghanistan as soon as possible, while 41% favor keeping troops there; in
2010, French opinion was more mixed, with 52% saying troops should be withdrawn and
47% expressing support for keeping them in Afghanistan.
In Britain, 51% now say troops should leave Afghanistan and 41% believe U.S. and NATO
troops should stay in that country; a year ago, 45% wanted troops to leave Afghanistan
while about half (49%) favored keeping them there. Nearly six-in-ten (58%) Germans
favor troop withdrawal, unchanged from a year ago.
In Spain, however, support for the war is now more widespread than it was in 2010.
About half (51%) of Spanish respondents believe troops should remain in Afghanistan
until the situation is stabilized; 44% say the U.S. and NATO should remove their troops
as soon as possible. A year ago, fewer in Spain said troops should stay in Afghanistan
than said they should be removed (43% vs. 49%).
For the first time since 2007, when the Pew Research Center first asked this question,
more Americans say the U.S. and NATO should remove its troops from Afghanistan as
soon as possible than say military troops should remain in that country until the
situation has stabilized (52% vs. 41%). A survey by the Pew Research Center for the
People & the Press, conducted just days before Obama’s speech announcing his policy for
drawing down U.S. forces in Afghanistan, finds even more support for troop withdrawal;
56% say troops should be removed from Afghanistan as soon as possible, while 39% say
they should stay in that country. (For a more detailed analysis of Americans’ opinions
about the war in Afghanistan, see “ Record Number Favors Removing U.S. Troops from
Afghanistan,” released June 21, 2011, by the Pew Research Center for the People & the
Press.)

8/3/2019 Pew Global Attitudes Balance of Power U.S. Image Report FINAL July 13 2011
http://slidepdf.com/reader/full/pew-global-attitudes-balance-of-power-us-image-report-final-july-13-2011 31/160
29
49
43
39
29
28
25
Confidence
Economicproblems
Calls for politicalchange
Afghanistan
Israeli/Palestinian
conflict
Iran
% Approve
3. Global Opinion of President Barack Obama
U.S. President Barack Obama remains popular
in most parts of the world, and this isespecially true in Western Europe, where large
majorities express at least some confidence in
the American president to do the right thing in
world affairs. More than half in Lithuania,
Poland, Japan, Brazil, Indonesia and Kenya
also give Obama high marks. Publics in
predominantly Muslim nations, however,
continue to offer negative ratings of Obama,
although Indonesia is a major exception.
As has been the case since he took office,
opinions of how Obama handles specific
international policies lag overall confidence in
the U.S. president. In particular, Obama
receives low marks for his handling of the situation in Afghanistan, Iran, and the conflict
between Israelis and Palestinians. Assessments of the way Obama has dealt with the
recent calls for political change in the Middle East and global economic problems are
somewhat more positive.
It is of note that Obama gets better grades for dealing with the global economy in most
nations surveyed than he does in the U.S. And the American president has managed to
create a consensus between Israelis and Palestinians. Solid majorities among both
publics disapprove of how he is dealing with their conflict.
Confidence in Obama
President Obama receives some of his most positive ratings in Western Europe. Nearly
nine-in-ten (88%) Germans say they have at least some confidence in the U.S. president
to do the right thing in world affairs, as do 84% in France, 75% in Britain and 67% in
Spain. By comparison, 61% of Americans have confidence in Obama.
Views of Obama
Median % across the 23 countries surveyed who express atleast some confidence in Obama and who approve of hishandling of various issues.
PEW RESEARCH CENTER Q48a & Q79a-e.

8/3/2019 Pew Global Attitudes Balance of Power U.S. Image Report FINAL July 13 2011
http://slidepdf.com/reader/full/pew-global-attitudes-balance-of-power-us-image-report-final-july-13-2011 32/160
Pew Research Center’s Global Attitudes Project – www.pewglobal.org
30
61
88
84
75
67
68
52
41
37
12
49
43
35
2814
81
62
48
44
8
63
38
86
38
12
15
22
32
23
32
43
42
73
51
57
64
6884
13
35
11
33
68
31
54
10
U.S.
Germany
France
Britain
Spain
Lithuania
Poland
Russia
Ukraine
Turkey
Israel
Lebanon
Egypt
JordanPalest. ter.
Japan
Indonesia
India
China
Pakistan
Brazil
Mexico
Kenya
ConfidenceNo confidence
Majorities also express confidence in Obama in
Kenya (86%), Japan (81%), Lithuania (68%),
Brazil (63%), Indonesia (62%) and Poland
(52%). Pluralities in India (48%) and China(44%) share this view.
Opinions of Obama are more mixed in Israel,
as well as in Russia and Ukraine. About half
(49%) of Israelis have at least some confidence
in Obama when it comes to world affairs and
about the same percentage (51%) has little or
no confidence in the U.S. president. In Russia,
about four-in-ten (41%) express confidence in
Obama, while 43% do not. Among Ukrainians,37% give Obama positive ratings, while slightly
more (42%) say they have little or no
confidence.
With the exception of Indonesians, publics in
predominantly Muslim countries give Obama
decidedly negative ratings. Just 8% in
Pakistan, 12% in Turkey and 14% in the
Palestinian territories have confidence in the
American president to do the right thing in
international affairs; 28% in Jordan and 35% in Egypt share this view. Opinions of
Obama are somewhat more positive in Lebanon, where 43% express at least some
confidence, but a majority (57%) in that country say they have little or no confidence in
him. (For a more detailed analysis of views of Obama in predominantly Muslim
countries, see “ Arab Spring Fails to Improve U.S. Image,” released May 17, 2011.)
Mexicans also give Obama negative ratings; 38% have confidence in him when it comes
to world affairs, while 54% say they have little or no confidence in the U.S. president. In
2010, Mexicans were evenly split, with 43% expressing confidence in Obama and thesame percentage saying they lacked confidence in him.
Ratings of Obama have also declined since 2010 in Turkey (11 points percentage points),
Britain (9 points), Kenya (9 points), Poland (8 points), China (8 points), Indonesia (5
points), and the U.S. (4 points); in the Palestinian territories and Israel, confidence in
General Confidence in Obama
PEW RESEARCH CENTER Q48a.

8/3/2019 Pew Global Attitudes Balance of Power U.S. Image Report FINAL July 13 2011
http://slidepdf.com/reader/full/pew-global-attitudes-balance-of-power-us-image-report-final-july-13-2011 33/160
Pew Research Center’s Global Attitudes Project – www.pewglobal.org
31
Obama has dropped 9 and 7 percentage points,
respectively, since 2009, when Palestinians
and Israelis were last included in the Pew
Global Attitudes survey.
In contrast, more Brazilians and Japanese
express confidence in Obama than did so a
year ago. Confidence in Obama is up 7
percentage points in Brazil, a country the
American president visited in March 2011. In
Japan, where U.S. efforts to assist with the
impact of the March earthquake and tsunami
have been widely recognized, confidence in
Obama is up 5 points.
Obama’s Handling of Middle East
Protests and the Israeli-Palestinian
Conflict
Obama receives relatively positive ratings for
his handling of the recent calls for political
change in countries such as Egypt, Tunisia,
Bahrain and Libya.2 Majorities or pluralities in
10 of the 23 countries surveyed approve of the
way Obama has dealt with the uprisings, including about seven-in-ten in France (70%)
and Germany (69%) and at least six-in-ten in Kenya (64%) and Spain (63%).
Views of Obama’s handling of the recent protests in the Middle East are most negative in
the Muslim countries surveyed, where majorities or pluralities are critical of his
performance. Still, many in these countries approve of the way Obama has handled the
uprisings. This is especially the case in Egypt and Lebanon; 45% of Egyptians and 41%
of Lebanese approve of Obama’s handling of calls for political change, while 52% in eachcountry disapprove.
2 The survey was conducted after the start of NATO-led airstrikes in Libya and before Obama’s May 19 speech on Middle
East policy.
General Confidence in Obama
2009 2010 2011Change10-11
% % %U.S. 74 65 61 -4
Britain 86 84 75 -9
France 91 87 84 -3
Germany 93 90 88 -2
Spain 72 69 67 -2
Lithuania -- -- 68 --
Poland 62 60 52 -8
Russia 37 41 41 0
Ukraine -- -- 37 --
Turkey 33 23 12 -11
Egypt 42 33 35 +2
Jordan 31 26 28 +2
Lebanon 46 43 43 0
Palest. ter. 23 -- 14 --
Israel 56 -- 49 --
China 62 52 44 -8
India -- -- 48 --
Indonesia 71 67 62 -5
Japan 85 76 81 +5
Pakistan 13 8 8 0
Brazil -- 56 63 +7
Mexico 55 43 38 -5
Kenya 94 95 86 -9PEW RESEARCH CENTER Q48a.

8/3/2019 Pew Global Attitudes Balance of Power U.S. Image Report FINAL July 13 2011
http://slidepdf.com/reader/full/pew-global-attitudes-balance-of-power-us-image-report-final-july-13-2011 34/160
Pew Research Center’s Global Attitudes Project – www.pewglobal.org
32
In contrast, Obama receives some of his most
negative ratings for his handling of the Israeli-
Palestinian conflict. Only in Kenya do more
than half (51%) approve of Obama’sperformance on this issue.
In Spain and France, majorities disapprove of
Obama’s performance on this issue (58% and
54%, respectively), as does a plurality (42%) in
Britain. Germans are nearly evenly divided;
45% approve and 42% disapprove of his
handling of the Israeli-Palestinian conflict.
Disapproval of Obama’s performance has
increased since last year in France, Spain, andBritain; 47%, 45% and 34%, respectively, gave
the American president low marks for his
handling of the conflict in 2010.
Palestinians are more critical than Israelis, but
majorities among both publics (84% and 64%,
respectively) disapprove of the way Obama is
dealing with the Israeli-Palestinian conflict.
Elsewhere in the Middle East, at least eight-in-
ten in Lebanon (85%), Jordan (82%) and
Egypt (82%) disapprove of Obama’s handling
of this issue.
Criticism of Iran and Afghanistan Policies
Opinions of the way Obama is dealing with Iran are largely negative across the world.
France, Germany and Kenya are the only countries surveyed where a clear majority or
plurality approves of Obama’s handling of Iran (53%, 48% and 44%, respectively).
In the Middle Eastern countries surveyed, majorities are critical of Obama’s handling of
Iran. This is especially the case in the Palestinian territories and Jordan, where 80% and
77%, respectively, disapprove; 68% in Egypt and Turkey, 61% in Israel and 55% in
Lebanon share this view.
Obama’s Handling of…
Calls for political change
in Middle East
Israeli-Palestinian
conflict
App-rove
Dis-app
App-rove
Dis-app
% % % %
U.S. 44 39 35 45
Britain 50 28 32 42
France 70 29 45 54
Germany 69 26 45 42
Spain 63 26 32 58
Lithuania 40 32 25 43
Poland 47 27 31 36
Russia 13 54 9 57
Ukraine 19 42 14 42
Turkey 8 65 6 68
Egypt 45 52 15 82
Jordan 31 65 17 82
Lebanon 41 52 12 85
Palest. ter. 33 63 13 84
Israel 38 50 29 64
China 14 46 14 48
India 14 19 11 23
Indonesia 30 49 26 57
Japan 48 30 34 47
Pakistan 3 43 4 46
Brazil 39 38 26 54
Mexico 29 48 24 54
Kenya 64 16 51 24
PEW RESEARCH CENTER Q79d & Q79e.
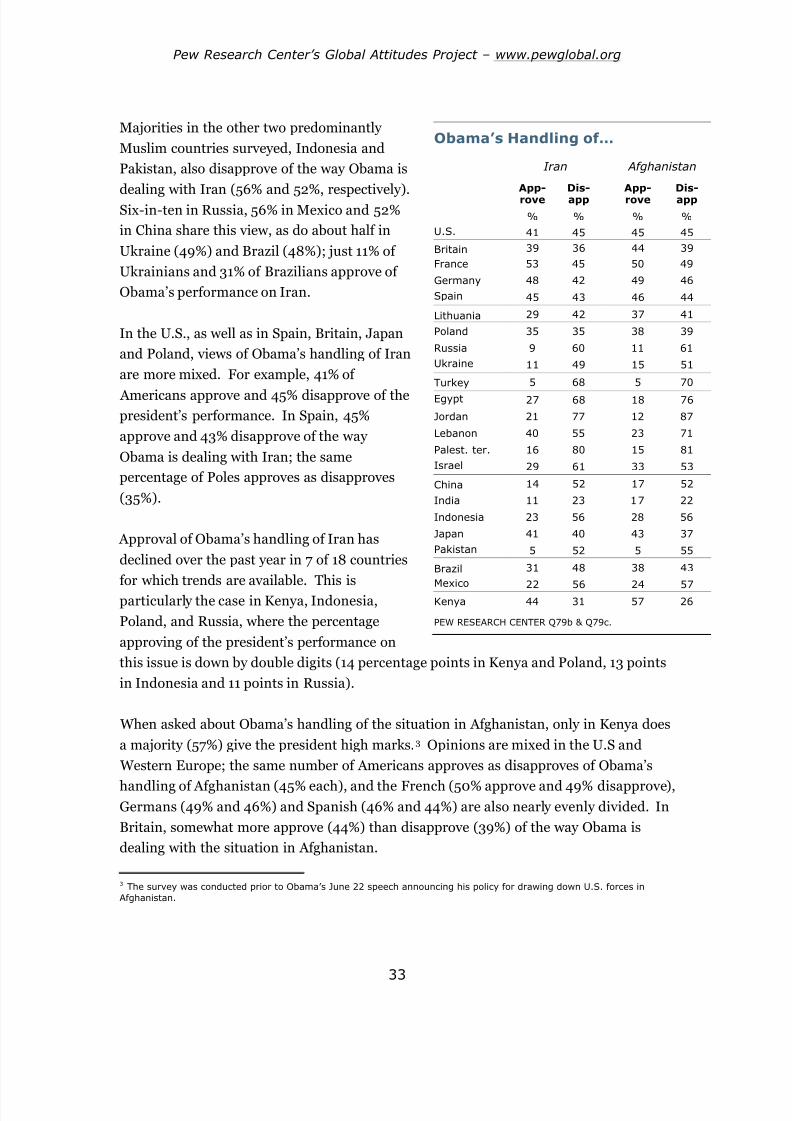
8/3/2019 Pew Global Attitudes Balance of Power U.S. Image Report FINAL July 13 2011
http://slidepdf.com/reader/full/pew-global-attitudes-balance-of-power-us-image-report-final-july-13-2011 35/160
Pew Research Center’s Global Attitudes Project – www.pewglobal.org
33
Majorities in the other two predominantly
Muslim countries surveyed, Indonesia and
Pakistan, also disapprove of the way Obama is
dealing with Iran (56% and 52%, respectively).Six-in-ten in Russia, 56% in Mexico and 52%
in China share this view, as do about half in
Ukraine (49%) and Brazil (48%); just 11% of
Ukrainians and 31% of Brazilians approve of
Obama’s performance on Iran.
In the U.S., as well as in Spain, Britain, Japan
and Poland, views of Obama’s handling of Iran
are more mixed. For example, 41% of
Americans approve and 45% disapprove of thepresident’s performance. In Spain, 45%
approve and 43% disapprove of the way
Obama is dealing with Iran; the same
percentage of Poles approves as disapproves
(35%).
Approval of Obama’s handling of Iran has
declined over the past year in 7 of 18 countries
for which trends are available. This is
particularly the case in Kenya, Indonesia,
Poland, and Russia, where the percentage
approving of the president’s performance on
this issue is down by double digits (14 percentage points in Kenya and Poland, 13 points
in Indonesia and 11 points in Russia).
When asked about Obama’s handling of the situation in Afghanistan, only in Kenya does
a majority (57%) give the president high marks.3 Opinions are mixed in the U.S and
Western Europe; the same number of Americans approves as disapproves of Obama’s
handling of Afghanistan (45% each), and the French (50% approve and 49% disapprove),Germans (49% and 46%) and Spanish (46% and 44%) are also nearly evenly divided. In
Britain, somewhat more approve (44%) than disapprove (39%) of the way Obama is
dealing with the situation in Afghanistan.
3 The survey was conducted prior to Obama’s June 22 speech announcing his policy for drawing down U.S. forces in
Afghanistan.
Obama’s Handling of…
Iran Afghanistan
App-
rove
Dis-
app
App-
rove
Dis-
app
% % % %
U.S. 41 45 45 45
Britain 39 36 44 39
France 53 45 50 49
Germany 48 42 49 46
Spain 45 43 46 44
Lithuania 29 42 37 41
Poland 35 35 38 39
Russia 9 60 11 61
Ukraine 11 49 15 51
Turkey 5 68 5 70
Egypt 27 68 18 76
Jordan 21 77 12 87
Lebanon 40 55 23 71
Palest. ter. 16 80 15 81
Israel 29 61 33 53
China 14 52 17 52
India 11 23 17 22
Indonesia 23 56 28 56
Japan 41 40 43 37
Pakistan 5 52 5 55
Brazil 31 48 38 43
Mexico22 56 24 57
Kenya 44 31 57 26
PEW RESEARCH CENTER Q79b & Q79c.

8/3/2019 Pew Global Attitudes Balance of Power U.S. Image Report FINAL July 13 2011
http://slidepdf.com/reader/full/pew-global-attitudes-balance-of-power-us-image-report-final-july-13-2011 36/160
Pew Research Center’s Global Attitudes Project – www.pewglobal.org
34
49
24402738
19262536
62
4353667673
1526
133851
2242
8
40
68595252
60483932
11
4443302120
6965363511
6241
78
U.S.
GermanyFranceBritainSpain
LithuaniaPoland
UkraineRussia
Turkey
IsraelLebanon
Palest. ter.JordanEgypt
JapanIndonesia
IndiaChina
Pakistan
BrazilMexico
Kenya
ApproveDisapprove
As is the case with other key policies in the Muslim world, views of Obama’s handling of
Afghanistan are especially negative in predominantly Muslim countries. Nearly nine-in-
ten (87%) Jordanians and at least three-quarters in the Palestinian territories (81%) and
Egypt (76%) disapprove of the way Obama is dealing with the situation in Afghanistan;71% in Lebanon and 70% in Turkey, as well as narrower majorities in Indonesia (56%)
and Pakistan (55%) express similar views.
Mostly Good Grades on Global Economy
Majorities or pluralities in 12 of 23 countries
surveyed approve of the way the U.S. president
is dealing with global economic problems.
Kenyans are particularly supportive; nearly eight-in-ten (78%) approve of Obama’s
handling of the world economy.
In Western Europe, Germans express the most
support for Obama’s handling of economic
problems; about two-thirds (68%) approve of
the president’s performance. Nearly six-in-ten
(59%) in France and narrower majorities in
Britain and Spain (52% each) share this view.
By comparison, four-in-ten Americans approve
and about half (49%) disapprove of the way
Obama is dealing with global economic
problems.
Six-in-ten Lithuanians offer support for
Obama’s handling of global economic
problems. About half (48%) in Poland and
39% in Ukraine approve of the way the U.S.
president is dealing with this issue; about aquarter in each country (26% and 25%,
respectively) disapprove. In contrast, more in
Russia disapprove (36%) than approve (32%) of Obama’s performance.
Obama’s Handling of GlobalEconomic Problems
PEW RESEARCH CENTER Q79a.

8/3/2019 Pew Global Attitudes Balance of Power U.S. Image Report FINAL July 13 2011
http://slidepdf.com/reader/full/pew-global-attitudes-balance-of-power-us-image-report-final-july-13-2011 37/160
Pew Research Center’s Global Attitudes Project – www.pewglobal.org
35
For the most part, publics in the predominantly Muslim countries surveyed are critical of
the way Obama is dealing with the world economy. At least seven-in-ten in Jordan
(76%) and Egypt (73%) disapprove of Obama’s performance, as do 66% in the
Palestinian territories, 62% in Turkey, 53% in Lebanon and 51% in Pakistan. Only inIndonesia does a majority (65%) approve of Obama’s handling of global economic
problems; 26% of Indonesians disapprove.
Views of Obama’s performance on the global economy are mixed in Israel, Mexico and
China. In Israel, 44% approve and 43% disapprove of the way Obama is handling this
issue. About four-in-ten (41%) Mexicans give Obama high marks for his handling of
global economic problems, while about the same number (42%) are critical of the
president. And in China, 35% approve and 38% disapprove. In contrast, 69% in Japan
and 62% in Brazil approve of the way Obama is dealing with economic problems, as do
36% in India; 13% of Indians disapprove and 51% do not offer an opinion.

8/3/2019 Pew Global Attitudes Balance of Power U.S. Image Report FINAL July 13 2011
http://slidepdf.com/reader/full/pew-global-attitudes-balance-of-power-us-image-report-final-july-13-2011 38/160
36
36
26
39
49
59
23
2536
32
66
36
37
39
46
52
3
28
61
35
37
46
21
51
59
55
51
34
63
6352
51
18
62
59
57
49
44
82
67
34
25
49
39
71
U.S.
Britain
Spain
France
Germany
Ukraine
RussiaLithuania
Poland
Turkey
Palest. ter.
Lebanon
Egypt
Israel
Jordan
Pakistan
Indonesia
Japan
India
Brazil
Mexico
Kenya
Unfavorable Favorable
4. Views of China
China’s overall image is positive in most of the nations surveyed, with European views, in
particular, improving over the past year. In Asia, opinion is mixed: majorities inPakistan and Indonesia are favorably inclined toward China, while Indians tend to be
uncertain about the region’s other growing economic powerhouse, and a majority of
Japanese have a negative opinion of their neighbor to the west. Opinion of Chinese
President Hu Jintao varies similarly among Asian publics.
Inside and outside Asia, however, reservations about China’s growing power persist,
especially with regard to China’s military prowess. In most countries, majorities or
pluralities view China’s increasing military might as a bad thing for their country. Fewer
publics appear troubled by China’s economic growth. The prevailing view in more than
half the surveyed nations is that China’s expanding economy benefits their own country.
China’s Image
In 16 of 22 nations, majorities or pluralities
have a very or somewhat positive opinion of
China. In only four countries do majorities
express negative views of this emerging Asian
power. European publics, in particular, are
more favorably inclined toward China than
they were last year.
Currently, half or more in Britain (59%), Spain
(55%) and France (51%) view China favorably.
Similar assessments prevail across Eastern
Europe, where the percentage holding a
positive opinion of China ranges from 51% in
Poland to 63% each in Russia and Ukraine.
American attitudes toward China, too, leantoward the positive, with roughly half (51%)
expressing a favorable opinion of this Asian
giant.
Views of China
PEW RESEARCH CENTER Q3c.

8/3/2019 Pew Global Attitudes Balance of Power U.S. Image Report FINAL July 13 2011
http://slidepdf.com/reader/full/pew-global-attitudes-balance-of-power-us-image-report-final-july-13-2011 39/160
Pew Research Center’s Global Attitudes Project – www.pewglobal.org
37
Within Europe, Germans stand out for their predominantly negative views of China.
Only about a third (34%) have a favorable opinion of China, compared with nearly six-in-
ten (59%) who hold an unfavorable view.
Among Western European
countries, favorable opinion
of China has risen over the
past year. Positive views
have increased 13 percentage
points in Britain, 10 points
in France, 8 points in Spain,
and 5 points in Poland.
Even in Germany, the
proportion of people whohold a favorable opinion of
China is up four percentage
points.
In the Middle East,
majorities in the Palestinian
territories (62%), Lebanon
(59%) and Egypt (57%)
express positive views of
China. Israelis, meanwhile,
are divided (49% favorable,
46% unfavorable). In the
region, only Jordanians are
mostly skeptical, with 52%
expressing an unfavorable opinion of China.
Opinion of China has ticked up slightly in Egypt (+5 percentage points) in the last year,
and is up dramatically since 2009 in the Palestinian territories (+19 points). In Jordan,
positive views of China have retreated 9 percentage points over the past year, while alsosliding 7 points in Israel since 2009.
Further east, 82% of Pakistanis have a favorable opinion of their neighbor, likely
reflecting the fact that an overwhelming number of people in Pakistan (87%) see China
as a partner, rather than an enemy. (For more on Pakistani views of China and the U.S.,
China Favorability Trends
2002 2005 2006 2007 2008 2009 2010 2011
10-11
Change
% % % % % % % %
U.S. -- 43 52 42 39 50 49 51 +2
Britain -- 65 65 49 47 52 46 59 +13
France -- 58 60 47 28 41 41 51 +10
Germany -- 46 56 34 26 29 30 34 +4
Spain -- 57 45 39 31 40 47 55 +8
Lithuania -- -- -- -- -- -- -- 52 --
Poland -- 37 -- 39 33 43 46 51 +5
Russia 71 60 63 60 60 58 60 63 +3
Ukraine -- -- -- 64 -- -- -- 63 --
Turkey -- 40 33 25 24 16 20 18 -2
Egypt -- -- 63 65 59 52 52 57 +5
Jordan -- 43 49 46 44 50 53 44 -9
Lebanon -- 66 -- 46 50 53 56 59 +3
Palest. ter. -- -- -- 46 -- 43 -- 62 --
Israel -- -- -- 45 -- 56 -- 49 --
India -- -- -- -- -- -- -- 25 --
Indonesia 68 73 62 65 58 59 58 67 +9
Japan 55 -- 27 29 14 26 26 34 +8
Pakistan -- 79 69 79 76 84 85 82 -3
Brazil -- -- -- -- -- -- 52 49 -3
Mexico -- -- -- 43 38 39 39 39 0
Kenya -- -- -- 81 -- 73 86 71 -15
PEW RESEARCH CENTER Q3c.

8/3/2019 Pew Global Attitudes Balance of Power U.S. Image Report FINAL July 13 2011
http://slidepdf.com/reader/full/pew-global-attitudes-balance-of-power-us-image-report-final-july-13-2011 40/160
Pew Research Center’s Global Attitudes Project – www.pewglobal.org
38
see “ U.S. Image in Pakistan Falls No Further Following bin Laden Killing,” released
June 21, 2011.)
Elsewhere in Asia, assessments of China are mixed. While a majority (67%) of Indonesians are favorably inclined toward China, a nearly equal number of Japanese
(61%) take a dim view of their regional rival. Indians tend to be wary of China (25%
favorable vs. 35% unfavorable), although a large percentage (40%) do not offer a definite
opinion.
Notably, opinion of China has improved over the past year, not only in Indonesia (+9
percentage points) but in Japan as well (+8 points). The latter increase is likely due to
China offering aid to victims of the earthquake and tsunami that struck the northeast
coast of Japan in March. (For more on Japanese views of the effect of the March 11
earthquake and tsunami, see “ Japanese Resilient, but See Economic Challenges Ahead ,” released June 1, 2011.)
In Africa, most Kenyans (71%) are positively inclined toward China, although this is a
substantial decline from 2010, when 86% expressed a favorable opinion of Asia’s rising
power. In Latin America, publics are somewhat more circumspect: 49% of Brazilians say
they have a favorable opinion of China, while just 39% of Mexicans say the same.
Opinion in Brazil is little changed from last year; however, among Mexicans there has
been a 15 percentage point increase in the number who have an unfavorable opinion of
China.
Little Confidence in President Hu in Asia
Among the Asian publics asked, the image of China’s President Hu Jintao varies greatly.
In keeping with their positive overall view of China, Pakistanis express the greatest trust
in Hu, with six-in-ten saying they have at least some confidence in the Chinese leader to
do the right thing regarding world affairs. Indonesians, meanwhile are ambivalent:
Roughly four-in-ten (38%) say they have confidence in Hu, while just slightly fewer say
they either lack confidence in him (30%) or are unsure (31%).
In Japan, just a quarter trust Hu to do the right thing in world affairs, while two-thirds
lack confidence in the Chinese president. Among Indians, only 13% have confidence in
Hu, compared with 26% who lack confidence, and fully 62% who do not know.

8/3/2019 Pew Global Attitudes Balance of Power U.S. Image Report FINAL July 13 2011
http://slidepdf.com/reader/full/pew-global-attitudes-balance-of-power-us-image-report-final-july-13-2011 41/160
Pew Research Center’s Global Attitudes Project – www.pewglobal.org
39
Views of China’s Military and Economic Power
Even in countries where overall opinions of China are favorable, many people express
reservations about China’s growing military prowess. In only three of 21 countries domajorities believe a militarily more powerful China is a good thing for their country. By
contrast, concern about China’s expanding economic reach is less widespread, with half
or more in most nations describing a growing Chinese economy as beneficial to their
country.
The prospect of the Chinese government
modernizing and strengthening its military
forces is unwelcome in most regions of the
world. In Western Europe, publics are in
strong agreement on this point. Upward of seven-in-ten in France (83%), Germany (79%),
Spain (74%) and Britain (71%) believe China’s
growing military might is a negative
development. A large majority of Americans
(79%), too, fail to see an upside to a more
powerful Chinese military.
Meanwhile across Eastern Europe, majorities
ranging from 57% in Ukraine to 74% in Russia
describe an increasingly potent Chinese
military as bad for their country. And in
Turkey, nearly two-thirds (66%) react
negatively to China’s increasing military
prowess.
Across these countries, reactions toward
China’s growing military power have held
fairly steady since last year, although the
number describing this as a bad thing hasincreased in Turkey (+8 percentage points),
Spain (+8 points) and Germany (+7 points).
In the Middle East, publics tend to see China’s growing military might as a bad thing,
including 66% of Israelis, 57% of Lebanese and 52% of Jordanians. A majority of
How China’s Growing PowerAffects Your Country
Growingmilitary power
Growingeconomy
Goodthing
Badthing
Goodthing
Badthing
% % % %
U.S. 11 79 37 53
Britain 13 71 53 32
France 16 83 41 59
Germany 12 79 46 50
Spain 12 74 52 40
Lithuania 11 62 47 27
Poland 13 68 32 46
Russia 12 74 37 41
Ukraine 12 57 37 33
Turkey 9 66 13 64
Jordan 28 52 65 28
Lebanon 24 57 57 29
Palest. ter. 62 29 66 24
Israel 19 66 53 30
India 22 50 29 40
Indonesia 44 36 62 25
Japan 7 87 57 35
Pakistan 72 5 79 5
Brazil 29 51 53 30
Mexico 26 55 39 43
Kenya 62 29 85 12
Not asked in Egypt.
PEW RESEARCH CENTER Q63 & Q64.

8/3/2019 Pew Global Attitudes Balance of Power U.S. Image Report FINAL July 13 2011
http://slidepdf.com/reader/full/pew-global-attitudes-balance-of-power-us-image-report-final-july-13-2011 42/160
Pew Research Center’s Global Attitudes Project – www.pewglobal.org
40
Palestinians (62%), however, consider a more militarily powerful China to be a positive
development. In Africa, an identical percentage of Kenyans (62%) agree with this
assessment.
Overall, Pakistanis are the most welcoming of China’s growing military power, with fully
72% saying this is a good thing for their country. Elsewhere in Asia, 44% of Indonesians
see this as a good thing for their country. Few Indians (22%) or Japanese (7%) express
enthusiasm for a more militarily potent China.
In Latin America, both the Mexican and Brazilian publics tend to see an expanding
Chinese military as a bad thing. In Mexico, 55% hold this view, up 9 percentage points
from last year; in Brazil, 51% see it as a negative, up 11 points from a year ago.
In contrast to views of China’s military power, reactions to the country’s expandingeconomic influence are generally more favorable. Kenyans are the most upbeat, with
85% believing China’s growing economic might is a good thing for their country. In Asia,
majorities in Pakistan (79%), Indonesia (62%) and even Japan (57%) agree. Only
Indians appear skeptical: just 29% say China’s increasing economic reach is a good thing
for their country, while 40% say it is a bad thing and about a third (32%) offer no definite
opinion.
Sentiment among the Middle Eastern publics surveyed also tends to be positive. At least
half in the Palestinian territories (66%), Jordan (65%), Lebanon (57%) and Israel (53%)
believe an expanding Chinese economy is beneficial to their country.
With the exception of Britain and Spain, where slight majorities (53% and 52%,
respectively) welcome China’s rising economic influence,
Europeans tend to be circumspect about a more powerful
Chinese economy. Just under half in Lithuania (47%) and
Germany (46%) see an upside to China’s growing economic
power, while roughly four-in-ten or fewer in France (41%),
Russia (37%), Ukraine (37%) or Poland (32%) concur.
Compared with a year ago, however, Western European publics
are considerably more optimistic about the benefits of an
expanding Chinese economy. In Britain, France and Germany,
the number who see China’s economic growth as a positive is
up 9 percentage points in each country. Meanwhile, an even
Western Europeans
More Positive About
China’s GrowingEconomy
% Good thing
2010 2011 Change% %
Britain 44 53 +9
France 32 41 +9
Germany 37 46 +9
Spain 36 52 +16
PEW RESEARCH CENTER Q63.

8/3/2019 Pew Global Attitudes Balance of Power U.S. Image Report FINAL July 13 2011
http://slidepdf.com/reader/full/pew-global-attitudes-balance-of-power-us-image-report-final-july-13-2011 43/160
Pew Research Center’s Global Attitudes Project – www.pewglobal.org
41
more dramatic shift has occurred in Spain, where the percentage saying China’s growing
economy is a good thing has increased from 36% to 52% since 2010.
In the Western Hemisphere, less than half of Mexicans (39%) and Americans (37%) see agrowing Chinese economy as a positive. More Brazilians (53%) believe their country
benefits from China’s development as an economic power. Notably, in all three countries
the percentage who say China’s expanding economy is a bad thing has ticked up – 9
percentage points each in Mexico and Brazil, and 6 points in the U.S.
Across the nations surveyed, Turks are the most skeptical about the impact of China’s
growing economy – just 13% say this is a good thing, down slightly from last year.

8/3/2019 Pew Global Attitudes Balance of Power U.S. Image Report FINAL July 13 2011
http://slidepdf.com/reader/full/pew-global-attitudes-balance-of-power-us-image-report-final-july-13-2011 44/160
42
73
54
61
75
83
60
66
81
87
49
34
54
56
85
87
10
47
61
72
92
46
76
81
21
43
32
25
15
32
30
14
9
48
65
44
39
13
11
85
51
36
25
6
52
22
19
U.S.
Germany
Britain
France
Spain
Russia
Poland
Lithuania
Ukraine
Turkey
Egypt
Jordan
Israel
Palest. ter.
Lebanon
China
India
Indonesia
Japan
Pakistan
Brazil
Mexico
Kenya
Dissatisfied Satisfied
5. Economic Issues
Despite signs that some countries are
recovering from the Great Recession of 2008-2009, economic times remain tough for many
around the world. In most of the nations
surveyed, people are dissatisfied with the way
things are going in their country and downbeat
about their national economy. The few
exceptions to this pattern include publics in
China, Brazil and India. Although opinion is
divided as to whether economic conditions will
improve over the coming year, most publics
continue to blame their own government,rather than banks or the United States, for
their country’s current economic problems.
In nearly all nations, people describe rising
prices and a lack of job opportunities as very
big problems. Only in China, Israel and
Germany do publics characterize inflation and
job shortages as less pressing issues. When
asked who is to blame for people not having
jobs, majorities in most countries fault outside
forces rather than the unemployed themselves.
Yet, despite economic concerns, public support
for economic globalization appears strong, with majorities worldwide describing the
expansion of international trade and business ties as a good thing.
Most Unhappy With Country Direction
Majorities in 18 of 23 surveyed countries are unhappy with their country’s direction.
Dissatisfaction is most intense in Pakistan, where roughly nine-in-ten (92%) say they are
displeased with the way things are going. Large majorities elsewhere also express
Satisfaction With Country
Direction
PEW RESEARCH CENTER Q2.

8/3/2019 Pew Global Attitudes Balance of Power U.S. Image Report FINAL July 13 2011
http://slidepdf.com/reader/full/pew-global-attitudes-balance-of-power-us-image-report-final-july-13-2011 45/160
Pew Research Center’s Global Attitudes Project – www.pewglobal.org
43
discontent, including in
Lebanon (87%), Ukraine
(87%), the Palestinian
territories (85%), Spain(83%) and Kenya (81%).
In the past year, the most
dramatic increase in
dissatisfaction has occurred
in Poland, where 66% are
now unhappy with the
country’s direction,
compared with 47% a year
ago. Dissatisfaction has alsointensified in several other
countries, including the U.S.,
where discontent has swelled
from 62% in 2010 to 73%
today. Pakistanis and
Spaniards, too, are less
happy than last year. In fact,
in Spain, dissatisfaction with
the country’s direction is at
its highest level (83%) since
2002.
Only in China (85%), Egypt (65%), Brazil (52%) and India (51%) do more than half
express satisfaction with the way things are going in their country. The Chinese public
has been consistently upbeat since 2005; Egyptians have not.
A year ago, just 28% of Egyptians were happy with the direction their country was
headed. The 37-point jump in satisfaction compared with last year is most likely linked
to renewed optimism, following the popular uprising that unseated Hosni Mubarak inFebruary. (For a more detailed analysis of Egyptians’ views about their country’s
direction, see “Egyptians Embrace Revolt Leaders, Religious Parties and Military, As
Well,” released April 25, 2011.)
Dissatisfaction With Country Direction
2002 2003 2004 2005 2006 2007 2008 2009 2010 2011
% % % % % % % % % %
U.S. 55 -- 55 57 65 71 70 61 62 73Britain 64 49 58 51 58 66 65 76 63 61
France 67 56 68 71 80 78 71 73 74 75
Germany 66 73 78 73 67 66 63 54 59 54
Spain -- 52 -- 44 46 45 43 77 76 83
Lithuania -- -- -- -- -- -- -- 90* -- 81
Poland 87 -- -- 82 -- 74 47 67 47 66
Russia 71 64 69 71 62 56 43 65 59 60
Ukraine 89 -- -- -- -- 88 -- 88* -- 87
Turkey 93 79 58 55 56 58 75 75 60 49
Egypt -- -- -- -- 42 51 57 67 69 34
Jordan 78 56 30 30 44 42 47 52 64 54
Lebanon 92 84 -- 59 -- 92 92 87 86 87
Palest. ter. -- 92 -- -- -- 91 -- 91 -- 85
Israel -- 71 -- -- -- 79 -- 72 -- 56
China 33 -- -- 19 13 12 11 9 9 10
India -- -- -- -- -- -- -- -- -- 47
Indonesia 92 85 -- 64 73 77 68 58 56 61
Japan 86 -- -- -- 72 71 74 73 76 72
Pakistan 39 67 41 39 58 57 73 89 84 92
Brazil -- -- -- -- -- -- -- -- 49 46
Mexico 79 -- -- -- -- 66 68 78 79 76
Kenya 90 -- -- -- -- 54 -- 90 82 81
* Data from Fall 2009 survey.
Red box indicates a double-digit change in dissatisfaction between 2010 and 2011.
PEW RESEARCH CENTER Q2.

8/3/2019 Pew Global Attitudes Balance of Power U.S. Image Report FINAL July 13 2011
http://slidepdf.com/reader/full/pew-global-attitudes-balance-of-power-us-image-report-final-july-13-2011 46/160
Pew Research Center’s Global Attitudes Project – www.pewglobal.org
44
8
32
42
45
46
48
61
64
64
68
68
65
71
75
80
83
85
85
85
88
89
90
92
88
67
56
54
54
49
38
35
34
33
30
29
26
26
18
17
15
13
12
10
10
9
6
China
Germany
India
Brazil
Israel
Turkey
Indonesia
Palest. ter.
Egypt
Jordan
Mexico
Russia
Poland
Kenya
U.S.
France
Britain
Lebanon
Pakistan
Japan
Spain
Lithuania
Ukraine
Bad Good
Economic Recovery Still Distant
In 18 of 23 nations, less than half describe the
economic situation in their country as good.In the U.S., France, Britain, Lebanon and
Pakistan fewer than one-in-five offer a positive
assessment of the national economy. In Japan,
Spain, Lithuania, and Ukraine, one-in-ten or
fewer are upbeat about the economy.
Only in a handful of countries do majorities say
the economic situation in their country is good.
The Chinese public is the most positive, with
nearly nine-in-ten (88%) describing thedomestic economy as good. In Germany, two-
thirds echo this view, while over half in India
(56%), Israel (54%) and Brazil (54%) favorably
assess the economic situation in their country.
Turks, meanwhile, are evenly split on the issue:
49% say the national economy is good,
compared with 48% who say it is bad.
Following the global downturn, public
assessments of the economy have rebounded
to a greater degree in Germany than in the U.S.
or other Western European countries. The
number of Germans who are upbeat about the economic situation in their country rose
16 percentage points between 2009 and 2010 and another 23 points in the past year.
Meanwhile, in the U.S., Britain, France and Spain, confidence in the economy has yet to
return to pre-2008 levels, and has even declined slightly in the U.S. and Britain
compared with a year ago.
Besides Germany, economic assessments have also grown more positive in several othernations, including Israel (+22 percentage points from 2009), the Palestinian territories
(+18 points from 2009) and Turkey (+15 points from 2010).
Egyptians, too, while still far more pessimistic than they were four years earlier, are
more upbeat than they were in 2010, with 34% describing the economic situation in their
Current Economic Situation
PEW RESEARCH CENTER Q4.

8/3/2019 Pew Global Attitudes Balance of Power U.S. Image Report FINAL July 13 2011
http://slidepdf.com/reader/full/pew-global-attitudes-balance-of-power-us-image-report-final-july-13-2011 47/160
Pew Research Center’s Global Attitudes Project – www.pewglobal.org
45
country as good, compared
with 20% the previous year.
However, Egyptians’
improved opinion of theeconomy may reflect hopes
for the future, more than
actual changes on the
ground.
Poland has witnessed the
largest decline in economic
confidence among the
nations surveyed. A year
ago, 53% of Poles describedthe economic situation in
their country as good; today,
just 26% hold this view.
Double-digit declines have
also taken place since last
year in Kenya (-17 percentage
points) and Indonesia (-12
points).
Uncertain Future
Across the globe, opinion
varies as to whether economic conditions will improve in the near term. In 10 of 23
countries, majorities or pluralities believe the next 12 months will usher in better
economic conditions. However, in the remaining nations, prevailing views are less
optimistic, with most anticipating economic circumstances will either remain the same
or worsen.
Publics in the emerging economies of China, Brazil and India are the most upbeat about
economic change. In China, more than eight-in-ten (84%) believe the economic
situation in their country will improve over the next 12 months. Since 2008, strong
majorities of Chinese have consistently predicted better economic times ahead.
National Economic Situation
% Good
2002 2007 2008 2009 2010 2011
10-11
Change
% % % % % % %
U.S. 46 50 20 17 24 18 -6
Germany 27 63 53 28 44 67 +23
France 45 30 19 14 13 17 +4
Spain -- 65 35 13 13 10 -3
Britain 65 69 30 11 20 15 -5
Lithuania -- -- -- 3 -- 9 +6*
Ukraine 10 19 -- 5 -- 6 +1*
Russia 13 38 52 20 33 29 -4
Poland 7 36 52 29 53 26 -27
Turkey 14 46 21 24 34 49 +15
Israel -- 46 -- 32 -- 54 +22*Palest. ter. -- 10 -- 17 -- 35 +18*
Egypt -- 53 44 27 20 34 +14
Jordan 33 44 39 33 30 33 +3
Lebanon 5 9 10 11 13 13 0
Japan 6 28 13 10 12 10 -2
China 52 82 82 88 91 88 -3
Pakistan 49 59 41 22 18 12 -6
Indonesia 15 23 20 48 50 38 -12
India -- -- -- -- -- 56 --
Mexico 31 51 36 30 24 30 +6
Brazil -- -- -- -- 62 54 -8
Kenya 7 60 -- 19 43 26 -17
* Change is from Spring 2009 to 2011 in the Palestinian territories and Israel.Change is from Fall 2009 in Lithuania and Ukraine.
PEW RESEARCH CENTER Q4.

8/3/2019 Pew Global Attitudes Balance of Power U.S. Image Report FINAL July 13 2011
http://slidepdf.com/reader/full/pew-global-attitudes-balance-of-power-us-image-report-final-july-13-2011 48/160
Pew Research Center’s Global Attitudes Project – www.pewglobal.org
46
84
79
60
56
48
45
44
42
39
38
37
36
34
31
30
28
25
21
1717
15
15
13
10
14
19
26
29
19
18
25
31
42
47
44
32
26
34
46
26
43
3231
45
36
15
2
7
16
17
22
31
31
31
29
20
12
18
33
43
35
18
47
31
5252
32
44
60
China
Brazil
India
Egypt
Mexico
Kenya
Turkey
U.S.
Palest. ter.
Germany
Indonesia
Israel
Jordan
Britain
Spain
Russia
Lebanon
Lithuania
FranceJapan
Poland
Ukraine
Pakistan
Improve Remain the same Worsen
Almost as many Brazilians (79%) as Chinese
anticipate economic improvements over the
next 12 months. A substantial majority of
Indians (60%) share this sense of optimism.
In Egypt, a majority (56%) is confident that the
national economy will improve in the coming
year. This is a huge shift in the Egyptian
public’s outlook – in 2010, just 25% expressed
confidence that better economic conditions
would emerge in the near term.
Pluralities in Mexico (48%), Kenya (45%),
Turkey (44%), the U.S. (42%), the Palestinianterritories (39%) and Jordan (34%) also
predict improved economic circumstances in
the coming year. Turkish attitudes have
brightened considerably – a year ago, just a
quarter foresaw better economic times. By
contrast, confidence in the economy’s future
has fallen 14 points among Americans,
dropping from 56% in spring 2010.
The prevailing view among Indonesians (47%),
Russians (46%), Poles (45%), Israelis (44%),
Lithuanians (43%) and Germans (42%) is that
economic conditions will remain the same over
the next 12 months. Elsewhere, pluralities
anticipate that the economic situation in their
country will actually worsen in the coming
year. Some of the most pessimistic publics are
found in Pakistan (60% worsen), France (52%) and Japan (52%).
Will the Economic Situation…
PEW RESEARCH CENTER Q5.

8/3/2019 Pew Global Attitudes Balance of Power U.S. Image Report FINAL July 13 2011
http://slidepdf.com/reader/full/pew-global-attitudes-balance-of-power-us-image-report-final-july-13-2011 49/160
Pew Research Center’s Global Attitudes Project – www.pewglobal.org
47
Blame for Economic Troubles
Among those who describe economic
conditions in their country as bad, most believe their own government is at fault –
continuing a pattern seen in 2010. Finger-
pointing at banks and other financial
institutions is most prevalent in Western
Europe, as it was last year. In general, more
people continue to find fault with themselves,
rather than the U.S., when it comes to bad
economic times at home.
In countries where majorities say theeconomic situation is poor, the predominant
view is that the national government is to
blame. In places as far-ranging as Lebanon,
Indonesia, Pakistan, Mexico, Poland,
Lithuania, Ukraine and Russia, three-quarters
or more who think economic conditions are
bad point to government as either the primary
or secondary reason. Roughly two-thirds or
more in Britain, Jordan, France and Spain also
fault their government.
The idea that banks and other financial
institutions are to blame for struggling
economies is especially popular among
Europeans who report bad economic times at
home. Majorities in Britain (75%), Spain
(75%), Germany (68%), France (65%) and
Lithuania (60%) fault banks and related institutions for economic problems. In Spain,
the percentage holding banks responsible has increased 9 percentage points from 2010, while it has held steady in Britain and slipped in France and Germany (down 5 and 9
points, respectively).
In general, relatively few people hold the U.S. responsible for the economic misfortunes
of their country. Only in the Palestinian territories do as many as half of those
Who’s to Blame for CurrentEconomic Problems?
Ourgov’t
Banks,financial
institutions U.S. EU Ourselves
% % % % %
Britain 70 75 9 9 18
France 68 65 8 34 21
Germany 71 68 9 21 18
Spain 65 75 12 12 26
Lithuania 87 60 4 11 16
Poland 86 37 7 22 19
Russia 77 27 12 4 24
Ukraine 86 27 7 5 30
Turkey 87 21 32 14 21
Jordan 70 59 39 8 15
Lebanon 85 31 19 3 45
Palest. ter. 78 22 51 22 24
Israel 90 39 6 2 35
China 62 43 20 7 16
India 91 17 4 4 48
Indonesia 93 31 6 2 49
Pakistan 90 16 29 1 33
Brazil 89 31 5 1 58
Mexico 93 30 20 1 34Kenya 95 21 2 1 49
Asked only of people who said economy was “bad” in Q4.
Not asked in Egypt or Japan.
Total adds to more than 100% because of multipleresponses.
“Who is most to blame for (survey country’s) currenteconomic problems? Is it…” & “Who is second most to blamefor (survey country’s) current economic problems?”
PEW RESEARCH CENTER Q6 & Q7.

8/3/2019 Pew Global Attitudes Balance of Power U.S. Image Report FINAL July 13 2011
http://slidepdf.com/reader/full/pew-global-attitudes-balance-of-power-us-image-report-final-july-13-2011 50/160
Pew Research Center’s Global Attitudes Project – www.pewglobal.org
48
describing their economy as poor point the finger at the U.S.
(51%). Smaller numbers blame the U.S. in Jordan (39%),
Turkey (32%) and Pakistan (29%), while just one-in-five or
fewer in the other surveyed nations say the U.S. is culpable fortheir country’s economic troubles. The percentage blaming
the U.S. is actually down in 6 of 15 nations, for which there are
comparable data from 2010. In only one country, Turkey, do
substantially more people point to the U.S. as the cause of their
country’s economic problems (32% today vs. 24% in 2010).
Roughly half or more in Brazil (58%), Indonesia (49%), Kenya
(49%), India (48%), and Lebanon (45%) blame themselves for
the bad economic situation in their country. Fewer elsewhere
share this view, but overall, more tend to fault themselvesrather than the U.S. In Kenya, compared with last year, there
has been a 10-point increase in the number of people holding
themselves responsible for their country’s economic troubles.
In Germany the percentage has risen 8 percentage points and
in Russia 7 points.
Many Worried About Prices and Jobs
Rising prices and a lack of job opportunities are significant
concerns in nearly all the countries surveyed. In most cases,
worries about inflation and jobs track relatively closely.
In 19 0f 22 nations, most people say rising prices are a very big problem, including
overwhelming majorities in Pakistan (97%), Kenya (93%), Lebanon (89%), Lithuania
(86%), the Palestinian territories (83%) and Indonesia (81%). Even in some countries
where publics are generally content, large numbers worry about inflation. In India and
Brazil, for example, roughly eight-in-ten (83% and 79%, respectively) describe rising
prices as a very big problem.
Inflation worries are closely coupled with concerns about unemployment. In the same
countries where majorities see rising prices as a pressing issue, half or more also say a
lack of job opportunities is a very big problem. In several Western nations, however,
worries about job shortages significantly trump apprehensions about price increases.
How Big of a ProblemIs…
% Very big problem
Rising
prices
Lack of
jobs
% %
U.S. 57 71
Britain 55 71
France 70 80
Germany 32 33
Spain 60 86
Lithuania 86 88
Poland 66 56
Russia 62 59
Ukraine 76 75
Turkey 66 73
Egypt 58 56
Jordan 64 62
Lebanon 89 89
Palest. ter. 83 85
Israel 47 43
China 49 37
India 83 75
Indonesia 81 68
Pakistan 97 95
Brazil 79 74
Mexico 74 70
Kenya 93 93
Not asked in Japan.
PEW RESEARCH CENTER Q13 & Q13b.
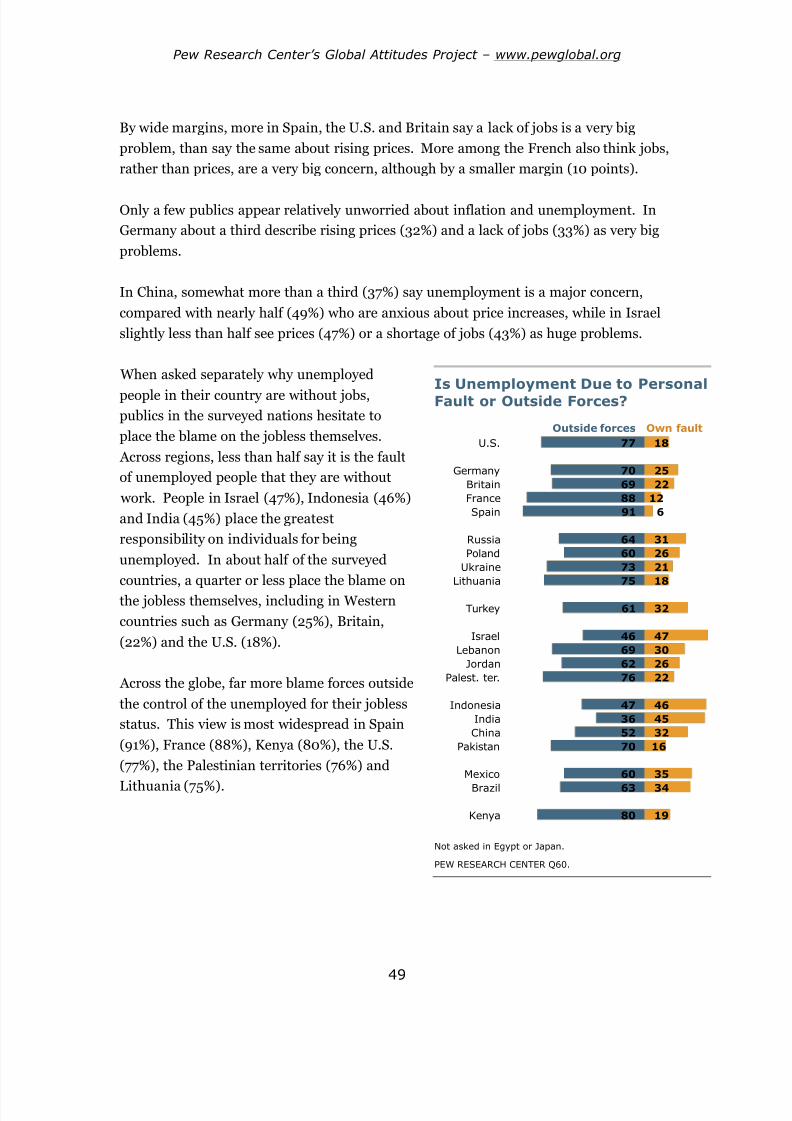
8/3/2019 Pew Global Attitudes Balance of Power U.S. Image Report FINAL July 13 2011
http://slidepdf.com/reader/full/pew-global-attitudes-balance-of-power-us-image-report-final-july-13-2011 51/160
Pew Research Center’s Global Attitudes Project – www.pewglobal.org
49
77
70
69
88
91
64
60
73
75
61
46
69
62
76
47
36
52
70
60
63
80
18
25
22
12
6
31
26
21
18
32
47
30
26
22
46
45
32
16
35
34
19
U.S.
Germany
Britain
France
Spain
Russia
Poland
Ukraine
Lithuania
Turkey
Israel
Lebanon
Jordan
Palest. ter.
Indonesia
India
China
Pakistan
Mexico
Brazil
Kenya
Own faultOutside forces
By wide margins, more in Spain, the U.S. and Britain say a lack of jobs is a very big
problem, than say the same about rising prices. More among the French also think jobs,
rather than prices, are a very big concern, although by a smaller margin (10 points).
Only a few publics appear relatively unworried about inflation and unemployment. In
Germany about a third describe rising prices (32%) and a lack of jobs (33%) as very big
problems.
In China, somewhat more than a third (37%) say unemployment is a major concern,
compared with nearly half (49%) who are anxious about price increases, while in Israel
slightly less than half see prices (47%) or a shortage of jobs (43%) as huge problems.
When asked separately why unemployed
people in their country are without jobs,publics in the surveyed nations hesitate to
place the blame on the jobless themselves.
Across regions, less than half say it is the fault
of unemployed people that they are without
work. People in Israel (47%), Indonesia (46%)
and India (45%) place the greatest
responsibility on individuals for being
unemployed. In about half of the surveyed
countries, a quarter or less place the blame on
the jobless themselves, including in Western
countries such as Germany (25%), Britain,
(22%) and the U.S. (18%).
Across the globe, far more blame forces outside
the control of the unemployed for their jobless
status. This view is most widespread in Spain
(91%), France (88%), Kenya (80%), the U.S.
(77%), the Palestinian territories (76%) and
Lithuania (75%).
Is Unemployment Due to Personal
Fault or Outside Forces?
Not asked in Egypt or Japan.
PEW RESEARCH CENTER Q60.

8/3/2019 Pew Global Attitudes Balance of Power U.S. Image Report FINAL July 13 2011
http://slidepdf.com/reader/full/pew-global-attitudes-balance-of-power-us-image-report-final-july-13-2011 52/160
Pew Research Center’s Global Attitudes Project – www.pewglobal.org
50
50
58
44
40
58
47
25
39
33
33
27
48
48
56
14
40
29
24
31
41
18
47
38
51
55
33
44
64
48
50
50
56
34
34
25
67
40
50
54
46
35
49
Lebanon
Spain
Israel
Germany
Kenya
Lithuania
China
Britain
Russia
Indonesia
France
Turkey
India
Pakistan
Brazil
Ukraine
Mexico
Poland
Jordan
Palest. ter.
U.S.
Very good Somewhat goodNET
97
96
95
95
91
91
89
87
83
83
83
82
82
81
81
80
79
78
77
76
67
International Trade Still Favored
Despite widespread feelings of economic malaise, and specific worries about inflation
and unemployment, publics in the nations surveyed see increased international tradeand business ties as a good thing. However, not everywhere do people feel as strongly
about the benefits of such ties.
Majorities in all parts of the globe say growing international trade and business ties is a
good thing for their country. Roughly nine-in-ten or more share this view in Lebanon
(97%), Spain (96%), Israel (95%), Germany (95%), Kenya (91%), Lithuania (91%) and
China (89%). Public enthusiasm for trade is especially notable in Lebanon, Spain and
Kenya – all countries where large majorities
are unhappy with both their country’s direction
and the domestic economy. In the othernations surveyed, no less than two-thirds
endorse expanded trade and business ties with
other countries.
While overall views of international trade are
positive across regions, the intensity of support
varies by country. In Spain (58%), Kenya
(58%) and Pakistan (56%) majorities say trade
is very good for their country. Roughly half in
Lebanon (50%), Turkey (48%), India (48%)
and Lithuania (47%) concur. By contrast, just
14% of Brazilians and 18% of Americans think
increased trade and business ties with other
nations are very good for their country.
In China, just a quarter believe international
trade is very good for their country, up slightly
from 2010. The percentage describing trade as very good jumped 25 percentage points in
Spain between 2010 and 2011.
Are Trade and Business Ties Goodfor the Country?
PEW RESEARCH CENTER Q19.
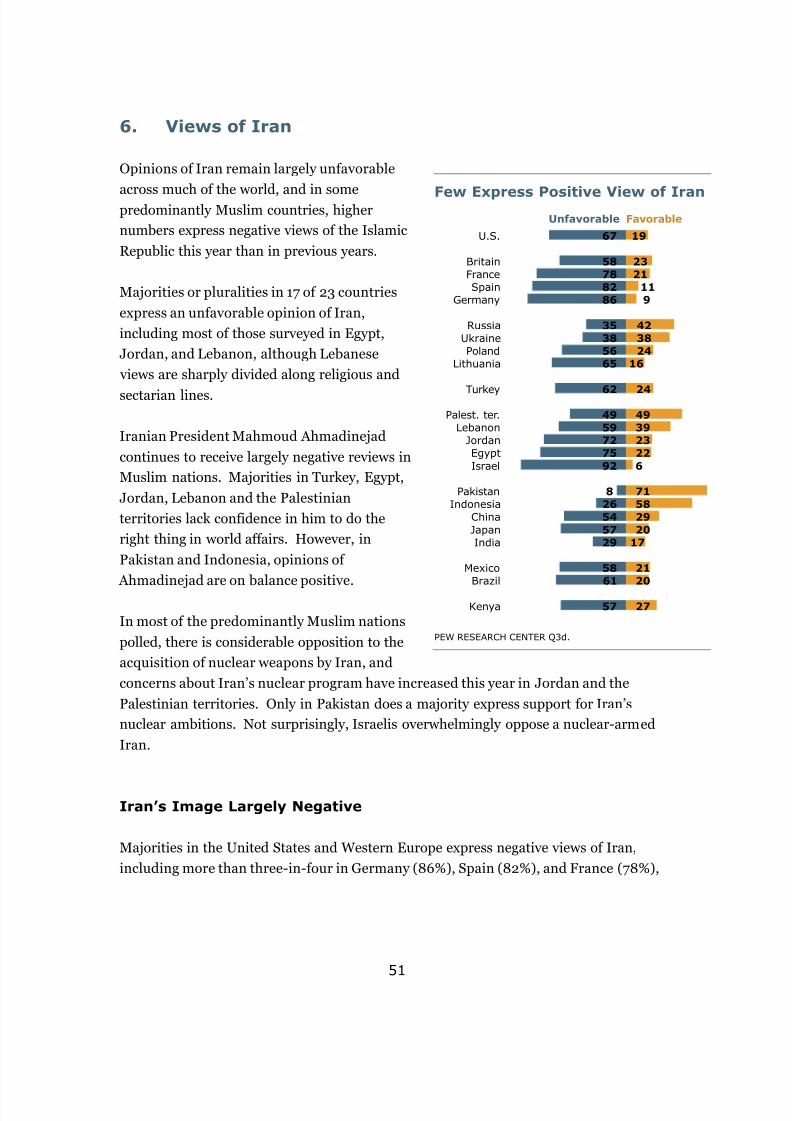
8/3/2019 Pew Global Attitudes Balance of Power U.S. Image Report FINAL July 13 2011
http://slidepdf.com/reader/full/pew-global-attitudes-balance-of-power-us-image-report-final-july-13-2011 53/160
51
67
58
78
82
86
35
38
56
65
62
49
59
72
75
92
8
26
54
57
29
58
61
57
19
23
21
11
9
42
38
24
16
24
49
39
23
22
6
71
58
29
20
17
21
20
27
U.S.
Britain
France
Spain
Germany
Russia
Ukraine
Poland
Lithuania
Turkey
Palest. ter.
Lebanon
Jordan
Egypt
Israel
Pakistan
Indonesia
China
Japan
India
Mexico
Brazil
Kenya
FavorableUnfavorable
6. Views of Iran
Opinions of Iran remain largely unfavorable
across much of the world, and in somepredominantly Muslim countries, higher
numbers express negative views of the Islamic
Republic this year than in previous years.
Majorities or pluralities in 17 of 23 countries
express an unfavorable opinion of Iran,
including most of those surveyed in Egypt,
Jordan, and Lebanon, although Lebanese
views are sharply divided along religious and
sectarian lines.
Iranian President Mahmoud Ahmadinejad
continues to receive largely negative reviews in
Muslim nations. Majorities in Turkey, Egypt,
Jordan, Lebanon and the Palestinian
territories lack confidence in him to do the
right thing in world affairs. However, in
Pakistan and Indonesia, opinions of
Ahmadinejad are on balance positive.
In most of the predominantly Muslim nations
polled, there is considerable opposition to the
acquisition of nuclear weapons by Iran, and
concerns about Iran’s nuclear program have increased this year in Jordan and the
Palestinian territories. Only in Pakistan does a majority express support for Iran’s
nuclear ambitions. Not surprisingly, Israelis overwhelmingly oppose a nuclear-armed
Iran.
Iran’s Image Largely Negative
Majorities in the United States and Western Europe express negative views of Iran,
including more than three-in-four in Germany (86%), Spain (82%), and France (78%),
Few Express Positive View of Iran
PEW RESEARCH CENTER Q3d.

8/3/2019 Pew Global Attitudes Balance of Power U.S. Image Report FINAL July 13 2011
http://slidepdf.com/reader/full/pew-global-attitudes-balance-of-power-us-image-report-final-july-13-2011 54/160
Pew Research Center’s Global Attitudes Project – www.pewglobal.org
52
59
4846
35
33
22
4946
41
30
37
23
0
10
20
30
40
50
60
70
2006 2007 2008 2009 2010 2011
Egypt Jordan
and two-thirds in the U.S. (67%). A smaller majority in Britain (58%) shares this
opinion.
Views of Iran are more mixed across Eastern Europe. Russians, on balance, have afavorable view of Iran, while Ukrainians are evenly divided. Majorities express a
negative opinion in Poland (56%) and Lithuania (65%).
Roughly nine-in-ten Israelis (92%) have an
unfavorable opinion of Iran, although among
Israel’s minority Arab community, views are
divided, with 45% expressing a positive and
44% a negative opinion.
Iran receives mostly negative marks in four of the seven predominantly Muslim nations
polled: Egypt, Jordan, Turkey and Lebanon.
Opinions are evenly divided in the Palestinian
territories, where roughly half (49%) have a
favorable view of Iran, while the same
percentage have a negative opinion. Pakistan
(71%) and Indonesia (58%) are the only
countries where majorities express favorable
opinions of the Islamic Republic.
Both Egyptians and Jordanians have become
increasingly negative in their views of Iran
over the last few years. A majority of Egyptians had a favorable view of Iran in 2006
(59%), but currently only 22% hold this view, down from 33% last year.
A similar decline has taken place in Jordan. About half (49%)
of Jordanians expressed a positive view of Iran in 2006,
however just 23% now express this opinion.
In Lebanon, roughly one-in-four Lebanese Christians (26%)
have a positive view, while just 12% of Sunni Muslims assign a
favorable rating to the largely Shia Islamic Republic. Lebanese
Shia Muslims, however, voice overwhelmingly positive views of
Iran – 84% have a favorable opinion.
Favorable Views of Iran Becoming
Less Common in Egypt and Jordan
% Favorable
PEW RESEARCH CENTER Q3d.
Sharply Divided
Views of Iran in
Lebanon
Fav Unfav DK% % %
Lebanon 39 59 2
Christian 26 72 2
Sunni 12 84 3
Shia 84 16 0
PEW RESEARCH CENTER Q3d.

8/3/2019 Pew Global Attitudes Balance of Power U.S. Image Report FINAL July 13 2011
http://slidepdf.com/reader/full/pew-global-attitudes-balance-of-power-us-image-report-final-july-13-2011 55/160
Pew Research Center’s Global Attitudes Project – www.pewglobal.org
53
Views of Iran’s Leader
Majorities in five of the seven predominantly
Muslim nations surveyed – Egypt, Jordan,Lebanon, Turkey and the Palestinian
territories – express little or no confidence in
Iranian President Mahmoud Ahmadinejad.
Moreover, ratings for Ahmadinejad have fallen
significantly since last year in Egypt and
Jordan. Nearly three-in-ten Egyptians (28%)
expressed confidence in him last year,
compared with just 18% today. Among
Jordanians, confidence in Ahmadinejaddeclined from 32% to 23%.
As is the case with overall ratings for Iran,
public opinion in Lebanon about Ahmadinejad remains divided along sectarian and
religious lines. Nearly nine-in-ten (86%) Shia Muslims have confidence in the Iranian
president, compared with only 18% of Christians and just 9% of Sunnis.
Ahmadinejad receives his most favorable reviews in Indonesia and Pakistan, where on
balance, he gets positive ratings. Roughly half of Indonesians (48%) have a lot or some
confidence in him, while 28% lack confidence. In Pakistan, 40% express confidence;
16% lack confidence; and fully 44% offer no opinion.
Israelis give the Iranian president his worst ratings – overall, 95% of Israelis say they
have not too much or no confidence that Ahmadinejad will do the right thing in world
affairs. This view is shared by 73% of Israeli Arabs.
Confidence in Ahmadinejad
A lot/Some
Not much/None DK
% % %
Indonesia 48 28 24
Palest. ter. 40 57 2
Pakistan 40 16 44
Lebanon 35 63 1
Christian 18 81 1
Sunni 9 90 1
Shia 86 14 0
Jordan 23 75 3
Turkey 21 61 18
Egypt 18 80 1
Israel 2 95 2
PEW RESEARCH CENTER Q48f.

8/3/2019 Pew Global Attitudes Balance of Power U.S. Image Report FINAL July 13 2011
http://slidepdf.com/reader/full/pew-global-attitudes-balance-of-power-us-image-report-final-july-13-2011 56/160
Pew Research Center’s Global Attitudes Project – www.pewglobal.org
54
Opposition to Iran’s Nuclear Program
In nearly every predominantly Muslim country
polled there is widespread opposition to Iranacquiring nuclear weapons. More than six-in-
ten Lebanese (64%), Egyptians (63%) and
Turks (65%) oppose the idea of a nuclear-
armed Iran. Only in Pakistan does a majority
of respondents (61%) support Iran’s nuclear
ambitions.
Lebanese public opinion once again reflects
wide sectarian and religious differences.
Support for Iran’s nuclear program stands at78% among the Shia community, compared
with just 23% of Christians and 6% of Sunnis.
Fully 93% of Israelis oppose Iran acquiring nuclear weapons. Among the country’s Arab
community, 58% oppose this idea, while 25% favor a nuclear-armed Iran and 17% give
no opinion.
Iran Acquiring Nuclear Weapons
Favor Oppose DK
% % %
Pakistan 61 11 28
Palest. ter. 38 55 7
Lebanon 34 64 3
Christian 23 74 3
Sunni 6 91 3
Shia 78 21 1
Egypt 26 63 11
Indonesia 25 57 18
Jordan 22 70 8
Turkey 20 65 14Israel 4 93 3
PEW RESEARCH CENTER Q83.

8/3/2019 Pew Global Attitudes Balance of Power U.S. Image Report FINAL July 13 2011
http://slidepdf.com/reader/full/pew-global-attitudes-balance-of-power-us-image-report-final-july-13-2011 57/160
55
61
88
84
75
67
68
52
41
37
12
49
43
35
28
14
81
62
48
44
8
63
38
86
U.S.
Germany
France
Britain
Spain
Lithuania
Poland
Russia
Ukraine
Turkey
Israel
Lebanon
Egypt
Jordan
Palest. ter.
Japan
Indonesia
India
China
Pakistan
Brazil
Mexico
Kenya
46
69
80
64
69
64
51
47
49
4
57
35
23
25
23
13
30
6
23
16
41
N/A
N/A
45
44
48
44
41
38
35
34
30
1
40
51
25
27
31
48
22
17
26
5
22
12
40
31
42
32
35
17
38
24
70
58
7
27
38
14
22
24
25
40
6
17
15
41
N/A
N/A
7. Ratings of World Leaders
In most parts of the world, publics continue to express more confidence in U.S. President
Barack Obama than in key European leaders tested in the survey. As in previoussurveys, German Chancellor Angela Merkel is popular in European countries, but not
well-known in the rest of the world. French President Nicolas Sarkozy and Russian
President Dmitri Medvedev are generally less popular than Merkel in Western Europe,
but also virtually unknown in many other countries surveyed. Meanwhile, Saudi King
Abdullah is well-regarded in most of the predominantly Muslim nations surveyed, and
Indian Prime Minister Manmohan Singh is valued for his foreign policy leadership in
India, but inspires far less confidence in neighboring China and Pakistan.
Confidence in World Leaders
Obama Merkel Sarkozy Medvedev
Percentage expressing at least some confidence in _________ regarding world affairs.
Merkel and Medvedev not asked in Egypt and Japan.
PEW RESEARCH CENTER Q48a, Q48b, Q48d & Q48h.
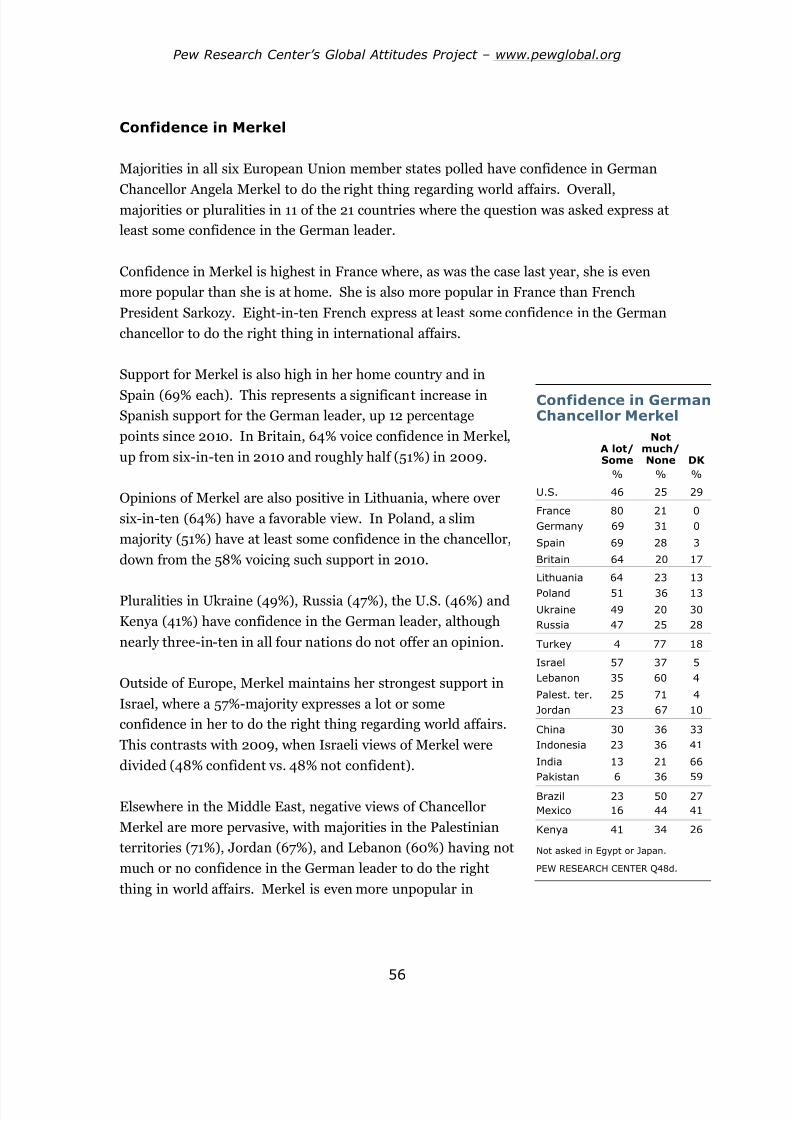
8/3/2019 Pew Global Attitudes Balance of Power U.S. Image Report FINAL July 13 2011
http://slidepdf.com/reader/full/pew-global-attitudes-balance-of-power-us-image-report-final-july-13-2011 58/160
Pew Research Center’s Global Attitudes Project – www.pewglobal.org
56
Confidence in Merkel
Majorities in all six European Union member states polled have confidence in German
Chancellor Angela Merkel to do the right thing regarding world affairs. Overall,majorities or pluralities in 11 of the 21 countries where the question was asked express at
least some confidence in the German leader.
Confidence in Merkel is highest in France where, as was the case last year, she is even
more popular than she is at home. She is also more popular in France than French
President Sarkozy. Eight-in-ten French express at least some confidence in the German
chancellor to do the right thing in international affairs.
Support for Merkel is also high in her home country and in
Spain (69% each). This represents a significant increase inSpanish support for the German leader, up 12 percentage
points since 2010. In Britain, 64% voice confidence in Merkel,
up from six-in-ten in 2010 and roughly half (51%) in 2009.
Opinions of Merkel are also positive in Lithuania, where over
six-in-ten (64%) have a favorable view. In Poland, a slim
majority (51%) have at least some confidence in the chancellor,
down from the 58% voicing such support in 2010.
Pluralities in Ukraine (49%), Russia (47%), the U.S. (46%) and
Kenya (41%) have confidence in the German leader, although
nearly three-in-ten in all four nations do not offer an opinion.
Outside of Europe, Merkel maintains her strongest support in
Israel, where a 57%-majority expresses a lot or some
confidence in her to do the right thing regarding world affairs.
This contrasts with 2009, when Israeli views of Merkel were
divided (48% confident vs. 48% not confident).
Elsewhere in the Middle East, negative views of Chancellor
Merkel are more pervasive, with majorities in the Palestinian
territories (71%), Jordan (67%), and Lebanon (60%) having not
much or no confidence in the German leader to do the right
thing in world affairs. Merkel is even more unpopular in
Confidence in GermanChancellor Merkel
A lot/Some
Notmuch/None DK
% % %
U.S. 46 25 29
France 80 21 0
Germany 69 31 0
Spain 69 28 3
Britain 64 20 17
Lithuania 64 23 13
Poland 51 36 13
Ukraine 49 20 30
Russia 47 25 28
Turkey 4 77 18
Israel 57 37 5
Lebanon 35 60 4
Palest. ter. 25 71 4
Jordan 23 67 10
China 30 36 33
Indonesia 23 36 41
India 13 21 66
Pakistan 6 36 59
Brazil 23 50 27
Mexico 16 44 41
Kenya 41 34 26
Not asked in Egypt or Japan.
PEW RESEARCH CENTER Q48d.

8/3/2019 Pew Global Attitudes Balance of Power U.S. Image Report FINAL July 13 2011
http://slidepdf.com/reader/full/pew-global-attitudes-balance-of-power-us-image-report-final-july-13-2011 59/160
Pew Research Center’s Global Attitudes Project – www.pewglobal.org
57
Turkey, where more than three-quarters (77%) voice little or no confidence in her.
Confidence in the German leader has declined in China less than a year after a well-
publicized visit by Merkel to bolster trade ties. Only three-in-ten Chinese expressconfidence in the German leader, down 10 percentage points since 2010.
Elsewhere, many offer no opinion about Merkel. Pluralities in India (66%), Pakistan
(59%) and Indonesia (41%) said they could not assess her ability to handle world affairs.
Confidence in Sarkozy
As in previous surveys, European Union publics express far less
confidence in French President Nicolas Sarkozy than inGerman Chancellor Merkel. In fact, there is no European
nation, including France, where a majority has confidence in
the French leader. And majorities or pluralities in only four of
the 23 countries surveyed voice at least some confidence in the
French president to do the right thing in international affairs.
Among the EU nations surveyed, President Sarkozy garners the
most confidence in his home country. Nevertheless, opinions
are closely divided – about half (48%) have confidence in their
leader when it comes to doing the right thing in global affairs,
while 52% express not much or no confidence. Around four-in-
ten in Britain (44%), Germany (44%), Spain (41%) and
Lithuania (38%) express confidence in President Sarkozy
regarding international affairs. In Poland, only 35% have
confidence, a striking 17 percentage point decline from the
52%-majority saying the same in 2010.
Pluralities in Japan (48%), the U.S. (45%), and Kenya (40%)
have confidence in the French leader. Japanese opinion of President Sarkozy is up sharply (+11 percentage points) from
2010 when less than four-in-ten (37%) had at least some
confidence in France’s president.
Confidence in FrenchPresident Sarkozy
A lot/Some
Notmuch/None DK
% % %
U.S. 45 32 23
France 48 52 0
Britain 44 44 12
Germany 44 55 2
Spain 41 56 2
Lithuania 38 45 17
Poland 35 49 17
Russia 34 38 28
Ukraine 30 36 34
Turkey 1 80 18
Lebanon 51 48 1
Israel 40 55 5
Palest. ter. 31 67 2
Jordan 27 70 4
Egypt 25 71 4
Japan 48 37 14
China 26 41 32
Indonesia 22 39 39India 17 18 65
Pakistan 5 31 63
Brazil 22 55 23
Mexico 12 46 42
Kenya 40 34 26
PEW RESEARCH CENTER Q48h.

8/3/2019 Pew Global Attitudes Balance of Power U.S. Image Report FINAL July 13 2011
http://slidepdf.com/reader/full/pew-global-attitudes-balance-of-power-us-image-report-final-july-13-2011 60/160
Pew Research Center’s Global Attitudes Project – www.pewglobal.org
58
As was the case in previous surveys, a majority of Lebanese have confidence in Sarkozy,
albeit a slim one (51%). Elsewhere in the Middle East, negative views of the French
president are more prevalent. Majorities in Egypt (71%), Jordan (70%), the Palestinian
territories (67%), and Israel (55%) have not much or no confidence in Sarkozy when itcomes to global affairs.
As in previous years, hardly any Turks (1%) express confidence in the French president,
with eight-in-ten voicing little or no confidence in him.
In Brazil, only about two-in-ten (22%) have confidence in President Sarkozy, down 9
percentage points from 2010. A similar number of Brazilians (23%) do not offer an
opinion. Even larger proportions in India (65%), Pakistan (63%), Mexico (42%) and
Indonesia (39%) express no view of the French leader.
Views of Medvedev
Confidence in Russian President Dmitri Medvedev to do the
right thing in world affairs is relatively low across the countries
surveyed, with the exceptions of his home country and
neighboring Ukraine. Seven-in-ten Russians have confidence
in their president, while 58% of Ukrainians have a lot or some
confidence in the Russian president regarding international
affairs.
Meanwhile, Russian views toward Prime Minister (and former
president) Vladimir Putin are also largely positive: three-
quarters have at least some confidence in Putin to do the right
thing regarding world affairs; just 19% lack confidence in their
prime minister.
Elsewhere in Europe, majorities or pluralities in all six EU
member states surveyed express not too much or no confidencein Medvedev. Confidence in Medvedev has declined
significantly in Poland (-12 percentage points) and Germany
(-8 percentage points) since last year.
Confidence in RussianPresident Medvedev
A lot/Some
Notmuch/None DK
% % %
U.S. 31 47 21
Germany 42 55 2
Britain 35 44 21
France 32 69 0
Spain 17 73 10
Russia 70 24 6
Ukraine 58 27 15
Lithuania 38 52 11
Poland 24 64 12
Turkey 7 74 20
Lebanon 38 58 4
Israel 27 69 4
Palest. ter. 22 75 3
Jordan 14 76 9
China 40 31 29
India 25 15 61
Indonesia 24 44 32Pakistan 6 45 50
Brazil 17 57 27
Mexico 15 50 35
Kenya 41 34 26
Not asked in Egypt or Japan.
PEW RESEARCH CENTER Q48b.

8/3/2019 Pew Global Attitudes Balance of Power U.S. Image Report FINAL July 13 2011
http://slidepdf.com/reader/full/pew-global-attitudes-balance-of-power-us-image-report-final-july-13-2011 61/160
Pew Research Center’s Global Attitudes Project – www.pewglobal.org
59
13
20
5
20
37
54
66
90
87
78
72
63
62
44
13
7
Jordan
Egypt
Pakistan
Indonesia
Palest. ter.
Lebanon
Turkey
Israel
A lot/Someconfidence
Not too much/No confidence
Similarly negative views of Medvedev are widespread across the Middle East, with
significant majorities in Jordan (76%), the Palestinian territories (75%), Israel (69%),
and Lebanon (58%) lacking confidence in the Russian leader.
Turks have consistently expressed little confidence in President Medvedev, with fewer
than one-in-ten (7%) currently saying they have a lot or some confidence in the Russian
president to do the right thing in the world.
In Russia’s largest neighbor, China, a slim plurality (40%) expresses confidence in the
Russian president, with about three-in-ten having little or no confidence (31%) or not
offering an opinion (29%). Elsewhere in Asia, many in India (61%) and Pakistan (50%)
do not express an opinion of Medvedev.
In Latin America, opinion of the Russian leader is negative, with nearly six-in-tenBrazilians (57%) and half of Mexicans saying they lack confidence in Medvedev.
Views of Saudi King Abdullah
Majorities in five of the seven predominantly
Muslim publics surveyed have at least some
confidence in Saudi King Abdullah to do the
right thing regarding international affairs.
Over six-in ten in Jordan (87%), Egypt (78%),
Pakistan (72%), Indonesia (63%) and the
Palestinian territories (62%) have a lot or some
confidence in the Saudi leader.
Views are more mixed in Lebanon, with 44%
expressing confidence in the Saudi king and
54% saying they have not too much or no
confidence. However, opinions about King
Abdullah, a Sunni Muslim rulingpredominantly Sunni Saudi Arabia, split
sharply along religious and sectarian lines.
Only 23% of Lebanese Shia Muslims have
confidence in him, while more than six-in-ten
Sunni Muslims (61%) voice confidence in the Saudi leader to do the right thing regarding
Confidence in Saudi King Abdullah
PEW RESEARCH CENTER Q48l.

8/3/2019 Pew Global Attitudes Balance of Power U.S. Image Report FINAL July 13 2011
http://slidepdf.com/reader/full/pew-global-attitudes-balance-of-power-us-image-report-final-july-13-2011 62/160
Pew Research Center’s Global Attitudes Project – www.pewglobal.org
60
80
37
33
24
7
8
24
30
42
69
12
39
37
34
25
India
Japan
Indonesia
China
Pakistan
A lot/Some confidence
Not too much/No confidence
DK/Refused
international affairs. Lebanese Christians are almost evenly divided; 48% express
confidence, while 51% lack confidence.
The Saudi king is less well-regarded in Turkey, where about one-in-ten (13%) say they have confidence in Abdullah; nearly two-thirds (66%) voice little or no confidence. In
Israel, only 7% say they have a lot or some confidence in the king, with nine-in-ten
saying they lack confidence in his ability to do the right thing regarding world affairs.
Views of Singh
In his home country, an overwhelming
majority (80%) express confidence in Indian
Prime Minister Manmohan Singh’s ability tohandle world affairs.
However, views of Singh are negative in
neighboring Pakistan and China, where 69%
and 42% respectively express a lack of
confidence in the Indian Prime Minister.
Outside of mainland Asia, nearly four-in-ten in
Japan (39%) and Indonesia (37%) do not offer
an opinion of the Indian leader.
Confidence in Indian PrimeMinister Manmohan Singh
PEW RESEARCH CENTER Q48o.

8/3/2019 Pew Global Attitudes Balance of Power U.S. Image Report FINAL July 13 2011
http://slidepdf.com/reader/full/pew-global-attitudes-balance-of-power-us-image-report-final-july-13-2011 63/160
61
5451
28
35
Favorable Unfavorable
UN EU
8. Rating Countries and Institutions
Overall, both the United Nations and European
Union receive largely positive ratings, althoughthere are a few countries where these
organizations are seen in a negative light.
Across the 23 nations surveyed, a median
percentage of 54% offer a favorable opinion of
the UN; a median of 51% express a positive
view of the EU.
However, while ratings for the EU remain
generally positive, its image has declined since
last year, and it receives especially low ratingsin key Arab nations such as Egypt, Jordan, and
the Palestinian territories.
And in Turkey – a country whose ambitions to
join the EU have met with resistance from
some European leaders – just 23% give the
organization a favorable rating. However, the
EU is not alone in this regard – the other nations and organizations tested also receive
some of their lowest ratings in Turkey. Also, Turkey is the only NATO member state
surveyed in which a majority has a negative opinion of the military alliance.
Russia gets mixed reviews among its European neighbors, receiving its highest marks in
Ukraine and its lowest ratings in Poland. On balance, Americans offer positive
assessments of their former Cold War rival.
The most negative ratings for Russia are found in Israel, where roughly seven-in-ten
(69%) express an unfavorable opinion. And, with a potential UN Security Council debate
over Palestinian statehood looming, Israelis also give the UN its lowest rating – again,
about seven-in-ten (69%) express a negative view. However, an almost equal number of Palestinians (67%) also give the UN an unfavorable rating.
Views o f the UN and EU
Median % across all 23 nations surveyed in 2011.
PEW RESEARCH CENTER Q3f & Q3j.

8/3/2019 Pew Global Attitudes Balance of Power U.S. Image Report FINAL July 13 2011
http://slidepdf.com/reader/full/pew-global-attitudes-balance-of-power-us-image-report-final-july-13-2011 64/160
Pew Research Center’s Global Attitudes Project – www.pewglobal.org
62
28
23
18
21
29
16
16
26
20
61
34
44
64
67
69
12
27
43
15
33
30
31
8
61
76
73
73
66
72
66
54
54
23
65
54
35
31
28
79
61
37
28
21
52
44
86
U.S.
France
Britain
Germany
Spain
Poland
Lithuania
Russia
Ukraine
Turkey
Lebanon
Egypt
Jordan
Palest. ter.
Israel
Indonesia
Japan
China
India
Pakistan
Brazil
Mexico
Kenya
FavorableUnfavorable
The United Nations
Overall, the UN receives positive ratings in the
nations polled – majorities or pluralities in 16of 23 countries express a positive view of the
organization.
It gets particularly high marks among EU
member states. At least 66% have a favorable
opinion of the UN in France, Britain, Germany,
Spain, Poland and Lithuania.
Roughly six-in-ten Americans express a
favorable view, although there are significantpartisan differences on this issue – 71% of
Democrats give the organization a positive
rating, compared with 58% of independents
and 51% of Republicans.
The UN gets especially positive reviews in
Kenya (86%) and Indonesia (79%). The most
negative ratings are found in the Middle East.
Roughly seven-in-ten Israelis (69%) assign an
unfavorable rating, as do 67% of Palestinians
and 64% of Jordanians. However, most
Lebanese (65%) and Egyptians (54%) express a
positive opinion of the organization.
Positive assessments of the UN have become more common in Japan over the last year,
jumping from 45% to 61%. This may be tied in part to assistance provided by the UN
following the devastating March 11 earthquake and tsunami. Roughly half of those
surveyed in Japan (49%) say the UN provided either a great deal or a fair amount of
assistance to Japan following the tragedy. (For more on Japanese views regardinginternational assistance, see “ Japanese Resilient, but See Economic Challenges Ahead ,”
released June 1, 2011.)
Favorable ratings for the UN have become notably less common since 2009 in China (-18
percentage points), Mexico (-14), Jordan (-9), Pakistan (-7), and Israel (-4).
UN Favorability
PEW RESEARCH CENTER Q3j.

8/3/2019 Pew Global Attitudes Balance of Power U.S. Image Report FINAL July 13 2011
http://slidepdf.com/reader/full/pew-global-attitudes-balance-of-power-us-image-report-final-july-13-2011 65/160
Pew Research Center’s Global Attitudes Project – www.pewglobal.org
63
The European Union
The EU continues to receive largely positive ratings, especially among the EU members
states included in the survey. Solid majorities in Lithuania (78%), Poland (74%), Spain(72%), Germany (66%), and France (63%) have a positive opinion of the organization,
while enthusiasm is somewhat more muted in Britain (51% favorable, 41% unfavorable).
A slim majority (55%) of Americans express a positive view of
the EU, while 22% express an unfavorable view and 23% offer
no opinion. The organization gets its highest ratings among
independents (63% favorable), followed by Democrats (55%)
and Republicans (46%).
While its ratings are still generally positive, the overall imageof the EU has declined somewhat over the last year, with
favorable ratings dropping in 13 of the 20 countries where
trends from 2010 are available. The decline has been
especially notable in China (-15 percentage points), Indonesia
(-13), and Kenya (-13).
The organization gets its lowest ratings in parts of the Muslim
world. Majorities in the Arab nations of Jordan (71%), the
Palestinian territories (63%), and Egypt (62%) express a
negative view of the EU.
And in Turkey, 64% say they have an unfavorable opinion of
the organization. As negotiations regarding Turkey’s
ascension into the EU have stalled in recent years, Turks have
become less enthusiastic about eventual EU membership. A
slim majority (52%) still wants their country to become a
member, but support is down considerably from 2005, when
roughly two-thirds (68%) held this view. (For more on Turkish
views regarding the EU, see “ On Eve of Elections, a MoreUpbeat Mood in Turkey,” released June 7, 2011.)
Declining Ratings forthe EU
% Favorable
2010 2011 Change
% % %
U.S. 57 55 -2
Germany 62 66 +4Britain 49 51 +2
France 64 63 -1
Spain 77 72 -5
Russia 69 64 -5
Poland 81 74 -7
Lithuania -- 78 --
Ukraine -- 72 --
Turkey 28 23 -5
Palest. ter.* 37 36 -1
Israel* 56 51 -5
Jordan 29 23 -6
Lebanon 61 55 -6
Egypt 42 35 -7
Pakistan 8 9 +1
Japan 73 71 -2
Indonesia 58 45 -13
China 47 32 -15
India -- 23 --
Brazil 55 47 -8
Mexico 42 33 -9
Kenya 80 67 -13
* Data from 2009
PEW RESEARCH CENTER Q3f.

8/3/2019 Pew Global Attitudes Balance of Power U.S. Image Report FINAL July 13 2011
http://slidepdf.com/reader/full/pew-global-attitudes-balance-of-power-us-image-report-final-july-13-2011 66/160
Pew Research Center’s Global Attitudes Project – www.pewglobal.org
64
13
30
19
17
32
33
24
43
41
64
72
70
65
63
62
60
54
37
34
18
Poland
France
Lithuania
Britain
Spain
Germany
U.S.
Russia
Ukraine
Turkey
FavorableUnfavorable
10
12
11
10
12
10
19
26
90
85
82
78
78
78
76
73
France
Spain
Lithuania
Britain
Russia
Ukraine
Poland
Germany
FavorableUnfavorable
NATO
Opinions of NATO continue to be largely
positive among the organization’s memberstates. At least six-in-ten give NATO a
favorable rating in Poland (72%), France
(70%), Lithuania (65%), Britain (63%), Spain
(62%), and Germany (60%), as does a 54%-
majority of Americans.
There is one clear exception to this pattern,
however. In Turkey – the only predominantly
Muslim country in the military alliance – only
18% have a positive opinion of NATO, while64% give a negative assessment.
In the two non-member states where this
question was asked –the former Soviet republics Russia and Ukraine – opinions about
NATO are on balance negative. Only 37% of Russians and 34% of Ukrainians give it a
positive rating.
Germany
Across the European nations surveyed,
Germany receives strongly positive ratings.
More than three-quarters express a favorable
opinion of Germany in fellow EU members
France (90%), Spain (85%), Lithuania (82%),
Britain (78%), and Poland (76%).
Germany gets similarly high ratings in Russia
and Ukraine (78% favorable in bothcountries).
Germans themselves are actually a little less
likely to see their country in a favorable light –
73% express a positive opinion.
Views of NATO
PEW RESEARCH CENTER Q3l.
Views of Germany
PEW RESEARCH CENTER Q3k.

8/3/2019 Pew Global Attitudes Balance of Power U.S. Image Report FINAL July 13 2011
http://slidepdf.com/reader/full/pew-global-attitudes-balance-of-power-us-image-report-final-july-13-2011 67/160
Pew Research Center’s Global Attitudes Project – www.pewglobal.org
65
32
48
31
49
45
11
42
53
67
43
62
62
63
69
37
44
20
62
42
47
48
45
49
53
50
47
46
84
53
35
18
53
35
34
31
29
47
35
31
28
15
33
23
34
U.S.
France
Britain
Germany
Spain
Ukraine
Lithuania
Poland
Turkey
Lebanon
Egypt
Palest. ter.
Jordan
Israel
China
Indonesia
India
Japan
Pakistan
Brazil
Mexico
Kenya
FavorableUnfavorable
Opinions about Germany have basically held steady over the last year, although
favorable ratings are up by seven percentage points in Spain and six points in Britain.
Russia
Majorities or pluralities express a favorable
view of Russia in 8 of 22 countries. By far,
Russia receives its most positive reviews in
Ukraine (84% favorable), including favorable
ratings from both ethnic Russians (94%) and
ethnic Ukrainians (82%).
In the other former Soviet republic surveyed,Lithuania, a much smaller majority (53%)
assigns a positive rating. And in Poland, a
former Eastern bloc nation, just 35% have a
positive view, down from 45% last year.
Among Western European nations, opinions
are fairly evenly divided in France, Germany
and Spain, while the British are on balance
positive (50% favorable, 31% unfavorable).
Americans are also on balance favorably
disposed toward Russia, with 49% offering a
positive view and 32% a negative one.
Attitudes toward Russia tend to be negative in
the predominantly Muslim nations surveyed,
especially in Jordan, the Palestinian territories,
and Egypt, where more than six-in-ten have an unfavorable view. The exception to this
pattern is Lebanon – a slim 53%-majority of Lebanese say they have a positive opinion of Russia.
Israelis offer the most negative assessments of Russia among the nations surveyed – just
29% have a favorable opinion, while roughly seven-in-ten (69%) express an unfavorable
view of Russia.
Russia Favorability
PEW RESEARCH CENTER Q3e.

8/3/2019 Pew Global Attitudes Balance of Power U.S. Image Report FINAL July 13 2011
http://slidepdf.com/reader/full/pew-global-attitudes-balance-of-power-us-image-report-final-july-13-2011 68/160
Pew Research Center’s Global Attitudes Project – www.pewglobal.org
66
Ratings are also generally negative in Japan (28% favorable, 62% unfavorable). In
neighboring China, however, a 47%-plurality holds a positive view of Russia.

8/3/2019 Pew Global Attitudes Balance of Power U.S. Image Report FINAL July 13 2011
http://slidepdf.com/reader/full/pew-global-attitudes-balance-of-power-us-image-report-final-july-13-2011 69/160
67
Methodological Appendix
Note: For more comprehensive information on the methodology of this study, see the “Methods in Detail”
section.
Country Sample size
Margin of Error
(pct. points) Field dates Mode
U.S. 1,001 ±4.0 March 25 – April 14 Telephone
Britain 1,000 ±3.5 March 22 – April 13 Telephone
France 1,004 ±3.5 March 21 – April 5 Telephone
Germany 1,001 ±4.5 March 21 – April 11 Telephone
Spain 1,000 ±3.5 March 22 - April 5 Telephone
Lithuania 750 ±4.5 March 23 – April 7 Face-to-face
Poland 750 ±4.5 March 21 – April 15 Face-to-face
Russia 1,000 ±4.0 March 21 – April 4 Face-to-face
Ukraine 1,000 ±4.0 March 22 – April 7 Face-to-face
Turkey 1,000 ±4.0 March 21 – April 12 Face-to-face
Egypt 1,000 ±4.0 March 24 – April 7 Face-to-faceJordan 1,000 ±4.0 March 21 – April 7 Face-to-face
Lebanon 1,000 ±4.0 March 21 – April 7 Face-to-face
Palest. ter. 825 ±4.0 March 22 – April 12 Face-to-face
Israel 907 ±5.0 March 22 – April 5 Face-to-face
China 3,308 ±2.5 March 18 – April 6 Face-to-face
India 4,029 ±3.5 March 26 – April 23 Face-to-face
Indonesia 1,000 ±4.0 March 23 – April 6 Face-to-face
Japan 700 ±4.5April 8 – April 27,May 13 – May 24
Telephone
Pakistan 1,251 ±4.0 May 8 – May 15 Face-to-face
Brazil 802 ±4.5 March 19 – April 5 Face-to-face
Mexico 800 ±4.5 March 22 – April 7 Face-to-face
Kenya 1,002 ±4.0 March 24 – April 5 Face-to-face

8/3/2019 Pew Global Attitudes Balance of Power U.S. Image Report FINAL July 13 2011
http://slidepdf.com/reader/full/pew-global-attitudes-balance-of-power-us-image-report-final-july-13-2011 70/160
68
Methods in Detail
About the 2011 Pew Global Attitudes Survey
Results for the survey are based on telephone and face-to-face interviews conducted
under the direction of Princeton Survey Research Associates International. Survey
results are based on national samples except in China. For further details on sample
designs, see below.
The descriptions below show the margin of sampling error based on all interviews
conducted in that country. For results based on the full sample in a given country, one
can say with 95% confidence that the error attributable to sampling and other random
effects is plus or minus the margin of error. In addition to sampling error, one should
bear in mind that question wording and practical difficulties in conducting surveys can
introduce error or bias into the findings of opinion polls.
Country: Brazil
Sample design: Multi-stage cluster sample stratified by Brazil’s five regions and
proportional to population size and urban/rural population
(excluding municipalities with a population below 5,000 — about
2%)
Mode: Face-to-face adults 18 plus
Languages: PortugueseFieldwork dates: March 19 – April 5, 2011
Sample size: 802
Margin of Error: ±4.5 percentage points
Representative: Adult population
Country: Britain
Sample design: Random Digit Dial (RDD) probability sample representative of all
telephone households (roughly 99% of all British households)
Mode: Telephone adults 18 plus
Languages: English
Fieldwork dates: March 22 – April 13, 2011
Sample size: 1,000
Margin of Error: ±3.5 percentage points
Representative: Telephone households (including cell phone only households)

8/3/2019 Pew Global Attitudes Balance of Power U.S. Image Report FINAL July 13 2011
http://slidepdf.com/reader/full/pew-global-attitudes-balance-of-power-us-image-report-final-july-13-2011 71/160
Pew Research Center’s Global Attitudes Project – www.pewglobal.org
69
Country: China4
Sample design: Multi-stage cluster sample stratified by China’s three regional-
economic zones (which include all provinces except Tibet,
Xinjiang, Hong Kong and Macao) with disproportional samplingof the urban population. Twelve cities, towns and villages were
sampled covering central, east, and west China. The cities sampled
were Beijing, Shanghai, Guangzhou, Nanjing, Hefei, Harbin,
Nanchang, Taiyuan, Chongqing, Guiyang, Kunming, and Xining.
The towns covered were Jiangyin, Wuxi, Jiangsu; Pulandian,
Dalian, Liaoning; Linan, Hangzhou, Zhejiang; Tengzhou,
Zaozhuang, Shandong; Conghua, Guangzhou, Guangdong; Xinji,
Shijiangzhuang, Hebei; Tongcheng, Anqing, Hefei; Shangzhi,
Harbin, Heilongjiang; Leping, Jingdezhen, Jiangxi; Gujiao,
Taiyuan, Shanxi; Xuanwei, Qujing, Yunnan; Chishui, Zunyi,Guizhou. Two or three villages near each of these towns were
sampled.
Mode: Face-to-face adults 18 plus
Languages: Chinese (Mandarin, Guangdong, Yunnan, Shandong, Guizhou,
Hebei, Chongqing, Shanxi, Jiangsu, Shanghai, Qinghai, Jiangxi,
Anhui, Beijing, and Zhejiang dialects)
Fieldwork dates: March 18 – April 6, 2011
Sample size: 3,308
Margin of Error: ±2.5 percentage points
Representative: Disproportionately urban (the sample is 66% urban, China’s
population is 47% urban). The sample represents roughly 57% of
the adult population.
4 Data were purchased from Horizon Research Consultancy Group based on their self-sponsored survey “Chinese People
View the World.”
8/3/2019 Pew Global Attitudes Balance of Power U.S. Image Report FINAL July 13 2011
http://slidepdf.com/reader/full/pew-global-attitudes-balance-of-power-us-image-report-final-july-13-2011 72/160
Pew Research Center’s Global Attitudes Project – www.pewglobal.org
70
Country: Egypt
Sample design: Multi-stage cluster sample stratified by governorates (excluding
Frontier governorates for security reasons—about 2% of the
population) proportional to population size and urban/ruralpopulation
Mode: Face-to-face adults 18 plus
Languages: Arabic
Fieldwork dates: March 24 – April 7, 2011
Sample size: 1,000
Margin of Error: ±4.0 percentage points
Representative: Adult population
Country: France
Sample design: Random Digit Dial (RDD) sample representative of all telephonehouseholds (roughly 99% of all French households) with quotas
for gender, age and occupation and proportional to region size and
urban/rural population
Mode: Telephone adults 18 plus
Languages: French
Fieldwork dates: March 21 – April 5, 2011
Sample size: 1,004
Margin of Error: ±3.5 percentage points
Representative: Telephone households (including cell phone only households)
Country: Germany
Sample design: Random Last Two Digit Dial (RL(2)D) probability sample
representative of roughly 95% of the German population
proportional to population size
Mode: Telephone adults 18 plus
Languages: German
Fieldwork dates: March 21 – April 11, 2011
Sample size: 1,001
Margin of Error: ±4.5 percentage pointsRepresentative: Telephone households (excluding cell phone only households —
between 5% and 10%)

8/3/2019 Pew Global Attitudes Balance of Power U.S. Image Report FINAL July 13 2011
http://slidepdf.com/reader/full/pew-global-attitudes-balance-of-power-us-image-report-final-july-13-2011 73/160
Pew Research Center’s Global Attitudes Project – www.pewglobal.org
71
Country: India
Sample design: Multi-stage cluster sample in 14 states and all four regions
– Uttar Pradesh, Delhi, and Punjab in the North; Bihar, West
Bengal, Jharkhand, and Orissa in the East; Gujarat, Maharashtra,Rajasthan, and Madhya Pradesh in the West; Andhra Pradesh,
Tamil Nadu, and Karnataka in the South—with disproportional
sampling of the urban population
Mode: Face-to-face adults 18 plus
Languages: Hindi, Bengali, Tamil, Kannad, Telugu, Gujarati, Marathi, Oriya,
English
Fieldwork dates: March 26 – April 23, 2011
Sample size: 4,029
Margin of Error: ±3.5 percentage points
Representative: Sample is disproportionately urban, but data are weighted toreflect the actual urban/rural distribution in India. Sample covers
roughly 86% of the adult population.
Country: Indonesia
Sample design: Multi-stage cluster sample representative of roughly 88% of the
population (excluding Papua and remote areas or provinces with
small populations) proportional to population size and
urban/rural population
Mode: Face-to-face adults 18 plus
Languages: Indonesian
Fieldwork dates: March 23 – April 6, 2011
Sample size: 1,000
Margin of Error: ±4.0 percentage points
Representative: Adult population (excludes 12% of population)

8/3/2019 Pew Global Attitudes Balance of Power U.S. Image Report FINAL July 13 2011
http://slidepdf.com/reader/full/pew-global-attitudes-balance-of-power-us-image-report-final-july-13-2011 74/160
Pew Research Center’s Global Attitudes Project – www.pewglobal.org
72
Country: Israel
Sample design: Multi-stage cluster sample stratified by Israel’s six districts
proportional to population size and urban/rural population with
an oversample of ArabsMode: Face-to-face adults 18 plus
Languages: Hebrew, Arabic
Fieldwork dates: March 22 – April 5, 2011
Sample size: 907 (504 Jews, 381 Arabs, 22 others)
Margin of Error: ±5.0 percentage points
Representative: Adult population
Country: Japan
Sample design: Random Digit Dial (RDD) probability sample representative of all
landline telephone households stratified by region and populationsize (excluding 5.4% of the population living in areas most affected
by the earthquake)
Mode: Telephone adults 18 plus
Languages: Japanese
Fieldwork dates: April 8 - April 27, May 13 – May 24, 2011
Sample size: 700
Margin of Error: ±4.5 percentage points
Representative: Telephone households (excluding cell phone only households –
less than 5%, households with no telephones – about 5%, and the
population living in areas most affected by the earthquake – 5.4%)
Country: Jordan
Sample design: Multi-stage cluster sample stratified by region and Jordan’s 12
governorates and proportional to population size and urban/rural
population
Mode: Face-to-face adults 18 plus
Languages: Arabic
Fieldwork dates: March 21 – April 7, 2011
Sample size: 1,000Margin of Error: ±4.0 percentage points
Representative: Adult population
8/3/2019 Pew Global Attitudes Balance of Power U.S. Image Report FINAL July 13 2011
http://slidepdf.com/reader/full/pew-global-attitudes-balance-of-power-us-image-report-final-july-13-2011 75/160
Pew Research Center’s Global Attitudes Project – www.pewglobal.org
73
Country: Kenya
Sample design: Multi-stage cluster sample stratified by all eight regions and
proportional to population size and urban/rural population
Mode: Face-to-face adults 18 plusLanguages: Swahili, English, Somali
Fieldwork dates: March 24 - April 5, 2011
Sample size: 1,002
Margin of Error: ±4.0 percentage points
Representative: Adult population
Country: Lebanon
Sample design: Multi-stage cluster sample stratified by Lebanon’s seven major
regions (excluding a small area in Beirut controlled by a militia
group and a few villages in the south Lebanon, which border Israeland are inaccessible to outsiders) and proportional to population
size and urban/rural population
Mode: Face-to-face adults 18 plus
Languages: Arabic
Fieldwork dates: March 21 – April 7, 2011
Sample size: 1,000
Margin of Error: ±4.0 percentage points
Representative: Adult population
Country: Lithuania
Sample design: Multi-stage cluster sample stratified by Lithuania’s 10 counties
and proportional to population size and urban/rural population
Mode: Face-to-face adults 18 plus
Languages: Lithuanian
Fieldwork dates: March 23 – April 7, 2011
Sample size: 750
Margin of Error: ±4.5 percentage points
Representative: Adult population

8/3/2019 Pew Global Attitudes Balance of Power U.S. Image Report FINAL July 13 2011
http://slidepdf.com/reader/full/pew-global-attitudes-balance-of-power-us-image-report-final-july-13-2011 76/160
Pew Research Center’s Global Attitudes Project – www.pewglobal.org
74
Country: Mexico
Sample design: Multi-stage cluster sample stratified by Mexico’s geographical
regions and urban/rural population
Mode: Face-to-face adults 18 plusLanguages: Spanish
Fieldwork dates: March 22 – April 7, 2011
Sample size: 800
Margin of Error: ±4.5 percentage points
Representative: Adult population
Country: Pakistan
Sample design: Multi-stage cluster sample of all four provinces stratified by
province (the Federally Administered Tribal Areas, Gilgit-
Baltistan, Azad Jammu and Kashmir were excluded for security reasons as were areas of instability in Khyber Pakhtunkhwa
[formerly the North-West Frontier Province] and Baluchistan –
roughly 15% of the population) with disproportional sampling of
the urban population
Mode: Face-to-face adults 18 plus
Languages: Urdu, Punjabi, Pashto, Sindhi, Saraiki, Hindko, Brahavi
Fieldwork dates: May 8 – May 15, 2011
Sample size: 1,251
Margin of Error: ±4.0 percentage points
Representative: Sample is disproportionately urban, but data are weighted to
reflect the actual urban/rural distribution in Pakistan. Sample
covers roughly 85% of the adult population.
Country: Palestinian territories
Sample design: Multi-stage cluster sample stratified by 17 districts in Gaza Strip
and the West Bank, including East Jerusalem and proportional to
population size and urban/rural population
Mode: Face-to-face adults 18 plus
Languages: ArabicFieldwork dates: March 22 – April 12, 2011
Sample size: 825
Margin of Error: ±4.0 percentage points
Representative: Adult population

8/3/2019 Pew Global Attitudes Balance of Power U.S. Image Report FINAL July 13 2011
http://slidepdf.com/reader/full/pew-global-attitudes-balance-of-power-us-image-report-final-july-13-2011 77/160
Pew Research Center’s Global Attitudes Project – www.pewglobal.org
75
Country: Poland
Sample design: Multi-stage cluster sample stratified by Poland’s 16 provinces and
proportional to population size and urban/rural population
Mode: Face-to-face adults 18 plusLanguages: Polish
Fieldwork dates: March 21 – April 15, 2011
Sample size: 750
Margin of Error: ±4.5 percentage points
Representative: Adult population
Country: Russia
Sample design Multi-stage cluster sample stratified by Russia’s eight regions
(excluding a few remote areas in the northern and eastern parts of
the country and Chechnya) and proportional to population sizeand urban/rural population
Mode: Face-to-face adults 18 plus
Languages: Russian
Fieldwork dates: March 21 – April 4, 2011
Sample size: 1,000
Margin of Error: ±4.0 percentage points
Representative: Adult population
Country: Spain
Sample design: Random Digit Dial (RDD) probability sample representative of
telephone households (about 99% of Spanish households)
stratified by region and proportional to population size
Mode: Telephone adults 18 plus
Languages: Spanish/Castilian
Fieldwork dates: March 22 – April 5, 2011
Sample size: 1,000
Margin of Error: ±3.5 percentage points
Representative: Telephone households (including cell phone only households)

8/3/2019 Pew Global Attitudes Balance of Power U.S. Image Report FINAL July 13 2011
http://slidepdf.com/reader/full/pew-global-attitudes-balance-of-power-us-image-report-final-july-13-2011 78/160
Pew Research Center’s Global Attitudes Project – www.pewglobal.org
76
Country: Turkey
Sample design: Multi-stage cluster sample in all 26 regions (based on geographical
location and level of development [NUTS 2]) and proportional to
population size and urban/rural populationMode: Face-to-face adults 18 plus
Languages: Turkish
Fieldwork dates: March 21 – April 12, 2011
Sample size: 1,000
Margin of Error: ±4.0 percentage points
Representative: Adult population
Country: Ukraine
Sample design: Multi-stage cluster sample stratified by Ukraine’s four regions and
proportional to population size and urban/rural populationMode: Face-to-face adults 18 plus
Languages: Russian, Ukrainian
Fieldwork dates: March 22 – April 7, 2011
Sample size: 1,000
Margin of Error: ±4.0 percentage points
Representative: Adult population
Country: United States
Sample design: Random Digit Dial (RDD) probability sample representative of all
telephone households in the continental U.S. stratified by county
Mode: Telephone adults 18 plus
Languages: English
Fieldwork dates: March 25 – April 14, 2011
Sample size: 1,001
Margin of Error: ±4.0 percentage points
Representative: Telephone households in continental U.S. (including cell phone
only households)

8/3/2019 Pew Global Attitudes Balance of Power U.S. Image Report FINAL July 13 2011
http://slidepdf.com/reader/full/pew-global-attitudes-balance-of-power-us-image-report-final-july-13-2011 79/160
77
Pew Global Attitudes Project
2011 Spring Survey Topline Results
July 13, 2011 Release
Methodological notes:
• Survey results are based on national samples except in China. For further details
on sample designs, see Survey Methods section.
• Due to rounding, percentages may not total 100%. The topline “total” columns
show 100%, because they are based on unrounded numbers. When multiple
responses are allowed, totals may add to more than 100%.
• Since 2007, the Global Attitudes Project has used an automated process to
generate toplines. As a result, numbers may differ slightly from those published
prior to 2007.
• Spring, 2011 survey in Pakistan was fielded before the death of Osama bin Laden
(April 10 – April 26), while the Late Spring, 2011 survey was conducted
afterwards (May 8 – May 15).
• Previous trends from India are not shown because those results were based on
disproportionately urban samples of the population, while 2011 results arenationally representative.
• Trends from Brazil prior to 2010 are not shown because those results were based
on disproportionately urban samples of the population. Since 2010, the samples
have been nationally representative.
• Trends from Egypt in 2002 are not shown because those results were based on a
disproportionately urban sample of the population. Since 2006, the samples
have been nationally representative.
• Not all questions included in the Spring 2011 survey are presented in this topline.
Omitted questions have either been previously released or will be released in
future reports.

8/3/2019 Pew Global Attitudes Balance of Power U.S. Image Report FINAL July 13 2011
http://slidepdf.com/reader/full/pew-global-attitudes-balance-of-power-us-image-report-final-july-13-2011 80/160
DK/RefusedDissatisfiedSatisfied Total
Q2 Overall, are you satisfied or dissatisfied with the
way things are going in our country today?
Spring, 2011
Spring, 2010
Fall, 2009
Spring, 2009
Spring, 2008
Spring, 2007
Spring, 2006
May, 2005
March, 2004
Summer, 2002
Spring, 2011
Spring, 2010
Fall, 2009
Spring, 2009
Spring, 2008
Spring, 2007
Spring, 2006
May, 2005
March, 2004
May, 2003
March, 2003
Summer, 2002
Spring, 2011
Spring, 2010
Fall, 2009
Spring, 2009
Spring, 2008
Spring, 2007
Spring, 2006
May, 2005
March, 2004
May, 2003
March, 2003
Summer, 2002
Spring, 2011
Spring, 2010
Fall, 2009
Spring, 2009
Spring, 2008Spring, 2007
Spring, 2006
May, 2005
March, 2004
May, 2003
March, 2003
Summer, 2002
United States
Britain
France
Germany
10036631
10037918
10027325
10027820
10027325
10056729
10026633
10036334
10035443
10025048
10025939
10035443
10016732
10026731
10005644
10006832
10007128
10008020
10007822
10007129
10007327
10006732
10007426
10007525
10046432
10066330
10054946
10045838
10055144
10065835
10046630
10056530
10047621
10076429
10076331
10076132
10045541
10065539
10055739
10066529
10047125
10067023
10036136
10076430
10086230
10067321
78

8/3/2019 Pew Global Attitudes Balance of Power U.S. Image Report FINAL July 13 2011
http://slidepdf.com/reader/full/pew-global-attitudes-balance-of-power-us-image-report-final-july-13-2011 81/160
DK/RefusedDissatisfiedSatisfied Total
Q2 Overall, are you satisfied or dissatisfied with the
way things are going in our country today?
Spring, 2011
Spring, 2010
Fall, 2009
Spring, 2009
Spring, 2008
Spring, 2007
Spring, 2006
May, 2005
May, 2003
March, 2003
Spring, 2011
Fall, 2009
Spring, 2011
Spring, 2010
Fall, 2009
Spring, 2009
Spring, 2008
Spring, 2007
May, 2005
March, 2003
Summer, 2002
Spring, 2011
Spring, 2010
Fall, 2009
Spring, 2009
Spring, 2008
Spring, 2007
Spring, 2006
May, 2005
March, 2004
May, 2003
March, 2003
Summer, 2002
Spring, 2011
Fall, 2009
Spring, 2007
Summer, 2002
Spring, 2011
Spring, 2010Spring, 2009
Spring, 2008
Spring, 2007
Spring, 2006
May, 2005
March, 2004
May, 2003
March, 2003
Summer, 2002
Spain
Lithuania
Poland
Russia
Ukraine
Turkey
1002934
10028118
10027919
10025840
10045541
10045640
10035839
10047521
10037522
10026038
10034948
1003899
1003889
1004887
1005879
10097120
10065835
10096427
10056926
10067123
10076232
10095636
10044354
10096527
10066034
10075934
10086032
1004879
1004897
10058213
10087418
100114742
100126720
10055936
10064747
10046630
1003907
10058114
100124741
10035245
10054451
10044650
10044551
10074350
10027721
10037521
10027622
10028315
79

8/3/2019 Pew Global Attitudes Balance of Power U.S. Image Report FINAL July 13 2011
http://slidepdf.com/reader/full/pew-global-attitudes-balance-of-power-us-image-report-final-july-13-2011 82/160
DK/RefusedDissatisfiedSatisfied Total
Q2 Overall, are you satisfied or dissatisfied with the
way things are going in our country today?
Spring, 2011
Spring, 2010
Spring, 2009
Spring, 2008
Spring, 2007
Spring, 2006
Spring, 2011
Spring, 2010
Spring, 2009
Spring, 2008
Spring, 2007
Spring, 2006
May, 2005
March, 2004
May, 2003
Summer, 2002
Spring, 2011
Spring, 2010
Spring, 2009
Spring, 2008
Spring, 2007
May, 2005
May, 2003
Summer, 2002
Spring, 2011
Spring, 2009
Spring, 2007
May, 2003
Spring, 2011
Spring, 2009
Spring, 2007
May, 2003
Spring, 2011
Spring, 2010
Spring, 2009
Spring, 2008
Spring, 2007
Spring, 2006
May, 2005Summer, 2002
Egypt
Jordan
Lebanon
Palest. ter.
Israel
China
100193348
100101972
10061381
10051283
10031186
1004987
1004987
10051085
10037127
10037918
10037225
10055639
1002926
1004915
1001918
10038513
1001927
10018414
10025940
1002926
1002926
10028711
10028611
10018711
10017821
10025642
100113059
10013069
10034453
10024256
10044749
10025246
10016435
10035444
10024255
10025147
10045740
10026731
10036928
10023465
80

8/3/2019 Pew Global Attitudes Balance of Power U.S. Image Report FINAL July 13 2011
http://slidepdf.com/reader/full/pew-global-attitudes-balance-of-power-us-image-report-final-july-13-2011 83/160
DK/RefusedDissatisfiedSatisfied Total
Q2 Overall, are you satisfied or dissatisfied with the
way things are going in our country today?
Spring, 2011
Spring, 2011
Spring, 2010
Spring, 2009
Spring, 2008
Spring, 2007
Spring, 2006
May, 2005
May, 2003
Summer, 2002
Spring, 2011
Spring, 2010
Spring, 2009
Spring, 2008
Spring, 2007
Spring, 2006
Summer, 2002
Late Spring, 2011
Spring, 2011
Spring, 2010
Spring, 2009
Spring, 2008
Spring, 2007
Spring, 2006
May, 2005
March, 2004
May, 2003
Summer, 2002
Spring, 2011
Spring, 2010
Spring, 2011
Spring, 2010
Spring, 2009
Spring, 2008
Spring, 2007
Summer, 2002
Spring, 2011
Spring, 2010
Spring, 2009Spring, 2007
Summer, 2002
India
Indonesia
Japan
Pakistan
Brazil
Mexico
Kenya
1001908
10015445
1001909
10018217
10008119
10067916
10036630
10026830
10037820
10027919
10027622
10024950
10034652
100123949
10046729
10054154
10043957
10075835
10045739
10027325
1002899
10028414
1001899
1002926
10028612
10017227
10077122
10037423
10027325
10047620
10037225
1001927
10018515
10016435
10017326
10017722
10026830
10025840
10025641
10036136
10024751
81

8/3/2019 Pew Global Attitudes Balance of Power U.S. Image Report FINAL July 13 2011
http://slidepdf.com/reader/full/pew-global-attitudes-balance-of-power-us-image-report-final-july-13-2011 84/160
DK/RefusedVery
unfavorableSomewhat
unfavorableSomewhatfavorableVery favorable Total
Q3a Please tell me if you have a very favorable, somewhat favorable, somewhat
unfavorable or very unfavorable opinion of: a. The United States
Spring, 2011
Spring, 2010
Spring, 2009
Spring, 2008
Spring, 2007
Spring, 2006
May, 2005
Spring, 2011
Spring, 2010
Spring, 2009
Spring, 2008
Spring, 2007
Spring, 2006
May, 2005
March, 2004
May, 2003
March, 2003
Summer, 2002
Spring, 2011
Spring, 2010
Spring, 2009
Spring, 2008
Spring, 2007
Spring, 2006
May, 2005
March, 2004
May, 2003
March, 2003
Summer, 2002
Spring, 2011
Spring, 2010
Spring, 2009
Spring, 2008
Spring, 2007
Spring, 2006
May, 2005
March, 2004
May, 2003
March, 2003
Summer, 2002
Spring, 2011
Spring, 2010
Spring, 2009
Spring, 2008
Spring, 2007
Spring, 2006
May, 2005
May, 2003
March, 2003
Spring, 2011
United States
Britain
France
Germany
Spain
Lithuania 10072186112
100123935113
10062629308
100916342714
10053637194
10062832322
100122233312
10014622517
10011523538
10067225014
1004431519
10043041214
10011242396
10031049353
10051044384
10031446352
10041947282
10041353283
1003726604
1003431585
1003332584
1003826548
10022245256
10011938348
10022042316
10001542403
10011743372
10001644345
10001839384
1000520678
1000521685
1000422687
10094124827
1001116243414
100512145218
100810244315
100711274213
1001113204511
10071329429
100101225458
100106145613
100106185114
100126224912
10034103350
10067102749
10026123347
1003683153
1002363652
1004383748
10047103445
82

8/3/2019 Pew Global Attitudes Balance of Power U.S. Image Report FINAL July 13 2011
http://slidepdf.com/reader/full/pew-global-attitudes-balance-of-power-us-image-report-final-july-13-2011 85/160
DK/RefusedVery
unfavorableSomewhat
unfavorableSomewhatfavorableVery favorable Total
Q3a Please tell me if you have a very favorable, somewhat favorable, somewhat
unfavorable or very unfavorable opinion of: a. The United States
Spring, 2011
Spring, 2010
Spring, 2009
Spring, 2008
Spring, 2007
May, 2005
March, 2003
Summer, 2002
Spring, 2011
Spring, 2010
Spring, 2009
Spring, 2008
Spring, 2007
Spring, 2006
May, 2005
March, 2004
May, 2003
March, 2003
Summer, 2002
Spring, 2011
Spring, 2007
Summer, 2002
Spring, 2011
Spring, 2010
Spring, 2009
Spring, 2008
Spring, 2007
Spring, 2006
May, 2005
March, 2004
May, 2003
March, 2003
Summer, 2002
Spring, 2011
Spring, 2010
Spring, 2009
Spring, 2008
Spring, 2007
Spring, 2006
Spring, 2011
Spring, 2010
Spring, 2009
Spring, 2008
Spring, 2007
Spring, 2006
May, 2005
March, 2004
May, 2003
Summer, 2002
Spring, 2011
Poland
Russia
Ukraine
Turkey
Egypt
Jordan
Lebanon 100235143118
10005718196
1000831610
1001672632
10005921129
1000553096
10025226128
10024831145
10014430187
10014534147
1003493585
10013633255
10024632147
100440351210
100339311512
10014834134
10014930119
100164113246
1005671793
10036815132
10074518246
100105413194
10012679102
100875872
1001170784
100165712122
10095915152
10013621582
10025145030
100720194410
100107235010
1007627538
10042543244
100823322611
100111529379
1008931439
100101928349
100111632338
100720283412
100121133386
10010726489
100108264313
100101106514
10071133419
100145185111
10096254912
1008420626
1009618607
10062176014
10010316637
83

8/3/2019 Pew Global Attitudes Balance of Power U.S. Image Report FINAL July 13 2011
http://slidepdf.com/reader/full/pew-global-attitudes-balance-of-power-us-image-report-final-july-13-2011 86/160
DK/RefusedVery
unfavorableSomewhat
unfavorableSomewhatfavorableVery favorable Total
Q3a Please tell me if you have a very favorable, somewhat favorable, somewhat
unfavorable or very unfavorable opinion of: a. The United States
Spring, 2010
Spring, 2009
Spring, 2008
Spring, 2007
May, 2005
May, 2003
Summer, 2002
Spring, 2011
Spring, 2009
Spring, 2007
May, 2003
Spring, 2011
Spring, 2009
Spring, 2007
May, 2003
Spring, 2011
Spring, 2010
Spring, 2009
Spring, 2008
Spring, 2007
Spring, 2006
May, 2005
Spring, 2011
Spring, 2011
Spring, 2010
Spring, 2009
Spring, 2008
Spring, 2007
Spring, 2006
May, 2005
May, 2003
Summer, 2002
Spring, 2011
Spring, 2010
Spring, 2009
Spring, 2008
Spring, 2007
Spring, 2006
Summer, 2002
Late Spring, 2011
Spring, 2011
Spring, 2010
Spring, 2009
Spring, 2008
Spring, 2007
Spring, 2006
May, 2005
March, 2004
May, 2003
Summer, 2002
Lebanon
Palest. ter.
Israel
China
India
Indonesia
Japan
Pakistan
10020581182
10067110103
100185010174
100184812176
100174214207
100165414114
100175211136
100165414133
100165513143
100146510101
100166211102
10023235913
1003629558
1003333538
1002741464
1003334536
1002428597
10011135926
1003927565
10014835132
10051740326
10042542237
10052541254
100101637307
10084265013
1006628518
100610304113
10049372219
10051340375
10010637389
10081047322
100111137365
1007838416
1005730499
100101234377
10018124632
10015154929
10027194526
10015235814
1001851300
1001701694
10026616132
10014931162
10063821279
10024823198
100040182022
100128243116
100130193318
100031144015
100033143814
84

8/3/2019 Pew Global Attitudes Balance of Power U.S. Image Report FINAL July 13 2011
http://slidepdf.com/reader/full/pew-global-attitudes-balance-of-power-us-image-report-final-july-13-2011 87/160
DK/RefusedVery
unfavorableSomewhat
unfavorableSomewhatfavorableVery favorable Total
Q3a Please tell me if you have a very favorable, somewhat favorable, somewhat
unfavorable or very unfavorable opinion of: a. The United States
Spring, 2011
Spring, 2010
Spring, 2011
Spring, 2010
Spring, 2009
Spring, 2008
Spring, 2007
Summer, 2002
Spring, 2011
Spring, 2010
Spring, 2009
Spring, 2007
Summer, 2002
Brazil
Mexico
Kenya
10055103545
1003384443
1005122268
1003122371
1005472954
1001010154915
100315264610
100919253413
10059185415
100914214313
1007932466
1008524557
100116225210
85

8/3/2019 Pew Global Attitudes Balance of Power U.S. Image Report FINAL July 13 2011
http://slidepdf.com/reader/full/pew-global-attitudes-balance-of-power-us-image-report-final-july-13-2011 88/160
DK/RefusedVery
unfavorableSomewhat
unfavorableSomewhatfavorableVery favorable Total
Q3b Please tell me if you have a very favorable, somewhat favorable, somewhat
unfavorable or very unfavorable opinion of: b. Americans
Spring, 2011
Spring, 2010
Spring, 2009
Spring, 2008
Spring, 2007
Spring, 2006
May, 2005
Spring, 2011
Spring, 2010
Spring, 2009
Spring, 2008
Spring, 2007
Spring, 2006
May, 2005
March, 2004
May, 2003
Summer, 2002
Spring, 2011
Spring, 2010
Spring, 2009
Spring, 2008
Spring, 2007
Spring, 2006
May, 2005
March, 2004
May, 2003
Summer, 2002
Spring, 2011
Spring, 2010
Spring, 2009
Spring, 2008
Spring, 2007
Spring, 2006
May, 2005
March, 2004
May, 2003
Summer, 2002
Spring, 2011
Spring, 2010
Spring, 2009
Spring, 2008
Spring, 2007
Spring, 2006
May, 2005
May, 2003
Spring, 2011
Spring, 2011
Spring, 2010
Spring, 2009
Spring, 2008
United States
Britain
France
Germany
Spain
Lithuania
Poland
1008318628
1009416657
10052136515
10011213659
10082176310
1001316253611
100158224016
100111833334
100101827406
100191524392
10023421475
10017520518
10097204915
10073205812
10047235215
1006520599
10011420579
1007422615
10057265310
10011529487
1009522604
1007223617
1006123628
10035216110
100113294513
10031330485
1001729595
1000827605
1001831547
10001026577
1000521678
1000423666
1000318708
1008385824
1005595327
10095145220
10084185218
100105164920
100104165416
100115145713
100113125617
100123115419
100124125518
1002183949
1006363253
10022104046
1003273850
1002173852
1003384145
1003373552
86

8/3/2019 Pew Global Attitudes Balance of Power U.S. Image Report FINAL July 13 2011
http://slidepdf.com/reader/full/pew-global-attitudes-balance-of-power-us-image-report-final-july-13-2011 89/160
DK/RefusedVery
unfavorableSomewhat
unfavorableSomewhatfavorableVery favorable Total
Q3b Please tell me if you have a very favorable, somewhat favorable, somewhat
unfavorable or very unfavorable opinion of: b. Americans
Spring, 2007
May, 2005
Summer, 2002
Spring, 2011
Spring, 2010
Spring, 2009
Spring, 2008
Spring, 2007
Spring, 2006
May, 2005
March, 2004
May, 2003
Summer, 2002
Spring, 2011
Spring, 2007
Summer, 2002
Spring, 2011
Spring, 2010
Spring, 2009
Spring, 2008
Spring, 2007
Spring, 2006
May, 2005
March, 2004
May, 2003
Summer, 2002
Spring, 2011
Spring, 2010
Spring, 2009
Spring, 2008
Spring, 2007
Spring, 2006
Spring, 2011
Spring, 2010
Spring, 2009
Spring, 2008
Spring, 2007
Spring, 2006
May, 2005
March, 2004
May, 2003
Summer, 2002
Spring, 2011
Spring, 2010
Spring, 2009
Spring, 2008
Spring, 2007
May, 2005
May, 2003
Summer, 2002
Poland
Russia
Ukraine
Turkey
Egypt
Jordan
Lebanon
100724223314
100117214121
100114183432
100117144425
100116105321
100017144623
100022124521
10022693824
100129173321
10004636153
10063340174
10003927259
10013031363
10033032306
10022835279
100134262910
100226283212
10023130289
10013330288
10024027247
100535302011
100128322713
10032732327
100529302610
100183812266
10084317275
100153321266
100144617194
100145514152
100106314121
100175911103
100215213122
100155218142
100145321111
10024114836
100711165314
100105175414
1009321589
100107184817
100118175113
100116235110
1001011234611
10011826468
100912224512
10012823489
100105215311
100116195013
100111116512
100163145513
100114225211
87

8/3/2019 Pew Global Attitudes Balance of Power U.S. Image Report FINAL July 13 2011
http://slidepdf.com/reader/full/pew-global-attitudes-balance-of-power-us-image-report-final-july-13-2011 90/160
DK/RefusedVery
unfavorableSomewhat
unfavorableSomewhatfavorableVery favorable Total
Q3b Please tell me if you have a very favorable, somewhat favorable, somewhat
unfavorable or very unfavorable opinion of: b. Americans
Spring, 2011
Spring, 2009
Spring, 2007
May, 2003
Spring, 2011
Spring, 2009
Spring, 2007
May, 2003
Spring, 2011
Spring, 2010
Spring, 2009
Spring, 2008
Spring, 2007
Spring, 2006
May, 2005
Spring, 2011
Spring, 2011
Spring, 2010
Spring, 2009
Spring, 2008
Spring, 2007
Spring, 2006
May, 2005
May, 2003
Summer, 2002
Spring, 2011
Spring, 2010
Spring, 2009
Spring, 2008
Spring, 2007
Spring, 2006
Summer, 2002
Late Spring, 2011
Spring, 2011
Spring, 2010
Spring, 2009
Spring, 2008
Spring, 2007
Spring, 2006
May, 2005
March, 2004
May, 2003
Summer, 2002
Spring, 2011
Spring, 2010
Spring, 2011
Spring, 2010
Spring, 2009
Spring, 2008
Spring, 2007
Palest. ter.
Israel
China
India
Indonesia
Japan
Pakistan
Brazil
Mexico
100612304210
100111927359
100710264611
1001313263910
10071636384
1009426555
10011624517
100225012143
100114011308
100273413205
100224114175
100203418225
100214218154
100243917164
100223918173
100204021153
100195316102
100205513102
10042226310
10023136616
10051186411
1004327605
1004223619
1004318678
10030106423
1003825605
10021131506
1008937388
10051842306
10061339384
100111232387
10010531477
1008631505
1009929439
10037592920
10081138385
10012534446
1009944353
100121238335
1007941384
10057275110
100111433366
10055124830
10023194926
10037164727
10027165817
1002682460
10045025174
10035621191
10024034222
88

8/3/2019 Pew Global Attitudes Balance of Power U.S. Image Report FINAL July 13 2011
http://slidepdf.com/reader/full/pew-global-attitudes-balance-of-power-us-image-report-final-july-13-2011 91/160
DK/RefusedVery
unfavorableSomewhat
unfavorableSomewhatfavorableVery favorable Total
Q3b Please tell me if you have a very favorable, somewhat favorable, somewhat
unfavorable or very unfavorable opinion of: b. Americans
Summer, 2002
Spring, 2011
Spring, 2010
Spring, 2009
Spring, 2007
Summer, 2002
Mexico
Kenya
1005783445
1002384640
1005252463
1003152863
10054103546
1001213194511
89

8/3/2019 Pew Global Attitudes Balance of Power U.S. Image Report FINAL July 13 2011
http://slidepdf.com/reader/full/pew-global-attitudes-balance-of-power-us-image-report-final-july-13-2011 92/160
DK/RefusedVery
unfavorableSomewhat
unfavorableSomewhatfavorableVery favorable Total
Q3c Please tell me if you have a very favorable, somewhat favorable, somewhat
unfavorable or very unfavorable opinion of: c. China
Spring, 2011
Spring, 2010
Spring, 2009
Spring, 2008
Spring, 2007
Spring, 2006
May, 2005
Spring, 2011
Spring, 2010
Spring, 2009
Spring, 2008
Spring, 2007
Spring, 2006
May, 2005
Spring, 2011
Spring, 2010
Spring, 2009
Spring, 2008
Spring, 2007
Spring, 2006
May, 2005
Spring, 2011
Spring, 2010
Spring, 2009
Spring, 2008
Spring, 2007
Spring, 2006
May, 2005
Spring, 2011
Spring, 2010
Spring, 2009
Spring, 2008
Spring, 2007
Spring, 2006
May, 2005
Spring, 2011
Spring, 2011
Spring, 2010
Spring, 2009
Spring, 2008
Spring, 2007
May, 2005
Spring, 2011
Spring, 2010
Spring, 2009
Spring, 2008
Spring, 2007
Spring, 2006
May, 2005
Summer, 2002
United States
Britain
France
Germany
Spain
Lithuania
Poland
Russia
100112165912
100126234911
100107204914
10013521519
100106245010
10012524499
100116234812
100116194914
10030925325
10019834354
100131539321
100171031403
10012833388
10017725465
10013432493
100235163918
100181226405
100171330354
100132333283
10019833355
10015830407
100515243718
10016433415
10010528506
100121242295
10062345242
10081350272
10081546282
10071148313
10001329526
10001229537
10011338434
10003339253
10002238356
10002435356
10001633447
100183135213
100203115510
10025621427
100171224407
10018722448
10019926388
100166204712
100221322349
1001910194012
100181425348
100191626309
100131325419
1001412243910
1001214223912
90

8/3/2019 Pew Global Attitudes Balance of Power U.S. Image Report FINAL July 13 2011
http://slidepdf.com/reader/full/pew-global-attitudes-balance-of-power-us-image-report-final-july-13-2011 93/160
DK/RefusedVery
unfavorableSomewhat
unfavorableSomewhatfavorableVery favorable Total
Q3c Please tell me if you have a very favorable, somewhat favorable, somewhat
unfavorable or very unfavorable opinion of: c. China
Spring, 2011
Spring, 2007
Spring, 2011
Spring, 2010
Spring, 2009
Spring, 2008
Spring, 2007
Spring, 2006
May, 2005
Spring, 2011
Spring, 2010
Spring, 2009
Spring, 2008
Spring, 2007
Spring, 2006
Spring, 2011
Spring, 2010
Spring, 2009
Spring, 2008
Spring, 2007
Spring, 2006
May, 2005
Spring, 2011
Spring, 2010
Spring, 2009
Spring, 2008
Spring, 2007
May, 2005
Spring, 2011
Spring, 2009
Spring, 2007
Spring, 2011
Spring, 2009
Spring, 2007
Spring, 2011
Spring, 2010
Spring, 2009
Spring, 2008
Spring, 2007
Spring, 2006
May, 2005
Spring, 2011
Spring, 2011
Spring, 2010
Spring, 2009
Spring, 2008
Spring, 2007
Spring, 2006
May, 2005
Summer, 2002
Ukraine
Turkey
Egypt
Jordan
Lebanon
Palest. ter.
Israel
China
India
Indonesia
1002624644
10022235716
10063285111
1005426605
1008628526
1008430518
1006433535
10065235611
100401916196
1002183553
1002143658
1002064053
1002023560
1000153362
1000023364
1001133164
10091035387
100812254214
100510363811
100111924406
10082921376
10021422539
10067214719
100629193313
100824183812
10041429449
100214284313
100313244514
10051835376
10051036418
10061435397
10041636359
100118323515
100210363518
100318343113
100612204320
10046253926
100128213722
100019293220
100513303715
100412273819
100222415319
100243212267
100223617214
100263911186
100274512133
100194516173
100174422162
100183155113
10014320558
91
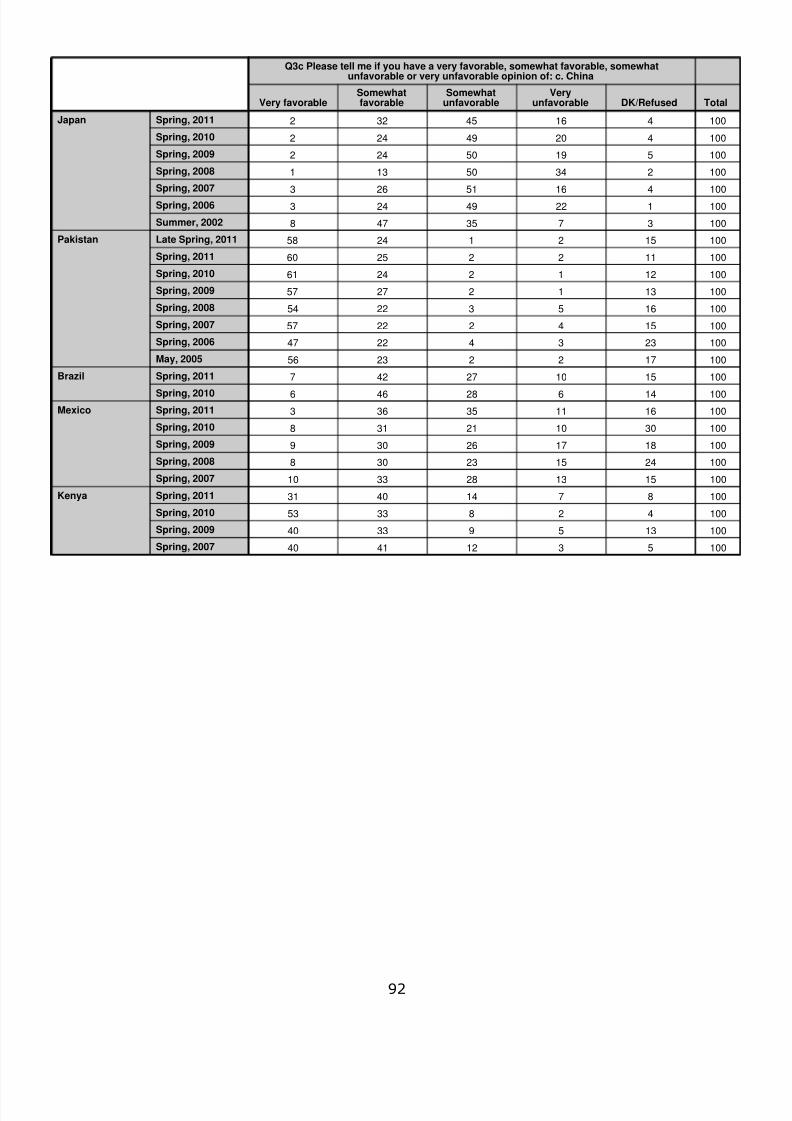
8/3/2019 Pew Global Attitudes Balance of Power U.S. Image Report FINAL July 13 2011
http://slidepdf.com/reader/full/pew-global-attitudes-balance-of-power-us-image-report-final-july-13-2011 94/160
DK/RefusedVery
unfavorableSomewhat
unfavorableSomewhatfavorableVery favorable Total
Q3c Please tell me if you have a very favorable, somewhat favorable, somewhat
unfavorable or very unfavorable opinion of: c. China
Spring, 2011
Spring, 2010
Spring, 2009
Spring, 2008
Spring, 2007
Spring, 2006
Summer, 2002
Late Spring, 2011
Spring, 2011
Spring, 2010
Spring, 2009
Spring, 2008
Spring, 2007
Spring, 2006
May, 2005
Spring, 2011
Spring, 2010
Spring, 2011
Spring, 2010
Spring, 2009
Spring, 2008
Spring, 2007
Spring, 2011
Spring, 2010
Spring, 2009
Spring, 2007
Japan
Pakistan
Brazil
Mexico
Kenya
10053124140
10013593340
1004283353
10087144031
1001513283310
100241523308
100181726309
100301021318
100161135363
10014628466
100151027427
10017222356
10023342247
10015422257
10016532254
10013122757
10012122461
10011222560
10015212458
1003735478
10012249243
10041651263
10023450131
10051950242
10042049242
10041645322
92

8/3/2019 Pew Global Attitudes Balance of Power U.S. Image Report FINAL July 13 2011
http://slidepdf.com/reader/full/pew-global-attitudes-balance-of-power-us-image-report-final-july-13-2011 95/160
DK/RefusedVery
unfavorableSomewhat
unfavorableSomewhatfavorableVery favorable Total
Q3d Please tell me if you have a very favorable, somewhat favorable, somewhat
unfavorable or very unfavorable opinion of: d. Iran
Spring, 2011
Spring, 2010
Fall, 2009
Spring, 2009
Spring, 2008
Spring, 2007
Spring, 2006
Spring, 2011
Spring, 2010
Spring, 2009
Spring, 2008
Spring, 2007
Spring, 2006
Spring, 2011
Spring, 2010
Spring, 2009
Spring, 2008
Spring, 2007
Spring, 2006
Spring, 2011
Spring, 2010
Spring, 2009
Spring, 2008
Spring, 2007
Spring, 2006
Spring, 2011
Spring, 2010
Spring, 2009
Spring, 2008
Spring, 2007
Spring, 2006
Spring, 2011
Spring, 2011
Spring, 2010
Spring, 2009
Spring, 2008
Spring, 2007
Spring, 2011
Spring, 2010
Spring, 2009
Spring, 2008
Spring, 2007
Spring, 2006
Spring, 2011
Spring, 2007
Spring, 2011
Spring, 2010
Spring, 2009
Spring, 2008
Spring, 2007
United States
Britain
France
Germany
Spain
Lithuania
Poland
Russia
Ukraine
Turkey
100163818235
100204511186
100234612154
100164315215
100153725186
100201329317
10025731344
100209293310
10023733316
100221029346
10026728335
100201530297
10024827339
100152543152
100152246160
100181942191
100122042224
100201541231
100191451160
100113234193
100133240141
100134136101
100152446131
100132548112
1007433983
10063250111
1005404582
10062953111
10072755101
1006374980
1005384881
10003047211
10014341131
10003745172
10013244212
10004437171
10014137183
100281524313
100192433222
100221630303
100191933254
100192533202
100192632194
100183126178
100144526122
100163727155
100153528174
100125225101
100153829153
100143928163
93

8/3/2019 Pew Global Attitudes Balance of Power U.S. Image Report FINAL July 13 2011
http://slidepdf.com/reader/full/pew-global-attitudes-balance-of-power-us-image-report-final-july-13-2011 96/160
DK/RefusedVery
unfavorableSomewhat
unfavorableSomewhatfavorableVery favorable Total
Q3d Please tell me if you have a very favorable, somewhat favorable, somewhat
unfavorable or very unfavorable opinion of: d. Iran
Spring, 2006
Summer, 2002
Spring, 2011
Spring, 2010
Spring, 2009
Spring, 2008
Spring, 2007
Spring, 2006
Spring, 2011
Spring, 2010
Spring, 2009
Spring, 2008
Spring, 2007
Spring, 2006
Spring, 2011
Spring, 2010
Spring, 2009
Spring, 2008
Spring, 2007
Spring, 2011
Spring, 2009
Spring, 2007
Spring, 2011
Spring, 2009
Spring, 2007
Spring, 2011
Spring, 2010
Spring, 2009
Spring, 2008
Spring, 2007
Spring, 2006
Spring, 2011
Spring, 2011
Spring, 2010
Spring, 2009
Spring, 2008
Spring, 2007
Spring, 2006
Spring, 2011
Spring, 2010
Spring, 2009
Spring, 2008
Spring, 2007
Spring, 2006
Late Spring, 2011
Spring, 2011
Spring, 2010
Spring, 2009
Spring, 2008
Spring, 2007
Turkey
Egypt
Jordan
Lebanon
Palest. ter.
Israel
China
India
Indonesia
Japan
Pakistan
10021643038
10021572839
10018444133
10019363735
10018553835
10022353833
10081553203
100152446131
100121951161
100171948151
100132253111
100241344191
10072135522
10016317568
10020621458
10017423478
10013422557
100164224711
100541415143
10026840242
10019946242
100231142222
100171047232
100141347243
100181341263
1003771641
1004642552
1002811151
100622173817
100329193712
10021930427
100150141917
100156101519
10035481223
100147131623
100247121425
100118333712
10012132388
100427293110
10044224255
100129342611
10053735203
10019304613
10011139426
10012034379
10043725287
10013234285
10023738193
100174417175
1001220153518
94

8/3/2019 Pew Global Attitudes Balance of Power U.S. Image Report FINAL July 13 2011
http://slidepdf.com/reader/full/pew-global-attitudes-balance-of-power-us-image-report-final-july-13-2011 97/160
DK/RefusedVery
unfavorableSomewhat
unfavorableSomewhatfavorableVery favorable Total
Q3d Please tell me if you have a very favorable, somewhat favorable, somewhat
unfavorable or very unfavorable opinion of: d. Iran
Spring, 2006
Spring, 2011
Spring, 2010
Spring, 2011
Spring, 2010
Spring, 2009
Spring, 2008
Spring, 2007
Spring, 2011
Spring, 2010
Spring, 2009
Spring, 2007
Pakistan
Brazil
Mexico
Kenya
100623332513
1002219232610
1001013313115
100172730207
100172533186
100323224112
100302327173
100381927151
100212038192
100161946171
100202140182
10018463141
95

8/3/2019 Pew Global Attitudes Balance of Power U.S. Image Report FINAL July 13 2011
http://slidepdf.com/reader/full/pew-global-attitudes-balance-of-power-us-image-report-final-july-13-2011 98/160

8/3/2019 Pew Global Attitudes Balance of Power U.S. Image Report FINAL July 13 2011
http://slidepdf.com/reader/full/pew-global-attitudes-balance-of-power-us-image-report-final-july-13-2011 99/160
DK/RefusedVery
unfavorableSomewhat
unfavorableSomewhatfavorableVery favorable Total
Q3e Please tell me if you have a very favorable, somewhat favorable, somewhat
unfavorable or very unfavorable opinion of: e. Russia
Spring, 2007
Spring, 2011
Spring, 2009
Spring, 2007
Spring, 2011
Spring, 2010
Spring, 2009
Spring, 2007
Spring, 2011
Spring, 2011
Spring, 2010
Spring, 2009
Spring, 2007
Spring, 2011
Spring, 2010
Spring, 2009
Spring, 2007
Late Spring, 2011
Spring, 2011
Spring, 2010
Spring, 2009
Spring, 2007
Spring, 2011
Spring, 2010
Spring, 2011
Spring, 2010
Spring, 2009
Spring, 2007
Spring, 2011
Spring, 2010
Spring, 2009
Spring, 2007
Palest. ter.
Israel
China
India
Indonesia
Japan
Pakistan
Brazil
Mexico
Kenya
10089264017
1002518212510
1001111313116
100201926268
100261125335
100361422236
100451318214
100291632221
10019934371
100211433312
100402418144
10036371791
10040351692
10043311592
100423012141
100111750202
10091850221
100101248291
100101448271
10023536333
10028833293
10019935362
100211331314
100498121813
10014527495
10012835415
10011832445
100161126425
10052541245
10042738256
10023138263
100112732264
97

8/3/2019 Pew Global Attitudes Balance of Power U.S. Image Report FINAL July 13 2011
http://slidepdf.com/reader/full/pew-global-attitudes-balance-of-power-us-image-report-final-july-13-2011 100/160
DK/RefusedVery
unfavorableSomewhat
unfavorableSomewhatfavorableVery favorable Total
Q3f Please tell me if you have a very favorable, somewhat favorable, somewhat
unfavorable or very unfavorable opinion of: f. The European Union
Spring, 2011
Spring, 2010
Spring, 2009
Spring, 2007
March, 2004
Summer, 2002
Spring, 2011
Spring, 2010
Spring, 2009
Spring, 2007
March, 2004
Spring, 2011
Spring, 2010
Spring, 2009
Spring, 2007
March, 2004
Spring, 2011
Spring, 2010
Spring, 2009
Spring, 2007
March, 2004
Spring, 2011
Spring, 2010
Spring, 2009
Spring, 2007
Spring, 2011
Spring, 2011
Spring, 2010
Spring, 2009
Spring, 2007
Spring, 2011
Spring, 2010
Spring, 2009
Spring, 2007
March, 2004
Spring, 2011
Spring, 2007
Spring, 2011
Spring, 2010
Spring, 2009
Spring, 2007
March, 2004
Spring, 2011
Spring, 2010
Spring, 2009
Spring, 2007
Spring, 2011
Spring, 2010
Spring, 2009
Spring, 2007
United States
Britain
France
Germany
Spain
Lithuania
Poland
Russia
Ukraine
Turkey
Egypt
Jordan
10043040188
100335371610
100537301811
10053932185
100414303319
100524263214
100225303210
10033329269
100720153622
100154414225
10020509184
100144512244
100144519185
10012385621
100143115517
100215135111
100203154715
100154135316
100163125019
100175144915
10071106023
10073126215
10052126021
10073166014
10071146711
10053126416
10062146215
10043156215
10037174923
10036334513
10026245612
1003626578
10037285111
1001527588
10019225712
10001127539
10009285012
10009285113
100011264914
100915214113
1001016214210
100101821428
100102121409
100819223813
100334104013
10035917327
10030715389
100228154214
100236144413
100236164015
98

8/3/2019 Pew Global Attitudes Balance of Power U.S. Image Report FINAL July 13 2011
http://slidepdf.com/reader/full/pew-global-attitudes-balance-of-power-us-image-report-final-july-13-2011 101/160
DK/RefusedVery
unfavorableSomewhat
unfavorableSomewhatfavorableVery favorable Total
Q3f Please tell me if you have a very favorable, somewhat favorable, somewhat
unfavorable or very unfavorable opinion of: f. The European Union
March, 2004
Spring, 2011
Spring, 2010
Spring, 2009
Spring, 2007
Spring, 2011
Spring, 2009
Spring, 2007
Spring, 2011
Spring, 2009
Spring, 2007
Spring, 2011
Spring, 2010
Spring, 2009
Spring, 2007
Spring, 2011
Spring, 2011
Spring, 2010
Spring, 2009
Spring, 2007
Spring, 2011
Spring, 2010
Spring, 2009
Spring, 2007
Late Spring, 2011
Spring, 2011
Spring, 2010
Spring, 2009
Spring, 2007
March, 2004
Spring, 2011
Spring, 2010
Spring, 2011
Spring, 2010
Spring, 2009
Spring, 2007
Spring, 2011
Spring, 2010
Spring, 2009
Spring, 2007
Jordan
Lebanon
Palest. ter.
Israel
China
India
Indonesia
Japan
Pakistan
Brazil
Mexico
Kenya
1006394537
100216122636
1007393149
100166114126
100239184010
100358163110
100386142913
100271524294
10017423523
10021923425
100482211163
100462218113
10046361081
10046341171
10048361051
10047351081
10012522556
10013219587
100113136310
100121166110
10022319487
10027617428
10015622517
100201124387
10060611194
10020733364
100161034354
100151029416
100201532275
10061727409
100514264214
10031234447
10083228257
10063324316
10022934315
100815183821
100116184620
100219194318
100222213817
100103144143
99

8/3/2019 Pew Global Attitudes Balance of Power U.S. Image Report FINAL July 13 2011
http://slidepdf.com/reader/full/pew-global-attitudes-balance-of-power-us-image-report-final-july-13-2011 102/160
DK/RefusedVery
unfavorableSomewhat
unfavorableSomewhatfavorableVery favorable Total
Q3j Please tell me if you have a very favorable, somewhat favorable, somewhat
unfavorable or very unfavorable opinion of: j. The United Nations
Spring, 2011
Spring, 2009
Spring, 2007
Spring, 2006
March, 2004
Spring, 2011
Spring, 2009
Spring, 2007
Spring, 2006
March, 2004
Spring, 2011
Spring, 2009
Spring, 2007
Spring, 2006
March, 2004
Spring, 2011
Spring, 2009
Spring, 2007
Spring, 2006
March, 2004
Spring, 2011
Spring, 2009
Spring, 2007
Spring, 2006
Spring, 2011
Spring, 2011
Spring, 2009
Spring, 2007
Spring, 2011
Spring, 2009
Spring, 2007
Spring, 2006
March, 2004
Spring, 2011
Spring, 2007
Spring, 2011
Spring, 2009
Spring, 2007
Spring, 2006
March, 2004
Spring, 2011
Spring, 2009
Spring, 2007
Spring, 2006
Spring, 2011
Spring, 2009
Spring, 2007
Spring, 2006
March, 2004
Spring, 2011
United States
Britain
France
Germany
Spain
Lithuania
Poland
Russia
Ukraine
Turkey
Egypt
Jordan
Lebanon 100116184520
10064726156
10013633246
100235312210
100034233113
100131332411
100024273811
10012530368
100021234115
100218263717
1001419163813
100203219245
100203918203
100264611153
100164021185
100158144815
10026515477
100215134713
100229203811
100185194612
100216174610
100206204311
100115165315
100162106210
100132145814
10019214624
100108224911
100109185310
10014420538
100510194422
10063205021
10074215513
1005427568
1007423596
1006219649
10036245710
10008206210
1000726579
1000620659
10005186214
10074145222
100118154916
100108234711
100127155017
100104145221
1001115204114
1001119193615
100131623399
1001013164318
1001112164219
100
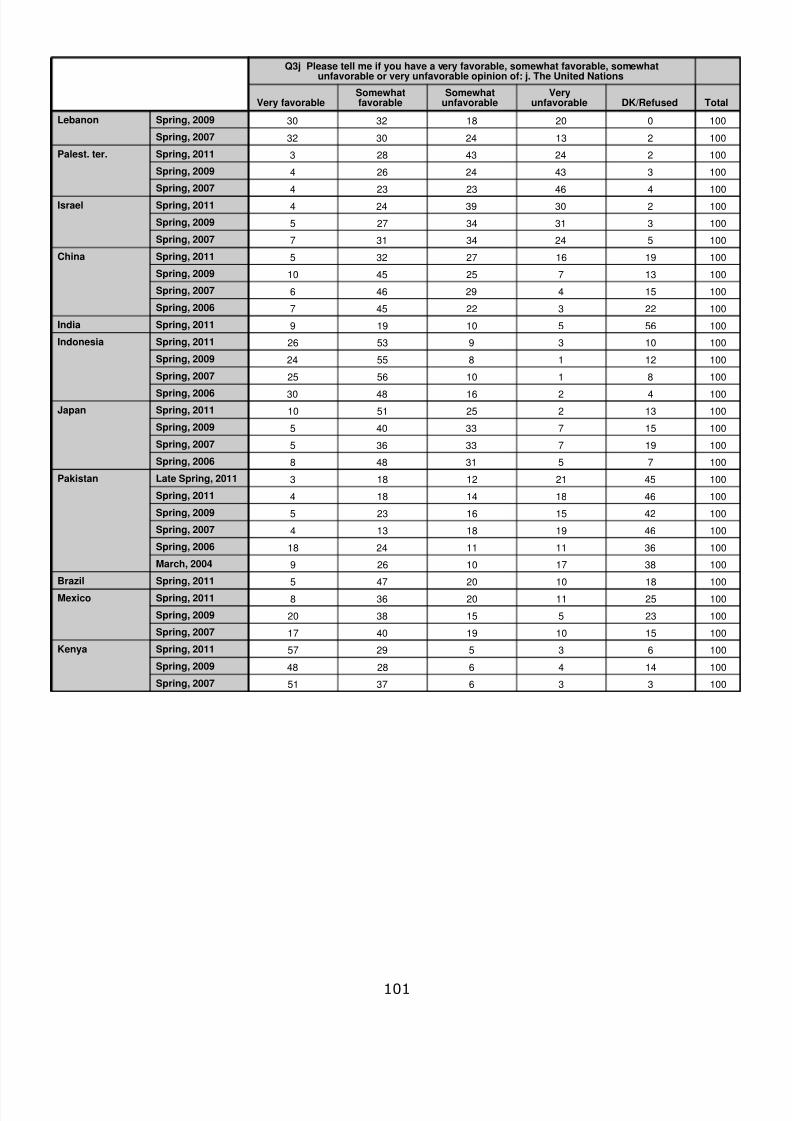
8/3/2019 Pew Global Attitudes Balance of Power U.S. Image Report FINAL July 13 2011
http://slidepdf.com/reader/full/pew-global-attitudes-balance-of-power-us-image-report-final-july-13-2011 103/160
DK/RefusedVery
unfavorableSomewhat
unfavorableSomewhatfavorableVery favorable Total
Q3j Please tell me if you have a very favorable, somewhat favorable, somewhat
unfavorable or very unfavorable opinion of: j. The United Nations
Spring, 2009
Spring, 2007
Spring, 2011
Spring, 2009
Spring, 2007
Spring, 2011
Spring, 2009
Spring, 2007
Spring, 2011
Spring, 2009
Spring, 2007
Spring, 2006
Spring, 2011
Spring, 2011
Spring, 2009
Spring, 2007
Spring, 2006
Spring, 2011
Spring, 2009
Spring, 2007
Spring, 2006
Late Spring, 2011
Spring, 2011
Spring, 2009
Spring, 2007
Spring, 2006
March, 2004
Spring, 2011
Spring, 2011
Spring, 2009
Spring, 2007
Spring, 2011
Spring, 2009
Spring, 2007
Lebanon
Palest. ter.
Israel
China
India
Indonesia
Japan
Pakistan
Brazil
Mexico
Kenya
1003363751
10014462848
1006352957
1001510194017
100235153820
100251120368
100181020475
100381710269
1003611112418
100461918134
100421516235
100461814184
100452112183
1007531488
10019733365
10015733405
100132255110
10042164830
10081105625
10012185524
10010395326
10056510199
10022322457
10015429466
100137254510
100191627325
10052434317
10033134275
10023039244
10044623234
10034324264
10022443283
100213243032
100020183230
101

8/3/2019 Pew Global Attitudes Balance of Power U.S. Image Report FINAL July 13 2011
http://slidepdf.com/reader/full/pew-global-attitudes-balance-of-power-us-image-report-final-july-13-2011 104/160
DK/RefusedVery
unfavorableSomewhat
unfavorableSomewhatfavorableVery favorable Total
Q3k Please tell me if you have a very favorable, somewhat favorable, somewhat
unfavorable or very unfavorable opinion of: k. Germany
Spring, 2011
Spring, 2010
Spring, 2007
Spring, 2006
May, 2005
Summer, 2002
Spring, 2011
Spring, 2010
Spring, 2007
Spring, 2006
May, 2005
Summer, 2002
Spring, 2011
Spring, 2010
Spring, 2007
Spring, 2006
May, 2005
Spring, 2011
Spring, 2010
Spring, 2007
Spring, 2006
May, 2005
Spring, 2011
Spring, 2011
Spring, 2010
Spring, 2007
May, 2005
Summer, 2002
Spring, 2011
Spring, 2010
Spring, 2007
Spring, 2006
May, 2005
Spring, 2011
Spring, 2007
Britain
France
Germany
Spain
Lithuania
Poland
Russia
Ukraine
10012375821
10012286315
10083105821
10094105522
100122105522
100122105322
10010395820
10082136115
100134195311
1009519589
10042166216
10063166511
10071107210
10014285027
100134115814
10083126511
10012196018
1004485134
10016285410
10028255312
10016215617
10005196412
10013235815
1004167513
1000487118
1000386920
1000376921
1000277021
1000376426
100164125018
100132105718
10014395420
10013486014
10016485319
10012375622
102

8/3/2019 Pew Global Attitudes Balance of Power U.S. Image Report FINAL July 13 2011
http://slidepdf.com/reader/full/pew-global-attitudes-balance-of-power-us-image-report-final-july-13-2011 105/160
DK/RefusedVery
unfavorableSomewhat
unfavorableSomewhatfavorableVery favorable Total
Q3l Please tell me if you have a very favorable, somewhat favorable, somewhatunfavorable or very unfavorable opinion of: l. NATO, that is, North Atlantic Treaty
Organization
Spring, 2011
Spring, 2010
Fall, 2009
Spring, 2011
Spring, 2010
Fall, 2009
Spring, 2011
Spring, 2010
Fall, 2009
Spring, 2011
Spring, 2010
Fall, 2009
Spring, 2011
Spring, 2010
Fall, 2009
Spring, 2011
Fall, 2009
Spring, 2011
Spring, 2010
Fall, 2009
Spring, 2007
Spring, 2011
Spring, 2010
Fall, 2009
Spring, 2007
Spring, 2011
Fall, 2009
Spring, 2007
Spring, 2011
United States
Britain
France
Germany
Spain
Lithuania
Poland
Russia
Ukraine
Turkey 100174321162
100123024277
1001727242110
100251823304
100222028255
100182236204
100201426328
100191726289
100114135715
10015285817
10013195918
100142116012
10022514509
10016217614
10015820497
10019523476
100611214715
10044185914
1009627507
1007429546
10017205912
1002724626
10017236010
100216114122
100245124218
100205124617
1002310144211
100256154113
100227174014
103

8/3/2019 Pew Global Attitudes Balance of Power U.S. Image Report FINAL July 13 2011
http://slidepdf.com/reader/full/pew-global-attitudes-balance-of-power-us-image-report-final-july-13-2011 106/160
DK/RefusedVery
unfavorableSomewhat
unfavorableSomewhatfavorableVery favorable Total
Q3q Please tell me if you have a very favorable, somewhat favorable, somewhat
unfavorable or very unfavorable opinion of: q. India
Spring, 2011
Spring, 2010
Spring, 2008
Spring, 2007
Spring, 2006
Spring, 2011
Spring, 2011
Spring, 2010
Spring, 2008
Spring, 2007
Spring, 2011
Spring, 2010
Spring, 2008
Spring, 2007
Spring, 2006
Late Spring, 2011
Spring, 2011
Spring, 2010
Spring, 2008
Spring, 2006
Summer, 2002
China
India
Indonesia
Japan
Pakistan
1001471951
100173218249
100153720207
100105218164
1007651792
100115718122
1007226578
10014530447
10010426555
10012522566
10018320527
10011213659
10016220567
10013319613
10016319556
1005141279
10024538312
100151245272
100201238272
100181932284
100192132252
104

8/3/2019 Pew Global Attitudes Balance of Power U.S. Image Report FINAL July 13 2011
http://slidepdf.com/reader/full/pew-global-attitudes-balance-of-power-us-image-report-final-july-13-2011 107/160
DK/RefusedVery badSomewhat badSomewhat
goodVery good Total
Q4 Now thinking about our economic situation, how would you describe the currenteconomic situation in (survey country) - is it very good, somewhat good, somewhat bad or
very bad?
Spring, 2011
Spring, 2010
Fall, 2009
Spring, 2009
Spring, 2008
Spring, 2007
Summer, 2002
Spring, 2011
Spring, 2010
Fall, 2009
Spring, 2009
Spring, 2008
Spring, 2007
Summer, 2002
Spring, 2011
Spring, 2010
Fall, 2009
Spring, 2009
Spring, 2008
Spring, 2007
Summer, 2002
Spring, 2011
Spring, 2010
Fall, 2009
Spring, 2009
Spring, 2008
Spring, 2007
Summer, 2002
Spring, 2011
Spring, 2010
Fall, 2009
Spring, 2009
Spring, 2008
Spring, 2007
Spring, 2011
Fall, 2009
Spring, 2011
Spring, 2010
Fall, 2009
Spring, 2009
Spring, 2008
Spring, 2007
Summer, 2002
United States
Britain
France
Germany
Spain
Lithuania
Poland
1002514070
10031348360
1006636493
10061550272
10031247362
1003836485
10032249251
1002435030
1001325890
1001529569
10031943341
10024738121
10014543111
10004840121
1000622791
10011655261
10011125558
1001739494
10021654271
10011258271
1001847422
1001527589
1002647441
10001753291
10002061190
10002758140
10002460151
10003156121
10003152170
1004824578
10038205613
10022047282
10024938101
10023845142
10013940182
10014045141
10021339424
10031632419
10033641182
10014142152
10023444191
10013441231
10014238171
105

8/3/2019 Pew Global Attitudes Balance of Power U.S. Image Report FINAL July 13 2011
http://slidepdf.com/reader/full/pew-global-attitudes-balance-of-power-us-image-report-final-july-13-2011 108/160
DK/RefusedVery badSomewhat badSomewhat
goodVery good Total
Q4 Now thinking about our economic situation, how would you describe the currenteconomic situation in (survey country) - is it very good, somewhat good, somewhat bad or
very bad?
Spring, 2011
Spring, 2010
Fall, 2009
Spring, 2009
Spring, 2008
Spring, 2007
Summer, 2002
Spring, 2011
Fall, 2009
Spring, 2007
Summer, 2002
Spring, 2011
Spring, 2010
Spring, 2009
Spring, 2008
Spring, 2007
Summer, 2002
Spring, 2011
Spring, 2010
Spring, 2009
Spring, 2008
Spring, 2007
Spring, 2011
Spring, 2010
Spring, 2009
Spring, 2008
Spring, 2007
Summer, 2002
Spring, 2011
Spring, 2010
Spring, 2009
Spring, 2008
Spring, 2007
Summer, 2002
Spring, 2011
Spring, 2009
Spring, 2007
Spring, 2011
Spring, 2009
Spring, 2007
Spring, 2011
Spring, 2010
Spring, 2009
Spring, 2008
Spring, 2007
Summer, 2002
Russia
Ukraine
Turkey
Egypt
Jordan
Lebanon
Palest. ter.
Israel
China
10011037493
10041136616
1004113775
1002196919
1002077219
1003086919
10021340415
10012345257
10011432477
1000682282
10005924161
10002638287
1000702550
1004543272
1001523891
10005436101
10005234121
10025035112
10011849276
100213413212
10011644318
10002344303
10012643255
10002741249
100223234013
100225293410
10004429243
10003347182
10022836286
10027015122
10032229379
10044727174
10033537222
10013629313
100325233712
10014741100
10062946163
1003593232
1002563651
10042657130
10061145353
1004637475
10052155182
10041850253
10041649303
10061946245
106

8/3/2019 Pew Global Attitudes Balance of Power U.S. Image Report FINAL July 13 2011
http://slidepdf.com/reader/full/pew-global-attitudes-balance-of-power-us-image-report-final-july-13-2011 109/160
DK/RefusedVery badSomewhat badSomewhat
goodVery good Total
Q4 Now thinking about our economic situation, how would you describe the currenteconomic situation in (survey country) - is it very good, somewhat good, somewhat bad or
very bad?
Spring, 2011
Spring, 2011
Spring, 2010
Spring, 2009
Spring, 2008
Spring, 2007
Summer, 2002
Spring, 2011
Spring, 2010
Spring, 2009
Spring, 2008
Spring, 2007
Summer, 2002
Late Spring, 2011
Spring, 2011
Spring, 2010
Spring, 2009
Spring, 2008
Spring, 2007
Summer, 2002
Spring, 2011
Spring, 2010
Spring, 2011
Spring, 2010
Spring, 2009
Spring, 2008
Spring, 2007
Summer, 2002
Spring, 2011
Spring, 2010
Spring, 2009
Spring, 2007
Summer, 2002
India
Indonesia
Japan
Pakistan
Brazil
Mexico
Kenya
1000662670
10011227537
10005921145
10013026367
10005520215
10033036283
10011829447
10022735306
10013336255
10013837222
10022840264
1002729584
10011332513
100142016418
100912203920
10043521338
10045024202
10045820153
10036023104
1003652084
1000514260
10021754271
10012857121
1001434791
10003949111
1001424691
10003253150
10012552212
10003544191
1001941444
1000941419
10001843353
100221223422
107

8/3/2019 Pew Global Attitudes Balance of Power U.S. Image Report FINAL July 13 2011
http://slidepdf.com/reader/full/pew-global-attitudes-balance-of-power-us-image-report-final-july-13-2011 110/160
DK/RefusedWorsen a lotWorsen a littleRemain the
sameImprove a littleImprove a lot Total
Q5 And over the next 12 months do you expect the economic situation in our country to improve a lot,
improve a little, remain the same, worsen a little or worsen a lot?
Spring, 2011
Spring, 2010
Spring, 2009
Spring, 2008
Summer, 2002
Spring, 2011
Spring, 2010
Spring, 2009
Spring, 2008
Summer, 2002
Spring, 2011
Spring, 2010
Spring, 2009
Spring, 2008
Summer, 2002
Spring, 2011
Spring, 2010
Spring, 2009
Spring, 2008
Summer, 2002
Spring, 2011
Spring, 2010
Spring, 2009
Spring, 2008
Spring, 2011
Spring, 2011
Spring, 2010
Spring, 2009
Spring, 2008
Summer, 2002
Spring, 2011
Spring, 2010
Spring, 2009
Spring, 2008
Summer, 2002
Spring, 2011
Summer, 2002
Spring, 2011
Spring, 2010
Spring, 2009
Spring, 2008
Summer, 2002
Spring, 2011
Spring, 2010
Spring, 2009
Spring, 2008
Spring, 2011
Spring, 2010
Spring, 2009
Spring, 2008
Summer, 2002
Spring, 2011
Spring, 2010
Spring, 2009
Spring, 2008
Summer, 2002
United States
Britain
France
Germany
Spain
Lithuania
Poland
Russia
Ukraine
Turkey
Egypt
Jordan
Lebanon
1005362223131
1004183222222
1006212625222
1002192926222
1002212626187
100272140256
1001212534145
100182238274
10061124301910
1001924322212
1002193135141
100193232233
1004162235223
1002413263422
1008272222183
10014262917122
1008173018243
1006221829205
10081021183014
10035959231
1005242036141
100751353211
100631039348
100971536275
10073842363
100961246226
1007111951120
100721044334
100652247191
100521049323
1008122045141
1004121943201
100573633171
100392128362
100171930403
1001142134273
100141739373
100162339293
100181925423
100051531453
100031742353
100262336293
1000133334181
1000152829252
1000162734211
1000223032161
100372439225
1002183728122
100381530386
100571327416
1001182526283
100251728399
1004132624277
10021013164811
1002912204313
1001131825357
108

8/3/2019 Pew Global Attitudes Balance of Power U.S. Image Report FINAL July 13 2011
http://slidepdf.com/reader/full/pew-global-attitudes-balance-of-power-us-image-report-final-july-13-2011 111/160
DK/RefusedWorsen a lotWorsen a littleRemain the
sameImprove a littleImprove a lot Total
Q5 And over the next 12 months do you expect the economic situation in our country to improve a lot,
improve a little, remain the same, worsen a little or worsen a lot?
Spring, 2011
Spring, 2009
Spring, 2011
Spring, 2009
Spring, 2011
Spring, 2010
Spring, 2009
Spring, 2008
Summer, 2002
Spring, 2011
Spring, 2011
Spring, 2010
Spring, 2009
Spring, 2008
Summer, 2002
Spring, 2011
Spring, 2010
Spring, 2009
Spring, 2008
Summer, 2002
Late Spring, 2011
Spring, 2011
Spring, 2010
Spring, 2009
Spring, 2008
Summer, 2002
Spring, 2011
Spring, 2010
Spring, 2011
Spring, 2010
Spring, 2009
Spring, 2008
Summer, 2002
Spring, 2011
Spring, 2010
Spring, 2009
Summer, 2002
Palest. ter.
Israel
China
India
Indonesia
Japan
Pakistan
Brazil
Mexico
Kenya
10015101328304
1005272121197
1005910194413
10041813193213
1006812293311
1002516353012
100259244219
10031016253512
1001913293513
100313173936
100025142950
100305618337
1001288183914
10014161928194
10011311920145
10012361916143
10010421815112
100052163110
100010384750
100182153171
100182552140
1001163631161
10022946356
100761842234
100503384410
100115374313
10033947307
100688194119
10031653324
10030295332
100204115824
100101106522
100402106222
1002816283511
100161244306
1006191527294
100223631336
109
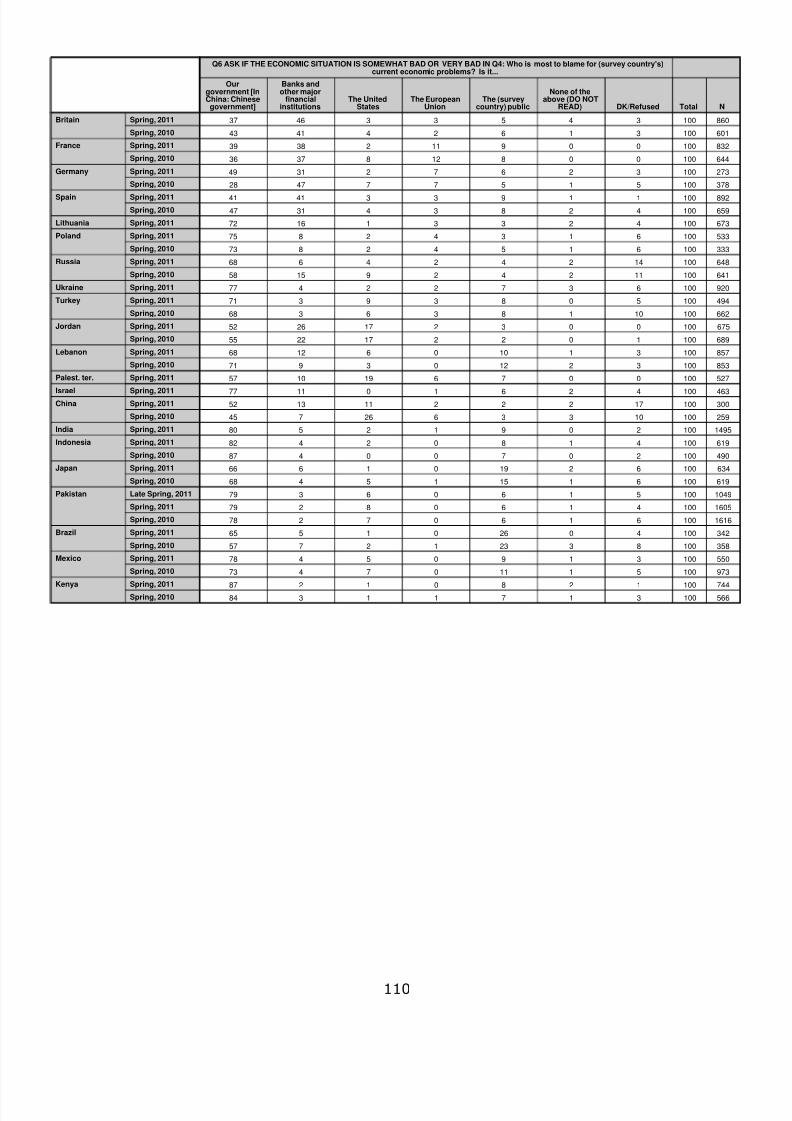
8/3/2019 Pew Global Attitudes Balance of Power U.S. Image Report FINAL July 13 2011
http://slidepdf.com/reader/full/pew-global-attitudes-balance-of-power-us-image-report-final-july-13-2011 112/160
DK/Refused
None of theabove (DO NOT
READ)The (survey
country) publicThe European
UnionThe United
States
Banks andother major
financialinstitutions
Ourgovernment [InChina: Chinesegovernment] NTotal
Q6 ASK IF THE ECONOMIC SITUATION IS SOMEWHAT BAD OR VERY BAD IN Q4: Who is most to blame for (survey country's)
current economic problems? Is it...
Spring, 2011
Spring, 2010
Spring, 2011
Spring, 2010
Spring, 2011
Spring, 2010
Spring, 2011
Spring, 2010
Spring, 2011
Spring, 2011
Spring, 2010
Spring, 2011
Spring, 2010
Spring, 2011
Spring, 2011
Spring, 2010
Spring, 2011
Spring, 2010
Spring, 2011
Spring, 2010
Spring, 2011
Spring, 2011Spring, 2011
Spring, 2010
Spring, 2011
Spring, 2011
Spring, 2010
Spring, 2011
Spring, 2010
Late Spring, 2011
Spring, 2011
Spring, 2010
Spring, 2011
Spring, 2010
Spring, 2011
Spring, 2010
Spring, 2011
Spring, 2010
Britain
France
Germany
Spain
Lithuania
Poland
Russia
Ukraine
Turkey
Jordan
Lebanon
Palest. ter.
IsraelChina
India
Indonesia
Japan
Pakistan
Brazil
Mexico
Kenya
56610031711384
74410012801287
973100511107473
55010031905478
358100832312757
342100402601565
161610061607278
160510041608279
104910051606379
619100611515468
634100621901666
49010020700487
61910041802482
149510020912580
2591001033626745
30010017222111352
463100426101177
5271000076191057
853100321203971
8571003110061268
6891001022172255
6751000032172652
662100101836368
49410050839371
92010063722477
6411001124291558
648100142424668
33310061542873
53310061342875
673100423311672
659100428343147
892100119334141
378100515774728
273100326723149
6441000081283736
8321000091123839
601100316244143
860100345334637
110

8/3/2019 Pew Global Attitudes Balance of Power U.S. Image Report FINAL July 13 2011
http://slidepdf.com/reader/full/pew-global-attitudes-balance-of-power-us-image-report-final-july-13-2011 113/160
DK/Refused
None of theabove (DO NOT
READ)The (survey
country) publicThe European
UnionThe United
States
Banks andother major
financialinstitutions
Ourgovernment [InChina: Chinesegovernment] NTotal
Q7 ASK IF ANSWER GIVEN IN Q6: Who is second most to blame for (survey country's) current economic problems? Is it...
Spring, 2011
Spring, 2010
Spring, 2011
Spring, 2010
Spring, 2011
Spring, 2010
Spring, 2011
Spring, 2010Spring, 2011
Spring, 2011
Spring, 2010
Spring, 2011
Spring, 2010
Spring, 2011
Spring, 2011
Spring, 2010
Spring, 2011
Spring, 2010
Spring, 2011
Spring, 2010
Spring, 2011
Spring, 2011
Spring, 2011
Spring, 2010
Spring, 2011
Spring, 2011
Spring, 2010
Late Spring, 2011
Spring, 2011
Spring, 2010
Spring, 2011
Spring, 2010
Spring, 2011
Spring, 2010
Spring, 2011
Spring, 2010
Britain
France
Germany
Spain
Lithuania
Poland
Russia
Ukraine
Turkey
Jordan
Lebanon
Palest. ter.
Israel
China
India
Indonesia
Pakistan
Brazil
Mexico
Kenya
539100121734252010
7241006194312209
919100122232192616
528100132251162715
3181009336142226
3321004534142725
1516100178281211212
1519100195242261014
977100174291241411
4791001473917239
5881005444252812
146210030340221210
22510017291519317
231100152176103712
42810013531163014
523100011717321221
817100136322151518
81810064362141918
68010023164233221
67510017126223417
5861001282110211712
4651001601411251816
8441002542636269
561100173143133416
54410024424392511
308100116181953111
497100134171953112
63410093148347166171005417893720
8701002318993424
36310032511143133
25810031121573824
643100111115123327
82710001122372730
57710031138133626
7961002314673136
111

8/3/2019 Pew Global Attitudes Balance of Power U.S. Image Report FINAL July 13 2011
http://slidepdf.com/reader/full/pew-global-attitudes-balance-of-power-us-image-report-final-july-13-2011 114/160
DK/Refused
None of theabove (DO NOT
READ)The (survey
country) publicThe European
UnionThe United
States
Banks andother major
financialinstitutions
Ourgovernment [InChina: Chinese
government] Total
Q6/Q7 COMBINED
Spring, 2011
Spring, 2010
Spring, 2011
Spring, 2010
Spring, 2011
Spring, 2010
Spring, 2011
Spring, 2010
Spring, 2011
Spring, 2011
Spring, 2010
Spring, 2011
Spring, 2010
Spring, 2011
Spring, 2011
Spring, 2010
Spring, 2011
Spring, 2010
Spring, 2011
Spring, 2010
Spring, 2011
Spring, 2011
Spring, 2011
Spring, 2010
Spring, 2011
Spring, 2011
Spring, 2010
Late Spring, 2011
Spring, 2011
Spring, 2010
Spring, 2011
Spring, 2010
Spring, 2011
Spring, 2010
Spring, 2011Spring, 2010
Britain
France
Germany
Spain
Lithuania
Poland
Russia
Ukraine
Turkey
Jordan
Lebanon
Palest. ter.
Israel
China
India
Indonesia
Pakistan
Brazil
Mexico
Kenya195151839352293
19772049122195
194163322252988
196153341203093
19016555252680
1968558153189
193229321261389
196225292331193
194214331291690
19816745172695
1958549263193
19831348441791
1872551119423551
181294167204362
19416735263990
199112422512278
195157432182388
19685453193185
19933185395377
20017158395970
1892192612241879
1952002114322187
19229730572786
188264174204572
184355244122777
193166222263784
193184192273786
194135161146087
194962411136666
198342612127565
195721017207760
19563182196871
200111827207063
19911213486568
196621810177668
1935718997570
112

8/3/2019 Pew Global Attitudes Balance of Power U.S. Image Report FINAL July 13 2011
http://slidepdf.com/reader/full/pew-global-attitudes-balance-of-power-us-image-report-final-july-13-2011 115/160
DK/RefusedNot a problem
at allSmall problemModerately big
problemVery bigproblem Total
Q13 Do you think rising prices is a very big problem, a moderately big problem, a small
problem or not a problem at all in our country?
Spring, 2011
Spring, 2011
Spring, 2011
Spring, 2011
Spring, 2011
Spring, 2011
Spring, 2011
Spring, 2011
Spring, 2011
Spring, 2011
Spring, 2011
Spring, 2011
Spring, 2011
Spring, 2011
Spring, 2011
Spring, 2011
Spring, 2011
Spring, 2011
Late Spring, 2011
Spring, 2011
Spring, 2011
Spring, 2011
Spring, 2011
United States
Britain
France
Germany
Spain
Lithuania
Poland
Russia
Ukraine
Turkey
Egypt
Jordan
Lebanon
Palest. ter.
Israel
China
India
Indonesia
Pakistan
Brazil
Mexico
Kenya 100011693
1000022374
1001141679
100100297
100100197
1000021781
1001011583
1001164449
1000234947
1000131383
1000011089
1000023464
1001682858
1001572166
1001141976
1002153062
1002152766
1001011286
1000253260
10003254132
1000022870
1000283455
1002283157
113

8/3/2019 Pew Global Attitudes Balance of Power U.S. Image Report FINAL July 13 2011
http://slidepdf.com/reader/full/pew-global-attitudes-balance-of-power-us-image-report-final-july-13-2011 116/160
DK/RefusedNot a problem
at allSmall problemModerately big
problemVery bigproblem Total
Q13b Do you think a lack of job opportunities is a very big problem, a moderately big
problem, a small problem or not a problem at all in our country?
Spring, 2011
Spring, 2011
Spring, 2011
Spring, 2011
Spring, 2011
Spring, 2011
Spring, 2011
Spring, 2011
Spring, 2011
Spring, 2011
Spring, 2011
Spring, 2011
Spring, 2011
Spring, 2011
Spring, 2011
Spring, 2011
Spring, 2011
Spring, 2011
Late Spring, 2011
Spring, 2011
Spring, 2011
Spring, 2011
Spring, 2011
United States
Britain
France
Germany
Spain
Lithuania
Poland
Russia
Ukraine
Turkey
Egypt
Jordan
Lebanon
Palest. ter.
Israel
China
India
Indonesia
Pakistan
Brazil
Mexico
Kenya 100001693
1000132670
1000461574
100101395
100101395
1001122868
1001142075
10012124837
1000264843
1000121285
1000011089
1001143362
1001692856
1000251973
1000132175
1001263159
1002163556
1001011088
1000021286
10005243833
1000121780
1001152271
1001242271
114

8/3/2019 Pew Global Attitudes Balance of Power U.S. Image Report FINAL July 13 2011
http://slidepdf.com/reader/full/pew-global-attitudes-balance-of-power-us-image-report-final-july-13-2011 117/160
DK/RefusedVery badSomewhat badSomewhat
goodVery good Total
Q19 What do you think about the growing trade and business ties between (surveycountry) and other countries - do you think it is a very good thing, somewhat good,
somewhat bad or a very bad thing for our country?
Spring, 2011
Spring, 2010
Spring, 2009
Spring, 2008
Spring, 2007
Summer, 2002
Spring, 2011
Spring, 2010
Spring, 2009
Spring, 2008
Spring, 2007
Summer, 2002
Spring, 2011
Spring, 2010
Spring, 2009
Spring, 2008
Spring, 2007
Summer, 2002
Spring, 2011
Spring, 2010
Spring, 2009
Spring, 2008
Spring, 2007
Summer, 2002
Spring, 2011
Spring, 2010
Spring, 2009
Spring, 2008
Spring, 2007
United States
Britain
France
Germany
Spain
1009264735
1003266821
1003265435
1002275733
1001123858
1002175437
1001585530
10012105730
10012125332
1001175733
1001045540
1001385632
10005165622
10004145230
10004135528
10005155623
10004125627
1004275532
10072135028
10064134928
10043115329
1004385232
1003274839
10044145721
100515214514
100615263815
100510204916
10078194917
100410194918
115

8/3/2019 Pew Global Attitudes Balance of Power U.S. Image Report FINAL July 13 2011
http://slidepdf.com/reader/full/pew-global-attitudes-balance-of-power-us-image-report-final-july-13-2011 118/160
DK/RefusedVery badSomewhat badSomewhat
goodVery good Total
Q19 What do you think about the growing trade and business ties between (surveycountry) and other countries - do you think it is a very good thing, somewhat good,
somewhat bad or a very bad thing for our country?
Spring, 2011
Spring, 2011
Spring, 2010
Spring, 2009
Spring, 2008
Spring, 2007
Summer, 2002
Spring, 2011
Spring, 2010
Spring, 2009
Spring, 2008
Spring, 2007
Summer, 2002
Spring, 2011
Spring, 2007
Summer, 2002
Spring, 2011
Spring, 2010
Spring, 2009
Spring, 2008
Spring, 2007
Summer, 2002
Spring, 2011
Spring, 2010
Spring, 2009
Spring, 2008
Spring, 2007
Summer, 2002
Spring, 2011
Spring, 2010
Spring, 2009
Spring, 2008
Spring, 2007
Summer, 2002
Spring, 2011
Spring, 2009
Spring, 2007
Spring, 2011
Spring, 2009
Spring, 2007
Spring, 2011
Spring, 2010
Spring, 2009
Spring, 2008
Spring, 2007
Summer, 2002
Spring, 2011
Spring, 2011
Spring, 2010
Lithuania
Poland
Russia
Ukraine
Turkey
Jordan
Lebanon
Palest. ter.
Israel
China
India
Indonesia
10042125329
1005295033
10010263448
1006125832
1005145338
1006066819
1003036726
1004037320
1007136425
1004154347
1002364147
1002135144
10059173435
10016123644
10028143541
10033125429
10045103942
1003474441
1001094446
1000254746
1001114750
100011373715
10035204428
10038254124
100211283921
10029184031
10016164631
1006662954
100152113241
100131193334
100159133430
1006653350
1008283448
1001156231
1004244348
10062114040
1004256226
10062105230
10053115328
10072115624
1005275333
1006285033
10073126117
10073125621
1005196619
10062105922
10051106321
100101115424
1003154447
116

8/3/2019 Pew Global Attitudes Balance of Power U.S. Image Report FINAL July 13 2011
http://slidepdf.com/reader/full/pew-global-attitudes-balance-of-power-us-image-report-final-july-13-2011 119/160
DK/RefusedVery badSomewhat badSomewhat
goodVery good Total
Q19 What do you think about the growing trade and business ties between (surveycountry) and other countries - do you think it is a very good thing, somewhat good,
somewhat bad or a very bad thing for our country?
Spring, 2009
Spring, 2008
Spring, 2007
Summer, 2002
Late Spring, 2011
Spring, 2011
Spring, 2010
Spring, 2009
Spring, 2008
Spring, 2007
Summer, 2002
Spring, 2011
Spring, 2010
Spring, 2011
Spring, 2010
Spring, 2009
Spring, 2008
Spring, 2007
Summer, 2002
Spring, 2011
Spring, 2010
Spring, 2009
Spring, 2007
Summer, 2002
Indonesia
Pakistan
Brazil
Mexico
Kenya
1005142763
1002144449
10036114238
1001274446
1001353358
1008495127
10045145522
10057194821
10064125227
100106134823
10044135029
1005186522
10072106714
10020111662
10014133052
10015253048
10010293247
1009232363
1009432857
10012432556
1003196225
10064205516
10052215219
10051145821
117

8/3/2019 Pew Global Attitudes Balance of Power U.S. Image Report FINAL July 13 2011
http://slidepdf.com/reader/full/pew-global-attitudes-balance-of-power-us-image-report-final-july-13-2011 120/160
DK/Refused
None/ There isno leadingeconomic
power (DO NOTREAD)
Other (DO NOTREAD)
The countriesof the European
UnionJapan ORChinaThe United
States Total
Q26 Today, which ONE of the following do you think is the world's leading economic power?
Spring, 2011
Spring, 2010
Spring, 2009
Spring, 2008
Spring, 2011
Spring, 2010
Spring, 2009
Spring, 2008
Spring, 2011
Spring, 2010
Spring, 2009
Spring, 2008
Spring, 2011
Spring, 2010
Spring, 2009
Spring, 2008
Spring, 2011
Spring, 2010
Spring, 2009
Spring, 2008
Spring, 2011
Spring, 2011
Spring, 2010
Spring, 2009
Spring, 2008
Spring, 2011
Spring, 2010
Spring, 2009
Spring, 2008
Spring, 2011
Spring, 2011
Spring, 2010
Spring, 2009
Spring, 2008
Spring, 2011Spring, 2010
Spring, 2009
Spring, 2008
Spring, 2011
Spring, 2010
Spring, 2009
Spring, 2008
Spring, 2011
Spring, 2009
Spring, 2011
Spring, 2009
Spring, 2011
Spring, 2010
Spring, 2009
Spring, 2008
Spring, 2011
Spring, 2011
Spring, 2010
Spring, 2009
Spring, 2008
Spring, 2011
Spring, 2010
Spring, 2009
Spring, 2008
Late Spring, 2011
Spring, 2011
Spring, 2010
United States
Britain
France
Germany
Spain
Lithuania
Poland
Russia
Ukraine
Turkey
Jordan
Lebanon
Palest. ter.
Israel
China
India
Indonesia
Japan
Pakistan
1001740132153
1001821032551
1001810043047
1003101961952
100620762158
100310425040
100310633355
1007106181553
1008204191750
1005107182049
1007115182641
1003451361438
1001900922148
1001100524141
1001100623645
1001131812650
100310942656
100302373550
10032013103241
100310772855
10031202072235
10011401863229
10048013103629
1003701663731
1005101893136
1002101092949
10010061350301001104174434
100161086762
100184065958
100820541269
1001011431368
10094310122240
100103017251232
100158012222617
10012409252723
10011518102640
10090013111552
100126015111839
1008301092744
100931953043
100622681858
1005102092442
10062010122247
1006008123440
100200764937
10030031113025
1007003682820
1004001985118
1003102164822
10010014103144
1000001373545
100000754741
100000654742
1005501082944
100610753446
100500854438
100700754733
10071010102646
100610573348
100700684138
100600664338
118

8/3/2019 Pew Global Attitudes Balance of Power U.S. Image Report FINAL July 13 2011
http://slidepdf.com/reader/full/pew-global-attitudes-balance-of-power-us-image-report-final-july-13-2011 121/160
DK/Refused
None/ There isno leadingeconomic
power (DO NOTREAD)
Other (DO NOTREAD)
The countriesof the European
UnionJapan ORChinaThe United
States Total
Q26 Today, which ONE of the following do you think is the world's leading economic power?
Spring, 2009
Spring, 2008
Spring, 2011
Spring, 2010
Spring, 2011
Spring, 2010
Spring, 2009
Spring, 2008
Spring, 2011
Spring, 2010
Spring, 2009
Pakistan
Brazil
Mexico
Kenya
100710761366
100600672061
100900272062
100810781759
1001020881655
100620892253
100720561565
10013105131851
1001402591653
1002410141852
1002430022644
DK/RefusedNeither (DONOT READ)Bad thingGood thing NTotal
Q27US ASK IF UNITED STATES IN Q26 (Q26=1): Do you think this a
good thing or a bad thing?
Spring, 2011
Spring, 2011
Spring, 2011
Spring, 2011
Spring, 2011
Spring, 2011
Spring, 2011
Spring, 2011
Spring, 2011
Spring, 2011
Spring, 2011
Spring, 2011
Spring, 2011
Spring, 2011
Spring, 2011
Spring, 2011
Spring, 2011
Spring, 2011
Late Spring, 2011
Spring, 2011
Spring, 2011
Spring, 2011
Spring, 2011
United States
Britain
France
Germany
Spain
Lithuania
Poland
Russia
Ukraine
Turkey
Jordan
Lebanon
Palest. ter.
Israel
China
India
Indonesia
Japan
Pakistan
Brazil
Mexico
Kenya 619100061084
518100943453
435100323461
994100767215
581100677413
3941002111968
422100592759
1851100752861
158310011184129
4271005121073
455100126532
3011004153052
3371001213939
680100123779
4021008351740
40110011352925
3321001513964
441100435556
3661006113547
220100664346
422100103564
3241007104241
41010032689
119

8/3/2019 Pew Global Attitudes Balance of Power U.S. Image Report FINAL July 13 2011
http://slidepdf.com/reader/full/pew-global-attitudes-balance-of-power-us-image-report-final-july-13-2011 122/160
DK/RefusedNeither (DONOT READ)Bad thingGood thing NTotal
Q27CHI ASK IF CHINA IN Q26 (Q26=2): Do you think this a good thing or
a bad thing?
Spring, 2011
Spring, 2011
Spring, 2011
Spring, 2011
Spring, 2011Spring, 2011
Spring, 2011
Spring, 2011
Spring, 2011
Spring, 2011
Spring, 2011
Spring, 2011
Spring, 2011
Spring, 2011
Spring, 2011
Spring, 2011Spring, 2011
Spring, 2011
Late Spring, 2011
Spring, 2011
Spring, 2011
Spring, 2011
Spring, 2011
United States
Britain
France
Germany
SpainLithuania
Poland
Russia
Ukraine
Turkey
Jordan
Lebanon
Palest. ter.
Israel
China
IndiaIndonesia
Japan
Pakistan
Brazil
Mexico
Kenya 20410003789
117100234055
142100562565
50310012492
36110012196
2251005105926
259100332272610100394839
83710023392
3401005173938
229100122275
3871003121670
4361003142854
129100646327
2181007292242
25910012262438
2371008144830
1351005342140485100795429
491100656326
474100026731
48410011134333
425100338510
120

8/3/2019 Pew Global Attitudes Balance of Power U.S. Image Report FINAL July 13 2011
http://slidepdf.com/reader/full/pew-global-attitudes-balance-of-power-us-image-report-final-july-13-2011 123/160
DK/RefusedWill never
replace U.S.Has already
replaced U.S.Will eventually
replace U.S. Total
Q28 Which comes closest to your view - China will eventually replacethe U.S. as the world's leading superpower; China has already replacedthe U.S. as the world's leading superpower; or China will never replace
the U.S. as the world's leading superpower?
Spring, 2011
Spring, 2009
Spring, 2008
Spring, 2011
Spring, 2009
Spring, 2008
Spring, 2011
Spring, 2009
Spring, 2008
Spring, 2011
Spring, 2009
Spring, 2008
Spring, 2011
Spring, 2009
Spring, 2008Spring, 2011
Spring, 2011
Spring, 2009
Spring, 2008
Spring, 2011
Spring, 2009
Spring, 2008
Spring, 2011
Spring, 2011
Spring, 2009
Spring, 2008Spring, 2011
Spring, 2009
Spring, 2008
Spring, 2011
Spring, 2009
Spring, 2008
Spring, 2011
Spring, 2009
Spring, 2011
Spring, 2009
Spring, 2011
Spring, 2009
Spring, 2008
Spring, 2011
Spring, 2011
Spring, 2009
Spring, 2008
Spring, 2011
Spring, 2009
Spring, 2008
Late Spring, 2011
United States
Britain
France
Germany
Spain
Lithuania
Poland
Russia
Ukraine
Turkey
Jordan
Lebanon
Palest. ter.
Israel
China
India
Indonesia
Japan
Pakistan 10033101047
100267823
1006591025
1003601225
1001855522
1001951724
1002146825
10050171319
1001923553
1001420859
1002017657
1009561223
1009441532
1009411238
1008381737
10017561017
10010541422
1007541524
1009521524
10010561321
10084517301002838628
1003437722
10023411521
10027361423
1001945828
10023361031
10025301530
10015461226
10020441224
10022312126
10020401129
100835552
100844840
1003301453
100435952
100841942
1005341150
1000341551
1001431144
1000282349
100936748
1001141643
1008261154
1001054531
1001057726
1009451234
121

8/3/2019 Pew Global Attitudes Balance of Power U.S. Image Report FINAL July 13 2011
http://slidepdf.com/reader/full/pew-global-attitudes-balance-of-power-us-image-report-final-july-13-2011 124/160
DK/RefusedWill never
replace U.S.Has already
replaced U.S.Will eventually
replace U.S. Total
Q28 Which comes closest to your view - China will eventually replacethe U.S. as the world's leading superpower; China has already replacedthe U.S. as the world's leading superpower; or China will never replace
the U.S. as the world's leading superpower?
Spring, 2011
Spring, 2009
Spring, 2008
Spring, 2011
Spring, 2011
Spring, 2009
Spring, 2008
Spring, 2011
Spring, 2009
Pakistan
Brazil
Mexico
Kenya
1001347733
1001243737
10014352229
10020331730
10016311934
10016471027
10035201134
10041191030
100337951
122
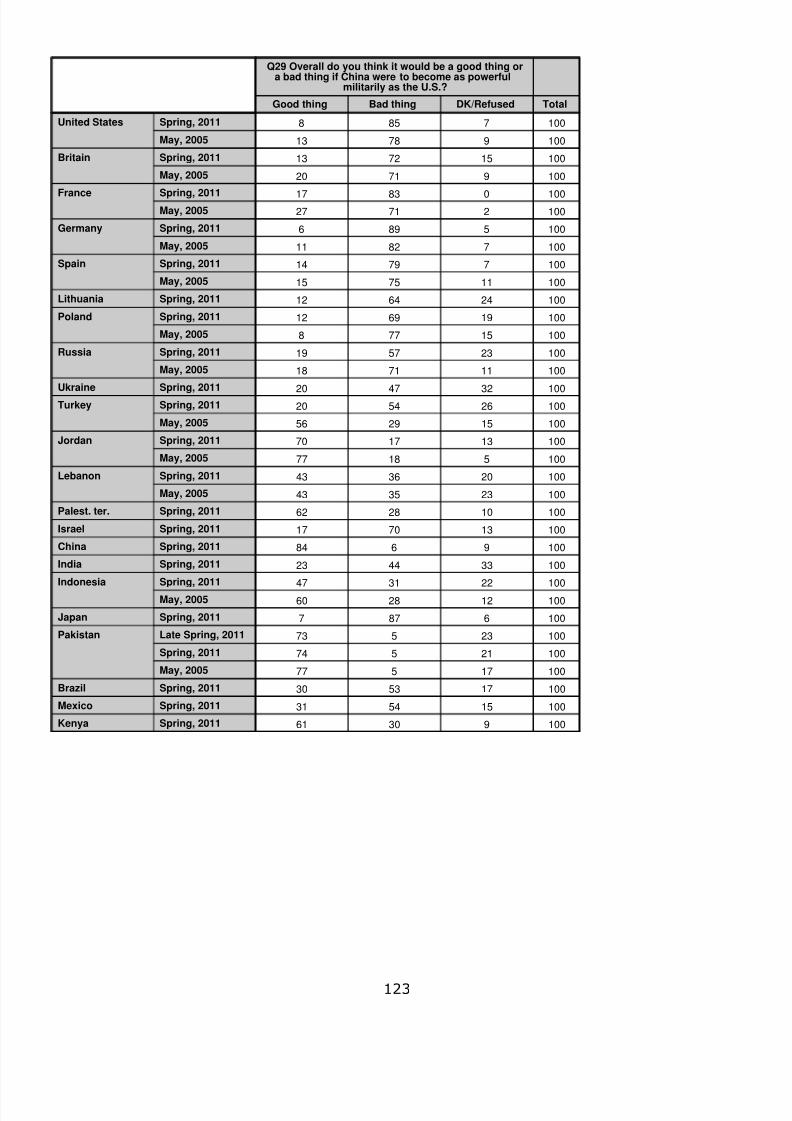
8/3/2019 Pew Global Attitudes Balance of Power U.S. Image Report FINAL July 13 2011
http://slidepdf.com/reader/full/pew-global-attitudes-balance-of-power-us-image-report-final-july-13-2011 125/160
DK/RefusedBad thingGood thing Total
Q29 Overall do you think it would be a good thing ora bad thing if China were to become as powerful
militarily as the U.S.?
Spring, 2011
May, 2005
Spring, 2011
May, 2005
Spring, 2011May, 2005
Spring, 2011
May, 2005
Spring, 2011
May, 2005
Spring, 2011
Spring, 2011
May, 2005
Spring, 2011
May, 2005
Spring, 2011Spring, 2011
May, 2005
Spring, 2011
May, 2005
Spring, 2011
May, 2005
Spring, 2011
Spring, 2011
Spring, 2011
Spring, 2011
Spring, 2011
May, 2005
Spring, 2011
Late Spring, 2011
Spring, 2011
May, 2005
Spring, 2011
Spring, 2011
Spring, 2011
United States
Britain
France
Germany
Spain
Lithuania
Poland
Russia
UkraineTurkey
Jordan
Lebanon
Palest. ter.
Israel
China
India
Indonesia
Japan
Pakistan
Brazil
Mexico
Kenya 10093061
100155431
100175330
10017577
10021574
10023573
1006877
100122860
100223147
100334423
1009684
100137017
100102862
100233543
100203643
10051877
100131770
100152956
100265420100324720
100117118
100235719
10015778
100196912
100246412
100117515
10077914
10078211
1005896
1002712710008317
10097120
100157213
10097813
1007858
123

8/3/2019 Pew Global Attitudes Balance of Power U.S. Image Report FINAL July 13 2011
http://slidepdf.com/reader/full/pew-global-attitudes-balance-of-power-us-image-report-final-july-13-2011 126/160
DK/RefusedAbout rightNot enoughToo much Total
Q30 Does our government cooperate too much, not enough or about the
right amount with the United States government?
Spring, 2011
Spring, 2011
Spring, 2011
Spring, 2011
Spring, 2011
Spring, 2011
Spring, 2011
Spring, 2011
Spring, 2011
Spring, 2011
Spring, 2011
Spring, 2011
Spring, 2011
Spring, 2011
Spring, 2011
Spring, 2011
Spring, 2011
Late Spring, 2011
Spring, 2011
Spring, 2011
Spring, 2011
Spring, 2011
Britain
France
Germany
Spain
Lithuania
Poland
Russia
Ukraine
Turkey
Egypt
Jordan
Lebanon
Israel
China
India
Indonesia
Japan
Pakistan
Brazil
Mexico
Kenya 1004214430
1003272544
10012402523
10023101354
10021161152
1004531132
1009541819
10038142622
10026362811
1005412331
1003251854
1006221657
1006312439
10015322626
1002235359
10016452317
1001334459
1001242387
1003592315
1002721116
1000651619
1005401045
Due to an administrative error, results for the Palestinian territories are not shown.
124

8/3/2019 Pew Global Attitudes Balance of Power U.S. Image Report FINAL July 13 2011
http://slidepdf.com/reader/full/pew-global-attitudes-balance-of-power-us-image-report-final-july-13-2011 127/160
DK/RefusedNo confidence
at allNot too much
confidenceSome
confidenceA lot of
confidence Total
Q48a For each, tell me how much confidence you have in each leader to do the right thingregarding world affairs - a lot of confidence, some confidence, not too much confidence, or
no confidence at all: a. U.S. President Barack Obama
Spring, 2011
Spring, 2010
Spring, 2009
Spring, 2011
Spring, 2010
Spring, 2009
Spring, 2011
Spring, 2010
Spring, 2009
Spring, 2011
Spring, 2010
Spring, 2009
Spring, 2011
Spring, 2010
Spring, 2009
Spring, 2011
Spring, 2011
Spring, 2010
Spring, 2009
Spring, 2011
Spring, 2010
Spring, 2009
Spring, 2011
Spring, 2011
Spring, 2010
Spring, 2009
Spring, 2011
Spring, 2010
Spring, 2009
Spring, 2011
Spring, 2010
Spring, 2009
Spring, 2011
Spring, 2010
Spring, 2009
Spring, 2011
Spring, 2009
Spring, 2011
Spring, 2009
Spring, 2011
Spring, 2010
Spring, 2009
Spring, 2011
Spring, 2011
Spring, 2010
Spring, 2009
Spring, 2011
Spring, 2010
Spring, 2009
United States
Britain
France
Germany
Spain
Lithuania
Poland
Russia
Ukraine
Turkey
Egypt
Jordan
Lebanon
Palest. ter.
Israel
China
India
Indonesia
Japan
1006185629
10052176115
10061126714
10072205714
10045245611
10048274814
10040472325
100153204913
10019525448
10023924368
100116273620
100017343910
10025718212
10024440131
100518323115
100020362716
100125322617
100113424247
100103628224
10034028244
100112918357
10093425294
10003826287
100154210285
100124916203
100155617111
100211230298
10023931307
10022928329
1001614292615
10017516557
100126215010
10015626484
1009518599
10057155517
10027225316
10017255611
1002233756
1000364446
1001395137
1000355734
1000596225
10005106123
1004554343
1004674836
10038144728
100211132648
100120143134
100119193229
125

8/3/2019 Pew Global Attitudes Balance of Power U.S. Image Report FINAL July 13 2011
http://slidepdf.com/reader/full/pew-global-attitudes-balance-of-power-us-image-report-final-july-13-2011 128/160
DK/RefusedNo confidence
at allNot too much
confidenceSome
confidenceA lot of
confidence Total
Q48a For each, tell me how much confidence you have in each leader to do the right thingregarding world affairs - a lot of confidence, some confidence, not too much confidence, or
no confidence at all: a. U.S. President Barack Obama
Late Spring, 2011
Spring, 2011
Spring, 2010
Spring, 2009
Spring, 2011
Spring, 2010
Spring, 2011
Spring, 2010
Spring, 2009
Spring, 2011
Spring, 2010
Spring, 2009
Pakistan
Brazil
Mexico
Kenya
1002141678
1001131778
1004462462
100119244015
1001420233211
10081836317
1001119154016
100617144122
10036447112
1003251971
1002557891
1002463562
126

8/3/2019 Pew Global Attitudes Balance of Power U.S. Image Report FINAL July 13 2011
http://slidepdf.com/reader/full/pew-global-attitudes-balance-of-power-us-image-report-final-july-13-2011 129/160
DK/RefusedNo confidence
at allNot too much
confidenceSome
confidenceA lot of
confidence Total
Q48b For each, tell me how much confidence you have in each leader to do the right thingregarding world affairs - a lot of confidence, some confidence, not too much confidence, or
no confidence at all: b. Russian President Dmitri Medvedev
Spring, 2011
Spring, 2010
Spring, 2009
Spring, 2011
Spring, 2010
Spring, 2009
Spring, 2011
Spring, 2010
Spring, 2009
Spring, 2011
Spring, 2010
Spring, 2009
Spring, 2011
Spring, 2010
Spring, 2009
Spring, 2011
Spring, 2011
Spring, 2010
Spring, 2009
Spring, 2011
Spring, 2010
Spring, 2009
Spring, 2011
Spring, 2011
Spring, 2010
Spring, 2009
Spring, 2011
Spring, 2010
Spring, 2009
Spring, 2011
Spring, 2010
Spring, 2009
Spring, 2011
Spring, 2009
Spring, 2011
Spring, 2009
Spring, 2011
Spring, 2010
Spring, 2009
Spring, 2011
Spring, 2011
Spring, 2010
Spring, 2009
Late Spring, 2011
Spring, 2011
Spring, 2010
Spring, 2009
Spring, 2011
Spring, 2010
United States
Britain
France
Germany
Spain
Lithuania
Poland
Russia
Ukraine
Turkey
Jordan
Lebanon
Palest. ter.
Israel
China
India
Indonesia
Pakistan
Brazil
100312823161
100273324143
1006035310
1005934620
1005436740
1005039651
10049822202
10035929251
100321331213
10061510187
10021429397
10024528367
10029724337
10043143185
10042742234
100125121151
10033144211
10091840313
10061738336
10042236317
100144132112
10012354751
1009334395
10030511352
10023521771
10020532161
100156213721
10064144927
10074153836
10066184030
100153237152
100121636315
100122044222
100111339344
10021353581
100212539132
100102350161
10062439293
10031433428
10021837366
10023941161
10013138273
10003039293
100242227252
100201727333
100211727323
100252224273
100261520353
100212027292
127

8/3/2019 Pew Global Attitudes Balance of Power U.S. Image Report FINAL July 13 2011
http://slidepdf.com/reader/full/pew-global-attitudes-balance-of-power-us-image-report-final-july-13-2011 130/160
DK/RefusedNo confidence
at allNot too much
confidenceSome
confidenceA lot of
confidence Total
Q48b For each, tell me how much confidence you have in each leader to do the right thingregarding world affairs - a lot of confidence, some confidence, not too much confidence, or
no confidence at all: b. Russian President Dmitri Medvedev
Spring, 2011
Spring, 2010
Spring, 2009
Spring, 2011
Spring, 2010
Spring, 2009
Mexico
Kenya
1003410202511
1002112223015
1002613213011
100501421123
10052201692
100352624141
DK/RefusedNo confidence
at allNot too much
confidenceSome
confidenceA lot of
confidence Total
Q48c For each, tell me how much confidence you have in each leader to do the right thingregarding world affairs - a lot of confidence, some confidence, not too much confidence, or
no confidence at all: c. Russian Prime Minister Vladimir Putin
Spring, 2011
Spring, 2010
Spring, 2009
Russia
10043114239
10074123245
10065143936
DK/RefusedNo confidence
at allNot too much
confidenceSome
confidenceA lot of
confidence Total
Q48d For each, tell me how much confidence you have in each leader to do the right thing
regarding world affairs - a lot of confidence, some confidence, not too much confidence, orno confidence at all: d. German Chancellor Angela Merkel
Spring, 2011
Spring, 2010
Spring, 2009
Spring, 2008
Spring, 2007
Spring, 2006
Spring, 2011
Spring, 2010
Spring, 2009
Spring, 2008
Spring, 2007
Spring, 2006
Spring, 2011
Spring, 2010
Spring, 2009
Spring, 2008
Spring, 2007
Spring, 2006
Spring, 2011
Spring, 2010
Spring, 2009
Spring, 2008
Spring, 2007
Spring, 2006
Spring, 2011
Spring, 2010
Spring, 2009
Spring, 2008
Spring, 2007
Spring, 2006
United States
Britain
France
Germany
Spain
100251919325
100261424315
100171122438
100141423427
1001111214512
10037215118
10019134334
1001694243
10008164135
10019144431
10009184032
100010214326
10017126812
1001576621
1001696321
10008146116
10008116120
10008135723
100231115456
100225114814
10027911476100231016447
100209124911
100178124717
100381014335
10035911386
100411010345
100291014416
100351012376
100291015397
128

8/3/2019 Pew Global Attitudes Balance of Power U.S. Image Report FINAL July 13 2011
http://slidepdf.com/reader/full/pew-global-attitudes-balance-of-power-us-image-report-final-july-13-2011 131/160
DK/RefusedNo confidence
at allNot too much
confidenceSome
confidenceA lot of
confidence Total
Q48d For each, tell me how much confidence you have in each leader to do the right thingregarding world affairs - a lot of confidence, some confidence, not too much confidence, or
no confidence at all: d. German Chancellor Angela Merkel
Spring, 2011
Spring, 2011
Spring, 2010
Spring, 2009
Spring, 2008
Spring, 2007
Spring, 2011
Spring, 2010
Spring, 2009
Spring, 2008
Spring, 2007
Spring, 2006
Spring, 2011
Spring, 2007
Spring, 2011
Spring, 2010
Spring, 2009
Spring, 2008
Spring, 2007
Spring, 2006
Spring, 2011
Spring, 2010
Spring, 2009
Spring, 2008
Spring, 2007
Spring, 2011
Spring, 2010
Spring, 2009
Spring, 2008
Spring, 2007
Spring, 2011
Spring, 2009
Spring, 2007
Spring, 2011
Spring, 2009
Spring, 2007
Spring, 2011
Spring, 2010
Spring, 2009
Spring, 2008
Spring, 2007
Spring, 2011
Spring, 2011
Spring, 2010
Spring, 2009
Spring, 2008
Spring, 2007
Late Spring, 2011
Spring, 2011
Lithuania
Poland
Russia
Ukraine
Turkey
Jordan
Lebanon
Palest. ter.
Israel
China
India
Indonesia
Pakistan
1006626521
1005929751
10040724291
10052820181
10055617202
100391025242
10041828221
10066813103
10031830283
100401023242
10025632315
10028626337
100331125255
100143328195
100518303612
100517204314
10017502192
100165320101
10043041232
100830212911
100628322212
10053430265
10083229256
10043525278
100222329233
100212732182
100183930131
100163628191
100103433185
10025586101
10027511291
1002560860
10027561061
10025511860
10018601740
10032522338
100304163415
10037518319
100316193212
100248203514
10034520337
100354183111
100286193116
100161428375
100141031414
100141631354
10012723499
10013927465
10013320568
129

8/3/2019 Pew Global Attitudes Balance of Power U.S. Image Report FINAL July 13 2011
http://slidepdf.com/reader/full/pew-global-attitudes-balance-of-power-us-image-report-final-july-13-2011 132/160
DK/RefusedNo confidence
at allNot too much
confidenceSome
confidenceA lot of
confidence Total
Q48d For each, tell me how much confidence you have in each leader to do the right thingregarding world affairs - a lot of confidence, some confidence, not too much confidence, or
no confidence at all: d. German Chancellor Angela Merkel
Spring, 2010
Spring, 2009
Spring, 2008
Spring, 2007
Spring, 2011
Spring, 2010
Spring, 2011
Spring, 2010
Spring, 2009
Spring, 2008
Spring, 2007
Spring, 2011
Spring, 2010
Spring, 2009
Spring, 2007
Pakistan
Brazil
Mexico
Kenya
100168233915
100369192214
1002112202819
1002612222615
100362221175
10046241893
100541319103
100531916103
100412222142
100332320213
100272921203
10046351252
1005931641
1006628420
1006526621
130

8/3/2019 Pew Global Attitudes Balance of Power U.S. Image Report FINAL July 13 2011
http://slidepdf.com/reader/full/pew-global-attitudes-balance-of-power-us-image-report-final-july-13-2011 133/160
DK/RefusedNo confidence
at allNot too much
confidenceSome
confidenceA lot of
confidence Total
Q48f For each, tell me how much confidence you have in each leader to do the right thingregarding world affairs - a lot of confidence, some confidence, not too much confidence, or
no confidence at all: f. Iranian President Mahmoud Ahmadinejad
Spring, 2011
Spring, 2010
Spring, 2009
Spring, 2008
Spring, 2007
Spring, 2006
Spring, 2011
Spring, 2010
Spring, 2009
Spring, 2008
Spring, 2007
Spring, 2006
Spring, 2011
Spring, 2010
Spring, 2009
Spring, 2008
Spring, 2007
Spring, 2006
Spring, 2011
Spring, 2010
Spring, 2009
Spring, 2008
Spring, 2007
Spring, 2011
Spring, 2009
Spring, 2007
Spring, 2011
Spring, 2009
Spring, 2007
Spring, 2011
Spring, 2010
Spring, 2009
Spring, 2008
Spring, 2007
Spring, 2006
Late Spring, 2011
Spring, 2011
Spring, 2010
Spring, 2009
Spring, 2008
Spring, 2007
Spring, 2006
Turkey
Egypt
Jordan
Lebanon
Palest. ter.
Israel
Indonesia
Pakistan
100431781715
100371472021
100431041924
100461252116
100451652411
100411052618
100441062317
10029419399
10026519456
10040519324
10032520385
10022622455
10024721417
100680843
1003771721
1002841120
1001426143611
100433183015
10021839355
100259101416
10026251517
10006171022
100153101521
10015491025
10092743184
10043642171
10043437204
10003632248
10012937239
10033738176
10072542215
10083537191
10073836174
10014034224
10013537253
10014436153
10026418196
100244214165
10020528147
10024509134
100224713135
100184318165
131
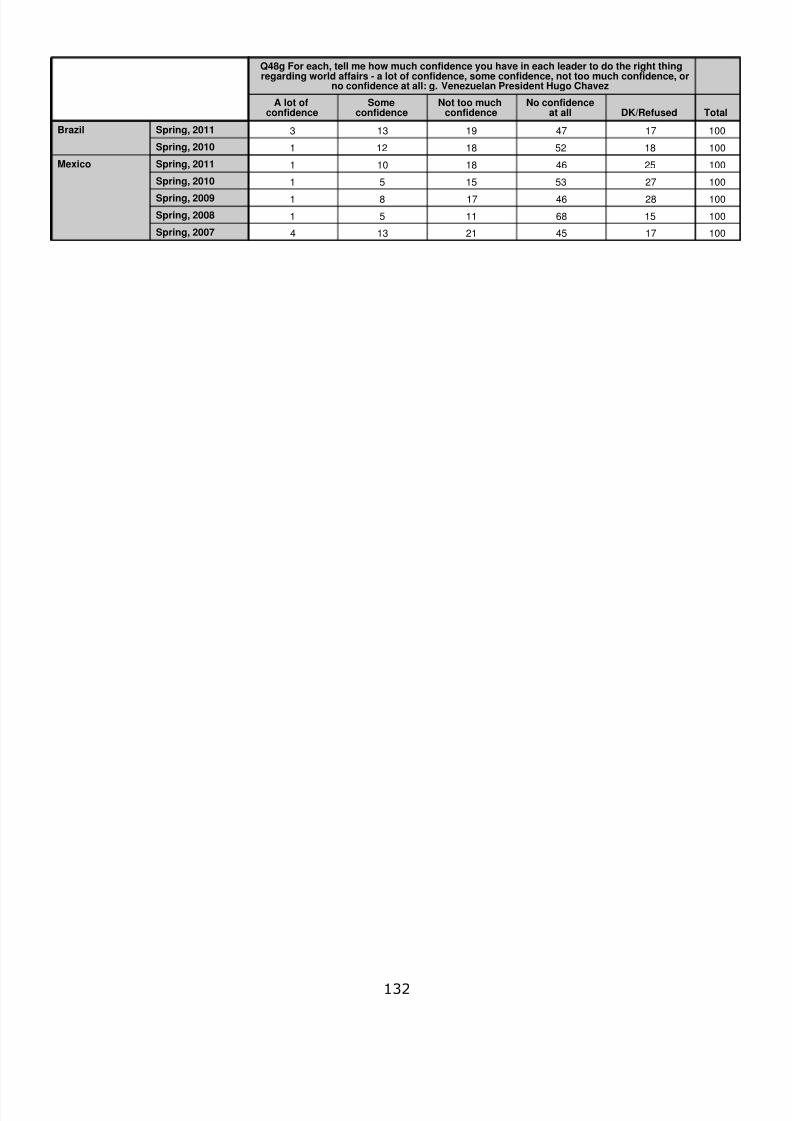
8/3/2019 Pew Global Attitudes Balance of Power U.S. Image Report FINAL July 13 2011
http://slidepdf.com/reader/full/pew-global-attitudes-balance-of-power-us-image-report-final-july-13-2011 134/160
DK/RefusedNo confidence
at allNot too much
confidenceSome
confidenceA lot of
confidence Total
Q48g For each, tell me how much confidence you have in each leader to do the right thingregarding world affairs - a lot of confidence, some confidence, not too much confidence, or
no confidence at all: g. Venezuelan President Hugo Chavez
Spring, 2011
Spring, 2010
Spring, 2011
Spring, 2010
Spring, 2009
Spring, 2008
Spring, 2007
Brazil
Mexico
100174521134
10015681151
10028461781
10027531551
100254618101
100185218121
100174719133
132
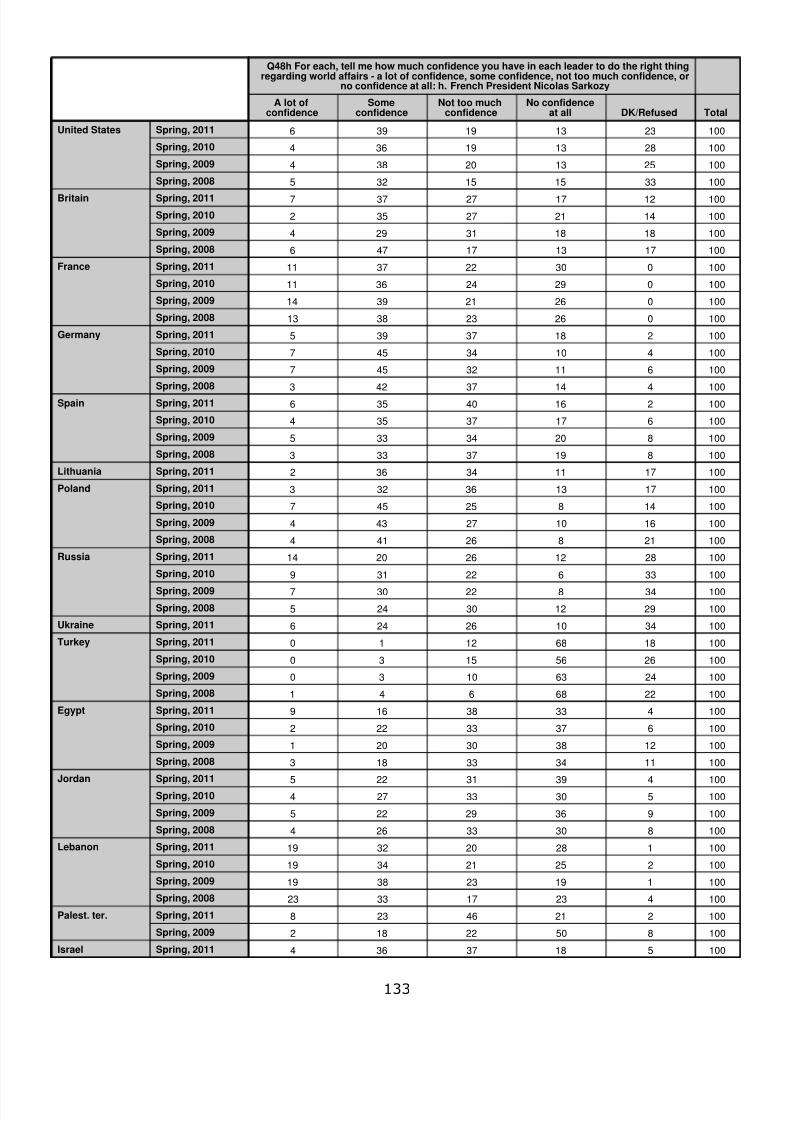
8/3/2019 Pew Global Attitudes Balance of Power U.S. Image Report FINAL July 13 2011
http://slidepdf.com/reader/full/pew-global-attitudes-balance-of-power-us-image-report-final-july-13-2011 135/160
DK/RefusedNo confidence
at allNot too much
confidenceSome
confidenceA lot of
confidence Total
Q48h For each, tell me how much confidence you have in each leader to do the right thingregarding world affairs - a lot of confidence, some confidence, not too much confidence, or
no confidence at all: h. French President Nicolas Sarkozy
Spring, 2011
Spring, 2010
Spring, 2009
Spring, 2008
Spring, 2011
Spring, 2010
Spring, 2009
Spring, 2008
Spring, 2011
Spring, 2010
Spring, 2009
Spring, 2008
Spring, 2011
Spring, 2010
Spring, 2009
Spring, 2008
Spring, 2011
Spring, 2010
Spring, 2009
Spring, 2008
Spring, 2011
Spring, 2011
Spring, 2010
Spring, 2009
Spring, 2008
Spring, 2011
Spring, 2010
Spring, 2009
Spring, 2008
Spring, 2011
Spring, 2011
Spring, 2010
Spring, 2009
Spring, 2008
Spring, 2011
Spring, 2010
Spring, 2009
Spring, 2008
Spring, 2011
Spring, 2010
Spring, 2009
Spring, 2008
Spring, 2011
Spring, 2010
Spring, 2009
Spring, 2008
Spring, 2011
Spring, 2009
Spring, 2011
United States
Britain
France
Germany
Spain
Lithuania
Poland
Russia
Ukraine
Turkey
Egypt
Jordan
Lebanon
Palest. ter.
Israel 10051837364
10085022182
10022146238
100423173323
100119233819
100225213419
100128203219
10083033264
10093629225
10053033274
10043931225
100113433183
100123830201
10063733222
10043338169
1002268641
10024631030
10026561530
10018681210
100341026246
100291230245
10034822307
10033622319
1002812262014
10021826414
100161027434
10014825457
100171336323
100171134362
10081937333
10082034335
10061737354
10021640356
10041437423
10061132457
10041034457
10021837395
100026233813
100026213914
100029243611
100030223711
100171317476
100181831294
100142127352
100121727377
100331515325
100251320384
100281319364
100231319396
133

8/3/2019 Pew Global Attitudes Balance of Power U.S. Image Report FINAL July 13 2011
http://slidepdf.com/reader/full/pew-global-attitudes-balance-of-power-us-image-report-final-july-13-2011 136/160
DK/RefusedNo confidence
at allNot too much
confidenceSome
confidenceA lot of
confidence Total
Q48h For each, tell me how much confidence you have in each leader to do the right thingregarding world affairs - a lot of confidence, some confidence, not too much confidence, or
no confidence at all: h. French President Nicolas Sarkozy
Spring, 2009
Spring, 2011
Spring, 2010
Spring, 2009
Spring, 2008
Spring, 2011
Spring, 2011
Spring, 2010
Spring, 2009
Spring, 2008
Spring, 2011
Spring, 2010
Spring, 2009
Spring, 2008
Late Spring, 2011
Spring, 2011
Spring, 2010
Spring, 2009
Spring, 2008
Spring, 2011
Spring, 2010
Spring, 2011
Spring, 2010
Spring, 2009
Spring, 2008
Spring, 2011
Spring, 2010
Spring, 2009
Israel
China
India
Indonesia
Japan
Pakistan
Brazil
Mexico
Kenya
1003611152216
1002112192918
1002614202515
100432619111
100521418143
100491818113
100422620111
100252420274
100233421184
1006426541
1006625530
1006524730
1006527520
1006323841
100171040312
10021935304
10021834352
10014433453
10057819141
10054617212
100361025281
100391128202
10065711134
100441022213
100241031314
10028927306
100321427215
10032432339
134

8/3/2019 Pew Global Attitudes Balance of Power U.S. Image Report FINAL July 13 2011
http://slidepdf.com/reader/full/pew-global-attitudes-balance-of-power-us-image-report-final-july-13-2011 137/160
DK/RefusedNo confidence
at allNot too much
confidenceSome
confidenceA lot of
confidence Total
Q48j For each, tell me how much confidence you have in each leader to do the right thingregarding world affairs - a lot of confidence, some confidence, not too much confidence, or
no confidence at all: j. Israeli Prime Minister Benjamin Netanyahu
Spring, 2011
Spring, 2009
Spring, 2011
Spring, 2009
Spring, 2011
Spring, 2009
Spring, 2011
Spring, 2009
Spring, 2011
Spring, 2009
Spring, 2011
Spring, 2009
Spring, 2011
Spring, 2009
Late Spring, 2011
Spring, 2011
Spring, 2009
Turkey
Egypt
Jordan
Lebanon
Palest. ter.
Israel
Indonesia
Pakistan
1005937310
1005735620
1005737510
100333122131
100263625111
100120243916
100112244914
100194320
10026810127
100195301
100097200
100091431
100089542
100084962
100191521
1002268810
10018721010
135

8/3/2019 Pew Global Attitudes Balance of Power U.S. Image Report FINAL July 13 2011
http://slidepdf.com/reader/full/pew-global-attitudes-balance-of-power-us-image-report-final-july-13-2011 138/160
DK/RefusedNo confidence
at allNot too much
confidenceSome
confidenceA lot of
confidence Total
Q48k For each, tell me how much confidence you have in each leader to do the right thingregarding world affairs - a lot of confidence, some confidence, not too much confidence, or
no confidence at all: k. Palestinian President Mahmoud Abbas
Spring, 2011
Spring, 2010
Spring, 2009
Spring, 2007
Spring, 2011
Spring, 2010
Spring, 2009
Spring, 2007
Spring, 2011
Spring, 2010
Spring, 2009
Spring, 2007
Spring, 2011
Spring, 2010
Spring, 2009
Spring, 2007
Spring, 2011
Spring, 2009
Spring, 2007
Spring, 2011
Spring, 2009
Spring, 2007
Spring, 2011
Spring, 2010
Spring, 2009
Spring, 2007
Late Spring, 2011
Spring, 2011
Spring, 2010
Spring, 2009
Spring, 2007
Turkey
Egypt
Jordan
Lebanon
Palest. ter.
Israel
Indonesia
Pakistan
100451172115
10059117168
10057165185
100541261711
10057135169
10030512494
10039318354
10023620447
10028617417
1005671972
1002623231
1001543861
100325173422
100131163319
100210244124
100103825252
10043436225
10033736195
10024136174
100212323419
100136301815
100132282614
100227272915
10037233631
100041272211
100326362412
100130352112
100353612144
100275110112
100314315101
100214318126
136

8/3/2019 Pew Global Attitudes Balance of Power U.S. Image Report FINAL July 13 2011
http://slidepdf.com/reader/full/pew-global-attitudes-balance-of-power-us-image-report-final-july-13-2011 139/160
DK/RefusedNo confidence
at allNot too much
confidenceSome
confidenceA lot of
confidence Total
Q48l For each, tell me how much confidence you have in each leader to do the right thingregarding world affairs - a lot of confidence, some confidence, not too much confidence, or
no confidence at all: l. Saudi King Abdullah
Spring, 2011
Spring, 2010
Spring, 2009
Spring, 2007
May, 2003
Spring, 2011
Spring, 2010
Spring, 2009
Spring, 2007
Spring, 2011
Spring, 2010
Spring, 2009
Spring, 2007
May, 2003
Spring, 2011
Spring, 2010
Spring, 2009
Spring, 2007
May, 2003
Spring, 2011
Spring, 2009
Spring, 2007
May, 2003
Spring, 2011
Spring, 2009
Spring, 2007
May, 2003
Spring, 2011
Spring, 2010
Spring, 2009
May, 2003
Late Spring, 2011
Spring, 2011
Spring, 2010
Spring, 2009
Spring, 2007
May, 2003
Turkey
Egypt
Jordan
Lebanon
Palest. ter.
Israel
Indonesia
Pakistan
10024973426
10023531852
10029432341
10030622636
10021412054
10023322349
100113215015
100232134813
100143105617
100176144815
100134315226
10085525102
1004602583
1002573361
10034530203
100531123913
10024021317
10019285111
10063029278
10019114237
100130143124
100235162918
100135192618
100221363210
1002994932
1000363260
1001793153
1001584443
1002554543
1000894340
10023214133
10028124236
100244411174
100353810134
1002856971
10030471471
100204719103
In 2003, asked about 'Saudi Crown Prince and Prime Minister Abdullah'
137

8/3/2019 Pew Global Attitudes Balance of Power U.S. Image Report FINAL July 13 2011
http://slidepdf.com/reader/full/pew-global-attitudes-balance-of-power-us-image-report-final-july-13-2011 140/160
DK/RefusedNo confidence
at allNot too much
confidenceSome
confidenceA lot of
confidence Total
Q48n For each, tell me how much confidence you have in each leader to do the right thingregarding world affairs - a lot of confidence, some confidence, not too much confidence, or
no confidence at all: n. Chinese President Hu Jintao
Spring, 2011
Spring, 2011
Spring, 2011
Spring, 2007
Spring, 2006
Spring, 2011
Spring, 2007
Spring, 2006
Late Spring, 2011
Spring, 2011
Spring, 2007
China
India
Indonesia
Japan
Pakistan
10038831735
10030532340
10032632436
10041853251
100201641221
10082344241
10030825325
10029623402
10031822335
100621610103
1007164244
DK/RefusedNo confidence
at allNot too much
confidenceSome
confidenceA lot of
confidence Total
Q48o For each, tell me how much confidence you have in each leader to do the right thingregarding world affairs - a lot of confidence, some confidence, not too much confidence, or
no confidence at all: o. Indian Prime Minister Manmohan Singh
Spring, 2011
Spring, 2011
Spring, 2011
Spring, 2011
Late Spring, 2011
Spring, 2011
China
India
Indonesia
Japan
Pakistan
10021591261
10025551461
10039321352
10037723303
10012262456
100341428222
138

8/3/2019 Pew Global Attitudes Balance of Power U.S. Image Report FINAL July 13 2011
http://slidepdf.com/reader/full/pew-global-attitudes-balance-of-power-us-image-report-final-july-13-2011 141/160
DK/RefusedNot at allNot too muchFair amountGreat deal Total
Q51 In making international policy decisions, to what extent do you think the United Statestakes into account the interests of countries like (survey country) - a great deal, a fair
amount, not too much, or not at all?
Spring, 2011
Spring, 2010
Spring, 2009
Spring, 2007
May, 2005
March, 2004
May, 2003
Summer, 2002
Spring, 2011
Spring, 2010
Spring, 2009
Spring, 2007
May, 2005
March, 2004
May, 2003
Summer, 2002
Spring, 2011
Spring, 2010
Spring, 2009
Spring, 2007
May, 2005
March, 2004
May, 2003
Summer, 2002
Spring, 2011
Spring, 2010
Spring, 2009
Spring, 2007
May, 2005
May, 2003
Spring, 2011
Spring, 2011
Spring, 2010
Spring, 2009
Spring, 2007
May, 2005
Summer, 2002
Spring, 2011
Spring, 2010
Spring, 2009
Spring, 2007
May, 2005
March, 2004
May, 2003
Summer, 2002
Spring, 2011
Spring, 2007
Summer, 2002
Spring, 2011
Spring, 2010
Britain
France
Germany
Spain
Lithuania
Poland
Russia
Ukraine
Turkey
1008582454
100114330125
10032444254
10082738217
10073740123
10092445183
10073338157
10073043155
10062647183
10083141154
10062341256
10091645255
100102344176
100122039254
100132846112
100102238292
10041942304
10031840317
10052240303
1009354781
10043440157
10044729127
10074431143
10033147145
10052749146
10012853136
10031034439
10022442293
10022247263
10031544353
10032249243
1003834495
1002942434
1001636515
10032650174
10004144131
10013351113
10003151162
10004049101
10001452313
10002051263
10001849302
100415373311
10011639377
10021843297
10022244248
10032945177
10021244358
10031844305
10021544337
139

8/3/2019 Pew Global Attitudes Balance of Power U.S. Image Report FINAL July 13 2011
http://slidepdf.com/reader/full/pew-global-attitudes-balance-of-power-us-image-report-final-july-13-2011 142/160
DK/RefusedNot at allNot too muchFair amountGreat deal Total
Q51 In making international policy decisions, to what extent do you think the United Statestakes into account the interests of countries like (survey country) - a great deal, a fair
amount, not too much, or not at all?
Spring, 2009
Spring, 2007
May, 2005
March, 2004
May, 2003
Summer, 2002
Spring, 2011
Spring, 2010
Spring, 2009
Spring, 2007
Spring, 2011
Spring, 2010
Spring, 2009
Spring, 2007
May, 2005
March, 2004
May, 2003
Summer, 2002
Spring, 2011
Spring, 2010
Spring, 2009
Spring, 2007
May, 2005
May, 2003
Summer, 2002
Spring, 2011
Spring, 2009
Spring, 2007
May, 2003
Spring, 2011
Spring, 2010
Spring, 2009
Spring, 2007
May, 2005
Spring, 2011
Spring, 2011
Spring, 2010
Spring, 2009
Spring, 2007
May, 2005
May, 2003
Summer, 2002
Spring, 2011
Spring, 2010
Spring, 2009
Spring, 2007
Summer, 2002
Late Spring, 2011
Spring, 2011
Spring, 2010
Turkey
Egypt
Jordan
Lebanon
Israel
China
India
Indonesia
Japan
Pakistan
100253917154
100224713126
100244412137
10051049323
1007949323
10041051342
10021254292
1004639474
1001010392912
10051753205
10064314613
10014933369
10087413410
10076373812
1008841367
10032293225
100910284012
1001111353410
10074275011
10063156016
100126254314
10015204825
10026185024
10019204426
100110224621
10035028164
10014536135
100830272213
10013332286
10014434183
10004733163
10014432167
10013635217
10013644163
10073938151
10014141125
10023243158
10014143124
10023834197
10023739185
100241331212
10054531128
10004540132
10023740165
100104727116
1005572863
1007443595
100114927103
10011561995
10014482396
140

8/3/2019 Pew Global Attitudes Balance of Power U.S. Image Report FINAL July 13 2011
http://slidepdf.com/reader/full/pew-global-attitudes-balance-of-power-us-image-report-final-july-13-2011 143/160
DK/RefusedNot at allNot too muchFair amountGreat deal Total
Q51 In making international policy decisions, to what extent do you think the United Statestakes into account the interests of countries like (survey country) - a great deal, a fair
amount, not too much, or not at all?
Spring, 2009
Spring, 2007
May, 2005
March, 2004
May, 2003
Summer, 2002
Spring, 2011
Spring, 2010
Spring, 2011
Spring, 2010
Spring, 2009
Spring, 2007
Summer, 2002
Spring, 2011
Spring, 2010
Spring, 2009
Spring, 2007
Summer, 2002
Pakistan
Brazil
Mexico
Kenya
100810283419
10058213928
10045173836
10042183738
10049143836
100627253012
100324253413
100417323216
10053132258
10032027409
100613244115
100717253516
10041279185
100154022194
100343216153
1002021202712
100253519165
100263815184
Due to an administrative error, results for the Palestinian territories are not shown.
DK/RefusedNot at allNot too muchFair amountGreat deal Total
Q51US In making international policy decisions, to what extent do you think the UnitedStates takes into account the interests of other countries around the world - a great deal, a
fair amount, not too much, or not at all?
Spring, 2011
Spring, 2010
Spring, 2009
Spring, 2007
May, 2005
March, 2004
May, 2003
Summer, 2002
United States
10053174431
10026194528
1003621363410037233928
10068273623
10034154831
10034184432
10023194135
141

8/3/2019 Pew Global Attitudes Balance of Power U.S. Image Report FINAL July 13 2011
http://slidepdf.com/reader/full/pew-global-attitudes-balance-of-power-us-image-report-final-july-13-2011 144/160
DK/Refused
I oppose theUS-led efforts
to fightterrorism
I favor the US-led efforts tofight terrorism Total
Q52 And which comes closer to describing yourview? I favor the U.S.-led efforts to fight terrorism,OR I oppose the U.S.-led efforts to fight terrorism.
Spring, 2011
Spring, 2010
Spring, 2009
Spring, 2007
Spring, 2006
May, 2005
March, 2004
Summer, 2002
Spring, 2011
Spring, 2010
Spring, 2009
Spring, 2007
Spring, 2006
May, 2005
March, 2004
May, 2003
Summer, 2002
Spring, 2011
Spring, 2010
Spring, 2009
Spring, 2007
Spring, 2006
May, 2005
March, 2004
May, 2003
Summer, 2002
Spring, 2011
Spring, 2010
Spring, 2009
Spring, 2007
Spring, 2006
May, 2005
March, 2004
May, 2003
Summer, 2002
Spring, 2011
Spring, 2010
Spring, 2009
Spring, 2007
Spring, 2006
May, 2005
May, 2003
United States
Britain
France
Germany
Spain
10053263
10076726
10057619
100126721
10063559
10063856
10043858
10052570
10053560
10024355
10054550
10035047
10075142
10072568
10043759
10033067
10022375
10013960
10034750
10014851
10015742
10005743
10012574
10013367
10002971
10082369
10073063
10073063
10094051
100104249
100134938
10082864
100113158
10093259
1003889
10061281
10061876
10081973
10072370
10041581
10061578
10051580
142

8/3/2019 Pew Global Attitudes Balance of Power U.S. Image Report FINAL July 13 2011
http://slidepdf.com/reader/full/pew-global-attitudes-balance-of-power-us-image-report-final-july-13-2011 145/160
DK/Refused
I oppose theUS-led efforts
to fightterrorism
I favor the US-led efforts to
fight terrorism Total
Q52 And which comes closer to describing yourview? I favor the U.S.-led efforts to fight terrorism,OR I oppose the U.S.-led efforts to fight terrorism.
Spring, 2011
Spring, 2011
Spring, 2010
Spring, 2009
Spring, 2007
May, 2005
Summer, 2002
Spring, 2011
Spring, 2010
Spring, 2009
Spring, 2007
Spring, 2006
May, 2005
March, 2004
May, 2003
Summer, 2002
Spring, 2011
Spring, 2007
Summer, 2002
Spring, 2011
Spring, 2010
Spring, 2009
Spring, 2007
Spring, 2006
May, 2005
March, 2004
May, 2003
Summer, 2002
Spring, 2011
Spring, 2010
Spring, 2009
Spring, 2007
Spring, 2006
Spring, 2011
Spring, 2010
Spring, 2009
Spring, 2007
Spring, 2006
May, 2005
March, 2004
May, 2003
Summer, 2002
Spring, 2011
Spring, 2010
Spring, 2009
Spring, 2007
Lithuania
Poland
Russia
Ukraine
Turkey
Egypt
Jordan
Lebanon
10046334
100115831
10046630
10056135
10028513
1001972
100107812
10018613
100107416
10067718
100117911
10078212
10011809
10088210
10076726
10077319
10097318
100116821
100125830
10077122
10075637
100127117
10097714
10012799
100215524
100225919
100196714
10021386
100153451
100162955
100111673
100212851
10072073
100113455
100133552
100173350
100212554
100151570
100182953
10091181
100102961
100123652
100102466
100102070
100122860
100152461
143

8/3/2019 Pew Global Attitudes Balance of Power U.S. Image Report FINAL July 13 2011
http://slidepdf.com/reader/full/pew-global-attitudes-balance-of-power-us-image-report-final-july-13-2011 146/160
DK/Refused
I oppose theUS-led efforts
to fightterrorism
I favor the US-led efforts to
fight terrorism Total
Q52 And which comes closer to describing yourview? I favor the U.S.-led efforts to fight terrorism,OR I oppose the U.S.-led efforts to fight terrorism.
May, 2005
May, 2003
Summer, 2002
Spring, 2011
Spring, 2009
Spring, 2007
May, 2003
Spring, 2011
Spring, 2010
Spring, 2009
Spring, 2007
Spring, 2006
Spring, 2011
Spring, 2011
Spring, 2010
Spring, 2009
Spring, 2007
Spring, 2006
May, 2005
May, 2003
Summer, 2002
Spring, 2011
Spring, 2010
Spring, 2009
Spring, 2007
Spring, 2006
Summer, 2002
Late Spring, 2011
Spring, 2011
Spring, 2010
Spring, 2009
Spring, 2007
Spring, 2006
May, 2005
March, 2004
May, 2003
Summer, 2002
Spring, 2011
Spring, 2010
Spring, 2011
Spring, 2010
Spring, 2009
Spring, 2007
Summer, 2002
Spring, 2011
Spring, 2010
Lebanon
Israel
China
India
Indonesia
Japan
Pakistan
Brazil
Mexico
Kenya
10062075
10061777
100113752
10086131
100152956
100124543
100134047
100102962
10073657
100354520
100107416
100256016
100275222
100195030
100285913
100205624
100255619
100216514
100226216
10073261
10027226
100134740
10095042
10075042
100114842
10056430
10057223
10084250
10045739
100125632
10083459
100102367
100123355
100282052
100186319
100205526
100133750
100194041
100176023
10021385
10061678
10061480
100111872
10065638
10036730
10046531
144
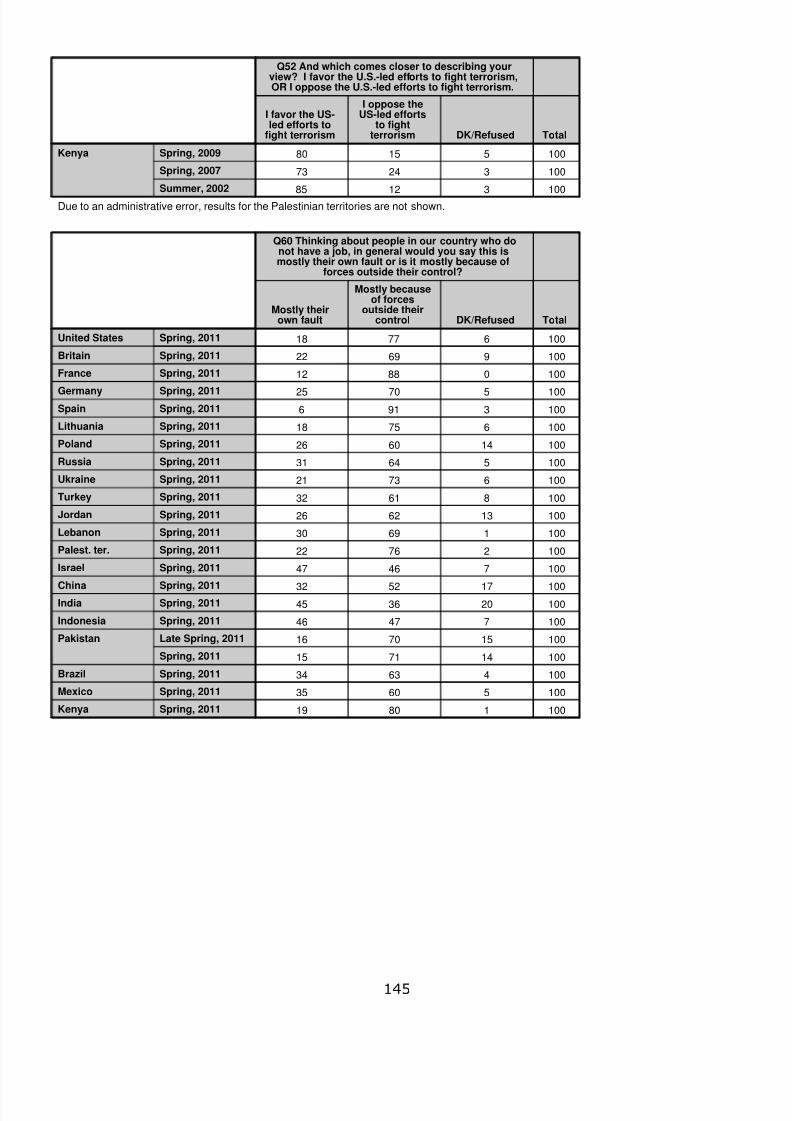
8/3/2019 Pew Global Attitudes Balance of Power U.S. Image Report FINAL July 13 2011
http://slidepdf.com/reader/full/pew-global-attitudes-balance-of-power-us-image-report-final-july-13-2011 147/160
DK/Refused
I oppose theUS-led efforts
to fightterrorism
I favor the US-led efforts to
fight terrorism Total
Q52 And which comes closer to describing yourview? I favor the U.S.-led efforts to fight terrorism,OR I oppose the U.S.-led efforts to fight terrorism.
Spring, 2009
Spring, 2007
Summer, 2002
Kenya
10031285
10032473
10051580
Due to an administrative error, results for the Palestinian territories are not shown.
DK/Refused
Mostly becauseof forces
outside theircontrol
Mostly theirown fault Total
Q60 Thinking about people in our country who donot have a job, in general would you say this ismostly their own fault or is it mostly because of
forces outside their control?
Spring, 2011
Spring, 2011
Spring, 2011
Spring, 2011Spring, 2011
Spring, 2011
Spring, 2011
Spring, 2011
Spring, 2011
Spring, 2011
Spring, 2011
Spring, 2011
Spring, 2011
Spring, 2011
Spring, 2011Spring, 2011
Spring, 2011
Late Spring, 2011
Spring, 2011
Spring, 2011
Spring, 2011
Spring, 2011
United States
Britain
France
GermanySpain
Lithuania
Poland
Russia
Ukraine
Turkey
Jordan
Lebanon
Palest. ter.
Israel
ChinaIndia
Indonesia
Pakistan
Brazil
Mexico
Kenya 10018019
10056035
10046334
100147115
100157016
10074746
100203645100175232
10074647
10027622
10016930
100136226
10086132
10067321
10056431
100146026
10067518
1003916
10057025
10008812
10096922
10067718
145

8/3/2019 Pew Global Attitudes Balance of Power U.S. Image Report FINAL July 13 2011
http://slidepdf.com/reader/full/pew-global-attitudes-balance-of-power-us-image-report-final-july-13-2011 148/160
DK/RefusedRemove their
troopsKeep troops in
Afghanistan Total
Q62 Do you think the U.S. and NATO should keepmilitary troops in Afghanistan until the situation hasstabilized, or do you think the U.S. and NATO should
remove their troops as soon as possible?
Spring, 2011
Spring, 2010
Fall, 2009
Spring, 2009
Spring, 2008
Spring, 2007
Spring, 2011
Spring, 2010
Fall, 2009
Spring, 2009
Spring, 2008
Spring, 2007
Spring, 2011
Spring, 2010
Fall, 2009Spring, 2009
Spring, 2008
Spring, 2007
Spring, 2011
Spring, 2010
Fall, 2009
Spring, 2009
Spring, 2008
Spring, 2007
Spring, 2011
Spring, 2010Fall, 2009
Spring, 2009
Spring, 2008
Spring, 2007
Spring, 2011
Fall, 2009
Spring, 2011
Spring, 2010
Fall, 2009
Spring, 2009
Spring, 2008
Spring, 2007
Spring, 2011
Spring, 2010
Fall, 2009
Spring, 2009
Spring, 2008
Spring, 2007
Spring, 2011
Fall, 2009
Spring, 2007
United States
Britain
France
Germany
Spain
Lithuania
Poland
Russia
Ukraine
100177211
10030627
100226413
100167312
100147214
100186616
100206515
100235324
100255916
100136324
100116524
100135730
100126424
100144442
100165331
100245027
100185032
100116722
100105634
100104644
10013483810094943
10054451
10084944
10035443
10044748
10035442
10025840
10015841
10015148
10015446
10014950
10016138
10005247
10005841
100134245
10094348
10074846
10085438
10064549
10085141
10074250
10064450
10053857
10074350
10074548
10065241
146

8/3/2019 Pew Global Attitudes Balance of Power U.S. Image Report FINAL July 13 2011
http://slidepdf.com/reader/full/pew-global-attitudes-balance-of-power-us-image-report-final-july-13-2011 149/160
DK/RefusedRemove their
troopsKeep troops in
Afghanistan Total
Q62 Do you think the U.S. and NATO should keepmilitary troops in Afghanistan until the situation hasstabilized, or do you think the U.S. and NATO should
remove their troops as soon as possible?
Spring, 2011
Spring, 2010
Spring, 2009
Spring, 2008
Spring, 2007
Spring, 2011
Spring, 2010
Spring, 2009
Spring, 2008
Spring, 2007
Spring, 2011
Spring, 2010
Spring, 2009
Spring, 2008
Spring, 2007Spring, 2011
Spring, 2010
Spring, 2009
Spring, 2008
Spring, 2007
Spring, 2011
Spring, 2009
Spring, 2007
Spring, 2011
Spring, 2010
Spring, 2009Spring, 2008
Spring, 2007
Spring, 2011
Spring, 2011
Spring, 2010
Spring, 2009
Spring, 2008
Spring, 2007
Spring, 2011
Spring, 2010
Spring, 2009
Spring, 2008
Spring, 2007
Late Spring, 2011
Spring, 2011
Spring, 2010
Spring, 2009
Spring, 2008
Spring, 2007
Spring, 2011
Spring, 2010
Turkey
Egypt
Jordan
Lebanon
Israel
China
India
Indonesia
Japan
Pakistan
Brazil
100174637
100134641
10022753
10019729
10024724
10028657
10026686
10022698
100244729
10086032
100135136
100125335
100164044
10012808
100235621
100176617
100186219
100187112
100471934
10015805
10022698100137016
100285418
10025659
100103159
100142759
100152857
10037027
10046630
10086824
10096921
10087122
10077815
10077616
10028612
10068113
1004879
10068212
10068014
100117019
10048115
100117811
100157411
10019728
100226315
100226711
10019756
147

8/3/2019 Pew Global Attitudes Balance of Power U.S. Image Report FINAL July 13 2011
http://slidepdf.com/reader/full/pew-global-attitudes-balance-of-power-us-image-report-final-july-13-2011 150/160
DK/RefusedRemove their
troopsKeep troops in
Afghanistan Total
Q62 Do you think the U.S. and NATO should keepmilitary troops in Afghanistan until the situation hasstabilized, or do you think the U.S. and NATO should
remove their troops as soon as possible?
Spring, 2011
Spring, 2010
Spring, 2009
Spring, 2008
Spring, 2007
Spring, 2011
Spring, 2010
Spring, 2009
Spring, 2007
Mexico
Kenya
10043660
100143056
100182557
100122662
100147017
100137512
100275122
100226118
100225325
Due to an administrative error, results for the Palestinian territories are not shown.
DK/RefusedBad thingGood thing Total
Q63 Turning to China, overall do you think thatChina's growing economy is a good thing or a bad
thing for our country?
Spring, 2011
Spring, 2010
Spring, 2008
Spring, 2007
May, 2005
Spring, 2011
Spring, 2010
Spring, 2008
Spring, 2007
May, 2005
Spring, 2011
Spring, 2010Spring, 2008
Spring, 2007
May, 2005
Spring, 2011
Spring, 2010
Spring, 2008
Spring, 2007
May, 2005
Spring, 2011
Spring, 2010
Spring, 2008Spring, 2007
May, 2005
United States
Britain
France
Germany
Spain
100154836
100214435100174538
100164836
10084052
10093853
10065539
10055639
10055837
10035046
10026137
10016435
10006337
10016732
10005941
100133156
100144145
100144443
100144244
100153253
100114049
100134541
100115335
100134740
100105337
148
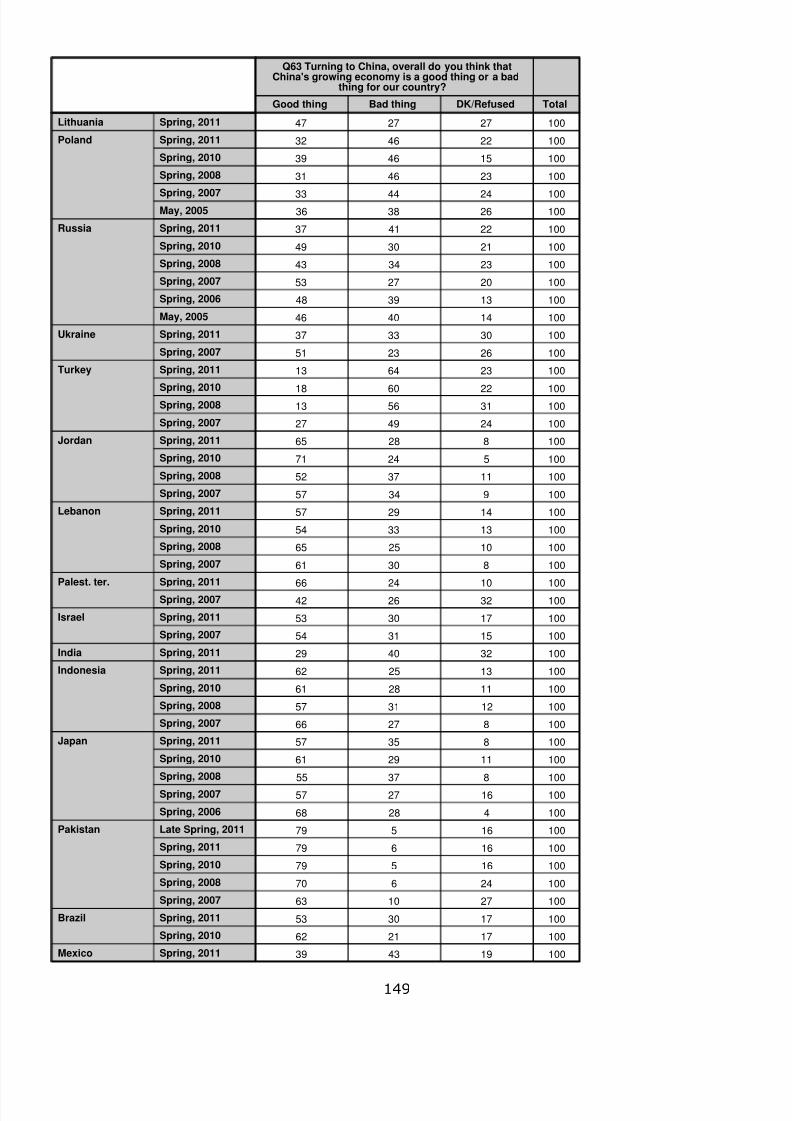
8/3/2019 Pew Global Attitudes Balance of Power U.S. Image Report FINAL July 13 2011
http://slidepdf.com/reader/full/pew-global-attitudes-balance-of-power-us-image-report-final-july-13-2011 151/160
DK/RefusedBad thingGood thing Total
Q63 Turning to China, overall do you think thatChina's growing economy is a good thing or a bad
thing for our country?
Spring, 2011
Spring, 2011
Spring, 2010
Spring, 2008
Spring, 2007May, 2005
Spring, 2011
Spring, 2010
Spring, 2008
Spring, 2007
Spring, 2006
May, 2005
Spring, 2011
Spring, 2007
Spring, 2011
Spring, 2010Spring, 2008
Spring, 2007
Spring, 2011
Spring, 2010
Spring, 2008
Spring, 2007
Spring, 2011
Spring, 2010
Spring, 2008
Spring, 2007
Spring, 2011
Spring, 2007
Spring, 2011
Spring, 2007
Spring, 2011
Spring, 2011
Spring, 2010
Spring, 2008
Spring, 2007
Spring, 2011
Spring, 2010
Spring, 2008
Spring, 2007
Spring, 2006
Late Spring, 2011
Spring, 2011
Spring, 2010
Spring, 2008
Spring, 2007
Spring, 2011
Spring, 2010
Spring, 2011
Lithuania
Poland
Russia
Ukraine
Turkey
Jordan
Lebanon
Palest. ter.
Israel
India
Indonesia
Japan
Pakistan
Brazil
Mexico 100194339
100172162
100173053
100271063
10024670
10016579
10016679
10016579
10042868
100162757
10083755
100112961
10083557
10082766
100123157
100112861
100132562
100324029
100153154
100173053
100322642
100102466
10083061
100102565
100133354
100142957
10093457
100113752
10052471
10082865
100244927
100315613100226018
100236413
100262351
100303337
100144046
100133948
100202753
100233443
100213049
100224137
100263836100244433
100234631
100154639
100224632
100272747
149

8/3/2019 Pew Global Attitudes Balance of Power U.S. Image Report FINAL July 13 2011
http://slidepdf.com/reader/full/pew-global-attitudes-balance-of-power-us-image-report-final-july-13-2011 152/160
DK/RefusedBad thingGood thing Total
Q63 Turning to China, overall do you think thatChina's growing economy is a good thing or a bad
thing for our country?
Spring, 2010
Spring, 2008
Spring, 2007
Spring, 2011
Spring, 2010Spring, 2007
Mexico
Kenya
10054911004690
10041285
100165528
100164836
100253441
150
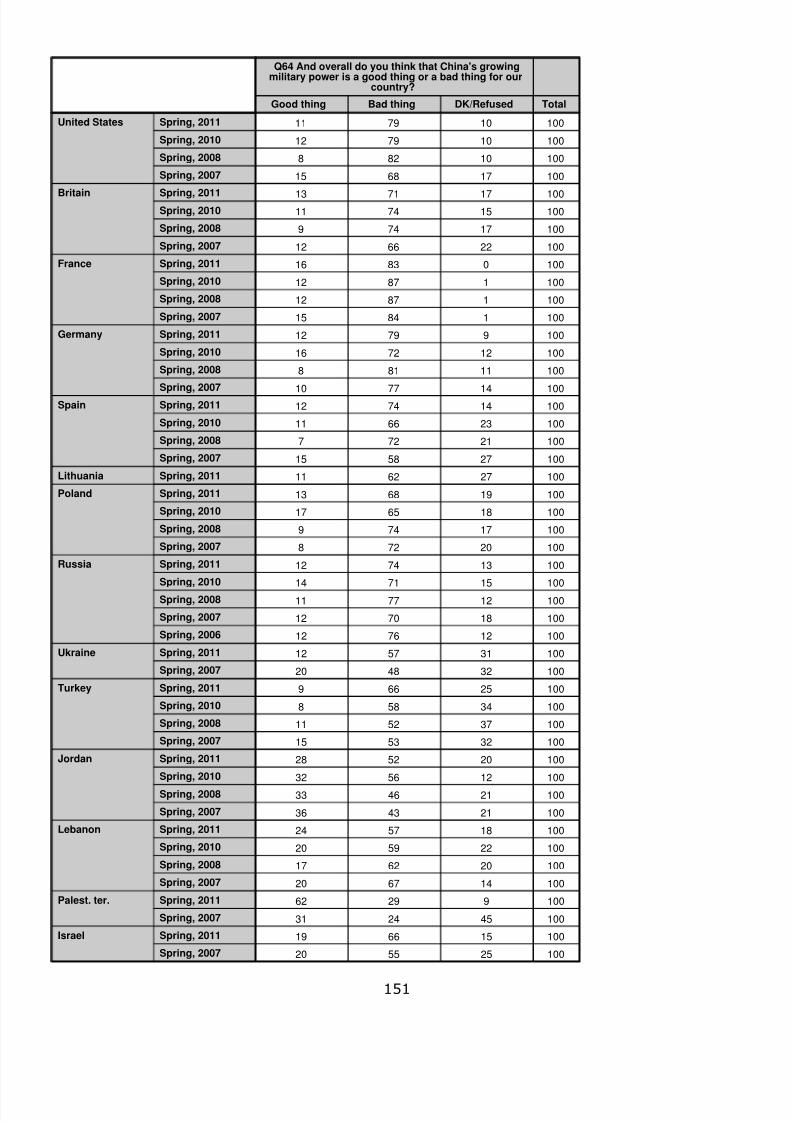
8/3/2019 Pew Global Attitudes Balance of Power U.S. Image Report FINAL July 13 2011
http://slidepdf.com/reader/full/pew-global-attitudes-balance-of-power-us-image-report-final-july-13-2011 153/160
DK/RefusedBad thingGood thing Total
Q64 And overall do you think that China's growingmilitary power is a good thing or a bad thing for our
country?
Spring, 2011
Spring, 2010
Spring, 2008
Spring, 2007
Spring, 2011Spring, 2010
Spring, 2008
Spring, 2007
Spring, 2011
Spring, 2010
Spring, 2008
Spring, 2007
Spring, 2011
Spring, 2010
Spring, 2008
Spring, 2007Spring, 2011
Spring, 2010
Spring, 2008
Spring, 2007
Spring, 2011
Spring, 2011
Spring, 2010
Spring, 2008
Spring, 2007
Spring, 2011
Spring, 2010
Spring, 2008
Spring, 2007
Spring, 2006
Spring, 2011
Spring, 2007
Spring, 2011
Spring, 2010
Spring, 2008
Spring, 2007
Spring, 2011
Spring, 2010
Spring, 2008
Spring, 2007
Spring, 2011
Spring, 2010
Spring, 2008
Spring, 2007
Spring, 2011
Spring, 2007
Spring, 2011
Spring, 2007
United States
Britain
France
Germany
Spain
Lithuania
Poland
Russia
Ukraine
Turkey
Jordan
Lebanon
Palest. ter.
Israel
100255520
100156619
100452431
10092962
100146720
100206217
100225920
100185724
100214336
100214633
100125632
100205228
100325315
100375211
10034588
10025669
100324820
100315712
100127612
100187012
100127711
100157114
100137412
10020728
10017749
100186517
100196813
100276211
100275815
10021727
100236611
100147412100147710
10011818
100127216
10097912
10018415
10018712
10018712
10008316
100226612
10017749
100157411100177113
100176815
10010828
100107912
100107911
151

8/3/2019 Pew Global Attitudes Balance of Power U.S. Image Report FINAL July 13 2011
http://slidepdf.com/reader/full/pew-global-attitudes-balance-of-power-us-image-report-final-july-13-2011 154/160
DK/RefusedBad thingGood thing Total
Q64 And overall do you think that China's growingmilitary power is a good thing or a bad thing for our
country?
Spring, 2011
Spring, 2011
Spring, 2010
Spring, 2008
Spring, 2007Spring, 2011
Spring, 2010
Spring, 2008
Spring, 2007
Spring, 2006
Late Spring, 2011
Spring, 2011
Spring, 2010
Spring, 2008
Spring, 2007
Spring, 2011Spring, 2010
Spring, 2011
Spring, 2010
Spring, 2008
Spring, 2007
Spring, 2011
Spring, 2010
Spring, 2007
India
Indonesia
Japan
Pakistan
Brazil
Mexico
Kenya
100112069
10092566
100102962
100225622
100225721
100334621
100195526
100254034100205129
10035857
10030961
10023770
10020773
10023572
1003933
10014806
1005905
1008884
1006877100204337
100314227
100203941
100203644
100285022
152

8/3/2019 Pew Global Attitudes Balance of Power U.S. Image Report FINAL July 13 2011
http://slidepdf.com/reader/full/pew-global-attitudes-balance-of-power-us-image-report-final-july-13-2011 155/160
DK/RefusedDisapproveApprove Total
Q79a Please tell me if you approve or disapprove ofthe way President Barack Obama is dealing with a.
global economic problems
Spring, 2011
Spring, 2011
Spring, 2011
Spring, 2011
Spring, 2011Spring, 2011
Spring, 2011
Spring, 2011
Spring, 2011
Spring, 2011
Spring, 2011
Spring, 2011
Spring, 2011
Spring, 2011
Spring, 2011
Spring, 2011Spring, 2011
Spring, 2011
Spring, 2011
Late Spring, 2011
Spring, 2011
Spring, 2011
Spring, 2011
Spring, 2011
United States
Britain
France
Germany
SpainLithuania
Poland
Russia
Ukraine
Turkey
Egypt
Jordan
Lebanon
Palest. ter.
Israel
ChinaIndia
Indonesia
Japan
Pakistan
Brazil
Mexico
Kenya 10013878
100174241
100172262
100404812
100385111
100161569
10092665
100511336100283835
100134344
10046630
10055343
10027621
10077320
100276211
100362539
100323632
100262648
100201960100103852
10082468
10014059
100222752
100114940
153

8/3/2019 Pew Global Attitudes Balance of Power U.S. Image Report FINAL July 13 2011
http://slidepdf.com/reader/full/pew-global-attitudes-balance-of-power-us-image-report-final-july-13-2011 156/160
DK/RefusedDisapproveApprove Total
Q79b Please tell me if you approve or disapprove ofthe way President Barack Obama is dealing with b.
the situation in Afghanistan
Spring, 2011
Spring, 2010
Spring, 2011
Spring, 2010
Spring, 2011Spring, 2010
Spring, 2011
Spring, 2010
Spring, 2011
Spring, 2010
Spring, 2011
Spring, 2011
Spring, 2010
Spring, 2011
Spring, 2010
Spring, 2011Spring, 2011
Spring, 2010
Spring, 2011
Spring, 2010
Spring, 2011
Spring, 2010
Spring, 2011
Spring, 2010
Spring, 2011
Spring, 2011
Spring, 2011
Spring, 2010
Spring, 2011
Spring, 2011
Spring, 2010
Spring, 2011
Spring, 2010
Late Spring, 2011
Spring, 2011
Spring, 2010
Spring, 2011
Spring, 2010
Spring, 2011
Spring, 2010
Spring, 2011
Spring, 2010
United States
Britain
France
Germany
Spain
Lithuania
Poland
Russia
UkraineTurkey
Egypt
Jordan
Lebanon
Palest. ter.
Israel
China
India
Indonesia
Japan
Pakistan
Brazil
Mexico
Kenya
100122266
100182657
100324622
100195724
100244333
100194338
10039556
10039529
10040555
100223840
100203743
100115336
100155628
100602217
100334225
100315217
100145333
10048115
10067222
10067123
10038413
10018712
10048115
10067618
10033625
10026705100335115
100364520
100276111
100173349
100243938
100224137
100193744
10094446
10084646
10054649
1001435510014950
100163252
100163944
100123751
100104545
154

8/3/2019 Pew Global Attitudes Balance of Power U.S. Image Report FINAL July 13 2011
http://slidepdf.com/reader/full/pew-global-attitudes-balance-of-power-us-image-report-final-july-13-2011 157/160
DK/RefusedDisapproveApprove Total
Q79c Please tell me if you approve or disapprove ofthe way President Barack Obama is dealing with c.
Iran
Spring, 2011
Spring, 2010
Spring, 2011
Spring, 2010
Spring, 2011Spring, 2010
Spring, 2011
Spring, 2010
Spring, 2011
Spring, 2010
Spring, 2011
Spring, 2011
Spring, 2010
Spring, 2011
Spring, 2010
Spring, 2011Spring, 2011
Spring, 2010
Spring, 2011
Spring, 2010
Spring, 2011
Spring, 2010
Spring, 2011
Spring, 2010
Spring, 2011
Spring, 2011
Spring, 2011
Spring, 2010
Spring, 2011
Spring, 2011
Spring, 2010
Spring, 2011
Spring, 2010
Late Spring, 2011
Spring, 2011
Spring, 2010
Spring, 2011
Spring, 2010
Spring, 2011
Spring, 2010
Spring, 2011
Spring, 2010
United States
Britain
France
Germany
Spain
Lithuania
Poland
Russia
UkraineTurkey
Egypt
Jordan
Lebanon
Palest. ter.
Israel
China
India
Indonesia
Japan
Pakistan
Brazil
Mexico
Kenya
100162658
100253144
100364718
100225622
100254332
100214831
10040527
100405010
10043525
100243641
100194041
100115336
100205623
100672311
100384220
100355214
100106129
10048016
10035443
10045540
10028414
10027721
10027622
10056827
10033625
10027685100404911
100374320
10031609
100212949
100303535
100294229
100213643
100124345
100123949
100104248
1001395910024553
100242848
100243639
100154144
100134541
155

8/3/2019 Pew Global Attitudes Balance of Power U.S. Image Report FINAL July 13 2011
http://slidepdf.com/reader/full/pew-global-attitudes-balance-of-power-us-image-report-final-july-13-2011 158/160
DK/RefusedDisapproveApprove Total
Q79d Please tell me if you approve or disapprove ofthe way President Barack Obama is dealing with d.
the conflict between Israelis and Palestinians
Spring, 2011
Spring, 2010
Spring, 2011
Spring, 2010
Spring, 2011Spring, 2010
Spring, 2011
Spring, 2010
Spring, 2011
Spring, 2010
Spring, 2011
Spring, 2011
Spring, 2010
Spring, 2011
Spring, 2010
Spring, 2011Spring, 2011
Spring, 2010
Spring, 2011
Spring, 2010
Spring, 2011
Spring, 2010
Spring, 2011
Spring, 2010
Spring, 2011
Spring, 2011
Spring, 2011
Spring, 2010
Spring, 2011
Spring, 2011
Spring, 2010
Spring, 2011
Spring, 2010
Late Spring, 2011
Spring, 2011
Spring, 2010
Spring, 2011
Spring, 2010
Spring, 2011
Spring, 2010
Spring, 2011
Spring, 2010
United States
Britain
France
Germany
Spain
Lithuania
Poland
Russia
UkraineTurkey
Egypt
Jordan
Lebanon
Palest. ter.
Israel
China
India
Indonesia
Japan
Pakistan
Brazil
Mexico
Kenya
100182557
100252451
100374816
100225424
100254926
100205426
10044515
10049456
10050464
100224632
100194734
10085636
100175726
100652311
100394119
100384814
10076429
10038413
1002908
10038512
10028415
10028217
10018811
10038215
10030665
10026686100444214
100463915
10034579
100272944
100333631
100334325
100214534
100105832
100164044
100134245
1002475110025445
100313435
100264232
100204139
100204535
156
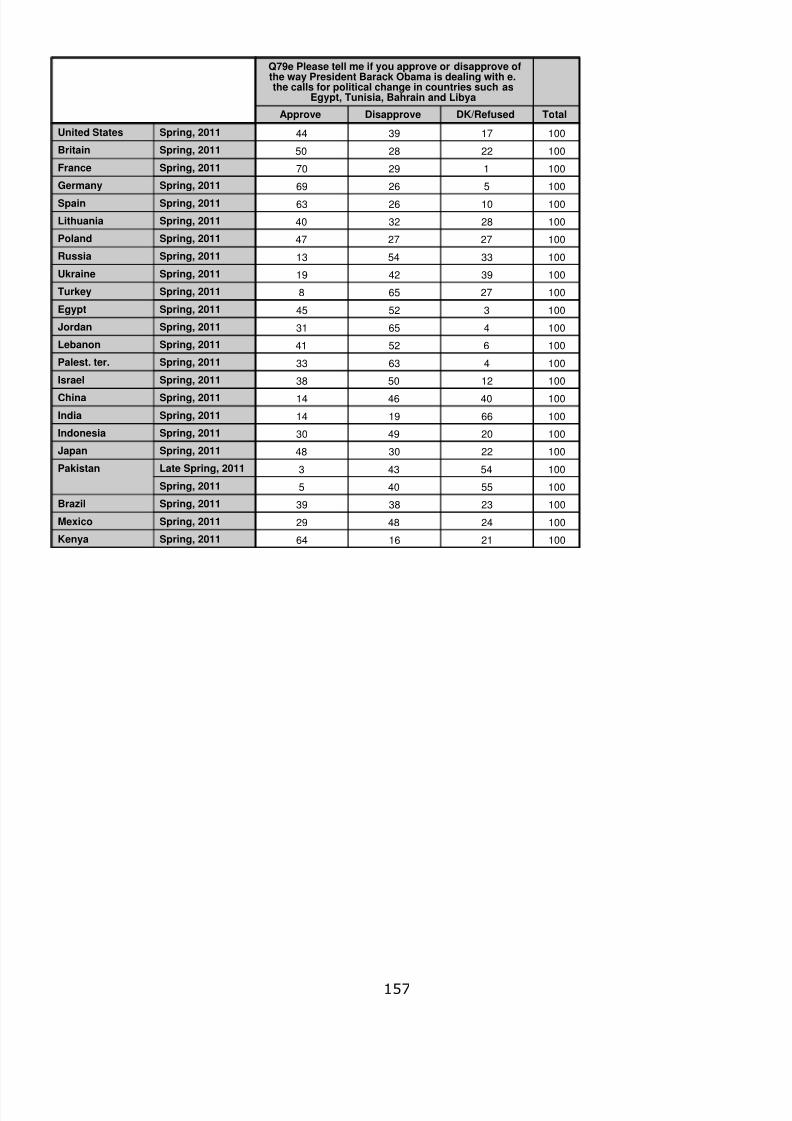
8/3/2019 Pew Global Attitudes Balance of Power U.S. Image Report FINAL July 13 2011
http://slidepdf.com/reader/full/pew-global-attitudes-balance-of-power-us-image-report-final-july-13-2011 159/160
DK/RefusedDisapproveApprove Total
Q79e Please tell me if you approve or disapprove ofthe way President Barack Obama is dealing with e.the calls for political change in countries such as
Egypt, Tunisia, Bahrain and Libya
Spring, 2011
Spring, 2011
Spring, 2011
Spring, 2011
Spring, 2011
Spring, 2011
Spring, 2011
Spring, 2011
Spring, 2011
Spring, 2011
Spring, 2011
Spring, 2011
Spring, 2011
Spring, 2011
Spring, 2011
Spring, 2011
Spring, 2011
Spring, 2011
Spring, 2011
Late Spring, 2011
Spring, 2011
Spring, 2011
Spring, 2011
Spring, 2011
United States
Britain
France
Germany
Spain
Lithuania
Poland
Russia
Ukraine
Turkey
Egypt
Jordan
Lebanon
Palest. ter.
Israel
China
India
Indonesia
Japan
Pakistan
Brazil
Mexico
Kenya 100211664
100244829
100233839
10055405
10054433
100223048
100204930
100661914
100404614
100125038
10046333
10065241
10046531
10035245
10027658
100394219
100335413
100272747
100283240
100102663
10052669
10012970
100222850
100173944
157

8/3/2019 Pew Global Attitudes Balance of Power U.S. Image Report FINAL July 13 2011
http://slidepdf.com/reader/full/pew-global-attitudes-balance-of-power-us-image-report-final-july-13-2011 160/160
DK/RefusedOpposeFavor Total
Q83 Now thinking about Iran, would you favor or
oppose Iran acquiring nuclear weapons?
Spring, 2011
Spring, 2010
Spring, 2009
Spring, 2008
Spring, 2007
Spring, 2006
Spring, 2011
Spring, 2010
Spring, 2009
Spring, 2008
Spring, 2007
Spring, 2006
Spring, 2011
Spring, 2010
Spring, 2009
Spring, 2008
Spring, 2007
Spring, 2006
Spring, 2011
Spring, 2010
Spring, 2009
Spring, 2008
Spring, 2007
Turkey
Egypt
Jordan
Lebanon
10026929
10046928
10036631
10026434
10036434
100124245
100135532
100106129
100105634
10085339
10087022
100144244
100195724
100126126
10096426
10096626
100116326
100166123
100165925
100116721
100146521
100176321
100146520