Embed Size (px)
Citation preview


PETROLEUM REFINING PROCESS WASTELISTING DETERMINATION
SUPPLEMENTAL BACKGROUND DOCUMENT
GROUNDWATER PATHWAY RISK ANALYSIS
US Environmental Protection AgencyOffice of Solid Waste
Washington, DC
March 1997

i
TABLE OF CONTENTSPage
1.0 BACKGROUND . . . . . . . . . . . . . . . . . . . . . . . . . . . . . . . . . . . . . . . . . . . . . . . . . . . . . . . . . . . 1-11.1 GENERAL BACKGROUND . . . . . . . . . . . . . . . . . . . . . . . . . . . . . . . . . . . . . . . . . 1-1
1.1.1 General Overview of Analyses . . . . . . . . . . . . . . . . . . . . . . . . . . . . . . . . . . 1-11.2 WASTESTREAMS AND MANAGEMENT SCENARIOS . . . . . . . . . . . . . . . . . . 1-21.3 REPORT ORGANIZATION . . . . . . . . . . . . . . . . . . . . . . . . . . . . . . . . . . . . . . . . . . 1-2
2.0 GENERAL METHODOLOGY . . . . . . . . . . . . . . . . . . . . . . . . . . . . . . . . . . . . . . . . . . . . . . . . 2-12.1 MODELING APPROACH . . . . . . . . . . . . . . . . . . . . . . . . . . . . . . . . . . . . . . . . . . . 2-1
2.1.1 EPACMTP Model . . . . . . . . . . . . . . . . . . . . . . . . . . . . . . . . . . . . . . . . . . . . 2-12.1.2 Contaminant Source Term Modeling . . . . . . . . . . . . . . . . . . . . . . . . . . . . . 2-32.1.3 Processes in Subsurface Fate and Transport Modeling . . . . . . . . . . . . . . . . 2-42.1.4 Regional Site-Based Modeling Approach . . . . . . . . . . . . . . . . . . . . . . . . . . 2-5
2.2 MODELING SCENARIOS AND INPUT DATA . . . . . . . . . . . . . . . . . . . . . . . . . . 2-62.2.1 Data Sources . . . . . . . . . . . . . . . . . . . . . . . . . . . . . . . . . . . . . . . . . . . . . . . 2-102.2.2 Hydroprocessing Waste . . . . . . . . . . . . . . . . . . . . . . . . . . . . . . . . . . . . . . . 2-112.2.3 Multi Wastestream Codisposal . . . . . . . . . . . . . . . . . . . . . . . . . . . . . . . . . 2-112.2.4 Contingent CSO Sludge Management . . . . . . . . . . . . . . . . . . . . . . . . . . . . 2-142.2.5 TC Rule Constrained Maximum TCLP . . . . . . . . . . . . . . . . . . . . . . . . . . . 2-162.2.6 Off-Spec Products and Fines TCLP Data . . . . . . . . . . . . . . . . . . . . . . . . . 2-16
3.0 DETERMINISTIC GROUNDWATER PATHWAY ANALYSES . . . . . . . . . . . . . . . . . . . . . 3-13.1 BOUNDING ANALYSES . . . . . . . . . . . . . . . . . . . . . . . . . . . . . . . . . . . . . . . . . . . 3-13.2 TWO HIGH-END PARAMETERS BASELINE ANALYSES . . . . . . . . . . . . . . . . 3-1
3.2.1 1995 Proposal Results . . . . . . . . . . . . . . . . . . . . . . . . . . . . . . . . . . . . . . . . . 3-33.2.2 Revised Two High-End Parameters Analyses . . . . . . . . . . . . . . . . . . . . . . . 3-33.2.3 Current Two Parameter Sensitivity Analysis . . . . . . . . . . . . . . . . . . . . . . . . 3-4
3.2.3.1 Approach . . . . . . . . . . . . . . . . . . . . . . . . . . . . . . . . . . . . . . . . . . . . 3-43.2.3.2 Sensitivity of Parameters . . . . . . . . . . . . . . . . . . . . . . . . . . . . . . . . 3-5
3.3 CENTRAL TENDENCY ANALYSIS. . . . . . . . . . . . . . . . . . . . . . . . . . . . . . . . . . . 3-53.3.1 1995 (Previous) Analysis . . . . . . . . . . . . . . . . . . . . . . . . . . . . . . . . . . . . . . . 3-53.3.2 1995 (Current) Central Tendency Analysis . . . . . . . . . . . . . . . . . . . . . . . . . 3-5
3.4 TWO HIGH-END PARAMETERS ANALYSIS FOR CODISPOSAL . . . . . . . . . 3-5
4.0 MONTE CARLO ANALYSES PROCEDURE . . . . . . . . . . . . . . . . . . . . . . . . . . . . . . . . . . . . 4-14.1 SINGLE-WASTESTREAM BASELINE . . . . . . . . . . . . . . . . . . . . . . . . . . . . . . . . 4-1
4.1.1 On-Site Baseline Monte Carlo Analysis . . . . . . . . . . . . . . . . . . . . . . . . . . . 4-14.1.1.1 Procedure . . . . . . . . . . . . . . . . . . . . . . . . . . . . . . . . . . . . . . . . . . . . 4-44.1.1.2 Modeled Wastestreams and Constituents . . . . . . . . . . . . . . . . . . . . 4-5
4.1.2 Off-Site Baseline Monte Carlo Analysis . . . . . . . . . . . . . . . . . . . . . . . . . . . 4-54.1.2.1 Procedure . . . . . . . . . . . . . . . . . . . . . . . . . . . . . . . . . . . . . . . . . . . . 4-54.1.2.2 Modeled Wastestreams and Waste Constituents . . . . . . . . . . . . . . . 4-7

TABLE OF CONTENTS
Page
ii
4.2 CODISPOSAL MONTE CARLO ANALYSIS . . . . . . . . . . . . . . . . . . . . . . . . . . . . 4-74.2.1 On-Site Codisposal Monte Carlo Analysis Procedure . . . . . . . . . . . . . . . . . 4-7
4.2.1.1 Procedure . . . . . . . . . . . . . . . . . . . . . . . . . . . . . . . . . . . . . . . . . . . . 4-84.2.2 Off-site Codisposal Monte Carlo Analysis Procedure . . . . . . . . . . . . . . . . 4-10
4.2.2.1 Procedure . . . . . . . . . . . . . . . . . . . . . . . . . . . . . . . . . . . . . . . . . . . 4-10
5.0 MODELING RESULTS AND GROUNDWATER RISK . . . . . . . . . . . . . . . . . . . . . . . . . . . . 5-15.1 RISK CALCULATION . . . . . . . . . . . . . . . . . . . . . . . . . . . . . . . . . . . . . . . . . . . . . . 5-1
5.1.1 Direct Groundwater Risk . . . . . . . . . . . . . . . . . . . . . . . . . . . . . . . . . . . . . . . 5-15.1.2 Indirect Groundwater Risk . . . . . . . . . . . . . . . . . . . . . . . . . . . . . . . . . . . . . 5-15.1.3 Total Risk . . . . . . . . . . . . . . . . . . . . . . . . . . . . . . . . . . . . . . . . . . . . . . . . . . 5-1
5.2 MODELING RESULTS . . . . . . . . . . . . . . . . . . . . . . . . . . . . . . . . . . . . . . . . . . . . . 5-25.2.1 Two High-End Parameters Results . . . . . . . . . . . . . . . . . . . . . . . . . . . . . . . 5-25.2.2 Central Tendency Results . . . . . . . . . . . . . . . . . . . . . . . . . . . . . . . . . . . . . . 5-25.2.3 Monte Carlo Results . . . . . . . . . . . . . . . . . . . . . . . . . . . . . . . . . . . . . . . . . . 5-25.2.4 Contingent CSO Management . . . . . . . . . . . . . . . . . . . . . . . . . . . . . . . . . . . 5-25.2.5 Codisposal Results . . . . . . . . . . . . . . . . . . . . . . . . . . . . . . . . . . . . . . . . . . . 5-25.2.6 TC Capped Results . . . . . . . . . . . . . . . . . . . . . . . . . . . . . . . . . . . . . . . . . . . 5-2
6.0 REFERENCES . . . . . . . . . . . . . . . . . . . . . . . . . . . . . . . . . . . . . . . . . . . . . . . . . . . . . . . . . . . . . 6-1
APPENDIX A: Waste and Leachate ConcentrationsAPPENDIX B: Landfill Size and Waste Volume DataAPPENDIX C: Sensitivity Analyses Data and ResultsAPPENDIX D: Calculation of Two High-End Codisposal ParametersAPPENDIX E: Baseline Modeling Results
iii
LIST OF FIGURESPage
Figure 2.1 Schematic view of the modeled subsurface pathway . . . . . . . . . . . . . . . . . . . . . . . . 2-2
Figure 2.2 Flowchart of EPACMTP for the Regional Site-Based Monte Carlo Approach . . . . . . . . . . . . . . . . . . . . . . . . . . . . . . . . . . . . . . . . . . . . . . . . . . . . . . . . . 2-8

iv
LIST OF TABLESPage
Table 1.1 Petroleum Refining Listing Wastestreams and Landfill Scenarios . . . . . . . . . . . . . . 1-3
Table 1.2 Petroleum Refining Study Wastestreams . . . . . . . . . . . . . . . . . . . . . . . . . . . . . . . . . 1-4
Table 2.1 Petroleum Refining Modeling Analyses Performed in 1995 and 1996 . . . . . . . . . . . 2-9
Table 2.2a Off-Site CSO Contingent Management Data . . . . . . . . . . . . . . . . . . . . . . . . . . . . . 2-14
Table 2.2b On-Site CSO Contingent Management Data . . . . . . . . . . . . . . . . . . . . . . . . . . . . . 2-15
Table 3.1 Summary of 1995 Groundwater Pathway Analysis Results . . . . . . . . . . . . . . . . . . . 3-2
Table 3.2 Comparison of 1995 and 1996 Modeled Waste Quantities for Three WasteStreams . . . . . . . . . . . . . . . . . . . . . . . . . . . . . . . . . . . . . . . . . . . . . . . . . . . . . . . . . . 3-4
Table 3.3 Summary of Two High-End Parameter Sensitivity Analysis . . . . . . . . . . . . . . . . . . 3-7
Table 3.4 Two High-End Parameter Input Data for Codisposal Scenario . . . . . . . . . . . . . . . . 3-8
Table 4.1 Description of Monte Carlo Input Data and Data Sources . . . . . . . . . . . . . . . . . . . . 4-2
Table 4.2 Modeled Wastestreams and Constituents for On-Site Scenarios . . . . . . . . . . . . . . . 4-5
Table 4.3 Modeled Wastestreams and Constituents for Off-Site Scenarios . . . . . . . . . . . . . . . 4-7
Table 5.1 Summary of Maximum Groundwater Risks . . . . . . . . . . . . . . . . . . . . . . . . . . . . . . 5-3
Table 5.2 Deterministic Groundwater Pathway Analysis Results from On-Site Landfills . . . . 5-4
Table 5.3 Deterministic Groundwater Pathway Analysis Results from Off-Site Landfills . . . . 5-5
Table 5.4 Monte Carlo Groundwater Pathway Analysis Results from On-Site Landfills . . . . . 5-6
Table 5.5 Monte Carlo Groundwater Pathway Analysis Results from Off-Site Landfills . . . . 5-7
Table 5.6 CSO Contingent Management Scenario Results . . . . . . . . . . . . . . . . . . . . . . . . . . . 5-8
Table 5.7 Codisposal Scenario Results . . . . . . . . . . . . . . . . . . . . . . . . . . . . . . . . . . . . . . . . . . 5-9
Table 5.8 Off-Spec Products and Fines Summary of Analyses Results for Benz(a)anthracene 5-10
Table A.1 Benzene Concentration Data . . . . . . . . . . . . . . . . . . . . . . . . . . . . . . . . . . . . . . . . . . A.1
Table A.2 Arsenic Concentration Data . . . . . . . . . . . . . . . . . . . . . . . . . . . . . . . . . . . . . . . . . . . A.3
Table A.3 Nickel Concentration Data . . . . . . . . . . . . . . . . . . . . . . . . . . . . . . . . . . . . . . . . . . . . A.5

LIST OF TABLES
Page
v
Table A.4 Benz(a)anthracene Concentration Data . . . . . . . . . . . . . . . . . . . . . . . . . . . . . . . . . . A.7
Table A.5 Toluene Concentration Data . . . . . . . . . . . . . . . . . . . . . . . . . . . . . . . . . . . . . . . . . . A.9
Table A.6 Benzo(a)pyrene Concentration Data . . . . . . . . . . . . . . . . . . . . . . . . . . . . . . . . . . . A.10
Table A.7 Cadmium Concentration Data . . . . . . . . . . . . . . . . . . . . . . . . . . . . . . . . . . . . . . . . A.11
Table A.8 Vanadium Concentration Data . . . . . . . . . . . . . . . . . . . . . . . . . . . . . . . . . . . . . . . . A.12
Table A.9 3/4-Methylphenol Concentration Data . . . . . . . . . . . . . . . . . . . . . . . . . . . . . . . . . . A.13
Table B.1 On-Site Landfill Source Input Data . . . . . . . . . . . . . . . . . . . . . . . . . . . . . . . . . . . . . B.1
Table B.2 Off-Site Landfill Waste Volume Data . . . . . . . . . . . . . . . . . . . . . . . . . . . . . . . . . . . B.7
Table C.1 Two-High End Parameters Determined from Sensitivity Analyses . . . . . . . . . . . . . C.1
Table C.2 Parameter Distributions for CSO Sludge/Benzene . . . . . . . . . . . . . . . . . . . . . . . . . . C.2
Table C.3 Sensitivity Analysis CSO Sludge On-Site Landfill/Benzene . . . . . . . . . . . . . . . . . . C.3
Table C.4 Sensitivity Analysis CSO Sludge Off-Site Landfill/Benzene . . . . . . . . . . . . . . . . . . C.4
Table C.5 Parameter Distributions for Contingent Mgmt. of CSO Sludge/Benzene . . . . . . . . . C.5
Table C.6 Sensitivity Analysis for Contingent Mgmt. of CSO Sludge On-Site Landfill/Benzene . . . . . . . . . . . . . . . . . . . . . . . . . . . . . . . . . . . . . . . . . . . . . . . . . . . C.6
Table C.7 Sensitivity Analysis for Contingent Mgmt. of CSO Sludge Off-Site Landfill/Benzene . . . . . . . . . . . . . . . . . . . . . . . . . . . . . . . . . . . . . . . . . . . . . . . . . . . C.7
Table C.8 Parameter Distributions for Crude Oil Tank Sludge/Benzene . . . . . . . . . . . . . . . . . C.8
Table C.9 Sensitivity Analysis for Crude Oil Tank Sludge On-Site Landfill/Benzene . . . . . . . C.9
Table C.10 Sensitivity Analysis for Crude Oil Tank Sludge Off-Site Landfill/Benzene . . . . . . C.10
Table C.11 Parameter Distributions for Hydrotreating Catalyst/Benzene . . . . . . . . . . . . . . . . . C.11
Table C.12 Sensitivity Analysis for Hydrotreating Catalyst On-Site Landfill/Benzene . . . . . . C.12
Table C.13 Sensitivity Analysis for Hydrotreating Catalyst On-Site Landfill/TC Capped Benzene . . . . . . . . . . . . . . . . . . . . . . . . . . . . . . . . . . . . . . . . . . . . . . . . . . C.13
Table C.14 Sensitivity Analysis for Hydrotreating Catalyst Off-Site Landfill/Benzene . . . . . . C.14

LIST OF TABLES
Page
vi
Table C.15 Sensitivity Analysis for Hydrotreating Catalyst Off-Site Landfill/TC Capped Benzene . . . . . . . . . . . . . . . . . . . . . . . . . . . . . . . . . . . . . . . . . . . . . . . . . . . . . . . . . C.15
Table C.16 Parameter Distributions for Hydrotreating Catalyst/Arsenic . . . . . . . . . . . . . . . . . C.16
Table C.17 Sensitivity Analysis for Hydrotreating Catalyst On-Site Landfill/Arsenic . . . . . . . C.17
Table C.18 Sensitivity Analysis for Hydrotreating Catalyst Off-Site Landfill/Arsenic . . . . . . C.18
Table C.19 Parameter Distributions for Hydrorefining Catalyst/Benzene . . . . . . . . . . . . . . . . C.19
Table C.20 Sensitivity Analysis for Hydrorefining Catalyst On-Site Landfill/Benzene . . . . . . C.20
Table C.21 Sensitivity Analysis for Hydrorefining Catalyst On-Site Landfill/TC Capped Benzene . . . . . . . . . . . . . . . . . . . . . . . . . . . . . . . . . . . . . . . . . . . . . . . . . . C.21
Table C.22 Sensitivity Analysis for Hydrorefining Catalyst Off-Site Landfill/Benzene . . . . . . C.22
Table C.23 Sensitivity Analysis for Hydrorefining Catalyst Off-Site Landfill/TC Capped Benzene . . . . . . . . . . . . . . . . . . . . . . . . . . . . . . . . . . . . . . . . . . . . . . . . . . C.23
Table C.24 Parameter Distributions for Hydrorefining Catalyst/Arsenic . . . . . . . . . . . . . . . . . C.24
Table C.25 Sensitivity Analysis for Hydrorefining Catalyst On-Site Landfill/Arsenic . . . . . . . C.25
Table C.26 Sensitivity Analysis for Hydrorefining Catalyst On-Site Landfill/TC Capped Arsenic . . . . . . . . . . . . . . . . . . . . . . . . . . . . . . . . . . . . . . . . . . . . . . . . . . . C.26
Table C.27 Sensitivity Analysis for Hydrorefining Catalyst Off-Site Landfill/Arsenic . . . . . . C.27
Table C.28 Sensitivity Analysis for Hydrorefining Catalyst Off-Site Landfill/TC Capped Arsenic . . . . . . . . . . . . . . . . . . . . . . . . . . . . . . . . . . . . . . . . . . . . . . . . . . . C.28
Table C.29 Parameter Distributions for HF Alkylation Sludge/Benzene . . . . . . . . . . . . . . . . . C.29
Table C.30 Sensitivity Analysis for HF Alkylation Sludge On-Site Landfill/Benzene . . . . . . . C.30
Table C.31 Sensitivity Analysis for HF Alkylation Sludge Off-Site Landfill/Benzene . . . . . . C.31
Table C.32 Parameter Distributions for Off-Spec. Products and Fines/Benz(a)anthracene . . . C.32
Table C.33 Sensitivity Analysis for On-Site Off-Spec. Products and Fines/Benz(a)anthracene C.33
Table C.34 Sensitivity Analysis for Off-Site Off-Spec. Products and Fines/Benz(a)anthracene C.34
Table D.1 Codisposal Data for Two High-End Parameter Analysis, Arsenic in

LIST OF TABLES
Page
vii
On-Site Landfills . . . . . . . . . . . . . . . . . . . . . . . . . . . . . . . . . . . . . . . . . . . . . . . . . . . D.1
Table D.2 Codisposal Data for Two High-End Parameter Analysis, Benzene in On-Site Landfills . . . . . . . . . . . . . . . . . . . . . . . . . . . . . . . . . . . . . . . . . . . . . . . . . . . D.2
Table D.3 Codisposal Data for Two High-End Parameter Analysis, Benzene with TC Cap in On-Site Landfills . . . . . . . . . . . . . . . . . . . . . . . . . . . . . . . . . . . . . . D.3
Table D.4 Codisposal Data for Two High-End Parameter Analysis, Arsenic in Off-Site Landfills with HydroCracking Catalyst . . . . . . . . . . . . . . . . . . . . . . . . . . . . . . . . . . D.4
Table D.5 Codisposal Data for Two High-End Parameter Analysis, Benzene in Off-Site Landfills with HydroCracking Catalyst . . . . . . . . . . . . . . . . . . . . . . . . . . . . . . . . . . D.5
Table D.6 Codisposal Data for Two High-End Parameter Analysis, TC Capped Benzene in Off-Site Landfills with HydroCracking Catalyst . . . . . . . . . . . . . . . . . . D.6
Table D.7 Codisposal Data for Two High-End Parameter Analysis, Arsenic in Off-Site Landfills without HydroCracking Catalyst . . . . . . . . . . . . . . . . . . . . . . . . . . . . . . . . D.7
Table D.8 Codisposal Data for Two High-End Parameter Analysis, Benzene in Off-Site Landfills without HydroCracking Catalyst . . . . . . . . . . . . . . . . . . . . . . . . . . . . . . . . D.8
Table D.9 Codisposal Data for Two High-End Parameter Analysis, TC Capped Benzene in Off-Site Landfills without HydroCracking Catalyst . . . . . . . . . . . . . . . D.9
Table E.1 Two High-End Parameter Analysis Results of On-Site Landfills . . . . . . . . . . . . . . . E.1
Table E.2 Monte Carlo Baseline Modeling Results for On-Site Landfills . . . . . . . . . . . . . . . . E.2
Table E.3 Two High-End Parameter Analysis Results of Off-Site Landfills . . . . . . . . . . . . . . E.3
Table E.4 Monte Carlo Baseline Modeling Results for Off-Site Landfills . . . . . . . . . . . . . . . . E.4

1-1
1.0 BACKGROUND
1.1 GENERAL BACKGROUND
This document describes groundwater pathway analyses performed to support thepetroleum refining listing determination. These analyses supplement the analyses carried outearlier as part of the EPA’s proposal for the petroleum refining listing determination (USEPA,1995a). The analyses were designed to determine the potential exposure, via the groundwaterpathway, to human receptors from petroleum refining wastes, being managed and/or disposedin land management units. The exposure is expressed in terms of the contaminant concentrationat a groundwater extraction well located down-gradient from the waste-management unit.
The contaminant concentrations were obtained using the EPA’s Composite Model forLeachate Migration with Transformation Products (EPACMTP) (USEPA, 1996c ,d ,e; USEPA,1997d). EPACMTP simulates the subsurface fate and transport of waste constituents leachingfrom land disposal units. Wastestreams and waste constituents of potential concern are identifiedby comparing the model predicted exposure concentrations to health-based numbers (HBNs) forboth carcinogens and non-carcinogens.
In the current modeling analyses, in addition to the two high-end parameter and thecentral tendency analyses, Monte-Carlo analyses were also performed to assess the potentialgroundwater exposures due to dissolved chemicals associated with the disposal of petroleumrefining wastes in waste management units. The EPACMTP model was selected because of itscapabilities to perform deterministic and full, Monte Carlo-based, probabilistic exposureassessments.
1.1.1 General Overview of Analyses
EPA received a number of comments related to the groundwater pathway analysessupporting the November 20, 1995 notice of proposed rulemaking (60 FR 57747, November 20,1995). In responding to these comments, EPA performed a variety of additional analyses. A briefoverview of what analyses EPA undertook and the general nature of the comments that promptedsuch analyses, are given below.
Volume Inputs and Waste Fractions. EPA received comments regarding the Agency’sselection of volume inputs and the fraction of the landfill waste that was assumed to be thepetroleum waste. As a result, EPA reexamined the approach it used and conducted additionalanalyses to better assess groundwater risks. EPA subsequently made revisions to thedeterministic modeling approach, as described in Section 3.0. In addition, EPA conducted a full,Monte Carlo based, probabilistic exposure assessments as a way of confirming the deterministicmodeling analyses. The Monte Carlo methodology is presented in Section 4.0.
Codisposal of Multiple Wastestreams. In the proposed rule, EPA assumed that only onewastestream is managed/disposed of in a unit at any time. One of the comments about volumeinputs suggested that EPA should consider co-disposal of the evaluated wastes with other
1-2
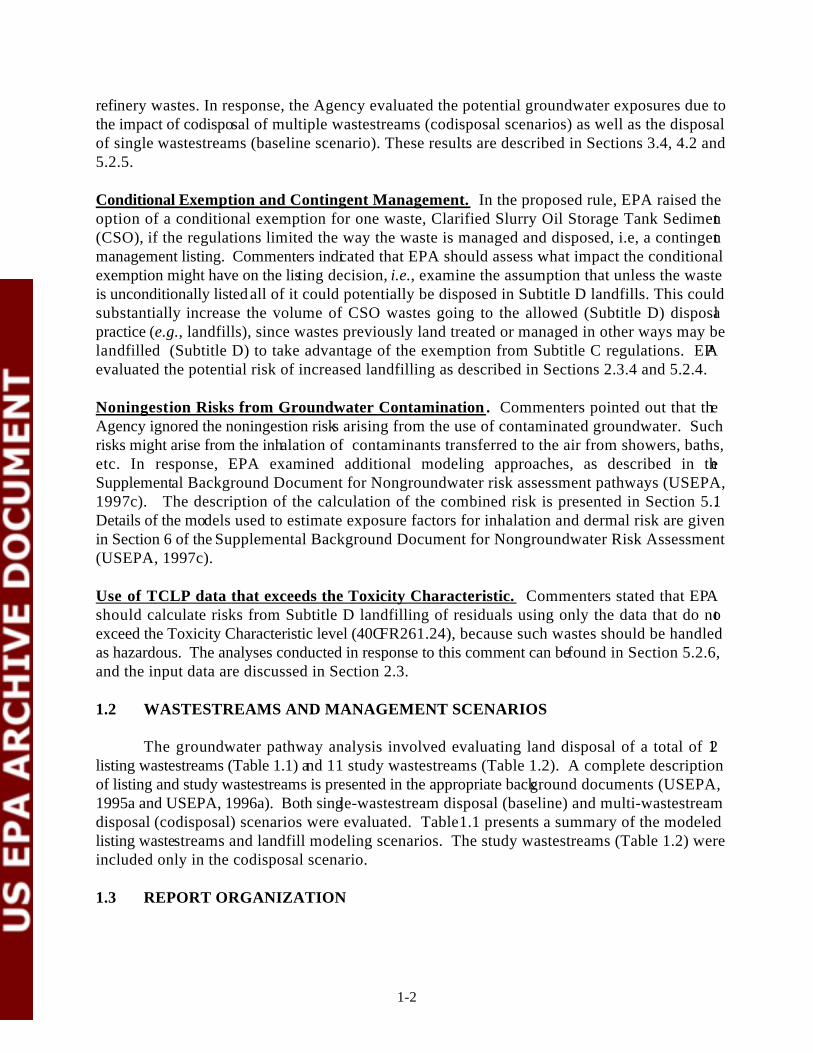
refinery wastes. In response, the Agency evaluated the potential groundwater exposures due tothe impact of codisposal of multiple wastestreams (codisposal scenarios) as well as the disposalof single wastestreams (baseline scenario). These results are described in Sections 3.4, 4.2 and5.2.5.
Conditional Exemption and Contingent Management. In the proposed rule, EPA raised theoption of a conditional exemption for one waste, Clarified Slurry Oil Storage Tank Sediment(CSO), if the regulations limited the way the waste is managed and disposed, i.e, a contingentmanagement listing. Commenters indicated that EPA should assess what impact the conditionalexemption might have on the listing decision, i.e., examine the assumption that unless the wasteis unconditionally listed all of it could potentially be disposed in Subtitle D landfills. This couldsubstantially increase the volume of CSO wastes going to the allowed (Subtitle D) disposalpractice (e.g., landfills), since wastes previously land treated or managed in other ways may belandfilled (Subtitle D) to take advantage of the exemption from Subtitle C regulations. EPAevaluated the potential risk of increased landfilling as described in Sections 2.3.4 and 5.2.4.
Noningestion Risks from Groundwater Contamination. Commenters pointed out that theAgency ignored the noningestion risks arising from the use of contaminated groundwater. Suchrisks might arise from the inhalation of contaminants transferred to the air from showers, baths,etc. In response, EPA examined additional modeling approaches, as described in theSupplemental Background Document for Nongroundwater risk assessment pathways (USEPA,1997c). The description of the calculation of the combined risk is presented in Section 5.1.Details of the models used to estimate exposure factors for inhalation and dermal risk are givenin Section 6 of the Supplemental Background Document for Nongroundwater Risk Assessment(USEPA, 1997c).
Use of TCLP data that exceeds the Toxicity Characteristic. Commenters stated that EPAshould calculate risks from Subtitle D landfilling of residuals using only the data that do notexceed the Toxicity Characteristic level (40CFR261.24), because such wastes should be handledas hazardous. The analyses conducted in response to this comment can be found in Section 5.2.6,and the input data are discussed in Section 2.3.
1.2 WASTESTREAMS AND MANAGEMENT SCENARIOS
The groundwater pathway analysis involved evaluating land disposal of a total of 12listing wastestreams (Table 1.1) and 11 study wastestreams (Table 1.2). A complete descriptionof listing and study wastestreams is presented in the appropriate background documents (USEPA,1995a and USEPA, 1996a). Both single-wastestream disposal (baseline) and multi-wastestreamdisposal (codisposal) scenarios were evaluated. Table 1.1 presents a summary of the modeledlisting wastestreams and landfill modeling scenarios. The study wastestreams (Table 1.2) wereincluded only in the codisposal scenario.
1.3 REPORT ORGANIZATION

1-3
General technical approaches are outlined in Section 2. Detailed descriptions for thedeterministic and Monte Carlo scenarios are presented in Sections 3, and 4, respectively.Modeling results and exposure risk calculations are presented in Section 5.

1-4
Table 1.1 Petroleum Refining Listing Wastestreams and Landfill Scenarios.
Wastestream
Landfill Scenarios
SingleWastestream Codisposal
Baseline
On-site Off-site On-site Off-site
I. Crude Oil Tank Sludge x x
II. CSO Sludge x x x x
III. Unleaded Gasoline Tank Sludge x x x x
IV. Off-spec Product Fines (Coke Fines) x x x x
V. Sulfur Complex Sludge x x x x
VI. HF Alkylation Sludge x x x x
VII. H SO Alkylation Sludge x x2 4
VIII. Claus Catalyst x x
IX. SCOT Catalyst x x
X. Hydrotreating Catalyst x x
XI. Hydrorefining Catalyst x x
XII. FCC Catalyst & Fines x x x x

1-5
Table 1.2 Petroleum Refining Study Wastestreams.
Wastestream
Landfill Scenarios
SingleWastestream Codisposal
Baseline
On-site Off-site On-site Off-site
I. Desalting Sludge x
II. Extraction Clay x x
III. HF Treating Clay x x
IV. Isomerization Clay x x
V. Phosphoric Acid Catalyst x x
VI. Process Sludge-Residual Upgrade x
VII. Off-Spec Sulfur x x
VIII. Treating Clay from Clay-Filtering x x
IX. Hydrocracking Catalyst x x
X. Residual Oil Tank Sludge x x
XI. Dimersol Catalyst x
2-1
2.0 GENERAL METHODOLOGY
This section outlines the general methodology used in the groundwater pathway analysis.It includes: an overview of the modeling approach, modeling scenarios, and descriptions of thedata sources used in the analysis.
2.1 MODELING APPROACH
The groundwater pathway analysis determines the groundwater exposure concentrationsresulting from the release of waste constituents from the waste management unit into thesubsurface, and the subsequent fate and transport of the constituent, through the vadose zone andunderlying saturated zone. The exposure concentration is evaluated at the intake point of ahypothetical groundwater drinking water well, located at a specified distance from thedowngradient edge of the waste management unit. This well is referred to hereafter as the'receptor well'. The modeled subsurface pathway is depicted schematically in Figure 2.1. Themodeling approach may be divided into two major steps: (1) the release of waste constituents intothe subsurface, i.e., the model source term characterization, and (2) the fate and transport ofconstituents in the subsurface(in the vadose zone and the saturated zone). The modelingapproach for the groundwater pathway analysis involves aqueous phase migration of wasteconstituents. Considering that the wastes associated with petroleum refining operations maycontain a significant amount of non-aqueous phase liquids, i.e, “oil”, the potential may exist formigration of waste constituents via non-aqueous phase flow. However, an evaluation conductedfor the 1995 Analysis indicated that multiphase flow would not be expected to be a concern forthe wastestreams investigated. Laboratory analysis of petroleum waste samples also shows thatthe waste actually contains no or very little free flowing oil (USEPA, 1997a). Furthermore, it isvery likely that petroleum waste parcels are buffered by daily soil cover, and other waste parcelswith little or no free-flowing oil. For these reasons, the flow and transport in the vadose andsaturated zones are considered significant in the dissolved phase only, and the EPACMTP model(USEPA, 1996c) is appropriate for the modeling analyses.
In the ensuing subsections, details of the following are presented:
• The EPACMTP model;• Source-term modeling in the EPACMTP model;• Processes in subsurface fate and transport in the EPACMTP model; and• Monte Carlo simulation with a regional site-based approach using EPACMTP.
2.1.1 EPACMTP Model
EPACMTP (EPA’s Composite Model for Leachate Migration with TransformationProducts) (USEPA, 1995 a, b, c, d) is a computer simulation model for modeling the subsurfacefate and transport of contaminants leaching from a land disposal site, e.g., landfill, surfaceimpoundment, waste pile, or land application unit. Fate and transport processes accounted forin the model are: advection, hydrodynamic dispersion, linear or nonlinear sorption, and chained-decay reactions. In cases where degradation of a waste constituent yields daughter products that
2-2
are also of concern, EPACMTP has the capability to simulate the fate and transport of up to six(grand-)daughter products. The composite model consists of a one-dimensional module thatsimulates infiltration and dissolved constituent transport through the unsaturated zone, and whichis coupled to a three-dimensional saturated zone flow and transport module. The saturated zoneflow module accounts for the processes affecting the magnitude and direction of groundwaterf l o w s u c h a s l e a c h i n g f r o m

2-3
Figure 2.1 Schematic View of the Modeled Subsurface Pathway

2-4
the waste management unit and regional recharge. The saturated zone transport module accountsfor three-dimensional advection and dispersion, chained-decay reactions involving up to sevendifferent chemical species (i.e., parent compound and up to six daughter products), and linear ornonlinear equilibrium sorption. EPACMTP simulates steady state flow in both the unsaturatedzone and the saturated zone; contaminant transport can be either steady state or transient. Thesteady state modeling option is used for continuous source modeling scenarios; the transientmodeling option is used for finite source modeling scenarios, with optional accounting for sourcedepletion. EPACMTP predicts the contaminant concentration arriving at a down gradientgroundwater receptor well. This can be either a steady state concentration value, correspondingto the continuous source scenario, or a time-dependent concentration, corresponding to the finitesource scenario. In the latter case, the model can calculate either the peak concentration arrivingat the well, or a time averaged concentration, corresponding to a specified exposure duration, e.g.,a nine year average residence time. EPACMTP has the capability to perform Monte Carlosimulations to account for parametric uncertainty or variability. The flow and transport simulationmodules of EPACMTP are linked to a Monte Carlo driver which permits a probabilisticevaluation of uncertainty in model input parameters, as described by specified (joint) probabilitydistributions.
EPACMTP replaces the EPA’s Composite Model for Landfills (EPACML) which wasused in 1990 Toxicity Characteristic (TC) Rule (55FR11798). EPACMTP extends thecapabilities of the earlier EPACML model. The enhanced capabilities include accounting forthree-dimensional groundwater flow, the finite source and transformation products options, andcapability to simulate metals transport with nonlinear sorption isotherms through linkage with theMINTEQ geochemical speciation model. EPACMTP has been published in an internationalrefereed journal (Kool, Huyakorn, Sudicky, and Saleem, 1994). It also has been extensivelyreviewed. The SAB (USEPA's Science Advisory Board) commended the Agency for itssignificant improvements to the model. They also stated that it represents the state of the art forsuch analyses. However, they also encouraged additional validation studies, especially for themetals (USEPA, 1995c).
2.1.2 Contaminant Source Term Modeling
The release of contaminants into the subsurface constitutes the source term for the fate andtransport model. The conceptual differences between a landfill and other waste managementscenarios are reflected in how the model source term is characterized in different scenarios. Themodeled subsurface fate and transport processes are the same for each waste managementscenario. The contaminant source term for the EPACMTP fate and transport model is definedin terms of four primary parameters: (1) area of the waste unit, (2) leachate flux rate emanatingfrom the waste unit, (3) leachate concentration of each constituent, and (4) duration of theconstituent release. Information on the on-site waste unit areas was obtained from responses tothe 1992 RCRA §3007 Questionnaire of the Petroleum Refining Industry (1992 RCRA §3007Survey Database). The off-site unit areas were obtained from the USEPA Office of Solid Waste(OSW) Industrial Subtitle D Waste Management Facility Database (USEPA, 1996c;USEPA ,1997d). Leachate flux and contaminant release rates were determined as a function of the designand operational characteristics of the different waste management and wastestream characteristics

CL(t) C 0L e
I t
d Fw PwCW
CL
2-5
(1)
(waste quantities and waste constituent concentrations). The modeling approach related to thedesign and operational characteristics for landfills is as follows:
The modeled landfill is a Subtitle D industrial landfill which has an earthen cover, but noliner or leachate collection system. The leachate flux through the landfill is the result ofinfiltration of ambient precipitation through the landfill cover. Leachate flux rates used in theanalysis were determined using the HELP model (USEPA, 1996c and 1997d). The net infiltrationrate is calculated using a water balance approach, which considers, among other factors,precipitation, evapotranspiration, and surface run-off. The model was used to calculate landfillinfiltration rates for a representative Subtitle D landfill with 2-foot earthen cover, using climaticdata from 97 climatic stations located throughout the United States (USEPA, 1996c and 1997d).For the groundwater pathway analysis it is assumed that the landfill has a 20 year operational life,and that there are no losses due to volatilization while the landfill is in operation or due tomechanisms other than leaching after the landfill has been closed. The total amount of constituentin the landfill which is available for leaching is therefore given by the product of annual wastequantity disposed and constituent concentration in the waste, times 20 years. The 20-year timeframe was chosen as representative of the average operational life for a typical landfill wherepetroleum wastes are disposed. This time period is based on a median active life of petroleumwaste landfills (USEPA, 1997b) and on the average active lifetime of Municipal Subtitle Dlandfills (USEPA, 1988). In the groundwater pathway analysis it is assumed that each constituentinitially leaches at a concentration given by the TCLP concentration of that constituent in thewastestream being analyzed, with a gradual decrease in leaching concentration due to sourcedepletion (USEPA, 1996d). Assuming that all of the constituent mass in the waste mayeventually leach out, with linear equilibrium partitioning of the constituent into the aqueousphase, the leaching concentration follows an exponential decrease with time according to(USEPA, 1996d):
where:C (t) = Leachate concentration (mg/L) of a constituent at time tL
C = Initial leachate concentration (mg/L) of a constituentL0
C = Total concentration (mg/kg) of the constituent in the wasteW
I = Infiltration rate (m/y)d = Depth of waste unitF = Volume fraction of waste in the waste unitW
P = Density of the waste (kg/L)W
t = Time (y)
The volume fraction of waste in the unit, F , is given by 20 times annual waste volumew
divided by the total volume of the waste unit.
2.1.3 Processes in Subsurface Fate and Transport Modeling

2-6
The primary transport mechanisms in the subsurface are downward movement along withinfiltrating water in the vadose zone, and movement along with (ambient) groundwater flow inthe saturated zone. The advective movement in the unsaturated zone is one-dimensional, whilethe saturated zone module accounts for three-dimensional flow and transport. The model alsoconsiders mixing due to hydrodynamic dispersion in both the unsaturated and saturated zones.In the vadose zone, the flow is gravity-driven and prevails in the vertically downward directionn the vadose zone. Therefore, it is reasonable to model flow in the unsaturated zone as one-dimensional in the vertical direction. It is also assumed that transverse dispersion (bothmechanical dispersion and molecular diffusion) is negligible in the vadose zone. This assumptionis based on the fact that lateral migration due to transverse dispersion is negligibly smallcompared with the horizontal dimensions of waste management units. In addition, thisassumption is conservative because it allows the leading front of chemicals to arrive at the watertable relatively sooner, and in the case of finite source, with greater peak concentration.
Chemical constituents in the subsurface may be subject to a variety of bio-chemicaltransformation processes. EPACMTP accounts for transformations due to hydrolysis with first-order reaction kinetics. For those waste constituents which hydrolyze into toxic daughterproducts, the model also accounts for the formation and subsequent fate and transport ofhydrolysis products. However, none of the organic constituents considered in the presentanalysis are subject to breakdown by hydrolysis (Kollig et al., 1993; Washington, 1995).
Biodegradation may be a significant removal process for some of the constituentsconsidered in the analysis. However, biodegradation data obtained with methods that areconsistent with the USEPA’s protocol for measuring biodegradation rates exhibit inconsistentbehaviors (long lag time, short lag time, no degradation, etc.). Furthermore, the data are presentlynot adequately available so as to be implemented in the subsurface fate and transport model. Apreliminary evaluation of all available data and the documented anaerobic biodegradation studiesof benzene suggest that in-situ anaerobic biodegradation of benzene rates may be stronglydependent on site-specific conditions. These degradation-controlling site-specific conditions arecurrently not exactly known, and may be time-dependent. In addition, several field studies andlaboratory studies have revealed that benzene may be recalcitrant to anaerobic biodegradation(Krumholz et al., 1996; Salinitro, 1993). In the report by Krumholz et al. (1996), 12 of the totalof 15 field studies showed no biodegradation. Salinitro (1993) reported 2 of the total of 26 fieldstudies without biodegradation. The necessary conditions for anaerobic benzene biodegradationare poorly understood. The absence of biodegradation could be due to the presence of competingsubstrates, such as, toluene, xylenes, and ethylbenzene, as well as inadequate geochemicalconditions and lack of proper electron acceptors (nitrate, sulfate, iron, etc.). Therefore, becauseof the lack of information to correlate site-specific controlling factors to biodegradation, thelimited number of field data, and the field and laboratory evidence that benzene tends to berecalcitrant to anaerobic biodegradation, biodegradation of benzene is considered to be negligiblein the current groundwater pathway analysis.
The groundwater pathway analysis accounts for (linear) equilibrium sorption of wasteconstituents in the soil and aquifer. For organic constituents the partition coefficient (k) isd
calculated as the product of the constituent-specific organic carbon partition coefficient (k ), andoc
the fraction organic carbon (f )in the soil and aquifer. oc
2-7
Therefore, for a number of the metals analyzed (e.g., lead, chromium, mercury) theisotherms are highly nonlinear which adds considerably to the computational effort of the modelsimulations. For metals, the sorption isotherms used in the Monte Carlo analyses weredetermined using MINTEQA2 geochemical speciation model (USEPA, 1996e). These isothermsreflect varying subsurface geochemical conditions defined by four major geochemical parameters(pH, leachate organic matter, natural organic matter, and iron hydroxide absorbent). The valuesassigned to each of these parameters are allowed to vary over three ranges (low, medium, andhigh) to produce sorption isotherms representative of a wide range of subsurface geochemicalconditions. In the Monte Carlo analyses of metals, the sorption isotherms used were based onthe distributions of the four geochemical parameters.
For bounding and two high-end parameters analyses, partition coefficients (Ks) wered
calculated based on metal-specific empirical relationships between K and pH. The median pHd
values from the nationwide distribution was used to calculate Ks for metals.d
2.1.4 Regional Site-Based Modeling Approach
The regional, site-based, Monte Carlo approach option available in EPACMTP wasimplemented for the Petroleum Refining groundwater pathway analysis. In general, the receptorwell concentration downgradient from a waste management site is a function of the following:source (e.g., area, volume), design (e.g., cover, liner), climate (e.g. precipitation,evapotranspiration), hydrogeology (e.g., depth to groundwater, aquifer thickness, hydraulicconductivity, hydraulic gradient), receptor location (e.g. depth and downgradient distance andchemical specific properties (e.g. retardation and decay). The location, area and volume of thewaste management units used in the site-based approach represent the unit specific characteristicsof an actual waste management site; the climatic parameters (e.g. precipitation, evaporation) usedfor a given waste management unit are given by the climatic characteristics in the regionalvicinity of the unit. Using the source characteristics of actual waste management units whenpossible and the hydrogeologic characteristics based on actual hydrogeologic information insuresthat the within-site dependence between source terms and between hydrogeologic characteristicsis maintained.
The regional site-based approach attempts to approximate the ideal situation where aprobability sample of sites has a complete description of the characteristics needed to estimatethe site’s receptor well concentration. This approach uses the site location to place the sitewithin one of 13 hydrogeologic regions, (USEPA, 1996c; USEPA, 1997d) to define the site’shydrogeologic parameters and within one of 97 climatic regions (USEPA, 1996c; USEPA,1997d), thereby defining the site’s climatic parameters.
The following step-by-step procedure is used to implement the regional site-basedapproach in EPACMTP (these steps are discussed in detail for the present petroleum refininggroundwater pathway analysis in Section 4 of this document):
Step 1: Waste Site Selection. This step involves selecting a site at random,from the list of waste management facilities. The facility informationincludes location and for on-site landfills, area and volume. For off-site

2-8
landfills, an area and volume are selected at random from the OSWIndustrial Subtitle D Waste Management Facility Database (USEPA, 1996c;USEPA, 1997d).
Step 2: Generate Recharge and Infiltration for Selected Waste Site .Given the waste site’s location, the climatic region in which the site islocated can be identified and the corresponding precipitation andevaporation values specified. The precipitation and evaporation values forthe site are used together with the soil (and cover type for landfills) of theunit to derive the recharge and infiltration values of the site. The soil andlandfill cover types used at the sites are generated from a national jointprobability distribution described in USEPA 1996c and 1997d.
Step 3: Generate Hydrogeologic Variables for Selected Site in OS WIndustrial Subtitle D Facility Database. Given the facility location, theUSGS groundwater resources inventory maps (USGS, 1985) are used toidentify the aquifer type for the site. The hydrogeologic parameters for thesite are determined by using the characteristics of a groundwaterinvestigation site selected at random from the Hydrogeologic Database(API, 1989; Newell et al.,1990) for the corresponding hydrogeologicenvironment. If the selected groundwater parameter set is missing anyvalues, a joint distribution of the parameters derived for each region is usedto fill in the missing values.
Step 4: Generate Remaining Parameters for Selected Waste Site. Theremaining parameters for the waste site (e.g. x, y, and z coordinates of thereceptor well) are generated by using nationwide distributions based on datacompiled by the USEPA from across the USA (USEPA, 1997d). Themedian and high end values of x, y, and z are given in Appendix C with theTwo high-end parameter sensitivity analysis input parameters.
Step 5: Calculate the Receptor Well Concentration Value for SelectedWaste Site. Given the site data, hydrogeologic characteristics, and receptorwell location generated in the previous four steps, and the chemical-specificcharacteristics, the groundwater transport model is used to compute thereceptor well concentration value for the site.
Step 6: Repeat Steps 1-5 N (10,000) Times (N is a predetermine dnumber of Monte Carlo iterations or parameter realizations based ona convergence test) and Estimate the National Distribution of ReceptorWell Concentrations. After Step 5, the receptor well concentration valuefor a specific realization is obtained. The process is repeated to yield N(10,000) values which represent the nationwide distribution of drinkingwater exposure concentrations. Given this distribution and the drinkingwater standards for the waste, the groundwater exposure risk can be

2-9
calculated for any level of protection (e.g. 85-th percentile, 90-th percentile,95-th percentile).
A flow chart of the above procedure is shown in Figure 2.2.
2.2 MODELING SCENARIOS AND INPUT DATA
All of the modeling scenarios performed for the Petroleum Refining GroundwaterPathway Analysis, including the 1995 analyses are summarized in Table 2.1. Completedescriptions of each current analysis are presented in Sections 3 and 4 and the results arepresented in Section 5. The 1995 Petroleum Refining Groundwater Pathway AnalysisBackground Document includes complete descriptions of the previous analyses conducted in1995 (USEPA, 1995d).
Additional modeling analysis have been performed to further enhance the results of the1995 Petroleum Refining Groundwater Pathway Analysis. The analyses included additionaldeterministic high-end analyses (Section 3) and several Monte Carlo scenarios (Section 4). Priorto performing the Monte Carlo simulations , waste constituents were screened based on the 1995bounding analysis (USEPA, 1995d). Then, Monte Carlo analyses were performed for wasteconstituents not eliminated in the bounding analysis. Both the deterministic and Monte Carloanalyses include both single-wastestream baseline scenarios and multi-wastestream codisposalscenarios. For the multi-wastestream codisposal scenario, discussed further in Section 2.2.3, totalcodisposed 20-year petroleum waste quantities at each landfill were modeled based on the medianactive lifetime of 20 years for Subtitle D landfills (USEPA, 1997b). Volume weighted waste andleachate concentrations were calculated for both benzene and arsenic to estimate a representativeeffective leachate rate and an effective waste concentration for the landfills. Volume weightingof the input parameters was determined to be the most representative method for combining theconcentration data. Other additional modeling considerations included a contingent CSOmanagement scenario (Section 2.2.4) and TC Rule limitations on waste leachate concentrations(in all scenarios; Section 2.2.5). The source term input parameters (e.g. waste quantity, landfillsize, waste concentration, and leachate concentration) used for modeling were obtained fromresponses to the RCRA §3007 Survey (1992 RCRA §3007 Survey Database) and the USEPARecord Sampling (USEPA, 1995a) and are provided in Appendices A and B. The parametersobtained from the OSW hydrogeological modeling database are listed in the EPACMTPBackground Document (USEPA, 1996c).

2-10
Figure 2.2 Flowchart of EPACMTP for the Regional Site-Based Monte Carlo Approach.

2-11
Table 2.1 Petroleum Refining Modeling Analyses Performed in 1995 and 1996
Year Analysis DescriptionPrevious See 1995 Background Document (USEPA, 1995d)Sensitivity
Previous See 1995 Background Document (USEPA, 1995d)Bounding Analysis
Previous See 1995 Background Document (USEPA, 1995d)High-End Parameter Analysis
Previous See 1995 Background Document (USEPA, 1995d)Central Tendency
Previous See 1995 Background Document (USEPA, 1995d)Biodegradation SensitivityAnalysis
Previous See 1995 Background Document (USEPA, 1995d)Multiphase Transport
Current Used actual 1992 waste volumes. Direct Risk, Total RiskRevised Two High-EndParameters Analyses for Sulfur Complex Sludge, andUnleaded Gasoline TankSludge.
and TC rule limited results reported for wastestreams notconsidered in sensitivity analyses.
Current All quantities of CSO Sludge generated in 1992 wereContingent CSO - Two High-End Parameter modeled with the exclusion of wastes recycled on-site in
refinery processes, waste transferred for use as fuel, andwaste used in an on-site industrial furnace.
Current Benzene and Arsenic transport modeled using volumeCodisposal - Two High-EndParameters Analyses weighted average concentrations, 90-th percentile areas,
and net 50-th percentile waste volumes. Hydrotreating andhydrorefining were excluded and analyses were performedboth with and without hydrocracking catalyst.
Current Deterministic sensitivity analyses using data statistics toSensitivity Analysis forHydrotreating and Hydrorefining Catalysts,HF Alkylation Sludge,Crude Oil Tank SludgeCSO Sludge (contingent andnon-contingent), and Off-Spec. Products and Fines
determine two high-end parameters.
Current All wastes stream constituents not bounding out in 1995Baseline - Monte CarloBounding analysis. For all Wastestreams excepthydrotreating and hydrorefining, all Subtitle D wastes weremodeled and correlated to landfill locations. Forhydrotreating and hydrorefining, all non-Subtitle C wastequantities were correlated to landfill locations and onelandfill was selected for each realization.
Current All quantities of CSO Sludge generated in 1992 wereContingent CSO - MonteCarlo modeled with the exclusion of wastes recycled on-site in
refinery processes, waste transferred for use as fuel, andwaste used in an on-site industrial furnace.

2-12
Year Analysis Description
Current Benzene and Arsenic transport modeled for onCodisposal - MonteCarlo and off-site codisposal considering all petroleum
landfills in Monte Carlo simulation. Hydrotreating and hydrorefining catalystsexcluded. Considered both with and withouthydrocracking catalyst and TC Rule limit.
The following are described in subsections:
• Data sources;• Hydroprocessing waste data;• Multi Waste Stream Codisposal; • Contingent CSO sludge management data; and• Maximum TCLP data for TC-Rule constrained waste management.• Off-Spec Products and Fines TCLP Data
2.2.1 Data Sources
Model input data pertaining to waste quantities and density, waste management scenarios and wasteunit information (e.g., area, volume; Appendix B) based on responses to the RCRA §3007 Survey of thePetroleum Refining Industry (1992 RCRA §3007; USEPA, 1995a). Waste quantities managed bypetroleum refineries in on- and off-site landfills in 1992 and on-site waste unit information were providedin responses to the survey. For all wastestreams except hydrotreating catalysts, hydrorefining catalysts,and clarified slurry oil sediment (contingent management) the modeled waste quantities were based onannual 1992 Subtitle D landfill management (see sections 2.2.2 and 2.2.4 below for a discussion of themodeled waste quantities for those waste streams).
For waste managed in off-site landfills the following information provided in the RCRA §3007Survey Database was used for the modeling analysis: the off-site landfill location, waste quantity managedin the off-site landfill in 1992 and a limited number of waste density values. For waste managed in on-sitelandfills, waste unit area and waste height were also available in addition to the 1992 waste quantity anddensity values (1992 RCRA §3007). Again, off-site waste unit areas and depths were obtained from theOSW database of industrial Subtitle D landfills (USEPA 1996c; USEPA, 1997d). Waste density valueswere available for only a limited number of locations and since density is relatively non-varying comparedto other parameters in the analysis, average on-site and average off-site density values were used in theanalysis. On-site waste unit information, 20-year waste quantity, and average on-site density values arelisted for each modeled wastestream in Table B.1, Appendix B. Off-site 20-year waste volumes andaverage off-site densities are listed in Table B.2, Appendix B.
Information on wastestream composition, including waste concentrations and TCLP leachingconcentrations, were obtained from record sampling data collected by the USEPA from each of thewastestreams investigated, as part of the Listing Determination (USEPA, 1995a). Leachate concentrationsfor all constituents in landfills are presented in Appendix A.
The 1992 RCRA §3007 Survey responses provided limited data on hydrogeological setting at thewaste management unit locations (1992 RCRA §3007). Available information for on-site waste
2-13
management units was restricted to waste unit size (area and depth), geographical location of the unit, depthto groundwater and distance to the nearest drinking water well. However, the depth to groundwater andnearest drinking water well distance data available in the RCRA §3007 Database were not used in thismodeling analysis because the hydrogeological data set was not complete. Well distances were notreported for approximately one-half of the refinery sites and the well distances that were provided in the§3007 responses were much larger than the median value in the OSW Industrial Subtitle D WasteManagement Facility Database (e.g. an average of 2,600 meters versus a median value of 430 meters inthe OSW database; 1992 RCRA §3007; USEPA, 1997d). In a number of cases the unsaturated zone andsaturated zone thicknesses were given as a range of values indicating that the value was estimated ratherthan directly measured (e.g. 0 - 40 feet). For these reasons the OSW Database (USEPA, 1997d) and APIHydrogeological Database (API, 1989; Newell et al., 1990; USEPA, 1997d)) were deemed to be morereliable sources of data for the hydrogeological parameters. The hydrogeological parameters from the APIdatabase are not selected from arbitrary nationwide distributions rather they are site based and correlatedto the aquifer type located at the site.
For off-site units, the survey provided only the waste management unit location. The Monte CarloOSW hydrogeological modeling database which is incorporated into EPACMTP (USEPA, 1996c and1997d) was therefore used to obtain values for missing parameters. Data on constituent-specific k values,oc
as well as metals sorption isotherms, were also obtained from the OSW data base (USEPA, 1996c and1997d).
2.2.2 Hydroprocessing Waste
Information provided by catalyst reclaimers indicates that because of the depressed metals markets,landfilling of catalysts is becoming significantly more cost-effective than reclamation. EPA predicts thatif the risk assessment modeling shows no basis for listing hydroprocessing catalysts, landfilling willcontinue to increase in the future. Because of this trend, the Agency made the decision to also perform themodeling analysis using the entire distribution of waste volumes reported in 1992 (excluding volumesreported to go to Subtitle C management) for hydroprocessing wastes (hydrotreating, hydrorefining, andSCOT catalysts) rather than just the quantities reported to be managed in Subtitle D units (USEPA, 1995a).The total quantity of hydroprocessing waste generated by each refinery was compiled including recycled,reclaimed and stored waste (Subtitle C landfill waste quantities were excluded). For the on-site landfillanalysis, each refinery’s total hydroprocessing waste was modeled as disposed in the on-site landfill. Onlyrefineries reporting on-site landfills were included in the data set to be modeled. In the case of off-sitelandfills, each refinery’s total hydroprocessing waste was modeled as disposed at either the nearest off-sitelandfill or at an off-site landfill known to have received waste from that refinery based on otherwastestream data. The 20-year non-Subtitle C landfill waste quantities modeled for hydroprocessingwastes are listed in Tables B.1 and B.2, Appendix B (1992 RCRA §3007 Database).
2.2.3 Multi Waste Stream Codisposal
In response to comments, the Agency has evaluated the potential groundwater exposuresdue to the impact of codisposal of multiple wastestreams. For the multi-wastestream codisposalscenario, total codisposed 20-year petroleum waste quantities at each landfill were modeled basedon the median active lifetime of 20 years for Subtitle D landfills (USEPA, 1997b). Volumeweighted waste and leachate concentrations were calculated for both benzene and arsenic toestimate a representative effective leachate rate and an effective waste concentration for thelandfills. Volume weighting of the concentration data was determined to be the mostrepresentative method for combining the concentration data of the individual codisposedwastestreams. The rationale is presented below.
CLid Fh In
J 1AJ d Fh I
n
J 1AJ CLJi
CLi
n
J 1VJ CLJi
n
J 1VJ
CLJi
CLJ
AJ d Fh
2-14
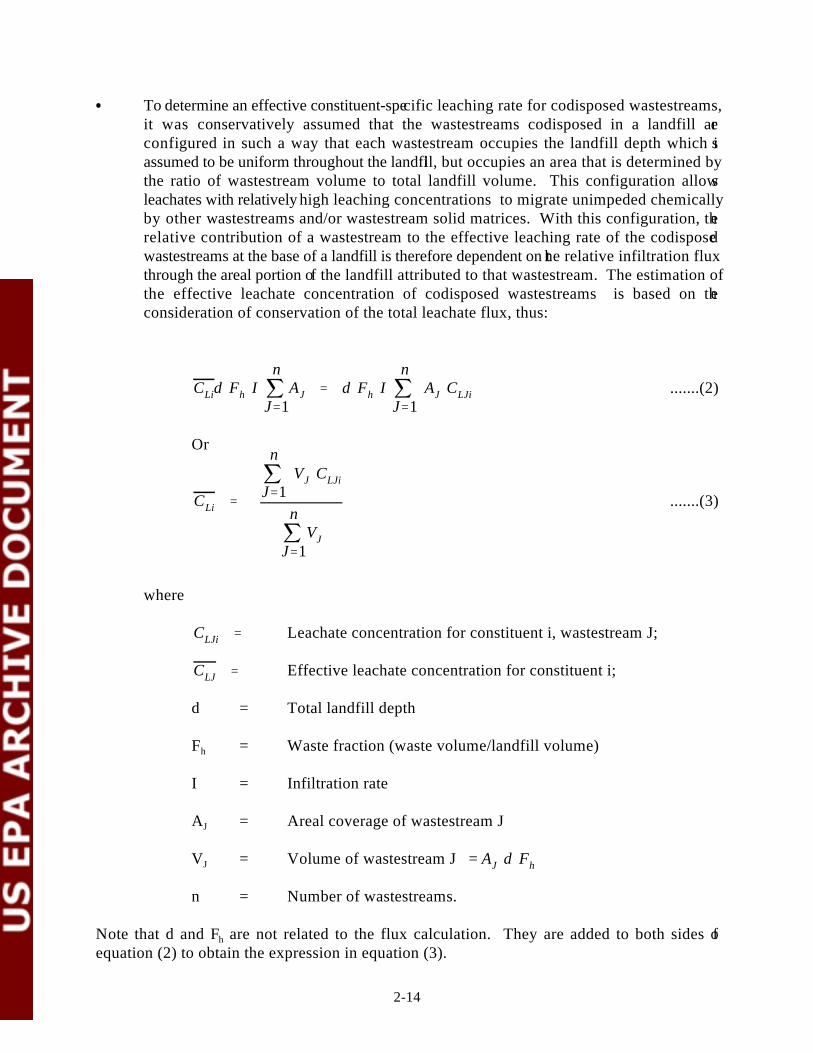
To determine an effective constituent-specific leaching rate for codisposed wastestreams,it was conservatively assumed that the wastestreams codisposed in a landfill areconfigured in such a way that each wastestream occupies the landfill depth which isassumed to be uniform throughout the landfill, but occupies an area that is determined bythe ratio of wastestream volume to total landfill volume. This configuration allowsleachates with relatively high leaching concentrations to migrate unimpeded chemicallyby other wastestreams and/or wastestream solid matrices. With this configuration, therelative contribution of a wastestream to the effective leaching rate of the codisposedwastestreams at the base of a landfill is therefore dependent on the relative infiltration fluxthrough the areal portion of the landfill attributed to that wastestream. The estimation ofthe effective leachate concentration of codisposed wastestreams is based on theconsideration of conservation of the total leachate flux, thus:
.......(2)
Or
.......(3)
where
Leachate concentration for constituent i, wastestream J;
Effective leachate concentration for constituent i;
d = Total landfill depth
F = Waste fraction (waste volume/landfill volume)h
I = Infiltration rate
A = Areal coverage of wastestream JJ
V = Volume of wastestream J = J
n = Number of wastestreams.
Note that d and F are not related to the flux calculation. They are added to both sides ofh
equation (2) to obtain the expression in equation (3).

CWi
n
J 1
sJ(1 J)
s(1 )
VJ
n
J 1VJ
CWJi
CWi
n
J 1VJ CWJi
n
J 1VJ
CWJi
CWJ
s(1 ) (1 J) sJ
(1 J) sJ
2-15
Following the above wastestream configuration assumption, the effective constituent-specific waste concentration may be determined based on the mass conservationconsideration:
.......(4)
where
Leachate concentration for constituent i, wastestream J;
Effective leachate concentration for constituent i;
= Density of dry waste solid of wastestream JsJ
= Porosity of wastestream JJ
n = Number of wastestreams.
= mean of
The waste solid density and porosity are not exactly known; however, the product is very close to the reported wet waste density which does not vary
significantly. Therefore, it may be inferred that the density- and porosity-related ratio isclose to unity whereas the volume ratio may vary over a few orders of magnitude. Basedon this reasoning, the effective waste concentration may be approximated by:
.......(5)
2-16
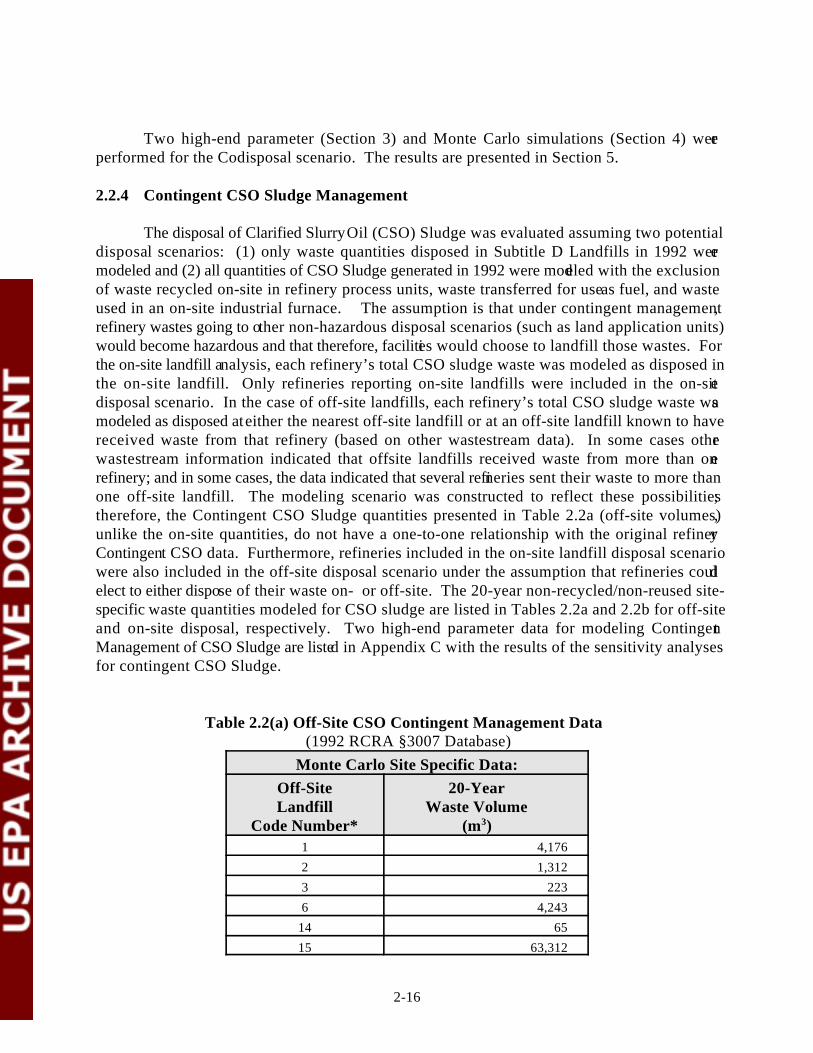
Two high-end parameter (Section 3) and Monte Carlo simulations (Section 4) wereperformed for the Codisposal scenario. The results are presented in Section 5.
2.2.4 Contingent CSO Sludge Management
The disposal of Clarified Slurry Oil (CSO) Sludge was evaluated assuming two potentialdisposal scenarios: (1) only waste quantities disposed in Subtitle D Landfills in 1992 weremodeled and (2) all quantities of CSO Sludge generated in 1992 were modeled with the exclusionof waste recycled on-site in refinery process units, waste transferred for use as fuel, and wasteused in an on-site industrial furnace. The assumption is that under contingent management,refinery wastes going to other non-hazardous disposal scenarios (such as land application units)would become hazardous and that therefore, facilities would choose to landfill those wastes. Forthe on-site landfill analysis, each refinery’s total CSO sludge waste was modeled as disposed inthe on-site landfill. Only refineries reporting on-site landfills were included in the on-sitedisposal scenario. In the case of off-site landfills, each refinery’s total CSO sludge waste wasmodeled as disposed at either the nearest off-site landfill or at an off-site landfill known to havereceived waste from that refinery (based on other wastestream data). In some cases otherwastestream information indicated that offsite landfills received waste from more than onerefinery; and in some cases, the data indicated that several refineries sent their waste to more thanone off-site landfill. The modeling scenario was constructed to reflect these possibilities;therefore, the Contingent CSO Sludge quantities presented in Table 2.2a (off-site volumes),unlike the on-site quantities, do not have a one-to-one relationship with the original refineryContingent CSO data. Furthermore, refineries included in the on-site landfill disposal scenariowere also included in the off-site disposal scenario under the assumption that refineries couldelect to either dispose of their waste on- or off-site. The 20-year non-recycled/non-reused site-specific waste quantities modeled for CSO sludge are listed in Tables 2.2a and 2.2b for off-siteand on-site disposal, respectively. Two high-end parameter data for modeling ContingentManagement of CSO Sludge are listed in Appendix C with the results of the sensitivity analysesfor contingent CSO Sludge.
Table 2.2(a) Off-Site CSO Contingent Management Data (1992 RCRA §3007 Database)
Monte Carlo Site Specific Data:Off-Site 20-YearLandfill Waste Volume
Code Number* (m )3
1 4,1762 1,3123 2236 4,243
14 6515 63,312

Monte Carlo Site Specific Data:Off-Site 20-YearLandfill Waste Volume
Code Number* (m )3
2-17
16 1,89218 13,51419 2,55821 1,35122 2,27023 42,47325 39,32426 2,36535 23637 8,85138 81,13539 81140 1442 3,79745 8,85146 77,37847 8,36550 2,02752 5,64753 3,43261 13,51463 2,36567 85,62269 42,473
Table 2.2(b) On-Site CSO Contingent Management Data(1992 RCRA §3007 Database)
Monte Carlo Site Specific Data:On-Site 20-YearLandfill Waste Volume
Code Number* (m )3
1 3,3783 8,3655 2,270
11 1,40412 81113 1,751
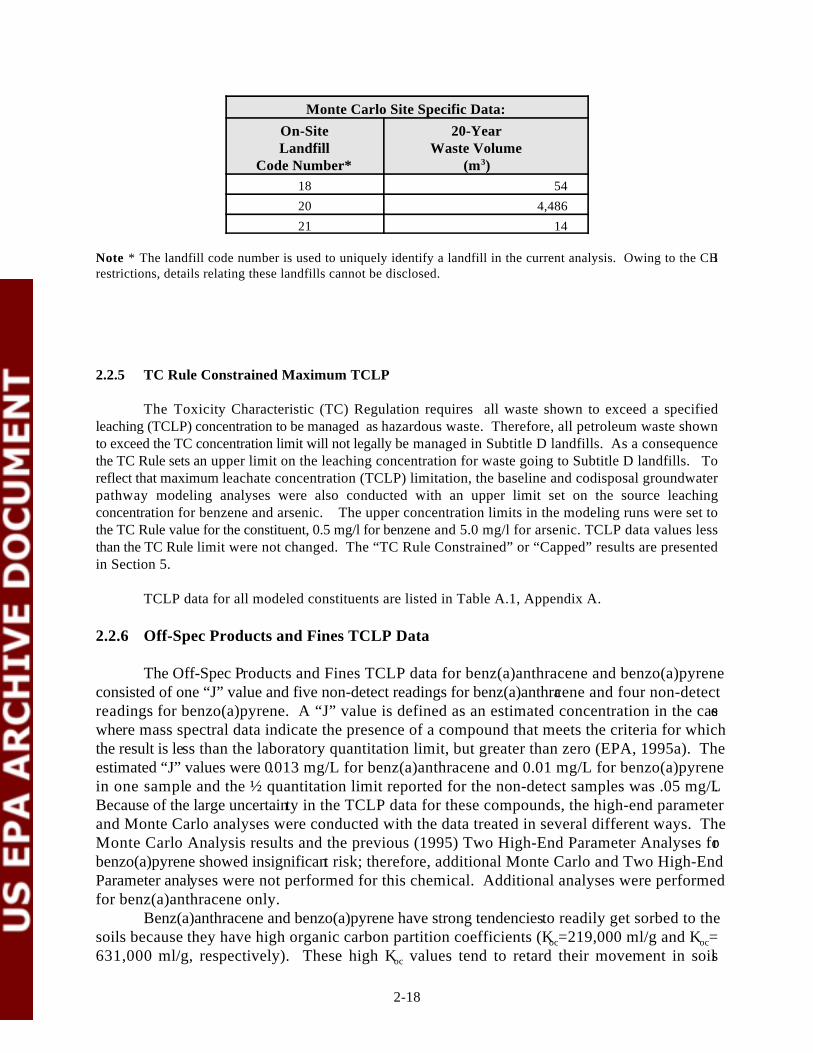
Monte Carlo Site Specific Data:On-Site 20-YearLandfill Waste Volume
Code Number* (m )3
2-18
18 5420 4,48621 14
Note * The landfill code number is used to uniquely identify a landfill in the current analysis. Owing to the CBIrestrictions, details relating these landfills cannot be disclosed.
2.2.5 TC Rule Constrained Maximum TCLP
The Toxicity Characteristic (TC) Regulation requires all waste shown to exceed a specifiedleaching (TCLP) concentration to be managed as hazardous waste. Therefore, all petroleum waste shownto exceed the TC concentration limit will not legally be managed in Subtitle D landfills. As a consequencethe TC Rule sets an upper limit on the leaching concentration for waste going to Subtitle D landfills. Toreflect that maximum leachate concentration (TCLP) limitation, the baseline and codisposal groundwaterpathway modeling analyses were also conducted with an upper limit set on the source leachingconcentration for benzene and arsenic. The upper concentration limits in the modeling runs were set tothe TC Rule value for the constituent, 0.5 mg/l for benzene and 5.0 mg/l for arsenic. TCLP data values lessthan the TC Rule limit were not changed. The “TC Rule Constrained” or “Capped” results are presentedin Section 5.
TCLP data for all modeled constituents are listed in Table A.1, Appendix A.
2.2.6 Off-Spec Products and Fines TCLP Data
The Off-Spec Products and Fines TCLP data for benz(a)anthracene and benzo(a)pyreneconsisted of one “J” value and five non-detect readings for benz(a)anthracene and four non-detectreadings for benzo(a)pyrene. A “J” value is defined as an estimated concentration in the casewhere mass spectral data indicate the presence of a compound that meets the criteria for whichthe result is less than the laboratory quantitation limit, but greater than zero (EPA, 1995a). Theestimated “J” values were 0.013 mg/L for benz(a)anthracene and 0.01 mg/L for benzo(a)pyrenein one sample and the ½ quantitation limit reported for the non-detect samples was .05 mg/L.Because of the large uncertainty in the TCLP data for these compounds, the high-end parameterand Monte Carlo analyses were conducted with the data treated in several different ways. TheMonte Carlo Analysis results and the previous (1995) Two High-End Parameter Analyses forbenzo(a)pyrene showed insignificant risk; therefore, additional Monte Carlo and Two High-EndParameter analyses were not performed for this chemical. Additional analyses were performedfor benz(a)anthracene only.
Benz(a)anthracene and benzo(a)pyrene have strong tendencies to readily get sorbed to thesoils because they have high organic carbon partition coefficients (K =219,000 ml/g and K =oc oc
631,000 ml/g, respectively). These high K values tend to retard their movement in soilsoc

2-19
significantly. Therefore, they tend not to show up in ground water or have very lowconcentrations in groundwater.
2.3.5.1 Monte Carlo Distributed Data
For the Monte Carlo Analysis, distributions consisting of individual data values aretypically used. However, the TCLP data were used in two different ways for these wastes.
1. The “J” value was assumed to be the only reliable data point and it was used to representa fixed value for the TCLP concentration of benz(a)anthracene. Other parameters werevaried as before in the Monte Carlo Analyses.
2. The “J” value of 13 ppb was used with the five ½ quantitation limit values of 50 ppb toconstruct a leachate distribution.
2.3.5.2 High-End Parameter Data
The TCLP data were handled in two different ways for conducting the high-end parametersensitivity analysis:
1. In the first case the “J” value was assumed to be the only reliable data point and it wasassumed to represent the mean or expected value of the TCLP for benz(a)anthracene inoff-spec products and fines. The sensitivity analysis was therefore conducted todetermine the two high-end parameters for off-spec products and fines.
2. In the second case the “J” value was assumed to be the maximum or high-end TCLPvalue and the sensitivity analysis was therefore conducted to determine one other high-end parameter for the two high-end parameter analyses.
The results for the Off-Spec Products and Fines analysis are presented in Table 5.8.

3-1
3.0 DETERMINISTIC GROUNDWATER PATHWAY ANALYSES
3.1 BOUNDING ANALYSES
A bounding analysis was performed in the 1995 groundwater pathway modeling analysisto eliminate from further consideration those wastestreams and/or waste constituents which evenunder worst-case conditions do not show risk or HBN exceedance in groundwater (USEPA,1995d). According to EPA’s Guidance on Risk Characterization (USEPA, 1992), boundingestimates are intended to purposely overestimate the exposure or dose in an actual population forthe purpose of developing a statement that, the risk is “not greater than the results of theanalysis”. Therefore those constituents not posing risk in the bounding analysis can be eliminatedfrom further consideration.
The bounding analysis consisted of deterministic EPACMTP groundwater transport runswith sensitive modeling parameters set to high end values and the remaining parameters set tomedian values. Assignment of parameters in the bounding analysis was as follows: the leachateconcentration of each waste constituent was set to its maximum TCLP value; the waste unit area,infiltration rate, waste quantity, landfill waste fraction and waste concentration were set to their90-th percentile values, and the receptor well was placed on the plume centerline, at the 10-thpercentile of the down gradient distance and depth. Other parameters were set to their medianvalues. In addition, the source depletion option was not used in the bounding analysis. Instead,the release of the waste constituents were modeled as a pulse with constant concentration equalto the maximum measured TCLP for the waste constituent. The peak receptor well concentrationwas used for both carcinogenic and non-carcinogenic constituents.
Single-wastestream baseline analyses were then performed in the 1996 Monte CarloGroundwater Pathway Analyses for all wastestreams and waste constituents that showed risk inthe 1995 bounding analysis, i.e., if the HBN of a waste constituent was exceeded in the boundinganalysis, the single-wastestream baseline analysis was performed for that waste constituent (seeSection 5.1).
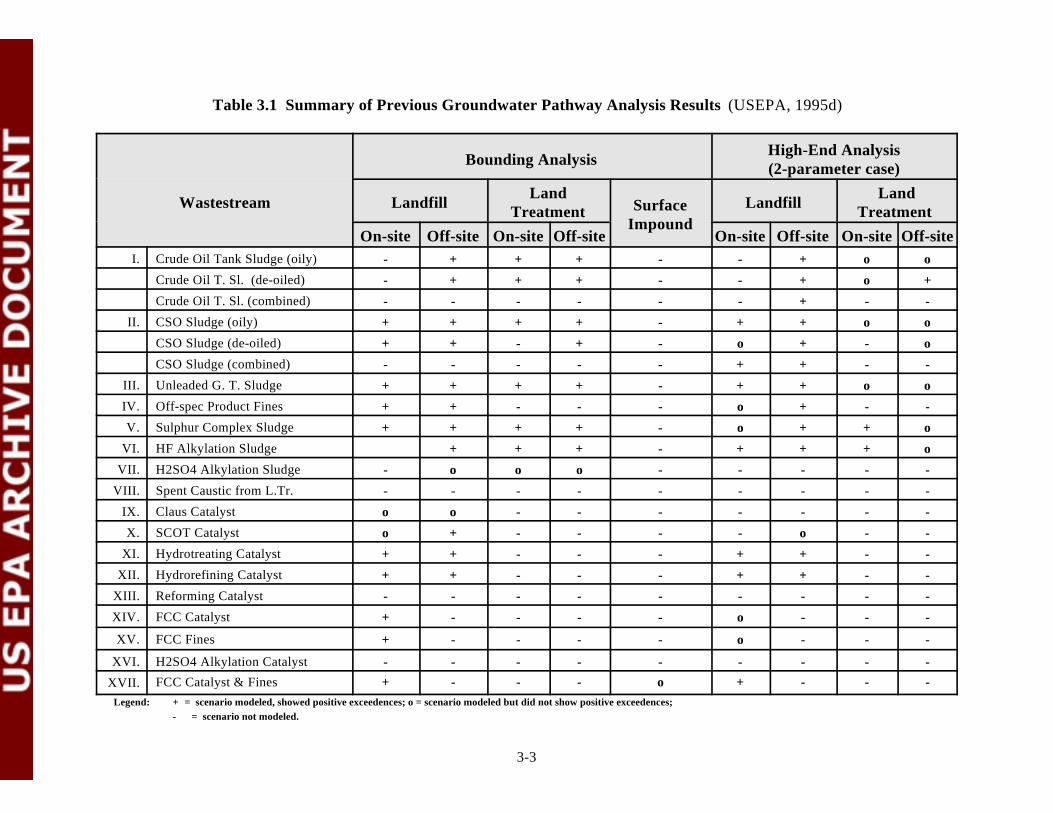
Qualitative results of the bounding analysis are shown in Table 3.1. The quantitativeresults are given in detail in the 1995 Groundwater Pathway Background Document, AppendixC (USEPA, 1995d).
3.2 TWO HIGH-END PARAMETERS BASELINE ANALYSES
According to EPA’s Guidance on Risk Characterization, “The high end risk descriptor isa plausible estimate of the individual risk for those persons at the upper end of the riskdistribution. The intent of this descriptor is to convey an estimate of risk in the upper range ofthe distribution, but to avoid estimates which are beyond the true distribution. Conceptually, highend risk means risks above the 90-th percentile of the population distribution, but not higher thanthe individual in the population who has the highest risk” (USEPA, 1992). If limited informationon the distribution of exposure or dose factors is available, the high-end can be estimated byidentifying the most sensitive parameters and using maximum or near-maximum values for one

3-2
or two of these variables, leaving other at their mean values. (USEPA, 1992). In order to identifythe most sensitive parameters for performing a high-end analysis in the 1995 groundwaterpathway analysis, a sensitivity analysis was conducted on crude oil tank sediment (USEPA,1995d) to determine the most sensitive waste source and receptor well parameters. This analysiswas conducted by individually varying the source and well location parameters from 50-th to 90-th percentile values, and ranking them in terms of the corresponding change in predicted receptorwell concentration. For the subsequent 1995 two high-end parameter groundwater impactanalysis, the two most sensitive parameters were set to their 90-th percentile values, while theremaining model parameters were all kept at median values.
3-3
Table 3.1 Summary of Previous Groundwater Pathway Analysis Results (USEPA, 1995d)
Wastestream
Bounding Analysis High-End Analysis(2-parameter case)
Landfill LandfillLand Land Treatment Treatment Surface
ImpoundOn-site Off-site On-site Off-site On-site Off-site On-site Off-site
I. Crude Oil Tank Sludge (oily) - + + + - - + o o
Crude Oil T. Sl. (de-oiled) - + + + - - + o +
Crude Oil T. Sl. (combined) - - - - - - + - -
II. CSO Sludge (oily) + + + + - + + o o
CSO Sludge (de-oiled) + + - + - o + - o
CSO Sludge (combined) - - - - - + + - -
III. Unleaded G. T. Sludge + + + + - + + o o
IV. Off-spec Product Fines + + - - - o + - -
V. Sulphur Complex Sludge + + + + - o + + o
VI. HF Alkylation Sludge + + + - + + + o
VII. H2SO4 Alkylation Sludge - o o o - - - - -
VIII. Spent Caustic from L.Tr. - - - - - - - - -
IX. Claus Catalyst o o - - - - - - -
X. SCOT Catalyst o + - - - - o - -
XI. Hydrotreating Catalyst + + - - - + + - -
XII. Hydrorefining Catalyst + + - - - + + - -
XIII. Reforming Catalyst - - - - - - - - -
XIV. FCC Catalyst + - - - - o - - -
XV. FCC Fines + - - - - o - - -
XVI. H2SO4 Alkylation Catalyst - - - - - - - - -
XVII. FCC Catalyst & Fines + - - - o + - - -Legend: + = scenario modeled, showed positive exceedences; o = scenario modeled but did not show positive exceedences;
- = scenario not modeled.
3-4
3.2.1 1995 Proposal Results
The modeling results presented in the 1995 petroleum refining waste listing determinationrule proposal were the results of the 1995 two high-end parameter modeling analysis. For the twohigh-end parameter analysis, the two most sensitive parameters were set to their respective 90-thpercentile values. The selection of the two high-end parameters was as follows for the landfilland land treatment scenarios:
Landfill: Waste Unit Area Distance to Well
Land treatment unit: Waste Unit Area Waste Quantity
It should be noted that in the case of the distance-to-well, the high-end value corresponds to the10-th, rather than the 90-th percentile of the distribution, i.e., a closer well will result in a moreconservative assessment. The waste fraction that was used in the modeling analysis wascalculated as the ratio of the median 20-year wastestream volume and the mean landfill volume.The mean landfill volume was chosen because its value was generally intermediate between the50-th and 90-th percentile values, yielding a corresponding intermediate value for the wastefraction which was kept constant. The consequence of the parameter values used is that themodeled waste volume was derived from the pre-determined waste fraction. For mostwastestreams, the modeled waste quantity used in the high-end analysis exceeded the actualmedian value of the reported wastestream volume, but under-estimated the median wastestreamvolume in the central tendency case.
In the single parameter high-end case, the single most sensitive variable was assigned toits 90-th percentile value, while all other model parameters were set to median values. Thisvariable was the waste unit area for both landfills and land treatment units. In the high-endanalysis the source depletion option was used for the landfill scenario. The receptor well wasplaced at half-way between the plume centerline and the lateral extent of the contaminant plume.In the evaluation of groundwater exposure concentrations, the 9-year maximum averageconcentration was used for carcinogens, and the peak concentration for non-carcinogens. Cancerrisks and health-based number (HBN) exceedances for the high-end analysis are shown inSection 5 (Table 5.1 Summary of Groundwater Pathway Analysis Results) along with the revisedtwo high-end parameter analysis results (see Section 3.2.2).
3.2.2 Revised Two High-End Parameters Analyses
In the 1995 Two High-End Parameters Analysis, the waste fraction was defined as theratio between the median 20-year wastestream volume and the mean landfill volume, while the20-year waste volume was treated as a derived parameter in the modeling (USEPA, 1995d).Consequently, as mentioned above, for most wastestreams the modeled waste volume was greaterthan actual 50th percentile waste volume. In response to comments on the 1995 Proposal mostof the wastestreams were reanalyzed using the reported 1992 waste volumes in detailedsensitivity analyses (Section 3.2.3). In addition, the 1995 Two-High End Parameter Scenario was

3-5
reanalyzed for two listing wastestreams, for which a detailed Two Parameter sensitivity was notperformed (Sulfur Complex Sludge and Unleaded Gasoline Tank Sludge) using the reportedwaste volumes from the 1992 RCRA §3007 Survey (USEPA, 1995a). Table 3.2 shows acomparison between the waste volumes derived in the 1995 Proposal Groundwater Analysis andthe reported waste volumes used in the revised Two High-End Parameters analysis. In the caseof On-Site Unleaded Gasoline Tank Sludge the modeled waste quantity was less than the 1992RCRA §3007 reported waste quantity (USEPA, 1995a). For the Off-Site Unleaded GasolineTank Sludge and Off-Site Sulfur Complex Sludge the modeled waste quantities were greater thanthe reported values (USEPA, 1995a: Table 3.2). A comparison between the 1995 groundwaterrisk results and the revised results are shown in Section 5 (Tables 5.1, 5.2, and 5.3).
3.2.3 Current Two Parameter Sensitivity Analysis
A sensitivity analysis was conducted in the current analysis to determine the two modelinput parameters which have the greatest impact on the receptor well concentration. These twoparameters were set to their 90-th percentile when performing the two high-end parametersanalysis.
The analysis focused on source-related parameters (area, waste and leachateconcentration, infiltration, and waste volume) and the location of the receptor well (x-, y-, andz- coordinates). All other variables were assigned median values. Sensitivity analysis wasperformed on all the wastestreams that showed a significant risk in the 1995 analysis (USEPA,1995d) and the 1996 Monte Carlo analysis. Table 3.3 shows a list of wastestreams andconstituents for which sensitivity analysis was performed. Tables in Appendix C show the inputparameter distributions used in the modeling analysis for each wastestream. In the case ofconstituent waste and leachate concentrations, instead of a statistical distribution, the averageconcentration measured across the samples was used for the 50th percentile and the maximumconcentration was used for the high end. The relatively few waste and leachate samples availablewarranted this approach. The distributions of the source input parameters vary from wastestreamto wastestream and constituent to constituent. Therefore, the combination of the two mostsensitive parameters also varies and is dependent on wastestream and constituents.
Table 3.2 Comparison of 1995 and 1996 Modeled Waste Volumes
Wastestream Modeled in 1996 Modeled in 1995
20-year Waste Quantity (MT)
50-th percentile Derived
Sulfur Complex Sludge - On-Site 76.2 20.4
Sulfur Complex Sludge - Off-Site 76.2 126.4
Unleaded Gasoline Tank Sludge - On-Site 126 29.1
Unleaded Gasoline Tank Sludge - Off-Site 126 178.5

3-6
3.2.3.1 Approach
The analysis was carried out in two steps. First, the model was run for a base case scenario. Abase case scenario represents a simulation in which all the input parameters are set to their respectivemedian values. Then, a series of simulations were performed by setting a combinations of two parameters,at a time, at their 90-th percentile values. In total, 28 simulations were performed for each constituent ina wastestream. In the case of TC rule capped scenarios the leachate concentration distribution above theTC rule regulatory values was truncated. The sensitivity of each combination of two parameters, set attheir 90-th percentile values, was determined based on the relative change in receptor well concentrationfrom its base case. In the case of carcinogens, 9 year average receptor well concentrations were used toestimate the relative concentrations.
3.2.3.2 Sensitivity of Parameters
The relative sensitivities of the combination of two parameters set to their high-end values, for eachconstituent and wastestream are presented in Appendix C. A summary of the two most sensitiveparameters for each constituent and wastestream is presented in Table 3.3. As discussed in the previoussections, it can be seen that the most sensitive parameters vary from wastestream to wastestream and alsofrom constituent to constituent. Since the sensitivity analysis was performed by varying a combination oftwo parameters at a time, the synergism between the two parameters and their impacts on the receptor wellconcentration are clearly demonstrated (see Appendix C). All data values listed in Appendix C are fromthe 1995 Listing Background Document ( USEPA, 1995a) with the exception of the offsite landfilldimensions. The offsite landfill areas and depths were obtained from USEPA RCRA Confidential BusinessInformation Documents (RCRA CBI, 1995).
3.3 CENTRAL TENDENCY ANALYSIS
Central tendency analyses were performed in both the previous (1995) and current (1996)Groundwater Pathway Analyses to reflect the central estimate of exposure or dose. In these analyses, allparameters were set to their median (50th percentile) value except TCLP and waste concentration whichwere set to their mean values due to the limited number of data points.
3.3.1 1995 Analysis
Details and results of the previous (1995) central tendency analysis are presented in the 1995Groundwater Pathway Analysis Background Document, Section 4 (USEPA, 1995d).
3.3.2 Revised Central Tendency Analysis
The central tendency analysis performed in 1996 (current analysis) was similar to the previous(1995) analysis. The one difference was that in the current analysis the waste fraction was treated as aderived parameter and the reported waste volume (1992 RCRA §3007 Survey; USEPA, 1995a) was usedin the modeling. The results of the current central tendency analysis are presented in Appendix E. Themedian value parameters used in the current central tendency analysis are presented in Appendix C. Thecentral tendency parameters are listed in the top row of each sensitivity table (Base Case).
3.4 TWO HIGH-END PARAMETERS ANALYSIS FOR CODISPOSAL
A two high-end parameters analysis was performed to investigate the impacts of waste codisposalon risks associated with benzene and arsenic in 20 wastestreams managed in on-site and off-site Subtitle

3-7
D landfills. Tables 1.1 and 1.2 list wastestreams included in the codisposal analyses. As indicated byTable 1.1, Hydrotreating and Hydrorefining Catalyst were not included in the codisposal analysis becausethese wastestreams are recommended to be listed, and would, therefore, not be codisposed with nonlistedwastestreams in Subtitle D landfills. Risks were also evaluated with and without Hydrocracking Catalystto evaluate the relative contribution of Hydrocracking Catalyst to benzene and arsenic risk in the codisposalscenario.
All model runs were conducted in deterministic mode by setting two parameters ( waste unit areaand x-well distance) to their high-end values i.e. 90-th percentile for landfill area and 10-th percentile forthe well distance. The two high-end parameters were selected based on the sensitivity analysis conductedin 1995 (USEPA, 1995d). Although a sensitivity analysis was not performed to determine the two mostsensitive parameters for the codisposal scenario, the analysis results (Table 5.7) indicate that the selectionof Area and X-Well as the two high-end parameters produced receptor well concentrations between the95th and 99th percentile on the Monte Carlo distribution. The remaining input parameters of the modelwere assigned to their median values obtained from parameter specific distributions (USEPA, 1996c and1997d). Codisposed values for each source parameter were calculated from the data values from theindividual wastestreams as described below.
The on-site and off-site codisposed waste volumes were determined by adding up the 50-thpercentile of the 20- year waste volumes for individual wastestreams. For other waste characteristics suchas source leachate concentration, waste concentration, and density, the volume-weighted average valueswere used in the analyses for both on-site and off-site modeling scenarios. The waste management unitarea used was the 90-th percentile of the 90-th percentile landfill areas The waste unit depth was obtainedsimilarly using the 50-th percentile of the 50-th percentile depth values. A summary of model inputparameters used in the analysis are in Table 3.4. Tables showing the individual wastestream data that wentinto the calculation of the codisposal input parameters are shown in Appendix D.
As with the single wastestream scenarios, the codisposal scenario was evaluated both with andwithout a TC limitation (TC Cap) on the source leaching rate. The TC Cap scenario was evaluated byrestricting the source leaching rate to be less than or equal to the toxicity characteristic (TC) value , 0.5mg/L and 5.0 mg/L for benzene and arsenic, respectively. Consequently, whenever a constituent TCLPexceeded the TC Rule limit of a constituent, it was capped at the TC Rule limit. For the case of no TCRule limit, risks were evaluated using source leachate concentrations (TCLP) collected from site recordsampling (USEPA, 1995a). The two high-end parameters codisposal risks for benzene and arsenic arepresented with the Monte Carlo risk results in Section 5 (Table 5.7).
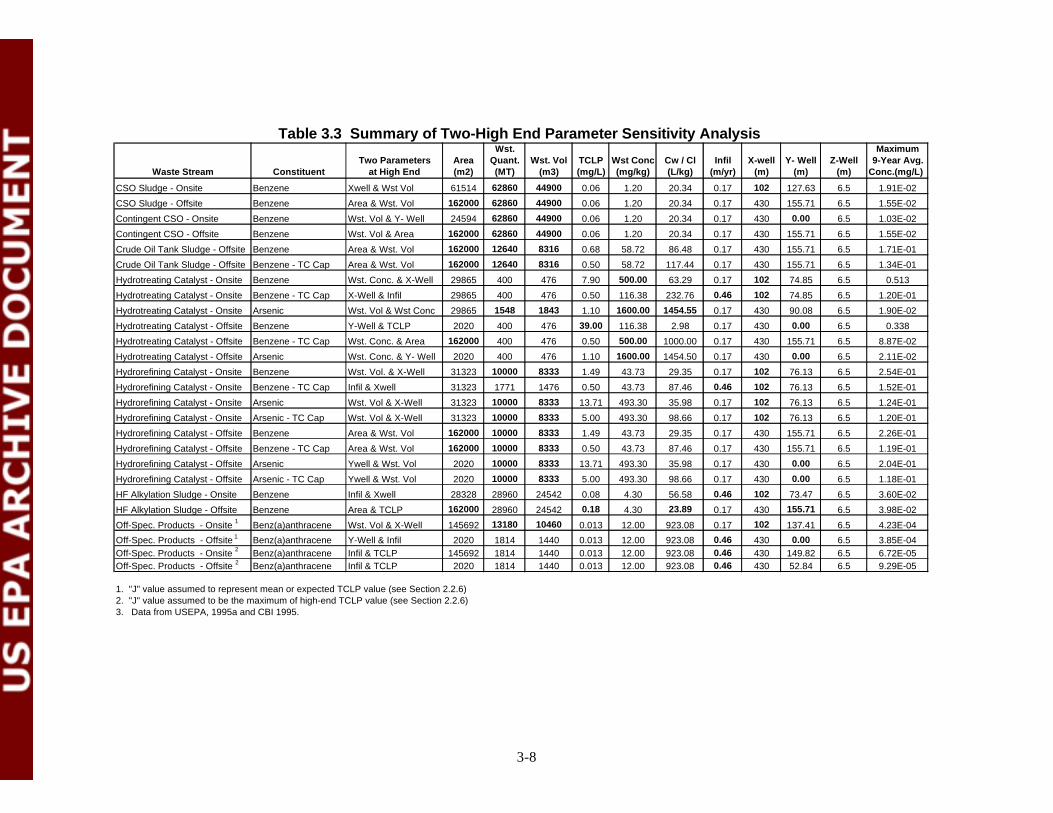
Table 3.3 Summary of Two-High End Parameter Sensitivity Analysis Wst. Maximum
Two Parameters Area Quant. Wst. Vol TCLP Wst Conc Cw / Cl Infil X-well Y- Well Z-Well 9-Year Avg.Waste Stream Constituent at High End (m2) (MT) (m3) (mg/L) (mg/kg) (L/kg) (m/yr) (m) (m) (m) Conc.(mg/L)
CSO Sludge - Onsite Benzene Xwell & Wst Vol 61514 62860 44900 0.06 1.20 20.34 0.17 102 127.63 6.5 1.91E-02
CSO Sludge - Offsite Benzene Area & Wst. Vol 162000 62860 44900 0.06 1.20 20.34 0.17 430 155.71 6.5 1.55E-02
Contingent CSO - Onsite Benzene Wst. Vol & Y- Well 24594 62860 44900 0.06 1.20 20.34 0.17 430 0.00 6.5 1.03E-02
Contingent CSO - Offsite Benzene Wst. Vol & Area 162000 62860 44900 0.06 1.20 20.34 0.17 430 155.71 6.5 1.55E-02
Crude Oil Tank Sludge - Offsite Benzene Area & Wst. Vol 162000 12640 8316 0.68 58.72 86.48 0.17 430 155.71 6.5 1.71E-01
Crude Oil Tank Sludge - Offsite Benzene - TC Cap Area & Wst. Vol 162000 12640 8316 0.50 58.72 117.44 0.17 430 155.71 6.5 1.34E-01
Hydrotreating Catalyst - Onsite Benzene Wst. Conc. & X-Well 29865 400 476 7.90 500.00 63.29 0.17 102 74.85 6.5 0.513
Hydrotreating Catalyst - Onsite Benzene - TC Cap X-Well & Infil 29865 400 476 0.50 116.38 232.76 0.46 102 74.85 6.5 1.20E-01
Hydrotreating Catalyst - Onsite Arsenic Wst. Vol & Wst Conc 29865 1548 1843 1.10 1600.00 1454.55 0.17 430 90.08 6.5 1.90E-02
Hydrotreating Catalyst - Offsite Benzene Y-Well & TCLP 2020 400 476 39.00 116.38 2.98 0.17 430 0.00 6.5 0.338
Hydrotreating Catalyst - Offsite Benzene - TC Cap Wst. Conc. & Area 162000 400 476 0.50 500.00 1000.00 0.17 430 155.71 6.5 8.87E-02
Hydrotreating Catalyst - Offsite Arsenic Wst. Conc. & Y- Well 2020 400 476 1.10 1600.00 1454.50 0.17 430 0.00 6.5 2.11E-02
Hydrorefining Catalyst - Onsite Benzene Wst. Vol. & X-Well 31323 10000 8333 1.49 43.73 29.35 0.17 102 76.13 6.5 2.54E-01
Hydrorefining Catalyst - Onsite Benzene - TC Cap Infil & Xwell 31323 1771 1476 0.50 43.73 87.46 0.46 102 76.13 6.5 1.52E-01
Hydrorefining Catalyst - Onsite Arsenic Wst. Vol & X-Well 31323 10000 8333 13.71 493.30 35.98 0.17 102 76.13 6.5 1.24E-01
Hydrorefining Catalyst - Onsite Arsenic - TC Cap Wst. Vol & X-Well 31323 10000 8333 5.00 493.30 98.66 0.17 102 76.13 6.5 1.20E-01
Hydrorefining Catalyst - Offsite Benzene Area & Wst. Vol 162000 10000 8333 1.49 43.73 29.35 0.17 430 155.71 6.5 2.26E-01
Hydrorefining Catalyst - Offsite Benzene - TC Cap Area & Wst. Vol 162000 10000 8333 0.50 43.73 87.46 0.17 430 155.71 6.5 1.19E-01
Hydrorefining Catalyst - Offsite Arsenic Ywell & Wst. Vol 2020 10000 8333 13.71 493.30 35.98 0.17 430 0.00 6.5 2.04E-01
Hydrorefining Catalyst - Offsite Arsenic - TC Cap Ywell & Wst. Vol 2020 10000 8333 5.00 493.30 98.66 0.17 430 0.00 6.5 1.18E-01
HF Alkylation Sludge - Onsite Benzene Infil & Xwell 28328 28960 24542 0.08 4.30 56.58 0.46 102 73.47 6.5 3.60E-02
HF Alkylation Sludge - Offsite Benzene Area & TCLP 162000 28960 24542 0.18 4.30 23.89 0.17 430 155.71 6.5 3.98E-02
Off-Spec. Products - Onsite 1 Benz(a)anthracene Wst. Vol & X-Well 145692 13180 10460 0.013 12.00 923.08 0.17 102 137.41 6.5 4.23E-04
Off-Spec. Products - Offsite 1 Benz(a)anthracene Y-Well & Infil 2020 1814 1440 0.013 12.00 923.08 0.46 430 0.00 6.5 3.85E-04Off-Spec. Products - Onsite 2 Benz(a)anthracene Infil & TCLP 145692 1814 1440 0.013 12.00 923.08 0.46 430 149.82 6.5 6.72E-05Off-Spec. Products - Offsite 2 Benz(a)anthracene Infil & TCLP 2020 1814 1440 0.013 12.00 923.08 0.46 430 52.84 6.5 9.29E-05
1. "J" value assumed to represent mean or expected TCLP value (see Section 2.2.6)2. "J" value assumed to be the maximum of high-end TCLP value (see Section 2.2.6)3. Data from USEPA, 1995a and CBI 1995.
3-8

3-9
Table 3.4 Two-Parameter High-End Input Data for Codisposal Scenario
Constituent mg/kg mg/l mg/l MT/m m m m
Vol. Wgt. Avg. Avg. TCLP Avg. Total 90-th 50-thAv. Cw TCLP TC-Rule Density Vol. Area Depth
Vol. Wgt. Vol. Wgt.
3 3 2
Arsenic/On-Site 5.51 4.66E-03 4.66E-03 1.23 43298.26 202350 4.57
Benzene/On-Site 5.12 0.11 0.0657 1.23 43298.26 202350 4.57
Arsenic w/HC Off-Site 6.82 0.01 0.01 1.26 54556.56 162000 2.60
Benzene w/HC Off-Site 5.99 0.14 0.0576 1.26 54556.56 162000 2.60
Arsenic w/o HC Off- 6.62 0.01 0.01 1.25 53292.19 162000 2.60Site
Benzene w/o HC Off- 3.08 0.06 0.0471 1.25 53292.19 162000 2.60Site

4-1
4.0 MONTE CARLO ANALYSES PROCEDURE
Monte Carlo simulations were performed to generate probability distributions of downgradientreceptor well concentrations for each waste constituent of concern, e.g. benzene for all wastestreams whichwere not eliminated in the bounding analysis. The Monte Carlo simulations consisted of 10,000groundwater chemical transport simulations, each with a different set of input parameters. A particularcombination of parameters is referred to as a realization. In this analysis, for each Monte Carlorealization, a receptor well concentration was calculated by randomly selecting one landfill along with itscorrelated, site specific parameters and site-specific parameter databases. Each parameter with a statisticaldistribution was then selected from its distribution database. These distributed parameters were eithercorrelated to the site, e.g. hydraulic conductivity or hydraulic gradient, or they were independent of the site,e.g. leachate concentration. Generic and site-specific data are further described below. Simulations wereperformed for each realization using the selected parameters. Receptor well concentrations calculated forall of the realizations were sorted to determine the concentration probability distribution.
Site-specific parameters are those modeling parameters which were correlated to the waste unitsite location. Site-specific parameters were available either from responses to the RCRA §3007 Survey(1992 RCRA §3007 Database) or from a reference source such as the API hydrogeologic parameter database (API, 1989; Newell et al., 1990: USEPA 1997d). Site-specific parameters were correlated to therefinery location. Site-specific parameters selected from a source other than the RCRA §3007 survey werecorrelated to the site based on the geographic location of the site through the assignment of a groundwaterregion code or a climatic region code. Generic parameters are those modeling parameters for whichlimited data or no reliable data exist for each landfill location. Consequently, generic parameters wererandomly selected from distribution databases independently of the site selection. For example, a limitednumber of waste concentration and TCLP concentration data points were available for each wastestream.These data are used as source concentration input values in the groundwater model. Therefore, a genericsource concentration distribution consisting of two to six paired concentration data values per wastestreamwas used for all sites. For each Monte Carlo realization, paired source concentration values were randomlyselected from the concentration distribution. Site-specific and generic modeling parameters and theirsources are summarized in Table 4.1.
4.1 SINGLE-WASTESTREAM BASELINE
The petroleum refining waste data were categorized into waste disposed at on-site refinery landfillsand waste disposed at off-site industrial Subtitle D landfills. More detailed waste unit information wasavailable for on-site landfills than for off-site landfills; therefore, different Monte Carlo procedures havebeen developed for on- and off-site landfills. In addition, separate Monte Carlo procedures have beendeveloped to simulate multi-wastestream codisposal at on- and off-site landfills. The Monte Carloprocedures for each of the four scenarios are described in the following sections.
Single-wastestream baseline Monte Carlo analyses were performed for all wastestreams and wasteconstituents that showed risk in the bounding analysis, i.e. if the HBN of a waste constituent was exceededin the bounding analysis, the single-wastestream baseline analysis was performed for that waste constituent.
4.1.1 On-Site Baseline Monte Carlo Analysis
Waste unit area and depth values and wastestream volume data are available for each on-sitelandfill. Therefore, single-valued site-specific parameters for on-site landfills include: waste unit area and
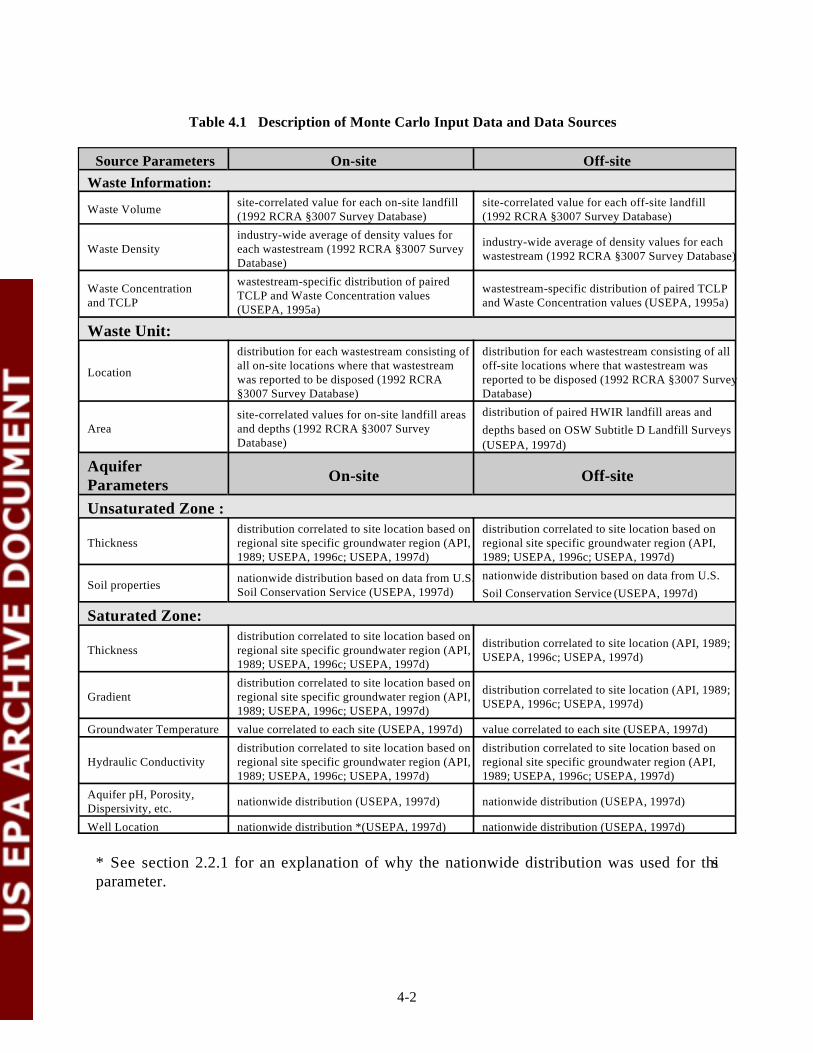
4-2
Table 4.1 Description of Monte Carlo Input Data and Data Sources
Source Parameters On-site Off-siteWaste Information:
Waste Volume site-correlated value for each on-site landfill site-correlated value for each off-site landfill(1992 RCRA §3007 Survey Database) (1992 RCRA §3007 Survey Database)
Waste Density each wastestream (1992 RCRA §3007 Surveyindustry-wide average of density values for
Database)
industry-wide average of density values for eachwastestream (1992 RCRA §3007 Survey Database)
Waste Concentration wastestream-specific distribution of paired TCLPand TCLP and Waste Concentration values (USEPA, 1995a)
wastestream-specific distribution of pairedTCLP and Waste Concentration values(USEPA, 1995a)
Waste Unit:
Location
distribution for each wastestream consisting of distribution for each wastestream consisting of allall on-site locations where that wastestream off-site locations where that wastestream waswas reported to be disposed (1992 RCRA reported to be disposed (1992 RCRA §3007 Survey§3007 Survey Database) Database)
Area and depths (1992 RCRA §3007 Surveysite-correlated values for on-site landfill areas
Database)
distribution of paired HWIR landfill areas anddepths based on OSW Subtitle D Landfill Surveys(USEPA, 1997d)
AquiferParameters On-site Off-site
Unsaturated Zone :
Thickness regional site specific groundwater region (API, regional site specific groundwater region (API,distribution correlated to site location based on distribution correlated to site location based on
1989; USEPA, 1996c; USEPA, 1997d) 1989; USEPA, 1996c; USEPA, 1997d)
Soil properties nationwide distribution based on data from U.S.Soil Conservation Service (USEPA, 1997d)
nationwide distribution based on data from U.S.Soil Conservation Service (USEPA, 1997d)
Saturated Zone:
Thickness regional site specific groundwater region (API,distribution correlated to site location based on
1989; USEPA, 1996c; USEPA, 1997d)
distribution correlated to site location (API, 1989;USEPA, 1996c; USEPA, 1997d)
Gradient regional site specific groundwater region (API,distribution correlated to site location based on
1989; USEPA, 1996c; USEPA, 1997d)
distribution correlated to site location (API, 1989;USEPA, 1996c; USEPA, 1997d)
Groundwater Temperature value correlated to each site (USEPA, 1997d) value correlated to each site (USEPA, 1997d)
Hydraulic Conductivity regional site specific groundwater region (API, regional site specific groundwater region (API,distribution correlated to site location based on distribution correlated to site location based on
1989; USEPA, 1996c; USEPA, 1997d) 1989; USEPA, 1996c; USEPA, 1997d)
Aquifer pH, Porosity, Dispersivity, etc. nationwide distribution (USEPA, 1997d) nationwide distribution (USEPA, 1997d)
Well Location nationwide distribution *(USEPA, 1997d) nationwide distribution (USEPA, 1997d)
* See section 2.2.1 for an explanation of why the nationwide distribution was used for thisparameter.

4-3
depth, wastestream volumes, and groundwater temperature. Site-correlated distributioninformation for each simulation includes infiltration rates, groundwater recharge rates, andaquifer flow and transport properties. Generic parameters are not correlated to site location andinclude wastestream and leachate concentrations (see explanation above), waste densities, andreceptor well location.
4.1.1.1 Procedure
The step-by-step Monte Carlo procedure for the baseline on-site landfill scenario is outlinedbelow:
STEP 1. A Wastestream is selected,
STEP 2. A Constituent is selected then,
For the I-th Monte Carlo realization:
STEP 3. An on-site landfill is selected which includes the followinginformation:
• landfill area, waste unit depth and volume (informationreported in responses to the RCRA § 3007 Survey; 1992 RCRA§ 3007 Survey Database),
• wastestream volume (information reported in responses to theRCRA § 3007 Survey *20 year;1992 RCRA § 3007 SurveyDatabase),(In a limited number of cases the landfill volumes reported inthe RCRA § 3007 Survey were less than the reported 20 yearwaste volumes; in those cases the landfill waste fraction will befixed at 1.00, thereby implicitly increasing the depth of thelandfill; the calculated volume of a landfill (= total thickness(height +depth) x area) may be different from the reportedvolume due to the slopes of the sides of the landfill (assumingno other sources of errors)
• hydrogeologic region (and hydrogeologic parameters; API,1989 and USEPA, 1997d),
• climatic region (and climatic-related parameters; USEPA, 1997dand
• groundwater temperature.

4-4
STEP 4. Remaining parameters are selected such as well location anddispersivity, from nationwide distributions (USEPA, 1997d).
STEP 5. The receptor well concentration for the above selectedparameters is calculated.
For each wastestream, and a constituent of that wastestream, the process (Steps3 to 5) is repeated 10,000 times. The receptor well concentrations are thensorted and reported in terms of the 85-th, 90-th, 95-th and 99-th percentileexceedances (and/or Cancer Risks or Health Quotients).
Steps 2 to 5 are repeated for all constituents of the selected wastestream. Steps1 to 5 are repeated for all wastestreams of interest.
4.1.1.2 Modeled Wastestreams and Constituents
The wastestreams and waste constituents shown in Table 4.2 were included in the single-wastestream baseline modeling analysis. In the previous bounding analyses (USEPA, 1995d),these wastestream constituents had been found to exceed their respective HBN values.
Table 4.2 Modeled Wastestreams and Constituents for On-Site Scenarios
On-Site Landfill Wastestreams: Waste Constituents:
CSO Sludge benzene
Unleaded Gasoline Tank Sludge benzene, nickel
Off-Spec Product and Fines benz(a)anthracene, benzo(a)pyrene,
Sulfur Complex Sludge benzene, arsenic
Hydrotreating Catalyst benzene, toluene, arsenic, nickel
Hydrorefining Catalyst benzene, arsenic, nickel
FCC Catalyst & Fines nickel
SCOT Catalyst cadmium, vanadium
HF Alkylation Sludge benzene, 3/4-methylphenol
4.1.2 Off-Site Baseline Monte Carlo Analysis
Monte Carlo simulations of the off-site landfill scenario similar to the on-site scenariowere conducted. Locations were available for each off-site landfill. Therefore, hydrogeologicinformation were selected from an API database (API, 1989; Newell et al., 1990; USEPA 1997d)based on its geographic location. Those parameters were correlated with the landfill site along

4-5
with site-specific parameters such as waste volume, and groundwater temperature. As with theon-site scenario, the wastestream and leachate concentrations as well as receptor well locations,are generic and were randomly selected from distributions consisting of industry-wide sitesampling data. Receptor well locations were selected from a uniform distribution of x and y wellcoordinates. Climate information (i.e., infiltration and recharge) was selected from a nationwidedatabase for each landfill site based on its location. Waste unit depths and areas were notavailable for off-site landfills; therefore, paired values were randomly selected for eachrealization from the HWIR Subtitle D landfill database (USEPA, 1996c and USEPA, 1997d).A check was implemented to ensure that the selected landfill volume was greater than thewastestream volume; otherwise, the landfill was rejected and another area-depth pair was selectedfrom the HWIR distribution.
4.1.2.1 Procedure
The Monte Carlo procedure for the single-wastestream baseline off-site landfill scenariois similar to the on-site baseline procedure except that after an off-site landfill and itshydrogeologic parameters are selected. The following steps are taken :
STEP 1. A Wastestream is selected,
STEP 2. A Constituent is selected then,
For the I-th Monte Carlo realization:
STEP 3. An off-site landfill is selected which includes the followinginformation:
• wastestream volume (information reported in responses to theRCRA § 3007 Survey *20 years; 1992 RCRA § 3007 SurveyDatabase).
• hydrogeologic region (and hydrogeologic parameters; API,1989; USEPA, 1997d),
• climatic region (and climatic-related parameters; USEPA,1997d), and
• groundwater temperature.

4-6
STEP 4. Paired landfill area and depth values are selected from theHWIR distribution of Subtitle D industrial landfills.
STEP 5. The volume of the selected landfill is computed and comparedwith the codisposed waste volume (see paragraph below). Ifthe codisposed waste volume is greater than or equal to thelandfill volume, the landfill area and depth pair are rejected anda new area-depth pair is selected until a pair is selected thatmeets the criteria of waste unit volume being greater than wastevolume.
Waste management facility volumes are compared againstcodisposed wastestream volumes in both the single-wastestream (baseline) and codisposal scenario to ensureconsistency between the scenarios and to ensure thatunrealistically small landfill areas are not selected for thebaseline analysis.
STEP 6. Remaining parameters are selected such as well location anddispersivity, from nationwide distributions (USEPA, 1997d).
STEP 7. The receptor well concentration for the above selectedparameters is calculated.
For each wastestream, and a constituent of that wastestream, the process (Steps3 to 7) is repeated 10,000 times. The receptor well concentrations are thensorted and reported in terms of the 85-th, 90-th, 95-th and 99-th percentileexceedances (and/or Cancer Risks or Health Quotients).
Steps 2 to 5 are repeated for all constituents of the selected wastestream. Steps1 to 5 are repeated for all wastestreams of interest.
4.1.2.2 Modeled Wastestreams and Waste Constituents
The wastestreams and constituents shown in Table 4.3 were included in the baselinemodeling analysis.
Table 4.3 Modeled Wastestreams and Waste Constituents for Off-Site Scenarios
Off-Site Landfill Wastestreams: Waste Constituents:
CSO Sludge benzene

Off-Site Landfill Wastestreams: Waste Constituents:
4-7
Unleaded Gasoline Tank Sludge benzene, nickel
Crude Oil Tank Sludge benzene
Off-Spec Product Fines benz(a)anthracene, benzo(a)pyrene,
Sulfur Complex Sludge benzene, arsenic
Hydrotreating Catalyst benzene, toluene, arsenic, nickel
Hydrorefining Catalyst benzene, arsenic, nickel
FCC Catalyst & Fines nickel
SCOT Catalyst cadmium, vanadium
HF Alkylation Sludge benzene, 3/4-methylphenol
4.2 CODISPOSAL MONTE CARLO ANALYSIS
Concerns raised in the public comments concerning the impact of codisposal ofwastestreams in landfills were addressed by performing multi-wastestream codisposal modelinganalyses similar to the single-wastestream baseline scenarios described in Section 3. However,instead of considering the wastestreams individually, information on codisposal at each landfillwas used to model total petroleum waste volumes and volume averaged waste and leachateconcentrations. The on- and off-site codisposal scenarios were simulated for benzene andarsenic transport using the entire set of either on-site or off-site landfills. Since hydrorefining andhydrotreating wastes are recommended to be listed and will not be codisposed with non-listedwastestreams in Subtitle D landfills, those wastes were excluded from the codisposal scenario.In the case of off-site landfills, analyses were performed both with and without hydrocrackingwaste to evaluate the impact of listing that wastestream. 4.2.1 On-Site Codisposal Monte Carlo Analysis Procedure
Monte Carlo simulations were performed to determine a probability distribution ofreceptor well concentrations for each constituent of concern. Again site-specific parameters werecorrelated to each refinery and generic parameters were randomly selected from distributiondatabases. The general Monte Carlo procedure is similar to that for on-site baseline analyses(Section 4.1.1). In this procedure, however, wastestream and leachate concentrations werevolume-weighted averages of all wastestreams disposed of at a landfill. Volume-averaged TCLPand waste concentration values for each constituent of concern were calculated for the landfillsas follows:
• Concentration values are selected at random from the TCLP, (C), and wasteij
concentration, (C ), data sets for each wastestream(I) disposed at an on-site landfill.wij

Cij
n
i 1CijVi
n
i 1Vi
Cwij
n
i 1CwijVi
n
i 1Vi
j Random(1,2,...,m)
4-8
(1)
(2)
(3)
• The volume averaged TCLP (leachate) concentration and waste concentration values arecalculated using the formula below,
Where the subscript, I, refers to the wastestream, j refers to the value selected at random from theconcentration data set for wastestream I with m values, and V is the volume of wastestream I.i
• If the TCLP data for a wastestream showed no indication of the presence of a particularconstituent, then the wastestream is included in the codisposal with the TCLP of thatconstituent set to 0.0.
Site-specific parameters for codisposal at on-site landfills include waste unit information,total wastestream volume, and some aquifer parameters. Generic information for each simulationincludes volume-weighted average densities, well location and some aquifer parameters.
4.2.1.1 Procedure
The Monte Carlo procedure for the on-site landfill codisposal scenario is outlined below:
STEP 1. A Wastestream is selected
STEP 2. A Waste Constituent is selected, then
For the I-th Monte Carlo realization:

4-9
STEP 3. An on-site landfill is selected which includes the followinginformation:
• landfill area, waste unit depth and volume (informationreported in responses to the RCRA § 3007 Survey; 1992 RCRA§ 3007 Survey Database).
• wastestream volume for each wastestream codisposed in thelandfill (information reported in RCRA § 3007 Survey *20years) (In a limited number of cases the landfill volumesreported in the RCRA 3007 survey are less than the reported 20year waste volumes; in those cases the landfill waste fractionwill be fixed at 1.00; see on-site baseline for additionalexplanation, Section 4.1.1)
• hydrogeologic region (and hydrogeologic parameters; API,1989; Newell et al., 1990; USEPA, 1997d),
• climatic region (and climatic-related parameters; USEPA,1997d), and
• groundwater temperature.
STEP 4. A 20-year codisposed waste volume for each landfill iscalculated by summing the reported 1992 annual volumes of allwastestreams (including study wastestreams) disposed in thatlandfill and multiplying the volume by 20 years.
STEP 5. Volume averaged TCLP and waste concentration values foreach constituent of concern are calculated for the landfills asfollows:
5.1 Concentration values are selected at random from the TCLPand waste concentration data sets for each wastestream(I)disposed at the selected landfill.
5.2 Volume-averaged TCLP (leachate) concentration and wasteconcentration values are calculated using Equations 1 and 2.
5.3 If the TCLP data for a wastestream showed no indication of thepresence of a particular constituent, then the wastestream isincluded in the codisposal with the TCLP of that constituent setto 0.0.
STEP 6. Other parameters such as well location and dispersivity fromnationwide distributions are selected.

4-10
STEP 7. Receptor well concentration for the above selected parametersis calculated.
The process (Steps 3 to 7) is repeated 10,000 times. The receptor wellconcentrations are reported as the 90-th, 95-th and 99-th percentileexceedances (and/or Cancer Risks or HQs).
Steps 2 to 7 are repeated for all constituents of the selected wastestream. Steps1 to 7 are repeated for all wastestreams of interest.
4.2.2 Off-site Codisposal Monte Carlo Analysis Procedure
Off-site codisposal is simulated much the same as the off-site single wastestream disposalexcept that volume-weighted average concentrations and densities along with total wastestreamvolume were correlated with the landfill location.
4.2.2.1 Procedure
The Monte Carlo procedure for the on-site landfill codisposal scenario is outlined below:
STEP 1. Select a wastestream
STEP 2. Select a Waste Constituent, then
For the I-th Monte Carlo realization:
STEP 3. Select an off-site landfill which includes the followinginformation
• wastestream volumes for each wastestream codisposed in thelandfill (information reported in responses to the RCRA § 3007Survey * 20 years; 1992 RCRA § 3007 Survey Database)
• hydrogeologic region (and hydrogeologic parameters; API,1989; Newell et al., 1990; USEPA 1997d),
• climatic region (and climatic-related parameters; USEPA,1997d), and
• groundwater temperature
STEP 4. A 20 year codisposed waste volume for each landfill iscalculated by summing the reported 1992 annual volumes of allwastestreams disposed in that landfill and multiplying thevolume by 20 years.

4-11
STEP 5. Volume averaged TCLP and waste concentration values foreach constituent of concern is calculated for the landfills asfollows:
5.1 Concentration values are selected at random from the TCLPand waste concentration data sets for each wastestream(I)disposed at the selected landfill.
5.2 Volume averaged TCLP (leachate) concentration and wasteconcentration values are calculated using Equations 1 and 2.
5.3 If the TCLP data for a wastestream showed no indication of thepresence of a particular constituent, then the wastestream isincluded in the codisposal with the TCLP of that constituent setto 0.0.
STEP 6. Select paired landfill area and depth values from the HWIRdistribution of Subtitle D industrial landfills. The volume of theselected landfill is compared against the codisposed wastevolume of the landfill selected in 3 above. If the codisposedwaste volume is greater than or equal to the landfill volume, thelandfill area and depth pair is rejected and a new area-depthpair is selected until a pair is selected that meets the criteria ofwaste unit volume being greater than waste volume.
Waste management facility volumes are compared againstcodisposed wastestream volumes in both the single-wastestream (baseline) and codisposal scenarios to ensureconsistency between the scenarios and to ensure thatunrealistically small landfill areas are not selected for thebaseline analysis (if the landfill volume is too small, that valueof volume is rejected and a new volume is selected).
STEP 7. Select other parameters such as well location and dispersivityfrom nationwide distributions.
STEP 8. Calculate a receptor well concentration for the above selectedparameters.
Repeat the process (Steps 3 to 8) 10,000 times. The receptor wellconcentrations are reported as the 90-th, 95-th and 99-th percentileexceedances (and/or Cancer Risks or HQs).
Steps 2 to 7 are repeated for all constituents of the selected wastestream. Steps1 to 7 are repeated for all wastestreams of interest.

5-1
5.0 MODELING RESULTS AND GROUNDWATER RISK
After the modeling results were processed, receptor well concentrations were used toassess the potential for adverse health effects from both direct and indirect exposures togroundwater. Calculated exposure levels were compared to EPA’s health-based numbers(HBN’s). For carcinogens, where risk is expressed as a probability of getting cancer the HBN’swere set at the exposure level where the risk is 1 x 10 . For non-carcinogens, HBN’s were-6
EPA’s reference dose (RFD’s) levels. RFD’s are values at or below which adverse health effectsare not expected to occur.
5.1 RISK CALCULATION
5.1.1 Direct Groundwater Risk
The groundwater pathway modeling analysis results consist of modeled receptor wellconcentrations. In the case of the two high-end parameter deterministic analyses, a single wellconcentration was calculated for each waste constituent. For the Monte Carlo analysis,distributions of receptor well concentrations were generated for each waste constituent. Tocomplete the risk analysis, well concentrations were compared with the health-based numbers(HBN’s). The HBN values were calculated from standard equations for drinking water ingestionfrom the USEPA Risk Assessment Guidance for Superfund Volume I, Human Health EvaluationManual (USEPA, 1989), using an exposure duration of 9 years, ingestion rate of 1.4 L/day andadult body weight of 70 kg. Ratios of the well concentration to the HBN’s for the various modelscenarios are summarized in Tables 5.1 - 5.5. The 85-th, 90-th, 95-th and 99-th percentile modelresults are presented for the Monte Carlo Analysis.
5.1.2 Indirect Groundwater Risk
An additional indirect risk due to inhalation during showering was added to the Benzenedirect risk estimates to calculate a total estimated groundwater risk. The showering dose-response for Benzene was calculated as 6.06 x 10 risk per 1.0 mg/l of Benzene in the showering-5
water (USEPA, 1996b). Showering risks for other less volatile modeled constituents weredetermined to be negligible.
5.1.3 Total Risk
The indirect inhalation risk from showering combined with the direct ingestion riskproduces a total dose-response of 1.606 × 10 risk per 1.0 mg/l of benzene. The estimated total-4
groundwater risk for benzene was calculated from the product of the EPACMTP calculated wellconcentration (high-end parameter, 90-th, 95-th, or 99-th percentile) and the total dose responsefor benzene. The modeling results (risk estimates) listed in Tables 5.1 - 5.5 are presented asmultiples of 1.0 × 10 risk or risk at 1.0 × 10 . The total risk for the other less volatile modeled-6 -6
constituents is equal to the direct risk; showering risks were not added.

5-2
5.2 MODELING RESULTS
Results for the two high-end parameter and Monte Carlo analyses are shown in Tables 5.1through 5.7. The Monte Carlo results are presented as calculated 85-th, 90-th, 95-th, and 99-thpercentile risk estimates. Both direct (ingestion) and total (ingestion plus showering inhalation)risks are presented for benzene and direct risk is presented for all other waste constituents. Riskestimates which exceed 1.0 are shown in bold. This corresponds to a hazard quotient exceeding1.0 in the case of non-carcinogens and a cancer probability greater than 1 in a million (1 x 10⁻⁶
risk) in the case of carcinogens. The maximum 95-th percentile and two high-end parametergroundwater risks for each waste stream are summarized in Table 5.1.
5.2.1 Two High-End Parameters Results
The two high-end parameter results are presented for the baseline on-site landfill scenarioin Table 5.2 and for the baseline off-site landfill scenario in Table 5.3.
5.2.2 Central Tendency Results
The central tendency results are presented for the baseline on-site landfill scenario inTable 5.2 and for the baseline off-site landfill scenario in Table 5.3.
5.2.3 Monte Carlo Results
The baseline on-site landfill Monte Carlo results are give in Table 5.4 and the off-sitelandfill Monte Carlo results are presented in Table 5.5.
5.2.4 Contingent CSO Management
Results for both Monte Carlo and two high-end parameter contingent CSO managementanalyses are presented in Table 5.6 along with the non-contingent CSO (only 1992 annualSubtitle D Landfill waste quantities).
5.2.5 Codisposal Results
On- and off-site codisposal results are shown in Table 5.7.
5.2.6 TC Capped Results
TC-Capped results are presented in Tables 5.1 to 5.5.

Table 5.1 Summary of Maximum Groundwater Risks (x10-6)
95 High-End Monte TC CappedFederal Backgrnd Carlo Monte Carlo High-End
Waste Constituent Register Document (95th Perc.)96 High-End96 Central Tendency (95th perc.)
CSO benzene not 6.E-01 1.E+00 3.E+00 5.E-01 NA 1 NA 1
significantCrude Tank Sludge benzene 3.E+01 5.E-01 5.E+00 3.E+01 8.E-01 3.E+00 2.E+01
HT Catalyst benzene 1.E+01 4.E+01 1.E+01 8.E+01 9.E+00 4.E+00 2.E+01
arsenic 1.E+01 3.E+01 1.E+01 7.E+01 6.E+00 NA 1 NA 1
HR Catalyst benzene 2.E+01 4.E+01 8.E+00 4.E+01 1.E+01 6.E+00 2.E+01
arsenic 6.E+01 1.E+02 1.E+02 4.E+02 4.E+01 1.E+02 4.E+02
Unleaded Gas Sludge benzene 2.E+00 4.E+00 2.E+00 5.E+00 1.E+00 1.E+00 3.E+00*
HF Alkylation Sludge benzene 3.E+00 3.E+00 2.E+00 6.E+00 1.E+00 NA 1 NA 1
Off-Spec Products benz(a)anthracene no risks 1.E+01 5.E+00 2.E+01 5.E-01 NA 2 NA 2
of concernFCC Catalyst and Fines nickel not 5.E-01 7.E-02 Not 1.E-03 NA 1 NA 1
significant (RFD) modeledSulfur Complex Sludge benzene not 2.E-02 1.E-01 4.E-03 3.E-03 NA 1 NA 1
significant *
arsenic not 5.E-01 2.E-01 1.E-01 1.E-01 NA 1 NA 1
significant *SCOT Catalyst cadmium not 9.E-03 2.E-03 Not 4.E-04 NA 2 NA 2
significant modeledvanadium not Not 2.E-10 Not 3.E-03 NA 2 NA 2
significant modeled modeled
1. TCLP data were all below the Toxicity Characteristic (TC) Limit2. The TC limit has not been set for this constituent.
* Because risks from both the 1995 analysis and the Monte Carlo analysis were not significant, a sensitivity analysis was not performed for this waste stream. Not Modeled - Because both the 1995 analysis and the Monte Carlo analyses indicated very low risks, additional Two High-End modeling was not performed for this waste stream.
5-3
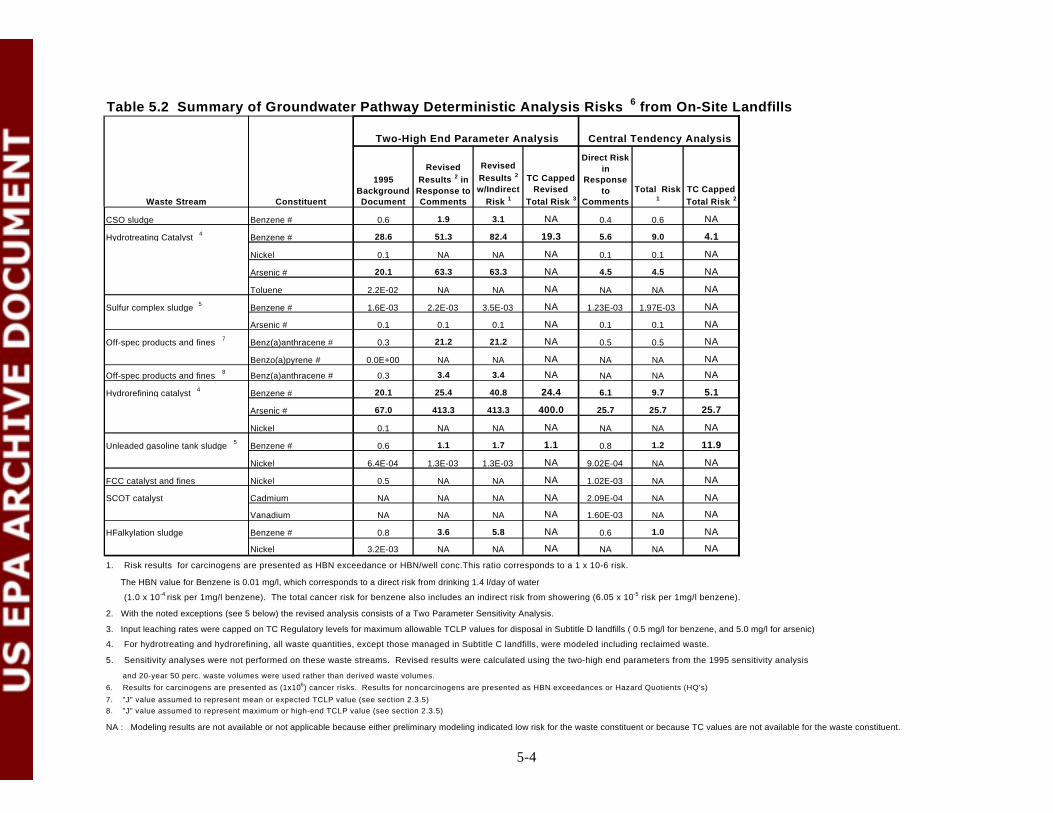
Table 5.2 Summary of Groundwater Pathway Deterministic Analysis Risks 6 from On-Site Landfills
Two-High End Parameter Analysis Central Tendency Analysis
Waste Stream Constituent
1995 Background Document
Revised Results 2 in
Response to Comments
Revised Results 2
w/Indirect Risk 1
TC Capped Revised
Total Risk 3
Direct Risk in
Response to
CommentsTotal Risk
1TC Capped Total Risk 2
CSO sludge Benzene # 0.6 1.9 3.1 NA 0.4 0.6 NA
Hydrotreating Catalyst 4 Benzene # 28.6 51.3 82.4 19.3 5.6 9.0 4.1
Nickel 0.1 NA NA NA 0.1 0.1 NA
Arsenic # 20.1 63.3 63.3 NA 4.5 4.5 NA
Toluene 2.2E-02 NA NA NA NA NA NA
Sulfur complex sludge 5 Benzene # 1.6E-03 2.2E-03 3.5E-03 NA 1.23E-03 1.97E-03 NA
Arsenic # 0.1 0.1 0.1 NA 0.1 0.1 NA
Off-spec products and fines 7 Benz(a)anthracene # 0.3 21.2 21.2 NA 0.5 0.5 NA
Benzo(a)pyrene # 0.0E+00 NA NA NA NA NA NA
Off-spec products and fines 8 Benz(a)anthracene # 0.3 3.4 3.4 NA NA NA NA
Hydrorefining catalyst 4 Benzene # 20.1 25.4 40.8 24.4 6.1 9.7 5.1
Arsenic # 67.0 413.3 413.3 400.0 25.7 25.7 25.7
Nickel 0.1 NA NA NA NA NA NA
Unleaded gasoline tank sludge 5 Benzene # 0.6 1.1 1.7 1.1 0.8 1.2 11.9
Nickel 6.4E-04 1.3E-03 1.3E-03 NA 9.02E-04 NA NA
FCC catalyst and fines Nickel 0.5 NA NA NA 1.02E-03 NA NA
SCOT catalyst Cadmium NA NA NA NA 2.09E-04 NA NA
Vanadium NA NA NA NA 1.60E-03 NA NA
HFalkylation sludge Benzene # 0.8 3.6 5.8 NA 0.6 1.0 NA
Nickel 3.2E-03 NA NA NA NA NA NA
1. Risk results for carcinogens are presented as HBN exceedance or HBN/well conc.This ratio corresponds to a 1 x 10⁻⁶ risk.
The HBN value for Benzene is 0.01 mg/l, which corresponds to a direct risk from drinking 1.4 l/day of water
(1.0 x 10⁻⁴ risk per 1mg/l benzene). The total cancer risk for benzene also includes an indirect risk from showering (6.05 x 10⁻⁵ risk per 1mg/l benzene).
2. With the noted exceptions (see 5 below) the revised analysis consists of a Two Parameter Sensitivity Analysis.
3. Input leaching rates were capped on TC Regulatory levels for maximum allowable TCLP values for disposal in Subtitle D landfills ( 0.5 mg/l for benzene, and 5.0 mg/l for arsenic)
4. For hydrotreating and hydrorefining, all waste quantities, except those managed in Subtitle C landfills, were modeled including reclaimed waste.
5. Sensitivity analyses were not performed on these waste streams. Revised results were calculated using the two-high end parameters from the 1995 sensitivity analysis
and 20-year 50 perc. waste volumes were used rather than derived waste volumes.6. Results for carcinogens are presented as (1x10⁻⁶) cancer risks. Results for noncarcinogens are presented as HBN exceedances or Hazard Quotients (HQ's)
7. "J" value assumed to represent mean or expected TCLP value (see section 2.3.5)8. "J" value assumed to represent maximum or high-end TCLP value (see section 2.3.5)
NA : Modeling results are not available or not applicable because either preliminary modeling indicated low risk for the waste constituent or because TC values are not available for the waste constituent.
5-4

Table 5.3 Summary of Groundwater Pathway Deterministic Analysis Risks6 from Off-Site Landfills
Two-High End Parameter Analysis Central Tendency Analysis
Waste Stream Constituent
1995 Background Document
Revised Results 2 in
Response to Comments
Revised Results 2
w/Indirect Risk 1
TC Capped Revised
Total Risk 3
Direct Risk in
Response to
CommentsTotal Risk
1TC Capped Total Risk 2
CSO sludge Benzene # 0.6 1.6 2.5 NA 4.8E-02 0.1 NA
Crude Oil Tank Sludge Benzene # 0.5 17.1 27.5 21.5 0.5 0.8 0.6
Hydrotreating Catalyst 4 Benzene # 35.7 33.8 54.3 14.2 4.0 6.4 0.7
Nickel 0.2 NA NA NA 0.1 NA NA
Arsenic * 31.6 70.3 70.3 NA 6.4 6.4 NA
Toluene 3.7E-02 NA NA NA 4.43E-03 4.43E-03 NA
Sulfur complex sludge 5 Benzene # 1.6E-02 2.0E-03 3.2E-03 NA 1.94E-03 3.11E-03 NA
Arsenic * 0.5 0.1 0.1 NA 0.1 0.1 NA
Off-spec products and fines 7 Benz(a)anthracene * 13.5 19.3 19.3 NA 0.5 0.5 NA
Benzo(a)pyrene * 2.0E-04 NA NA NA NA NA NA
Off-spec products and fines 8 Benz(a)anthracene * 13.5 4.6 4.6 NA NA NA NA
Hydrorefining catalyst 4 Benzene # 34.6 22.6 36.3 19.1 1.1 1.8 0.6
Arsenic * 126.7 680.0 680.0 393.3 39.0 39.0 34.3
Nickel 0.2 NA NA NA 1.38E-03 1.38E-03 NA
Unleaded gasoline tank sludge 5 Benzene # 4.1 2.9 4.7 3.0 0.4 0.7 NA
Nickel 4.3E-03 NA NA NA 1.43E-03 NA NA
FCC catalyst and fines Nickel NA NA NA NA NA NA NA
SCOT catalyst Cadmium 8.9E-03 NA NA NA 3.71E-04 NA NA
Vanadium NA NA NA NA 2.82E-03 NA NA
HFalkylation sludge Benzene # 3.1 4.0 6.4 NA 0.1 0.1 NA
3/4-Methylphenol 0.4 NA NA NA NA NA NA
1. Risk results for carcinogens are presented as HBN exceedance or HBN/well conc.This ratio corresponds to a 1 x 10⁻⁶ risk.
The HBN value for Benzene is 0.01 mg/l, which corresponds to a direct risk from drinking 1.4 l/day of water
(1.0 x 10⁻⁴ risk per 1mg/l benzene). The total cancer risk for benzene also includes an indirect risk from showering (6.05 x 10⁻⁵ risk per 1mg/l benzene).
2. With the noted exceptions (see 5 below) the revised analysis consists of a Two Parameter Sensitivity Analysis.
3. Input leaching rates were capped on TC Regulatory levels for maximum allowable TCLP values for disposal in Subtitle D landfills ( 0.5 mg/l for benzene, and 5.0 mg/l for arsenic)
4. For hydrotreating and hydrorefining, all waste quantities, except those managed in Subtitle C landfills, were modeled including reclaimed waste.
5. Sensitivity analyses were not performed on these waste streams. Revised results were calculated using the two-high end parameters from the 1995 sensitivity analysis
and 20-year 50 perc. waste volumes were used rather than derived waste volumes.6. Results for carcinogens are presented as (1x10⁻⁶) cancer risks. Results for noncarcinogens are presented as HBN exceedances or Hazard Quotients (HQ's)
7. "J" value assumed to represent mean or expected TCLP value (see section 2.3.5)8. "J" value assumed to represent maximum or high-end TCLP value (see section 2.3.5)
NA : Modeling results are not available or not applicable because either preliminary modeling indicated low risk for the waste constituent or because TC values are not available for the waste constituent.
5-5

Table 5.4 Summary of Groundwater Pathway Monte Carlo Analysis Risks 6 from On-Site Landfills85th Percentile 90th Percentile 95th Percentile 99th Percentile
Waste Stream ConstituentDirect Risk Total Risk
TC Capped
Total Risk 3
Direct Risk Total Risk
TC Capped
Total Risk 3
Direct Risk
Total Risk
TC Capped
Total Risk 3
Direct Risk
Total Risk
TC Capped
Total Risk 3
CSO sludge Benzene # 1.11E-02 1.78E-02 NA 5.0E-02 NA NA 0.2 0.3 NA 0.6 1.0 NA
Hydrotreating Catalyst 4 Benzene # 0.2 0.3 3.95E-03 0.8 1.3 0.8 4.8 7.7 3.5 53.8 86.5 17.7
Nickel 6.86E-03 6.86E-03 NA 5.4E-02 5.4E-02 NA 0.5 0.5 NA 11.6 11.6 NA
Arsenic # 0.4 0.4 NA 1.5 1.5 NA 7.2 7.2 NA 41.2 41.2 NA
Toluene 2.35E-04 2.35E-04 NA 8.2E-04 8.2E-04 NA 3.6E-03 3.6E-03 NA 7.3E-02 7.3E-02 NA
Sulfur complex sludge 5 Benzene # 1.50E-03 2.41E-03 NA 8.9E-03 1.4E-02 NA 0.1 0.1 NA 0.4 0.7 NA
Arsenic # 1.51E-03 1.51E-03 NA 1.4E-02 1.4E-02 NA 0.1 0.1 NA 5.2 5.2 NA
Off-spec products and fines 7 Benz(a)anthracene # 5.53E-05 5.53E-05 NA 3.8E-03 3.8E-03 NA 0.1 0.1 NA 4.2 4.2 NA
Benzo(a)pyrene # 1.22E-10 1.22E-10 NA 2.3E-08 2.3E-08 NA 2.1E-06 2.1E-06 NA 1.6E-02 1.6E-02 NA
Off-spec products and fines 8 Benz(a)anthracene # 5.57E-05 5.57E-05 NA 3.5E-03 3.5E-03 NA 0.1 0.1 NA 4.1 4.1 NA
Hydrorefining catalyst 4 Benzene # 0.5 0.9 4.88E-03 1.6 2.6 2.0 4.7 7.6 5.8 47.8 76.8 19.3
Arsenic # 7.4 7.4 2.96E-04 28.1 28.1 27.1 111.7 111.7 109.0 904.7 904.7 830.3
Nickel 3.34E-03 3.34E-03 NA 2.5E-02 2.5E-02 NA 0.3 0.3 NA 7.1 7.1 NA
Unleaded gasoline tank sludge 5 Benzene # 1.51E-02 2.43E-02 6.23E-03 0.1 0.1 0.1 0.4 0.6 0.6 2.4 3.9 3.8
Nickel 1.90E-06 1.90E-06 NA 5.2E-05 5.2E-05 NA 7.7E-04 7.7E-04 NA 3.0E-02 3.0E-02 NA
FCC catalyst and fines Nickel 2.91E-04 2.91E-04 NA 5.5E-03 5.5E-03 NA 6.6E-02 6.6E-02 NA 1.2 1.2 NA
SCOT catalyst Cadmium 2.70E-05 2.70E-05 NA 2.0E-04 2.0E-04 NA 1.6E-03 1.6E-03 NA 3.5E-02 3.5E-02 NA
Vanadium 3.28E-15 3.28E-15 NA 9.2E-13 9.2E-13 NA 1.8E-10 1.8E-10 NA 1.4E-08 1.4E-08 NA
HFalkylation sludge Benzene # 5.45E-03 8.75E-03 NA 2.8E-02 4.5E-02 4.5E-02 0.1 0.2 0.2 0.9 1.4 1.4
Nickel 3.32E-07 3.32E-07 NA 2.8E-05 2.8E-05 NA 1.0E-03 1.0E-03 NA 3.1E-02 3.1E-02 NA
1. Risk results for carcinogens are presented as HBN exceedance or HBN/well conc.This ratio corresponds to a 1 x 10⁻⁶ risk.
The HBN value for Benzene is 0.01 mg/l, which corresponds to a direct risk from drinking 1.4 l/day of water
(1.0 x 10⁻⁴ risk per 1mg/l benzene). The total cancer risk for benzene also includes an indirect risk from showering (6.05 x 10⁻⁵ risk per 1mg/l benzene).
2. With the noted exceptions (see 5 below) the revised analysis consists of a Two Parameter Sensitivity Analysis.
3. Input leaching rates were capped on TC Regulatory levels for maximum allowable TCLP values for disposal in Subtitle D landfills ( 0.5 mg/l for benzene, and 5.0 mg/l for arsenic)
4. For hydrotreating and hydrorefining, all waste quantities, except those managed in Subtitle C landfills, were modeled including reclaimed waste.
5. Sensitivity analyses were not performed on these waste streams. Revised results were calculated using the two-high end parameters from the 1995 sensitivity analysis
and 20-year 50 perc. waste volumes were used rather than derived waste volumes.6. Results for carcinogens are presented as (1x10⁻⁶) cancer risks. Results for noncarcinogens are presented as HBN exceedances or Hazard Quotients (HQ's)
7. "J" value assumed to represent mean or expected TCLP value (see section 2.3.5)8. "J" value assumed to represent maximum or high-end TCLP value (see section 2.3.5)
NA : Modeling results are not available or not applicable because either preliminary modeling indicated low risk for the waste constituent or because TC values are not available for the waste constituent.
5-6

Table 5.5 Summary of Groundwater Pathway Monte Carlo Analysis Risks from Off-Site Landfills85th Percentile 90th Percentile 95th Percentile 99th Percentile
Waste Stream ConstituentDirect Risk Total Risk
TC Capped
Total Risk 3
Direct Risk Total Risk
TC Capped
Total Risk 3
Direct Risk
Total Risk
TC Capped
Total Risk 3
Direct Risk
Total Risk
TC Capped
Total Risk 3
CSO sludge Benzene # 4.52E-02 0.1 NA 0.2 0.3 NA 0.7 1.1 NA 2.1 3.4 NA
Crude Oil Tank Sludge Benzene # 0.1 0.2 4.62E-03 0.5 0.8 0.6 2.8 4.5 3.3 27.1 43.5 22.0
Hydrotreating Catalyst 4 Benzene # 0.4 0.6 3.78E-03 1.4 2.2 1.2 6.6 10.6 4.4 67.4 108.3 20.3
Nickel 3.13E-02 3.13E-02 NA 0.2 1.8E-01 NA 1.3 1.3 NA 18.3 18.3 NA
Arsenic * 0.6 0.6 NA 2.5 2.5 NA 9.6 9.6 NA 56.5 56.5 NA
Toluene 3.28E-04 3.28E-04 NA 1.2E-03 1.2E-03 NA 4.8E-03 4.8E-03 NA 0.1 0.1 NA
Sulfur complex sludge 5 Benzene # 9.73E-04 1.56E-03 NA 4.4E-03 7.1E-03 NA 3.0E-02 4.7E-02 NA 0.5 0.7 NA
Arsenic * 2.30E-03 2.30E-03 NA 1.4E-02 1.4E-02 NA 0.2 0.2 NA 4.9 4.9 NA
Off-spec products and fines 7 Benz(a)anthracene * 0.1 0.1 NA 0.7 0.7 NA 5.4 5.4 NA 73.8 73.8 NA
Benzo(a)pyrene * 2.36E-04 2.36E-04 NA 1.0E-02 1.0E-02 NA 0.2 0.2 NA 4.1 4.1 NA
Off-spec products and fines 8 Benz(a)anthracene * 0.1 0.1 NA 0.6 0.6 NA 4.4 4.4 NA 52.6 52.6 NA
Hydrorefining catalyst 4 Benzene # 0.8 1.2 4.86E-03 2.1 3.3 2.6 5.1 8.3 6.3 53.0 85.1 20.5
Arsenic * 8.3 8.3 2.97E-04 32.6 32.6 31.3 124.9 124.9 123.0 1034.0 1034.0 936.7
Nickel 4.00E-03 4.00E-03 3.1E-02 3.1E-02 NA 0.4 0.4 NA 6.4 6.4 NA
Unleaded gasoline tank sludge 5 Benzene # 4.41E-02 0.1 4.05E-03 0.2 0.3 0.2 1.1 1.7 1.0 8.2 13.2 8.0
Nickel 2.17E-06 2.17E-06 NA 8.0E-05 8.0E-05 NA 2.0E-03 2.0E-03 NA 0.1 0.1 NA
FCC catalyst and fines Nickel 4.66E-04 4.66E-04 NA 4.7E-03 4.7E-03 NA 4.4E-02 4.4E-02 NA 0.6 0.6 NA
SCOT catalyst Cadmium 2.36E-09 2.36E-09 NA 9.2E-07 9.2E-07 NA 2.2E-04 2.2E-04 NA 0.0 0.0 NA
Vanadium 2.29E-19 2.29E-19 NA 1.1E-14 1.1E-14 NA 2.6E-11 2.6E-11 NA 0.0 0.0 NA
HFalkylation sludge Benzene # 0.2 0.3 NA 0.4 0.7 0.7 1.0 1.6 1.6 3.0 4.8 4.8
3/4-Methylphenol 7.17E-03 7.17E-03 NA 1.6E-02 1.6E-02 NA 3.5E-02 3.5E-02 NA 0.1 0.1 NA
1. Risk results for carcinogens are presented as HBN exceedance or HBN/well conc.This ratio corresponds to a 1 x 10⁻⁶ risk.
The HBN value for Benzene is 0.01 mg/l, which corresponds to a direct risk from drinking 1.4 l/day of water
(1.0 x 10⁻⁴ risk per 1mg/l benzene). The total cancer risk for benzene also includes an indirect risk from showering (6.05 x 10 -5 risk per 1mg/l benzene).
2. With the noted exceptions (see 5 below) the revised analysis consists of a Two Parameter Sensitivity Analysis.
3. Input leaching rates were capped on TC Regulatory levels for maximum allowable TCLP values for disposal in Subtitle D landfills ( 0.5 mg/l for benzene, and 5.0 mg/l for arsenic)
4. For hydrotreating and hydrorefining, all waste quantities, except those managed in Subtitle C landfills, were modeled including reclaimed waste.
5. Sensitivity analyses were not performed on these waste streams. Revised results were calculated using the two-high end parameters from the 1995 sensitivity analysis
and 20-year 50 perc. waste volumes were used rather than derived waste volumes.6. Results for carcinogens are presented as (1x10⁻⁶) cancer risks. Results for noncarcinogens are presented as HBN exceedances or Hazard Quotients (HQ's)
7. "J" value assumed to represent mean or expected TCLP value (see section 2.3.5)8. "J" value assumed to represent maximum or high-end TCLP value (see section 2.3.5)
NA : Modeling results are not available or not applicable because either preliminary modeling indicated low risk for the waste constituent or because TC values are not available for the waste constituent.
5-7
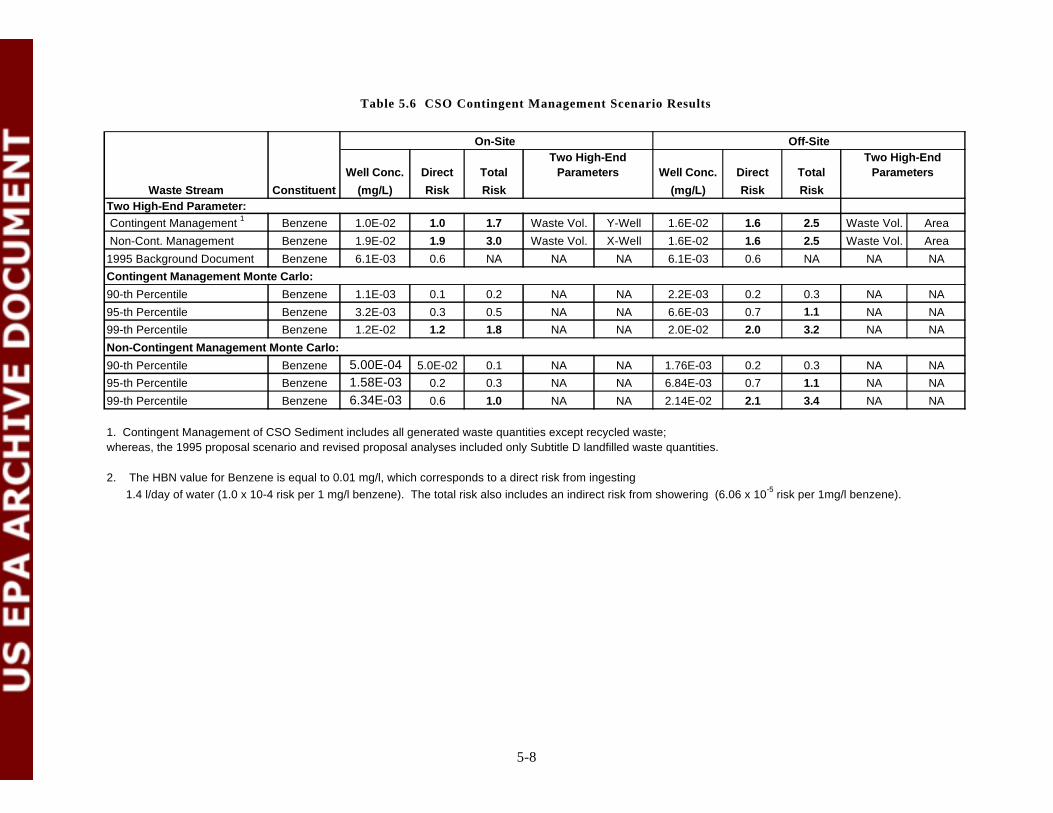
Table 5.6 CSO Contingent Management Scenario Results
On-Site Off-Site
Well Conc. Direct TotalTwo High-End
Parameters Well Conc. Direct TotalTwo High-End
ParametersWaste Stream Constituent (mg/L) Risk Risk (mg/L) Risk Risk
Two High-End Parameter: Contingent Management 1 Benzene 1.0E-02 1.0 1.7 Waste Vol. Y-Well 1.6E-02 1.6 2.5 Waste Vol. Area Non-Cont. Management Benzene 1.9E-02 1.9 3.0 Waste Vol. X-Well 1.6E-02 1.6 2.5 Waste Vol. Area1995 Background Document Benzene 6.1E-03 0.6 NA NA NA 6.1E-03 0.6 NA NA NAContingent Management Monte Carlo:90-th Percentile Benzene 1.1E-03 0.1 0.2 NA NA 2.2E-03 0.2 0.3 NA NA95-th Percentile Benzene 3.2E-03 0.3 0.5 NA NA 6.6E-03 0.7 1.1 NA NA99-th Percentile Benzene 1.2E-02 1.2 1.8 NA NA 2.0E-02 2.0 3.2 NA NANon-Contingent Management Monte Carlo:90-th Percentile Benzene 5.00E-04 5.0E-02 0.1 NA NA 1.76E-03 0.2 0.3 NA NA95-th Percentile Benzene 1.58E-03 0.2 0.3 NA NA 6.84E-03 0.7 1.1 NA NA99-th Percentile Benzene 6.34E-03 0.6 1.0 NA NA 2.14E-02 2.1 3.4 NA NA
1. Contingent Management of CSO Sediment includes all generated waste quantities except recycled waste;whereas, the 1995 proposal scenario and revised proposal analyses included only Subtitle D landfilled waste quantities.
2. The HBN value for Benzene is equal to 0.01 mg/l, which corresponds to a direct risk from ingesting
1.4 l/day of water (1.0 x 10⁻⁴ risk per 1 mg/l benzene). The total risk also includes an indirect risk from showering (6.06 x 10⁻⁵ risk per 1mg/l benzene).
5-8
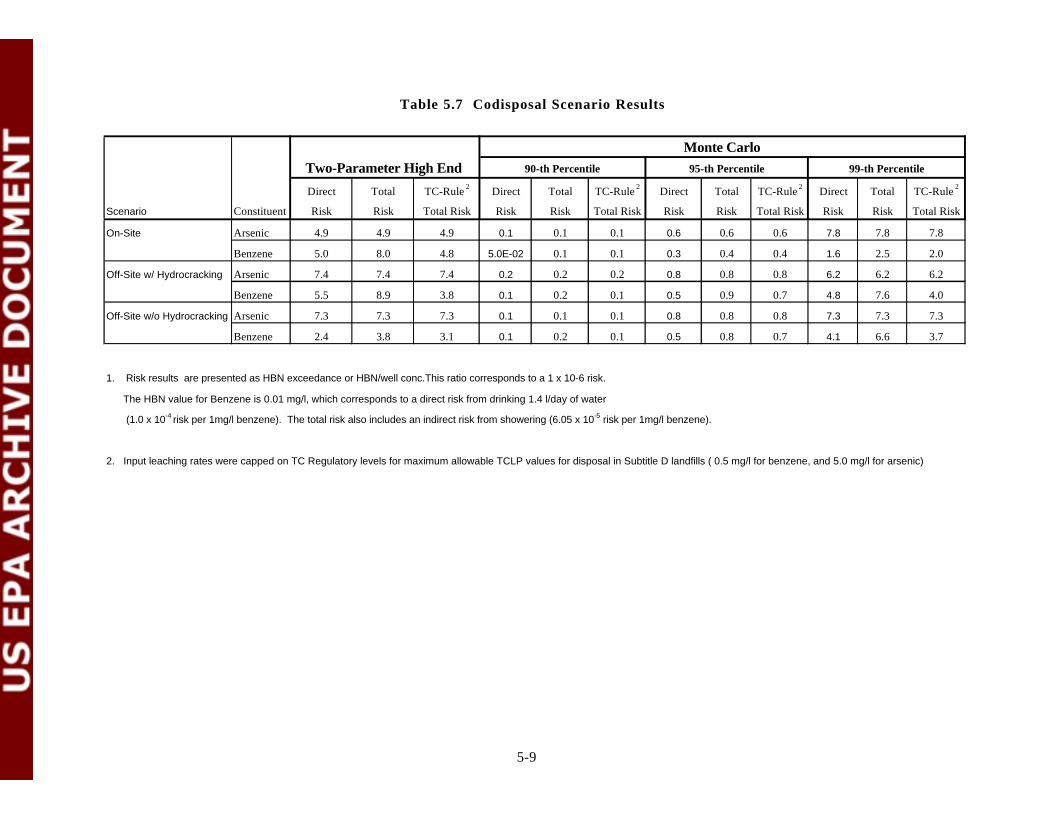
Table 5.7 Codisposal Scenario Results
Monte CarloTwo-Parameter High End 90-th Percentile 95-th Percentile 99-th Percentile
Direct Total TC-Rule 2 Direct Total TC-Rule 2 Direct Total TC-Rule 2 Direct Total TC-Rule 2
Scenario Constituent Risk Risk Total Risk Risk Risk Total Risk Risk Risk Total Risk Risk Risk Total Risk
On-Site Arsenic 4.9 4.9 4.9 0.1 0.1 0.1 0.6 0.6 0.6 7.8 7.8 7.8
Benzene 5.0 8.0 4.8 5.0E-02 0.1 0.1 0.3 0.4 0.4 1.6 2.5 2.0
Off-Site w/ Hydrocracking Arsenic 7.4 7.4 7.4 0.2 0.2 0.2 0.8 0.8 0.8 6.2 6.2 6.2
Benzene 5.5 8.9 3.8 0.1 0.2 0.1 0.5 0.9 0.7 4.8 7.6 4.0
Off-Site w/o Hydrocracking Arsenic 7.3 7.3 7.3 0.1 0.1 0.1 0.8 0.8 0.8 7.3 7.3 7.3
Benzene 2.4 3.8 3.1 0.1 0.2 0.1 0.5 0.8 0.7 4.1 6.6 3.7
1. Risk results are presented as HBN exceedance or HBN/well conc.This ratio corresponds to a 1 x 10⁻⁶ risk.
The HBN value for Benzene is 0.01 mg/l, which corresponds to a direct risk from drinking 1.4 l/day of water
(1.0 x 10⁻⁴ risk per 1mg/l benzene). The total risk also includes an indirect risk from showering (6.05 x 10⁻⁵ risk per 1mg/l benzene).
2. Input leaching rates were capped on TC Regulatory levels for maximum allowable TCLP values for disposal in Subtitle D landfills ( 0.5 mg/l for benzene, and 5.0 mg/l for arsenic)
5-9

Table 5.8 Off-Spec Products and Fines Summary of Analyses Results for Benz(a)anthracene
95-th Perc. Well Conc. (mg/L) (1x10⁻⁶) Risk
Analysis On-Site Off-Site On-Site Off-Site
1. Monte Carlo Analysis+ 2.68E-06 8.86E-05 0.13 4.43
2. Monte Carlo Analysis* 2.74E-06 1.09E-04 0.14 5.45
1. High-End Analysis** 4.23E-04 3.85E-04 21.15 19.25
2. High-End Analysis*** 6.72E-05 9.29E-05 3.36 4.65
+ Using only J value = 13 ppb * Using J value and 5 values of 1/2 quantitation limit (= 50 ppb)** With J value = mean; determine 2 other high-end parameters***With J value = high-end value; determine one other high-end parameter
5-10

6-1
6.0 REFERENCES
1992 RCRA §3007 Survey of the Petroleum Refining Industry Database.
API, 1989. Hydrogeologic Database for Groundwater Modeling, API Publication No. 4476,American Petroleum Institute.
Chappelle, F.M., 1993. Groundwater Microbiology and Geochemistry. John Wiley and Sons,New York.
Kool, J.B., P.S. Huyakorn, E.A. Sudicky, and Z.A. Saleem, 1994. A composite modelingapproach for subsurface transport of degrading contaminants from land disposal sites.Journal of Contaminant Hydrology, vol.17 pp. 69-90.
Kollig, H.P., J.J. Ellington, E.J. Weber, and N.L. Wolfe. Pathway analysis of chemicalhydrolysis for 14 RCRA chemicals. U.S. EPA Environmental Research Brief,EPA/600/M-89/009.
Krumholtz, L., M.E. Caldwell and J.M Suflita. 1996. Biodegradation of BTEX HydrocarbonsUnder Anaerobic conditions. Chapter in “Bioremediation: Principals and Applications”R. Crawford & D. Crawford, eds. Cambridge University Press.
Newell, C.J., L. P. Hopkins, and P. B. Bedient, 1990. A Hydrogeologic Database for Ground-Water Modeling. Groundwater, Vol. 28, No. 5, pp. 703-714.
RCRA CBI Documents, 1995. Document Control Numbers BP9500077 and BP9500086. (Onand OffsitePetroleum Refining Waste Landfill Statistics).
Salinitro, J.P., 1993. The Role of Bioattenuation in the Management of Aromatic HydrocarbonPlumes in Aquifers. Groundwater Monitoring and Remediation, p. 1-29. Batelle Press.Columbus, Ohio.
USEPA, 1988. Draft National Survey of Solid Waste (Municipal) Landfill Facilities, EPA/530-SW-88-034, U.S. Environmental Protection Agency, Washington D.C.
USEPA, 1989. USEPA Risk Assessment Guidance for Superfund, Volume I: Human HealthEvaluation Manual. Washington D.C., 20460.
USEPA, 1992. Guidance on Risk Characterization for Risk Managers, USEPA Memorandum,Washington, D.C., 20460.
USEPA, 1995a. Listing Background Document for the 1992-1996 Petroleum Refining
Determination. U.S. EPA Office of Solid Waste, Washington, D.C., 20460.

6-2
USEPA, 1995b. Assessments of Risks from the Management of Petroleum Refining Waste:Background Document. U.S. EPA Office of Solid Waste, Washington, D.C., 20460.
USEPA, 1995c. Review of EPA's Composite Model for Leachate Migration with TransformationProducts-EPACMTP. Science Advisory Board Exposure Model Subcommittee of theEnvironmental Engineering Committee. Report EPA-SAB-EEC-95-O10, August. U.S.EPA Science Advisory Board.
USEPA, 1995d. Background Document for Groundwater Pathway Analysis. U.S. EPA Officeof Solid Waste, Washington, D.C., 20460.
USEPA, 1996a. Study of Selected Petroleum Refining Residuals, Industry Study. U.S. EPAOffice of Solid Waste, Washington, D.C., 20460.
USEPA, 1996b. Assessments of Risks from the Management of Petroleum Refining Waste:Background Document. U.S. EPA Office of Solid Waste, Washington, D.C., 20460.
USEPA, 1996c. EPA's Composite Model for Leachate Migration with Transformation Products.Background Document, Office of Solid Waste, Washington, D.C., 20460.
USEPA, 1996d. Background document for EPACMTP: Finite Source Methodology forDegrading Chemicals with Transformation Products. U.S. EPA, Office of Solid Waste,Washington, D.C., 20460.
USEPA, 1996e. Background Document for Metals. EPA's Composite Model for LeachateMigration with Transformation Products (EPACMTP). Volume I: Methodology. U.S.EPA, Office of Solid Waste, Washington, D.C., 20460.
USEPA, 1997a. Docket Report Petroleum Waste Listing Notice of Data Availability: AnalysesRegarding Leaching of Oily Waste. U.S. EPA, Washington D.C.
USEPA, 1997b. Docket Report Petroleum Waste Listing Notice of Data Availability: ActiveLives of Landfills Used for the Disposal of Petroleum Refining Wastes. U.S. EPA,Washington D.C.
USEPA, 1997c. Supplemental Background Document; Nongroundwater Pathway RiskAssessment, Petroleum Process Waste Listing Determination, U.S. EPA, WashingtonD.C.
USEPA, 1997d. EPA's Composite Model for Leachate Migration with Transformation Products.User's Guide, Office of Solid Waste, Washington, D.C., 20460.
USGS, 1985. National Water Summary, 1984, United States Geological Survey Water-SupplyPaper 2275.

6-3
Washington, J.W., 1995. Hydrolysis Rates of Dissolved Volatile Organic Compounds,Principles, Temperature Effects and Literature Review. Groundwater 33(3): 415-424.