Embed Size (px)
Citation preview

Petroleum Briefing
J. Michael YeagerGroup and Chief Executive – BHP Billiton Petroleum
Monday 24 May 2010

Petroleum CSG Briefing, 24 May 2010 Slide 2
Disclaimer
Reliance on Third Party InformationThe views expressed here contain information that has been derived from publicly available sources that have not been independently verified. No representation or warranty is made as to the accuracy, completeness or reliability of the information. This presentation should not be relied upon as a recommendation or forecast by BHP Billiton.
Forward Looking StatementsThis presentation includes forward-looking statements within the meaning of the U.S. Securities Litigation Reform Act of 1995 regarding future events and the future financial performance of BHP Billiton. These forward-looking statements are not guarantees or predictions of future performance, and involve known and unknown risks, uncertainties and other factors, many of which are beyond our control, and which may cause actual results to differ materially from those expressed in the statements contained in this presentation. For more detail on those risks, you should refer to the sections of our annual report on Form 20-F for the year ended 30 June 2009 entitled “Risk factors”, “Forward looking statements” and “Operating and financial review and prospects” filed with the U.S. Securities and Exchange Commission.
No Offer of SecuritiesNothing in this release should be construed as either an offer to sell or a solicitation of an offer to buy or sell BHP Billiton securities in any jurisdiction.
Non-GAAP Financial InformationBHP Billiton results are reported under International Financial Reporting Standards (IFRS). References to Underlying EBIT and EBITDA exclude any exceptional items. A reconciliation to statutory EBIT is contained within the profit announcement, available at our website www.bhpbilliton.com.

Petroleum CSG Briefing, 24 May 2010 Slide 3
Agenda
BHP Billiton & Petroleum overview
Petroleum performance
Near term outlook
Longer term opportunities
– Exploration program
– Pre-development / ongoing projects
– Undeveloped gas resources

Petroleum CSG Briefing, 24 May 2010 Slide 4
Agenda
BHP Billiton & Petroleum overview
Petroleum performance
Near term outlook
Longer term opportunities
– Exploration program
– Pre-development / ongoing projects
– Undeveloped gas resources

Petroleum CSG Briefing, 24 May 2010 Slide 5
BHP Billiton Corporation A global upstream portfolio
Note: Ranking based on production volumes. Location of markers indicative only.
Stainless Steel Materials#3 global nickel producer
Stainless Steel Materials#3 global nickel producer
Iron OreOne of the world’s premier suppliers of iron ore
Iron OreOne of the world’s premier suppliers of iron ore
ManganeseOperations produce a combination of ores,
alloys and metal
ManganeseOperations produce a combination of ores,
alloys and metal
Metallurgical CoalProduce and market high quality hard coking
coals for the international steel industry
Metallurgical CoalProduce and market high quality hard coking
coals for the international steel industry
Base Metals#3 global producer of copper,
silver and lead
Base Metals#3 global producer of copper,
silver and lead
Aluminium#4 global producer of bauxite and #4 aluminium
company based on net third party sales
Aluminium#4 global producer of bauxite and #4 aluminium
company based on net third party sales
Energy CoalOne of the world's largest producers and
marketers of export thermal coal
Energy CoalOne of the world's largest producers and
marketers of export thermal coal
PetroleumA 450kbd oil and gas exploration
and production business
PetroleumA 450kbd oil and gas exploration
and production business
Diamonds & Specialty ProductsEKATI Diamond Mine is one of the world’s
largest gem quality diamond producers
Diamonds & Specialty ProductsEKATI Diamond Mine is one of the world’s
largest gem quality diamond producers
Aluminium Base Metals Diamonds & Specialty Products Energy Coal Iron Ore Manganese Metallurgical Coal Petroleum Stainless Steel Materials Offices

Petroleum CSG Briefing, 24 May 2010 Slide 6
The power and reach of a super-major behind BHP Billiton Petroleum
BHP Billiton has the balance sheet to undertake large and complex projects
– Diversified portfolio balances risk and provides flexibility
– Long term view with continued investment through the cycles
Petroleum has significant capability as a part of the BHP Billiton Group
0 50 100 150 200 250 300
HessHusky Energy
Marathon OilEncanaRepsol
Devon EnergyApache
Imperial OilCanadian Natural
LukoilSuncor Energy
BG GroupEcopetrol
OccidentalStatoilHydro
CNOOCEni
ConocoPhillipsTotal
GazpromBP
PetrobrasChevron
Royal Dutch ShellBHP BillitonPetro ChinaExxon Mobil
Integrated E & P
Market Capitalisation(US$bn, 17 May 2010)
Oil & Gas Companies
Source: Bloomberg.
Petroleum CSG Briefing, 24 May 2010 Slide 7
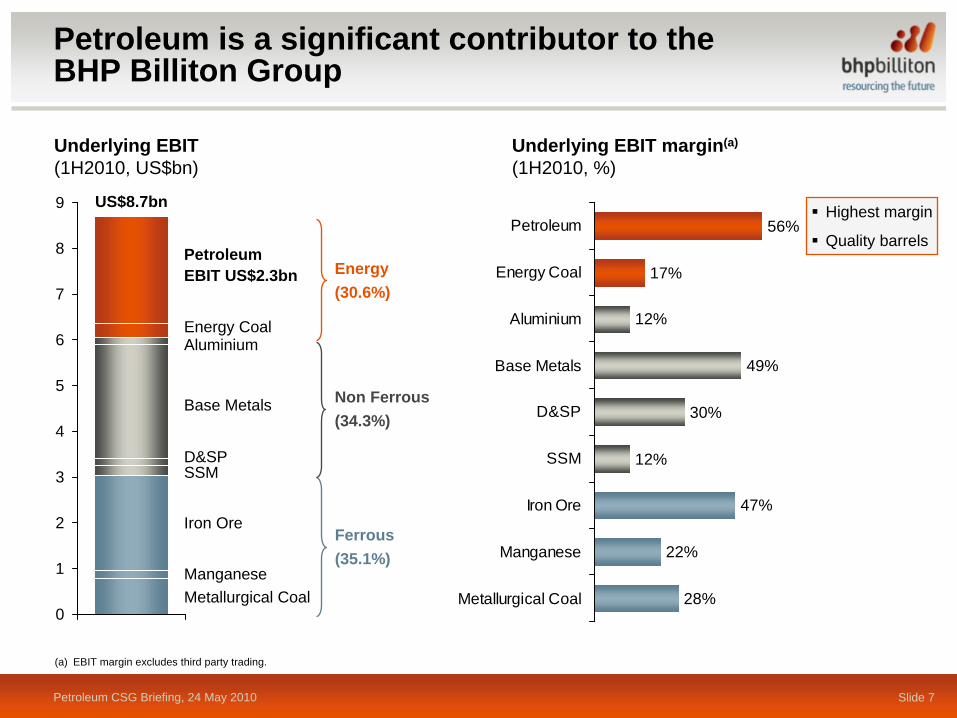
Underlying EBIT(1H2010, US$bn)
0
1
2
3
4
5
6
7
8
9
Ferrous(35.1%)
Non Ferrous(34.3%)
Energy(30.6%)
AluminiumEnergy Coal
Manganese
PetroleumEBIT US$2.3bn
D&SPSSM
Metallurgical Coal
Base Metals
Iron Ore
(a) EBIT margin excludes third party trading.
Petroleum is a significant contributor to the BHP Billiton Group
Underlying EBIT margin(a)
(1H2010, %)
28%
22%
47%
12%
30%
49%
12%
17%
56%
Metallurgical Coal
Manganese
Iron Ore
SSM
D&SP
Base Metals
Aluminium
Energy Coal
Petroleum
Highest margin
Quality barrels
US$8.7bn

Petroleum CSG Briefing, 24 May 2010 Slide 8
BHP Billiton Petroleum
Core Strategy
Be functionally strong where we compete
Fundamentals focus – safety, volume, cost
Take large, operated positions with multiple long life options
Explore over weighted to proven basins
Pursue commercial opportunities that fit and add to corporate diversification

Petroleum CSG Briefing, 24 May 2010 Slide 9
Large Positions
Petroleum HQ
Gulf of Mexico
Algeria Pakistan
Bass Strait
Trinidad
Western Australia
Malaysia
UK
Exploration – Proven Basins
Vietnam Philippines
Producing and development
Petroleum CSG Briefing, 24 May 2010 Slide 10
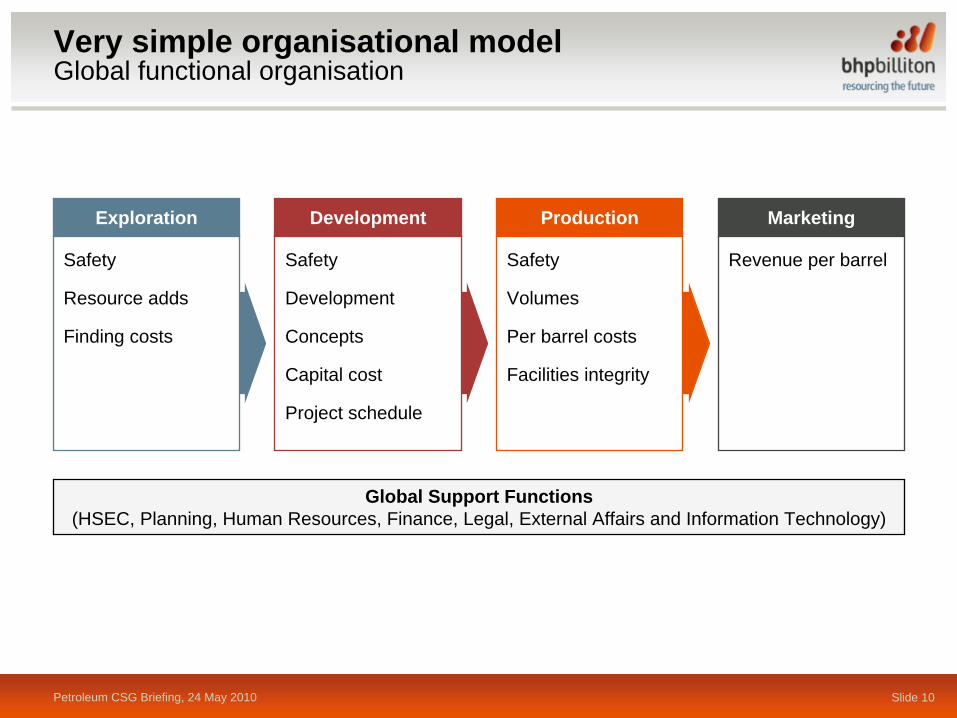
Very simple organisational model Global functional organisation
Exploration Development Production Marketing
Safety
Resource adds
Finding costs
Safety
Development
Concepts
Capital cost
Project schedule
Safety
Volumes
Per barrel costs
Facilities integrity
Revenue per barrel
Global Support Functions (HSEC, Planning, Human Resources, Finance, Legal, External Affairs and Information Technology)

Petroleum CSG Briefing, 24 May 2010 Slide 11
Two organisational principles
Execution
Western Australia
Bass Strait
Gulf of Mexico UK Trinidad Pakistan Algeria
Petroleum Headquarter – Houston
Centralised management/planning
Centralised services
Common worldwide standards
Functional excellence
Strong local operating units
Execution
Receive services
Adhere to worldwide standards
mboed Employees Employees/mboed2007 310 1,350 4.32010 450+ 1,566 3.4
Excellence

Petroleum CSG Briefing, 24 May 2010 Slide 12
Agenda
BHP Billiton & Petroleum overview
Petroleum performance
Near term outlook
Longer term opportunities
– Exploration program
– Pre-development / ongoing projects
– Undeveloped gas resources

Petroleum CSG Briefing, 24 May 2010 Slide 13
Outstanding performance metrics across the board
Three years of annual gains…
Excellent safety performance
10% CAGR volume growth since FY2007
– excellent fiscal terms– primarily liquids
100% reserves replacement FY2007-FY2009
Low operating cost/boe
Low depreciation per barrel for international independent oil and gas
High quality barrels for top EBIT/boe margin
Delivering highest EBIT return on capital employed among peers

Petroleum CSG Briefing, 24 May 2010 Slide 14
Safety Continuous improvement
FY2009 best ever safety performance for Petroleum
1.9 Total Recordable Incident Rate
Zero Lost Time Incidents
Zero fatalities
Part of functional excellence approach
Total Recordable Incident Frequency Rate (TRIFR)(Incidents per million hours worked)
0
1
2
3
4
5
FY2006 FY2007 FY2008 FY2009

Petroleum CSG Briefing, 24 May 2010 Slide 15
Safety Lost Time Injury performance
BHP Billiton Lost Time Injury Frequency Rate (LTIFR)(a)
(Injuries per million hours worked)
0
1
2
3
4
5LTIFR
Fatality
(a) From OGP Independent Study 2008. Results for 2009 study not available yet.
BHP Billiton
Sample List of Participating Companies
BG BP Chevron
CNOOC ConocoPhillips ENI
ExxonMobil Hess KOC
Maersk Marathon Nexen
Perenco Petrobras PetroCanada
Petronas Repsol Saudi Aramco
Shell StatoilHydro TOTAL

Petroleum CSG Briefing, 24 May 2010 Slide 16
Volume history
Expect strong FY2010 Q4 for another year of meeting our 10% growth target
3 strong long life areas
Investing in similar opportunities
(mmboe/year)
100
110
120
130
140
150
160
170
FY2007 FY2008 FY2009 FY2010E
10% CAGR

Petroleum CSG Briefing, 24 May 2010 Slide 17
Operating cost
Controlling cost in a difficult environment
Delivering lower cost than any other peer with a diversified portfolio
Significant focus on fundamentals
– Equipment reliability / uptime– Maintenance / shutdowns– Aviation and marine logistics– Product transportation
Source: Company reports. Data presented on a normalised basis to exclude one-off events and activities that were not considered part of E&P operations.
3 year average operating cost per boe, FY2007–FY2009(US$/boe)
0
3
6
9
12
15
BHPBilliton
Anadarko BG Devon Apache Murphy Hess Talisman
Petroleum CSG Briefing, 24 May 2010 Slide 18
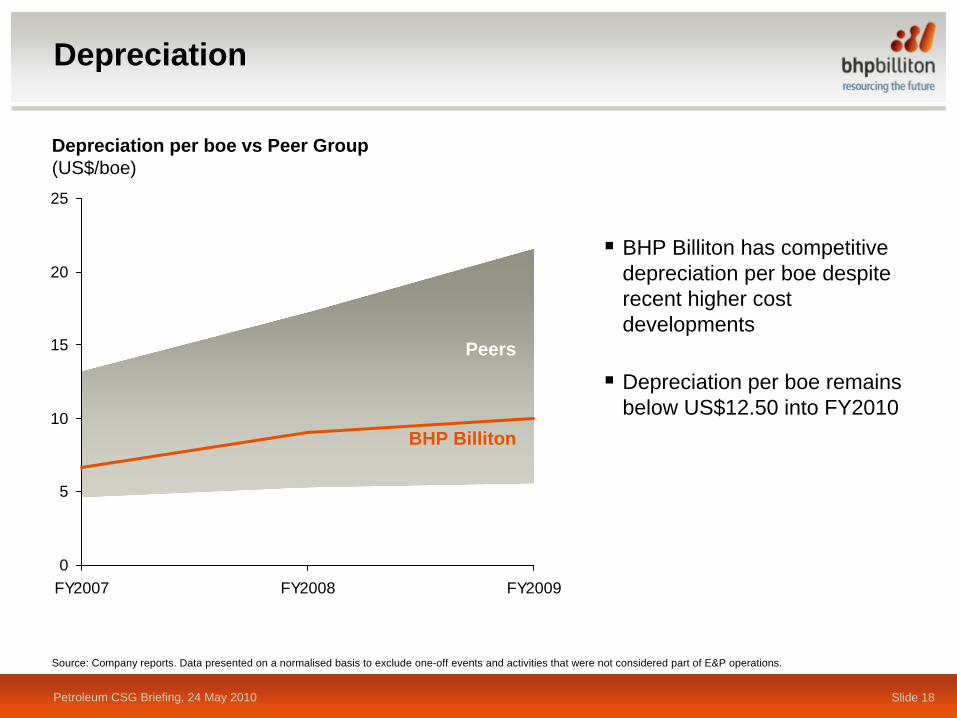
Depreciation
BHP Billiton has competitive depreciation per boe despite recent higher cost developments
Depreciation per boe remains below US$12.50 into FY2010
Depreciation per boe vs Peer Group(US$/boe)
0
5
10
15
20
25
FY2007 FY2008 FY2009
Peers
BHP Billiton
Source: Company reports. Data presented on a normalised basis to exclude one-off events and activities that were not considered part of E&P operations.

Petroleum CSG Briefing, 24 May 2010 Slide 19
Reserve replacement
(net mmboe)
116
129137
120
152144
0
30
60
90
120
150
180
FY2007* FY2008 FY2009 FY2010E
Production Volume
Reserves Adds
* Excludes asset sales.

Petroleum CSG Briefing, 24 May 2010 Slide 20
EBIT margin
Liquids priced barrels
– FY2006: 62% of 310 mbd– FY2010: 73% of 450 mbd
Top quality barrels for high realisations
Combined with low cash and non-cash costs for best in class margin
3 year average EBIT per boe, FY2007–FY2009(US$/boe)
0
10
20
30
40
Murphy BHPBilliton
Hess Apache BG Anadarko Devon Talisman
3 year average EBIT margin, FY2007–FY2009(% of revenue)
0
20
40
60
80
BHPBilliton
BG Apache Murphy Devon Hess AnadarkoTalisman
Source: Company reports. Data presented on a normalised basis to exclude one-off events and activities that were not considered part of E&P operations.

Petroleum CSG Briefing, 24 May 2010 Slide 21
EBIT return on capital employed
Efficient capital investment program
– Project costs as planned– Outstanding drilling
performance
All phases of execution handled well
3 year average EROC(%, FY2007–FY2009)
0
10
20
30
40
50
60
BHPBilliton
Hess Murphy BG Apache Devon AnadarkoTalisman
Source: Company reports. Data presented on a normalised basis to exclude one-off events and activities that were not considered part of E&P operations.

Petroleum CSG Briefing, 24 May 2010 Slide 22
Industry leading drilling performance
Gulf of Mexico deepwater (>2,000 ft water depth) exploration and appraisal wells, CY2000–CY2008(Days per 1,000 ft drilled)
0
1
2
3
4
5
6
7
8
9
BHPBilliton
KerrMcGee
Unocal Anadarko Shell BP Conoco Chevron Exxon Hess Devon
24 wells
68 wells
17 wells
26 wells
44 wells
39 wells
8 wells
28 wells
10 wells
13 wells
3 wells

Petroleum CSG Briefing, 24 May 2010 Slide 23
We operate two of the world’s deepest TLPs
Neptune Shenzi

Petroleum CSG Briefing, 24 May 2010 Slide 24
Key messages
Scaleable organisation
– Low overhead– Employee count per boe down with 50% volume growth
Production growth at 10% CAGR since FY2007
– Projects done on time and on budget– Few delays
Cost control
– Low operation costs– Focused on the basics
Highest EBIT return on capital employed amongst peers

Petroleum CSG Briefing, 24 May 2010 Slide 25
Agenda
BHP Billiton & Petroleum overview
Petroleum performance
Near term outlook
Longer term opportunities
– Exploration program
– Pre-development / ongoing projects
– Undeveloped gas resources

Petroleum CSG Briefing, 24 May 2010 Slide 26
LNG
Oil
Gas
Program and Projects
Gulf of Mexico
Mad Dog (23.9%)
• Resource continues to grow• Significant new developmentAtlantis (44.0%)
• South development and Water Injection
• North development getting started
Shenzi (44.0%)
• Strong base performance• Development drilling
Petroleum HQ

Petroleum CSG Briefing, 24 May 2010 Slide 27
Base
Mad Dog Continues to get bigger
Current Spar cannot drain all discovered oil to date
– West and South areas cannot be fully reached
– Optimised development scheme could double ultimate recovery
– Evaluating additional facility options
North area to be appraised during FY2011 can be tied into main Spar for near term barrels
Current spar producers
1 mi.
Spar Location
North
Gra
ben
North & GrabenAppraisal potential
WestEast
East – Under production
West – Under production
SouthMad Dog Southappraisal well
& sidetrack
Lower Miocene South
Oil In Place
West South
??
North

Petroleum CSG Briefing, 24 May 2010 Slide 28
South
North East
Development drilling continues in the initial southern area
South water injection project in progress
Two wells drilled in the north
– Two wells producing 50 mbd
– Up to five more wells
Ramping up to facility design of 200 mbd
East appraisal in FY2011/FY2012
Atlantis 2nd largest field in Gulf of Mexico
South North
??
East
Oil In Place
- 17,950’ (MDT)

Petroleum CSG Briefing, 24 May 2010 Slide 29
Shenzi
Design capacity of 100 mbd
Initial production 140 mbd
One year into production still over 100 mbd
Currently doing additional up-dip drilling
Water injection project in progress
C102BP1B203
I-1
I-2
I-3
I-4
I-5East
North
West

Petroleum CSG Briefing, 24 May 2010 Slide 30
TrinidadAngostura• Angostura Gas Project• Infill drilling program – oil
Angostura (45.0%)
LNG
Oil
Gas
Eastern AustraliaBass Strait (50.0%)• Infill drilling program
Western AustraliaPyrenees (71.43%)• Development drilling
Program and Projects
UKLiverpool Bay (46.1%)• Beginning gas blowdown
PakistanZamzama (38.5%)• Facilities at maximum
volumes• Front-end Compression
Gulf of Mexico
Mad Dog (23.9%)
• Resource continues to grow• Significant new developmentAtlantis (44.0%)
• South development and Water Injection
• North development getting started
Shenzi (44.0%)
• Strong base performance• Development drilling
Petroleum HQ
Western AustraliaNorth West Shelf (8-17%)• 5 trains at maximum
volume• Offshore developments
underpin throughput

Petroleum CSG Briefing, 24 May 2010 Slide 31
FY2011 production outlook
FY2011 outlook
Full year of Pyrenees volume
Angostura gas project start-up
Atlantis South drilling and water injection
Atlantis North development
Shenzi infill program
At maximum capacity– Bass Strait– North West Shelf– Pakistan
8 to 10% volume growth potential
BP Gulf of Mexico incident
2 Atlantis rigs now drilling relief wells
US Government drilling permit moratorium
Significant uncertainty – low end of range
(mmboe)
100
120
140
160
180
FY2010E FY2011E

Petroleum CSG Briefing, 24 May 2010 Slide 32
Key messages
Deep inventory of significant projects in existing areas underpinning production growth
– Continued opportunity for high margin liquids growth at Atlantis and Mad Dog
– Maintaining maximum capacity at Pyrenees, North West Shelf and Bass Strait
– Additional gas production facilities at Trinidad and Pakistan
Healthy FY2011 production growth potentially impacted by very recent deep water Gulf of Mexico uncertainty

Petroleum CSG Briefing, 24 May 2010 Slide 33
Agenda
BHP Billiton & Petroleum overview
Petroleum performance
Near term outlook
Longer term opportunities
– Exploration program
– Pre-development / ongoing projects
– Undeveloped gas resources

Petroleum CSG Briefing, 24 May 2010 Slide 34
Changing the exploration game
Tripled land capture after low activity period pre CY2006
Current focus on existing core areas and areas where oil and gas has been found
Operated and world class sized prospects
Material to BHP Billiton Corporation
Cumulative acreage captured (km2)
0
50,000
100,000
150,000
200,000
250,000
300,000
350,000
CY2000-2006
CY2007 CY2008 CY2009 CY2010E

Petroleum CSG Briefing, 24 May 2010 Slide 35
Top 20 discoveries in the Gulf of Mexico since 1995
Atlantis and Mad Dog world class discoveries
Recent appraisal drilling resulted in additional oil in both discoveries
Projects in place to develop
Recoverable oil(mmboe)
0
200
400
600
800
1,000
1,200
Thun
der H
orse
Atla
ntis
Mad
Dog
Tibe
r
Tahi
ti
Gre
at W
hite
St.
Mal
o
Shen
zi
Kas
kida
Tuck
er
Sto
nes
Buc
kski
n
Julia
Cas
cade
Luci
us
Knot
ty H
ead
Cae
sar/T
onga K2
Free
dom
Jack
Other companies BHP Billiton discoveries Paleogene discoveries without BHP Billiton working interest
Source: Wood Mackenzie.

Petroleum CSG Briefing, 24 May 2010 Slide 36
Building material positions in proven basins Gulf of Mexico
Extending our footprint with 300+ blocks in inventory to date
Top tier capture rate in recent lease sales
– Knotty Head appraisal: – Double Mountain: uneconomic– Firefox: dry– Deep Blue: in progress
Core Miocene East Gulf of Mexico
Extended Miocene
Paleogene200 kms
Miocene Play Extension:
Stepout from core play
Strong position with captured leads and running room
Core Miocene Play:
Delivery area, mature, high success rate
New Gulf of Mexico leases, October 2007-March 2010
Prior BHP Billiton
Shenzi
Mad Dog
NeptuneAtlantis
Knotty Head
Genesis

Petroleum CSG Briefing, 24 May 2010 Slide 37
Building material positions in proven basins South China Sea Area
Multiple countries (Vietnam, Malaysia and Philippines) but same rocks
Material position captured in a prolific basin (50 billion boe discovered to date)
– Philippines Dabakan: small gas discovery
– Malaysia Cerah: dry
Additional drilling second half CY2010
100 kms
BHP Billiton operated
BHP Billiton non operated

Petroleum CSG Briefing, 24 May 2010 Slide 38
Frontier tests for significant opportunities
India1 well
Falklands1 well
Colombia 5 wells
FY2010 WellsWells Planned
Canadian Laurentian1 well – uneconomic
GippslandSouth East Remora
Material in size to BHP Billiton Balance proven plays and frontier exploration Opportunities with potential for multiple successes Control and Operatorship
Exploration Strategy
Material in size to BHP Billiton Balance proven plays and frontier exploration Opportunities with potential for multiple successes Control and Operatorship
Exploration Strategy

Petroleum CSG Briefing, 24 May 2010 Slide 39
Exploration Program summary
Targets to impact BHP Billiton
75% Proven – 25% Frontier
Have rebuilt acreage position
Increased activity – increased spending
First real exploration in 8 to 10 years
Below planned results – higher exploration expense
Three year program in good locations with good partners
Petroleum CSG Briefing, 24 May 2010 Slide 40
Agenda
BHP Billiton & Petroleum overview
Petroleum performance
Near term outlook
Longer term opportunities
– Exploration program
– Pre-development / ongoing projects
– Undeveloped gas resources

Petroleum CSG Briefing, 24 May 2010 Slide 41
Pre-development / ongoing projects
LNG
Oil
Gas
Petroleum HQ
Western AustraliaMacedon (71.43%)Subsea wells and gas plant
Eastern Australia (50%)Bass Longford GCPGas conditioning plantKipperTwo well subsea tie-backTurrum New “Marlin B” platform
North West Shelf (16.67%)NWS Greater Western Flank Gas fields developmentNorth Rankin B New compression platformGulf of Mexico
Knotty Head (25%)
Gunflint (32.25%)
Petroleum CSG Briefing, 24 May 2010 Slide 42
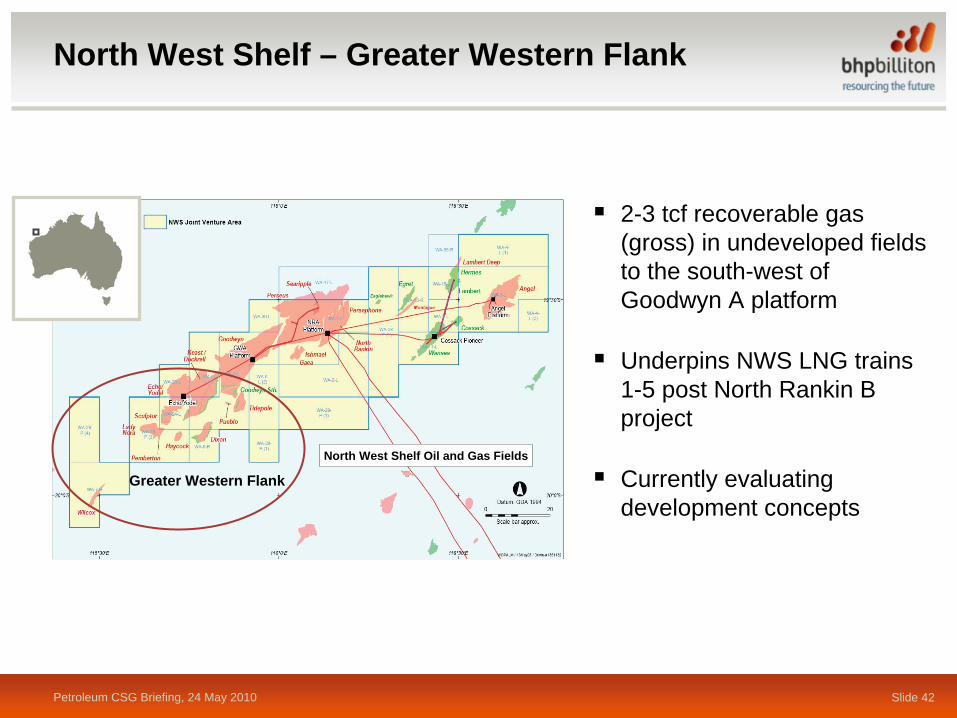
North West Shelf – Greater Western Flank
2-3 tcf recoverable gas (gross) in undeveloped fields to the south-west of Goodwyn A platform
Underpins NWS LNG trains 1-5 post North Rankin B project
Currently evaluating development concepts
Greater Western Flank
North West Shelf Oil and Gas Fields

Petroleum CSG Briefing, 24 May 2010 Slide 43
North West Shelf – North Rankin B
US$850 million net BHP Billiton development
Underpins trains 1-5 NWS LNG
Start up late CY2012

Petroleum CSG Briefing, 24 May 2010 Slide 44
Bass Strait – Kipper / Turrum
US$1.1 billion net BHP Billiton development
Projects keep volumes at facility maximum
Drilling and construction in progress
Cost and schedule under review
Marlin B
Marlin A

Petroleum CSG Briefing, 24 May 2010 Slide 45
West Australia – Macedon
Sanction planned mid CY2010 and first gas expected CY2013
FEED engineering complete and regulatory approvals in progress.
200 mmscfd plant design

Petroleum CSG Briefing, 24 May 2010 Slide 46
Agenda
BHP Billiton & Petroleum overview
Petroleum performance
Near term outlook
Longer term opportunities
– Exploration program
– Pre-development / ongoing projects
– Undeveloped gas resources

Petroleum CSG Briefing, 24 May 2010 Slide 47
0
500
1,000
1,500
2,000
2,500
3,000
3,500
4,000
4,500
5,000Gas
Oil
Significant resource position for long term growth
Proved Reserves1,381 mmboe
Probable Reserves plus Contingent Resources
2,449 mmboe
Reserves and Resources 3.831 mmboe(mmboe, as at 30 Jun 2009)
BrowseScarboroughExmouthNWSBass Strait
AtlantisMad DogShenzi
PyreneesBass Strait 0.0
0.5
1.0
1.5
2.0
2.5
FY2011 FY2012 FY2013 FY2014 FY2015
Forecast Capital Expenditure for Browse and Scarborough(US$bn)

Petroleum CSG Briefing, 24 May 2010 Slide 48
0
40
80
120
CY2010 CY2030
For a market with strong demand fundamentals
Asia gas supply(bcf/d)
LNG
Asia expected to require 300 mtpa (40 bcf/d) of LNG by CY2030
Demand growth driven by
– high GDP growth– rapid urbanisation– government policy support for
increased gas consumption
Source: BHP Billiton.
0
20
40
CY2010 CY2030 CY2010 CY2030
Power and other
Industrial and residential
China and India gas demand(bcf/d)
China India
Production and pipeline imports

Petroleum CSG Briefing, 24 May 2010 Slide 49
Browse LNG – long term growth opportunity
Three large gas field with 14 tcf recoverable reserves (Source: Wood Mackenzie)
Retention Lease accepted with commitment to US$1.25 billion work program (100%)
Basis of Design work started for upstream facilities and downstream LNG plant
Source: Woodside.
Torosa
Derby
BrecknockCalliance
Gas fields

Petroleum CSG Briefing, 24 May 2010 Slide 50
Scarborough/Thebe – long term growth opportunity
High equity giant gas fields with 10 tcf recoverable reserves in area
– Thebe 100% BHP Billiton– Scarborough 50% BHP Billiton
US$15-20 billion dollar investment (100%) expected for development of upstream facilities and LNG plant
Concept select studies progressing and site geotechnical survey work commenced
Planning for FEED commencement FY2011
Strong BHP Billiton position currently
– Production– Projects– Exploration
WA-351-P
WA-335-P
WA-346-P
ThebeScarborough
StybarrowPyreneesMacedon
Gas fields

Petroleum CSG Briefing, 24 May 2010 Slide 51
Summary
An integral part of BHP Billiton Group
– Strong performance in key commodity– Strong functional capability
Performance
– Consistent delivery of results in key metrics– Highly competitive versus peers
Nearer term
– Continuing strong growth potential into FY2011; Gulf of Mexico spill uncertainty– Driving investment in multiple world class projects and drilling
Longer term opportunities
– Rejuvenated exploration program; results improvement over time– Advancing world class resources in Western Australia


![Welcome [] BHP BHP Billiton Canada Inc. (BHP) is a leading global resources company with assets and projects in iron ore, petroleum, copper and coal. BHP proposes to construct a potash](https://img.dokumen.tips/doc/110x75/5b2d310d7f8b9ab66e8bbdd7/welcome-bhp-bhp-billiton-canada-inc-bhp-is-a-leading-global-resources-company.jpg)