Embed Size (px)
Citation preview

Petroleum and Coal
Pet Coal (2020); 62(1) 27-34 ISSN 1337-7027 an open access journal
Article Open Access
A Comparative Analysis of the Well Performance of Vertical, Horizontal and Multi-lateral Wells
Ameena A. Gaji, Petrus Nzerem, Oghenerume Ogolo*, Ikechukwu Okafor, Ternenge Joseph Chior Department of Petroleum and Gas Engineering, Nile University of Nigeria, Abuja, Nigeria
Received October 24, 2019; Accepted December 29, 2019
Abstract
The demand for energy in the world has been ever increasing. Conventional technologies are being replaced gradually by different new technologies. Horizontal wells and multilateral wells have proved to be highly beneficial by improving production rates significantly. This study focuses on investigating the well performance of vertical well (Well V), horizontal well (Well H), and multilateral well (Well M) in the Hurricane field using PROSPER software. PVT matching, well modelling and well performance analysis was carried out. Sensitivity analysis was performed on key parameters such as tubing diameter, water cut, wellhead pressure and tubing roughness to determine their effects on well
productivity. It was observed that increasing the water cut decreased the production rates of Well V, Well H and Well M by 41%, 36.1% and 33.5% respectively. An increase in the tubing diameter improved the production rates, wellhead pressure had high impacts on the well performance while tubing roughness had a minimal effect on oil production. The optimum production rates of 21,622.5 STB/day, 28,653.6 STB/day and 29,800.9 STB/day for Well V, Well H and Well M respectively were achieved at reservoir pressure of 3500 psig, wellhead pressure of 400 psig, water cut of 5% and a 5.5
inches tubing diameter.
Keywords: Sensitivity analysis; Inflow performance relationship; Multilateral wells; Horizontal well; PROSPER software; Well performance.
1. Introduction
As the oil and gas industry is moving away from conventional reservoirs towards uncon-
ventional reservoirs, traditional vertical wells may not be the most effective medium of max-
imizing hydrocarbon recovery in challenging zones such as; tight reservoirs, compartmental-
ized reservoirs, layered formations, marginal fields, etc [1-4].
However, each reservoir has unique conditions; therefore, horizontal or multilateral wells
may not be also necessarily ideal for effective drainage of a reservoir [5].
Thus, the significance of this study is to aid engineers in decision-making on whether to
drill and complete a well by conventional methods or more sophisticated configurations such
as drilling of horizontal, multilateral wells, etc. while maximizing recovery, and also to under-
stand the effects of productivity indicators such as tubing size, wellhead pressure, water cut
etc. in production optimization process.
Fossil fuels such as coal, petroleum, and natural gas account for 81% of global energy
consumption [6]. This percentage will change over time as experts believe the annual supply
of oil and gas is gradually declining as the global appetite for energy increases due to popula-
tion growth and industrialization [6].
Historically, oil and gas exploration involved conventional methods such as vertical drilling,
which is less expensive and complicated when compared to well types such as horizontal and
multilateral wells [7]. However, production rates of prolific oil and gas reserves are drastically
declining. This has led the petroleum industry to improve the productivity of wells by discov-
ering new technologies that can increase well deliverability while reducing costs. Development
1
Petroleum and Coal
Pet Coal (2020); 62(1): 27-34 ISSN 1337-7027 an open access journal
of new technologies such as horizontal wells, multilateral well completion and hydraulic frac-
turing has proven to create a sustainable development of fields which is of utmost concern to
oil and gas companies today [2-3].
This research work was aimed at investigating and comparing the production rates of a
vertical well (Well V), horizontal well (Well H), and multilateral well (Well M) in order to aid
engineers in the decision making the process of maximizing production from a reservoir [8].
This was achieved by simulating the well performance of the different well configurations using
PROSPER software.
2. Methodology
The methodology presented in this study was designed to assist engineers in the decision
making process. PROSPER (Production and System Performance) software was used in this
study. The software assists reservoir engineers in predicting the tubing and pipeline hydraulics
and temperature with much accuracy, conducting sensitivity analysis to understand the effects
of future changes in system parameters for production optimization etc. This study was done
using three wells named Well V, Well H and Well M in the Hurricane field located in Tulsa
County, Oklahoma. Well V is a vertical well, Well H is a horizontal well and Well M is a multi-
lateral well (Dual lateral). The sandstone reservoir produces under-saturated oil with API grav-
ity of 25 and a solution gas oil ratio (GOR) of 400 Scf/Stb. The specific gas gravity is 0.75 and
the aquifer salinity is 80,000 ppm. The black oil PVT model was used and the Glaso correlation
was selected for bubble point pressure (Pb), solution gas oil ratio (Rs) and oil formation volume
factor (Bo) while Beal et al. correlation were selected for oil viscosity. The data used in this
study was adapted from literature [9-10]) and relevant data are given in Table 1. All calculations
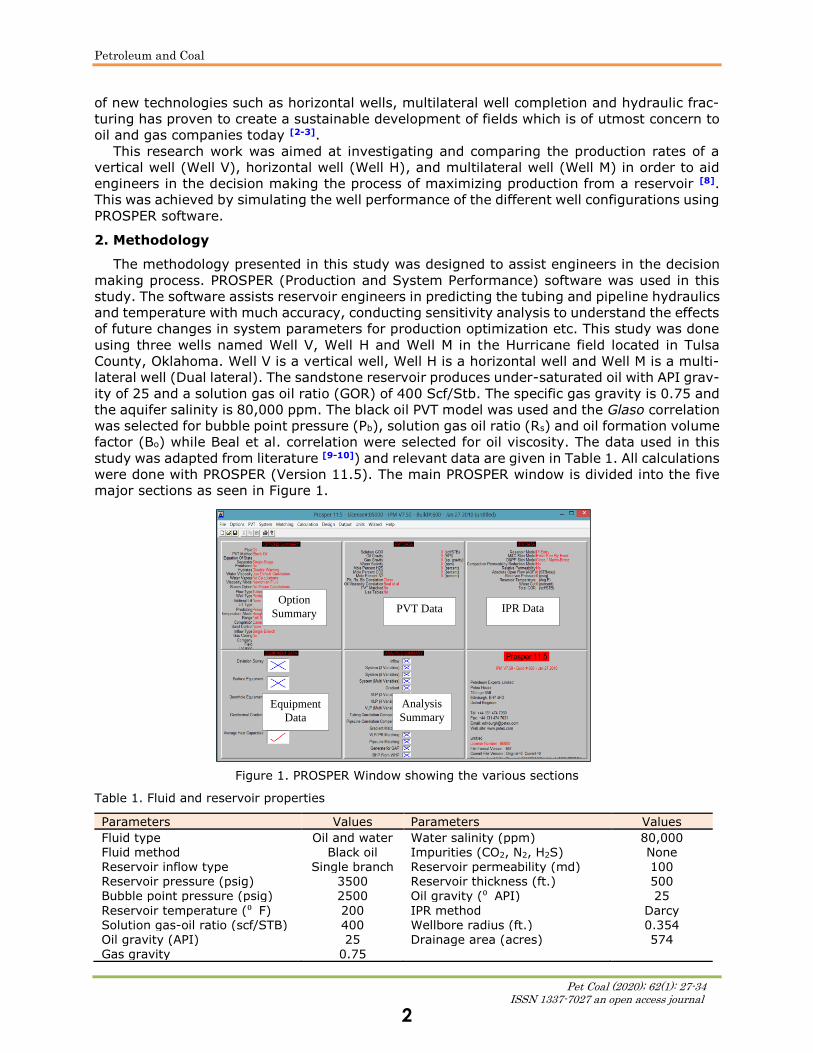
were done with PROSPER (Version 11.5). The main PROSPER window is divided into the five
major sections as seen in Figure 1.
Figure 1. PROSPER Window showing the various sections
Table 1. Fluid and reservoir properties
Parameters Values Parameters Values
Fluid type Oil and water Water salinity (ppm) 80,000 Fluid method Black oil Impurities (CO2, N2, H2S) None Reservoir inflow type Single branch Reservoir permeability (md) 100 Reservoir pressure (psig) 3500 Reservoir thickness (ft.) 500 Bubble point pressure (psig) 2500 Oil gravity (⁰ API) 25
Reservoir temperature (⁰ F) 200 IPR method Darcy Solution gas-oil ratio (scf/STB) 400 Wellbore radius (ft.) 0.354 Oil gravity (API) 25 Drainage area (acres) 574 Gas gravity 0.75
Option
Summary PVT Data IPR Data
Equipment
Data
Analysis
Summary
2

Petroleum and Coal
Pet Coal (2020); 62(1): 27-34 ISSN 1337-7027 an open access journal
2.1. Sensitivity analysis
For an effective optimization of a system, there is a need to carry out sensitivity analysis
on the key parameters affecting the productivity of the wells [11]. In this study, four parame-
ters were used for sensitivity analysis in PROSPER. These were: water cut, tubing roughness,
tubing diameter and wellhead pressure.
A range of tubing roughness (0.0006 in., 0.0015 in. and 0.004 in.) was selected. The well-
head pressure, water cut, reservoir pressure, and fluid properties were kept constant while
varying the tubing roughness. For each tubing roughness, the bottom hole pressure and pro-
duction rate were recorded at the node.
This method was used to construct different sensitivity plots for the three wells considered
in this study. The same procedure was carried out for water cut, wellhead pressure and tubing
diameter. Table 2 shows the parameter ranges for the sensitivity analysis
Table 2. Sensitivity parameter ranges
Parameter Ranges Parameter Ranges
Tubing diameter (inches) 4.0 – 6.0 Water cut (%) 5 – 30 Wellhead pressure (psig) 400 – 800 Tubing roughness (inches) 0.0006 – 0.004
3. Results and discussion
3.1. Well performance curves
An IPR curve represents the behavior of a reservoir in producing oil through the well [12]. It is
a plot of production rate versus bottom hole pressure. From the IPR-VLP curves in Figures 2,
3 and 4, the point of intersection of the inflow and outflow curves indicates the operating point
(solution point) of the well. Therefore, the production rates for Well V, Well H and Well M were
15,586 STB/day, 19,120 STB/day and 29,658.6 STB/day respectively. Well M has a greater
production rate due to the wide extent covered by the laterals. While other system solution
results were given in Table 3.
Figure 2. IPR-VLP curve of Well V Figure 3. IPR-VLP curve of Well H
Figure 4. IPR-VLP curve of Well M
3
Petroleum and Coal
Pet Coal (2020); 62(1): 27-34 ISSN 1337-7027 an open access journal
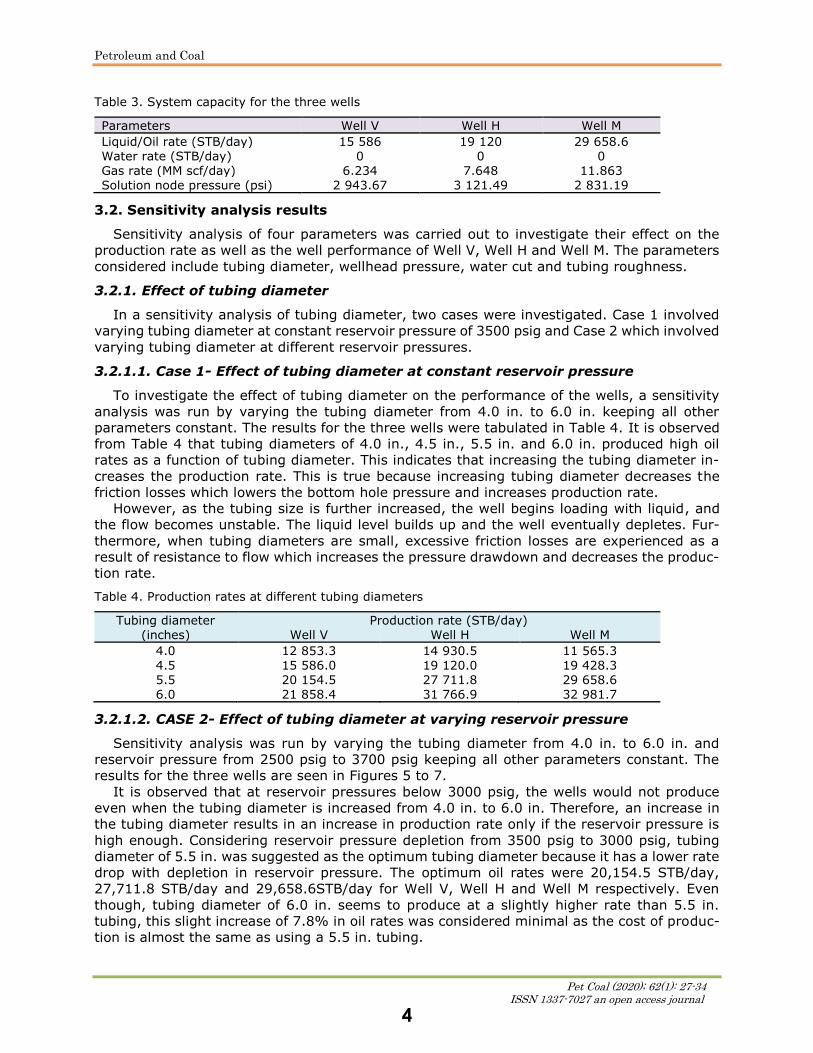
Table 3. System capacity for the three wells
Parameters Well V Well H Well M
Liquid/Oil rate (STB/day) 15 586 19 120 29 658.6 Water rate (STB/day) 0 0 0 Gas rate (MM scf/day) 6.234 7.648 11.863 Solution node pressure (psi) 2 943.67 3 121.49 2 831.19
3.2. Sensitivity analysis results
Sensitivity analysis of four parameters was carried out to investigate their effect on the
production rate as well as the well performance of Well V, Well H and Well M. The parameters
considered include tubing diameter, wellhead pressure, water cut and tubing roughness.
3.2.1. Effect of tubing diameter
In a sensitivity analysis of tubing diameter, two cases were investigated. Case 1 involved
varying tubing diameter at constant reservoir pressure of 3500 psig and Case 2 which involved
varying tubing diameter at different reservoir pressures.
3.2.1.1. Case 1- Effect of tubing diameter at constant reservoir pressure
To investigate the effect of tubing diameter on the performance of the wells, a sensitivity
analysis was run by varying the tubing diameter from 4.0 in. to 6.0 in. keeping all other
parameters constant. The results for the three wells were tabulated in Table 4. It is observed
from Table 4 that tubing diameters of 4.0 in., 4.5 in., 5.5 in. and 6.0 in. produced high oil
rates as a function of tubing diameter. This indicates that increasing the tubing diameter in-
creases the production rate. This is true because increasing tubing diameter decreases the
friction losses which lowers the bottom hole pressure and increases production rate.
However, as the tubing size is further increased, the well begins loading with liquid, and
the flow becomes unstable. The liquid level builds up and the well eventually depletes. Fur-
thermore, when tubing diameters are small, excessive friction losses are experienced as a
result of resistance to flow which increases the pressure drawdown and decreases the produc-
tion rate.
Table 4. Production rates at different tubing diameters
Tubing diameter (inches)
Production rate (STB/day) Well V Well H Well M
4.0 12 853.3 14 930.5 11 565.3 4.5 15 586.0 19 120.0 19 428.3 5.5 20 154.5 27 711.8 29 658.6 6.0 21 858.4 31 766.9 32 981.7
3.2.1.2. CASE 2- Effect of tubing diameter at varying reservoir pressure
Sensitivity analysis was run by varying the tubing diameter from 4.0 in. to 6.0 in. and
reservoir pressure from 2500 psig to 3700 psig keeping all other parameters constant. The
results for the three wells are seen in Figures 5 to 7.
It is observed that at reservoir pressures below 3000 psig, the wells would not produce
even when the tubing diameter is increased from 4.0 in. to 6.0 in. Therefore, an increase in
the tubing diameter results in an increase in production rate only if the reservoir pressure is
high enough. Considering reservoir pressure depletion from 3500 psig to 3000 psig, tubing
diameter of 5.5 in. was suggested as the optimum tubing diameter because it has a lower rate
drop with depletion in reservoir pressure. The optimum oil rates were 20,154.5 STB/day,
27,711.8 STB/day and 29,658.6STB/day for Well V, Well H and Well M respectively. Even
though, tubing diameter of 6.0 in. seems to produce at a slightly higher rate than 5.5 in.
tubing, this slight increase of 7.8% in oil rates was considered minimal as the cost of produc-
tion is almost the same as using a 5.5 in. tubing.
4

Petroleum and Coal
Pet Coal (2020); 62(1): 27-34 ISSN 1337-7027 an open access journal
Figure 5. Well performance at varying tubing di-ameter and reservoir pressure-Well V
Figure 6. Well performance at varying tubing di-ameter and reservoir pressure-Well H
Figure 7. Well performance at varying tubing di-ameter and reservoir pressure-Well M
3.2.2. Effect of wellhead pressure (WHP)
Similarly, in the sensitivity analysis of wellhead pressure, two cases were also investi-
gated. Case 1, which involved varying wellhead pressure at constant reservoir pressure of
3500 psig and Case 2, which involved varying wellhead pressure at different reservoir pres-
sures.
3.2.2.1. Case 1- Effect of wellhead pressure at constant reservoir pressure
Sensitivity analysis was carried out on the flowing wellhead pressure (WHP) to investigate
the effect of wellhead pressure on the production rate. Figure 8 shows the three well types
varied at three different wellhead pressures of 400 psig, 600 psig, and 800 psig with a 5.5 in.
tubing diameter and reservoir pressure of 3500 psi.
Figure 8. Well performance at varying wellhead
pressures for the three wells
Figure 9. Sensitivity plot at varying wellhead pres-
sure and reservoir pressure-Well V
It is observed that when the wellhead pressure was decreased from 800 psig to 400 psig,
the liquid production rate increases. This is because reducing the wellhead pressure results
in an increase in pressure drawdown which consequently increases the production rate.
5

Petroleum and Coal
Pet Coal (2020); 62(1): 27-34 ISSN 1337-7027 an open access journal
Wellhead pressure can be adjusted in different ways, such as changing the choke size, sur-
face pressure, and flow line. Therefore, the optimum oil rates obtained were 23,423.9
STB/day, 30,780.4 STB/day and 31,845.6 STB/day for Well V, Well H and Well M respec-
tively.
3.2.2.2. CASE 2- Effect of wellhead pressure at varying reservoir pressure
Figures 9, 10, and 11 are sensitivity plots of Well V, Well H and Well M respectively. At a
reservoir pressure of 3500 psig and WHP of 400 psig, the production rate of Well V was
23,423.9 STB/day, Well H was 30,780.4 STB/day and Well M was 31,845.6 STB/day.
When the reservoir pressure and WHP were increased to 400 psig and 800 psig, respec-
tively, the production rates for the three wells declined. It is observed that decreasing the
WHP increases the production rate resulting in a better well performance irrespective of in-
creasing the reservoir pressure.
Figure 10. Sensitivity plot at varying wellhead pressure and reservoir pressure-Well H
Figure 11. Sensitivity plot at varying wellhead pressure and reservoir pressure-Well M
3.2.3. Effect of water cut
At a wellhead pressure of 400 psig, 5.5 in. tubing diameter and reservoir pressure of 3500
psi, while keeping all other parameters constant, sensitivity analysis was run on four different
values of water cut 5%, 20%, 25%, and 30% to investigate their effect on the IPR and VLP
curves of Well V, Well H and Well M. The effect of water cut on production rates is given in
Table 6. It is observed that when water cut increases from 5% to 30%, the production declines
by 41%, 36.1% and 33.5% for the three wells respectively. Therefore, high water production
will increase the hydrostatic pressure loss (between the reservoir and the surface); conse-
quently, greater reservoir energy is needed to lift the reservoir fluids to the surface. Further-
more, the production of water at any stage of the well irrespective of the percentage also
contributes adversely to the decline in the oil production rate [13].
Table 6. Production rates at varying water cut
Water cut (%) Production rates (STB/day)
Well V Well H Well M
5 21 622.5 28 653.6 29 800.9 20 16 191.0 22 327.6 23 630.3 25 14 477.1 20 309.2 21 544.6 30 12 747.1 18 316.7 19 814.2
Production decline 41% 36.1% 33.5%
3.2.4. Effect of tubing roughness
Three different tubing roughness values were considered for the sensitivity analysis to study
their effect on well performance. The sensitivity results for the tubing roughness values
(0.0006 in., 0.0015 in. and 0.0040 in.) are shown in Figure 12. From Figure 12, it was ob-
served that when tubing roughness was increased from 0.0006 in. to 0.004 in. the production
rate for the three wells decreased by 4.4%, 7.7%, and 2.3% respectively. Generally, an
6

Petroleum and Coal
Pet Coal (2020); 62(1): 27-34 ISSN 1337-7027 an open access journal
increment in tubing roughness reduces the
production rate which increases the fric-
tional loss in the tubing string.
Figure 12. Well performance at varying tubing roughness for the three wells
4. Conclusion
The performance of three different wells configurations was analyzed and investigated us-
ing PROSPER software. From the results of this study, the following conclusions were made.
The initial production capacity for Well V, Well H, and Well M were 15,586 STB/day, 19,120
STB/day and 29,658.6 STB/day respectively. Well M has a higher production rate due to its
high reservoir contact.
Sensitivity analysis for different parameters such as tubing size, wellhead pressure, water
cut, and tubing roughness was conducted to investigate their effects on production rates and
well performance. From the sensitivity analysis, the following was observed for Well V, Well H
and Well M:
The effect of changing the tubing diameter was significant in the well performance and
increasing the tubing diameter from 4.0 in. to 6.0 in. increased the production rate by
41.2%, 52.9% and 64.9% respectively.
Increasing the water cut from 5% to 30% decreased the production rate by 41%, 36.1%
and 33.5% respectively.
Increasing the tubing roughness from 0.006 in. to 0.004 in. decreased the oil rate by 4.4%,
7.7%, and 2.3% respectively.
Decreasing the wellhead pressure from 800 psig to 400 psig, increased the production rate
from 8,474.6 STB/day to 23,423.9 STB/day for Well V, 16,387.5 STB/day to 30,780.4
STB/day for Well H and 19,385.4 STB/day to 33,845.6 STB/day for Well M.
The major objective of investigating the effect of these parameters on well production was
to detect their contribution to changing a well’s production. Parameters with a significant effect
on production such as tubing size, water cut and wellhead pressure were optimized while
tubing roughness was neglected because of its minimal effect on oil production. This saves
more time and effort into the optimization process.
Based on well performance conducted using PROSPER on the different well types, there
was a production advantage for the multilateral well in relation to the horizontal and vertical
wells. The production rate of Well M is 1.6 times more than Well H and 1.9 times more than
Well V.
References
[1] Keim SA, Luxbacher KD, Karmis M. A numerical study on optimization of multilateral horizon-
tal wellbore patterns for coalbed methane production in Southern Shanxi Province, China. International Journal of Coal Geology, 2011; 86(4): 306–317.
[2] Lyu Z, Song X, Geng L, Li G. Optimization of multilateral well configuration in fractured res-ervoirs. Journal of Petroleum Science and Engineering, 2019; 172: 1153-1164.
[3] Pan Z, Connell L, Shangzhi M, Sander R, Camilleri M, Downa DI, Carrasa J, Lua M, Xiaokang F, Wenzhong Z, Benguang G, Jianping Y, Briggs C, Lupton N. CO2 Injectivity in a Multi-lateral Horizontal Well in a Low Permeability Coal Seam: Results from a Field Trial. Energy Procedia,
2013; 37: 5834–5841.
7
Petroleum and Coal
Pet Coal (2020); 62(1): 27-34 ISSN 1337-7027 an open access journal
[4] Shadizadeh SR, Kargarpour MA, Zoveidavianpoor M. Modelling of Inflow Well Performance of
Multilateral Wells: Employing the Concept of Well Interference and the Joshi's Expression. Iran. J. Chem. Chem. Eng. 2011; 30(1):119-133.
[5] Dulce MA. Technical, Economic and Risk Analysis of Multilateral Wells. Master's Thesis, Petro-leum Engineering, Texas A&M University, 2008.
[6] Alley RB, Blumsack S, Bice D. Global Energy Sources. In Earth 104: Energy and Environment. Penn's State College of Earth and Mineral Sciences, 2010.
[7] Elyasi S. Assessment and evaluation of degree of multilateral well’s performance for determi-nation of their role in oil recovery at a fractured reservoir in Iran. Egyptian Journal of Petro-leum, 2016; 25(1): 1–14.
[8] Yanping Z, Rongquan R, Hui W, Jun W. Multilateral drilling & completion technology based on Solid Expandable Tubular fixing system. Petroleum Exploration and Development, 2009;
36(6): 768–775. [9] Fidan S. Reservoir and Production Management of Hurricane Field. Tulsa: University of Tulsa,
2012. [10] Petroleum Experts. PROSPER User Manual. Edinburgh, Scotland, 2009 [11] Okotie S, Ikporo S, Oveuma A. Gas Lift Technique a Tool to Production Optimization. Inter-
national Journal of Oil, Gas and Coal Engineering, 2015; 41-46.
[12] Lyons WC, Plisga GJ. Standard Handbook of Petroleum and Natural Gas Engineering. Elsevier, 2011.
[13] Parker ES. Effect of Gas-Oil ratio on Oil Production. Abuja: African University of Science and Technology, 2010.
To whom correspondence should be addressed: Dr. Oghenerume Ogolo, Department of Petroleum and Gas Engi-neering, Nile University of Nigeria, Abuja, Nigeria, E-mail [email protected]
8