Embed Size (px)
Citation preview
DISCLOSURE APPENDIX AT THE BACK OF THIS REPORT CONTAINS IMPORTANT DISCLOSURES, ANALYST CERTIFICATIONS, AND THE STATUS OF NON-US ANALYSTS. US Disclosure: Credit Suisse does and seeks to do business with companies covered in its research reports. As a result, investors should be aware that the Firm may have a conflict of interest that could affect the objectivity of this report. Investors should consider this report as only a single factor in making their investment decision.
Petroleum Equipment Suppliers Association
Source: Atwood
Oil 101
Perspectives from a Research Analyst
Energy Markets
James K. Wicklund Managing Director, Research

Page 2
A Primer, an Overview and an Opinion
Oilifield Services is analogous to the sellers of picks and shovels during the gold rush. It was best to have the best claim. It was second best to sell everyone else their “ticket” to
paradise. The presentation will focus on the last two parts -
– Overview – Company Specific Detail – Investing in the Industry – Current Trends

Page 3
Oilfield Services: Industry Segments
The Industry is made up of several segments/life cycle categories. We list them by stage of a new oil & gas field:
1) Exploration/Seismic 2) Drilling 3) Completion 4) Production
Oil Service companies aid independent exploration and production companies (E&Ps), international oil companies (IOCs) and national oil companies (NOCs) in the exploration and production of oil and natural gas. Some of the largest Oil Service companies are SLB, HAL, BHI, and WFT.
2013 Western Service company total revenues: $392bn
Source: Spears & Associates
Exploration / Seismic, 4%
Drillings Services, 20%
Contract Drilling, 21%
Completion, 14%
Production Services, 15%
Equipment / Infrastructure,
25%
Total Revenue:$392Bn

Page 4
Source: Spears & Associates, BP Energy, Baker Hughes
Streamers
Receiver vessel
Seismic services and equipment include: Data Acquisition - collection of seismic
data Data Processing - third party processing of
seismic data prior to interpretation Library Sales - multiclient sales of non-
exclusive seismic data Software - software products for seismic
processing, interpretation, mapping, reservoir modeling and characterization, petrophysical evaluation, and engineering analysis that can run on workstations or PCs
Geophysical Equipment - data recorders, telemetry systems, geophones/hydrophones, energy sources (vibratory vehicles, air guns, etc.) used in data acquisition.
OFS - Exploration: Seismic Marine Seismic Survey
Seismic Output

Page 5
Source: Spears & Associates, Schlumberger, American Association of Petroleum Geologists
Types of Log Measurements:
Electrical properties – resistivity and conductivity
Neutron density (porosity)
Pressure testing
Sonic properties
Dimensional measurements
Formation fluid sampling
Spectroscopy (lithography)
Wireline logging includes both open and cased hole services. Open hole logging occurs during the drilling
process and measures characteristics of the rock and the fluids contained therein. Cased hole logging refers to
measurements taken in a well after a casing or liner has been set in the well. It is often applied in old wells to help operators determine what to do next (e.g. where to drill a side track well).
OFS – Exploration/Drilling: Wireline Logging/LWD

Page 6
OFS – Contract Drilling: Land Rigs Land Rigs can be mechanical or electric and
vary in terms of drilling depth and horsepower. They are used for onshore oil and gas drilling. Key equipment includes:
Derrick – A structure used for lifting and positioning the drilling string and piping above the well bore and containing machinery for turning the drill bit.
Top drive – A device suspended in the derrick that rotates the drill pipe in order to drill the well.
Draw works – A steel spool device that is used to reel out and reel in the drilling line.
Blow Out Preventer (BOP) – A large valve used to seal off a well being drilled or worked over at the surface to prevent the escape of pressure.
Source: Schlumberger

Page 7
Roller or Tri-Cone
Fixed Cutter or Polycrystalline Compact Diamond (PDC)
OFS – Drilling: Bits Drill bits come in two main categories: Roller-cone and fixed cutter (PDC). Technology advancement has led to steady share gains by PDC bits and is moving the market to buy on a $/ft drilled basis (i.e. a “rental” model). –Roller cone bits have teeth typically made of milled
steel or tungsten-carbon inserts mounted on three roller cone assemblies. They are best used in hard and medium strength formations.
–Fixed cutter bits usually use Polycrystalline Compact Diamond (PDC) inserts mounted on the body of the bit. Fixed cutter bits are often custom engineered for specific formation characteristics. PDC bits have typically been used for soft formations, but advancing technology now puts them in hard, abrasive rock.
Source: Spears & Associates

Page 8
OFS – Drilling: Fluid System The drilling fluid, also known as drilling mud, is one of the major factors in the success or failure of the drilling operation. Drilling fluid serves three functions:
– Lifts cuttings to the surface
– Cools the drill bit
– Supports the integrity of the wellbore and prevents hydrocarbon “kicks” by providing weight/pressure that is generally greater than that of the reservoir (known as an “over-balanced” condition). The fluids handling system re-circulates the
drilling mud and includes: – Mud pump
– Mud mixer
– Shale shaker - to remove cuttings from the subsurface
– Mud pit – to collect used mud for recirculation
Fluid Circulation System
Fluid Enters the well at the Bit

Page 9
Directional and Horizontal Wells
Directional drilling entails drilling in a direction other than vertical. There are two methods:
– Conventional uses a bend near the bit and a steerable mud motor. Drilling fluid is pumped through the mud motor, turning the bit and thereby allowing it to drill in the direction the bit points (unlike conventional [vertical] drilling, the drill string does not rotate).
– Rotary Steerable Tools (RST) allow the driller to “point” or “push” the bit without stopping drill pipe rotation, allowing for faster and smoother hole construction.
Drilling directionally entails use of steering systems (Measurement While Drilling or MWD) and Logging While Drilling or FEWD or LWD). LWD measurements are generally similar to those taken in wireline logging.
OFS – Directional Drilling
Rotary Steerable Technology
Source: www.horizontaldrilling.org, Halliburton

Page 10
Completing the well is the process of accessing the reservoir including:
– Installation of casing and liner. Casing is large diameter steel pipe that is cemented into the well bore to ensure stability of the
formation. – Perforating the casing to access the reservoir. A series of “chargers” are deployed to where the well accesses the
reservoir.
– Stimulation (see next page)
OFS - Completions
Casing
Reservoir
Perforations
Perforating Casing/ Completion
Other key products include: – Packers and plugs to isolate zones
– Screens to keep sands away from production
– Isolation valves to manage flows from multiple completion zones
Screen Layers
Source: Schlumberger, Halliburton
Completion System
Packers

Page 11
Source: BJ Services, Carbo Ceramics, Independent Oil & Gas Service, Gulftex, ProPublica
Frac job
Frac unit
Cementing unit
OFS – Completion: Pressure Pumping Pressure pumping consists primarily of cementing and various forms of production stimulation.
–Cementing of Casing (approx 20% of P.P revenue) - As described in the completions section, casing is cemented in place in the well bore. Cement is pumped thru the casing to the end of the section and forced back up the well in the annulus (between outer wall and well) where it sets and hardens.
–Stimulation (80%) – Services include hydraulic fracturing (dominant), acidizing and nitrogen injection.
In fracturing, fluid is pumped at high pressures into the well bore to create/widen fractures in the formation so oil/gas can flow into the well. Proppants are used to keep fractures open and can be sand, resin-coated sand, and/or ceramic.
In acidizing, acids can be used to etch away rock.
Proppants

Page 12
OFS – Hydraulic Fracturing Equipment
Source: Jereh-PE, Weir SPM, Schlumberger
Treating Iron
Frac Pump Transmission
Engine Cooling System
Power End Expected Lifespan: Up to 2 years
Fluid End Expected Lifespan: Ranges from 500 to 1,400 hours
Frac Pump: a high pressure, high volume
pump used in hydraulic fracturing
• Manufacturers include independents such as
National Oilwell Varco (NOV), Gardner Denver
(private), Weir SPM (WEIR.LN), Kirby Corp. (KEX)
and vertically integrated providers such as Halliburton
(HAL) and FTS International (private)
Treating Iron: temporary surface piping, valves
and manifolds required to bring fluid
treatment down to wellbore from the pump
FMC Technologies’ (FTI) Weco™ and
Chiksan™ and Forum Energy Technologies
(FET).
Frac Truck
Frac Pump

Page 13
OFS – Hydraulic Fracturing Market
Source: Credit Suisse estimates, company data, and Spears & Associates
2013 Pressure Pumping Market Share
HAL, 27%
SLB, 20%
BHI, 13%
TCW CN, 5%
FTS, 5%
CFW CN, 4%
WFT, 5%
RES (Cudd Pumping), 3%
NBR, 3%PTEN, 2%
SPN, 1%
Others, 11%HAL
SLB
BHI
TCW CN
FTS
CFW CN
WFT
RES (Cudd Pumping)
NBR
PTEN
SPN
Others North American Hydraulic Horsepower (HHP)
0
2,000,000
4,000,000
6,000,000
8,000,000
10,000,000
12,000,000
14,000,000
16,000,000
18,000,000
20,000,000
2003 2004 2005 2006 2007 2008 2009 2010 2011 2012 2013 2014E
NAM Frac Horsepower CS NAM Frac Horsepower

Page 14
North America Hydraulic Horsepower Supply
Source: Credit Suisse estimates, company data, and Spears & Associates
Ticker/Company 2010 Capacity (HHP)
2011 Capacity Additions (HHP) 2011 Capacity (HHP) 2012 Capacity
Additions (HHP)2012 Capacity
(HHP)2013 Capacity
Additions (HHP)2013/Current
Capacity (HHP)2014 Capacity
Additions (HHP)2014/Current
Capacity (HHP)
Baker Hughes (BJ Services) 1,300,000 300,000 1,600,000 200,000 1,800,000 100,000 1,900,000 - 1,900,000 Halliburton 1,900,000 700,000 2,600,000 400,000 3,000,000 100,000 3,100,000 - 3,100,000
Schlumberger 1,500,000 400,000 1,900,000 300,000 2,200,000 100,000 2,300,000 - 2,300,000 Weatherford 500,000 250,000 750,000 50,000 800,000 800,000 - 800,000
FTS International 65,000 1,328,500 1,393,500 191,000 1,584,500 56,250 1,640,750 - 1,640,750 Trican Well Service Co. 615,000 240,000 855,000 145,000 1,000,000 - 1,000,000 - 1,000,000
Nabors Industries 450,000 230,000 680,000 145,000 825,000 (25,000) 800,000 - 800,000 Calfrac 414,000 346,000 760,000 217,000 977,000 217,000 1,194,000 - 1,194,000
Patterson-UTI 365,000 105,000 470,000 130,000 600,000 163,050 763,050 - 763,050 Sanjel (USA) Inc. 250,000 130,000 380,000 20,000 400,000 50,000 450,000 - 450,000
C&J Energy Services 95,000 95,000 190,000 116,000 306,000 - 306,000 20,000 326,000 Superior Energy Services 325,000 75,000 400,000 200,000 600,000 60,000 660,000 - 660,000
Basic Energy 180,000 90,000 270,000 21,000 291,000 6,000 297,000 - 297,000 Canyon Technical Services 100,000 37,000 137,000 78,000 215,000 10,000 225,000 - 225,000
RPC, Inc. (Cudd) 350,000 250,000 600,000 83,000 683,000 27,000 710,000 - 710,000 Gasfrac Energy Services 75,000 25,000 100,000 35,000 135,000 - 135,000 - 135,000
Archer 98,800 9,000 107,800 42,200 150,000 58,000 208,000 - 208,000 Seventy Seven Energy Inc. 250,000 75,000 325,000 35,000 360,000 - 360,000 - 360,000
Others 250,000 150,000 400,000 100,000 500,000 100,000 600,000 - 600,000 Total 9,082,800 13,918,300 16,426,500 17,448,800 17,468,800
Page 15
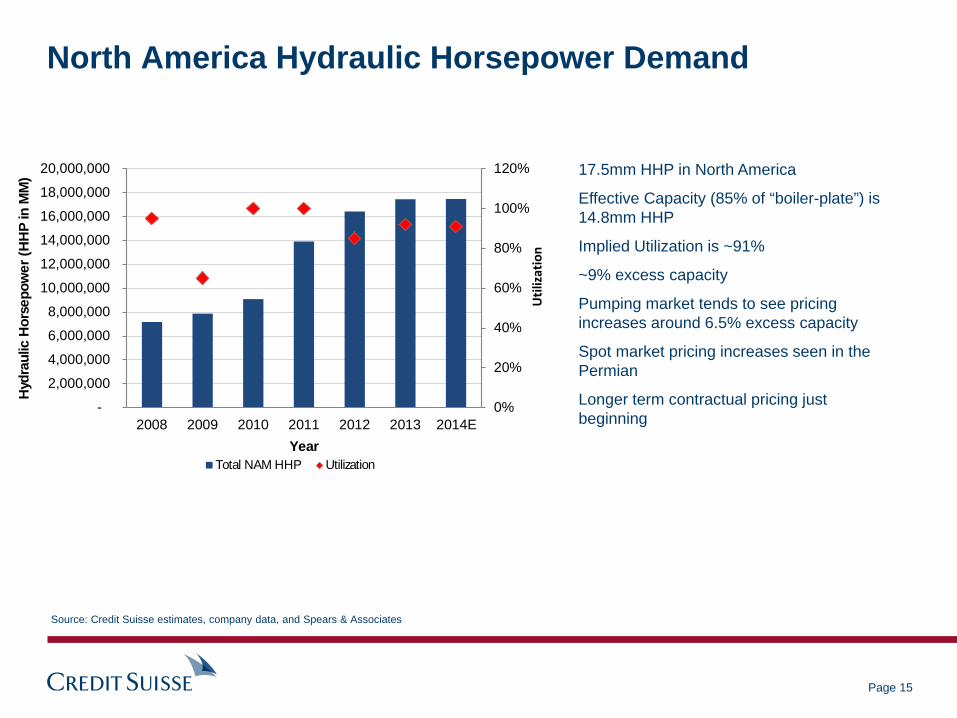
North America Hydraulic Horsepower Demand
Source: Credit Suisse estimates, company data, and Spears & Associates
0%
20%
40%
60%
80%
100%
120%
-
2,000,000
4,000,000
6,000,000
8,000,000
10,000,000
12,000,000
14,000,000
16,000,000
18,000,000
20,000,000
2008 2009 2010 2011 2012 2013 2014E
Hyd
raul
ic H
orse
pow
er (H
HP
in M
M)
YearTotal NAM HHP Utilization
Util
izat
ion
17.5mm HHP in North America
Effective Capacity (85% of “boiler-plate”) is 14.8mm HHP
Implied Utilization is ~91%
~9% excess capacity
Pumping market tends to see pricing increases around 6.5% excess capacity
Spot market pricing increases seen in the Permian
Longer term contractual pricing just beginning

Page 16
Source: FMC Technologies, Oceaneering International, Umbilical Manufacturers’ Federation
Subsea Tree Surface Tree
OFS – Production: Subsea A Christmas tree is a set of valves that sit on top of the wellhead and control the flow of pressure of a producing well.
– Surface trees are installed on land and on offshore platforms.
– Subsea trees are installed on the sea bed.
Manifolds house equipment and pipes that control, direct and measure the flow of fluids to/from the subsea well.
Umbilicals are used for the control of subsea production systems. Umbilicals are made of either steel or thermoplastic tubes that contain fluid conduits for hydraulic power and chemical injection.
Subsea TreeManifold
UmbilicalsFlowlines
Subsea TreeManifold
UmbilicalsFlowlines
Subsea Production System
Umbilical

Page 17
Source: Company data and Quest Offshore
OFS – Subsea Equipment
3476 39 50 27 40
147110
174175
7344
83
169
26
107
04
8
232122
38 224
165
159
19350 52
60
26
70
126
42
26 73
1 2
2014
Mea
n Ca
se, 5
36
0
100
200
300
400
500
600
2007 2008 2009 2010 2011 2012 2013
Tota
l Sub
sea T
rees
Awa
rded
Year
Aker OneSubsea (CAM) DRQ FTI GE Other 2014 Mean Case
49%
24%12%
60% 53%38% 35%
23%
34% 55%
20%
14%
20% 31%
10%
10%
19%7% 22%
30%8%
7%15%
12% 13% 9% 10%27%
5% 2%
2% 1% 2%
0%
20%
40%
60%
80%
100%
2007 2008 2009 2010 2011 2012 2013
FTI OneSubsea (CAM) GE Aker DRQ
553452 Trees 434 319 373 311 416
Page 18
Source: MMS, Credit Suisse
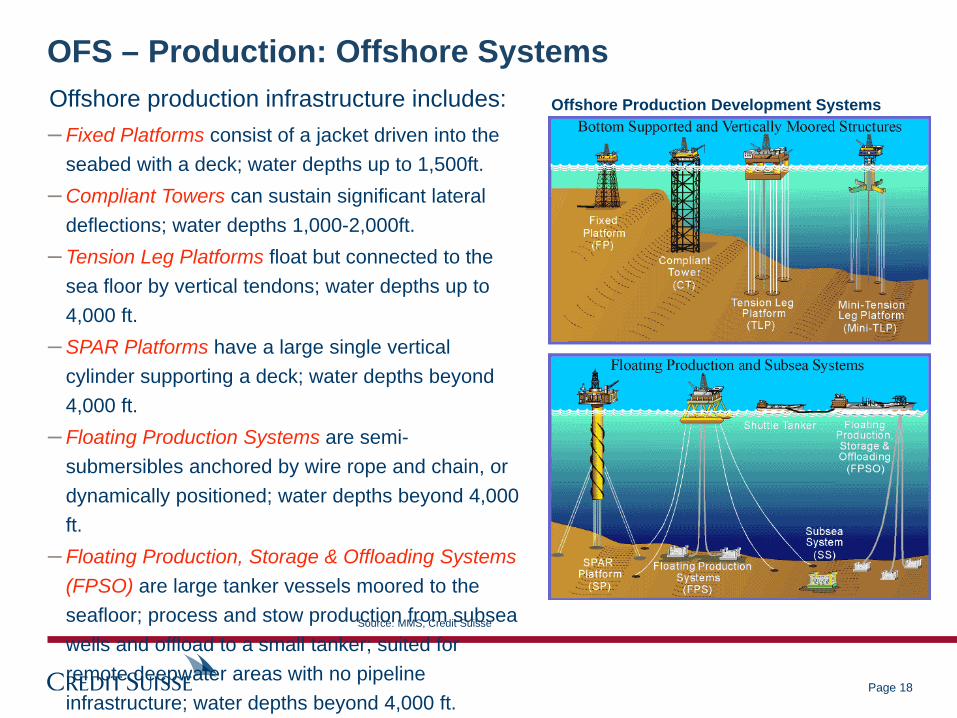
OFS – Production: Offshore Systems Offshore production infrastructure includes: – Fixed Platforms consist of a jacket driven into the
seabed with a deck; water depths up to 1,500ft. – Compliant Towers can sustain significant lateral
deflections; water depths 1,000-2,000ft. – Tension Leg Platforms float but connected to the
sea floor by vertical tendons; water depths up to 4,000 ft.
– SPAR Platforms have a large single vertical cylinder supporting a deck; water depths beyond 4,000 ft.
– Floating Production Systems are semi-submersibles anchored by wire rope and chain, or dynamically positioned; water depths beyond 4,000 ft.
– Floating Production, Storage & Offloading Systems (FPSO) are large tanker vessels moored to the seafloor; process and stow production from subsea wells and offload to a small tanker; suited for remote deepwater areas with no pipeline infrastructure; water depths beyond 4,000 ft.
Offshore Production Development Systems

Page 19
Source: SBM Offshore presentation
OFS – Floating Production, Storage & Offloading System Awards

Page 20
Source: Spears & Associates, Weatherford, Independent Oil & Gas Service, Schlumberger
Rod pump
OFS – Production: Artificial Lift Artificial Lift is a technology for mature oil and gas wells that need to boost fluids out of the wellbore, particularly as they produce water. 90% of existing producing oil wells and gas wells requiring water removal utilize some type of artificial lift. Main types of artificial lift include:
– Reciprocating rod pumps – a plunger and valve assembly driven by surface motor (low tech)
– Electric Submersible Pumps (ESPs) – typically several centrifugal pump stages to access
different wellbore sections driven by a downhole electric motor (highest tech)
– Progressive Cavity Pumps (PCPs) – a surface motor rotates the sucker rods using a stator and rotor to cause fluid to flow upward
ESP PCP

Page 21 Source: Spears & Associates, Weatherford, Independent Oil & Gas Service, Schlumberger
Artificial Lift Spending by Type
OFS – Production: Artificial Lift Artificial Lift has gained recent attention due to a global increase field decline. 95% of active oil wells utilize some type of artificial lift.
– M&A, 2013 – GE bought Lufkin Industries, a primarily rod-lift
oriented company, for $3.3B, or ~13.5x EBITDA. Although
rod lift is lower tech, it is the favored technology for low flow
wells. WFT sold its Russian ESP business for 8.5x EBITDA
– Baker Hughes FLEXPump™ – In 2Q13 BHI announced its
FLEXPump™ series, an ESP that can operate in low-flow
wells similar to rod lift. Lift Type by Well
Case Study Major Producer Operating 26k Wells
Source: Spears & Associates and Credit Suisse
Rod Lift Market Share ESP Market Share

Page 22
Source: TETRA Technologies (Compressco), Ariel
Compressor
OFS – Production: Compression Compression raises the pressure of natural gas in the reservoir so that it will flow into pipelines and other facilities. There are three segments to the field compression market:
– Wellhead
– Gas gathering (production tank – vapor recovery)
– Processing
Compressors have historically been owned and operated by oil companies, but the U.S. is now approximately 1/3 outsourced to contract compression providers.
Gas Gathering Compression

Page 23
Unconventional Compression Services – Vapor Recovery
Source: TETRA Technologies (Compressco)
Used primarily in connection with oil and gas liquids production
- Vapor recovery captures gas vapors from oil storage tanks
- Casing gas systems enhance oil production by reducing down-hole pressure

Page 24
OFS – Production: Well Servicing Well Servicing refers to the maintenance procedures that take place on a well after the well has been completed and production from the reservoir has begun. It is done to sustain and enhance the productivity of the well. Key products/services include:
–Workover – the process of performing major maintenance or remedial treatment on a well (KEG and BAS).
–Coiled tubing – tubing used for the placement of fluids or manipulation of tools during workover (BHI, SLB, SPN, and KEG)
–Snubbing – the process of putting drill pipe into the wellbore when the BOPs are closed and pressure is contained in the well
–Plug and Abandonment – the process of preparing a well to be permanently closed
Source: Schlumberger, MTG
Workover rig
Coiled tubing unit

Page 25
Source: IHS Petrodata
OFS – Offshore Drilling: Offshore Rigs by Type Floaters: A floating mobile offshore drilling unit that
operates in midwater (MW), deepwater (DW) and ultra-deepwater (UDW).
Floaters were constructed in Generations with each successive Gen adding new technology/capabilities
– Semisubmersibles float on pontoons and are moored to the ocean floor or dynamically positioned (good for development drilling)
– Drillships are independently mobile (do not need towing vessels) and are generally dynamically positioned (good for exploration)
Jackup: A mobile offshore drilling unit that operates in shallow water and rests on the ocean floor when drilling.
– High Spec Jackups are capable of drilling High Pressure, High Temp (HPHT) Wells (predominately in NW Europe and MENA) 0
50
100
150
200
250
300
350
Newbuilds 0-4 5-9 10-19 20-29 Old
Standard Premium High Spec
Jackups by Spec and Age Range
0
50
100
150
200
250
1st-3rd Gen 4th-5th Gen 6th
Newbuilds Current Fleet
Floaters by Generation

Page 26
Source: Noble, Rowan, Atwood
OFS – Offshore Drilling: Offshore Rigs by Water Depth Shallow Water (0-999’) Dominated by
Jackup rigs and occasionally semis (harsh environments). New Jackup construction is focused
in the 350-400’ range. Midwater (1,000-4,999’) Typically carried
out by early generation semis or harsh environment semis in NW Europe. Very few (11) midwater rigs have
been ordered in the last 5 years Deepwater/UDW (5,000’+) The
deepwater and especially the UDW requires newer gen semis and drillships The newest deepwater rigs are being
ordered with dual BOPs and dual activity drilling capabilities with water depth ratings up to 12,000’
New Gen, Dual BOP, Dual Activity Drillship
Jackup Semisubmersible

Page 27
OFS – Offshore Drilling: Rigs by Geography - Jackups
Middle East and Asia/Pac are the largest jackup markets (50% of market). – Not All Jackups Are Created Equal - The North Sea is predominantly a premium market
Source: ODS-Petrodata, note figures exclude newbuilds
15 63 25
HS P S
02
0
HS P S
126
4
HS P S
1466 67
HS P S
218 9
HS P S
23 202
HS P S
1 410
HS P S
3 923
HS P S
020 7
HS P S
334
11
HS P S

Page 28
OFS – Offshore Drilling: Rigs by Geography - Floaters
Global floater markets as % of total
Source: ODS-Petrodata, note figures exclude newbuilds
410
26
6th+ <6th MW
3110 7
6th+ <6th MW
21 169
6th+ <6th MW
36 21 20
6th+ <6th MW
26
3
6th+ <6th MW
375
6th+ <6th MW
1
6th+ <6th MW
14 6
6th+ <6th MW
41
6th+ <6th MW
6 5
36
6th+ <6th MW
The Golden Triangle (Brazil, US GoM and WAFA) are the largest basins for deepwater floaters

Page 29
Source: Bristow Group, Superior Energy, Wartstila, MMS
Supply Boat
OFS – Offshore Drilling: Offshore Logistics
Helicopters are used for transporting personnel between onshore bases and offshore platforms, drilling rigs, and installations. Operators include BRS, ERA and HELI. Lift Boats are self-propelled, self-elevating vessels with a relatively large, open deck for carrying equipment in support of offshore exploration and production, and which can serve as a platform from which maintenance and construction work can be conducted. Operators include CKH and HERO. Supply Boats are ships specifically designed to transport goods (i.e. drilling mud, cement, diesel fuel, chemicals, water, tools) and personnel to and from offshore oil rigs/platforms. Operators include TDW, HOS, GLF and CKH.
Lift Boat

Page 30
Source: CalDive, Oceaneering
OFS – Production: Offshore Construction Pipelay vessels use either the S-lay method in water depths <2K ft where pipe is laid into the water horizontally and bends twice in an S-shape, or the J-lay method in deep water where pipe is laid vertically and only bends once as it hits the seabed. Derrick barges have cranes used to lift heavy structures such as platforms/topsides. Diving support vessels (DSVs) support divers performing inspection, maintenance, repair (IMR) and welding. Surface diving can be performed in depths up to 200 ft; saturation diving can be performed in 200-1,000 ft depths. Offshore Support Vessels (OSVs) are equipped with Remotely Operated Vehicles (ROVs) , tethered underwater robots used for IMR, construction and drill support in deep water.
Combination Pipelay/Derrick Barge
ROV

Oilfield Services Company Specific Detail

Page 32
OFS: Life Cycle Exposure and Selected Co’s Life Cycle Stage Oil Services Activities Examples of OFS Co's Life Cycle Stage Oil Services Activities Ex. of OFS Co'sEXPLORATIONInitial Reservoir Analysis Seismic Acq./Processing CGG, SLB, PGS.NO Evaluation Wireline Logging SLB, HAL, BHI
Reservoir Imaging HAL Production Testing SLB, Expro, HALCoring CLB
DRILLINGContract Drilling Land NBR, HP, EDCL, PTEN Drilling Services OCTG TS, V&M, X
Shallow Water HERO, RDC Directional Drilling SLB, BHI, HAL, WFTDeep Water RIG, ESV, SDRL, NE Fluids SLB, HAL, BHI
DO, ORIG, PACD, RDC, ATW Bits SLB, BHI, HALCOMPLETIONCompletion Services Pressure Pumping HAL, SLB, BHI, TCW.CN
"Tools" HAL, BHI, WFT, SLBCasing Handling FI, WFT
PRODUCTIONWell Servicing Workover Rigs KEG, NBR, BAS Logistics Support Supply Boats TDW, CKH, GLF, HOS
Coiled Tubing SLB, HAL, BHI, SPN ROV Services OII, HLXCased Hole Wireline Logging SPN Helicopter BRS
Production Enhancement Artificial Lift WFT, SLB, GE, BHIChemicals Nalco, BHI, SLBNat Gas Compression EXH, TTI, NGS
EQUIPMENT/INFRASTRUCTUREDevelopment Engineering/Design TEC.FP, SUBC.NO, SPM.IM Capital Equip. Rig Equipment NOV, Aker, CAM
Fabrication MDR, GIFI Seismic Equipment IO, CGGInstallation HLX, TEC.FP Production Unit Equip. NOV, OIS
Production Subsea/Surface Equip. FTI, CAM, Aker, GEUmbilicals OII, TEC.FPRisers/Flowlines GE, DRQ
Source: Credit Suisse
Page 33
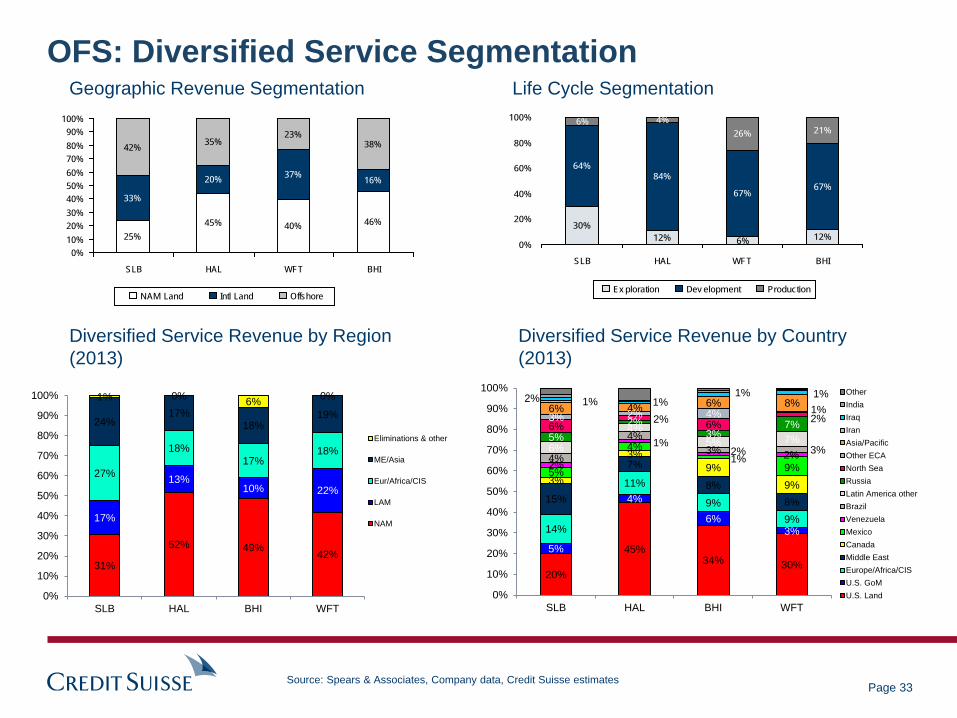
Geographic Revenue Segmentation Life Cycle Segmentation
Diversified Service Revenue by Country (2013)
Diversified Service Revenue by Region (2013)
Source: Spears & Associates, Company data, Credit Suisse estimates
OFS: Diversified Service Segmentation
30%12% 6% 12%
64%84%
67%67%
6% 4%26% 21%
0%
20%
40%
60%
80%
100%
SLB HAL WFT BHI
Ex ploration Dev elopment Production
25%45% 40% 46%
33%
20% 37% 16%
42% 35%23%
38%
0%10%20%30%40%50%60%70%80%90%
100%
SLB HAL WFT BHI
NAM Land Intl Land Offshore
31%
52% 49% 42%
17%
13% 10% 22%
27%
18% 17%
18%
24% 17%
18% 19%
1% 0% 6% 0%
0%
10%
20%
30%
40%
50%
60%
70%
80%
90%
100%
SLB HAL BHI WFT
Eliminations & other
ME/Asia
Eur/Africa/CIS
LAM
NAM
20%
45% 34% 30%
5%
4%
6% 3% 14%
11%
9% 9%
15%
7%
8% 8%
3%
3% 9%
9% 5%
4% 1%
9% 2%
1% 2% 2% 4%
4% 3% 3% 6%
4% 5% 7% 5%
2% 3%
7% 6% 2% 6% 2% 3% 2% 4% 1% 6% 4% 6% 8% 1% 2% 1%
1% 1%
0%
10%
20%
30%
40%
50%
60%
70%
80%
90%
100%
SLB HAL BHI WFT
OtherIndiaIraqIranAsia/PacificOther ECANorth SeaRussiaLatin America otherBrazilVenezuelaMexicoCanadaMiddle EastEurope/Africa/CISU.S. GoMU.S. Land

Page 34
OFS: Market Shares for Key Services/Products
2013 Revenues Artificial Lift = $13.2B Coiled Tubing = $5.4B
Directional Drilling = $14.6B Drill Bits = $5.1B
WFT, 23%
BHI, 14%
SLB, 15%
GE, 14%
Dover, 7%
Artificial Lift
SLB, 22%
HAL, 13%
BHI, 10%
SPN, 7%
TCW.CN, 4%
Coiled Tubing
SLB, 31%
HAL, 15%
BHI, 18%
WFT, 9%
Sci. Drilling,
4%
Directional Drilling
SLB, 29%
BHI, 25%
HAL, 16%
NOV, 13%
Varel Int.'l, 4%
Drill Bits
Source: Spears & Associates
Page 35
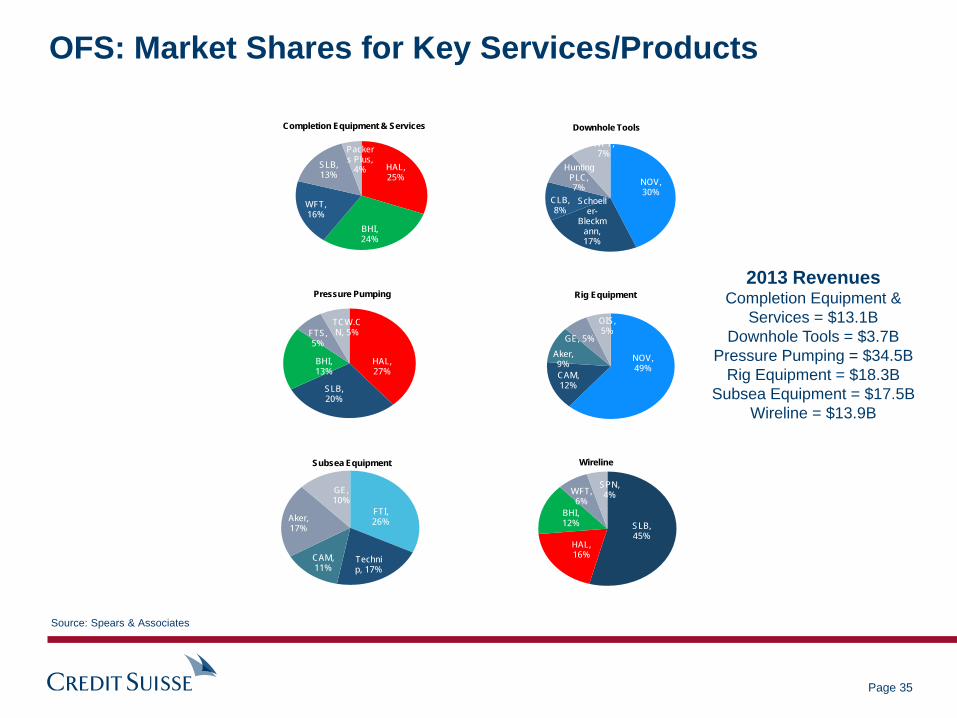
OFS: Market Shares for Key Services/Products
2013 Revenues Completion Equipment &
Services = $13.1B Downhole Tools = $3.7B
Pressure Pumping = $34.5B Rig Equipment = $18.3B
Subsea Equipment = $17.5B Wireline = $13.9B
HAL, 25%
BHI, 24%
WFT, 16%
SLB, 13%
Packers Plus,
4%
Completion Equipment & Services
NOV, 30%
Schoeller-
Bleckmann, 17%
CLB, 8%
Hunting PLC, 7%
WFT, 7%
Downhole Tools
HAL, 27%
SLB, 20%
BHI, 13%
FTS, 5%
TCW.CN, 5%
Pressure Pumping
NOV, 49%
CAM, 12%
Aker, 9%
GE, 5%
OIS, 5%
Rig Equipment
FTI, 26%
Technip, 17%
CAM, 11%
Aker, 17%
GE, 10%
Subsea Equipment
SLB, 45%
HAL, 16%
BHI, 12%
WFT, 6%
SPN, 4%
Wireline
Source: Spears & Associates

Page 36
OFS: Market Shares for Equipment/Infrastructure
Source: Spears & Associates
RIG36%
ESV19%
SDRL19%
NE15%
DO11%
Offshore Contract Drilling
NBR27%
HP25%
Eurasia20%
Ensign14%
PTEN14%
Land Contract Drilling
Bourbon
29%
TDW28%
Maersk18%
CKH15%
HOS10%
Supply Vessels
HELI43%
BRS37%
Pet.'l Heli12%
Era Avi.8%
Petroleum Aviation
KEG36%
NBR28%
Eurasia15%
BAS11%
SPN10%
Well Servicing2013 Revenues
Offshore Contract Drilling = $54.5B Land Contract Drilling = $29.5B
Supply Vessels = $8.0B Well Servicing = $6.4B
Petroleum Aviation = $4.9B

Page 37
OFS – Offshore Drilling: Fleet Profiles
Fleet Profile by Company (Floaters)
Source: IHS Petrodata
Fleet Profile by Company (Jackups)
0
5
10
15
20
25
30
35
40
45
50
ESV NE HERO SDRL RDC RIG ATW DO
NewbuildStandardPremHigh Spec
• RIG is the largest floater operator in the world with a mix of new and old generation floaters.
• SDRL, PACD, and ORIG have premium UDW fleets. • ESV and NE have the largest JUs fleet –premium and standard rigs.
• Stacking/Scrapping We expect older gen rigs to be idled and removed from the fleet.
0
10
20
30
40
50
60
70
80
RIG SDRL DO ESV NE ORIG ATW PACD RDC
Newbuilds
6th
5th
4th
3rd
2nd

Page 38
Source: Company Data
OFS – Offshore Drilling: Supply Boats by Region
GLF
GLF GLF
HOS
HOS
CKH
CKH
CKH
CKH
CKH
TDW TDW
GLF
TDW
TDW
TDW
TDW
GLF

INVESTING IN OILFIELD SERVICES & DRILLING

Page 40
OFS: The Traditional Upstream Spending Cycle
North America leads the upturn, international markets lag
Int'l markets, deepwater markets accelerate and cycle approaches peak earnings
Change in macro environment precipitates decline in commodity prices
North American independents curtail upstream spendingCycle begins with
upturn in commodity prices
North America generally leads in a resumption in upstream spending because more of the activity is conducted by smaller (and therefore more nimble) operators (E&P companies). With shorter time horizons, generally, the North American operators are also the first to curtail spending in a downturn

Page 41
OFS: Oil Services Activities Through the Cycle
Production related services are the most resilient and the earliest to “revive”, but traditionally have the lowest Beta. Secular challenges related to hydrocarbon production have sustained higher-than-expected growth in the latest upcycle.
With more confidence in sustained higher commodity prices, drilling and completion related activity responds. Exploration is generally the last to strengthen and the first to fall in a downturn in oil prices.
As Drilling and Completions activity picks up, beneficiaries include rig count driven companies selling drilling materials (e.g. bits, fluids) - margins improve quickly as manufacturing absorption issues dissipate.
Companies with solid positions in International markets as well as deepwater/remote areas benefit from pick up in international activity. Key beneficiaries: Large caps, deepwater drillers
Oil companies increasingly focus on new Prospect Identification as existing prospects have been developed. Seismic companies are key beneficiary.
Companies that (1) Install Infrastructure for new developments (Production) and (2) provide new drilling rig equipment tend to see fastest earnings growth later in the cycle. Stocks respond to backlog growth in middle stages of the cycle.
Initial activity includes Well Servicing and Production Enhancement, i.e. the fastest way to take advantage of higher commodity prices is not through the drill bit. Beneficiaries: pressure pumpers, workover drilling contractors
Drilling Services companies experience price leverage as rig count rises and service utilization increases.

Page 42
OFS – Offshore Drilling: The Cycle
Source: IHS Petrodata, Company data, Credit Suisse estimates
Peak
Trough
Newbuild Orders Peak
Utilization Declines
Dayrates Decline
Term Durations Shrink
Rigs Warm Stacked
Old Gen Rigs Outperform
Newbuild Orders Pickup
Rates Approach Cash
Costs
Rig Values Decline
New Gen Rigs Outperform
Utilization Increases
Dayrates Increase
Newbuild Prices Increase
Term Durations Increases Rigs Stacked
Capital Markets Pick Up

Page 43
OFS – Offshore Drilling: Dayrates Dayrates and utilization are key drivers of driller earnings power
Worldwide Floater Dayrate/Utilization
Source: IHS Petrodata
Worldwide Jackup Dayrate/Utilization
80%
82%
84%
86%
88%
90%
92%
94%
96%
98%
100%
$0
$100
$200
$300
$400
$500
$600
2003 1H 2004 2H 2006 1H 2007 2H 2009 1H 2010 2H 2012 1H 2013 2H
MW Dayrate DW DayrateMW Util DW Util
80%
82%
84%
86%
88%
90%
92%
94%
96%
98%
100%
$0
$20
$40
$60
$80
$100
$120
$140
$160
2003 1H 2004 2H 2006 1H 2007 2H 2009 1H 2010 2H 2012 1H 2013 2H
Dayrate
Utilization

Page 44
OFS – Offshore Drilling: Dayrates Dayrates Matter, But Sentiment More Important
Source: IHS Petrodata, Credit Suisse Estimates
0
100
200
300
400
500
600
700
Jun-03 Sep-04 Dec-05 Mar-07 Jun-08 Sep-09 Dec-10 Mar-12 Jun-13
Deepwater Dayrates
Driller Basket
*Driller Basket includes NE, ESV, RIG, DO and ATW
Indexed Growth of Deepwater Dayrates and Driller Stocks
Drillers fell of post NE
earnings call reaffirming near
term market weakness

Page 45
OFS – Offshore Drilling: Shareholder Returns • Dividends Matter – But Payout of Cash Flow Matters More
Source: Company Data, Credit Suisse Estimates
Indicated Yield on 2015 Dividend Payout of Estimated 2015 OCF
0%
2%
4%
6%
8%
10%
12%
SDRL DO RIG PACD NE ESV ORIG RDC ATW0%
10%
20%
30%
40%
50%
60%
70%
SDRL DO RIG ESV PACD NE ORIG RDC ATW

Page 46
OFS: Traditional Valuation Methodologies Services – as an earnings momentum group, we
believe shares have generally been valued on forward year P/E and to a lesser extent forward EV/EBITDA. During trough periods, P/E or EV/EBITDA is applied to normalized or “mid-cycle” earnings estimates
Equipment – the backlog visibility, which can extend out as far as three years, lends itself to DCF. However, forward earnings metrics are also used
Drillers – with high asset intensity associated with owning the rigs, and different depreciation methods used by the companies, the industry tends to use forward year P/CF (EV/EBITDA). In the recent upcycle, backlog visibility lends itself to DCF. In troughs, replacement value metrics are also used
Offshore Asset Replacement Cost Trend
Diversified Service Forward P/E Trend
0%
50%
100%
150%
200%
250%
Q1-97 Q4-98 Q3-00 Q2-02 Q1-04 Q4-05 Q3-07 Q2-09 Q1-11 Q4-12
Avg

Page 47
OFS: Indicators Leading Indicators
– Seismic – Licensing rounds, Oil company exploration budgets, Sustained higher commodity prices
– Drilling and Completion – Oil company spending budgets (generally set early in the calendar year, although they are revised intra-year), Permitting activity
Coincident Indicators – Oil and natural gas prices – Earnings. As a traditionally earnings momentum-driven group, quarterly earnings matter. – Pricing (day rates for drillers). Contract drilling shares are generally highly correlated with
the trajectory of day rates. – Rig count. North American rig counts are updated weekly (sources include Baker
Hughes, M-I) or bi-weekly (The Land Rig Newsletter). Non-North American rig counts are updated monthly

Current Oilfield Service Trends

Page 49
Technology Is King The larger OFS companies with better technology will continue to win share Technology creates value through a simple formula:
Source: Halliburton Investor Day 2013 Presentation

Page 50
“Managed Shale” Will Revolutionize OFS in the Next Five Years
Source: Halliburton Investor Day 2013 Presentation
Managed Shale is a term used to describe a business model in which an OFS company takes over all aspects of development, Integrated Project Management (IPM), in return for a pre-determined fee or a profit-sharing agreement. We expect to see accelerated adoption of Managed Shale among National Oil Companies (NOCs) and in mature fields. The results:
– Higher Returns for OFS and the Asset Owner – lower costs and higher production will grow returns
– Higher Margins for OFS – less competition because fewer players can compete in this
market and increase in risk leads to better reward
– Diversified OFS Companies Reap the Rewards – The large, diversified OFS companies with a full product service line offering are suited for these projects
60% of NOC’s production is declining at
8% p.a. which creates an opportunity for
OFS companies to deploy their newest
technologies to boost production.

Page 51
Efficiencies: Wells Count Up, Costs Down
Wells/Section up +220% Costs per well up < 5%
Resource Potential up +256% Source: EOG Resources

Page 52
Rising Costs for Majors Leads to Increase Focus on Returns
Significant cost escalations since 2010 – Key areas of cost increases: Subsea equipment Subsea installation and
repair Maintenance and labor
BP’s notion of “Value over Volume” – Focused on returns – Separating their Lower 48
onshore O&G business in the U.S.
Source: ExxonMobil and BP plc

Page 53
Upstream Capex Growth Slowing/Flatting; Shifting Onshore
CVX’s capital & exploratory (C&E) budget up +8.5% Y-o-Y
Anadarko’s ’14 capex is +12% YoY to $8.1-$8.5bn
but 60% is going onshore vs. offshore
Source: Chevron Investor Day 2014 Presentation
Page 54
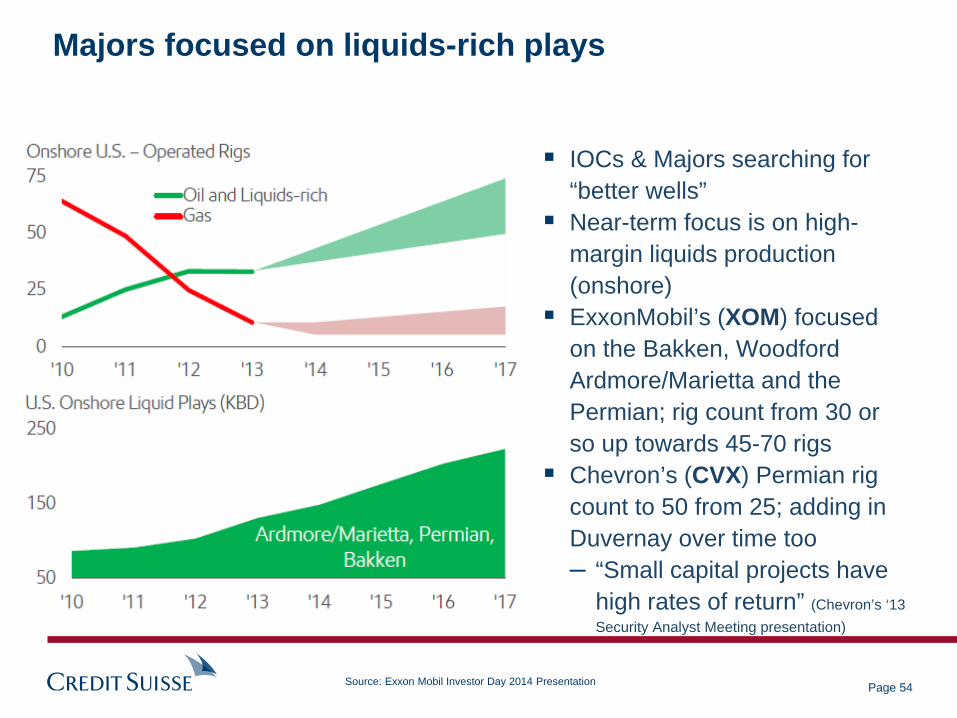
Majors focused on liquids-rich plays
IOCs & Majors searching for “better wells”
Near-term focus is on high-margin liquids production (onshore)
ExxonMobil’s (XOM) focused on the Bakken, Woodford Ardmore/Marietta and the Permian; rig count from 30 or so up towards 45-70 rigs
Chevron’s (CVX) Permian rig count to 50 from 25; adding in Duvernay over time too – “Small capital projects have
high rates of return” (Chevron’s ‘13 Security Analyst Meeting presentation)
Source: Exxon Mobil Investor Day 2014 Presentation

Page 55
OFS – Offshore Drilling: Lots of Rigs Delivering
Source: IHS Petrodata, Company data, Credit Suisse estimates
Worldwide Floater Fleet Growth Worldwide Jackup Fleet Growth
0%
2%
4%
6%
8%
10%
12%
0
50
100
150
200
250
300
350
400
2003 2005 2007 2009 2011 2013 2015
Floater Supply Growth
-4%
-2%
0%
2%
4%
6%
8%
10%
12%
0
100
200
300
400
500
600
700
2003 2005 2007 2009 2011 2013 2015
JU Supply Growth
• 2013-2015 record years for floater deliveries (2014 peak ~25 deliveries) • 2014-2016 record year for jackup deliveries (2015 peak ~60 deliveries)

Page 56
OFS – Offshore Drilling: And Not Enough CAPEX
Source: IHS Petrodata, Company data, Credit Suisse estimates
Floater Fixtures
0%2%4%6%8%10%12%14%16%18%20%
$0$5
$10$15$20$25$30$35$40$45$50
2010 2011 2012 2013 2014 2015
Renewals Uncontracted Newbuilds
Contracted Rigs Y-Y Growth
Historical and Estimated Annual Floater Spend (B$)
$0
$100
$200
$300
$400
$500
$600
$700
2003 1H 2004 2H 2006 1H 2007 2H 2009 1H 2010 2H 2012 1H 2013 2H
Dual Activity 6th+ 6th+ <6th
DS-9
• Rig Rental Capex Growth of ~15% in 2012/2013 Kept Demand Tight
• Slowing CAPEX Growth 5-10% has lead to Floater Supply Outstripping Demand
• Ten major IOCs/NOCs make up ~70% of Rig Rental CAPEX
Page 57
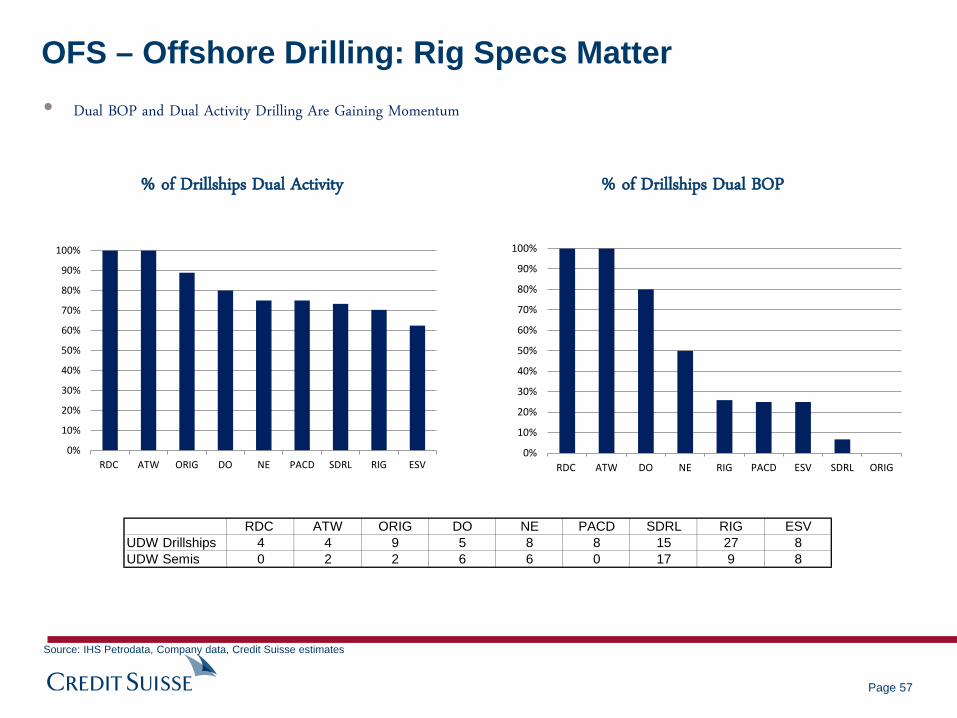
OFS – Offshore Drilling: Rig Specs Matter
Source: IHS Petrodata, Company data, Credit Suisse estimates
• Dual BOP and Dual Activity Drilling Are Gaining Momentum
% of Drillships Dual Activity % of Drillships Dual BOP
RDC ATW ORIG DO NE PACD SDRL RIG ESVUDW Drillships 4 4 9 5 8 8 15 27 8UDW Semis 0 2 2 6 6 0 17 9 8
0%
10%
20%
30%
40%
50%
60%
70%
80%
90%
100%
RDC ATW ORIG DO NE PACD SDRL RIG ESV0%
10%
20%
30%
40%
50%
60%
70%
80%
90%
100%
RDC ATW DO NE RIG PACD ESV SDRL ORIG

Page 58
OFS – Offshore Drilling: Jackups Could Be Next
Source: IHS Petrodata, Company data, Credit Suisse estimates
Historical Jackup Attrition Jackup Market Supply and Demand
80%
85%
90%
95%
100%
105%
0
100
200
300
400
500
600
2000 2003 2006 2009 2012 2015
HS Supply P SupplyS Supply Global DemandGlobal Utilization
0
2
4
6
8
10
12
14
16
2003 2005 2007 2009 2011 2013
• Strong Jackup Demand Has Kept the Pricing Firm With Dayrates Up YTD
• A Pause in Jackup Demand (lower commodity prices) Should Negatively Impact Pricing

Page 59
OFS – Offshore Drilling: Jackup Opportunities
Source: IHS Petrodata, Company data, Credit Suisse estimates
• Opportunities Worldwide for Jackup Backlog to Grow – Think NOCs
• Aramco average duration grew 60% in 2013
• High Utilization in Norway (HS Jackup) Has Pushed Dayrates Up Sharply ~50%
• Minimal Contract renewals in Norway should keep upward pressure on rates
Aramco Contract Duration (Yrs)
0
1
2
3
4
5
2003 2004 2005 2006 2007 2008 2009 2010 2011 2012 2013
+60%
$0
$50
$100
$150
$200
$250
$300
$350
$400
$450
2003 1H 2005 1H 2007 1H 2009 1H 2011 1H 2013 1H
Norway Avg HS JU Fixtures

Disclosures

Page 61
Companies Mentioned (Price as of 27-Mar-2014) Atwood Oceanics, Inc. (ATW.N, $49.56) Baker Hughes Inc. (BHI.N, $63.6) Cameron International Corp. (CAM.N, $61.1) Diamond Offshore Drilling, Inc (DO.N, $47.09) Ensco Plc. (ESV.N, $52.57) FMC Technologies, Inc. (FTI.N, $51.71) Frank's International (FI.N, $24.86) GulfMark Offshore (GLF.N, $44.12) Halliburton (HAL.N, $58.09) Helmerich & Payne, Inc. (HP.N, $105.88) Hercules Offshore (HERO.OQ, $4.59) Hi-Crush Partners, LP (HCLP.N, $39.43) Hornbeck Offshore (HOS.N, $39.48) Nabors Industries, Ltd. (NBR.N, $24.43) National Oilwell Varco (NOV.N, $76.03) Noble Corporation (NE.N, $32.03) Ocean Rig UDW Inc (ORIG.OQ, $17.51) Oceaneering Intl, Inc. (OII.N, $70.6) Oil States International (OIS.N, $95.84) Pacific Drilling (PACD.N, $10.79) Patterson-UTI Energy, Inc. (PTEN.OQ, $30.15) Precision Drilling Corporation (PDS.N, $11.67) Rowan Companies (RDC.N, $33.09) SEACOR Holdings (CKH.N, $85.53) Schlumberger (SLB.N, $96.49) Seadrill (SDRL.N, $34.28) Superior Energy Services, Inc. (SPN.N, $29.35) Tetra Technologies, Inc. (TTI.N, $12.2) Tidewater (TDW.N, $48.25) Transocean Inc. (RIG.N, $40.36) Weatherford International, Inc. (WFT.N, $16.98)
Disclosure Appendix
Important Global Disclosures Gregory Lewis, CFA, James Wicklund and Jonathan Sisto each certify, with respect to the companies or securities that the individual analyzes, that (1) the views expressed in this report accurately reflect his or her personal views about all of the subject companies and securities and (2) no part of his or her compensation was, is or will be directly or indirectly related to the specific recommendations or views expressed in this report. The analyst(s) responsible for preparing this research report received Compensation that is based upon various factors including Credit Suisse's total revenues, a portion of which are generated by Credit Suisse's investment banking activities
As of December 10, 2012 Analysts’ stock rating are defined as follows: Outperform (O) : The stock’s total return is expected to outperform the relevant benchmark*over the next 12 months. Neutral (N) : The stock’s total return is expected to be in line with the relevant benchmark* over the next 12 months. Underperform (U) : The stock’s total return is expected to underperform the relevant benchmark* over the next 12 months. *Relevant benchmark by region: As of 10th December 2012, Japanese ratings are based on a stock’s total return relative to the analyst's coverage universe which consists of all companies covered by the analyst within the relevant sector, with Outperforms representing the most attractive, Neutrals the less attractive, and Underperforms the least attractive investment opportunities. As of 2nd October 2012, U.S. and Canadian as well as European ratings are based on a stock’s total return relative to the analyst's coverage universe which consists of all companies covered by the analyst within the relevant sector, with Outperforms representing the most attractive, Neutrals the less attractive, and Underperforms the least attractive investment opportunities. For Latin American and non-Japan Asia stocks, ratings are based on a stock’s total return relative to the average total return of the relevant country or regional benchmark; Australia, New Zealand are, and prior to 2nd October 2012 U.S. and Canadian ratings were based on (1) a stock’s absolute total return potential to its current share price and (2) the relative attractiveness of a stock’s total return potential within an analyst’s coverage universe. For Australian and New Zealand stocks, 12-month rolling yield is incorporated in the absolute total return calculation and a 15% and a 7.5% threshold replace the 10-15% level in the Outperform and Underperform stock rating definitions, respectively. The 15% and 7.5% thresholds replace the +10-15% and -10-15% levels in the Neutral stock rating definition, respectively. Prior to 10th December 2012, Japanese ratings were based on a stock’s total return relative to the average total return of the relevant country or regional benchmark. Restricted (R) : In certain circumstances, Credit Suisse policy and/or applicable law and regulations preclude certain types of communications, including an investment recommendation, during the course of Credit Suisse's engagement in an investment banking transaction and in certain other circumstances.
Volatility Indicator [V] : A stock is defined as volatile if the stock price has moved up or down by 20% or more in a month in at least 8 of the past 24 months or the analyst expects significant volatility going forward.
Analysts’ sector weightings are distinct from analysts’ stock ratings and are based on the analyst’s expectations for the fundamentals and/or valuation of the sector* relative to the group’s historic fundamentals and/or valuation: Overweight : The analyst’s expectation for the sector’s fundamentals and/or valuation is favorable over the next 12 months.
Market Weight : The analyst’s expectation for the sector’s fundamentals and/or valuation is neutral over the next 12 months.
Underweight : The analyst’s expectation for the sector’s fundamentals and/or valuation is cautious over the next 12 months. *An analyst’s coverage sector consists of all companies covered by the analyst within the relevant sector. An analyst may cover multiple sectors.
Credit Suisse's distribution of stock ratings (and banking clients) is:
Global Ratings Distribution
Rating Versus universe (%) Of which banking clients (%) Outperform/Buy* 43% (53% banking clients) Neutral/Hold* 40% (50% banking clients) Underperform/Sell* 14% (45% banking clients) Restricted 2% *For purposes of the NYSE and NASD ratings distribution disclosure requirements, our stock ratings of Outperform, Neutral, and Underperform most closely correspond to Buy, Hold, and Sell, respectively; however, the meanings are not the same, as our stock ratings are determined on a relative basis. (Please refer to definitions above.) An investor's decision to buy or sell a security should be based on investment objectives, current holdings, and other individual factors.
Credit Suisse’s policy is to update research reports as it deems appropriate, based on developments with the subject company, the sector or the market that may have a material impact on the research views or opinions stated herein. Credit Suisse's policy is only to publish investment research that is impartial, independent, clear, fair and not misleading. For more detail please refer to Credit Suisse's Policies for Managing Conflicts of Interest in connection with Investment Research: http://www.csfb.com/research and analytics/disclaimer/managing_conflicts_disclaimer.html Credit Suisse does not provide any tax advice. Any statement herein regarding any US federal tax is not intended or written to be used, and cannot be used, by any taxpayer for the purposes of avoiding any penalties.
Please refer to the firm's disclosure website at https://rave.credit-suisse.com/disclosures for the definitions of abbreviations typically used in the target price method and risk sections.
Important Regional Disclosures Singapore recipients should contact Credit Suisse AG, Singapore Branch for any matters arising from this research report. Restrictions on certain Canadian securities are indicated by the following abbreviations: NVS--Non-Voting shares; RVS--Restricted Voting Shares; SVS--Subordinate Voting Shares. Individuals receiving this report from a Canadian investment dealer that is not affiliated with Credit Suisse should be advised that this report may not contain regulatory disclosures the non-affiliated Canadian investment dealer would be required to make if this were its own report. For Credit Suisse Securities (Canada), Inc.'s policies and procedures regarding the dissemination of equity research, please visit http://www.csfb.com/legal_terms/canada_research_policy.shtml. As of the date of this report, Credit Suisse acts as a market maker or liquidity provider in the equities securities that are the subject of this report. Principal is not guaranteed in the case of equities because equity prices are variable. Commission is the commission rate or the amount agreed with a customer when setting up an account or at any time after that.
For Credit Suisse disclosure information on other companies mentioned in this report, please visit the website at https://rave.credit-suisse.com/disclosures or call +1 (877) 291-2683.

Page 62
References in this report to Credit Suisse include all of the subsidiaries and affiliates of Credit Suisse operating under its investment banking division. For more information on our structure, please use the following link: https://www.credit-suisse.com/who_we_are/en/This report may contain material that is not directed to, or intended for distribution to or use by, any person or entity who is a citizen or resident of or located in any locality, state, country or other jurisdiction where such distribution, publication, availability or use would be contrary to law or regulation or which would subject Credit Suisse AG or its affiliates ("CS") to any registration or licensing requirement within such jurisdiction. All material presented in this report, unless specifically indicated otherwise, is under copyright to CS. None of the material, nor its content, nor any copy of it, may be altered in any way, transmitted to, copied or distributed to any other party, without the prior express written permission of CS. All trademarks, service marks and logos used in this report are trademarks or service marks or registered trademarks or service marks of CS or its affiliates. The information, tools and material presented in this report are provided to you for information purposes only and are not to be used or considered as an offer or the solicitation of an offer to sell or to buy or subscribe for securities or other financial instruments. CS may not have taken any steps to ensure that the securities referred to in this report are suitable for any particular investor. CS will not treat recipients of this report as its customers by virtue of their receiving this report. The investments and services contained or referred to in this report may not be suitable for you and it is recommended that you consult an independent investment advisor if you are in doubt about such investments or investment services. Nothing in this report constitutes investment, legal, accounting or tax advice, or a representation that any investment or strategy is suitable or appropriate to your individual circumstances, or otherwise constitutes a personal recommendation to you. CS does not advise on the tax consequences of investments and you are advised to contact an independent tax adviser. Please note in particular that the bases and levels of taxation may change. Information and opinions presented in this report have been obtained or derived from sources believed by CS to be reliable, but CS makes no representation as to their accuracy or completeness. CS accepts no liability for loss arising from the use of the material presented in this report, except that this exclusion of liability does not apply to the extent that such liability arises under specific statutes or regulations applicable to CS. This report is not to be relied upon in substitution for the exercise of independent judgment. CS may have issued, and may in the future issue, other communications that are inconsistent with, and reach different conclusions from, the information presented in this report. Those communications reflect the different assumptions, views and analytical methods of the analysts who prepared them and CS is under no obligation to ensure that such other communications are brought to the attention of any recipient of this report. CS may, to the extent permitted by law, participate or invest in financing transactions with the issuer(s) of the securities referred to in this report, perform services for or solicit business from such issuers, and/or have a position or holding, or other material interest, or effect transactions, in such securities or options thereon, or other investments related thereto. In addition, it may make markets in the securities mentioned in the material presented in this report. CS may have, within the last three years, served as manager or co-manager of a public offering of securities for, or currently may make a primary market in issues of, any or all of the entities mentioned in this report or may be providing, or have provided within the previous 12 months, significant advice or investment services in relation to the investment concerned or a related investment. Additional information is, subject to duties of confidentiality, available on request. Some investments referred to in this report will be offered solely by a single entity and in the case of some investments solely by CS, or an associate of CS or CS may be the only market maker in such investments. Past performance should not be taken as an indication or guarantee of future performance, and no representation or warranty, express or implied, is made regarding future performance. Information, opinions and estimates contained in this report reflect a judgment at its original date of publication by CS and are subject to change without notice. The price, value of and income from any of the securities or financial instruments mentioned in this report can fall as well as rise. The value of securities and financial instruments is subject to exchange rate fluctuation that may have a positive or adverse effect on the price or income of such securities or financial instruments. Investors in securities such as ADR's, the values of which are influenced by currency volatility, effectively assume this risk. Structured securities are complex instruments, typically involve a high degree of risk and are intended for sale only to sophisticated investors who are capable of understanding and assuming the risks involved. The market value of any structured security may be affected by changes in economic, financial and political factors (including, but not limited to, spot and forward interest and exchange rates), time to maturity, market conditions and volatility, and the credit quality of any issuer or reference issuer. Any investor interested in purchasing a structured product should conduct their own investigation and analysis of the product and consult with their own professional advisers as to the risks involved in making such a purchase. Some investments discussed in this report may have a high level of volatility. High volatility investments may experience sudden and large falls in their value causing losses when that investment is realised. Those losses may equal your original investment. Indeed, in the case of some investments the potential losses may exceed the amount of initial investment and, in such circumstances, you may be required to pay more money to support those losses. Income yields from investments may fluctuate and, in consequence, initial capital paid to make the investment may be used as part of that income yield. Some investments may not be readily realisable and it may be difficult to sell or realise those investments, similarly it may prove difficult for you to obtain reliable information about the value, or risks, to which such an investment is exposed. This report may provide the addresses of, or contain hyperlinks to, websites. Except to the extent to which the report refers to website material of CS, CS has not reviewed any such site and takes no responsibility for the content contained therein. Such address or hyperlink (including addresses or hyperlinks to CS's own website material) is provided solely for your convenience and information and the content of any such website does not in any way form part of this document. Accessing such website or following such link through this report or CS's website shall be at your own risk. This report is issued and distributed in Europe (except Switzerland) by Credit Suisse Securities (Europe) Limited, One Cabot Square, London E14 4QJ, England, which is authorised by the Prudential Regulation Authority and regulated by the Financial Conduct Authority and the Prudential Regulation Authority. This report is being distributed in Germany by Credit Suisse Securities (Europe) Limited Niederlassung Frankfurt am Main regulated by the Bundesanstalt fuer Finanzdienstleistungsaufsicht ("BaFin"). This report is being distributed in the United States and Canada by Credit Suisse Securities (USA) LLC; in Switzerland by Credit Suisse AG; in Brazil by Banco de Investimentos Credit Suisse (Brasil) S.A or its affiliates; in Mexico by Banco Credit Suisse (México), S.A. (transactions related to the securities mentioned in this report will only be effected in compliance with applicable regulation); in Japan by Credit Suisse Securities (Japan) Limited, Financial Instruments Firm, Director-General of Kanto Local Finance Bureau (Kinsho) No. 66, a member of Japan Securities Dealers Association, The Financial Futures Association of Japan, Japan Investment Advisers Association, Type II Financial Instruments Firms Association; elsewhere in Asia/ Pacific by whichever of the following is the appropriately authorised entity in the relevant jurisdiction: Credit Suisse (Hong Kong) Limited, Credit Suisse Equities (Australia) Limited, Credit Suisse Securities (Thailand) Limited, having registered address at 990 Abdulrahim Place, 27 Floor, Unit 2701, Rama IV Road, Silom, Bangrak, Bangkok 10500, Thailand, Tel. +66 2614 6000, Credit Suisse Securities (Malaysia) Sdn Bhd, Credit Suisse AG, Singapore Branch, Credit Suisse Securities (India) Private Limited regulated by the Securities and Exchange Board of India (registration Nos. INB230970637; INF230970637; INB010970631; INF010970631), having registered address at 9th Floor, Ceejay House, Dr.A.B. Road, Worli, Mumbai - 18, India, T- +91-22 6777 3777, Credit Suisse Securities (Europe) Limited, Seoul Branch, Credit Suisse AG, Taipei Securities Branch, PT Credit Suisse Securities Indonesia, Credit Suisse Securities (Philippines ) Inc., and elsewhere in the world by the relevant authorised affiliate of the above. Research on Taiwanese securities produced by Credit Suisse AG, Taipei Securities Branch has been prepared by a registered Senior Business Person. Research provided to residents of Malaysia is authorised by the Head of Research for Credit Suisse Securities (Malaysia) Sdn Bhd, to whom they should direct any queries on +603 2723 2020. This report has been prepared and issued for distribution in Singapore to institutional investors, accredited investors and expert investors (each as defined under the Financial Advisers Regulations) only, and is also distributed by Credit Suisse AG, Singapore branch to overseas investors (as defined under the Financial Advisers Regulations). By virtue of your status as an institutional investor, accredited investor, expert investor or overseas investor, Credit Suisse AG, Singapore branch is exempted from complying with certain compliance requirements under the Financial Advisers Act, Chapter 110 of Singapore (the "FAA"), the Financial Advisers Regulations and the relevant Notices and Guidelines issued thereunder, in respect of any financial advisory service which Credit Suisse AG, Singapore branch may provide to you. This research may not conform to Canadian disclosure requirements. In jurisdictions where CS is not already registered or licensed to trade in securities, transactions will only be effected in accordance with applicable securities legislation, which will vary from jurisdiction to jurisdiction and may require that the trade be made in accordance with applicable exemptions from registration or licensing requirements. Non-U.S. customers wishing to effect a transaction should contact a CS entity in their local jurisdiction unless governing law permits otherwise. U.S. customers wishing to effect a transaction should do so only by contacting a representative at Credit Suisse Securities (USA) LLC in the U.S. Please note that this research was originally prepared and issued by CS for distribution to their market professional and institutional investor customers. Recipients who are not market professional or institutional investor customers of CS should seek the advice of their independent financial advisor prior to taking any investment decision based on this report or for any necessary explanation of its contents. This research may relate to investments or services of a person outside of the UK or to other matters which are not authorised by the Prudential Regulation Authority and regulated by the Financial Conduct Authority and the Prudential Regulation Authority or in respect of which the protections of the Prudential Regulation Authority and Financial Conduct Authority for private customers and/or the UK compensation scheme may not be available, and further details as to where this may be the case are available upon request in respect of this report. CS may provide various services to US municipal entities or obligated persons ("municipalities"), including suggesting individual transactions or trades and entering into such transactions. Any services CS provides to municipalities are not viewed as "advice" within the meaning of Section 975 of the Dodd-Frank Wall Street Reform and Consumer Protection Act. CS is providing any such services and related information solely on an arm's length basis and not as an advisor or fiduciary to the municipality. In connection with the provision of the any such services, there is no agreement, direct or indirect, between any municipality (including the officials, management, employees or agents thereof) and CS for CS to provide advice to the municipality. Municipalities should consult with their financial, accounting and legal advisors regarding any such services provided by CS. In addition, CS is not acting for direct or indirect compensation to solicit the municipality on behalf of an unaffiliated broker, dealer, municipal securities dealer, municipal advisor, or investment adviser for the purpose of obtaining or retaining an engagement by the municipality for or in connection with Municipal Financial Products, the issuance of municipal securities, or of an investment adviser to provide investment advisory services to or on behalf of the municipality. If this report is being distributed by a financial institution other than Credit Suisse AG, or its affiliates, that financial institution is solely responsible for distribution. Clients of that institution should contact that institution to effect a transaction in the securities mentioned in this report or require further information. This report does not constitute investment advice by Credit Suisse to the clients of the distributing financial institution, and neither Credit Suisse AG, its affiliates, and their respective officers, directors and employees accept any liability whatsoever for any direct or consequential loss arising from their use of this report or its content. Principal is not guaranteed. Commission is the commission rate or the amount agreed with a customer when setting up an account or at any time after that. Copyright © 2014 CREDIT SUISSE AG and/or its affiliates. All rights reserved. Investment principal on bonds can be eroded depending on sale price or market price. In addition, there are bonds on which investment principal can be eroded due to changes in redemption amounts. Care is required when investing in such instruments.
When you purchase non-listed Japanese fixed income securities (Japanese government bonds, Japanese municipal bonds, Japanese government guaranteed bonds, Japanese corporate bonds) from CS as a seller, you will be requested to pay the purchase price only.