Embed Size (px)
Citation preview

Petitioned Health Consultation
Dioxins in Wild Game Taken from the Tittabawassee River Floodplain
South of Midland, Midland and Saginaw Counties, Michigan EPA ID# MID980994354
APRIL 29, 2005
Prepared by
Michigan Department of Community Health Under a cooperative agreement with
Agency for Toxic Substances and Disease Registry
1
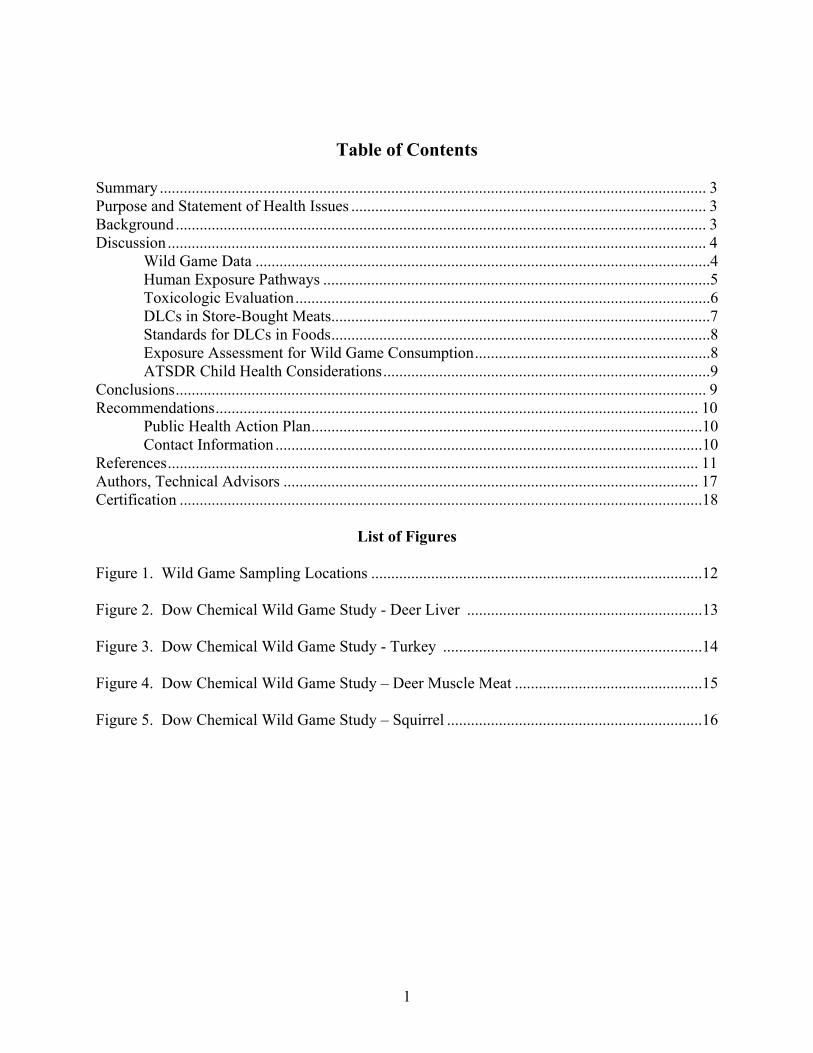
Table of Contents
Summary ......................................................................................................................................... 3 Purpose and Statement of Health Issues ......................................................................................... 3 Background..................................................................................................................................... 3 Discussion....................................................................................................................................... 4
Wild Game Data ..................................................................................................................4 Human Exposure Pathways .................................................................................................5 Toxicologic Evaluation........................................................................................................6 DLCs in Store-Bought Meats...............................................................................................7 Standards for DLCs in Foods...............................................................................................8 Exposure Assessment for Wild Game Consumption...........................................................8 ATSDR Child Health Considerations..................................................................................9
Conclusions..................................................................................................................................... 9 Recommendations......................................................................................................................... 10
Public Health Action Plan..................................................................................................10 Contact Information ...........................................................................................................10
References..................................................................................................................................... 11 Authors, Technical Advisors ........................................................................................................ 17 Certification ...................................................................................................................................18
List of Figures Figure 1. Wild Game Sampling Locations ...................................................................................12 Figure 2. Dow Chemical Wild Game Study - Deer Liver ...........................................................13 Figure 3. Dow Chemical Wild Game Study - Turkey .................................................................14 Figure 4. Dow Chemical Wild Game Study – Deer Muscle Meat ...............................................15 Figure 5. Dow Chemical Wild Game Study – Squirrel ................................................................16
2
List of Tables
Table 1. Animals Collected for the Dow Wild Game Study .........................................................4 Table 2. Toxic Equivalent (TEQ) Concentrations (ppt) in Wild Game..........................................5 Table 3. TEQ Concentrations in ppt in Turkey Skin and Meat Taken from Smith’s Crossing .....5 Table 4. Exposure Pathway for DLCs in Wild Game.....................................................................6 Table 5. DLCs in Store-Bought Meat and Fish ..............................................................................7
List of Attachments
Attachment A Technical Support Document ............................................................................. A-1 Attachment B. State of Michigan Wild Game Advisory…………………………………........B-1

3
Summary Consumption of dioxin-like compounds (DLCs) found in the liver of white-tailed deer and in turkey meat, with and without the skin, harvested from the flood plain area of the Tittabawassee River downstream of Midland presents a public health hazard. Consumption of DLCs found in the muscle meat of deer and squirrel harvested from the flood plain area of the Tittabawassee River downstream of Midland present a potential public health hazard to women of childbearing age and children under the age of 15. The Dow Chemical Company (Dow) conducted a study to determine if wild game consumption was a route of human exposure to DLC contamination in flood plain soils and sediments. After reviewing the data from the Dow study, the State of Michigan issued a Wild Game Advisory on September 14, 2004, advising that hunters and their families should not eat deer liver or turkey meat harvested from the flood plain of the Tittabawassee River. The advisory further cautioned women of childbearing age and children under the age of 15 to eat only one meal per week of deer and squirrel muscle meat.
Purpose and Statement of Health Issues On May 1, 2001, a Midland resident and two Michigan-based environmental organizations petitioned the federal Agency for Toxic Substances and Disease Registry (ATSDR) to conduct a public health assessment of DLC contamination in communities adjacent to Midland, Michigan. ATSDR and the Michigan Department of Community Health (MDCH) have a cooperative agreement for conducting assessments and consultations for potential health hazards at sites of environmental contamination within the state of Michigan. MDCH has agreed to prepare public health consultations in response to the 2001 petition. ATSDR will review MDCH's work and provide technical support as needed. The present consultation addresses concerns related to DLC contamination found in wild game taken from the floodplain of the Tittabawassee River below Midland. Additional consultations for Midland and affected adjacent communities that address other contaminated media may be developed in the future with the ultimate goal of providing a full public health assessment.
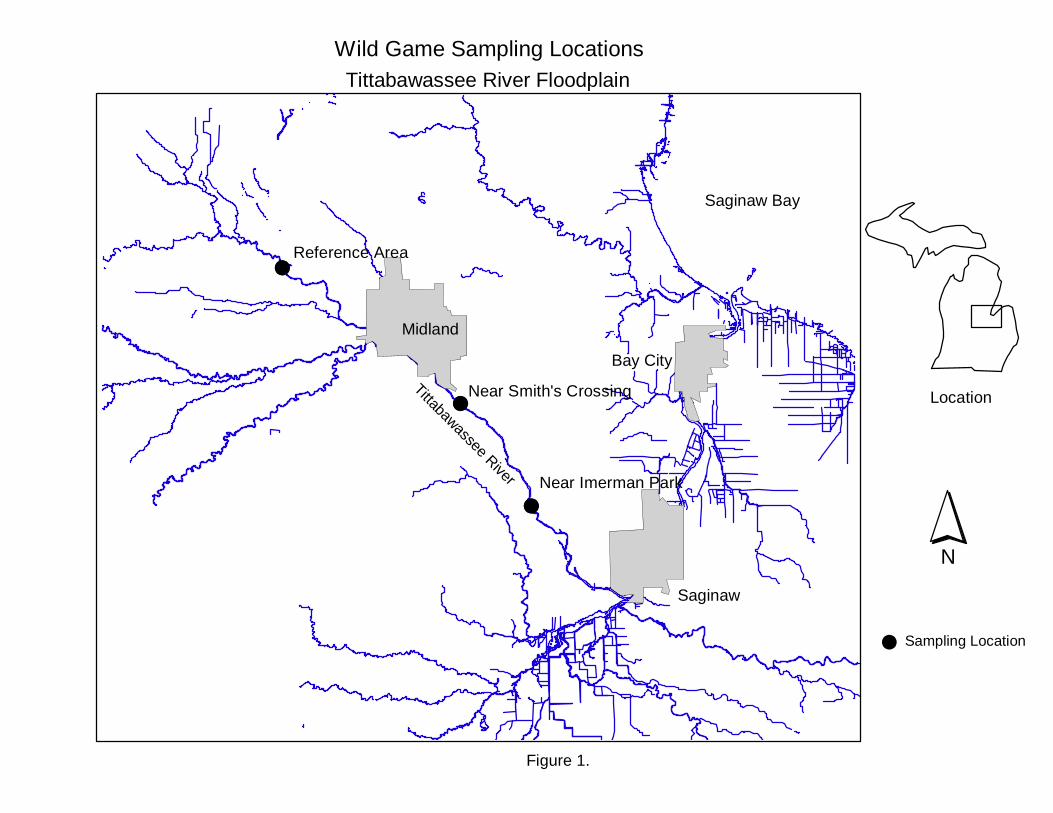
Background On June 12, 2003, the Michigan Department of Environmental Quality (MDEQ) issued a Hazardous Waste Management Facility Operating License to the Dow Chemical Company (Dow) for its Midland, Michigan plant site. The Dow plant encompasses approximately 1,900 acres on the southern perimeter of the city of Midland (Figure 1). The Tittabawassee River flows through the plant site and then southeast to the confluence with the Saginaw River, which continues northeast to the Saginaw Bay of Lake Huron. The operating license requires Dow to address off-site releases of DLCs, including river sediments and flood plain soils, to the Tittabawassee River. DLCs have been detected in the flood plain at concentrations up to 7,300 parts per trillion (ppt) in soil and 2,100 ppt in sediments (MDEQ 2003). The operating license also requires that Dow undertake Interim

4
Response Activities (IRAs) to control or understand ongoing human health risks until the full extent of the flood plain contamination can be determined (ENTRIX 2003). Beginning in the fall of 2003, Dow conducted a study in the flood plain area to determine if wild game living there represented a pathway of human exposure to DLCs (ENTRIX 2003). This study was prompted by concerns expressed by the MDCH, MDEQ, and the general public about the safety of eating wild game from the area of DLC contaminated soil and sediment.
Discussion Wild Game Data Wild game were sampled from each of three areas: a reference area upstream of the city of Midland, an area commonly referred to as Smith’s Crossing approximately six kilometers (km) downstream of the Dow dam on the Tittabawassee River, and a second downstream area near Imerman Park approximately 21 km downstream of the Dow dam (ENTRIX 2003). The upstream reference location was chosen to represent wild game exposed only to background concentrations of DLCs. This area is far enough removed from the downstream study areas to ensure that game will not move between the reference area and the study areas. Animals were harvested from November 2003 through January 2004. This time of year was chosen to represent the condition of game species during the fall hunting season. At this time of year, wild game have accumulated a reserve of body fat to carry them through the winter months when food may be scarce. Table 1 shows the species and number of animals collected at each sampling location. Table 1. Animals Collected for the Dow Wild Game Study Location # White-tailed Deer # Wild Turkeys # Fox Squirrels Reference Site 14 12 12 Smith’s Crossing 14 11 10 Near Imerman Park 10 1 10 Total 38 24 32
ENTRIX 2003
Samples of muscle meat or deer liver were prepared from each animal and analyzed for polychlorinated dioxins and furans. Co-planar polychlorinated biphenyls (PCBs) were also analyzed in about 25 percent of the deer samples (three samples from each location). Dioxin toxic equivalent (TEQ) concentrations were calculated for each sample based on the levels of dioxins and furans. TEQs included dioxins, furans, and PCBs for deer samples that were analyzed for PCBs. (ENTRIX 2004). At the reference site, coplanar PCBs contributed 8%–52% of the TEQ for the samples analyzed for PCBs. At the two downstream sites, PCBs accounted for 1.1%–12.3% of the TEQ.
Dioxin Toxic Equivalents Dioxin toxic equivalents (TEQs) are calculated by multiplying the level of a particular dioxin-like compound by its toxicity equivalency factor (see page 7 for additional information). The resulting TEQs are then added together to determine the total dioxin TEQ concentrations in a soil sample.

5
TEQ concentrations are based on the wet weight of the sample and are not adjusted for the percent of lipids (fat) measured in the sample. Table 2 presents the range of TEQs in ppt detected at each sampling location. For TEQs with nondetect data included, the nondetect congener concentrations were calculated at one half the detection limit. Table 2. TEQ Concentrations (ppt wet weight) in Wild Game
Study Site White-tailed
Deer Muscle Meat
White-tailed Deer Liver
Wild Turkeys
Fox Squirrels
Reference Site 0.04–0.17 0.2–1.3 0.11–0.39 0.04–0.11 Smith’s Crossing 0.12–0.26 5.6–19.2 0.63–25.4 0.092–1.5 Near Imerman Park 0.23–1.2 8.9–149 12.9* 0.083–4.3
ENTRIX 2003 * Only one turkey could be found near Imerman Park.
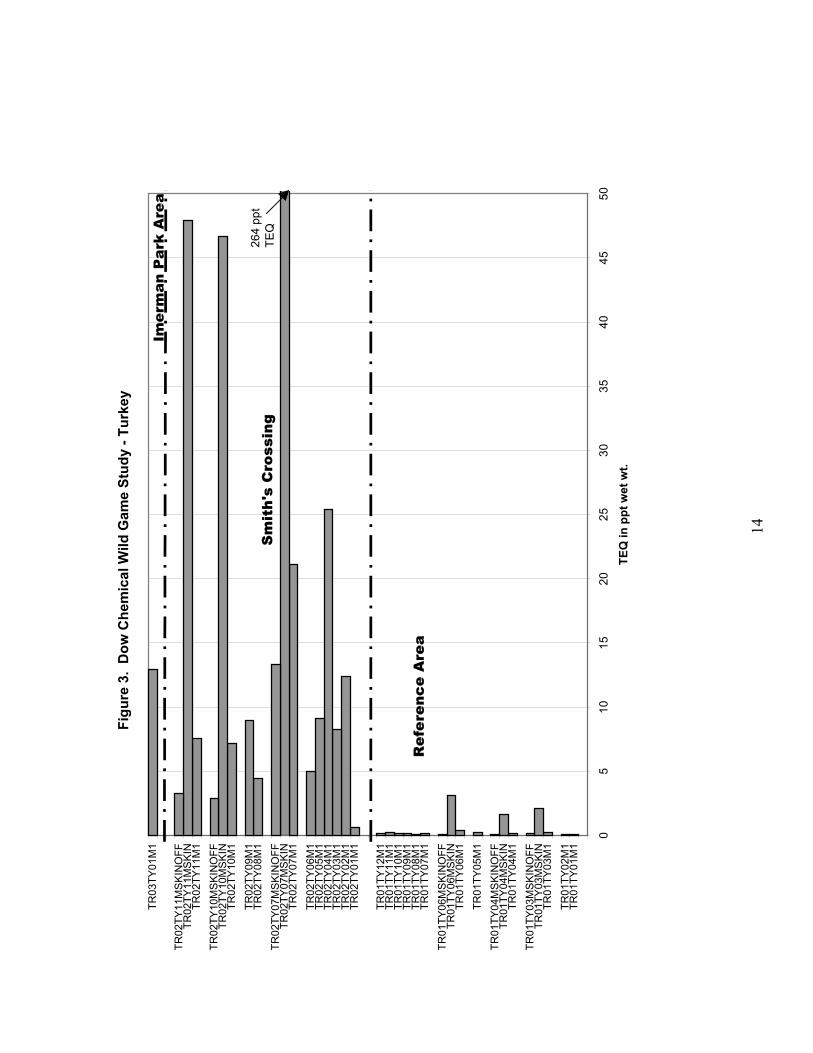
ppt: parts per trillion. TEQ: Toxic equivalent. Some turkey samples taken from the Smith’s Crossing location were analyzed both with and without the skin attached. TEQ concentrations in turkey meat without the skin were far lower than in those with the skin attached.
Table 3. TEQ Concentrations (ppt wet weight) in Turkey Skin and Meat taken from Smith’s Crossing
Turkey Sample # Meat with skin Meat without skin Skin Only 07 21.1 13.3 264 10 7.2 2.9 46.7 11 7.6 3.3 47.9
ENTRIX 2003 ppt: parts per trillion. TEQ: Toxic equivalent Figures 1 through 4 provide a graphic comparison of TEQ concentrations between the three study sites.
Human Exposure Pathways To determine whether people are or could be exposed to environmental contaminants, ATSDR and MDCH evaluate the environmental and human components that lead to human exposure. An exposure pathway contains five major elements: 1) a source of contamination, 2) contaminant transport through an environmental medium, 3) a point of exposure, 4) a route of human exposure, and 5) a receptor population. An exposure pathway is considered a complete pathway if evidence shows that all five of these elements are, have been, or will be present at the property.
6
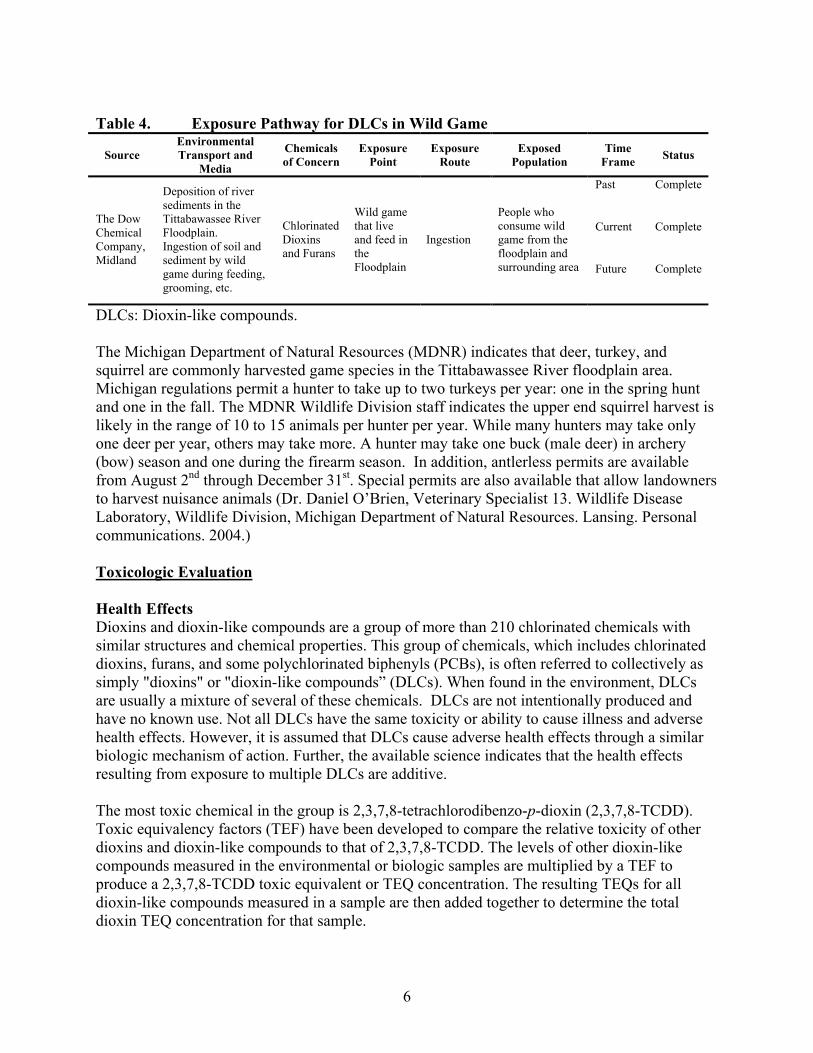
Table 4. Exposure Pathway for DLCs in Wild Game
Source Environmental Transport and
Media
Chemicals of Concern
Exposure Point
Exposure Route
Exposed Population
Time Frame Status
Past Complete
Current Complete The Dow Chemical Company, Midland
Deposition of river sediments in the Tittabawassee River Floodplain. Ingestion of soil and sediment by wild game during feeding, grooming, etc.
Chlorinated Dioxins and Furans
Wild game that live and feed in the Floodplain
Ingestion
People who consume wild game from the floodplain and surrounding area Future Complete
DLCs: Dioxin-like compounds. The Michigan Department of Natural Resources (MDNR) indicates that deer, turkey, and squirrel are commonly harvested game species in the Tittabawassee River floodplain area. Michigan regulations permit a hunter to take up to two turkeys per year: one in the spring hunt and one in the fall. The MDNR Wildlife Division staff indicates the upper end squirrel harvest is likely in the range of 10 to 15 animals per hunter per year. While many hunters may take only one deer per year, others may take more. A hunter may take one buck (male deer) in archery (bow) season and one during the firearm season. In addition, antlerless permits are available from August 2nd through December 31st. Special permits are also available that allow landowners to harvest nuisance animals (Dr. Daniel O’Brien, Veterinary Specialist 13. Wildlife Disease Laboratory, Wildlife Division, Michigan Department of Natural Resources. Lansing. Personal communications. 2004.) Toxicologic Evaluation Health Effects Dioxins and dioxin-like compounds are a group of more than 210 chlorinated chemicals with similar structures and chemical properties. This group of chemicals, which includes chlorinated dioxins, furans, and some polychlorinated biphenyls (PCBs), is often referred to collectively as simply "dioxins" or "dioxin-like compounds” (DLCs). When found in the environment, DLCs are usually a mixture of several of these chemicals. DLCs are not intentionally produced and have no known use. Not all DLCs have the same toxicity or ability to cause illness and adverse health effects. However, it is assumed that DLCs cause adverse health effects through a similar biologic mechanism of action. Further, the available science indicates that the health effects resulting from exposure to multiple DLCs are additive. The most toxic chemical in the group is 2,3,7,8-tetrachlorodibenzo-p-dioxin (2,3,7,8-TCDD). Toxic equivalency factors (TEF) have been developed to compare the relative toxicity of other dioxins and dioxin-like compounds to that of 2,3,7,8-TCDD. The levels of other dioxin-like compounds measured in the environmental or biologic samples are multiplied by a TEF to produce a 2,3,7,8-TCDD toxic equivalent or TEQ concentration. The resulting TEQs for all dioxin-like compounds measured in a sample are then added together to determine the total dioxin TEQ concentration for that sample.
7
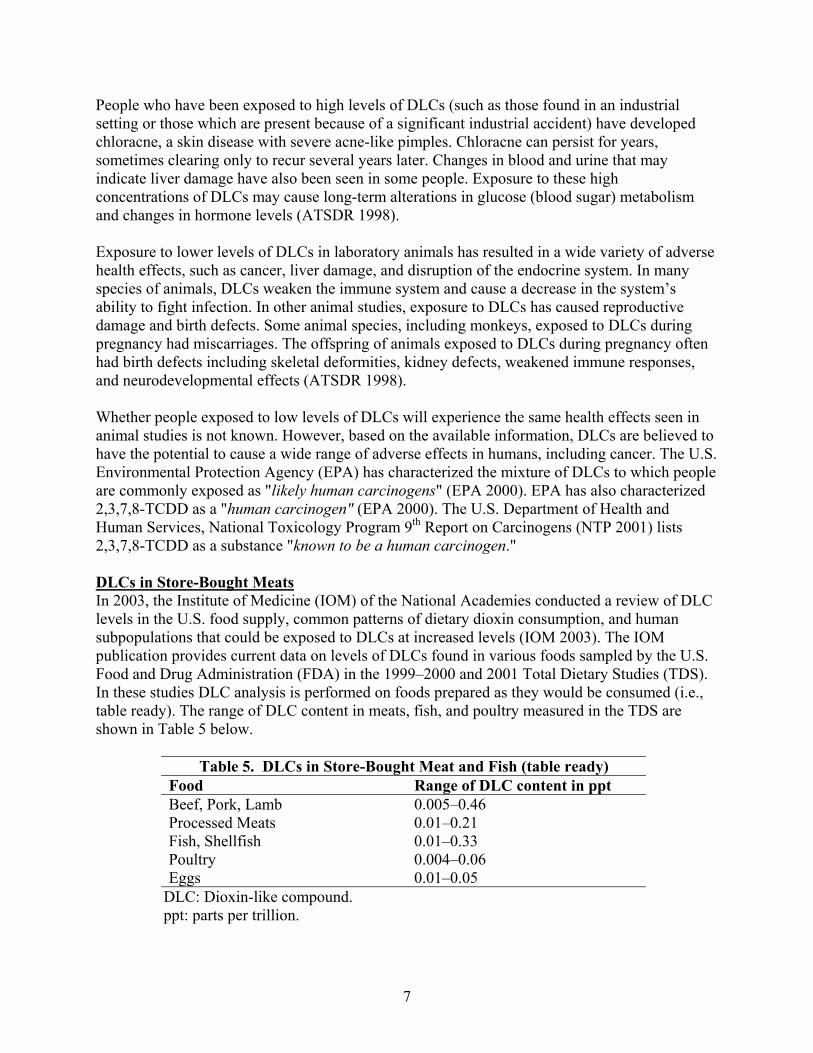
People who have been exposed to high levels of DLCs (such as those found in an industrial setting or those which are present because of a significant industrial accident) have developed chloracne, a skin disease with severe acne-like pimples. Chloracne can persist for years, sometimes clearing only to recur several years later. Changes in blood and urine that may indicate liver damage have also been seen in some people. Exposure to these high concentrations of DLCs may cause long-term alterations in glucose (blood sugar) metabolism and changes in hormone levels (ATSDR 1998). Exposure to lower levels of DLCs in laboratory animals has resulted in a wide variety of adverse health effects, such as cancer, liver damage, and disruption of the endocrine system. In many species of animals, DLCs weaken the immune system and cause a decrease in the system’s ability to fight infection. In other animal studies, exposure to DLCs has caused reproductive damage and birth defects. Some animal species, including monkeys, exposed to DLCs during pregnancy had miscarriages. The offspring of animals exposed to DLCs during pregnancy often had birth defects including skeletal deformities, kidney defects, weakened immune responses, and neurodevelopmental effects (ATSDR 1998). Whether people exposed to low levels of DLCs will experience the same health effects seen in animal studies is not known. However, based on the available information, DLCs are believed to have the potential to cause a wide range of adverse effects in humans, including cancer. The U.S. Environmental Protection Agency (EPA) has characterized the mixture of DLCs to which people are commonly exposed as "likely human carcinogens" (EPA 2000). EPA has also characterized 2,3,7,8-TCDD as a "human carcinogen" (EPA 2000). The U.S. Department of Health and Human Services, National Toxicology Program 9th Report on Carcinogens (NTP 2001) lists 2,3,7,8-TCDD as a substance "known to be a human carcinogen." DLCs in Store-Bought Meats In 2003, the Institute of Medicine (IOM) of the National Academies conducted a review of DLC levels in the U.S. food supply, common patterns of dietary dioxin consumption, and human subpopulations that could be exposed to DLCs at increased levels (IOM 2003). The IOM publication provides current data on levels of DLCs found in various foods sampled by the U.S. Food and Drug Administration (FDA) in the 1999–2000 and 2001 Total Dietary Studies (TDS). In these studies DLC analysis is performed on foods prepared as they would be consumed (i.e., table ready). The range of DLC content in meats, fish, and poultry measured in the TDS are shown in Table 5 below.
Table 5. DLCs in Store-Bought Meat and Fish (table ready) Food Range of DLC content in ppt Beef, Pork, Lamb 0.005–0.46 Processed Meats 0.01–0.21 Fish, Shellfish 0.01–0.33 Poultry 0.004–0.06 Eggs 0.01–0.05
DLC: Dioxin-like compound. ppt: parts per trillion.
8
Levels of DLCs found in wild game harvested in the Tittabawassee River flood plain downstream of Midland were consistently elevated compared to levels in similar foods in the U.S. food supply. However, levels of DLCs in prepared foods may not be directly comparable to those in uncooked wild game samples. Standards for DLCs in Foods No federal standards govern levels of DLCs in foods, nevertheless the U.S. Department of Agriculture (USDA) has provided guidance in response to an event in which a contaminated anticaking agent was added to animal foods resulting in elevated levels of DLCs in animal products for human consumption. The USDA provided a 1 (one) ppt level of concern for 2,3,7,8-TCDD as a guideline to indicate when a food is “not wholesome” for human consumption (U.S. Department of Agriculture. Letter to “Owners and Custodians of Poultry, Livestock and Eggs” from Mark Mina, DVM, deputy administrator, field operations, Food Safety and Inspection Service. Washington. July 8, 1997). The 2,3,7,8-TCDD congener contributed about 70% of the TEQs measured in foods during this event (USDA 1997b). All of the deer liver and all but one of the turkey samples, both with and without the skin, harvested from the flood plain downstream of Midland exceed the USDA 1-ppt level of concern. In addition, one deer meat sample taken from near Imerman Park and some squirrel samples taken both from Smith’s Crossing and near Imerman Park exceeded the 1 ppt level of concern. Exposure Assessment for Wild Game Consumption Attachment A provides the methodology used to determine if consumption of wild game harvested in the flood plain presents a human health hazard. The State of Michigan does not have an established protocol to determine if eating wild game that contains environmental contaminants poses a risk to human health. Therefore, the MDCH used reasonable assumptions about how much wild game meat people may eat and the results from the Dow study to estimate the intake of DLCs from eating wild game taken from the Tittabawassee River flood plain area. Estimated intakes of DLCs were then compared to health benchmarks developed by the ATSDR, the World Health Organization (WHO), and EPA. The level of DLCs in a single 4-ounce serving of wild game was compared to the WHO tolerable monthly intake (TMI) and to the EPA acceptable daily exposure (ADE) developed under the Great Lakes Initiative. Consumption of 4 ounces of turkey meat (with or without the skin) or deer liver taken from the two downstream sampling locations would likely result in an exceedance of the TMI or the ADE either alone or in combination with other foods (Attachment A, Table 1). Consumption of 4 ounces of deer muscle or squirrel meat from these locations would not result in an exceedance of the TMI or ADE. However, higher or more frequent consumption of these meats would result in higher DLC intake levels. DLC intake was also estimated using assumptions about how much wild game people might eat in a year. These estimates were used to calculate the cancer and noncancer risk for consumption of game taken in the flood plain. Cancer risk estimates were generally less than 1 additional cancer in 100,000 exposed people. However, higher cancer risks were estimated for consumption of deer liver and turkey meat (with or without the skin).
9
Noncancer risks were estimated by comparing annual DLC intake rates to the ATSDR minimal risk level (MRL) of 1 picogram of dioxin TEQ per kilogram of body weight per day (pg/kg/day). The MRL does not represent a boundary between safe and unsafe intake of DLCs. However, intake above the MRL will erode the margin of safety used in its development. Consumption of deer liver and turkey meat (with or without skin) resulted in 2.5- to 15.5-fold exceedances of the MRL for adults. For children who are assumed to eat smaller portions, consumption of these meats resulted in a 1.5- to 8.3-fold exceedance of the MRL. Consumption of deer and squirrel muscle meat resulted in generally lower exceedances of the MRL for both adults and children.
ATSDR Child Health Considerations Children may be at greater risk than adults from certain kinds of exposure to hazardous substances at sites of environmental contamination. They engage in activities such as playing outdoors and hand-to-mouth behaviors that increase their exposure to hazardous substances. Children are shorter than adults, which means they breathe dust, soil, and vapors close to the ground. Their lower body weight and higher intake rate result in a greater dose of hazardous substance per unit of body weight. The developing body systems of children can sustain permanent damage if toxic exposures are high enough during critical growth stages. Prenatal exposures and those that occur in the first few years of life are more likely to cause permanent damage. The methodology provided in Attachment A that was used to determine the human health risks of eating wild game harvested from the Tittabawassee River flood plain considered the potential risks to children and women of childbearing age. Fetuses, infants, and children may be especially sensitive to the health effects of DLCs because of their rapid growth and development. In animal studies, exposure to DLCs has caused reproductive damage and birth defects. Some animal species exposed to DLCs during pregnancy had miscarriages. The offspring of animals exposed to DLCs during pregnancy often had birth defects including skeletal deformities, kidney defects, weakened immune responses, and neurodevelopmental effects (ATSDR 1998).
Conclusions Consumption of DLCs found in the liver of white tailed deer and in turkey meat, with and without the skin, harvested from the flood plain area of the Tittabawassee River downstream of Midland presents a public health hazard. Eating these wild game meats would result in an estimated intake of DLCs that exceeds health benchmarks established by the ATSDR, the WHO, and EPA. Estimated cancer risks associated with eating these contaminated wild game were greater than 1 additional cancer in 10,000 exposed people. Consumption of DLCs found in the muscle meat of deer and squirrel harvested from the flood plain area of the Tittabawassee River downstream of Midland presents a potential public health hazard to women of childbearing age and children under the age of 15. A public health hazard may be present if women and children consume large amounts of these wild game meats. The levels of DLCs in game samples taken downstream of Midland were higher than the same game species harvested upstream of Midland. All the species tested in the Dow wild game study are herbivorous, so they are unlikely being exposed to DLCs through the food chain. Deer,
10
turkey, and squirrel may be ingesting contaminated soil and sediments during feeding or grooming activities.
Recommendations • No one should eat the liver of while tail deer or turkey meat taken from the flood plain of the
Tittabawassee River downstream of Midland. • Women of childbearing age and children under the age of 15 should limit their consumption
of deer and squirrel muscle meat to one meal per week. • Given the levels of DLCs found in deer liver, no one should eat organ meats from other game
species taken from this area. • Hunters and their families should choose lean wild game meats. DLCs accumulate in fatty
tissues and trimming excess fat before cooking will lessen exposure. • Additional studies of other wild game species in the Tittabawassee River flood plain (e.g.,
goose, duck) and other potentially affected areas downstream of the Tittabawassee should be considered.
Public Health Action Plan • The MDCH in cooperation with the MDEQ, MDNR, and the Michigan Department of
Agriculture issued a Wild Game Advisory on September 14, 2004. The advisory is provided in Attachment B.
The MDCH will be available to consult on the appropriateness and efficacy of future studies or remedial actions for the Tittabawassee River flood plain area. Contact Information
If any citizen has additional information or health concerns regarding the Tittabawassee River Floodplain Wild Game consultation or the Dow Chemical Company Midland petitioned health assessment, please contact the Michigan Department of Community Health, Division of Environmental and Occupational Epidemiology at 1-800-648-6942.
11
References Agency for Toxic Substances and Disease Registry. 1998. Toxicological profile for chlorinated dibenzo-p-dioxins. Atlanta: U.S. Department of Health and Human Services. ENTRIX, Inc. 2003. Draft wild game sampling work plan for the Tittabawassee River floodplain near Midland, Michigan. Houston: ENTRIX for The Dow Chemical Company. ENTRIX, Inc. 2004. Evaluation of PCDDs and PCDFs in wild game taken from the floodplain along the Tittabawassee River. Houston: ENTRIX for The Dow Chemical Company. Michigan Department of Environmental Quality, Environmental Response Division. 2001. Unpublished: Greenpoint—Tittabawassee River dioxin study area phase II sampling program. National Toxicology Program. 2001. 9th report on carcinogens. Research Triangle Park, North Carolina: U.S. Department of Health and Human Services. Public Health Service. U.S. Department of Agriculture. 1997. Guidance for reprocessing of broilers exposed to dioxin-contaminated feed. Washington: U.S. Department of Agriculture. U.S. Environmental Protection Agency. 2000. Draft exposure and human health reassessment of 2,3,7,8-tetrachlorodibenzo-p-dioxin (TCDD) and related compounds. Washington: U.S. Environmental Protection Agency.
Wild Game Sampling LocationsTittabawassee River Floodplain
Figure 1.
Midland
Bay City
Saginaw
#S
#S
#S
Reference Area
Near Smith's Crossing
Near Imerman Park
Saginaw Bay
Tittabawassee River
Location
N
# Sampling Location

13
Figu
re 2
. D
ow C
hem
ical
Wild
Gam
e St
udy
- Dee
r Liv
er
010
2030
4050
6070
8090
100
TR01
DR
01L1
TR01
DR
02L1
TR01
DR
03L1
TR01
DR
04L1
TR01
DR
05L1
TR01
DR
06L1
TR01
DR
07L1
TR01
DR
08L1
TR01
DR
09L1
TR01
DR
10L1
TR01
DR
12L1
TR01
DR
13L1
TR01
DR
14L1
TR02
DR
05L1
TR02
DR
06L1
TR02
DR
01LI
TR02
DR
02LI
TR02
DR
03L1
TR02
DR
04L1
TR02
DR
07L1
TR02
DR
08L1
TR02
DR
09L1
TR02
DR
10L1
TR02
DR
11L1
TR02
DR
12L1
TR02
DR
13L1
TR02
DR
14L1
TR03
DR
01L1
TR03
DR
02L1
TR03
DR
03L1
TR03
DR
04L1
TR03
DR
05L1
TR03
DR
06L1
TR03
DR
07L1
TR03
DR
08L1
TR03
DR
09L1
TR03
DR
10L1
TEQ
in p
pt w
et w
t.
129
TEQ
147
TEQ
149
TEQ
Ref
eren
ce A
rea S
mit
h's
Cro
ssin
g A
rea
Imer
man
Par
k A
rea
14
Figu
re 3
. D
ow C
hem
ical
Wild
Gam
e St
udy
- Tur
key
05
1015
2025
3035
4045
50
TR01
TY01
M1
TR01
TY02
M1
TR01
TY03
M1
TR01
TY03
MS
KIN
TR01
TY03
MS
KIN
OFF
TR01
TY04
M1
TR01
TY04
MS
KIN
TR01
TY04
MS
KIN
OFF
TR01
TY05
M1
TR01
TY06
M1
TR01
TY06
MS
KIN
TR01
TY06
MS
KIN
OFF
TR01
TY07
M1
TR01
TY08
M1
TR01
TY09
M1
TR01
TY10
M1
TR01
TY11
M1
TR01
TY12
M1
TR02
TY01
M1
TR02
TY02
M1
TR02
TY03
M1
TR02
TY04
M1
TR02
TY05
M1
TR02
TY06
M1
TR02
TY07
M1
TR02
TY07
MS
KIN
TR02
TY07
MS
KIN
OFF
TR02
TY08
M1
TR02
TY09
M1
TR02
TY10
M1
TR02
TY10
MS
KIN
TR02
TY10
MS
KIN
OFF
TR02
TY11
M1
TR02
TY11
MS
KIN
TR02
TY11
MS
KIN
OFF
TR03
TY01
M1
TEQ
in p
pt w
et w
t.
264
ppt
TEQ
Ref
eren
ce A
rea
Sm
ith'
s C
ross
ing
Imer
man
Par
k A
rea

15
Figu
re 4
. D
ow C
hem
ical
Wild
Gam
e St
udy
-Dee
r Mus
cle
00.
10.
20.
30.
40.
50.
60.
70.
80.
91
1.1
1.2
1.3
1.4
TR01
DR
11M
1TR
01D
R01
M1
TR01
DR
02M
1TR
01D
R03
M1
TR01
DR
04M
1TR
01D
R05
M1
TR01
DR
06M
1TR
01D
R07
M1
TR01
DR
08M
1TR
01D
R09
M1
TR01
DR
10M
1TR
01D
R12
M1
TR01
DR
13M
1TR
01D
R14
M1
TR02
DR
05M
1TR
02D
R06
M1
TR02
DR
01M
ITR
02D
R02
MI
TR02
DR
03M
1TR
02D
R04
M1
TR02
DR
07M
1TR
02D
R08
M1
TR02
DR
09M
1TR
02D
R10
M1
TR02
DR
11M
1TR
02D
R12
M1
TR02
DR
13M
1TR
02D
R14
M1
TR03
DR
01M
1TR
03D
R02
M1
TR03
DR
03M
1TR
03D
R04
M1
TR03
DR
05M
1TR
03D
R06
M1
TR03
DR
07M
1TR
03D
R08
M1
TR03
DR
09M
1TR
03D
R10
M1
TEQ
in p
pt w
et w
t.
Imer
man
Par
k A
rea
Sm
ith'
s C
ross
ing
Are
a
Ref
eren
ce A
rea

16
Figu
re 5
. D
ow C
hem
ical
Wild
Gam
e St
udy
- Squ
irrel
00.
51
1.5
22.
53
3.5
44.
55
TR01
SL01
M1
TR01
SL02
M1
TR01
SL03
M1
TR01
SL04
M1
TR01
SL05
M1
TR01
SL06
M1
TR01
SL07
M1
TR01
SL08
M1
TR01
SL09
M1
TR01
SL10
M1
TR01
SL11
M1
TR01
SL12
M1
TR02
SL01
M1
TR02
SL02
M1
TR02
SL03
M1
TR02
SL04
M1
TR02
SL05
M1
TR02
SL06
M1
TR02
SL07
M1
TR02
SL08
M1
TR02
SL09
M1
TR02
SL10
M1
TR03
SL01
M1
TR03
SL02
M1
TR03
SL03
M1
TR03
SL04
M1
TR03
SL05
M1
TR03
SL06
M1
TR03
SL07
M1
TR03
SL08
M1
TR03
SL09
M1
TR03
SL10
M1
TEQ
in p
pt w
et w
eigh
t
Ref
eren
ce A
rea
Sm
ith'
s C
ross
ing
Are
a
Imer
man
Par
k A
rea
17
Authors, Technical Advisors
Michigan Department of Community Health
Linda D. Dykema, Ph.D. Toxicologist, Principal Investigator
Robin Freer, M.S.
Geographic Information System Specialist
ATSDR Regional Representative
Mark Johnson Office of Regional Operations, Region V
ATSDR Technical Project Officer
Alan W. Yarbrough Division of Health Assessment and Consultation
Superfund Site Assessment Branch


Attachment A
Wild Game Advisories Downstream of Midland Technical Support Document
A-1
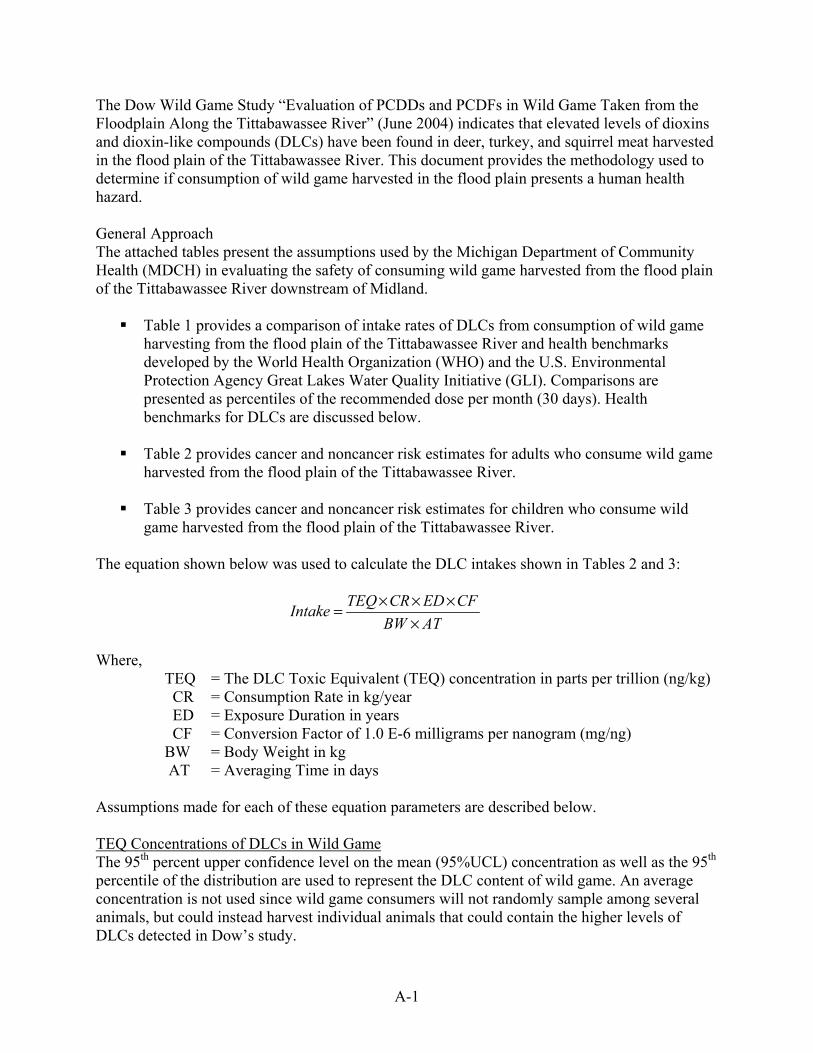
The Dow Wild Game Study “Evaluation of PCDDs and PCDFs in Wild Game Taken from the Floodplain Along the Tittabawassee River” (June 2004) indicates that elevated levels of dioxins and dioxin-like compounds (DLCs) have been found in deer, turkey, and squirrel meat harvested in the flood plain of the Tittabawassee River. This document provides the methodology used to determine if consumption of wild game harvested in the flood plain presents a human health hazard. General Approach The attached tables present the assumptions used by the Michigan Department of Community Health (MDCH) in evaluating the safety of consuming wild game harvested from the flood plain of the Tittabawassee River downstream of Midland. Table 1 provides a comparison of intake rates of DLCs from consumption of wild game
harvesting from the flood plain of the Tittabawassee River and health benchmarks developed by the World Health Organization (WHO) and the U.S. Environmental Protection Agency Great Lakes Water Quality Initiative (GLI). Comparisons are presented as percentiles of the recommended dose per month (30 days). Health benchmarks for DLCs are discussed below.
Table 2 provides cancer and noncancer risk estimates for adults who consume wild game
harvested from the flood plain of the Tittabawassee River. Table 3 provides cancer and noncancer risk estimates for children who consume wild
game harvested from the flood plain of the Tittabawassee River. The equation shown below was used to calculate the DLC intakes shown in Tables 2 and 3:
ATBWCFEDCRTEQIntake
××××=
Where, TEQ = The DLC Toxic Equivalent (TEQ) concentration in parts per trillion (ng/kg) CR = Consumption Rate in kg/year ED = Exposure Duration in years CF = Conversion Factor of 1.0 E-6 milligrams per nanogram (mg/ng) BW = Body Weight in kg AT = Averaging Time in days Assumptions made for each of these equation parameters are described below. TEQ Concentrations of DLCs in Wild Game The 95th percent upper confidence level on the mean (95%UCL) concentration as well as the 95th percentile of the distribution are used to represent the DLC content of wild game. An average concentration is not used since wild game consumers will not randomly sample among several animals, but could instead harvest individual animals that could contain the higher levels of DLCs detected in Dow’s study.
A-2
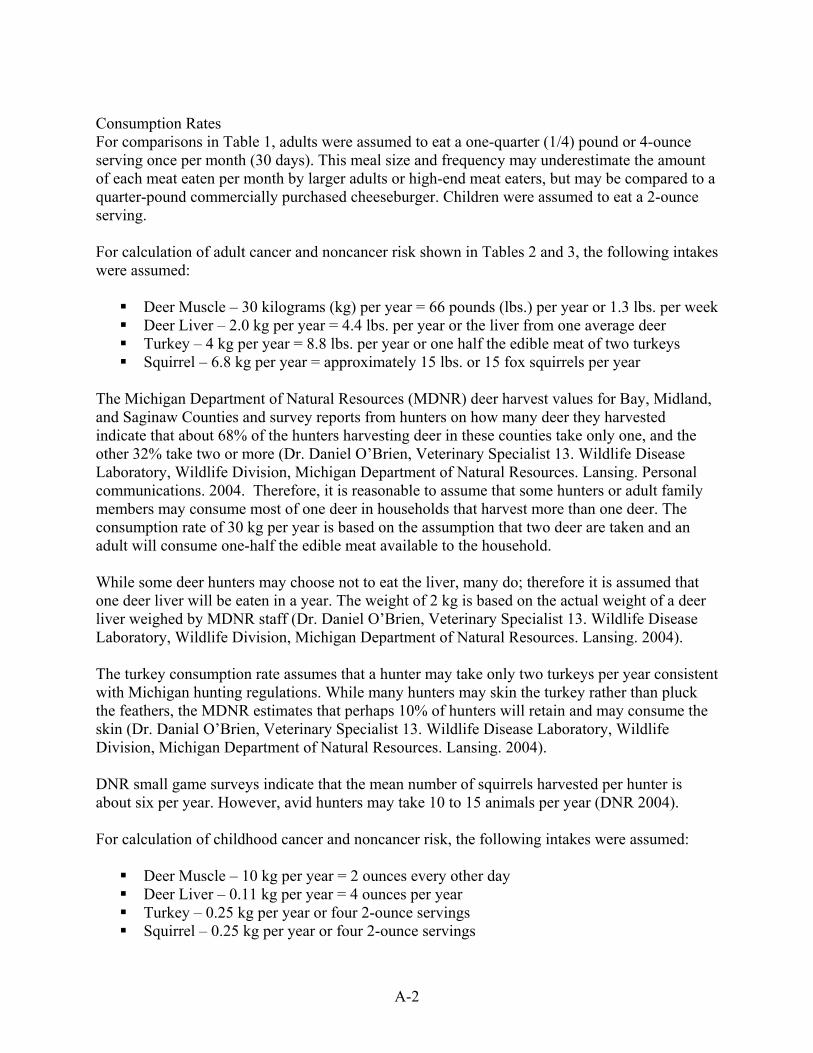
Consumption Rates For comparisons in Table 1, adults were assumed to eat a one-quarter (1/4) pound or 4-ounce serving once per month (30 days). This meal size and frequency may underestimate the amount of each meat eaten per month by larger adults or high-end meat eaters, but may be compared to a quarter-pound commercially purchased cheeseburger. Children were assumed to eat a 2-ounce serving. For calculation of adult cancer and noncancer risk shown in Tables 2 and 3, the following intakes were assumed: Deer Muscle – 30 kilograms (kg) per year = 66 pounds (lbs.) per year or 1.3 lbs. per week Deer Liver – 2.0 kg per year = 4.4 lbs. per year or the liver from one average deer Turkey – 4 kg per year = 8.8 lbs. per year or one half the edible meat of two turkeys Squirrel – 6.8 kg per year = approximately 15 lbs. or 15 fox squirrels per year
The Michigan Department of Natural Resources (MDNR) deer harvest values for Bay, Midland, and Saginaw Counties and survey reports from hunters on how many deer they harvested indicate that about 68% of the hunters harvesting deer in these counties take only one, and the other 32% take two or more (Dr. Daniel O’Brien, Veterinary Specialist 13. Wildlife Disease Laboratory, Wildlife Division, Michigan Department of Natural Resources. Lansing. Personal communications. 2004. Therefore, it is reasonable to assume that some hunters or adult family members may consume most of one deer in households that harvest more than one deer. The consumption rate of 30 kg per year is based on the assumption that two deer are taken and an adult will consume one-half the edible meat available to the household. While some deer hunters may choose not to eat the liver, many do; therefore it is assumed that one deer liver will be eaten in a year. The weight of 2 kg is based on the actual weight of a deer liver weighed by MDNR staff (Dr. Daniel O’Brien, Veterinary Specialist 13. Wildlife Disease Laboratory, Wildlife Division, Michigan Department of Natural Resources. Lansing. 2004). The turkey consumption rate assumes that a hunter may take only two turkeys per year consistent with Michigan hunting regulations. While many hunters may skin the turkey rather than pluck the feathers, the MDNR estimates that perhaps 10% of hunters will retain and may consume the skin (Dr. Danial O’Brien, Veterinary Specialist 13. Wildlife Disease Laboratory, Wildlife Division, Michigan Department of Natural Resources. Lansing. 2004). DNR small game surveys indicate that the mean number of squirrels harvested per hunter is about six per year. However, avid hunters may take 10 to 15 animals per year (DNR 2004). For calculation of childhood cancer and noncancer risk, the following intakes were assumed: Deer Muscle – 10 kg per year = 2 ounces every other day Deer Liver – 0.11 kg per year = 4 ounces per year Turkey – 0.25 kg per year or four 2-ounce servings Squirrel – 0.25 kg per year or four 2-ounce servings

A-3
Estimating how much wild game young children may consume is difficult. However, in households where wild game is used in place of store-bought meats, children reasonably would get a substantial portion of their protein intake from these foods. The estimated consumption rates for children may therefore underestimate the amounts of these foods eaten in a year. Exposure Duration (ED) The exposure duration was assumed to be 6 years for a child and 30 years for an adult consistent with assumptions used by the Michigan Department of Environmental Quality (MDEQ) to develop environmental cleanup criteria. Body Weight (BW) The adult and child body weights were assumed to be 70 kg and 15 kg, respectively. A 15-kg body weight corresponds approximately to a 3-year old child weighing 33 pounds. Averaging Time (AT) The AT represents the number of days over which the exposure is averaged and will vary dependent upon the type of toxic effect being evaluated. When evaluating noncancer effects, exposure is calculated by averaging over the period of exposure. For this evaluation, noncancer childhood exposures were averaged over 2,190 days (6 years x 365 days per year). Adult noncancer exposures were averaged over 10,950 days (30 years x 365 days per year). For cancer risk, the exposure is averaged over an assumed lifetime of 25,550 days (70 years x 365 days per year). Health Benchmarks Noncancer Health Effects The World Health Organization (WHO), the Agency for Toxic Substances and Disease Registry (ATSDR), and EPA’s Great Lakes Water Quality Initiative (GLI) have each assessed the noncancer effects of exposure to DLCs. The following benchmarks were used in assessing intake of DLCs from wild game. All values are presented as DLC doses in picogram (pg) per kilogram (kg) of body weight per unit of time. The WHO Tolerable Monthly Intake (TMI) of 70 pg/kg/month protective of both cancer
and noncancer health effects (WHO 2001). The ATSDR Minimal Risk Level (MRL) of 1 pg/kg/day protective of noncancer health
effects (ATSDR 1998). The GLI Acceptable Daily Exposure (ADE) of 1.3 pg/kg/day protective of noncancer
health effects (adjusted to 30 days for comparison to the WHO TMI) (GLI 1995). These health benchmarks do not represent a boundary between safe and unsafe intake of DLCs. However, intake of DLCs above these values will erode the margin of safety used in their derivation. Therefore, consumption of foods that contribute a high percentage of the recommended intake should be limited to avoid a significant exceedance of the health benchmark dose.
A-4
The derivations for the health benchmarks used in this evaluation are presented in detail in the cited documents and are not reproduced here. The WHO TMI, the ATSDR MRL, and the GLI ADE are all intended to be protective of potential developmental effects of DLC exposure either before birth or in the first few years of life. Therefore, exposures for women of childbearing age and children under the age of 15 are of particular concern.
Hazard quotients for wild game consumption are presented in Tables 2 and 3 for adults and children, respectively. A hazard quotient is a ratio of an exposure level to a reference dose developed for a chemical under consideration. If the hazard quotient is greater than unity, there may be concern for noncancer effects. The ATSDR MRL of 1 pg/kg/day is used to calculate hazard quotients for this evaluation. It is important to note that the hazard quotients shown are for one wild game species only and may not adequately account for DLC exposure if a consumer has additional exposures from sources such as other game or sport-caught fish.
Cancer The incremental lifetime cancer risk associated with consumption of wild game taken from the flood plain of the Tittabawassee River has also been calculated and may be compared to the acceptable incremental risk of 1 additional cancer in a population of 100,000 people as specified in Part 201, Environmental Remediation, of the Natural Resources and Environmental Protection Act, 1994 PA 451, as amended.
The cancer slope factor of 75,000 mg/kg/day-1 is used by the MDEQ to develop cleanup criteria under Part 201 of PA 451, referenced above. The slope factor is based on an observed increase in cancer in female rats in a two-year study conducted by the Dow Chemical Company (Kociba 1978). EPA and the National Toxicology Program are reviewing the cancer potency of DLCs. This assessment may be revised pending the outcome of those reviews.
Background Exposures When evaluating the potential for noncancer health effects resulting from exposure to DLCs in wild game, it is important to consider the level of exposure already occurring because of levels of DLCs in the national food supply. The U.S. Food and Drug Administration (FDA) Center for Food Safety and Applied Nutrition has estimated the exposure levels that would result from consumption of foods sampled in its Total Dietary Studies (TDS) conducted in 2001 and 2002. DLC concentration data were linked to consumption amounts for each food sampled in the TDS to provide an estimate of dietary exposure to DLCs by age group (FDA 2004). MDCH used these values to estimate the contribution of dietary exposure to adjust the ATSDR MRL of 1 pg/kg/day used in the Hazard Quotient evaluations presented in Tables 1 and 2. For children ages 1–6 years, the FDA TDS indicates an average TEQ intake from dietary sources of 24.1 pg/kg/month, which includes an average TEQ intake from meat and poultry of 9.7 pg/kg/month. It was assumed that wild game could account for one half the intake from meat and poultry, and the background dietary intake was adjusted to 19.25 pg/kg/month or 0.64 pg/kg/day. Therefore, only 36% of the ATSDR MRL of 1 pg/kg/day is not already taken up by background dietary exposures (1 pg/kg/day minus 0.64 pg/kg/day times 100). Hazard quotient calculations shown in Table 3 reflect this adjustment for wild game exposures. For adults, the FDA provides a TEQ intake from background dietary sources of 9.9 pg/kg/month. One half the TEQ intake from meat and poultry of 5.5 pg/kg/month was assume to come from
A-5
wild game consumption and the background rate adjusted to 7.15 pg/kg/month or 0.24 pg/kg/day, leaving 76% of the MRL for additional exposures. Conclusions and Recommendations Deer Muscle – DLC intake for adults from deer muscle meat taken south of Midland appears to be generally low in comparison to both the WHO TMI and the GLI ADE. However, consumption of 30 kg of deer muscle meat (one average deer per year or 1.3 pounds per week) would result in an exceedance of the ATSDR MRL and an increased cancer risk for approximately 3 additional cancers in 100,000 people. The MRL is protective of developmental effects in offspring of exposed mothers; therefore, an exceedance of this value is of more concern for women of childbearing age than for the general population of adults. A single 2-ounce serving of muscle meat at the 95th percentile of DLC content in deer near Imerman Park provides 9.7% of the ADE or 5.4 % of the TMI for a 15-kg child. Consumption by a child of 10 kg of muscle meat (2 ounces every other day) from deer taken near Imerman Park would result in a four- to five-fold exceedance of the ATSDR MRL and an increased cancer risk for 1.2 additional cancers in 100,000 children. The State of Michigan should advise that women of childbearing age and children under the age of 15 should eat only one meal per week of muscle meat taken from deer near Imerman Park.
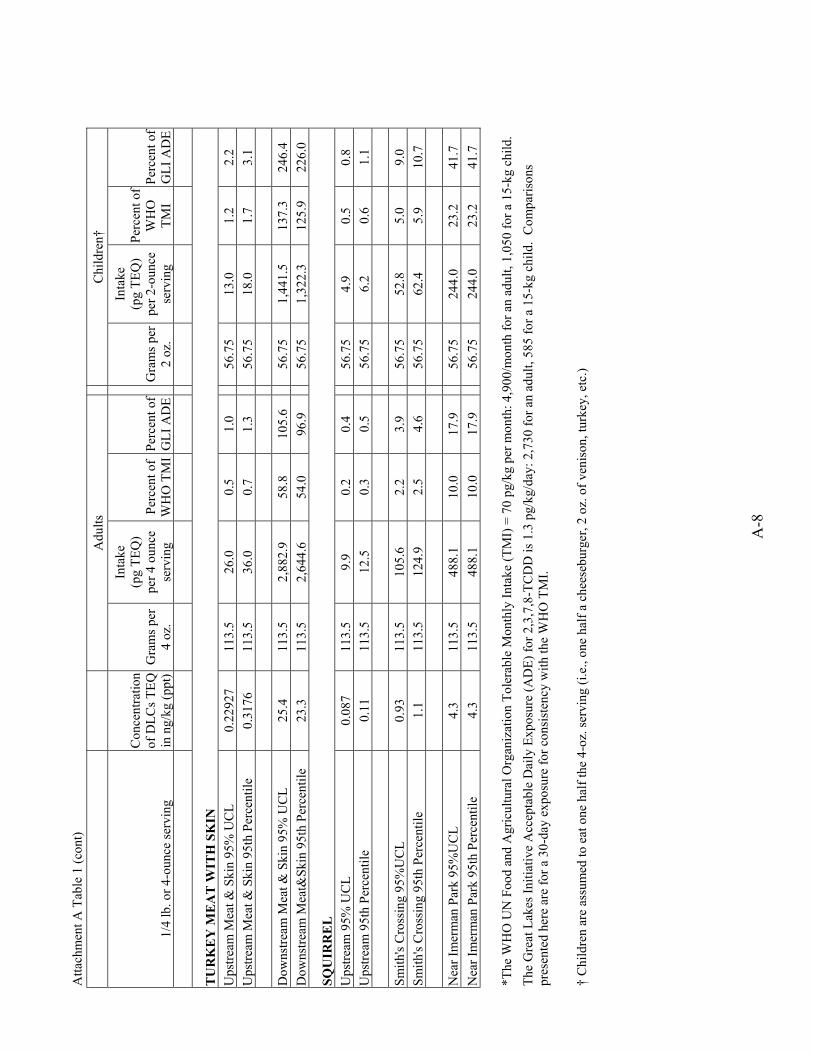
Deer Liver – DLC intakes from deer liver taken south of Midland range from 37% of the WHO TMI for an adult (Smith’s Crossing) to 1,445% of the GLI ADE or nearly 15 times the ADE for a child (near Imerman Park). Consumption of 2 kg of liver per year (one liver) from a deer taken near Imerman Park by an adult would result in a 15-fold exceedance of the ATSDR MRL and an increased cancer risk for 3.7 cancers in 10,000 people. Consumption of 4 ounces of liver from a deer taken near Imerman Park would result in an 8-fold exceedance of the ATSDR MRL and an increased cancer risk for 1.9 additional cancers in 100,000 children. The State of Michigan should advise that no one eat liver from deer taken in the Tittabawassee River flood plain south of Midland. Turkey – DLC intakes from turkey taken south of Midland range from 28.5% of the WHO TMI for adults (meat without skin) to 226% of the GLI ADE for a child (meat with skin). Consumption of 4 kg (one-half the edible meat of two turkeys) per year by an adult would result in a 2.5- (meat without skin) to 5.3-fold (meat with skin) exceedance of the ATSDR MRL and an increased cancer risk for up to 1.3 additional cancers in 10,000 adults. Consumption of 8 ounces of turkey per year by a child would result in a 1.5- to 3.2-fold exceedance of the ATSDR MRL and an increased cancer risk for 3.6 to 7.5 additional cancers in 1 million children. The State of Michigan should advise that no one eat turkey (with or without the skin) taken in the Tittabawassee River flood plain south of Midland. If wild game consumers choose to eat turkey taken in this area, the State of Michigan should advise that the skin and the internal organs such as the liver should not be eaten.
A-6
Squirrel - DLC intake for adults from squirrel meat taken near Smith’s Crossing appears to be generally low in comparison to both the WHO TMI and GLI ADE. However, DLC intake from just 4 ounces of meat from a squirrel taken near Imerman Park provides 10% of the WHO TMI and 18% of the GLI ADE. A single 2-ounce serving at the 95th percentile of DLC content in squirrel near Imerman Park provides 23% of the WHO TMI and 42% of the GLI ADE for a 15-kg child. The State of Michigan should advise that women of childbearing age and children under the age of 15 should eat only one meal per week of squirrel meat taken from near Imerman Park. References Agency for Toxic Substances and Disease Registry. 1998. Toxicological profile for chlorinated dibenzo-p-dioxins. Atlanta: U.S. Department of Health and Human Services. Kociba, et al. 1978. Results of a two-year choric toxicity and oncogenicity study of 2,3,7,8-TCDD in rats. Toxicol Appl Pharmacol. 46:281-287. U.S. Environmental Protection Agency, Great Lakes Water Quality Initiative. 1995. Criteria documents for the protection of human health. EPA Number: 820B95006. Washington: U.S. Environmental Protection Agency. U.S. Food and Drug Administration. 2004. PCDD/PCDF exposure estimates. July 2004. http://www.cfsan.fda.gov/~lrd/dioxee.html. World Health Organization. 2001. Joint FAO/SHO expert committee on food additives (JECFA). Fifty-seventh meeting, Rome, June 5-14, 2001.

A
-7
Atta
chm
ent A
T
able
1
Inta
ke o
f DL
Cs i
n W
ild G
ame
take
n fr
om th
e T
ittab
awas
see
Riv
er F
lood
plai
n
The
com
paris
ons s
how
n be
low
are
the
perc
enta
ge o
f the
WH
O T
oler
able
Mon
thly
Inta
ke (T
MI)
or t
he G
LI A
ccep
tabl
e D
aily
Exp
osur
e (A
DE)
acc
ount
ed fo
r by
a si
ngle
4-o
unce
serv
ing
for a
dults
or a
sing
le 2
-oun
ce se
rvin
g fo
r chi
ldre
n.*
Adu
lts
C
hild
ren†
1/4
lb. o
r 4-o
unce
serv
ing
Con
cent
ratio
n of
DLC
s TEQ
in
ng/
kg (p
pt)
Gra
ms p
er
4 oz
.
Inta
ke
(pg
TEQ
)
per 4
oun
ce
serv
ing
Perc
ent o
f W
HO
TM
IPe
rcen
t of
GLI
AD
E
Gra
ms p
er
2 oz
.
Inta
ke
(pg
TEQ
)
per 2
-oun
ce
serv
ing
Perc
ent o
f W
HO
TM
I Pe
rcen
t of
GLI
AD
E
DE
ER
MU
SCL
E
Ups
tream
95%
UC
L 0.
089
113.
5 10
.1
0.2
0.4
56.7
5 5.
1 0.
5 0.
9 U
pstre
am 9
5th
Perc
entil
e 0.
12
113.
5 13
.6
0.3
0.5
56.7
5 6.
8 0.
6 1.
2
Sm
ith's
Cro
ssin
g 95
% U
CL
0.2
113.
5 22
.7
0.5
0.8
56.7
5 11
.4
1.1
1.9
Smith
's C
ross
ing
95 P
erce
ntile
0.
25
113.
5 28
.4
0.6
1.0
56.7
5 14
.2
1.4
2.4
Nea
r Im
erm
an P
ark
95%
UC
L 0.
82
113.
5 93
.1
1.9
3.4
56.7
5 46
.5
4.4
8.0
Nea
r Im
erm
an P
ark
95%
th P
erce
ntile
1
113.
5 11
3.5
2.3
4.2
56.7
5 56
.8
5.4
9.7
DE
ER
LIV
ER
U
pstre
am 9
5% U
CL
0.73
11
3.5
82.9
1.
7 3.
0 56
.75
41.4
3.
9 7.
1 U
pstre
am 9
5th
Perc
entil
e 1
113.
5 11
3.5
2.3
4.2
56.7
5 56
.8
5.4
9.7
Smith
's C
ross
ing
95%
UC
L 16
11
3.5
1,81
6.0
37.1
66
.5
56.7
5 90
8.0
86.5
15
5.2
Smith
's C
ross
ing
95th
Per
cent
ile
19
113.
5 2,
156.
5 44
.0
79.0
56
.75
1,07
8.3
102.
7 18
4.3
Nea
r Im
erm
an P
ark
95%
UC
L 14
8 11
3.5
16,7
98.0
34
2.8
615.
3 56
.75
8,39
9.0
799.
9 1,
435.
7 N
ear I
mer
man
Par
k 95
th P
erce
ntile
14
9 11
3.5
16,9
11.5
34
5.1
619.
5 56
.75
8,45
5.8
805.
3 1,
445.
4
TU
RK
EY
ME
AT
ON
LY
U
pstre
am M
eat O
nly
95%
UC
L 0.
15
113.
5 17
.0
0.3
0.6
56.7
5 8.
5 0.
8 1.
5 U
pstre
am M
eat O
nly
95th
Per
cent
ile
0.15
11
3.5
17.0
0.
3 0.
6 56
.75
8.5
0.8
1.5
Dow
nstre
am M
eat O
nly
95%
UC
L 13
.3
113.
5 1,
509.
6 30
.8
55.3
56
.75
754.
8 71
.9
129.
0 D
owns
tream
Mea
t Onl
y 95
th P
erce
ntile
12
.3
113.
5 1,
396.
1 28
.5
51.1
56
.75
698.
0 66
.5
119.
3
A
-8
Atta
chm
ent A
Tab
le 1
(con
t)
Adu
lts
C
hild
ren†
1/4
lb. o
r 4-o
unce
serv
ing
Con
cent
ratio
n of
DLC
s TEQ
in
ng/
kg (p
pt)
Gra
ms p
er
4 oz
.
Inta
ke
(pg
TEQ
)
per 4
oun
ce
serv
ing
Perc
ent o
f W
HO
TM
IPe
rcen
t of
GLI
AD
E
Gra
ms p
er
2 oz
.
Inta
ke
(pg
TEQ
)
per 2
-oun
ce
serv
ing
Perc
ent o
f W
HO
TM
I Pe
rcen
t of
GLI
AD
E
TU
RK
EY
ME
AT
WIT
H S
KIN
U
pstre
am M
eat &
Ski
n 95
% U
CL
0.22
927
113.
5 26
.0
0.5
1.0
56.7
5 13
.0
1.2
2.2
Ups
tream
Mea
t & S
kin
95th
Per
cent
ile
0.31
76
113.
5 36
.0
0.7
1.3
56.7
5 18
.0
1.7
3.1
Dow
nstre
am M
eat &
Ski
n 95
% U
CL
25.4
11
3.5
2,88
2.9
58.8
10
5.6
56.7
5 1,
441.
5 13
7.3
246.
4 D
owns
tream
Mea
t&Sk
in 9
5th
Perc
entil
e 23
.3
113.
5 2,
644.
6 54
.0
96.9
56
.75
1,32
2.3
125.
9 22
6.0
SQU
IRR
EL
U
pstre
am 9
5% U
CL
0.08
7 11
3.5
9.9
0.2
0.4
56.7
5 4.
9 0.
5 0.
8 U
pstre
am 9
5th
Perc
entil
e 0.
11
113.
5 12
.5
0.3
0.5
56.7
5 6.
2 0.
6 1.
1
Sm
ith's
Cro
ssin
g 95
%U
CL
0.93
11
3.5
105.
6 2.
2 3.
9 56
.75
52.8
5.
0 9.
0 Sm
ith's
Cro
ssin
g 95
th P
erce
ntile
1.
1 11
3.5
124.
9 2.
5 4.
6 56
.75
62.4
5.
9 10
.7
Nea
r Im
erm
an P
ark
95%
UC
L 4.
3 11
3.5
488.
1 10
.0
17.9
56
.75
244.
0 23
.2
41.7
N
ear I
mer
man
Par
k 95
th P
erce
ntile
4.
3 11
3.5
488.
1 10
.0
17.9
56
.75
244.
0 23
.2
41.7
*The
WH
O U
N F
ood
and
Agr
icul
tura
l Org
aniz
atio
n To
lera
ble
Mon
thly
Inta
ke (T
MI)
= 7
0 pg
/kg
per m
onth
: 4,9
00/m
onth
for a
n ad
ult,
1,05
0 fo
r a 1
5-kg
chi
ld.
The
Gre
at L
akes
Initi
ativ
e A
ccep
tabl
e D
aily
Exp
osur
e (A
DE)
for 2
,3,7
,8-T
CD
D is
1.3
pg/
kg/d
ay: 2
,730
for a
n ad
ult,
585
for a
15-
kg c
hild
. C
ompa
rison
s pr
esen
ted
here
are
for a
30-
day
expo
sure
for c
onsi
sten
cy w
ith th
e W
HO
TM
I.
† C
hild
ren
are
assu
med
to e
at o
ne h
alf t
he 4
-oz.
serv
ing
(i.e.
, one
hal
f a c
hees
ebur
ger,
2 oz
. of v
enis
on, t
urke
y, e
tc.)

A
-9
Att
atch
men
t A
Tab
le 2
A
dult
Can
cer a
nd N
onca
ncer
Ris
k Es
timat
es fo
r Con
sum
ptio
n of
Wild
Gam
e fr
om th
e Ti
ttaba
was
see
Riv
er F
lood
plai
n
Con
cent
ratio
n of
DLC
s TEQ
in
ng/
kg (p
pt)
Con
sum
ptio
n R
ate
in
kg/y
ear
Con
vers
ion
fact
or fr
om
ng to
mg
Expo
sure
D
urat
ion
in y
ears
Adu
lt B
ody
Wei
ght
(kg)
A
vera
ging
tim
e
Adu
lt TE
Q
inta
ke in
m
g/kg
/day
Can
cer
Slop
e Fa
ctor
[1
/ (m
g/kg
/day
)]
Adu
lt In
crem
enta
l C
ance
r Ris
k
ATS
DR
M
RL
for
Chr
onic
N
onca
ncer
H
azar
d (m
g/kg
/day
)
Adu
lt C
hron
ic
N
onca
ncer
H
azar
d Q
uotie
nt
DE
ER
MU
SCL
E
Ups
tream
95%
UC
L 0.
089
30.0
1.
0E-0
6 30
70
.0
25,5
50.0
4.48
E-11
7.50
E+04
3.4E
-06
1.0E
-09
0.14
U
pstre
am 9
5th
Perc
entil
e 0.
12
30.0
1.
0E-0
6 30
70
.0
25,5
50.0
6.04
E-11
7.50
E+04
4.5E
-06
1.0E
-09
0.19
Sm
ith's
Cro
ssin
g 95
% U
CL
0.2
30.0
1.
0E-0
6 30
70
.0
25,5
50.0
1.01
E-10
7.50
E+04
7.5E
-06
1.0E
-09
0.31
Sm
ith's
Cro
ssin
g 95
Per
cent
ile
0.25
30
.0
1.0E
-06
30
70.0
25
,550
.01.
26E-
107.
50E+
049.
4E-0
6 1.
0E-0
9 0.
39
Nea
r Im
erm
an P
ark
95%
UC
L 0.
82
30.0
1.
0E-0
6 30
70
.0
25,5
50.0
4.13
E-10
7.50
E+04
3.1E
-05
1.0E
-09
1.28
N
ear I
mer
man
Par
k 95
%th
Per
cent
ile
1 30
.0
1.0E
-06
30
70.0
25
,550
.05.
03E-
107.
50E+
043.
8E-0
5 1.
0E-0
9 1.
57
DE
ER
LIV
ER
U
pstre
am 9
5% U
CL
0.73
2
1.0E
-06
30
70.0
25
,550
.02.
45E-
117.
50E+
041.
8E-0
6 1.
0E-0
9 0.
08
Ups
tream
95t
h Pe
rcen
tile
1 2
1.0E
-06
30
70.0
25
,550
.03.
35E-
117.
50E+
042.
5E-0
6 1.
0E-0
9 0.
10
Smith
's C
ross
ing
95%
UC
L 16
2
1.0E
-06
30
70.0
25
,550
.05.
37E-
107.
50E+
044.
0E-0
5 1.
0E-0
9 1.
67
Smith
's C
ross
ing
95th
Per
cent
ile
19
2 1.
0E-0
6 30
70
.0
25,5
50.0
6.37
E-10
7.50
E+04
4.8E
-05
1.0E
-09
1.98
N
ear I
mer
man
Par
k 95
% U
CL
148
2 1.
0E-0
6 30
70
.0
25,5
50.0
4.97
E-09
7.50
E+04
3.7E
-04
1.0E
-09
15.4
5 N
ear I
mer
man
Par
k 95
th P
erce
ntile
14
9 2
1.0E
-06
30
70.0
25
,550
.05.
00E-
097.
50E+
043.
7E-0
4 1.
0E-0
9 15
.55
TU
RK
EY
ME
AT
ON
LY
U
pstre
am M
eat O
nly
95%
UC
L 0.
15
4 1.
0E-0
6 30
70
.0
25,5
50.0
1.01
E-11
7.50
E+04
7.5E
-07
1.0E
-09
0.03
U
pstre
am M
eat O
nly
95th
Per
cent
ile
0.15
4
1.0E
-06
30
70.0
25
,550
.01.
01E-
117.
50E+
047.
5E-0
7 1.
0E-0
9 0.
03
Dow
nstre
am M
eat O
nly
95%
UC
L 13
.3
4 1.
0E-0
6 30
70
.0
25,5
50.0
8.92
E-10
7.50
E+04
6.7E
-05
1.0E
-09
2.78
D
owns
tream
Mea
t Onl
y 95
th P
erce
ntile
12
.3
4 1.
0E-0
6 30
70
.0
25,5
50.0
8.25
E-10
7.50
E+04
6.2E
-05
1.0E
-09
2.57

A
-10
Atta
chm
ent A
Tab
le 2
(con
t)
Con
cent
ratio
n of
DLC
s TEQ
in
ng/
kg (p
pt)
Con
sum
ptio
n R
ate
in
kg/y
ear
Con
vers
ion
fact
or fr
om
ng to
mg
Expo
sure
D
urat
ion
in y
ears
Adu
lt B
ody
Wei
ght
(kg)
A
vera
ging
tim
e
Adu
lt TE
Q
inta
ke in
m
g/kg
/day
Can
cer
Slop
e Fa
ctor
[1
/ (m
g/kg
/day
)]
Adu
lt In
crem
enta
l C
ance
r Ris
k
ATS
DR
M
RL
for
Chr
onic
N
onca
ncer
H
azar
d (m
g/kg
/day
)
Adu
lt C
hron
ic
N
onca
ncer
H
azar
d Q
uotie
nt
TU
RK
EY
ME
AT
WIT
H S
KIN
U
pstre
am M
eat &
Ski
n 95
% U
CL
0.22
927
4 1.
0E-0
6 30
70
.0
25,5
50.0
1.54
E-11
7.50
E+04
1.2E
-06
1.0E
-09
0.05
U
pstre
am M
eat &
Ski
n 95
th P
erce
ntile
0.
3176
4
1.0E
-06
30
70.0
25
,550
.02.
13E-
117.
50E+
041.
6E-0
6 1.
0E-0
9 0.
07
Dow
nstre
am M
eat &
Ski
n 95
% U
CL
25.4
4
1.0E
-06
30
70.0
25
,550
.01.
70E-
097.
50E+
041.
3E-0
4 1.
0E-0
9 5.
30
Dow
nstre
am M
eat&
Skin
95t
h Pe
rcen
tile
23.3
4
1.0E
-06
30
70.0
25
,550
.01.
56E-
097.
50E+
041.
2E-0
4 1.
0E-0
9 4.
86
SQU
IRR
EL
U
pstre
am 9
5% U
CL
0.08
7 6.
8 1.
0E-0
6 30
70
.0
25,5
50.0
9.92
E-12
7.50
E+04
7.4E
-07
1.0E
-09
0.03
U
pstre
am 9
5th
Perc
entil
e 0.
11
6.8
1.0E
-06
30
70.0
25
,550
.01.
25E-
117.
50E+
049.
4E-0
7 1.
0E-0
9 0.
04
Smith
's C
ross
ing
95%
UC
L 0.
93
6.8
1.0E
-06
30
70.0
25
,550
.01.
06E-
107.
50E+
048.
0E-0
6 1.
0E-0
9 0.
33
Smith
's C
ross
ing
95th
Per
cent
ile
1.1
6.8
1.0E
-06
30
70.0
25
,550
.01.
25E-
107.
50E+
049.
4E-0
6 1.
0E-0
9 0.
39
Nea
r Im
erm
an P
ark
95%
UC
L 4.
3 6.
8 1.
0E-0
6 30
70
.0
25,5
50.0
4.90
E-10
7.50
E+04
3.7E
-05
1.0E
-09
1.53
N
ear I
mer
man
Par
k 95
th P
erce
ntile
4.
3 6.
8 1.
0E-0
6 30
70
.0
25,5
50.0
4.90
E-10
7.50
E+04
3.7E
-05
1.0E
-09
1.53
30
kg
= ap
prox
. 66
lbs.
or 1
.3 lb
s. pe
r wee
k
2.
0 kg
= 4
.4 lb
s. or
the
liver
from
an
aver
age
deer
4
kg =
app
rox
8.8
lbs.
or h
alf t
he e
dibl
e m
eat o
f 2 tu
rkey
s per
yea
r
6.8
kg =
app
rox
15 lb
s. or
15
fox
squi
rrel
s
Ex
posu
re F
requ
ency
is 2
5,55
0 da
ys fo
r can
cer r
isk
and
10,9
50 d
ays f
or n
onca
ncer
haz
ard
quot
ient
.
10
0 %
Bio
avai
labi
lity
is a
ssum
ed fo
r DLC
s in
food
(Mos
er a
nd M
cLac
hlan
200
1).
H
azar
d Q
uotie
nt c
alcu
latio
ns a
re b
ased
on
the
ATS
DR
Min
imal
Ris
k Le
vel o
f 1 p
g TE
Q p
er k
g bo
dy w
eigh
t per
day
adj
uste
d fo
r bac
kgro
und
diet
ary
inta
ke (F
DA
/CFS
AN
20
04).

A
-11
Atta
chm
ent A
Ta
ble
3 C
hild
Can
cer a
nd N
onca
ncer
Ris
k Es
timat
es fo
r Con
sum
ptio
n of
Wild
Gam
e fr
om th
e Ti
ttaba
was
see
Riv
er F
lood
plai
n
Con
cent
ratio
n of
DLC
s TEQ
in
ng/k
g (p
pt)
Con
sum
ptio
n R
ate
kg/y
ear
Con
vers
ion
fact
or fr
om
ng to
mg
Expo
sure
D
urat
ion
year
s
Chi
ld
body
w
eigh
t (k
g)
Ave
ragi
ng
time*
Chi
ld T
EQ
inta
ke in
m
g/kg
/day
Can
cer S
lope
Fa
ctor
[1
/(mg/
kg/d
ay)]
Chi
ld
Incr
emen
tal
Can
cer R
isk
ATS
DR
M
RL
for
Chr
onic
N
onca
ncer
H
azar
d (m
g/kg
/day
)
Chi
ld
Chr
onic
N
onca
ncer
H
azar
d Q
uotie
nt
DE
ER
MU
SCL
E
Ups
tream
95%
UC
L 0.
089
10.0
1.
0E-0
6 6
15.0
2,
190.
01.
63E-
10
7.50
E+04
1.
0E-0
6 1.
0E-0
9 0.
45
Ups
tream
95t
h Pe
rcen
tile
0.12
10
.0
1.0E
-06
6 15
.0
2,19
0.0
2.19
E-10
7.
50E+
04
1.4E
-06
1.0E
-09
0.61
Sm
ith's
Cro
ssin
g 95
% U
CL
0.2
10.0
1.
0E-0
6 6
15.0
2,
190.
03.
65E-
10
7.50
E+04
2.
3E-0
6 1.
0E-0
9 1.
01
Smith
's C
ross
ing
95 P
erce
ntile
0.
25
10.0
1.
0E-0
6 6
15.0
2,
190.
04.
57E-
10
7.50
E+04
2.
9E-0
6 1.
0E-0
9 1.
27
Nea
r Im
erm
an P
ark
95%
UC
L 0.
82
10.0
1.
0E-0
6 6
15.0
2,
190.
01.
50E-
09
7.50
E+04
9.
6E-0
6 1.
0E-0
9 4.
16
Nea
r Im
erm
an P
ark
95%
th P
erce
ntile
1
10.0
1.
0E-0
6 6
15.0
2,
190.
01.
83E-
09
7.50
E+04
1.
2E-0
5 1.
0E-0
9 5.
07
DE
ER
LIV
ER
U
pstre
am 9
5% U
CL
0.73
0.
11
1.0E
-06
6 15
.0
2,19
0.0
1.47
E-11
7.
50E+
04
9.4E
-08
1.0E
-09
0.04
U
pstre
am 9
5th
Perc
entil
e 1
0.11
1.
0E-0
6 6
15.0
2,
190.
02.
01E-
11
7.50
E+04
1.
3E-0
7 1.
0E-0
9 0.
06
Smith
's C
ross
ing
95%
UC
L 16
0.
11
1.0E
-06
6 15
.0
2,19
0.0
3.21
E-10
7.
50E+
04
2.1E
-06
1.0E
-09
0.89
Sm
ith's
Cro
ssin
g 95
th P
erce
ntile
19
0.
11
1.0E
-06
6 15
.0
2,19
0.0
3.82
E-10
7.
50E+
04
2.5E
-06
1.0E
-09
1.06
N
ear I
mer
man
Par
k 95
% U
CL
148
0.11
1.
0E-0
6 6
15.0
2,
190.
02.
97E-
09
7.50
E+04
1.
9E-0
5 1.
0E-0
9 8.
26
Nea
r Im
erm
an P
ark
95th
Per
cent
ile
149
0.11
1.
0E-0
6 6
15.0
2,
190.
02.
99E-
09
7.50
E+04
1.
9E-0
5 1.
0E-0
9 8.
32
TU
RK
EY
ME
AT
ON
LY
U
pstre
am M
eat O
nly
95%
UC
L 0.
15
0.25
1.
0E-0
6 6
15.0
2,
190.
06.
85E-
12
7.50
E+04
4.
4E-0
8 1.
0E-0
9 0.
02
Ups
tream
Mea
t Onl
y 95
th P
erce
ntile
0.
15
0.25
1.
0E-0
6 6
15.0
2,
190.
06.
85E-
12
7.50
E+04
4.
4E-0
8 1.
0E-0
9 0.
02
Dow
nstre
am M
eat O
nly
95%
UC
L 13
.3
0.25
1.
0E-0
6 6
15.0
2,
190.
06.
07E-
10
7.50
E+04
3.
9E-0
6 1.
0E-0
9 1.
69
Dow
nstre
am M
eat O
nly
95th
Per
cent
ile
12.3
0.
25
1.0E
-06
6 15
.0
2,19
0.0
5.62
E-10
7.
50E+
04
3.6E
-06
1.0E
-09
1.56
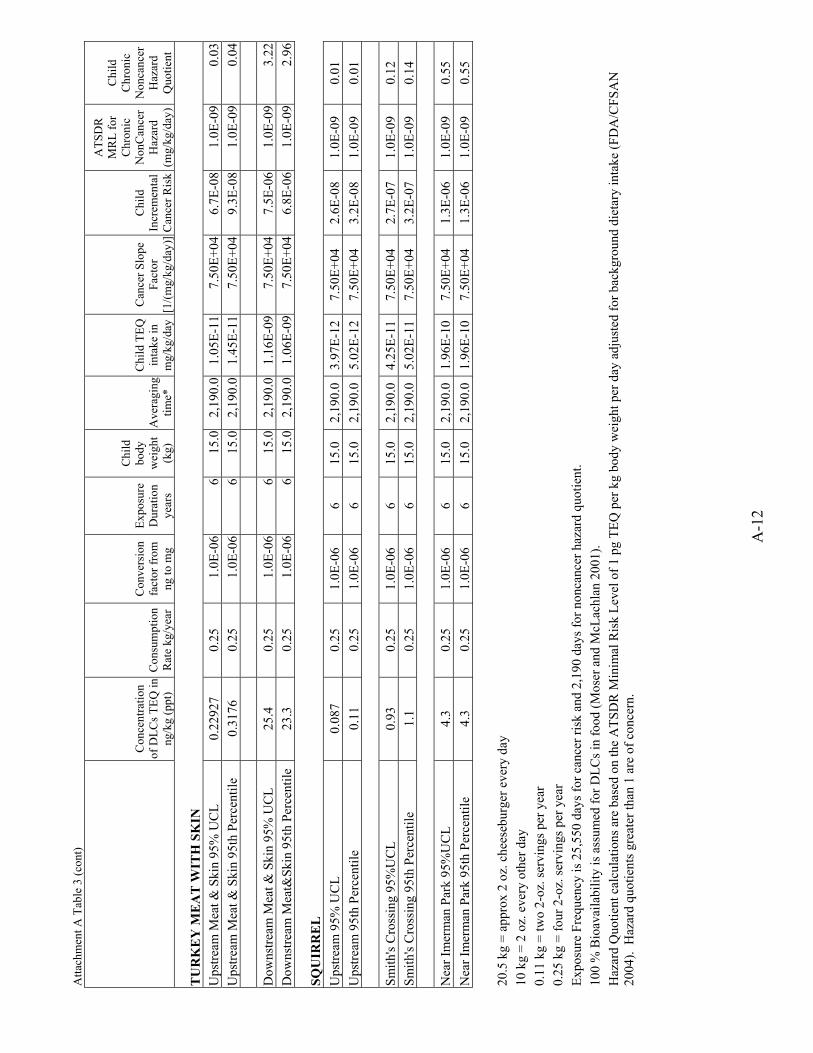
A
-12
Atta
chm
ent A
Tab
le 3
(con
t)
Con
cent
ratio
n of
DLC
s TEQ
in
ng/k
g (p
pt)
Con
sum
ptio
n R
ate
kg/y
ear
Con
vers
ion
fact
or fr
om
ng to
mg
Expo
sure
D
urat
ion
year
s
Chi
ld
body
w
eigh
t (k
g)
Ave
ragi
ng
time*
Chi
ld T
EQ
inta
ke in
m
g/kg
/day
Can
cer S
lope
Fa
ctor
[1
/(mg/
kg/d
ay)]
Chi
ld
Incr
emen
tal
Can
cer R
isk
ATS
DR
M
RL
for
Chr
onic
N
onC
ance
r H
azar
d (m
g/kg
/day
)
Chi
ld
Chr
onic
N
onca
ncer
H
azar
d Q
uotie
nt
TU
RK
EY
ME
AT
WIT
H S
KIN
U
pstre
am M
eat &
Ski
n 95
% U
CL
0.22
927
0.25
1.
0E-0
66
15.0
2,
190.
01.
05E-
117.
50E+
046.
7E-0
81.
0E-0
90.
03
Ups
tream
Mea
t & S
kin
95th
Per
cent
ile
0.31
76
0.25
1.
0E-0
66
15.0
2,
190.
01.
45E-
117.
50E+
049.
3E-0
81.
0E-0
90.
04
Dow
nstre
am M
eat &
Ski
n 95
% U
CL
25.4
0.
25
1.0E
-06
615
.0
2,19
0.0
1.16
E-09
7.50
E+04
7.5E
-06
1.0E
-09
3.22
D
owns
tream
Mea
t&Sk
in 9
5th
Perc
entil
e 23
.3
0.25
1.
0E-0
66
15.0
2,
190.
01.
06E-
097.
50E+
046.
8E-0
61.
0E-0
92.
96
SQU
IRR
EL
U
pstre
am 9
5% U
CL
0.08
7 0.
25
1.0E
-06
6 15
.0
2,19
0.0
3.97
E-12
7.50
E+04
2.
6E-0
8 1.
0E-0
9 0.
01
Ups
tream
95t
h Pe
rcen
tile
0.11
0.
25
1.0E
-06
6 15
.0
2,19
0.0
5.02
E-12
7.50
E+04
3.
2E-0
8 1.
0E-0
9 0.
01
Sm
ith's
Cro
ssin
g 95
%U
CL
0.93
0.
25
1.0E
-06
6 15
.0
2,19
0.0
4.25
E-11
7.50
E+04
2.
7E-0
7 1.
0E-0
9 0.
12
Smith
's C
ross
ing
95th
Per
cent
ile
1.1
0.25
1.
0E-0
6 6
15.0
2,
190.
05.
02E-
117.
50E+
04
3.2E
-07
1.0E
-09
0.14
Nea
r Im
erm
an P
ark
95%
UC
L 4.
3 0.
25
1.0E
-06
6 15
.0
2,19
0.0
1.96
E-10
7.50
E+04
1.
3E-0
6 1.
0E-0
9 0.
55
Nea
r Im
erm
an P
ark
95th
Per
cent
ile
4.3
0.25
1.
0E-0
6 6
15.0
2,
190.
01.
96E-
107.
50E+
04
1.3E
-06
1.0E
-09
0.55
20
.5 k
g =
appr
ox 2
oz.
che
eseb
urge
r eve
ry d
ay
10 k
g =
2 oz
. eve
ry o
ther
day
0.11
kg
= tw
o 2-
oz. s
ervi
ngs p
er y
ear
0.
25 k
g =
four
2-o
z. se
rvin
gs p
er y
ear
Ex
posu
re F
requ
ency
is 2
5,55
0 da
ys fo
r can
cer r
isk
and
2,19
0 da
ys fo
r non
canc
er h
azar
d qu
otie
nt.
100
% B
ioav
aila
bilit
y is
ass
umed
for D
LCs i
n fo
od (M
oser
and
McL
achl
an 2
001)
.
H
azar
d Q
uotie
nt c
alcu
latio
ns a
re b
ased
on
the
ATS
DR
Min
imal
Ris
k Le
vel o
f 1 p
g TE
Q p
er k
g bo
dy w
eigh
t per
day
adj
uste
d fo
r bac
kgro
und
diet
ary
inta
ke (F
DA
/CFS
AN
20
04).
Haz
ard
quot
ient
s gre
ater
than
1 a
re o
f con
cern
.

Attachment B Wild Game Advisory

B-1
FOR IMMEDIATE RELEASE CONTACT: T.J. Bucholz September 14, 2004 (517) 241-2112
State of Michigan Issues Health Advisories For Consuming Wild
Game From Tittabawassee River Flood Plain Today, four state agencies announced their response and concerns regarding a recent
Dow Chemical Company draft report on wild game. The study evaluated dioxin levels in wild game living in the Tittabawassee River floodplain, downstream from the community of Midland.
The Michigan Departments of Agriculture, Community Health, Environmental Quality and Natural Resources said today samples of wild game taken from the floodplain show high levels of dioxin and dioxin like compounds in muscle meats, skin, and other consumable portions of animals.
State of Michigan health assessors have reviewed the wild game data for the flood plain of the Tittabawassee River downstream of Midland. The results conclude that eating deer, turkey, or squirrel that contain dioxin at the levels found in the Dow wild game study could result in adverse health effects.
Levels of dioxins in the wild game harvested in the floodplain downstream of Midland for the study were up to 7 times higher than samples taken upstream of Midland in deer muscle meat, 118 times higher in deer liver, 66 times higher in turkey, and 40 times higher in squirrel.
The Michigan Department of Community Health (MDCH) is advising that hunters and their families follow these recommendations:
• Do not eat the liver from deer harvested in or near the floodplain downstream of Midland.
• Limit consumption of muscle meat from deer harvested in or near the floodplain
downstream of Midland. Women of childbearing age and children under the age of 15 should eat only one meal of deer muscle meat harvested in the floodplain per week. Trimming any visible fat will lower the level of dioxins in the cooked meat.
• Do not eat turkey harvested in or near the floodplain downstream of Midland.
While MDCH advises that you not eat turkey taken from the floodplain, at a minimum the skin, liver, and gizzard should be removed and discarded.
• Limit consumption of squirrel harvested in or near the floodplain downstream of
Midland. Women of childbearing age and children under the age of 15 should eat only one meal of squirrel per week.
MORE
B-2
Page 2 Only deer, turkey and squirrel harvested from the Tittabawassee River flood plain have
been tested for dioxins. Other wild game may also contain dioxins at levels that are a concern and other downstream areas may be affected. Additional studies are being considered. Until additional information is available, follow this general advice on wild game to reduce potential dioxin exposure: Trim any visible fat from the meat before cooking Do not consume organ meats, such as liver or brains Do not eat the skin
As a reminder, Fish Consumption Advisories remain in effect for sport caught fish from the
Tittabawassee River south of Midland, based on levels of dioxin and polychlorinated biphenyls. The updated 2004 Fish Consumption Advisory is now available on the front page of the Department of Community Health’s web site (see address below.)
Additional information regarding wild game advisories for the flood plain of the Tittabawassee River, including a map of the area covered by these advisories, may be found at www.michigan.gov/deq and www.michigan.gov/mdch.
###