Embed Size (px)
Citation preview
The FCO Cockpit – Global Bubble Status Report
Peter Cauwels & Didier Sornette
Chair of Entrepreneurial Risk
April 7th, 2015
The FCO Cockpit –
Global Bubble Status April 7th, 2015
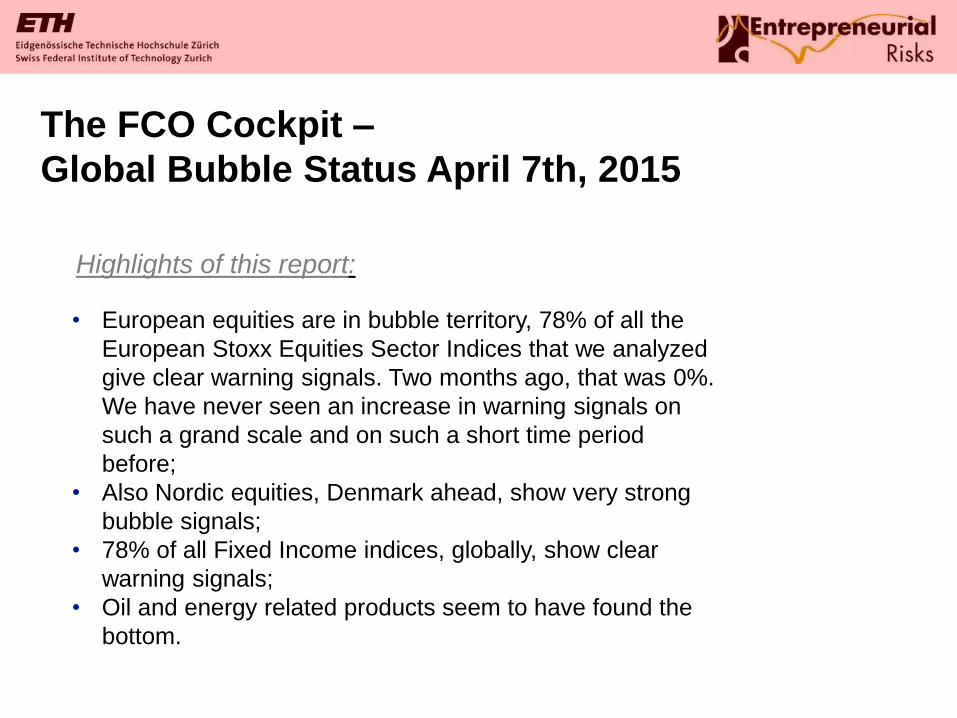
Highlights of this report:
• European equities are in bubble territory, 78% of all the
European Stoxx Equities Sector Indices that we analyzed
give clear warning signals. Two months ago, that was 0%.
We have never seen an increase in warning signals on
such a grand scale and on such a short time period
before;
• Also Nordic equities, Denmark ahead, show very strong
bubble signals;
• 78% of all Fixed Income indices, globally, show clear
warning signals;
• Oil and energy related products seem to have found the
bottom.

The FCO Cockpit –
Global Bubble Status April 7th, 2015
435 systemic assets are monitored
# Assets
# Bubbles April 1st
2015
% Bubbles April 1st
2015
% Bubbles March 1st
2015
% Bubbles February 1st
2015
% Bubbles January 1st
2015
% Bubbles December 1st
2014
% Bubbles November 1st
2014
Fixed Income Indices 116 91 78% 85% 76% 30% 14% 32%
Government 34 26 76% 88% 82% 67% 36% 67%
Corporate 82 65 79% 84% 73% 16% 5% 18%
Equities Indices 185 59 32% 25% 18% 22% 12% 6%
Country 78 25 32% 21% 21% 21% 10% 6%
US-Sector 63 9 14% 21% 27% 38% 22% 6%
EUR-Sector 32 25 78% 56% 3% 3% 3% 9%
Special 12 4 33% 0% 0% 0% 0% 25%
Commodities 38 11 29% 45% 39% 24% 34% 45%
Currencies 96 32 33% 39% 47% 33% 43% 43%
Total 435 193 44% 46% 42% 27% 21% 25%

The FCO Cockpit –
Global Bubble Status April 7th, 2015

The FCO Cockpit –
Global Bubble Status April 7th, 2015
Fixed Income

0%
10%
20%
30%
40%
50%
60%
70%
80%
90%
1-Dec-14 1-Jan-15 1-Feb-15 1-Mar-15 1-Apr-15
Fixed Income US Sectors
Fixed Income EU Sectors
Fixed Income Countries
The FCO Cockpit –
Global Bubble Status April 7th, 2015
General Observation:
Whether in US and EUR Sectors or in Country Indices, most fixed income indices (around 80%) give clear warning signals. The largest increase was seen last February. This is the consequence of central bank intervention, specifically the ECB announcement of January 22nd.
Asset Class – Fixed Income

The FCO Cockpit –
Global Bubble Status April 7th, 2015
Asset Class – Fixed Income Country Indices
Fixed Income Country Indices Yearly Return DS LPPL Trust DS LPPL Confidence
iBoxx EUR Belgium Index 15,9% 57,8% 47,9%
iBoxx EUR France Index 13,4% 54,2% 45,3%
iBoxx EUR Luxembourg Index 10,9% 50,8% 63,7%
iBoxx EUR Finland Index 10,5% 50,5% 26,1%
iBoxx EUR Austria Index 13,6% 48,5% 21,4%
iBoxx EUR Italy Index 15,1% 47,6% 74,7%
iBoxx EUR Supranationals Index 11,7% 47,2% 58,3%
iBoxx EUR Spain Index 13,7% 39,8% 68,0%
iBoxx EUR Ireland Index 12,8% 37,1% 65,0%
iBoxx EUR Netherlands Index 12,7% 35,3% 28,5%
iBoxx EUR Slovakia Index 11,5% 32,3% 62,2%
iBoxx EUR Germany Index 11,6% 31,7% 29,9%
iBoxx Asia Korea Government Index 11,0% 35,4% 18,5%
iBoxx Asia Indonesia Government Index 13,0% 31,0% 27,0%
Most European Fixed Income Country Indices give bubble warning signals.

The FCO Cockpit –
Global Bubble Status April 7th, 2015
Source: Thomson Reuters Eikon, Chair of Entrepreneurial Risk ETH Zurich
Asian Countries Fixed Income Indices
99
102
105
108
111
114
117
mrt/14 mei/14 jun/14 aug/14 okt/14 dec/14 feb/15 apr/15
iBoxx Asia Indonesia Government Index iBoxx Asia Korea Government Index
Besides Europe, we
see warnings in Asian
Countries Fixed Income
Indices.

The FCO Cockpit –
Global Bubble Status April 7th, 2015
Asset Class – Fixed Income Sector Indices
Fixed Income Sector Indices Yearly Return DS LPPL Trust DS LPPL Confidence
iBoxx EUR Financial Services Subordinated Index 12,9% 64,5% 67,4%
iBoxx EUR Insurance Index 10,1% 51,1% 46,0%
iBoxx EUR Insurance Subordinated Index 11,5% 36,7% 40,7%
iBoxx EUR Technology Index 12,7% 28,9% 9,7%
iBoxx USD Industrial Transportation Index 10,4% 14,8% 8,1%
iBoxx USD Electricity Index 11,2% 12,5% 6,6%
iBoxx USD Utilities Index 10,1% 12,5% 6,9%
The FCO Cockpit –
Global Bubble Status April 7th, 2015
Equities

The FCO Cockpit –
Global Bubble Status April 7th, 2015
Broad View:
This plot shows the performance of some major equity indices over the past two years (the time
series are rebased to 100). We see that in the past months European Equities have
outperformed US equities and have caught up with Japanese Equities. US Equities have gone
sideways over the past months.
Euro Stoxx
S&P 500
Hang Seng
Nikkei
Source: Thomson Reuters Eikon, Chair of Entrepreneurial Risk ETH Zurich

The FCO Cockpit –
Global Bubble Status April 7th, 2015
Broad View:
This plot shows the performance of some major equity indices year-to-date (the time series are
rebased to 100). Year-to-date European Equities have returned 20%. It is no surprise that
European Equities show clear bubble warning signals.
Euro Stoxx
S&P 500
Hang Seng
Nikkei
Source: Thomson Reuters Eikon, Chair of Entrepreneurial Risk ETH Zurich

The FCO Cockpit –
Global Bubble Status April 7th, 2015
• Even though Eurostoxx has increased 20% year-to-date, Chinese stocks still massively outperform the US,
Europe and Latin America;
• The graph above shows the indices rebased to 100, over a half a year of history. So, the last marks show
the half-yearly performance (64%-77% for Shenzhen/Shanghai);
• We see global equities markets at three different speeds: China ahead, in the middle, we have the US,
Europe, HK and Japan, and finally, Latin America is lagging.
Shenzhen
EURO STOXX
Shanghai
Hang SengS&P500
Source: Thomson Reuters Eikon, Chair of Entrepreneurial Risk ETH Zurich
Nikkei
Bovespa

The FCO Cockpit –
Global Bubble Status April 7th, 2015
Asset Class – Equities Country IndicesEquities Country Indices Yearly Return DS LPPL Trust DS LPPL Confidence Country
Positive Bubbles
ISEQ Overall Price Index 18% 26% 41% Ireland
Deutsche Boerse DAX Index 23% 18% 28% Germany
OMX Stockholm 30 Index 22% 17% 18% Sweden
OMX Nordic 40 Index 24% 16% 21% Nordics
BEL 20 Index 20% 15% 17% Belgium
Philippine SE Composite Index 23% 15% 9% Philippines
OMX Helsinki 25 Index 21% 14% 13% Finland
OMX Copenhagen 20 Index 36% 13% 22% Denmark
Amsterdam Exchanges Index 21% 13% 18% Netherlands
Nikkei 225 Index 29% 11% 31% Japan
EURO STOXX INDEX 15% 10% 15% Europe
SZSE 100 Index 87% 10% 7% China
TOPIX Stock Price Index 28% 9% 39% Japan
CNX Nifty Index 29% 6% 5% India
S&P BSE Sensex Index 27% 5% 6% India
Negative Bubbles
Colombia SE General Index -27% 21% 12% Colombia
Lima SE Selective Index -12% 21% 39% Peru

The FCO Cockpit –
Global Bubble Status April 7th, 2015
Asset Class – Nordic Countries Equities Indices
It is striking to see the presence of all Nordic countries (especially Denmark) in the list of Equity country indices
that show strong bubble signals.
Source: Thomson Reuters Eikon, Chair of Entrepreneurial Risk ETH Zurich
Denmark
Finland
Eurostoxx, Sweden, Norway

The FCO Cockpit –
Global Bubble Status April 7th, 2015
Asset Class – Nordic Countries Equities Indices
10 Year Historical evolution of the OMX Copenhagen 20 Index versus the Eurostoxx, rebased.
Source: Thomson Reuters Eikon, Chair of Entrepreneurial Risk ETH Zurich

The FCO Cockpit –
Global Bubble Status April 7th, 2015
Asset Class – European Equities Sector IndicesEquities EUR Sector Indices Yearly Return DS LPPL Trust DS LPPL Confidence
Positive Bubbles
STOXX Europe 600 Media 29% 25% 26%
STOXX Europe 600 Optimised Consumer Discretionary 25% 23% 28%
STOXX Europe 600 Travel & Leisure 28% 23% 34%
STOXX Europe 600 Technology 22% 23% 32%
STOXX Europe 600 Chemicals 27% 22% 26%
STOXX Europe 600 Insurance 30% 22% 33%
STOXX Europe 600 Financial Services 28% 20% 23%
STOXX Europe 600 Consumer Services 22% 19% 20%
STOXX Europe 600 Real Estate 33% 19% 11%
STOXX Europe 600 Automobiles & Parts 22% 19% 21%
STOXX Europe 600 Consumer Goods 26% 19% 19%
STOXX Europe 600 Health Care 35% 18% 32%
STOXX Europe 600 Optimised Automobiles & Parts 22% 18% 21%
STOXX Europe 600 Real Estate Cap 33% 18% 11%
STOXX Europe 600 Personal & Household Goods 27% 18% 20%
STOXX Europe 600 Telecommunications 25% 18% 19%
STOXX Europe 600 Optimised Consumer Staples 26% 16% 12%
STOXX Europe 600 Food & Beverage 26% 16% 14%

The FCO Cockpit –
Global Bubble Status April 7th, 2015
Asset Class – European Equities Sector Indices
Stoxx Europe Media
Stoxx Europe Consumer DiscrStoxx Europe Travel & LeisureStoxx Europe TechnologyStoxx Europe ChemicalsStoxx Europe InsuranceStoxx Europe Financial Services
The rise in European stocks has been across all sectors. 78% of all the Stoxx Europe Indices that we have
analysed show clear bubble warning signals.
Stoxx Europe Consumer Services
Source: Thomson Reuters Eikon, Chair of Entrepreneurial Risk ETH Zurich

The FCO Cockpit –
Global Bubble Status April 7th, 2015
Asset Class – US Equities Sector Indices
Equities US Sector Indices Yearly Return DS LPPL Trust DS LPPL Confidence
Positive Bubbles
S&P 500 Health Care Prvdrs&Serv 37% 33% 62%
S&P 500 Health Care Technology 36% 20% 36%
S&P 500 Multiline Retail 32% 18% 15%
S&P 500 Specialty Retail 36% 11% 7%
Negative Bubbles
S&P 500 Leisure Equip&Products -24% 6% 18%

The FCO Cockpit –
Global Bubble Status April 7th, 2015
After rising 20% YTD (in 3 months) warning signals for European Stoxx Sector indices have jumped from 0 to 56% in March and now to 78% in April.
78% of all European sector indices show clear warning signals. European equities are in clear bubble territory.
Equities

The FCO Cockpit –
Global Bubble Status April 7th, 2015
Asset Class – Equities Single Stocks
Next to the 185 global sector and country equities Indices, we do a bubble analysis
on single stocks taking all S&P 500 and Stoxx Europe 600 constituents with a
market cap higher than $ 50 bn, and all Hang Seng and Nikkei constituents with a
market cap higher than $ 15 bn.
In total, we analyzed 223 stocks, 57of these show bubble signals (7 negative and
50 positive bubbles).

The FCO Cockpit –
Global Bubble Status April 7th, 2015Single Stocks Yearly Return DS LPPL Trust DS LPPL Confidence Sector Country
Positive Bubbles
UnitedHealth Group Inc 45% 50% 54% Health Care US
Lockheed Martin Corp 61% 45% 13% Industrials US
Komatsu Ltd 75% 34% 35% Industrials JP
Costco Wholesale Corp 42% 31% 55% Consumer Staples US
Home Depot Inc 49% 30% 35% Consumer Discretionary US
Nomura Holdings Inc 69% 26% 58% Financials JP
HSBC Holdings PLC 50% 26% 33% Financials HK
Mitsui Fudosan Co Ltd 89% 23% 48% Financials JP
Actavis PLC 53% 23% 43% Health Care US
SAP SE 25% 20% 19% Information Technology EU
Hong Kong Exchanges and Clearing Ltd 30% 20% 26% Financials HK
Reckitt Benckiser Group PLC 27% 20% 19% Consumer Staples EU
Mitsubishi Electric Corp 50% 18% 48% Industrials JP
Mitsubishi Corp 33% 18% 48% Industrials JP
AstraZeneca PLC 45% 17% 33% Health Care EU
Electricite de France SA 45% 17% 12% Utilities EU
Unilever PLC 44% 17% 47% Consumer Staples EU
British American Tobacco PLC 29% 17% 27% Consumer Staples EU
Vodafone Group PLC 36% 16% 20% Telecommunication Services EU
Walt Disney Co 34% 15% 29% Consumer Discretionary US
Fast Retailing Co Ltd 23% 15% 31% Consumer Discretionary JP
L'Oreal SA 36% 15% 25% Consumer Staples EU
Sumitomo Mitsui Financial Group Inc 46% 14% 44% Financials JP
Apple Inc 70% 14% 30% Information Technology US
Starbucks Corp 34% 14% 25% Consumer Discretionary US
H & M Hennes & Mauritz AB 27% 12% 28% Consumer Discretionary EU
Diageo PLC 35% 12% 28% Consumer Staples EU
Telefonica SA 48% 12% 37% Telecommunication Services EU
BP PLC 32% 12% 16% Energy EU
Siemens AG 58% 11% 34% Industrials EU
Danaher Corp 21% 11% 17% Industrials US
Negative Bubbles
PetroChina Co Ltd -15% 18% 43% Energy HK
Caterpillar Inc -19% 13% 14% Industrials US
BOC Hong Kong Holdings Ltd -46% 12% 12% Financials HK

The FCO Cockpit –
Global Bubble Status April 7th, 2015
Currencies

The FCO Cockpit –
Global Bubble Status April 7th, 2015
Asset Class – CurrenciesFX Yearly Return DS LPPL Trust DS LPPL Confidence
US Dollar/Argentine Peso 10% 69% 68%
US Dollar/Danish Krone 25% 44% 49%
US Dollar/Bulgarian Lev 24% 40% 45%
US Dollar/Romanian New Leu 23% 36% 41%
US Dollar/Indonesian Rupiah 15% 30% 59%
US Dollar/Swedish Krona 30% 28% 8%
US Dollar/Czech Koruna 24% 27% 21%
US Dollar/Turkish Lira 21% 26% 25%
US Dollar/Brazilian Real 39% 23% 45%
US Dollar/Iceland Krona 18% 21% 25%
US Dollar/Polish Zloty 22% 16% 6%
US Dollar/Hungarian Forint 21% 9% 6%
US Dollar/South African Rand 11% 6% 24%
Saudi Arabian Riyal/Euro 24% 43% 46%
Qatar Rial/Euro 25% 41% 46%
Hong Kong Dollar/Euro 25% 40% 46%
US Dollar/Euro 20% 39% 45%
Chinese Renminbi/Euro 25% 30% 52%
Argentine Peso/Euro 13% 26% 31%
Indian Rupee/Euro 20% 21% 23%
Chilean Peso/Euro 13% 14% 29%
Taiwan Dollar/Euro 22% 14% 39%
UK Pound Sterling/Euro 12% 13% 17%
New Zealand Dollar/Euro 10% 13% 54%
Singapore Dollar/Euro 16% 12% 28%
Korean Won/Euro 21% 8% 13%
South African Rand/Euro 12% 6% 10%
Strengthening of US Dollar and weakening of EUR continue to give strong warning signals.

The FCO Cockpit –
Global Bubble Status April 7th, 2015
Commodities

The FCO Cockpit –
Global Bubble Status April 7th, 2015
Asset Class – Commodities
Commodities Yearly Return DS LPPL Trust DS LPPL Confidence
Negative Bubbles
Lean Hogs ER Index -41% 35% 30%
Softs ER Index -29% 24% 50%
Sugar ER Index -41% 18% 43%
Lead ER Index -11% 18% 10%
White Sugar ER Index -27% 15% 40%
Coffee ER Index -30% 12% 23%
Tin ER Index -28% 12% 35%
Aluminum ER Index -6% 11% 10%
Metals ER Index -9% 8% 16%
Nickel ER Index -22% 7% 20%
• We see negative bubble signals in soft commodities and industrial/base metals;
• The absence of energy and energy related products in the list suggests that oil is finding its bottomprice.

The FCO Cockpit –
Global Bubble Status April 7th, 2015
Asset Class – Commodities
Energy, Rouble and Russian Equities no longer show any negative bubble signals.
Energy seems to have found a bottom price. As a consequence, Russian stocks and Rouble are recovering.
Source: Thomson Reuters Eikon, Chair of Entrepreneurial Risk ETH Zurich
Russian Equities
Rouble
Brent
WTI

The FCO Cockpit –
Global Bubble Status April 7th, 2015
Conclusion

The FCO Cockpit –
Global Bubble Status April 7th, 2015
Fixed Income:
• Whether in US and EUR Sectors or in Country Indices, most fixed income
indices (around 80%) give clear warning signals. The largest increase in
warning signals was seen last February. This is the consequence of central
bank intervention, specifically the ECB announcement of January 22nd;
• Besides Europe, we see warnings in Asian Countries Fixed Income Indices
especially Korea and the Philippines.
Equities:
• After a 20% rise in 3 months, 78% of all European sector indices show clear
warning signals. European equities are in clear bubble territory;
• It is striking to see the presence of all Nordic countries (especially Denmark)
in the list of Equity country indices that show strong bubble signals.

The FCO Cockpit –
Global Bubble Status April 7th, 2015
Commodities
• We see negative bubble signals in soft commodities and industrial/base metals;
• The absence of energy and energy related products in the list suggests that oil
is finding its bottom price. As a result of this, also Rouble and Russian Equities
no longer show any negative bubble signals.
Currencies:
• US Dollar strengthening is global and bubble warning signals show up in a
wide range of currency pairs. This represents a very significant global
repricing;
• Continued strong momentum in weakening of the Euro;