Embed Size (px)
Citation preview

Periodic Compliance Assessment Report2012
as per Equator Principles
Bhushan Power and Steel Ltd.Village: Thelkoloi; Thesil: RengaliDistrict: Samabalpur; Orissa

CONTENTS
Section - 1 Introduction 5
Section - 2 Review & Categorisation 22
Section - 3 Social Environmental Impact Assessment 24
Section - 4 Social & Environmental Standard 71
Section - 5 Action Plan & Management System 79
Section - 6 Consultation & Disclosure 114
Section - 7 Grievance Mechanism 115
Section - 8 Conclusion 116


1.1 General
1.2 Location
Bhushan Power & Steel Limited. (BPSL) is more than three decades old Steel manufacturing &
Processing Company. Presently they are having 5 plants in Chandigarh, & Derabassi and one plant in
Kolkata. The Company has also successfully commissioned 2.2 MTPA Integrated Steel Project and
Captive Power Plant of 506 MW at Village Thelkoloi, of District Sambalpur in the State of Odisha, India.
BPSL is further expanding its manufacturing capacity to 3.0 MTPA Finished Steel at the same location.The step-by-step growth strategy of the Company has earned a place for itself in Indian Steel Industry,
defying the gloom witnessed in the past in general.
The existing steel plant is located 16 km from Jharsuguda town in state of Orissa and 45 km from
Sambalpur Town at Village Thelkoloi, Tehsil Rengali, Post Lapanga of District Sambalpur in the state of
Orissa. The steel plant is located between latitude 21°44' to 21°46' N and longitudes 84°01' to 84°03' E.
Nearest Railway station is Lapanga on South Eastern Railway and nearest port is Paradeep which isabout 400 km away from plant site.
Orissa Industrial Infrastructure Development Corporation (IDCO) had acquired the land measuring 1300acres and transferred to Bhushan Power & Steel Limited to set up the 3.0 MTPAintegrated steel plant.
The site was considered for setting up the integrated steel project based on the following environmentaladvantages
No major human settlement in the near vicinity of the site.
No Reserve Forest or Ecological Park nearby
No Wildlife Sanctuary or National Park in the vicinity
No presence of endangered species in the region
Not much agricultural land around the plant site
••
•
•
•
Section - 1 : Introduction
Environmental and SocialImpact Assessment Report5

Comparable
Factors
Remarks
Topography Partly flat & partly undulating
Soil condition Firm and stable. Suitable for open foundation.
Water Supply From Hirakud Reservoir at a distance of 15 Km.
Power Supply From Budipadar grid sub -station at about 14 Km.distance
Rail facility Lapanga railway station at a distance of about 2 Km.
Road facility L&T road SH -10 adjacent to site.
Nearest town Jharsuguda13 Km. Sambalpur 32Km.
Requirement ofreservoir
Yes
Nearest port Paradeep at about 400 KM
Environmental and SocialImpact Assessment Report 6
1.4 Equator Principal and International Finance Corporation (IFC) PerformanceStandard
Scope1.5
Equator Principles have been prepared by Equator Principles Financial Institutions (EPFI) as a financialindustry benchmark for determining, assessing and managing social and environmental risk in projectfinancing. The Equator Principles are formulated to ensure that the project financed by EPFIs aredeveloped in a manner which does not affect the environment and socip-economic conditions of theproject area adversely.IFC Performance statndards (PS 1 through PS -8) have been developed to manage environmental andsocial risk and impact of a project by using sustainability platforms with other strategies, policies andinitiatives to direct the project activities in order to achieve the project objectives.
The requirements of IFC / Equator Principles are in line to the requirements of Factories Act, 1948,Environment Protection Rules, 1989 and various notifications issued by MOEF regarding environmentprotection in India.
The report is based on Equator Principles / IFC guidelines and Indian Environmental Legislations andnotifications.
The Scope of the report is to assess the impact on environment, socio-economic condition & humanhabitation around the operational steel plant of BPSL as well as the expansion of the plant for producing3.0 MTPA finished steel requirements of Environment Protection Act, 1986. The report considers theEnvironment Protection Rule 1989 & latest notification (March 2012 )of MOEF in relation to EnvironmentProtection. IFC guidelines and Equator principles.
1.3 The Salient Features of Site
Section - 1 : Introduction

Environmental and SocialImpact Assessment Report7
1.6 EMD Organization Chart
Section - 1 : Introduction
Shri. R.N.YADAV(DIRECTOR– TECHNICAL)
DINESHYADAV(VICE-PRESIDENT)
HOD
RANJIT KUMARGHOSH(General Manager – EMD)
BHIMSINGHGORKHA(Manager – ED)
N.K.PATTNAIK / N.PARIDA(Asst. Manager – Environment)
SOLIDWASTEMANAGEMENTINCHARGE
BIJAYA KETANDAS(Sr. Engineer)
Raghawendra singhNarendra Bhainsa
Subrat SindriaRajendraMeher
DillipRabnaBikramdutiaChand
Dumping Yard
Derba Incharge Laripali
Biswajit Choudhary(Supervisor)
JagdishSethSanjeev SahooUdhabMaharana
Sukashmaya SahuSupervisor)
Antarjami SandhuSalegramSahuProdyumna
Dust SuppressionSystem
Manoj Rana(Sr. Supervisor)
Assistants – 02 Nos.
Tanker Drivers –10 Nos.
Tanker Helpers – 10 Nos.
HORTICULTUREWORK&INPLANT
MONITORING
Sunil Sahani(Sr. Supervisor)
Sudev Kumar Sahu
AbhishekPradhan
Mahadev Rout
Environmental and SocialImpact Assessment Report 8
Section - 1 : Introduction
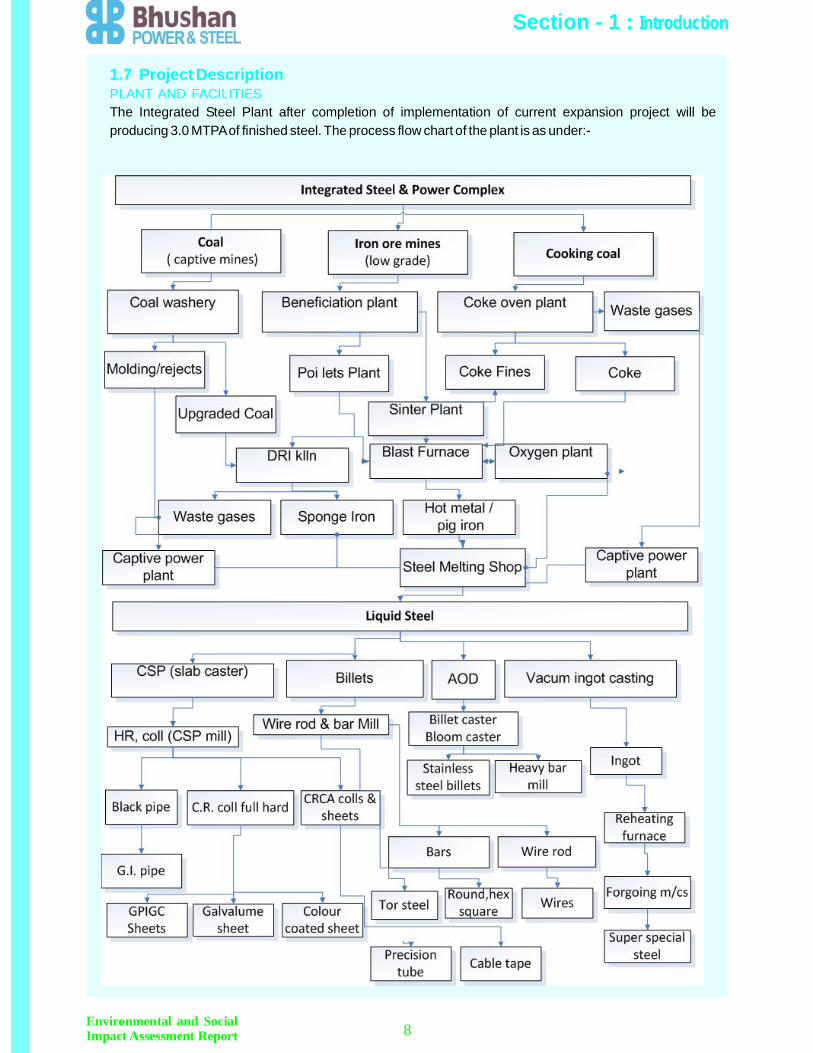
1.7 Project DescriptionPLANT AND FACILITIESThe Integrated Steel Plant after completion of implementation of current expansion project will beproducing 3.0 MTPAof finished steel. The process flow chart of the plant is as under:-

1.8 Selection of Technology
A progressive and visionary project proponent always aims at sustainability of plant operation without anyhindrance which may occur due to changing environmental norms in foreseeable future. In view of this,BPSL always selects technology which is of world standard and will be able to meet internationalguidelines.BPSL has selected the following technologies in the present integrated Steel Plant which is of latesttechnological standards towards meeting environmental parameters. The examples are as follows: -
The technologies for the plant units which are currently under advanced stage of execution are also fromthe world leaders in the field as mentioned below
For the current expansion programme for achieving 3.0 MTPA finished steel capacity the majortechnologies already selected for coke oven, sinter plant and blast furnace are also from world leaderswith all the latest technological features towards energy conservation and eco friendly as mentionedbelow
The salient features of technologies and the advantages of the new proposed units finalized andcontracted by BPSLso far are as discussed hereunder
Beneficiation Plant Metso, Sweden, ECM, BrazilPellet Plant Outotec, Germany
Environmental and SocialImpact Assessment Report9
Section - 1 : Introduction
UNITS TECHNOLOGY SUPPLIERS
DRI (Sponge Iron Plant) Lurgi, Germany
Coal Washery Humboldt Wedag, Germany
Turbo Generators (Power Plant) Siemens, Germany / BHEL, India
Arc Furnace Techint, Italy
Thin Slab Caster (CSP) & Hot Strip Mill SMS, Siemag, Germany
Sinter Plant, Blast Furnace & Coke
Oven
SSIT, Beijing, China
Wire Rod Mill Daniely, Italy
Cold Rolling Mill Daniely, Italy
(in operation)
UNITS TECHNOLOGY SUPPLIERS(in construction)
Sinter Plant based on EmissionOptimized Sintering (EOS)
Out otec, Germany
Blast Furnace with TRT Paul Wurth, LuxembourgCoke Oven & By Product with CDQand Wet Quenching
Paul Wurth, Italy and DMT,Germany for By Product
SMS & Heavy Bar Mill Daniely, Italy
UNITS TECHNOLOGY SUPPLIERS(in expansion)
Sinter Plant
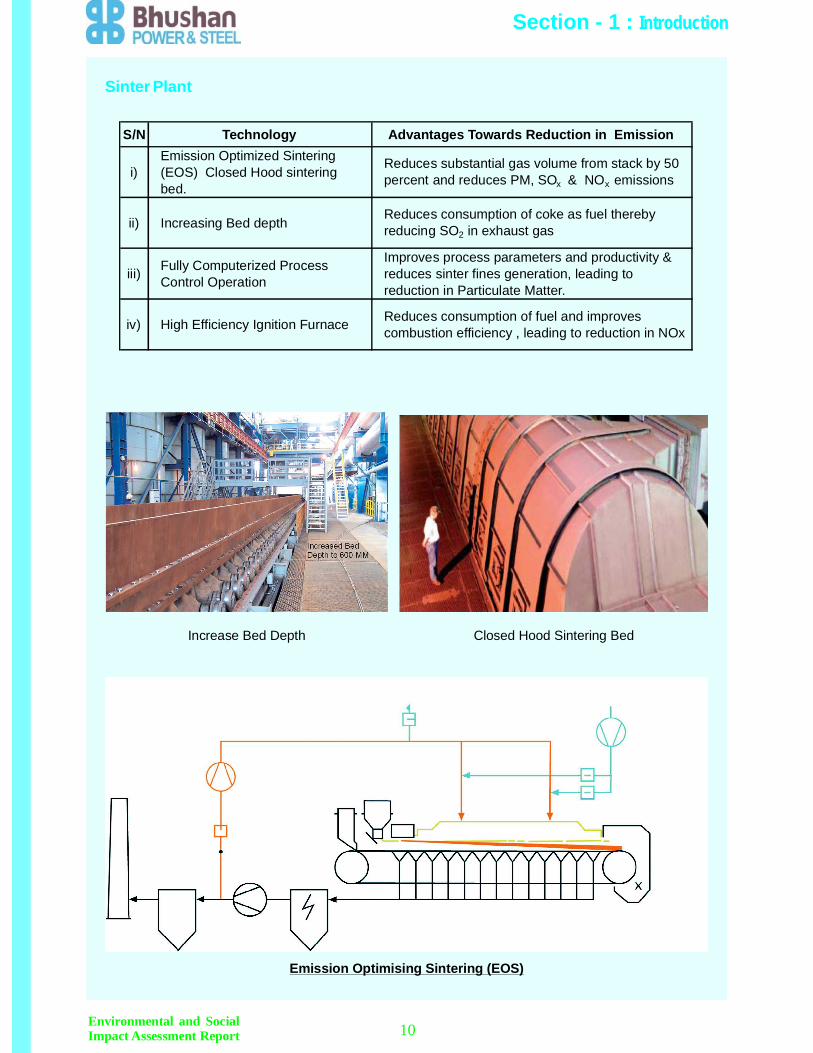
Increase Bed Depth Closed Hood Sintering Bed
Emission Optimising Sintering (EOS)
Environmental and SocialImpact Assessment Report 10
Section - 1 : Introduction
S/N Technology Advantages Towards Reduction in Emission
i)Emission Optimized Sintering(EOS) Closed Hood sinteringbed.
Reduces substantial gas volume from stack by 50percent and reduces PM, SOx & NOx emissions
ii) Increasing Bed depthReduces consumption of coke as fuel therebyreducing SO2 in exhaust gas
iii) Fully Computerized ProcessControl Operation
Improves process parameters and productivity &reduces sinter fines generation, leading toreduction in Particulate Matter.
iv) High Efficiency Ignition Furnace Reduces consumption of fuel and improvescombustion efficiency , leading to reduction in NOx
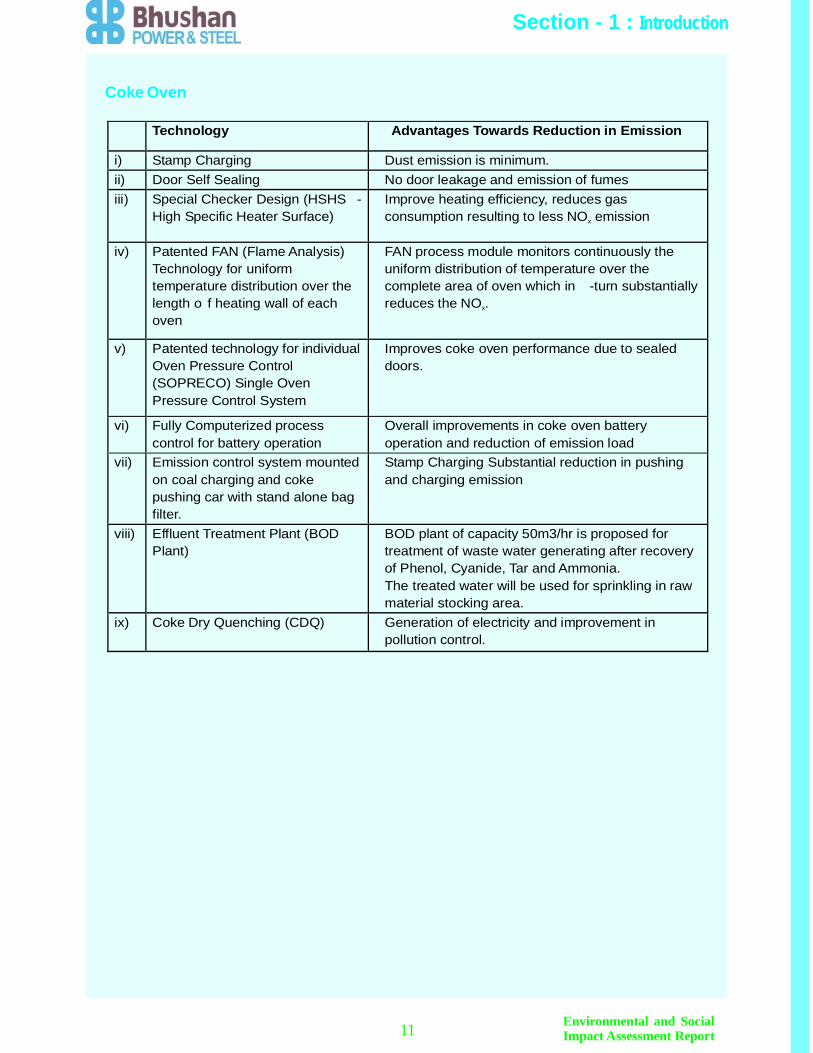
Coke Oven
Environmental and SocialImpact Assessment Report11
Technology Advantages Towards Reduction in Emission
i) Stamp Charging Dust emission is minimum.ii) Door Self Sealing No door leakage and emission of fumesiii) Special Checker Design (HSHS -
High Specific Heater Surface)Improve heating efficiency, reduces gasconsumption resulting to less NO emissionx
iv) Patented FAN (Flame Analysis)Technology for uniformtemperature distribution over thelength o f heating wall of eachoven
FAN process module monitors continuously theuniform distribution of temperature over thecomplete area of oven which in -turn substantiallyreduces the NO .x
v) Patented technology for individualOven Pressure Control(SOPRECO) Single OvenPressure Control System
Improves coke oven performance due to sealeddoors.
vi) Fully Computerized processcontrol for battery operation
Overall improvements in coke oven batteryoperation and reduction of emission load
vii) Emission control system mountedon coal charging and cokepushing car with stand alone bagfilter.
Stamp Charging Substantial reduction in pushingand charging emission
viii) Effluent Treatment Plant (BODPlant)
BOD plant of capacity 50m3/hr is proposed fortreatment of waste water generating after recoveryof Phenol, Cyanide, Tar and Ammonia.The treated water will be used for sprinkling in rawmaterial stocking area.
ix) Coke Dry Quenching (CDQ) Generation of electricity and improvement inpollution control.
Section - 1 : Introduction

Environmental and SocialImpact Assessment Report 12
Section - 1 : Introduction

Blast Furnace
Environmental and SocialImpact Assessment Report 13
Section - 1 : Introduction
S/N Technology
i) Patented Hot Stove Waste GasHeat Recovery System
ii) Patented Hot Stove NewCeramic Burner Design
iii)Patented SACHEM BlastFurnace Intelligent SupervisionSystem
iv) Patented INBA Slag GranulationSystem
v) Patented PW Designed Bell LessTop Charging System
vi) PLC Control Dedusting System
vii) Top Pressure Recovery Turbine(TRT)
INLET OUTLET
Gas Flow : 308000 Nm3/hr Gas Flow : 308000 Nm3/hr
Temperature : 167 oC Temperature : 65 oC
Pressure : 1.8 bar Pressure : 1.7 bar
Dust Content : 10 mg/Nm3 Dust Content : < 5 mg/Nm3
ix) Consumption of PCI Coal
x) Hot Blast Temperature
Minimizes the gas flow through selection of automatic control ofvalves from all suction points.
Generation of electrical energy, Enhancing BF gas top pressurecontrol to 1.7 bar, Noise reduction,
viii) Details of Gas Cleaning Plant
Advantages Towards Reduction in Emission
Improvement in combustion efficiency of stoves resulting in savingof BF gas consumption, reduction in intake of combustion air whichin-turn reduces the NOx emission. Also reduces the flue gastemperature to less than 120 oC
By induction of patented distributor in fuel injection line, it increasesthe combustion efficiency and substantially reduces the NOx.
It increases the process consistency , plant availability and reducesair pollution due to automatic supervision and operational control ofcomplete blast furnace.
Recycling of solid waste, air pollution control through closed loopgranulation and reduced emissions.
Ensures maximum reliability of operation with high top pressure andleast charging emissions
xi) Safety Precautions for CO Gas
CO monitoring sensors to be installed at GCP area, Stove area,Cast House area and BLT area.
Breathing Apparatus with Medicated Oxygen Cylinders will beplaced in Cast House, GCP and Stove Area.
Consumption of 180 Kg/Ton of Hot Metal reduces the consumptionof coke substantially.
1250 oC (First time introduced in India)
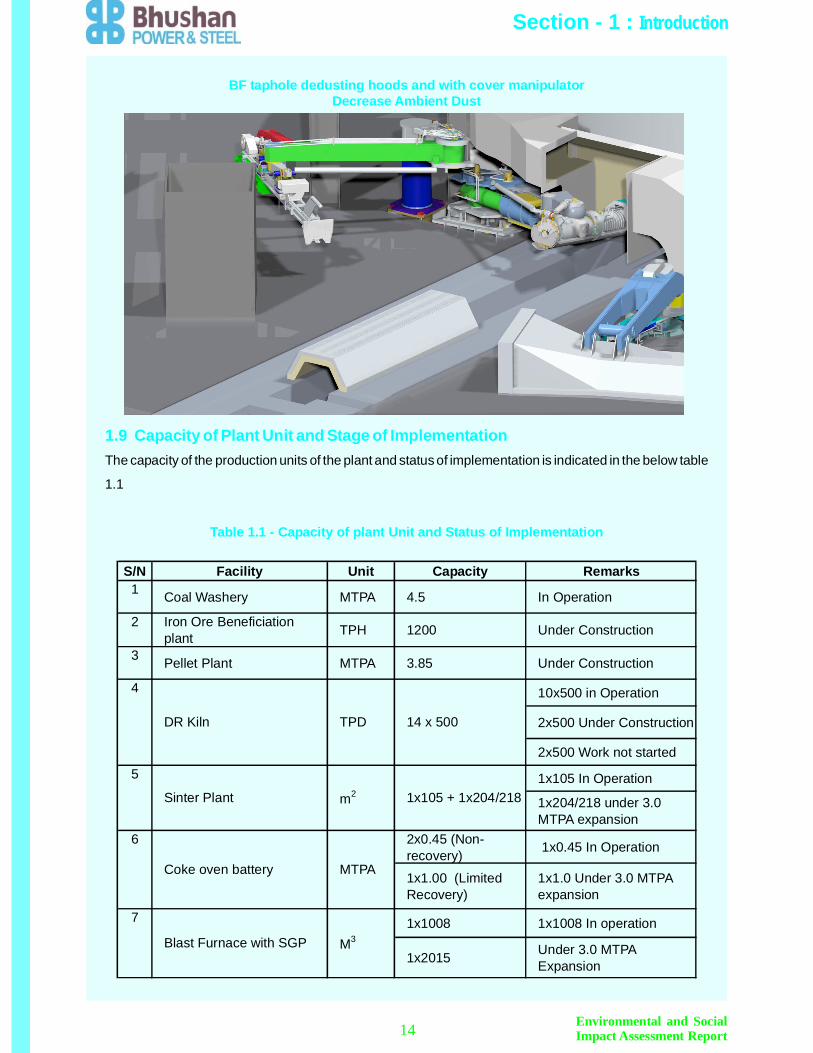
BF taphole dedusting hoods and with cover manipulatorDecrease Ambient Dust
Table 1.1 - Capacity of plant Unit and Status of Implementation
1.9 Capacity of Plant Unit and Stage of ImplementationThe capacity of the production units of the plant and status of implementation is indicated in the below table
1.1
Environmental and SocialImpact Assessment Report14
Section - 1 : Introduction
S/N Facility Unit Capacity Remarks1 Coal Washery MTPA 4.5 In Operation
2 Iron Ore Beneficiationplant TPH 1200 Under Construction
3 Pellet Plant MTPA 3.85 Under Construction
10x500 in Operation
2x500 Under Construction
2x500 Work not started
1x10⁵ In Operation
1x204/218 under 3.0MTPA expansion
2x0.45 (Non-recovery) 1x0.45 In Operation
1x1.00 (LimitedRecovery)
1x1.0 Under 3.0 MTPAexpansion
1x1008 1x1008 In operation
1x2015 Under 3.0 MTPAExpansion
6
Coke oven battery MTPA
7
Blast Furnace with SGP M3
1x10⁵ + 1x204/218
4
DR Kiln TPD
5
Sinter Plant m2
14 x 500

Environmental and SocialImpact Assessment Report15
Section - 1 : Introduction
4x90/100 In Operation
2x90/100 under 3.0MTPA expansion
IF Tons 4x15 3x15 In Operation
4x90/100 + 1x15 InOperation
2x90/100 under 3.0MTPA expansion
Alloy smelter MVA 4x16
Billet caster Strand 1x2 + 2x4 + 1x3 1x2 + 2x4 in Operation1x3 under 3.0 MTPA Exp.
Thin slab caster Strand 2x1 2x1 In Operation
VD/AOD Tons 3x100 2x100 under 3.0 MTPAexpansion
Bloom Caster Strand 1x2 1x2 under 3.0 MTPAexpansion
9CSP Plant (HRM) MTPA 1.8 In Operation
10Wire Drawing Unit MTPA 0.45 In Operation
11Heavy Bar/Bright Bar Mill MTPA 0.55 under 3.0 MTPA
expansion12
Pipe and Tube mill MTPA 0.2 In Operation
13Cold Rolling Mill (CRM) MTPA 1 In Operation
14 Galvanising/Galvolumeunit MTPA 0.5 In Operation
15Colour Coating Unit MTPA 0.45 In Operation
1x400 in operation
1x 660 undercommissioning
2x300 in Operation
1x300+1x600 under 3.0MTPA expansion
1x300 In Operation
1x100 under 3.0 MTPAexpansion
18
Dolo plant TPD 1x300 + 1x100
16
Oxygen Plant TPD 1x400 + 1x600/660
17
Lime plant TPD 3x300 + 1x600
8
EAF Tons 6x90/100
LF Tons 6x90/100 + 1x15
Steel making andcasting unit
S/N Facility Unit Capacity Remarks
Work not started

1.9 Requirement and Source of Raw Materials
Table 1.2 : Annual requirement of major raw materials at 3.0 MTPA
At present the basic raw material like iron ore, coking and non-cocking coal required for steel production
are purchased by the company and these raw material come by rail and partially by road. The annual
requirement of major raw materials and its sources and mode of transport at 3.0 MTPA indicated in the
below table:
Environmental and SocialImpact Assessment Report 16
Section - 1 : Introduction
376 MW In Operation
130 MW UnderCommissioning
20 Slag Cement Plant MTPA 1 Work not started
19
Captive Power Plant MW 560
Sl.
No.
Raw Material GrossQty (tpa)
Sources Mode ofTransport
1 Iron ore fines
(Beneficiation plant)
6,500,000 Bansapni Rail
2 Iron ore fine
(Sinter Plant)
1,459,000 Bansapni Rail
3 Coking coal 19,36,000 Imported
4 PCI Coal 350,000 Imported Rail
5 Non-coking coal 7,554680 IB Valley Rail
6 Limestone (BF Grade 3,81,000 Bansapni Rail/Road
7 Limestone (SMS
Grade)
636,000 Imported Rail
8 Dolomite (BF Grade) 2,98,000 Baradwar Rail/Road
9 Dolomite (SMS
Grade)
1,16,000 Baradwar Rail/Road
11 Dolomite (DR Grade) 63,000 Baradwar Rail/Road
12 Quartzite 110,500 Local Road
Rail
Rail
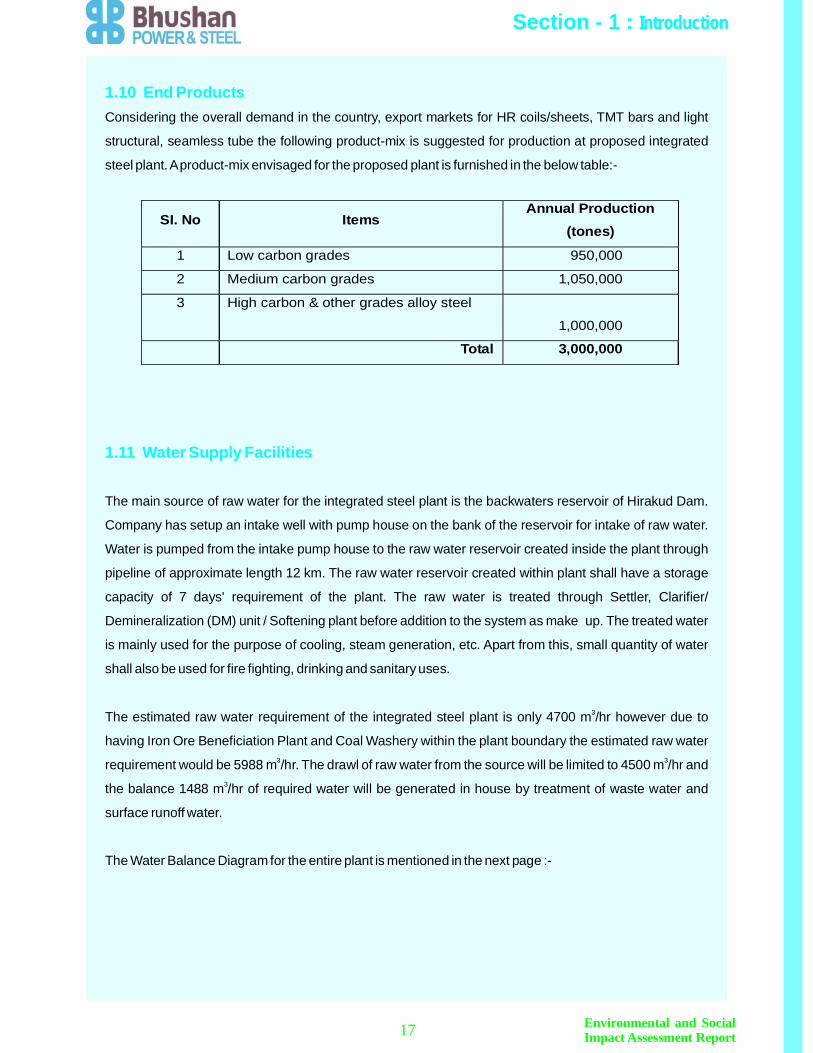
1.10 End Products
1.11 Water Supply Facilities
Considering the overall demand in the country, export markets for HR coils/sheets, TMT bars and light
structural, seamless tube the following product-mix is suggested for production at proposed integrated
steel plant.Aproduct-mix envisaged for the proposed plant is furnished in the below table:-
The main source of raw water for the integrated steel plant is the backwaters reservoir of Hirakud Dam.
Company has setup an intake well with pump house on the bank of the reservoir for intake of raw water.
Water is pumped from the intake pump house to the raw water reservoir created inside the plant through
pipeline of approximate length 12 km. The raw water reservoir created within plant shall have a storage
capacity of 7 days' requirement of the plant. The raw water is treated through Settler, Clarifier/
Demineralization (DM) unit / Softening plant before addition to the system as make up. The treated water
is mainly used for the purpose of cooling, steam generation, etc. Apart from this, small quantity of water
shall also be used for fire fighting, drinking and sanitary uses.
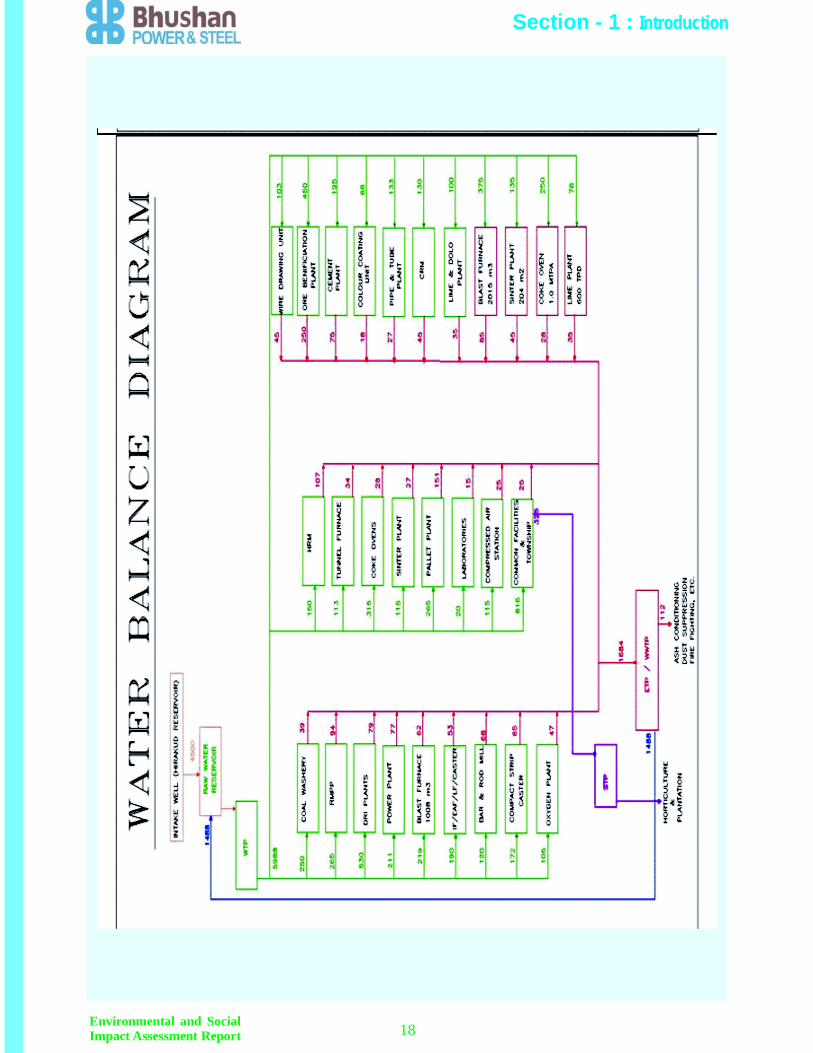
The estimated raw water requirement of the integrated steel plant is only 4700 m /hr however due to
having Iron Ore Beneficiation Plant and Coal Washery within the plant boundary the estimated raw water
requirement would be 5988 m /hr. The drawl of raw water from the source will be limited to 4500 m /hr and
the balance 1488 m /hr of required water will be generated in house by treatment of waste water and
surface runoff water.
The Water Balance Diagram for the entire plant is mentioned in the next page :-
3
3 3
3
SI. No ItemsAnnual Production
(tones)
1 Low carbon grades 950,000
2 Medium carbon grades 1,050,000
3 High carbon & other grades alloy steel
1,000,000
Total 3,000,000
Environmental and SocialImpact Assessment Report17
Section - 1 : Introduction
Environmental and SocialImpact Assessment Report 18
Section - 1 : Introduction
1.12 Fuel Facilities
Gaseous Fuels
BPSL is presently meeting most of the gases fuel requirement by purchase of LPG & Propane gas as the in
plant gas generation is only from Blast Furnace no. 1. The existing plant units which are using LPG/
Propane gas through purchase are as follows : -
The extent of purchase fuel (LPG/ Propane) is presently about Rs. 350 crores annually.
After expansion of the plant to about 3.0 MTPA when new blast furnace of 2015m and 1.0 Mt Coke Oven
and By-Product Plant will be commissioned, about 330,000 Nm /h of BF gas and about 52,000 Nm /h of
coke oven gas will be generated for its use within the plant.
This will reduce the purchase of gasses fuel requirement. However, new units like sinter plant, heavy bar
mill, pellet plant, new lime kilns will also be commissioned and will require gasses fuel for operation. It is
possible to virtually stop the purchase of fuel for the plant through optimum use except for few units e.g.
billet/ bloom casters, flux line etc where flame temperature requirement are high. The gas balance of the
plant is given in table 1.3.
••••••••••
Sinter Plant
Blast Furnace
EAF Shop
CSP
Wire Rod Mill
CRM
Galvanising Plant
Colour Coating Line
Acid Generation Plant
Lime Kilns
3
3 3
Environmental and SocialImpact Assessment Report19
Section - 1 : Introduction
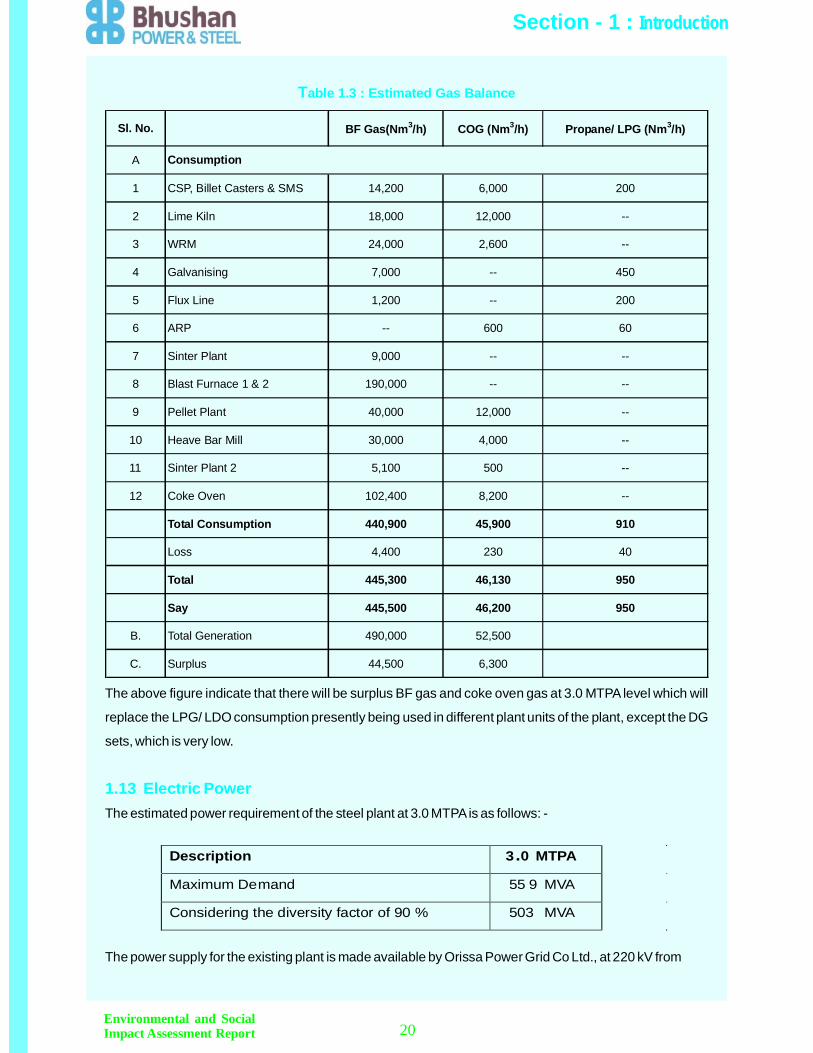
Table 1.3 : Estimated Gas Balance
1.13 Electric Power
The above figure indicate that there will be surplus BF gas and coke oven gas at 3.0 MTPA level which will
replace the LPG/ LDO consumption presently being used in different plant units of the plant, except the DG
sets, which is very low.
The estimated power requirement of the steel plant at 3.0 MTPAis as follows: -
The power supply for the existing plant is made available by Orissa Power Grid Co Ltd., at 220 kV from
Environmental and SocialImpact Assessment Report 20
Description 3 .0 MTPA
Maximum Demand 55 9 MVA
Considering the diversity factor of 90 % 503 MVA
Section - 1 : Introduction
A
1 CSP, Billet Casters & SMS 14,200 6,000 200
2 Lime Kiln 18,000 12,000 --
3 WRM 24,000 2,600 --
4 Galvanising 7,000 -- 450
5 Flux Line 1,200 -- 200
6 ARP -- 600 60
7 Sinter Plant 9,000 -- --
8 Blast Furnace 1 & 2 190,000 -- --
9 Pellet Plant 40,000 12,000 --
10 Heave Bar Mill 30,000 4,000 --
11 Sinter Plant 2 5,100 500 --
12 Coke Oven 102,400 8,200 --
Total Consumption 440,900 45,900 910
Loss 4,400 230 40
Total 445,300 46,130 950
Say 445,500 46,200 950
B. Total Generation 490,000 52,500
C. Surplus 44,500 6,300
Consumption
Sl. No. BF Gas(Nm3/h) COG (Nm3/h) Propane/ LPG (Nm3/h)
Budhipada Grid sub-station located at (aerial) distance of approximately 14 km from the plant site. The
route length for the incoming 220 kV line is approximately 18 kms.
The existing 40 and 60 MW captive power plant is generating power at 11kV. The power from CPP has
been synchronized with the Grid power supply at 33 kV through 50 and 75 MVA, 11/33 kV step up
generator transformers.
The 2x8 MW power plant and 3x130 MW power Plant are also connected in the similar manner as existing
100 MW Power plant.
A small township along with all necessary social amenities has been constructed to provide residential
accommodation of about 250 officials of plant. Sewage from the township is treated in a sewage treatment
plant and the treated water is used for greenbelt development. Two numbers of sewage treatment plants
has already been setup of capacity 350 and 600 m /hr.3
There will be an increase in traffic volume in the project area. Materials such as sand and piles will be
transported to the project site by road. The major portion of the raw material such as coal, iron ore, etc. will
be transported through rail.Arailway siding for the purpose has been setup in the plant.
Finished products are also transported to various parts of the country through rail network, however some
minor portion will be transported through road.
Wide road network within the integrated steel complex to access the area for the construction and
operation is already established.
Storm water is drained by a system of underground concrete drains around the periphery of the plant unit.
These drains ensure adequate storm water drainage and prevent flooding of properties. Runoff overland
can also be re-routed to the new collection systems.
Currently, BPSL is implementing expansion project to raise the capacity from 2.2 MTPA to about 3.0
MTPA.The units proposed under expansion will be commissioned progressively by 2016.
Prior to construction all workers will undergo a health and safety orientation programme. FirstAids Kits will
be present on-site and a senior member of the construction staff will be designated as the Health, Safety
and Environment Officer with responsibility to ensure that all health and safety measures are
1.14 Township
1.18 Occupational Health & Safety
1.15 Traffic Management
1.16 Drainage Layout
1.17 Construction Schedule
Environmental and SocialImpact Assessment Report21
Section - 1 : Introduction
implemented. All construction workers will be equipped with the necessary safety gears such as safety
goggles, helmets, hearing protection, gloves, respirators, overalls and other personal protective gear.Sanitary facilities will be provided on site as well as a continuous flow of potable water is ensured. Periodic
health checkup is being held for all employees as well as contractual workers every year.
During construction certain amount of waste will be generated. This will include construction waste i.e.
unused pieces of lumber, formwork, steel end pieces, cement bags, plastics, concrete waste from the site
clearing activities and domestic waste generated by construction workers. This waste is being sorted
accordingly and disposed by a contracted waste disposal service. 85% of total waste being generated/ tobe generated at 3.0 MTPA will be reused and only 15% is required to be disposed off at designated
disposal area as per the guidelines of state pollution control board.
Hazardous waste such as ETP sludge is being sent to common disposal facility developed by Orissa
waste management project in association M/s. Ramky Enviro Engineers for proper stabilization and
disposal. Used Oil and lubricants are sold toAuthorized vendors for reprocessing.
The project will provide job opportunities to about 15000 people in the form of direct and indirect
employment.
1.19 Waste Management (solid waste and sewage)
1.20 Employment
1.21 STRUCTURE OF ESIA REPORTSection - 1 Introduction
Section - 2 Review & Categorisation
Section - 3 Social Environmental Impact Assessment
Section - 4 Social & Environmental Standard
Section - 5 Action Plan & Management System
Section - 6 Consultation & Disclosure
Section - 7 Grievance Mechanism
Section - 8 Conclusion
Environmental and SocialImpact Assessment Report 22
Section - 1 : Introduction

Section 2 : Review & Categorisation
Environmental and SocialImpact Assessment Report23
As part of their review of a project's expected social and environmental impacts, EPFIs use a system ofsocial and environmental categorization, based on the IFC's environmental and social screening criteria,to reflect the magnitude of impacts understood as a result of assessment.
The categorization criteria of IFC for different category projects are summarized below :-
A proposed project is classified as Category A if it is likely to have significant adverse environmentalimpacts that are sensitive, diverse or unprecedented. These projects may affect an area broader than thesites or facilities subject to physical works. A full environmental assessment is required which is normallyan Environmental ImpactAssessment (EIA). Although decision on categorization are made on a case-by-case basis, examples of CategoryAprojects are :
i Large dams and reservoirs Forestry (large scale)ii Agro-industries (large scale)iii Industrial Plants (large scale)iv Major new industrial estatesv Major oil and gas developments, including major pipelinesvi Large ferrous and non-ferrous metal operationsvii Large port and harbor developmentsviii Projects with large resettlement components and all projects with potentially major impacts on
human populationsProjects affecting indigenous or tribal populations
x Large thermal and hydropower developmentxi Projects that include the manufacture, use or disposal of environmentally significant quantities of
pest control productsxii Manufacture, transportation and use of hazardous and/ or toxic materialsxiii Domestic and hazardous waste disposal operationsxiv Project which pose serious occupational or health risksxv Projects which pose serious socioeconomic concerns
From the above category, it can be seen that non of the criteria is applicable (except criteria vi) for thepresent project of BPSL. The present project which is an expansion of the current operating Iron & SteelPlant may require categorization in the bracket of Category A but its essential requirement that the projectis “likely to have significant adverse environmental impacts that are sensitive, diverse or unprecedented”is not applicable. The sensitive project has been defined by IFC as ”if impact may be irreversible (e.g. leadto loss of a major natural habitat), affect vulnerable groups of ethnic minorities, involve involuntary
A proposed project is classified as Category B if its potential adverse environmental impacts on humanpopulations or environmentally important areas including wetlands, forests, grasslands and other naturalhabitats are less adverse than those of Category A projects. These impacts are site-specific; few if any ofthem are irreversible; and in most cases mitigatory measures can be designed more readily than forCategoryAprojects.
A proposed project is classified as Category C if it is likely to have minimal or no adverse environmentalimpacts. Beyond screening, no further EAaction is required for a Category C project.
ix
Project Categorisations
CategoryAProjects
Category B Projects
Category C Projects

IFC has also indicated attributes of Environmental and Social Risks. These are furnished below:-
1. project sector and activities (which cause e. g. consumption of resources, use of hazardousmaterials, effluents, emissions, wastes, etc.)
2. specific location (site and potential impacts of operations on sensitive areas incl. impacts onbiodiversity etc.)
3. purpose of financing (e.g. site expansion, modernization, etc.)4. size of the project (large, medium or small scale)5. Environmental impact of the supply chain (immediate and important suppliers).
1. number of employees (present, newly created jobs, dismissals);2. percentage of risk groups as a proportion of total workforce (e.g. temporary workers, migrants,
minors, women, disabled persons);3. sub-contractors and social supply-chain management (e.g. number of workers hired through
subcontractors, outsourcing of core business activities to sub-contractors);4. affected communities (e.g. physical or economic displacement, impacts on social and economic
infrastructure, community health and safety, vulnerable groups);5. sector (e.g. low wage industries, agriculture, mining, infrastructure projects);6. occupational health & safety risks related to the sector
All the relevant attributes have been covered in the report.
Environmental Risk Categorisation Criteria
Social Risk Categorisation Criteria
Environmental and SocialImpact Assessment Report 24
Section 2 : Review & Categorisation

3.1 ObjectiveThe aims and objective of Environmental Impact Assessment (EIA) globally is to examine the social and
environmental consequences of the project prior to their execution and the actual outcome of the plant
after installation and coming into operation. The basic purpose of EIA processes is to provide information
to decision makers, regulatory and statutory authorities, and to public at large for scrutiny. EIA is a
proactive environment assessment tool for recognizing the environmental impact and any possible impact
on the socio economic conditions as well as public health in an around the plant area.
The agency/ institutions conducting the EIA study submits its recommendations for mitigation measures
that should be adopted promptly by the management of the plant before impairing the environment and
public health.
The production activities of many facilities, especially industrial facility and particularly Metal Production
facilities usually generate various categories of wastes and also contribute to the impacts on the natural
environment. Energy consumptions also generate Solids, gaseous and liquid wastes and pollutants.
The degree of Health, safety and Environmental impact varies between the different phases of impact
generation levels in the proposed projects and must be investigated.
MECON LIMITED, A Government of India enterprise under Ministry of Steel is the leading Engineering
and Consultancy organization in India and carried out many National and International assignments in the
Iron and Steel sectors. MECON LTD was engaged by BPSL for Engineering and consultancy services
since inception of the Orissa plant and also for the current expansion of the project. MECON LTD is also
one of the leading Institutions in the environmental consultancy services including EIA and EMP study.
MECON LTD. has been accredited by NABET/QCI for preparing EIA/EMP for 15 major sectors including
Metallurgical (ferrous and non ferrous), Oil & Gas, Mining, Ports & Harbors, Biotech Parks, Municipal Solid
waste Management, etc. MECON has its own testing laboratories which is approved and recognized by
Ministry of Environment and Forest (MOE&F), Government of India. Bhushan Power & Steel Ltd has
engaged MECON Ltd to undertake environmental and social study (ESIA).
The ESIAprocess in India is to ensure that projects are designed and implemented with due consideration
for the environment including bio-phyisical and socio-economic issues. In general the Indian
Environmental Protection Act 1986 and its further amendments makes provision for the conduct of EIA's
for prescribed development projects to ensure the developments comply with existing environmental
regulations and best practice standards. The present ESIA report has been prepared in compliance to
Indian Environment Protection Act/Law/Guidelines as well as International guidelines of International
Finance Corporation (IFC), Equator Principles Financial Institutions (EPFI), etc.
The objectives of this ESIA are to predict possible changes that may results on the eco system and the
inhabitants within the vicinity of the facility as direct consequences from the installations and operational
Section - 3 : Social & Environmental Impact Assessment
Environmental and SocialImpact Assessment Report 25

activities of the BPSLoperational plant & proposed expansion
To generate an environmental Baseline data, by conducting a multi-disciplinary baseline survey where
data for ecosystems and other environmental components of the projects site and locality are gathered
and this will form the basis for future references, especially data on environmentally sensitive parameters
that will enable proper environmental protection in the event of any unforeseen accident(s) and / or
disaster.
To determine the level of preparedness for various envisaged activities that will affect man, community,
other inhabitants and the company's immediate and global environment, with special emphasis on work
environment and personal protection.
The summary of the ESIAstudy aims at:
1. Meeting the requirements of the environmental regulatory bodies in host country India and conforming
IFC guidelines as well as conform with international best-practice for a project of this nature;
2. Identify and assess potential environmental and social impacts associated with the proposed project;
3. Develop a Comprehensive Management Plan outlining actions and responsibilities for managing the
predicted impacts of the expanded project;
4. Recommend mitigation measures that would reduce the significance of predicted negative impacts
and enhance predicted benefits on all aspects of the surrounding environment;
5. Inform corporate decisions about the project's planning and development
6. Promote development that is environmentally and socially sustainable.
MECON Limited has been engaged by M/S Bhushan Power & Steel Limited to conduct the ESIA study on
yearly basis. MECON is a full consultancy service provider in iron & steel sector in India which includes
environmental consultancy and has been involved with a number of such studies for major iron & steel
projects in India and other countries.
For this project, MECON Limited has mobilized a multidisciplinary professional team with the expertise
and experience in conducting ESIA's for iron & steel developments in India.
•
•
3.2 ESIATeam
Environmental and SocialImpact Assessment Report26
Section - 3 : Social & Environmental Impact Assessment

The consulting team consists of:
Mr. VVSN Pinaka Pani (Ph. D.) - Mathematical Modeling Specialist
Mr. S.C. Jain (Ph.D.) - Project Coordinator
Mr. S.K. Singh (Ph. D.) - Ecology Specialist
Mr. S.Adak (M.Tech) - Biodiversity Specialist
Mr. B. Singh (Ph. D.) - Environmental Monitoring Specialist
Also the environmental management team of M/s. Bhushan Power & Steel Limited comprising of the
following members was involved during the field monitoring
Mr. J.S.Sahay - Executive Director (Technical)
Mr. R.K.Ghosh - General Manager (EMD)
Mr. B.S.Gorkha - Manager (EMD),
Mr. N.Parida - Asst. Manager (EMD)
An ESIA study is being conducted by MECON Ltd every year since inception of the Orissa Plant within the
existing policy and administrative framework considering the applicable environmental legislation,
regulations and guidelines of MOEF, CPCB, Equator Principles, IFC’s Performance Standards, EHS
guideline and Integrated Steel Industries specific guidelines.
During month of April to June 2012 field monitoring and investigations were conducted by the respective
specialist on the team to asses the existing environmental conditions.
3.3
3.4
StudyApproachAnd Methodology
The Environmental Study And Impact Assessment (ESIA)
The Environmental Protection Act, 1986, establishes the requirement for Environmental Impact
Assessment (EIA). For projects that may significantly affect the environment and require environmental
clearance from MOE&F as per September'14, 2006 notification. The iron & Steel project falls into category
and hence, an ESIA for an environmental clearance is required before any developmental work could
commence.
The International Finance Corporation (IFC) guidelines for Environment Assessment (EA) indicate
Environmental and SocialImpact Assessment Report 27
Section - 3 : Social & Environmental Impact Assessment
the following aspects to be considered.
··
················
Assessment of the baseline environmental and social conditionsRequirements under host country laws and regulations, applicable international treaties andagreementsSustainable use of natural resourcesProtection of human health, cultural properties, endangered species and sensitive ecosystemsUse of dangerous substancesMajor hazardsOccupational health and safetyFire prevention and life safetySocioeconomic impactsLand acquisition and land useInvoluntary resettlementImpacts on indigenous peoples and communitiesCumulative impacts of existing projects, the proposed project and anticipated future projectsParticipation of affected parties in the design, review and implementation of the projectConsideration of environmentally and socially preferable alternativesEfficient production, delivery and use of energyPollution prevention and waste minimizationPollution controls (liquid effluents and air emissions) and solid and chemical waste management.
This section deals all the above aspects of IFC guidelines in sufficient details.
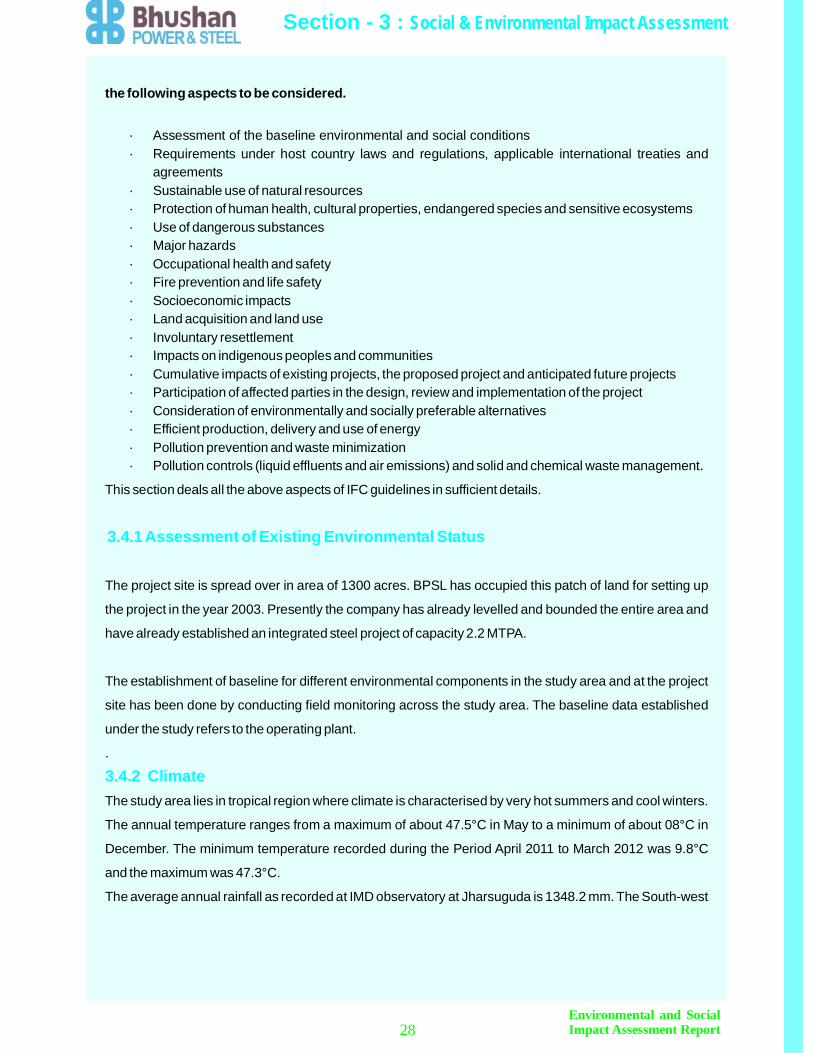
The project site is spread over in area of 1300 acres. BPSL has occupied this patch of land for setting up
the project in the year 2003. Presently the company has already levelled and bounded the entire area and
have already established an integrated steel project of capacity 2.2 MTPA.
The establishment of baseline for different environmental components in the study area and at the project
site has been done by conducting field monitoring across the study area. The baseline data established
under the study refers to the operating plant.
.
The study area lies in tropical region where climate is characterised by very hot summers and cool winters.
The annual temperature ranges from a maximum of about 47.5°C in May to a minimum of about 08°C in
December. The minimum temperature recorded during the Period April 2011 to March 2012 was 9.8°C
and the maximum was 47.3°C.
The average annual rainfall as recorded at IMD observatory at Jharsuguda is 1348.2 mm. The South-west
3.4.1 Assessment of Existing Environmental Status
3.4.2 Climate
Environmental and SocialImpact Assessment Report28
Section - 3 : Social & Environmental Impact Assessment
monsoon lasts from mid June to September and the area gets more than 80% of the annual rainfall during
this period. The average rainfall recorded during the PeriodApril 2011 to March 2012 in the area was 1250
mm..
Meteorological studies are an integral part of environmental impact assessment studies.
In order to get some idea about the baseline meteorological conditions to select the locations of the
ambient air quality monitoring stations, information published by Indian Meteorological Department (IMD)
was used. The nearest Indian Meteorological Department observatory station near to existing integrated
steel plant is at Jharsuguda about 16km north of the project site.
To monitor site-specific micrometeorological data, a meteorological station was set up within steel plant
site.
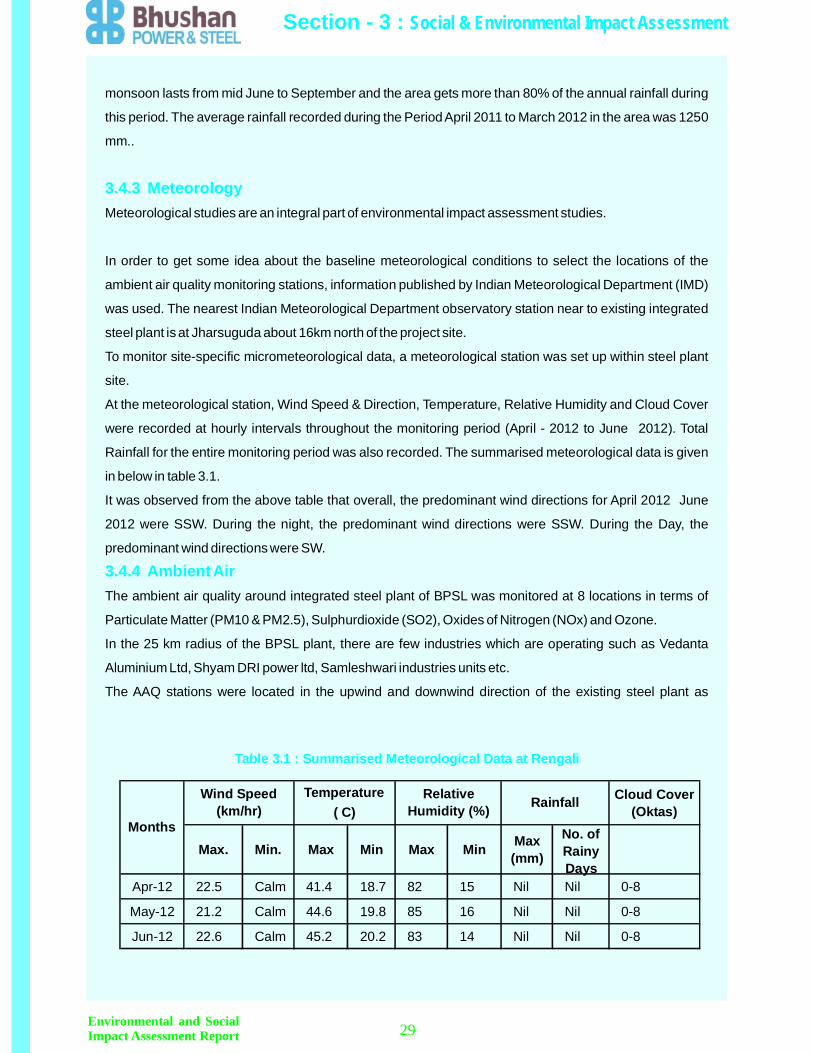
At the meteorological station, Wind Speed & Direction, Temperature, Relative Humidity and Cloud Cover
were recorded at hourly intervals throughout the monitoring period (April - 2012 to June 2012). Total
Rainfall for the entire monitoring period was also recorded. The summarised meteorological data is given
in below in table 3.1.
It was observed from the above table that overall, the predominant wind directions for April 2012 June
2012 were SSW. During the night, the predominant wind directions were SSW. During the Day, the
predominant wind directions were SW.
The ambient air quality around integrated steel plant of BPSL was monitored at 8 locations in terms of
Particulate Matter (PM10 & PM2.5), Sulphurdioxide (SO2), Oxides of Nitrogen (NOx) and Ozone.
In the 25 km radius of the BPSL plant, there are few industries which are operating such as Vedanta
Aluminium Ltd, Shyam DRI power ltd, Samleshwari industries units etc.
The AAQ stations were located in the upwind and downwind direction of the existing steel plant as
3.4.3 Meteorology
3.4.4 AmbientAir
Environmental and SocialImpact Assessment Report 29
Section - 3 : Social & Environmental Impact Assessment
Cloud Cover(Oktas)
Max. Min. Max Min Max Min Max(mm)
No. ofRainyDays
Apr-12 22.5 Calm 41.4 18.7 82 15 Nil Nil 0-8
May-12 21.2 Calm 44.6 19.8 85 16 Nil Nil 0-8
Jun-12 22.6 Calm 45.2 20.2 83 14 Nil Nil 0-8
Months
Wind Speed(km/hr)
Temperature( C)
RelativeHumidity (%) Rainfall
Table 3.1 : Summarised Meteorological Data at Rengali

indicated in the below table 3.2..
During the monitoring period, 24 hourly samples were collected twice a week for SPM (PM10 & PM2.5) &
SO2 whereas the NOx was estimated by taking one hour sample twice a week and Ozone was
established by taking 8 hourly sample twice a week.
The summarisedAAQ results for three month study period are given inTable below 3.3
Table 3.2 List of AAQ Monitoring Stations
Environmental and SocialImpact Assessment Report30
Section - 3 : Social & Environmental Impact Assessment
Location Distance & Direction fromProject Site (appx.)
Station No.
Brundamal Village 5.5 km, N A1
Sirpura Village 3.5 km, NE A2
Gumkarma Village 4.6 km, E A3
Bamloi Village 7.0 km, SE A4
Lapanga Village 4.5 km, S A5
Landupalli Village 6.0 km, SW A6
Thelkoloi Village 1.5 km, W A7
Kandagarh Village 4.9 km, NW A8

Environmental and SocialImpact Assessment Report 31
Table 3.3 :The summarised AAQ results
Section - 3 : Social & Environmental Impact Assessment
Parameters g/m
BrundamalVillage
(A1)
SirpuraVillage
(A2)
GumkarmaVillage
(A3)
BamloiVillage
(A4)
LapangaVillage
(A5)
LandupalliVillage
(A6)
ThelkoloiVillage
(A7)
KandagarhVillage
(A8)
PM 10
Max 32 46 37 42 44 29 43 26
Min. 16 28 19 32 27 14 36 15
Avg. 28 34 31 36 30 18 39 22
PM 2.5
Max 18 22 16 19 23 14 23 13
Min. 10 17 09 14 18 09 20 08
Avg. 16 21 14 16 20 10 22 11
SO2
Max 14 18 16 14 18 15 17 12
Min. 07 08 06 08 07 06 09 07
Avg. 12 13 11 12 11 10 12 12
NOX
Max 106 130 108 115 126 98 132 93
Min. 83 96 80 91 92 76 108 77
Avg. 93 115 94 96 103 85 118 81
Ozone Max 47 49 43 42 43 46 42 41
Results (µg/m )3

3.4.5 Noise (Outside plant boundary)
Results of Noise Monitoring
A detailed measurement of noise level was carried out at 10 locations covering commercial,
residential/mixed-use and industrial area. Precision integrated sound level meter was used. The
measurements were carried out for 24 hours during the study period. Hourly readings were recorded by
the operating the instrument for 10-15 minutes in each hour at one hour intervals in which leq (A) were
measured. The results of ambient noise monitoring are given inTable 3.4.
Table 3.4 :
Environmental and SocialImpact Assessment Report32
Section - 3 : Social & Environmental Impact Assessment
Max. Min. Log Avg. Max. Min. Log Avg.
Out side boundary behindBhushan Township Area(500 m from plant area)
N-2 Outside Main gate of Plant (50m from plant area) Industrial 62.2 51.6 58.5 56.5 52.6 54.0
SH 10, near Thelkoloi Market
(700 m from plant area)
N-4 Thelkoloi rehabilitation centre(900 M from plant area) Residendential 42.5 41.4 41.5 44.5 38.0 42.3
Landupalli village(4 Km from plant area)Lapanga Village(6 Km from plant area)Gumkarma Village(7 Km from Plant area)Sirpura Village(9 Km from plant area)Brundamal Village(4 Km from plant area)Tumbekela Village(2.5 Km from plant area)
ResultsDay (06.00-22.00 hrs) Night (22.00-0600 hrs)
N-1 Residendential 50.2 43.5 43 36.2 34.1 35.2
N-3 Commercial 65.2 45.3 53.2 48.5 40.5 45.5
36.6 40.5
N-6 Residendential 41.5 33.0 33.5 42.5 38.8 40.5
N-5 Residendential 43.5 38.1 40.5 43.5
40.2
N-8 Residendential 46.2 40.5 43.1 43.5 37.2 42.0
N-7 Residendential 45.5 42 43.2 43.5
44.3 38.1 40.5 42.5
37.0
All values in dB(A)
S/N Noise Monitoring Locations Type of area
37.2 39.5
N-10 Residendential 44.2 42.5 41.5 43.0 38.1 41.2
N-9 Residendential
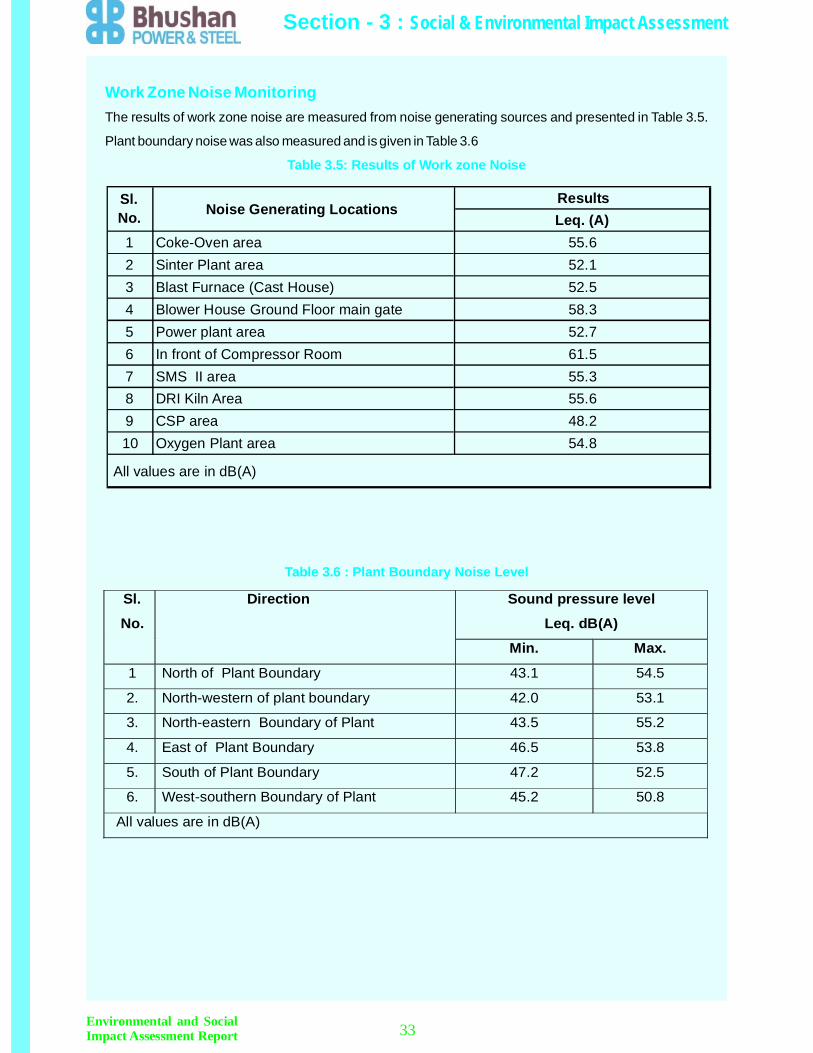
Work Zone Noise Monitoring
Table 3.5: Results of Work zone Noise
Plant Boundary Noise Level
The results of work zone noise are measured from noise generating sources and presented in Table 3.5.
Plant boundary noise was also measured and is given in Table 3.6
Table 3.6 :
Sl.
No.
Direction Sound pressure level
Leq. dB(A)
Min. Max.
1 North of Plant Boundary 43.1 54.5
2. North-western of plant boundary 42.0 53.1
3. North-eastern Boundary of Plant 43.5 55.2
4. East of Plant Boundary 46.5 53.8
5. South of Plant Boundary 47.2 52.5
6. West-southern Boundary of Plant 45.2 50.8
All values are in dB(A)
ResultsLeq. (A)
1 Coke-Oven area 55.62 Sinter Plant area 52.13 Blast Furnace (Cast House) 52.54 Blower House Ground Floor main gate 58.35 Power plant area 52.76 In front of Compressor Room 61.57 SMS II area 55.38 DRI Kiln Area 55.69 CSP area 48.210 Oxygen Plant area 54.8
Sl.No. Noise Generating Locations
All values are in dB(A)
Environmental and SocialImpact Assessment Report 33
Section - 3 : Social & Environmental Impact Assessment

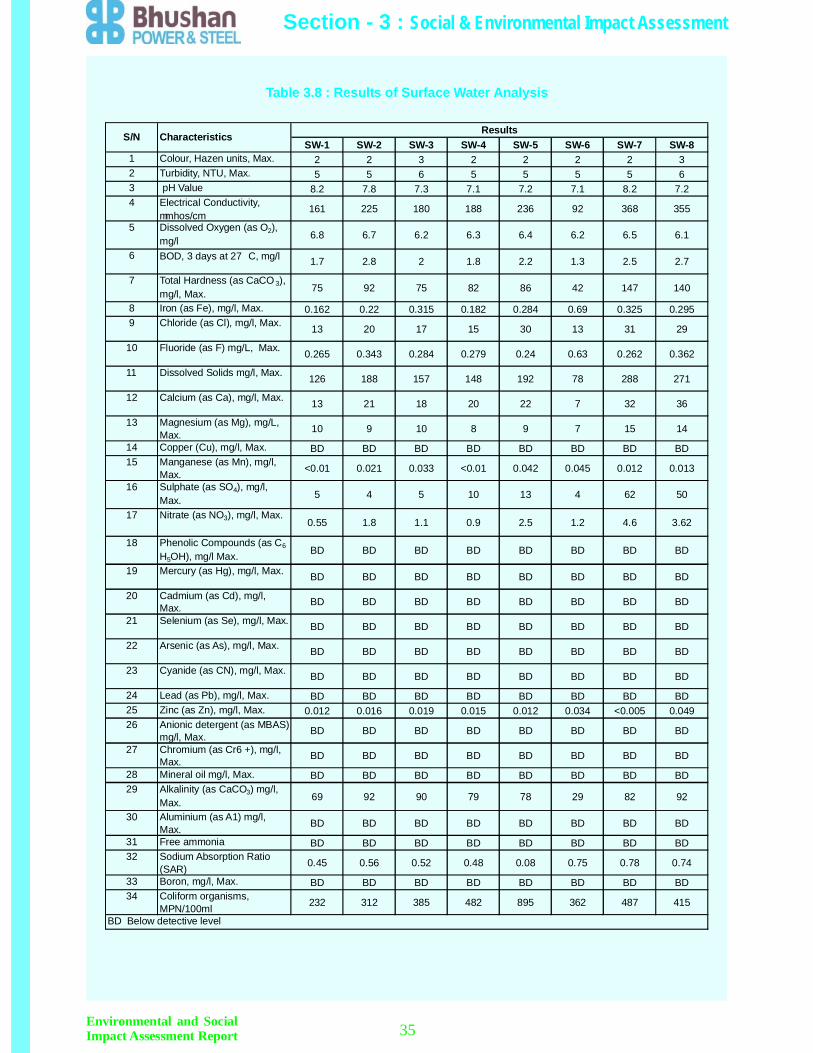
3.4.6 Water Quality MonitoringSurface Water Quality
Location of Water Monitoring Station
Surface water (SW) quality was monitored at 8 locations within the study area covering 10 KM radius from
the plant as center.The details of locations where sample was collected is mentioned below in table 3.7.
Grab samples from surface water sources were collected once during the summer season. The results of
surface water analysis are given in
T 3.7:able
Table below 3.8.
Sl. No. Stn. No. Distance from Plant Location Type
1 SW1 6 Km IB River Surface Water
2 SW2 1.5 Km Bhedan River Surface Water3 SW3 4.5 Km IB River after
confluence of
Surface Water
4 SW4 8 Km Hirakud Back Surface Water5 SW5 12 Km Matbali River at Surface Water6 SW6 11 Km Pond at Village Surface Water7 SW7 1 Km Nala near Surface Water8 SW8 1 Km Nala near Surface Water
Environmental and SocialImpact Assessment Report34
Section - 3 : Social & Environmental Impact Assessment
Environmental and SocialImpact Assessment Report 35
Section - 3 : Social & Environmental Impact Assessment
SW-1 SW-2 SW-3 SW-4 SW-5 SW-6 SW-7 SW-81 Colour, Hazen units, Max. 2 2 3 2 2 2 2 32 Turbidity, NTU, Max. 5 5 6 5 5 5 5 63 pH Value 8.2 7.8 7.3 7.1 7.2 7.1 8.2 7.24 Electrical Conductivity,
mmhos/cm161 225 180 188 236 92 368 355
5 Dissolved Oxygen (as O2),mg/l 6.8 6.7 6.2 6.3 6.4 6.2 6.5 6.1
6 BOD, 3 days at 27 C, mg/l 1.7 2.8 2 1.8 2.2 1.3 2.5 2.7
7 Total Hardness (as CaCO 3),mg/l, Max. 75 92 75 82 86 42 147 140
8 Iron (as Fe), mg/l, Max. 0.162 0.22 0.315 0.182 0.284 0.69 0.325 0.2959 Chloride (as Cl), mg/l, Max. 13 20 17 15 30 13 31 29
10 Fluoride (as F) mg/L, Max. 0.265 0.343 0.284 0.279 0.24 0.63 0.262 0.362
11 Dissolved Solids mg/l, Max. 126 188 157 148 192 78 288 271
12 Calcium (as Ca), mg/l, Max. 13 21 18 20 22 7 32 36
13 Magnesium (as Mg), mg/L,Max. 10 9 10 8 9 7 15 14
14 Copper (Cu), mg/l, Max. BD BD BD BD BD BD BD BD15 Manganese (as Mn), mg/l,
Max. <0.01 0.021 0.033 <0.01 0.042 0.045 0.012 0.013
16 Sulphate (as SO4), mg/l,Max. 5 4 5 10 13 4 62 50
17 Nitrate (as NO3), mg/l, Max.0.55 1.8 1.1 0.9 2.5 1.2 4.6 3.62
18 Phenolic Compounds (as C6
H5OH), mg/l Max. BD BD BD BD BD BD BD BD
19 Mercury (as Hg), mg/l, Max. BD BD BD BD BD BD BD BD
20 Cadmium (as Cd), mg/l,Max. BD BD BD BD BD BD BD BD
21 Selenium (as Se), mg/l, Max. BD BD BD BD BD BD BD BD
22 Arsenic (as As), mg/l, Max. BD BD BD BD BD BD BD BD
23 Cyanide (as CN), mg/l, Max. BD BD BD BD BD BD BD BD
24 Lead (as Pb), mg/l, Max. BD BD BD BD BD BD BD BD25 Zinc (as Zn), mg/l, Max. 0.012 0.016 0.019 0.015 0.012 0.034 <0.005 0.04926 Anionic detergent (as MBAS)
mg/l, Max. BD BD BD BD BD BD BD BD
27 Chromium (as Cr6 +), mg/l,Max. BD BD BD BD BD BD BD BD
28 Mineral oil mg/l, Max. BD BD BD BD BD BD BD BD29 Alkalinity (as CaCO3) mg/l,
Max. 69 92 90 79 78 29 82 92
30 Aluminium (as A1) mg/l,Max. BD BD BD BD BD BD BD BD
31 Free ammonia BD BD BD BD BD BD BD BD32 Sodium Absorption Ratio
(SAR) 0.45 0.56 0.52 0.48 0.08 0.75 0.78 0.74
33 Boron, mg/l, Max. BD BD BD BD BD BD BD BD34 Coliform organisms,
MPN/100ml 232 312 385 482 895 362 487 415
S/N Characteristics Results
BD Below detective level
Table 3.8 : Results of Surface Water Analysis
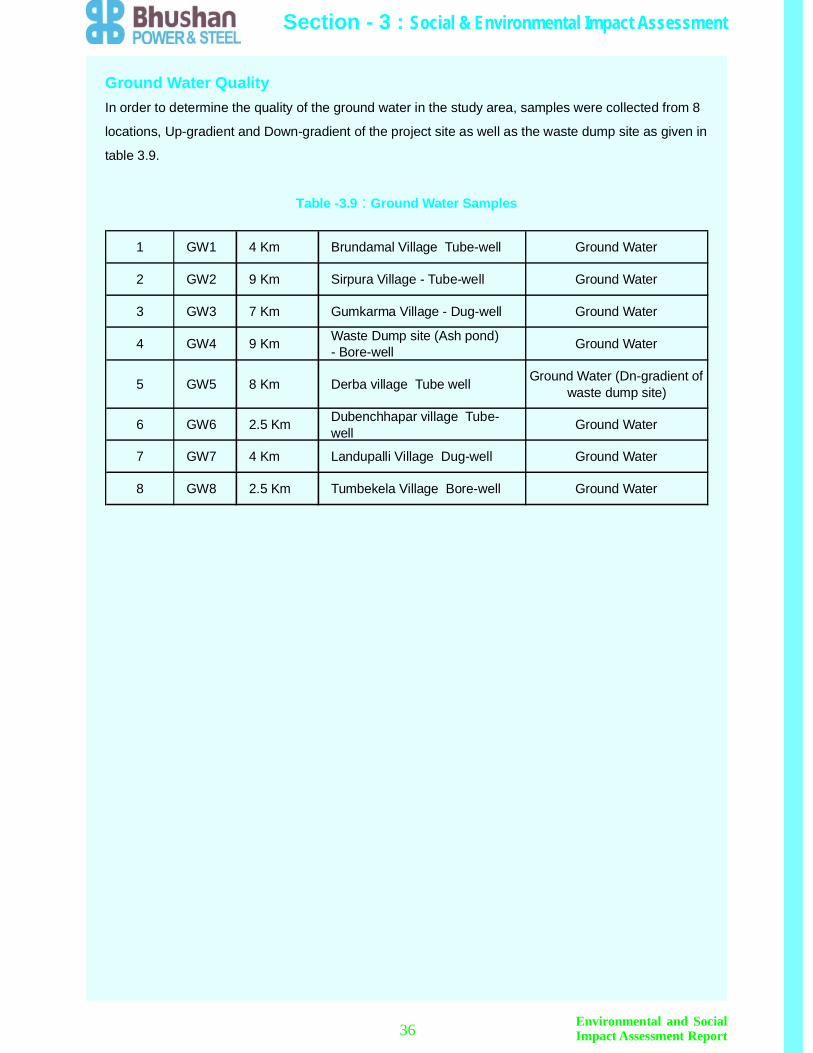
Ground Water Quality
Ground Water Samples
In order to determine the quality of the ground water in the study area, samples were collected from 8
locations, Up-gradient and Down-gradient of the project site as well as the waste dump site as given in
table 3.9.
T -3.9able :
Environmental and SocialImpact Assessment Report36
Section - 3 : Social & Environmental Impact Assessment
1 GW1 4 Km Brundamal Village Tube-well Ground Water
2 GW2 9 Km Sirpura Village - Tube-well Ground Water
3 GW3 7 Km Gumkarma Village - Dug-well Ground Water
4 GW4 9 Km Waste Dump site (Ash pond)- Bore-well Ground Water
5 GW5 8 Km Derba village Tube well Ground Water (Dn-gradient ofwaste dump site)
6 GW6 2.5 Km Dubenchhapar village Tube-well Ground Water
7 GW7 4 Km Landupalli Village Dug-well Ground Water
8 GW8 2.5 Km Tumbekela Village Bore-well Ground Water

Samples were collected monthly during the monitoring season and the average results of analysis are
given inTable 3.10
Table 3.10: Average Results of Ground Water Analysis
Environmental and SocialImpact Assessment Report 37
Section - 3 : Social & Environmental Impact Assessment
GW-1 GW-2 GW-6 GW-7 GW-8
Brundamal Sirpura Dubenc Landu Tumbek
1 Colour, Hazen Units,Max. 5 2 2 2 2 2
2 Odour Unobjectionable Unobjectionable Unobjectionable Unobjectionable Unobjectionable Unobjectionable3 Taste Agreeable Agree Agree Agree Agree Agree
4 Turbidity, NTU, Max. 10 5 5 5 5 5
5 pH NoRelaxation 6.5 6.2 6.8 7.5 7.2
6Total Hardness (asCaCO3), mg/l, Max. 600 62 78 80 178 332
7 Iron (as Fe), mg/l,Max. 1 0.812 0.359 0.078 0.253 0.152
8 Chloride (as Cl),mg/l, Max. 1000 21 24 30 45 162
9 Residual FreeChlorine, mg/l Min. - BD BD BD BD BD
10 Fluoride (as F)mg/L, Max. 1.5 0.78 0.169 0.2 0.45 0.68
11 Dissolved Solidsmg/l, Max. 2000 145 160 675 360 688
12 Calcium (as Ca),mg/l, Max. 200 14 19 119 38 82
13 Magnesium (as Mg),mg/l, Max. 100 8 9 41 20 25
14 Copper (Cu), mg/l,Max. 1.5 BD BD BD BD BD
15 Manganese (as Mn),mg/l, Max. 0.3 0.026 0.035 0.029 0.024 0.02
16 Sulphate (as SO4),mg/l, Max.
400 4 2 52 28 20
17Nitrate (as No3),mg/l, Max. 100 1.42 24.2 0.8 9.2 22.1
18PhenolicCompounds (as C6
H5OH), mg/l Max.0.002 BD BD BD BD BD
19 Mercury (as Hg),mg/l, Max. No relaxation BD BD BD BD BD
20 Cadmium (as Cd),mg/l, Max. No relaxation BD BD BD BD BD
21 Selenium (as Se),mg/l, Max. No relaxation BD BD BD BD BD
22 Arsenic (as As),mg/l, Max. No relaxation BD BD BD BD BD
23 Cyanide (as CN),mg/l, Max. No relaxation BD BD BD BD BD
24 Lead (as Pb), mg/l,Max. No relaxation BD BD BD BD BD
25 Zinc (as Zn), mg/l,Max. 15 0.042 0.11 1.112 0.335 0.11
26Anionic detergent(as MBAS) mg/l,Max.
1 BD BD BD BD BD
27 Chromium (as Cr6+), mg/l, Max. No relaxation BD BD BD BD BD
28 Mineral oil mg/l,Max. 0.03 BD BD BD BD BD
29Alkalinity (asCaCO3) mg/l, Max. 600 78 22 265 182 162
30 Aluminium (as A1)mg/l, Max. 0.2 BD BD BD BD BD
31 Boron, mg/l, Max. 5 BD BD BD BD BD
Essential Characteristics
2 2 2
S/N
Results
GW-3
Gumkarma
GW-4
Ashpond
GW-5
Nerwa
5 5 5
7.2 6.9 7.2
Unobjectionable Unobjectionable UnobjectionableAgree Agree Agree
14 31 390
BD BD BD
182 90 482
0.079 0.41 0.082
0.25 0.32 0.285
Desirable Characteristics
194 288 172
BD BD BD
0.02 <0.01 0.036
20 55 22
7 14 10
BD BD BD
BD BD BD
3 4 3
62 0.041 23.8
BD BD BD
BD BD BD
BD BD BD
BD BD BD
BD BD BD
BD BD BD
0.02 0.278 0.118
BD Below detective level
Characteristics Permissiblelimits
BD BD BD
BD BD BD
BD BD BD
25 190 28
BD BD BD
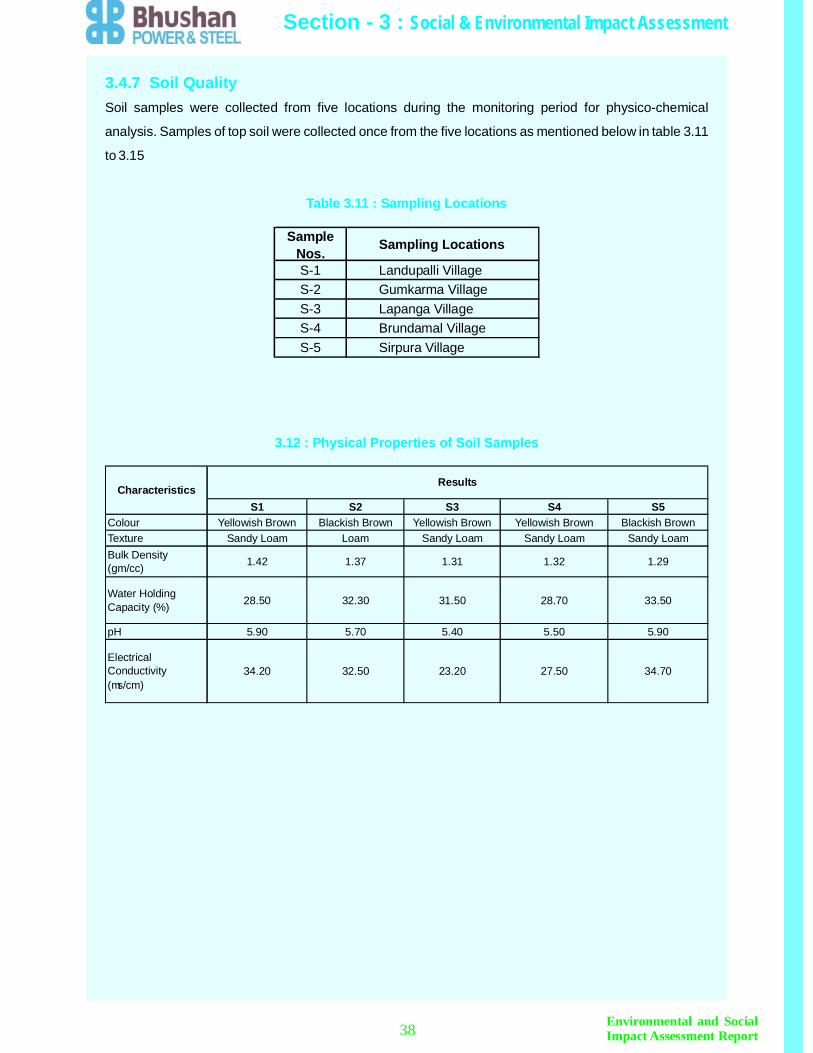
3.4.7 Soil Quality
Table 3.11 : Sampling Locations
3.12 : Physical Properties of Soil Samples
Soil samples were collected from five locations during the monitoring period for physico-chemical
analysis. Samples of top soil were collected once from the five locations as mentioned below in table 3.11
to 3.15
Environmental and SocialImpact Assessment Report38
Section - 3 : Social & Environmental Impact Assessment
SampleNos. Sampling Locations
S-1 Landupalli VillageS-2 Gumkarma VillageS-3 Lapanga VillageS-4 Brundamal VillageS-5 Sirpura Village
S1 S2 S3 S4 S5Colour Yellowish Brown Blackish Brown Yellowish Brown Yellowish Brown Blackish BrownTexture Sandy Loam Loam Sandy Loam Sandy Loam Sandy LoamBulk Density(gm/cc) 1.42 1.37 1.31 1.32 1.29
Water HoldingCapacity (%) 28.50 32.30 31.50 28.70 33.50
pH 5.90 5.70 5.40 5.50 5.90
ElectricalConductivity(ms/cm)
34.20 32.50 23.20 27.50 34.70
CharacteristicsResults

Environmental and SocialImpact Assessment Report 39
Table 3.13 : Available Major Nutrients in Soil
Table 3.14 : Available Micronutrients
Section - 3 : Social & Environmental Impact Assessment
S1 S2 S3 S4 S5Organic Carbon (%)and Rating
0.62Medium
1.31High
0.618Medium
0.686Medium
0.94High
Organic Matter (%) 1.51 2.38 1.42 1.58 2.1
Available Nitrogen(kg/ha) and Rating
340Medium
365Medium
291Low
235Low
355Medium
Available Phosphorus(kg/ha) and Rating
23.2Medium
29.2High
19.1Medium
13.1Medium
27.2High
Available Potassium (kg/ha)and Rating
165Medium
232Medium
115Low
138Medium
187Medium
Available Phosphorus : <10 Low; 10 to 25 Medium; >25 High
Available Potassium : <120 Low; 120 to 280 Medium; >280 High
` Results
Ratings Based on:
Organic Carbon : <0.50 Low; 0.50 to 0.75 Medium; >0.75 High
Available Nitrogen : <280 Low; 280 to 560 Medium; >560 High
S1 S2 S3 S4 S5Iron 148.20 52.00 35.20 77.00 122.00
Copper 1.78 1.32 1.19 1.28 3.00
Zinc 1.62 2.71 1.52 2.26 1.68
Manganese 10.42 13.79 11.83 14.45 21.82
Micro NutrientResults (in mg/kg)
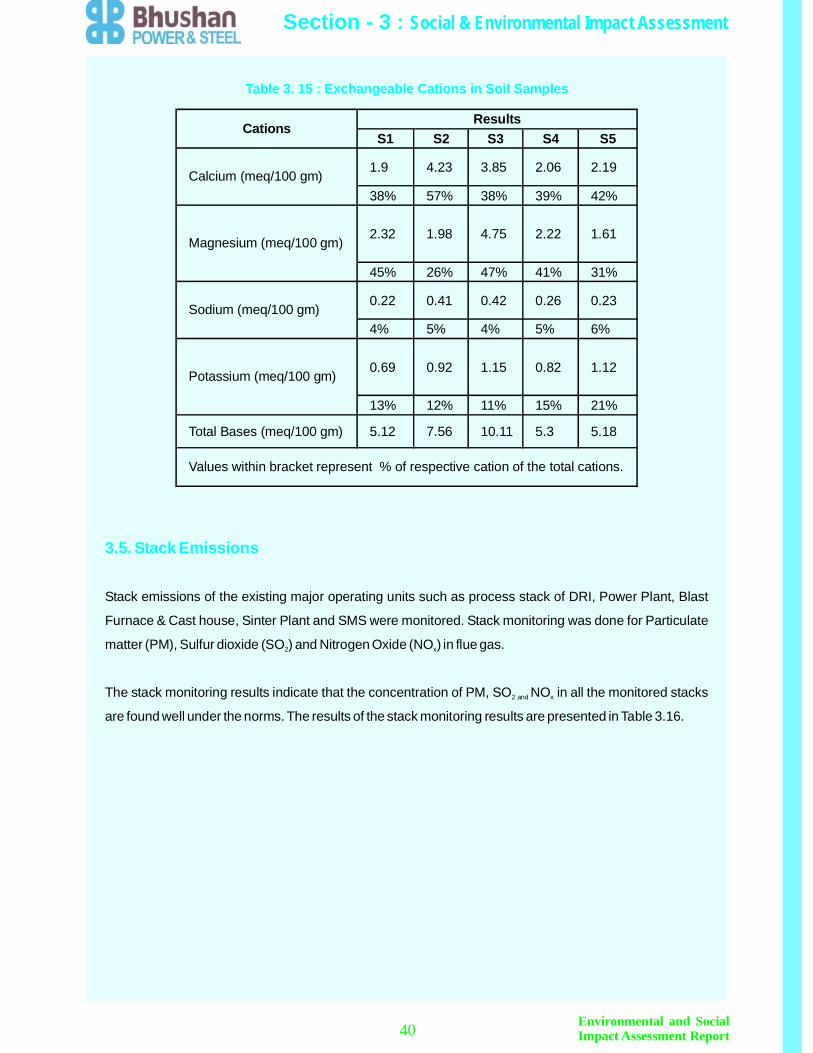
3.5. Stack Emissions
Stack emissions of the existing major operating units such as process stack of DRI, Power Plant, Blast
Furnace & Cast house, Sinter Plant and SMS were monitored. Stack monitoring was done for Particulate
matter (PM), Sulfur dioxide (SO ) and Nitrogen Oxide (NO ) in flue gas.
The stack monitoring results indicate that the concentration of PM, SO NO in all the monitored stacks
are found well under the norms. The results of the stack monitoring results are presented in Table 3.16.
2 x
2 and x
Environmental and SocialImpact Assessment Report40
Table 3. 15 : Exchangeable Cations in Soil Samples
Section - 3 : Social & Environmental Impact Assessment
S1 S2 S3 S4 S5
1.9 4.23 3.85 2.06 2.19
38% 57% 38% 39% 42%
2.32 1.98 4.75 2.22 1.61
45% 26% 47% 41% 31%
0.22 0.41 0.42 0.26 0.23
4% 5% 4% 5% 6%
0.69 0.92 1.15 0.82 1.12
13% 12% 11% 15% 21%
Total Bases (meq/100 gm) 5.12 7.56 10.11 5.3 5.18
Values within bracket represent % of respective cation of the total cations.
CationsResults
Calcium (meq/100 gm)
Magnesium (meq/100 gm)
Sodium (meq/100 gm)
Potassium (meq/100 gm)

3.5.1 Waste Management at the operating plant
3.5.2 Impacts Description &Analysis
The non hazardous and hazardous wastes being generated in different operating units of the plant are
indicated below. Presently non hazardous and hazardous waste are handled separately as per the
guidelines and direction of OSPCB.
The comparative waste generated and recycled/sold/transferred and dumping from different additional
units and 2.2 MTPA operating units of steel complex and its re-utilisation and disposal is given below in
table 3.17 to 3.20.
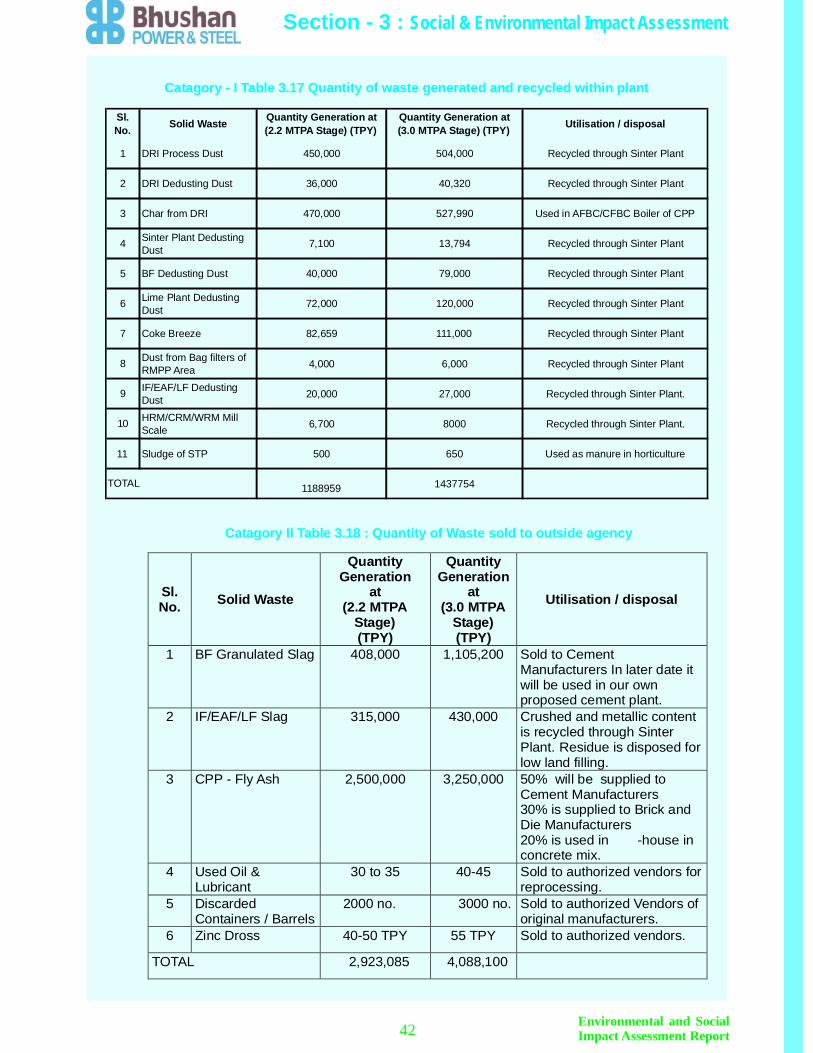
There are four categories of solid wastes, category- I, is wastes that are completely recycled within theplant (Sinter Plant, Power Plant) the other as classified as category II are waste which are 100% sold tooutside agency for value addition, the category - III of waste are the solid waste which is beingtaken/transferred by other external agency / contractor (Approved by OSPSB) and the category IV is thewaste which is required to be dumped by BPSL at the designated solid waste disposal site as perApproved scheme of Pollution control board. 85% of waste comes under the bracket of (I to III Category).Only 15% of waste is to be dumped by BPSL.
Environmental and SocialImpact Assessment Report 41
Table 3.16 : Stack Monitoring Results
Section - 3 : Social & Environmental Impact Assessment
(°C)S/N Stack Details Temperature Exit
Velocitym/s
ParticulateMatter
(mg/Nm3)
SulfurDioxide
(mg/Nm3)
NitrogenOxide
(mg/Nm3)
1 Kiln no. 1 162 12.8 45 233 522 Kiln No. 2 163 12.8 43 240 563 Kiln No. 3 162 12.5 41 236 504 Kiln No. 4 161 11.9 44 229 485 Kiln No. 5 163 12.8 48 245 526 Kiln No. 6 162 12.8 44 245 527 Kiln No. 7 161 12.8 41 241 488 Kiln No. 8 162 12.7 47 236 499 Kiln No. 9 162 11.9 45 237 4410 Kiln No. 10 161 12.5 42 240 4111 Kiln No. 1 & 2- Dedusting 47 10.8 33 - -12 Kiln No. 3 & 4- Dedusting 46 10.5 38 - -13 Kiln No. 5 & 6 - Dedusting 45 10.5 35 - -14 Kiln No. 7 & 8 - Dedusting 44 11.2 30 - -15 Kiln No. 9& 10 - Dedusting 45 11.5 3616 Power Plant (40 MW) 153 15.4 47 235 5517 Power Plant (60 MW) 152 17.5 48 222 5218 Power plant (130 MW -1) 154 18.0 45 222 5019 Power plant (130 MW -2) 155 20.5 46 228 52
10.0 32 - -21 Sinter Plant Dedusting 43 11.5 37 - -
15.0 30 - -- - 50 - -
22 SMS (Electric Arc FurnaceComplex) 75
MOE&F/ IFC norms
20 Blast Furnace and CastHouse 55
Environmental and SocialImpact Assessment Report42
Catagory - I Table 3.17 Quantity of waste generated and recycled within plant
Section - 3 : Social & Environmental Impact Assessment
Sl.No. Solid Waste Quantity Generation at
(2.2 MTPA Stage) (TPY)Quantity Generation at(3.0 MTPA Stage) (TPY) Utilisation / disposal
1 DRI Process Dust 450,000 504,000 Recycled through Sinter Plant
2 DRI Dedusting Dust 36,000 40,320 Recycled through Sinter Plant
3 Char from DRI 470,000 527,990 Used in AFBC/CFBC Boiler of CPP
4Sinter Plant DedustingDust 7,100 13,794 Recycled through Sinter Plant
5 BF Dedusting Dust 40,000 79,000 Recycled through Sinter Plant
6Lime Plant DedustingDust 72,000 120,000 Recycled through Sinter Plant
7 Coke Breeze 82,659 111,000 Recycled through Sinter Plant
8Dust from Bag filters ofRMPP Area 4,000 6,000 Recycled through Sinter Plant
9IF/EAF/LF DedustingDust 20,000 27,000 Recycled through Sinter Plant.
10HRM/CRM/WRM MillScale 6,700 8000 Recycled through Sinter Plant.
11 Sludge of STP 500 650 Used as manure in horticulture
1188959 1437754TOTAL
Sl.No. Solid Waste
QuantityGeneration
at(2.2 MTPA
Stage)(TPY)
QuantityGeneration
at(3.0 MTPA
Stage)(TPY)
Utilisation / disposal
1 BF Granulated Slag 408,000 1,105,200 Sold to CementManufacturers In later date itwill be used in our ownproposed cement plant.
2 IF/EAF/LF Slag 315,000 430,000 Crushed and metallic contentis recycled through SinterPlant. Residue is disposed forlow land filling.
3 CPP - Fly Ash 2,500,000 3,250,000 50% will be supplied toCement Manufacturers30% is supplied to Brick andDie Manufacturers20% is used in -house inconcrete mix.
4 Used Oil &Lubricant
30 to 35 40-45 Sold to authorized vendors forreprocessing.
5 DiscardedContainers / Barrels
2000 no. 3000 no. Sold to authorized Vendors oforiginal manufacturers.
6 Zinc Dross 40-50 TPY 55 TPY Sold to authorized vendors.
TOTAL 2,923,085 4,088,100
Catagory II Table 3.18 : Quantity of Waste sold to outside agency

Environmental and SocialImpact Assessment Report 43
Sl.No. Solid Waste
QuantityGeneration
at(2.2 MTPA
Stage)(TPY)
QuantityGeneration
at(3.0 MTPA
Stage)(TPY)
Utilisation / disposal
1. Sludge from ETP 1800 2500 Being treated and disposedin OWMP developed by M/s.Ramky Enviro Engg. Ltd nearVillage Jajpur.
2. Spent IonExchange Resin
10-12 KL/y 15-17 KL/y Handed over to M/s. RamkyEnviro Engineers Ltd. fortreatment and disposal inOrissa common disposalfacility.
TOTAL 1820 2530
Catagory III Table 3.19 Quantity of Waste transferred by Approved Agency
Section - 3 : Social & Environmental Impact Assessment
Sl.No. Solid Waste
QuantityGeneration
at(2.2 MTPA
Stage)(TPY)
QuantityGeneration
at(3.0 MTPA
Stage)(TPY)
Utilisation / disposal
1. CPP - Fly Ash 300,000 4,50,000 Disposed in designated solidwaste disposal area
2. CPP – BottomAsh 430,000 550,00 Disposed in designated solidwaste disposal area
TOTAL 730000 1000000
Grand TotalCategory – I to IV
4843854 6528384
Catagory IV Table 3.20 Quantity of Waste for dumping in separate area by BPSL

From the above it is concluded that maximum portion of solid waste are recycled or reused in the
plant/other manufacturing units. The balance is being dump in a separate designated area for which BPSL
has obtained approval from State Pollution Control Board. BPSL is already operating the current 2.2 MTPA
stream for the last couple of years and has already established waste management system due to which
the plant is running efficiently without any environment related problems and also socio-economic issues.
The present management team is quite competent to deal with the expanded plant of 3.0 MTPA.
Solid waste management of BPSL is quite efficient and about 85% of solid wastes are recycled/
reused and only 15% of solid wastes will require dumping. The approved dumping scheme of OSPCB
is fully environment friendly.
The dumping site is about 8 KM away from the plant spread over an area of about 100Acres. The dumping
is done strictly as per the guidelines of MOEF/CPCB/OSPCB after obtaining prior approval.
The dumping site is being inspected regularly by various inspecting authorities.
The salient feature of dumping system and protection measures being followed for pollution control is
discussed below.
The solid waste which are disposed in the site are of nonhazardous nature. The major solid waste will
be the Ash generating from the power plan.
T
Since there is no village near to the dumping area hence it is suitable for disposal of solid waste. The entire
disposal site is used for disposal of solid waste generated form the plant. The entire area is demarcated
and a boundary is provided with earth embankment prior to disposal of waste. Preparation of the land fill
area is done in a systematic way so as to utilize the land for a long period of time.
Preparation of the land fill site consist of the following activities
Number of pits are dug with a depth of around 5
to 6 meters for disposal of the waste.
Embankment upto a height of 12 meters from
the ground to accommodate maximum amount
Earth Cutting and leveling to create maximum storage capacity and to obtain fill material for
embankment.
Provision of embankment around each land fills area to retain the material and to prevent its
carry over / run-off with rain water.
The embankment will also serve to retain any rain water falling within the area
Provision of garland drain around the
embankments.
Provisions for approach road to each
land fill area.
Development of Disposal Site:
•
•
••
•
Environmental and SocialImpact Assessment Report44
Section - 3 : Social & Environmental Impact Assessment

of solid waste in each pit is raised.
After digging the pits the floor of the pit is
compacted with clay, Over which a 6 inch
sand layer is laid so as to prevent leaching
of water and prevention of ground water
contamination.
Provision for water sprinkling with fixed
water sprinkling system and flexible hose
is provided so as to prevent fugitive emission
The dumping area is protected through 12 m height and 3 m wide embankment and having garland drain
all around. The garland drain shall have slope from all sides so that the rain water can travel by gravity to
the collection pit which is constructed at a low gradient. A
tentative layout plan of the area is shown in figure below
The stacking of solid waste is done systemically by
properly laying in various areas step by step. Necessary
machinery such as dozer or JCB is engaged for the
purpose. The dumping and stacking is started from the low
level area so that more stacking could be done in the area.
With proper stacking and compaction the stacking height
can de increased above 3 meters in each layer. Between
two successive layers a thin layer of binder earth material
is used for proper compaction. Proper approach road is made within the area for easy operation of trucks
and tankers.Across section view of the plan is described in figure above.
The solid waste from the plant is transported by road to the dump area.Ash is transported in closed tankers
and covered tippers in moist condition. Loading of material is done mechanically through telescopic chute
from the silo after conditioning through conditioner. Photograph
of covered tippers used for transportation of ash is mentioned
below.
The dump site is
properly reclaimed after attaining the desired height. A thick
layer of soil is spred over the entire dump area. A thick green
belt is developed over the disposal site so as to develop
greenery. Native species of plants are selected as mentioned
below for plantation.
.
Rec l amat io n of
dump site
Environmental and SocialImpact Assessment Report 45
Plantation being done over thereclaimed area
Grown up vegetationover the reclaimed area.
Section - 3 : Social & Environmental Impact Assessment

Tectona Grandis GmelinaArborea Casia Firtula, etc.
Madhuka Indica Ghorea Roburta Mangifera Indica
Photograph of reclaimed area and development of plantation is
mentioned below
The plant is designed on zero discharge concepts. No process effluent
or waste water or effluent is discharged outside the plant boundary.
Effluent treatment
plant (ETP) of
capacity 150 m3/hr is in operation for treatment of
effluent generating from CRM complex. The acid
which is used in pickling is taken to acid regeneration
plant for recovery of acid and iron oxide. The
residual spent acid is treated in the ETP and the
treated water is reused in the plant for applications
such as sprinkling over raw material
stock yards, cleaning of floors and
ash conditioning.
Neutralisation tanks have been
provided in DM plant for treatment of
DM plant blow down water. The
treated water is again fed into the
cooling water system of different
plant units.
Company has also constructed 2 nos. of waste water treatment plant (WWTP) of capacity 650 & 600
m3/hr. The waste water such as surface runoff and storm water flowing through internal drains of the plant
is treated in these WWTP and reused. Major portion of the treated water is taken into the raw water
reservoir and used as fresh raw water. The sludge of WWTP is taken by approved agency M/s Ramky
Environ Engineers Ltd.
To access the present load of pollution created by traffic movement it is very important to survey
movement of traffic. Traffic survey was done at the main gate of the factory to assess the traffic density of
the plant, details is mentioned in table below.
3. 5. 3 Effluent / Waste Water Discharge
3.5.4 Traffic Density Survey
Environmental and SocialImpact Assessment Report46
Section - 3 : Social & Environmental Impact Assessment

The plant of BPSL has gradually increased the capacity starting from 1.2 MTPA to 2.2 MTPA. This has
influence in the movement of men and materials over the periods. The traffic density which was 927
inwards movements of heavy vehicles daily and outward 1140 in year 2011 has increased to 1120 and
1250 respectively. Similarly movement of different vehicles like two wheelers and four wheelers has also
increased. The movement of vehicles has affected in and around the vicinity of the plant but the monitoring
results of ambient air quality and noise around the plant boundary indicates virtually no impact of air and
noise pollution on these parameters.
The existing steel plant where expansion is proposed is located all along the SH-10 that connects
Jharsuguda with Sambalpur in Orissa very close to Bheden River. As such, the project will be influenced
by and will also influence the following immediate ecosystems:
The project site was a barren land without much irrigation and cultivation. Only a few surrounding villages
and a few hamlets were existing without much opportunity to employment and business. Now the area is
full of activities because of implementation of the project of this nature and people are getting employed
and in turn exposed to business opportunities. For establishing this project, few families of a village was
relocated with suitable compensation during the first phase of this project. No further rehabilitation or
resettlement is required during this proposed expansion.
The existing vegetation is comprised of degraded deciduous vegetation, primarily shrubs, herbaceous
plants and several species of grasses interlaced with a few thorny bushes. The fauna identified was typical
of areas where human intervention is evident. In addition many of the avian species observed were
transient and migratory towards Hirakud reservoir. Like the flora, the fauna are very common and can be
found throughout the plain especially on abandoned and open lands.
The Terrestrial Ecosystem
TheAquatic Ecosystem
3.5.5 Ecology of StudyArea (Flora & Fauna)
••
Environmental and SocialImpact Assessment Report 47
Section - 3 : Social & Environmental Impact Assessment
Inwards Plant Outwards Plant Inwards Plant Outwards Plant Inwards Plant Outwards Plant
06.00 AM to 02.00 PM 830 793 247 314 549 604
02.00 PM to 10.00 PM 653 725 239 271 482 476
10.00 PM to 06.00 AM 478 365 126 188 316 197
Total 1961 1883 612 773 1347 1277
TimeTwo Wheelers Four Wheelers Heavy Vehicles

Company has started plantation activities since 2005 onwards for enriching ecology and vegetation in and
around the plant.A wide green belt has been established all along the boundary. Green belt has also been
developed on both sides of the plant road and in all open lawns. The trees cover as well as the Green belt
developed in the plant have improved the ecological balance of the area.
The statics of plantation carried out by the company in view of green belt development is mentioned below
in table.
The list of plants commonly found in the area is given below in table
The study area is thinly populated. The thickly populated centers are Jharsuguda town and Sambalpur
town and these are located at a distance of nearly 16 km and 45 km respectively from the project site. The
study area is more or less a moderately undulating terrain.
Flora
The vegetation in the area is very typical of plain areas and areas that have been disturbed by humans.
Except for the presence of a few cultivated trees (Bamboo, mango and banana) the vegetation present
was primarily wild grass that is found in almost all areas and human disturbed areas.
Terrestrial Ecology
Table 3.21 : Plants found in study area
Environmental and SocialImpact Assessment Report48
Section - 3 : Social & Environmental Impact Assessment
S/N Common Name Scientific Name1 Sal Shorea robusta2 Mahua Madhuca indica3 Kendu Diospyros melanoxylon4 Boro Ficus bengalensis5 Ashwattho F. religiosa6 Dimiri F. hispida7 Neem Azadirachta indica8 Kusumo Schleichera trijuga9 Ambo Mangifera indica10 Panaso Artocarpus heterophyllus11 Arjuno Terminalia arjuna12 Harida T. chebula13 Asana T. tomentosa14 Gambhar Gmelina arborea15 Piasalo Pterocarpus marsupium16 Korado Cleisanthus collinus17 Kamini Bauhinia variegata.18 Dhatuki Woodfordia fruticosa19 Talo Borassus flabellifer20 Khajuri Phoenix sylvestris21 Jamkoli Syzigium cumini22 Barakoli Zizyphus mauritiana23 Polaso Butea frondosa

Forest
Agricultural Land
Waste Land
Vegetation near Human Habitation
3.4.2 Fauna (Terrestrial and Aquatic)
There is no reserve forest within 10.0 km of existing plant site. However, there are several reserve forests
beyond 10 km of the project site. These include Kurebaga R.F (12 km NE) Ghichamura R.F. (16 km SE or
E), Rampur R.F. (14.0 km WNW), Katikela R.F. (11 km NE) and Patrapali R.F. (12.5 km West). The forests
fall broadly within subgroup Tropical Dry Deciduous Forest and Dry Mixed Deciduous Forests. The forest
crop varies from compartment to compartment with density varying from 0.4 to 0.7. Bamboo occurs in
abundance and can be found all over the area. It occurs mainly as under-story with some pure patches.
Sal occurs at foothills in moister pockets in valleys and in small isolated patches. Natural regeneration of
tree species is poor, whereas that of bamboo is adequate, which leads to the conclusion that with
concentrated filling the aggressive bamboo growth may replace the tree species completely, particularly
over the hill slopes. The forest of the region will be described as forest falling under project site and forest in
the study area. It is difficult to distinguish at the two but for the purpose of the EIA report it is being
described separately.
The principal agricultural crop is paddy in the study area. Other crops like pulses, wheat and vegetables
are also grown at few places in a very limited area. Due to non-availability of irrigation system in the area
paddy is grown only once in a year during the monsoon season. The soil characteristic ranges from heavy
clay with kankar to loamy to sandy loam. The project area had very few patches of cultivable land.
At places where soil condition is not proper for plant growth or places where soil is over exploited the land
is completely denuded with vegetation except for the wasteland species and weeds. This type of land
basically comprises species like: sp, sp, , sp, Xanthium sp,
sp, sp, etc.
Near the villages, the vegetation pattern has abruptly changed from that what it is seen in the forest areas.
The common species are those which are useful to the human beings. The species commonly found are
, , j , , sp,
etc.
Since the change in ambient air quality due to emissions from the integrated steel plant will be small thus
the vegetation outside the plant area will not be damaged.
The fauna that was observed were all highly mobile and migratory species that easily adapt tochanging environments. The majority of fauna observed were avian fauna which are common to area.
Calotropis Ipomea Mimosa pudica Lantana
Cassia Ageratum
Mangifera indica Madhuca indica, Psidium guava Syzigium ambolana Tamarindus indica Pheonix
Artocarpus heterophylla
Environmental and SocialImpact Assessment Report 49
Section - 3 : Social & Environmental Impact Assessment

Birds
Table 3.22 : List of Birds Commonly Found in the Area
Wild life - Mammals, Reptiles and Amphibians
The birds found in the area are as follows:
The project area is bounded by Jharsuguda, Titlagarh railway line on the east, state high way No. 10 on the
west side and a village road to sirpura on the north.
The nearest wildlife sanctuary is Debrigarh wild life sanctuary which is located on the other side of Hirakud
reservoir and is about 45 km away from the project site. The other wildlife sanctuary of the district is
Badromar wild life sanctuary which is about 50 km away from project site. Hence the project and
surrounding area is not contiguous to any wild life habitat. Through no wild life of significance do occurs in
Environmental and SocialImpact Assessment Report50
Section - 3 : Social & Environmental Impact Assessment
Common Name Scientific Name StatusSchedule of Wildlife
Protection Act inwhich listed
Paddy Bird Ardeola grayii - IVLarge Indian Parakeet P. eupatria - IVRose Ringed Parakeet P. krameri - IVBrahminy Duck Tadorna ferrugninea - IVPochards Aythya spp - IVRed Wattled Lapwing Vannelus indicus - IVKoel Eudynamis scolopacea - IVWhite Breasted kingfisher Halcyon smyrnansis - IVSmall green Bee-eater Merops orientalis - IVCoot Fulica atra - IVJungle Crow Corvus marorhynchos - VCommon Crow C. splendens - VHill Mynah Gracula religiosa - IVCommon Mynah Acridotheres tristis - IVHouse Sparrow Passer domesticus - -Golden Backed Woodpecker Dinopium benghalense - IVRed Vent Bulbul Pycnonotus cafer - IVSpotted Dove Streptopelia chinensis - IVRed Jungle Fowl Gallus gallus - IVGrey Hornbill Tockus birostris - IVWhite Backed Vulture Gyps bengalensis - IVKing Vulture Sarcogyps calvus - IVSpur Fowl Galloperdix spp - IVGrey Quail Coturnix coturnix - IVBush Quail Peridicala indica - IVPurple Sun-bird Nectarinia asiatica - IVBustard Quail Turnix suscitator - IV

this patch, species like jackals, pythone, cobra, yellow monitor, lizzards, hares besides ground birds like
quails and patriges can be rarely seen. Other birds which are seen are parakeets, common hyna etc.
Based on actual field verification and interaction with local people and forest staff it is observed that very
few of the listed common wild animals and common birds are actually found in the project area. Also
because of high anthropogenic pressure due to the highway and consequent development of human and
industrial activity it is not been conducive for wildlife to inhabit the area.
The list of wild mammals and reptiles found in the study area are listed in the below table
The spotted deer usually inhabits on the lower slope of the hills and is found in grassy blanks near village
sites. Herds of 10-12 are at times seen when rabi crops are on. Sambar occurs in limited numbers in all the
forest areas of Barapahr hills and Meghpal. Wild dogs are common in Basiapara-Birsingah block and Bear
in Papagga and Goinpuria areas.
The common snakes found in the region are Kraits and Cobras.
The main Hirakud Dam lies some 15 to 20 km away from site however backwater lies about 6 to 8 km south
Table 3.23 List of Wild Mammals Found in the Study Area
Environmental and SocialImpact Assessment Report 51
Section - 3 : Social & Environmental Impact Assessment
Common Name Scientific NameStatus (As per RedData Book of Indian
Animals)
Schedule of WildlifeProtection Act in
which listed
Sloth bear Melursus ursinus - IICommon jungle cat Felis chans - IIHyaena Hyaena hyaena - IIICivet Vivera indica - IICommon mongoose Herpestres edwardsii - IVJackal Canis aureus - II,VWild dog Cuon alpinus - IIFox Vulpes bengalensis - IIIndian Giant Squirrel Ratufa indica - IIPorcupine Hystrix indica - IVCommon hares Lepas sp. - IVWild boar Sus scrofa - IIIBarking deer Muntiacus muntiacus - IIISpotted deer Axis axis - IIIStriped Palm Squirrel Funambulus palmatum - IV
Indian Cobra Naja naja _ IIYellow rat Snake Ptyas mucosus _ IICommon Krait Bungarus caeruleus - IVRussels Viper Vipera russelii _ IICheckered Keelback Xenochropis piscator _ II
A. Mammals
B. Reptiles

and south west of the project site. Many of the duck like bird are seen in main reservoir water far away from
project site.
The avian species observed were transient and migratory and are generally found around area inhabited
by humans. No main fish or aquatic species of significant environmental or ecological importance were
identified. The aquatic species of vegetation were considered aquatic weeds that obstruct effective water
flow.
The main water bodies in the area are Ib River, Bhedan River and the Hirakud Reservoir. The Ib River is a
tributary of river Mahanadi and joins the Hirakud Reservoir. The Bhedan River is not perennial. The
Hirakud Reservoir has been constructed on the Mahanadi River system. The water requirement of the
project would be met from the Hirakud Reservoir backwater. The data on ecology of the aquatic
ecosystem in the study area is based on literature.
A total of 35 species have been recorded from the area. Diatoms dominate the reservoir, whereas
filamentous algae of Chlorophyceae and Cyanophyceae dominate the rivers. In general the density,
volume and biomass of algae was higher in the reservoir and lower in the rivers.
Atotal of 23 species have been recorded in Hirakud dam and adjoining rivers of which Crustaceans are the
dominant group. It has been noted that density of zooplankton is higher in the dam than in the rivers.
The Hirakud Reservoir is the main ecosystem supporting fishes in the area. As per the survey conducted
by Job at (1955) on the Mahandi River system, before the construction of dam, there were 183 species of
fishes, out of which 24 were of economic importance. The most common species were and
. .After the formation of reservoir, fishery underwent considerable changes and the present fish
fauna of the reservoir constitute only 42 species which are listed in table below. As per the survey
conducted by George et.al (1973), four species viz. , , , and
are the commercially important fishes of the reservoir. Maximum abundance of fishes
was reported duringApril-July. The yield was better in the upper region followed by the middle region.
Labeo calbasu
L fimbriatus
Silonia silondia Labeo fimbriatus Catla catla
Cirrhina mrigala
3.5.6 AQUATIC ENVIRONMENT
AQUATIC ECOLOGY
Phytoplankton
Zooplankton
Fishes
Environmental and SocialImpact Assessment Report52
Section - 3 : Social & Environmental Impact Assessment

Table 3.24 : Fish Fauna of Hirakud Dam
3.5.6 Socio Economic Conditions
Methodology
In the present investigation, the study area is considered as the circle with 10 km with centre at Lapanga,
the plant / project site. The entire study area comes under two districts, viz, Sambalpur (Rengali Tehasil)
and Jharsuguda. Rengali, tehesils covers about 80% of the study area while the remaining 20% falls in
Jharsuguda. The impact assessment of this project has been done on the study area. Table-3.25 depicts
a synoptic view of the basic statistics of the study area. The population of the area is around 60000 with a
density of 130 persons per square km.
The major methods used as tools of analysis in this study are as given below:1. Regression:Simple linear regression of the following type in considered
Yi = a + b X + U (Where, U is the stochastic error term having its usual properties)The model is fitted to data applying Ordinary Least Square (OLS) to obtain estimated demand andconsumption functions.
2. Fitted regression models is used to work out
i) Elasticity of demand with respect to disposable income (e) in case of demand functions :e = (dy / dx). (y/x)
ii) Marginal propensity to consume (MPC) from consumption function : MPC = dC / Dy
3. Frequency distribution of peoples' perception, educational status, land holding etc
i i
Environmental and SocialImpact Assessment Report 53
Section - 3 : Social & Environmental Impact Assessment
Name of fish Local Name Name of fish Local NameCatla catla Bakur Notopterus notopterus FaliLabeo fimbriatus Pursi/Berag Notopterus chitala ChitalLabeo calbasu Kalanchi Gudusia chapra PhufurLabeo rohita Rohu Rohtee cotio ChilatiLabeo gonius Nunia Pama pama PatharmudiLabeo bata Banghen Glossogobius guiris GazraCirrhinus mrigala Mrikali Rhinomugil corsula KoingaC. reba Pohura/Dumala Xenentodon cancila GourchenaBarbus tor Kusra Chela sp. JeddaPuntius sarana Sarna Chela bacaillaMystus seenghala Asdi/Singhari Ailea coilfa BauspatiMystus sor Katrang Ambassis nama -Mystus gulio Tingra Ambassis sp PatponiaSilonia silondia Gaja Puntius sophore KutriWallago attu Balia Puntius dorsalis KutriPangasius pangasius Jalang Mastacembelus pancalus BayarriRita chrysea Kukia Channa marulius SoulEutropiichthys vacha Vacha Channa punctatus KhapsiBagarius bagarius Buthia Ompok bimaculatus Banju
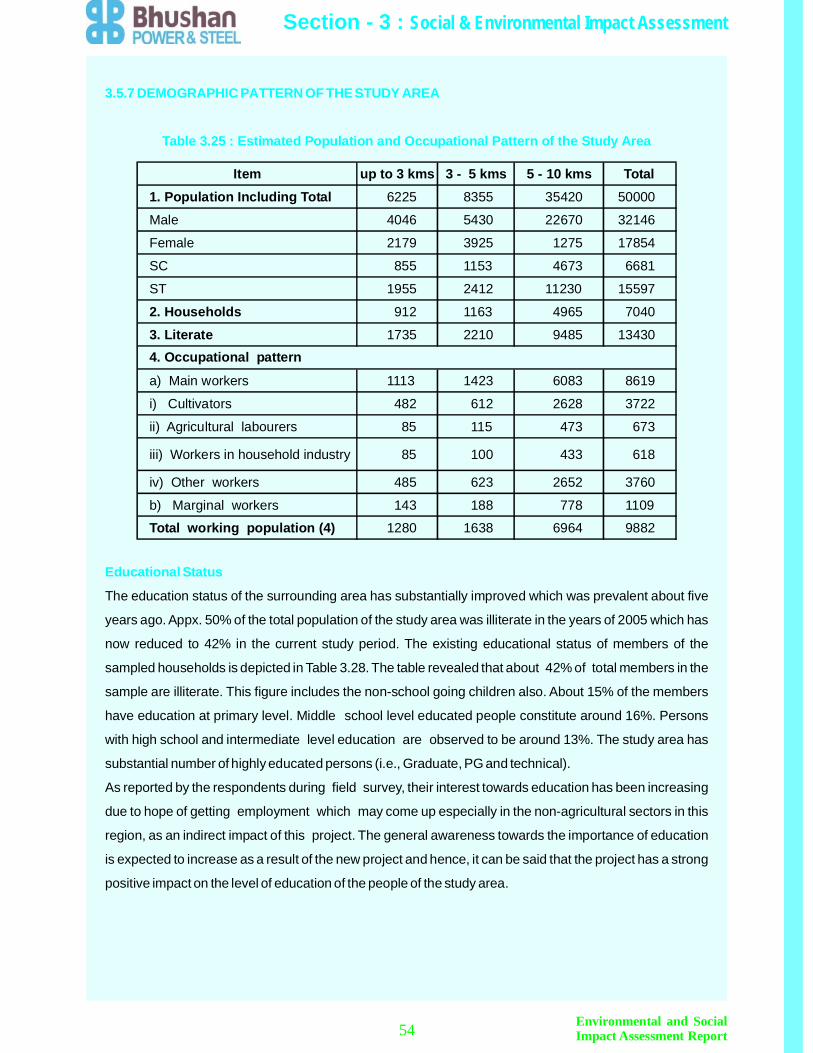
3.5.7 DEMOGRAPHIC PATTERN OF THE STUDY AREA
Table 3.25 : Estimated Population and Occupational Pattern of the Study Area
Educational Status
The education status of the surrounding area has substantially improved which was prevalent about five
years ago. Appx. 50% of the total population of the study area was illiterate in the years of 2005 which has
now reduced to 42% in the current study period. The existing educational status of members of the
sampled households is depicted in Table 3.28. The table revealed that about 42% of total members in the
sample are illiterate. This figure includes the non-school going children also. About 15% of the members
have education at primary level. Middle school level educated people constitute around 16%. Persons
with high school and intermediate level education are observed to be around 13%. The study area has
substantial number of highly educated persons (i.e., Graduate, PG and technical).
As reported by the respondents during field survey, their interest towards education has been increasing
due to hope of getting employment which may come up especially in the non-agricultural sectors in this
region, as an indirect impact of this project. The general awareness towards the importance of education
is expected to increase as a result of the new project and hence, it can be said that the project has a strong
positive impact on the level of education of the people of the study area.
Environmental and SocialImpact Assessment Report54
Section - 3 : Social & Environmental Impact Assessment
Item up to 3 kms 3 - 5 kms 5 - 10 kms Total1. Population Including Total 6225 8355 35420 50000
Male 4046 5430 22670 32146
Female 2179 3925 1275 17854
SC 855 1153 4673 6681
ST 1955 2412 11230 15597
2. Households 912 1163 4965 7040
3. Literate 1735 2210 9485 13430
a) Main workers 1113 1423 6083 8619
i) Cultivators 482 612 2628 3722
ii) Agricultural labourers 85 115 473 673
iii) Workers in household industry 85 100 433 618
iv) Other workers 485 623 2652 3760
b) Marginal workers 143 188 778 1109
Total working population (4) 1280 1638 6964 9882
4. Occupational pattern
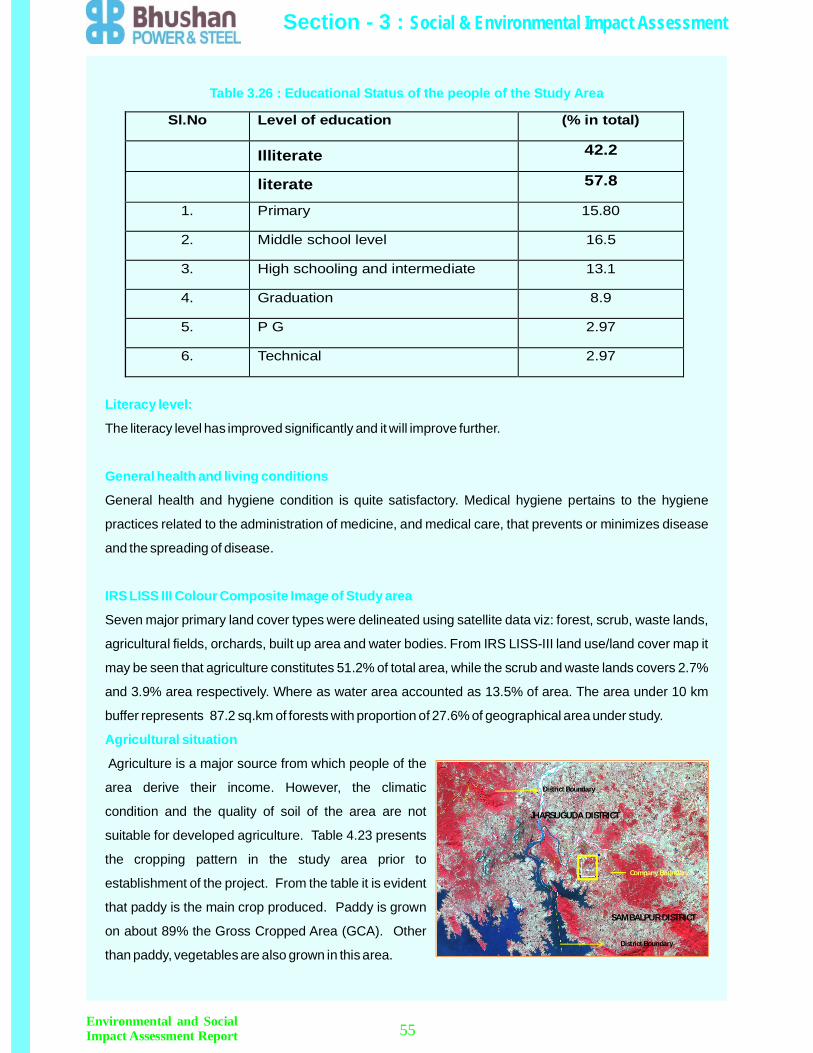
Table 3.26 : Educational Status of the people of the Study Area
Literacy level:
General health and living conditions
IRS LISS III Colour Composite Image of Study area
Agricultural situation
The literacy level has improved significantly and it will improve further.
General health and hygiene condition is quite satisfactory. Medical hygiene pertains to the hygiene
practices related to the administration of medicine, and medical care, that prevents or minimizes disease
and the spreading of disease.
Seven major primary land cover types were delineated using satellite data viz: forest, scrub, waste lands,
agricultural fields, orchards, built up area and water bodies. From IRS LISS-III land use/land cover map it
may be seen that agriculture constitutes 51.2% of total area, while the scrub and waste lands covers 2.7%
and 3.9% area respectively. Where as water area accounted as 13.5% of area. The area under 10 km
buffer represents 87.2 sq.km of forests with proportion of 27.6% of geographical area under study.
Agriculture is a major source from which people of the
area derive their income. However, the climatic
condition and the quality of soil of the area are not
suitable for developed agriculture. Table 4.23 presents
the cropping pattern in the study area prior to
establishment of the project. From the table it is evident
that paddy is the main crop produced. Paddy is grown
on about 89% the Gross Cropped Area (GCA). Other
than paddy, vegetables are also grown in this area.
Environmental and SocialImpact Assessment Report 55
Sl.No Level of education (% in total)
Illiterate 42.2
literate 57.8
1. Primary 15.80
2. Middle school level 16.5
3. High schooling and intermediate 13.1
4. Graduation 8.9
5. P G 2.97
6. Technical 2.97
Section - 3 : Social & Environmental Impact Assessment
JHARSUGUDA DISTRICT
SAMBALPUR DISTRICT
District Boundary
Company Boundary
District Boundary

Table 3.27: Cropping Pattern & Cropping Intensity
Tabe 3.28 : Crop Productivity
Employment and Income Effect
Direct employment
Indirect employment
3.5. 8
The productivity figure for paddy is found to lie much below state averages.
It is observed in the area is that the cropping intensity is quite low. This indicates backwardness of
agriculture. Scanty rainfall, scarcity of irrigation water and low quality soil permitted them to produce only a
few crops.
The operating plant of BPSL has provided substantial employment opportunities both direct and indirect
for the people around the area. Through the direct employment opportunities, huge no. of people of
surrounding areas have got the employment in BPSL Plant. Huge no of skilled, semi-skilled and unskilled
work force will be employed during construction of expansion project units.
During the construction period, the project is going to create substantial employment and income. A large
portion of these is likely to trickle down to the local people. Besides this, some persons from the study area
may get employment on permanent basis for actual operation of the plant in the form of skilled or semi-
skilled, or unskilled labour. Moreover, for regular mining activities local people may get jobs as wage
labourer. Thus, substantial amount of employment and income are expected to be generated for the local
people. Hence, it can be ascertained that the project is going to have significant employment and income
effects.
In the case of indirect employment also, the effect is quite strong and widespread. Besides direct
employment, the project is expected to generate substantial indirect employment in other sectors. So far
indirect employment is concerned, the effect is very strong and widespread specifically in mining, ancillary
industries and transport sectors. In view of the above, it can be justifiably concluded that the present
Environmental and SocialImpact Assessment Report56
Section - 3 : Social & Environmental Impact Assessment
S/N Crop Productivity (Qtl./ac.)
1 Paddy 6.8
S/N Crop Area covered in GCA(%)
1 Paddy (Wharf) 88.72 Others 11.3
100TOTAL
project has tremendous positive employment and income effects.
Overall assessment of the employment and income effects indicates that the project has strong positive
direct as well as indirect impact on employment and income generation.
The BPSL plant has already contributed in converting the place into a industrialised area. Besides other
industries which came up subsequently has also contributed towards the development of ancillary units.
These ancillary units usually have input-output linkages with the steel plants. The demand for spares,
assemblies and sub-assemblies by steel plants are generally met through the supply (of these items) from
ancillary units located nearly. This brings forth mutual advantages with one acting as complementary to
another.
Proper utilisation of these mutual advantages is expected to play a catalytic role in the development of the
region where the present project is proposed to be implemented.
The ancillary industries that are likely to come up in the vicinity of the steel plant can be grouped into three
categories, viz., spares, metal based and chemical based. These will be complemented by the service
units. This indicates that scope is there for industrialisation in the area surrounding the plant. It is important
to note that the ancillary units are usually labour-intensive and high-priority industries from social point of
view.
The proposed project is expected to foster the process of growth of small-scale industrial economy around
the steel plant complemented by the services sector. This is playing and continues to play a major role in
the further economic and social development of this area.
Study has been carried out to assess Environmental impact due to implementation of additional units
envisaged for achieving the capacity of plant to 3.0 MTPA.
The environmental assessment for the plant with units that are already operational for 2.2 MTPA
capacity is already presented in impact due to the additional units to be made fully operational are
discuss below.
3.5. 9 Industrialization around the steel plants
3.6 IMPACT ASSESSMENT DUE TO ADDITIONAL UNITS OF 3.0 MTPA EXPANSION
Additional Production units for 3.0 MTPA Expansion
Environmental and SocialImpact Assessment Report 57
Section - 3 : Social & Environmental Impact Assessment
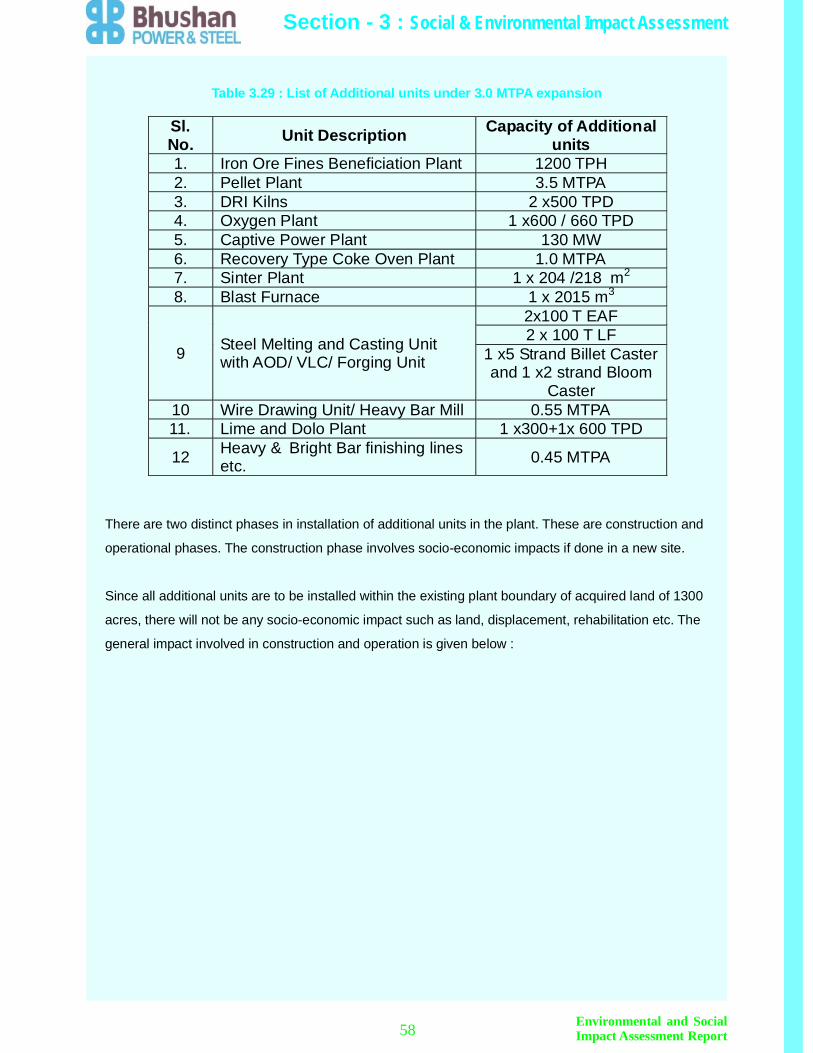
Table 3.29 : List of Additional units under 3.0 MTPA expansion
There are two distinct phases in installation of additional units in the plant. These are construction and
operational phases. The construction phase involves socio-economic impacts if done in a new site.
Since all additional units are to be installed within the existing plant boundary of acquired land of 1300
acres, there will not be any socio-economic impact such as land, displacement, rehabilitation etc. The
general impact involved in construction and operation is given below :
Environmental and SocialImpact Assessment Report58
Sl.No. Unit Description Capacity of Additional
units1. Iron Ore Fines Beneficiation Plant 1200 TPH2. Pellet Plant 3.5 MTPA3. DRI Kilns 2 x500 TPD4. Oxygen Plant 1 x600 / 660 TPD5. Captive Power Plant 130 MW6. Recovery Type Coke Oven Plant 1.0 MTPA7. Sinter Plant 1 x 204 /218 m2
8. Blast Furnace 1 x 2015 m3
9 Steel Melting and Casting Unitwith AOD/ VLC/ Forging Unit
2x100 T EAF2 x 100 T LF
1 x5 Strand Billet Casterand 1 x2 strand Bloom
Caster10 Wire Drawing Unit/ Heavy Bar Mill 0.55 MTPA11. Lime and Dolo Plant 1 x300+1x 600 TPD
12 Heavy & Bright Bar finishing linesetc. 0.45 MTPA
Section - 3 : Social & Environmental Impact Assessment

3.6.1 SOURCES AND TYPES OF ENVIRONMENTAL IMPACTS
3.6.2 ANTICIPATED ENVIRONMENTAL IMPACTS
Table 3.30: List of Additional units under 3.0 MTPA expansion
An attempt has been made to identify and list all possible aspects, which could generate significant impact
due to above additional units on different environmental attributes. Some of these impacts are insignificant
and don't warrant further analysis.
Environmental and SocialImpact Assessment Report 59
\
Units Feed &Fuels Operation Pollutants Recipient Form of
pollutionI. Construction Stage
Constructionmaterials
- DustsNoise
Air Air pollution
Slurry water Opendrain
Waterpollution
Constructiondebris
Land Landpollution
II. Operational StageCoking Australian
Coal,Coalcarbonization
Heat, DustSO2, NOXVOCs
Air Air pollution
Sinter Plant Iron orefines,Limestonefines, etc asfeed andcoke breezeand flue gasas fuel
Sintering atan elevatedtemperature
Heat, Dusts,SO2 , NOX
Air Air pollution
Noise Air Work-zonepollution
BlastFurnace
Coke, LumpIron Ore,Sinter,Fluxes andfuel gas
Hot metalmaking
Heat, Dusts,SO2, NOX
Air Air pollution
Noise Work-zone air
Work-zonepollution
Steel Meltshop
DRI, Scrap,Hot Metal,flux, Fuel
Steel makingand casting
Heat, Dusts,SO2, NOX
Air Air pollution
Noise Work-zone air
Work-zonepollution
Lime/Dolocalcining
Limestoneand fuel gas
Calcinations Heat, SO2,Dust, NOx
Air Air pollution
Heavy BarMill
Billets/Blooms fuelgas
Bars Heat, dustSO2, NOx
Air Air pollution
Noise WorkZone Air
Work ZonePollution
Section - 3 : Social & Environmental Impact Assessment
Thus objective is to identify and list only the significant impacts, which shall require detailed analysis to the
extent of decision-making purposes. The major construction activities will be of short duration and willhave very few lasting impacts. The operation will have the potential of major impacts, which has been
analyzed in detail. Based on the impacts identified, most affected environmental attributes have been
considered for detailed evaluation.
In this chapter the anticipated environmental impacts and the proposed mitigation measures for theadditional plant units of BPSLhave been described.
Impact prediction is a way of mapping the environmental consequences of the significant aspects of the
additional units. The impact assessment will focus on the additional units and will broadly cover the
following information and components:
The anticipated environmental impacts of the additional plant units are discussed below under the
following categories:
Impacts andAction plan for mitigating impact during construction
Impacts andAction plan for mitigating impact during operation.
Construction phase impact may be on land use, ground water, water quality, air quality, noise etc. These
aspects are discussed here under.
The additional plant units will be located within the existing plant boundary. Accordingly, most of the
construction activity will be limited within the existing BPSL plant premises and in the already levelled uparea. No large-scale excavation, soil erosion, loss of topsoil is expected. Moreover, plant site is already a
fairly well developed area with all sorts of infrastructure already available. It is therefore most unexpected
that influx of construction labour is going to change present land use pattern. Based on the construction
approach and well established infrastructure the impacts will be localized, minor, short term and limited to
construction phase
Assessment of physical effects will be covered for all phases including location, design, construction,
operation and possible accidents.
Estimation by type and quantity of expected contaminants, residues, and emissions (air, water,
noise, solid wastes) resulting from the operation of the these units.
•
•
•
•
Impacts andAction plan for mitigating impact during construction
Impacts3.6.2 LAND USE
Environmental and SocialImpact Assessment Report60
Section - 3 : Social & Environmental Impact Assessment

3.7 ACTION PLAN FOR MITIGATING IMPACT
3.7.1 AMBIENTAIR QUALITYImpacts
Action plan for mitigating impact
No significant impact envisaged due to addition of few plant units.
The construction and associated activities of additional plant units will lead to emission of different
pollutants in magnitude only. During the construction phase, Particulate Matter (PM) will be the main
pollutant. However, as already mentioned, the major part of proposed units will be carried out within the
premises of an already existing operating plant having all infrastructural facilities, and as such no large-
scale construction activity covering a large area is expected. Therefore the particulate matter emission will
not be much and will be localized only. However insignificant quantity of gaseous pollutants like SO2, NOx,will be added to the ambient air due to vehicular movement associated with this construction phase.
Gaseous emissions from construction machineries and vehicles will be attempted to be minimized by
enforcing strict emission monitoring system for the suggested mitigation measures. The impact will be
confined within the specific plant area where the proposed units in plant is taking place and is expected to
be negligible outside the plant boundary. Further, the impact of such activities will be temporary and will be
restricted to the construction phase only.
During the construction period the impacts that are associated with the air quality are:
The following mitigation measures will be employed during construction period to reduce the pollution
level to acceptable limits.
Deterioration of air quality due to fugitive dust emissions from construction activities (especially
during dry season) like excavation, back filling and concreting, hauling and dumping of earth
materials and from construction spoils.
Generation of pollutants due to operation of heavy vehicles and movement of machineries and
equipment for material handling, earth moving, laying of sands, metal, stones, asphalt, etc.
Proper and prior planning, appropriate sequencing and scheduling of all major construction activities
will be done, and timely availability of infrastructure supports needed for construction will be ensured
to shorten the construction period vis-à-vis reduce pollution.
Construction materials will be stored in covered godown or enclosed spaces to prevent the wind
blown fugitive emissions.
•
•
•
•
Environmental and SocialImpact Assessment Report 61
Section - 3 : Social & Environmental Impact Assessment
•
•
•
••
•
•
•
•
•
Stringent construction material handling / overhauling procedures will be followed.
Truck carrying soil, sand, stone dust, and stone will be duly covered to avoid spilling and fugitive
emissions.
Adequate dust suppression measures such as regular water sprinkling at vulnerable areas of
construction sites will be undertaken to control fugitive dust during material handling and hauling
activities in dry seasons.
The construction material delivering vehicles will be covered in order to reduce spills.
It will be ensured that all construction equipment and vehicles are in good working conditions,
properly tuned and maintained to keep emission within the permissible limits and engines turned off
when not in use to reduce pollution.
Vehicles and machineries would be regularly maintained so that emissions confirm to standards of
Central Pollution Control Board (CPCB), New Delhi.
Monitoring of air quality at regular intervals will be conducted during construction phase.
Quality of wastewater emanating from the construction site will be controlled through the existing
drainage system with sediment traps for arresting the silt / sediment load before its disposal.
All the washable construction material will be stored under sheds or enclosed space by fencing it with
brick or earth in order to prevent spillage into the drainage network, so that the same does not find its
way into the surface water runoff.
No water will be let out. All the water generated will be utilized for afforestration, sprinkling and other
activities within the plant premises.
The impacts on water quality during construction phase mainly arise due to site cleaning, levelling,
excavation, storage of construction material etc.A levelling and excavation activity normally increases the
level of suspended solids in the surface water runoff. However, for the Coke oven complex, sinter plant
and blast furnace complex, Steel Melt Shop, Heavy Bar Mill, Lime & Dolo Plant, no large scale levelling is
required since the these units will be established in already existing site. Excavation will be limited.
3.7.2 WATER QUALITY (SURFACE WATER)Impacts description and analysis
Action Plan for mitigating impact
Environmental and SocialImpact Assessment Report62
Section - 3 : Social & Environmental Impact Assessment

3.7.3 WATER QUALITY (GROUND WATER)
3.7.4 AMBIENT NOISE LEVEL
Impacts description and analysis
Mitigation Measures
Impacts description and analysis
Action Plan for Mitigation
Ecological EnvironmentImpacts description and analysis
The proposed additional units will be limited within an existing plant. The plant is already having all
infrastructure facilities including water supply. The water requirement during the construction phase will be
low and will be met from the already existing water supply facilities. Thus no ground water extraction is
envisaged. Therefore, it is most unlikely that construction phase will bring any modification in the groundwater regime of the area. Therefore, the construction phase of the proposed reconfiguration of few plant
units will have no impact on the ground water.
No impact envisaged on ground water regime due to additional units.
Major sources of noise during the construction phase are vehicular traffic, construction equipment etc.
The operation of the equipment will generate noise level ranging between 45 to 80 dB (A). However this
noise level will be near the source only and is expected not to create any noise pollution problem at far offdistances and outside the plant premises. The noise generated during the construction phase from
different equipments may have some adverse impact on the operators.
Protective gears (PPE) such as earplugs, earmuffs etc will be provided to construction personnel exposedto high noise levels as preventive measures and will be strictly adhered to minimize / eliminate any
adverse impact.
It will be ensured that all the construction equipment and vehicles used are in good working condition,
properly lubricated and maintained to keep noise within the permissible limits and engines tuned off when
not in use to reduce noise.
The additional plant units shall be located within the existing steel plant, will remain within 1300 acres of
land transferred by government of Orissa to BPSL. The area involved is small comparison to study area
and hence the impacts on the study area as a whole will be insignificant.Based on vegetation distribution and presence of no sensitive habitat or rare, threatened or endangered
species, removal of vegetation will not constitute any impact.
Environmental and SocialImpact Assessment Report 63
Section - 3 : Social & Environmental Impact Assessment
Action Plan for MitigationNo impact envisaged
Impact Description andAnalysis
mploymentImpact Description andAnalysis
3.8 Emission toAir Environment
3.7.5 CONSTRUCTION WASTE
3.7.6 E
Construction activities will generate significant quantities of solid waste. This mainly comprises materialscraps, debris from site clearance, excavation, construction, demolition and road works. Construction
Waste can be divided in to two categories
Non-inert construction waste is made-up of approximately 25 percent of the total construction waste, and
usually comprises paper, plastic, timber, electrical wire, vegetation, packaging waste and other organicmaterials. Some of these can be recycled, while others are disposed of at landfills.
In contrast, inert waste - otherwise known as public fill - mainly includes construction debris, rubble, earth,
bitumen and concrete, which can be used for land formation. Materials like concrete and asphalt can also
be recovered for construction use. BPSL has arrangement in place for waste to be collected on a regular
basis for disposal service.
The construction phase will have a significant positive effect on the economy of local area in terms of
increased direct and indirect employment. There will be a significant increase in the demand for both
skilled and unskilled labour. Additionally there will be a significant increased demand for a wide range ofsupplies and services.
The impact of employment levels will be distributed widely as the construction site workforce will originate
from the wider local area. Increased indirect employment by businesses providing sales and services will
also be widely distributed.
The positive socioeconomic impact of increased direct and indirect employment will be significant and will
continue for the duration of construction activities.
Over all there will be positive impact.
Impacts &Action Plan for Mitigation during Operation Phase
The additional plant units will only process raw materials.
The air pollutants are generated at different stages of production in these plant units. Air pollutants may be
particulate matter, sulphur dioxide, oxides of nitrogen, etc. These pollutants may be released as point
source or fugitive emission.
Inert construction waste
Non-inert construction waste••
Environmental and SocialImpact Assessment Report64
Section - 3 : Social & Environmental Impact Assessment

Methodology of ImpactAssessment
Impact Discussion
The proposed addition of few plant units of 3.0 MTPA integrated steel plant will have very less impact onthe air environment. While the impact of fugitive emissions will be within the short distance, the effect of
emissions from the point sources will marginally have impact on the ambient air quality in the surrounding
area.
For assessment of expected air emissions from the proposed units the basic assumption followed are:
The air pollution load emitted from the existing stacks (2.2 MTPA production) of BPSL is reflected in the airpollutants concentration in the ambient air quality.
In order to compute the impacts due to change in pollution load, contributions from the additional units
have been added onto the emission load calculated. Three sets of computation been carried out to predict
the overall impacts.
The atmospheric dispersion modelling and the prediction of ground level pollutant concentrations has
great relevance in the following activities:
Estimation of Ground Level Concentration (GLC) and its location in the study area:
The prediction of Ground level concentrations (GLC) of pollutants emitted from the major process stacks
of BPSL have been carried out using ISCST-3 Air Quality Simulation model released by USEPA which is
also accepted by Indian statutory bodies. This model is basically a Gaussian dispersion model whichconsiders multiple sources. The model accepts hourly meteorological data records to define the
conditions of plume rise for each source and receptor combination for each hour of input meteorological
data sequentially and calculates short term averages up to 24 hours. Stability has been computed by
Turner's method and mixing height is estimated for the study area from the "Spatial distribution of hourly
mixing depth over Indian region" published by Central Pollution Control Board (CPCB) and used fordispersion modelling studies.
In the present case, BPSL is proposing to add few of the plant units under expansion to 3.0 MTPA.
Accordingly, sources and emitted pollutants are a straightforward addition, which can be directly used as
source data input in the ISCST-3 model to assess the change in contribution of pollutants to the
background from the proposed expansion.
Stack emission details are estimated based on the actual measured data for the units that are alreadyoperating and similar design units have been proposed to be added under expansion. For the completely
new units, the design data as furnished by Equipment / Technology suppliers have been considered.
Meteorological data of the project site is another input required for computation of the contribution by the
proposed additional units.
To predict the impact of additional units and to study the impacts due to change in pollution load,
contributions in general from the change units have been added to the existing back ground
concentrations and predictions done accordingly.
Environmental and SocialImpact Assessment Report 65
Section - 3 : Social & Environmental Impact Assessment

3.9 GROUND LEVEL CONCENTRATION (GLC)
Table 3.31 : Stacks & Emission Details of additional Units over 2.2 MTPA Plant
The emissions are estimated and the details of the proposed additional units stacks and emissions fromthem are given inTable-
Stability has been computed by Turner's method and mixing height has been obtained from literature.The
predicted maximum GLC values have been provided at Table 3.34.
The change in pollution loads due to additional units of the plant are given in the below Table 3.33: The
change in Pollution Load (g/s)
Environmental and SocialImpact Assessment Report66
Section - 3 : Social & Environmental Impact Assessment
NOx
1 Coke Oven - Stack 120 4 141000 5.20 220
2 Sinter Plant - ChargingStack
3 Sinter Plant DedustingStack
4 BF Stove Stack 50 3.5 180000 10.00 300
5 BF Cast House DedustingStack 35 3 300000 12.00 30
6 BF Stock HouseDedusting Stack 35 3.5 400000 12.00 35
7 Pellet Plant 90 3 300000 14.16 858 DRI Process Stack-11 75 2 120000 15.06 1509 DRI Process Stack-12 75 2 120000 15.06 15010 DRI Process Stack-13 75 2 120000 15.06 15011 DRI Process Stack-14 75 2 120000 15.06 15012 DRI Kiln-11&12 35 2.5 300000 18.40 5013 DRI Kiln-13&14 35 2.5 300000 18.40 50
14 EAF+LF Fume ExtractionStack-II 60 2.75 272000 16.35 110
15 Wire Drawing Mill 50 2 55000 9.35 95
16 Heavy Bar Mill/Bright BarMill 50 2 45000 9.00 95
17 Power Plant CFBC-III(350tph) 120 4 660000 20.22 140
18 Lime Plant 50 2 90000 10.00 10035.94
1.91 7.8 5.8
S/N Description of StackAttached to
StackHeight
(m)
StackDia(m)
Flow Rate(Nm3/hr)
Exitvelocity(m/sec)
Temp CEmission Rate (g/sec)
PM SO2
4.20 0 0
85 5
400000+
250000=
13.45 163 9.02 5.56 3.8
0.75 2.5 1.5
5.50 0 0
4.60 5 6.91.67 20 01.67 20 01.67 20 01.67 20 04.17 0 04.17 0 0
3.78 0 0
0.46 0.25 1.15
0.45 0.25 1.15
9.17 23.83 13.75
1.25 0.6 1.89Total load g/s 56.11 125.79

Table 3.32 : Maximum Resultant GLC's at monitoring stations (in µg/m )3
3.10 WASTE GENERATION AND DISPOSAL
3.11 NOISE LEVELS
Note :AllGLCvaluesare in µg/m3
During the design phase all efforts have been made to adopt latest state of art technology and to install
adequate pollution control measures for different process and de-dusting stacks. During the construction
phase of the proposed expansion appropriate mitigation measures will be implemented to ameliorate the
anticipated air quality problems. The following mitigation measures will be employed during operationperiod to reduce the pollution level to acceptable limits.
Impacts description &Analysis
The comparative waste generated from different additional units and 2.2 MTPA operating units of steel
complex and its re-utilisation and disposal is given in section 3 with elaborate description of wastemanagement system being practiced for 2.2 MTPA and efficient waste management team to take care of
expansion 85% of wastes generated / to be degenerated will be recycled / reused and only 15% of waste
will require dumping as per fool proof system and in environment friendly manager.
Impacts description & analysis
During normal operations of the plant ambient noise levels may increase close to the machines but this will
be confined only within steel complex boundary and that too will be confined within shops.
The noise level within the plant boundary is occupational noise levels and confined within shops. The
noise level are further minimized when the noise reaches the plant boundary and the nearest residentialareas beyond the plant boundary. The elaborate green belt developed will further attenuate the noise level
and fugitive emission.
All the equipment in the reconfigured units will be designed/operated in such a way that the noise level
shall not exceed 85 dB (A).
However, if during operation, sometimes the noise level exceeds the norms due to breakdowns then the
protective measures given in Environmental Management Plan will be followed.
Environmental and SocialImpact Assessment Report 67
Section - 3 : Social & Environmental Impact Assessment
PM10 PM2.5 SO2 NOx PM10 PM2.5 SO2 NOx PM10 PM2.5 SO2 NOx
A1 BrundamalVillage 28 16 12 93 4.15 1.75 1.7 4.4 32.15 17.75 13.7 97.4
A2 SirpuraVillage 34 21 13 115 4.15 1.75 1.7 4.4 38.15 22.75 14.7 119.4
A3 GumkarmaVillage 31 14 11 94 4.15 1.75 1.7 4.4 35.15 15.75 12.7 98.4
A4 BamloiVillage 36 16 12 96 4.15 1.75 1.7 4.4 40.15 17.75 13.7 100.4
A5 LapangaVillage 30 20 11 103 4.15 1.75 1.7 4.4 34.15 21.75 13.7 107.4
A6 LandupalliVillage 18 10 10 85 4.15 1.75 1.7 4.4 22.15 11.75 11.7 89.4
A7 ThelkoloiVillage 39 22 12 118 4.15 1.75 1.7 4.4 43.15 23.75 13.7 122.4
A8 KandagarhVillage 22 11 12 81 4.15 1.75 1.7 4.4 26.15 12.75 13.7 85.4
LocationMonitored Ambient Air
Quality (2.2 MTPA)Predicted GLCs due
to Additional unitsResultant GLCs(Predicted
at 3.0 MTPA)S/N
In addition to it, green belt development around the shops is to be done to minimise propagation of noise to
nearby areas.
Various measures proposed to reduce noise pollution include reduction of noise at source, provision of
acoustic lagging for the equipment and vibration isolators, selection of low noise equipment, and isolation
of noisy equipment from working personnel. In some areas where due to technological process, it is notfeasible to bring down the noise level within acceptable limits of 85 dB (A) (at 1.5 m from source),
personnel working in these areas will be provided with noise reduction aid such as ear muffs/ ear plugs and
also the duration of exposure of the personnel will be limited as per the norms.
In a steel plant, with a variety of noise producing equipment, it may not be practicable to take technologicalcontrol measures at all the places. In such cases the following administrative measures shall be taken:
Over and above all these adopted measures, thick green belt existing surrounding BPSL plant premiseswill further attenuate the sound levels reaching the receptors within and outside the plant premises.
Working operation of expanded plant unit is cumbersome and negligence in plant operations may cause
risk to safety and health problems.
Reducing vibration of high speed rotating machines by regular monitoring of vibration and takingnecessary steps.Design of absorber system for the pulpit operator's cabin.
All the equipment in different new units be designed/operated in such a way that the noise level shallnot exceed 85 dB (A) as per .Periodical monitoring of work zone noise and outside plant premises
Un-manned high noise zone will be marked as "High Noise Zone".
In shops where measures are not feasible, attempts shall be made to provide operators with
soundproof enclosure to operate the system.
Workers exposed to noise level will be provided with protection devices like earmuffs as per present
practice and will be advised to use them regularly, while at work.
Workers exposed to noisy work place shall be provided with rotational duties.
All workers will be regularly checked up medically for any noise related health problem.
Impact
Action Plan for Mitigation
Action Plan - Technological Measures
Action Plan - Management Measures
3.12 OCCUPATIONAL SAFETY AND HEALTH
•
••
•
••
•
•
•
Environmental and SocialImpact Assessment Report68
Section - 3 : Social & Environmental Impact Assessment

Action Plan for Mitigation
Action Plan - General Measures
Action Plan - House Keeping
3.13 onclusionC
Company has already setup a dispensary within the plant fully equipped with basic first aid materials. Alsotwo doctors, pharmacists and assistance staff has been engaged for round the clock service. Pre-joining
medical examination and periodic health checkups of all the employees as well as contractual workers are
done in the dispensary. For ensuring better occupational health and safety the following measures will be
provided:
Based on the environmental monitoring for dust, gases, fumes, noise & vibration, the workersexposed to these will be regularly checked in medical unit and results will be intimated tomanagement.
Proper housekeeping is the key to proper environmental management. This creates proper working
environment for the work force and safe working conditions. BPSL has taken up a massive drive for
improving the house keeping conditions. Initial results have been encouraging. However efforts are on to
improve the condition further. However, for the proposed project the following good housekeeping
measures will be adopted:
A. For Present operating Plant ( 2.2 MTPA)
Proper control of fugitive dust/fumes from sources inside complex including fumes etc and to keep allscrubbing systems in perfect conditions. Keeping ventilation systems of premises in perfect workingorder to avoid accumulation of fumes within shop floor.
Keeping air conditioning plants in perfect running conditions for control/instrumentation rooms.
Workers exposed to noise prone areas will be medically checked and proper noise protectiveequipment will be supplied to them and will be encouraged to use the same.
More doctors in plant medical unit will be additionally trained in the field of occupational health aspolicy matter.
Regular cleaning of shop floors
Avoiding accumulation and dumping of wastes and damaged equipment and items anywhere insidethe plant affecting aesthetics.
Developing a positive outlook in the employees for keeping the work place, both in factory, office orlaboratory, clean and well maintained.
Maintaining hygienic conditions in areas like canteens, near drinking water sources and toilets.
On the basis of the overall results of the present impact assessment the following conclusions are drawn:
•
•
•
•
•
••
•
•
Environmental and SocialImpact Assessment Report 69
Section - 3 : Social & Environmental Impact Assessment

i) The ambient air quality around the steel plant indicates the level of particulate matter (PM), SO2, NOx,OS) well within the national and international norms/ standards.
ii) The level of noise outside the plant boundaries, work zone noise indicate very satisfactory parametersin comparison to permissible national and international norms
iii) The parameters of surface water quality and ground water quality indicated in the tables in the chapteralso conforms to national and international standards.
iv) The soil characteristics indicate no sign of any degradation in respect of nutrients and micro nutrientsvalues.
v) The stack emissions parameters for PM, SO2, NOx from all operating process and dedusting stacks ofdifferent operating units including power plant are also well within the national and internationalnorms.
vi) The most important area of steel plant operations in respect of environment control is wastemanagement. The waste management of BPSL as in place now for the operating plants is strictly asper the guidelines of regulatory authorities and in line with the international guidelines. The dumpingsite is being monitored by inspecting statutory authorities regularly. The other wastes are also meetingthe regulations and standards.
vii) Effluent and waste water discharge is fully meeting the Zero discharge concept of the plant and allprocess effluents including surface runoff and storm water are treated in ETP/ WWTP in the wastewater treatment plant.
viii) The ecology of the area does not reveal any adverse impact on flaura and fauna and on vegetations.
ix) The socio economic impact study of the area has reveled progressive growth in direct and indirectemployment opportunities, improvement in the socio-economic condition of the surrounding areapeople, improvement in the level of education, general improvement in health and hygiene conditionsetc.
x) The people in general have expressed satisfaction and happiness due to rapid industrialization of theirarea and general improvement in their earning capacity and availability of facilities required for dailylife.
Xi) The CSR initiative of the company is providing development to the surrounding. Regular consultationwith the people,effective platform for any grievance redressal.
B. For 3.0 MTPA expansion
The following conclusion is drawn for the Social & Environment impact for the existing operating plant and
likely impact under expansion.
The assessment of impact due to installation of additional units in the present environment
reveals that there will not be any adverse impact on the environment in anyway. The main reasons
for this prediction is due to introduction of latest technologies of world standard such as Sinter
Plant, Blast Furnace, Coke Oven & by Product etc.and the advantages to be derived in terms of
saving in fuel consumption, electricity generation with CDQ, TRT, reduction in CO etc. have been
elaborated in chapter 04. Substantial advantages will be derived due to reduction in DRI
·
2
Environmental and SocialImpact Assessment Report70
Section - 3 : Social & Environmental Impact Assessment
requirement for Steel production due to availability of hot metal with 2nd Blast Furnace of 2015 m .
The steel production of 3.0 MTPA can be achieved with 75% hot metal charge in EAF bringing
about more than 40% reduction in Electricity consumption. The resultant benefits will be
substantial reduction of CO in the Environment.
With the commissioning of 1.0 MTPA recovery Coke Oven battery, BPSL will be almost self
sufficient in terms of internal generation of fuel except for torch cutting etc. bringing financial
saving of about Rs. 700 Crores per year to be spent on purchased fuel. This will also bring
substantial reduction in CO emission.
The zero discharge concept of water from inception controls all aspects of water management in
the plant as discussed in Section 3.
The waste management especially the solid waste management is fully meeting the National
and International norm. The present environment management team with minor strengthening
can fully meet the requirement of the expanded plant based on the current technique and system.
The green belt development which is a continuous effort of BPSL and positive socio-economic
consideration are effective and expected to strengthen with joint co-operation of all stake holders.
The Corporate Social Responsibility (CSR) of BPSL is satisfactory and long term action plan
when implemented will further improve socio-economic level of the surrounding area.
3
2
·
·
·
·
·
2
Environmental and SocialImpact Assessment Report 71
Section - 3 : Social & Environmental Impact Assessment

4.1 NATIONAL ENVIRONMENTALMANAGEMENT FRAMEWORK
4.2 POLICY AND PLANNING FRAMEWORK
India's framework for environmental management is shaped by several policy documents; strategicplans and; laws and regulations and institutions. These are summarised as follows:
The Government of India regulates the environmental management system in the country through specificlegislations.and is responsible for ensuring environmental compliance by project promoters include:
inistry of Environment & Forests (MOEF).
The Ministry of Environment & Forest is the Statutory Body of Government of India who issues clearances
for setting up any project after due examination of the project proposal. The ExpertAppraisal Committee of
MOEF clears the project after examination of the proposal with regards to environmental implications and
commitments made by the project proponent towards meeting the environmental and social guidelines
laid by the Ministry. The ministry of Environment & Forest while issuing the approval / clearance to any
project specially projects for Iron & Steel Manufacturing indicates detail conditions for compliance by
project proponent for protecting the environment in all aspects i.e. Air, Water, Soil & Noise as well as
guidelines for social aspects..
There are comprehensive steps elaborated by MOEF through EIA Notification for grant of environmental
clearance.The essential steps are indicated below
i. Approval of Terms of Reference by Expert Appraisal Committee of MOEF after due examination of
project proposal in regards to likely impact of the industry on the environment.
ii. Preparation of ESIA/EMP report by reputed independent environmental Agency/Consultant after
conducting field study and collection of various data to establish the background environmental
scenario for a minimum period of 3 months.
iii. Submission of the EIA/EMP report by project proponent to MOEF and State Pollution Board for
examination and approval.
iv. After approval State Pollution Control Board conducts public hearing at the site where all people of the
adjoining area raise their concern relating to socioeconomic issues including rehabilitation &
resettlement, health, safety, environment etc. The public hearing proceeding are videographed by the
officials of SPCB.
v. The District Collector further prepares the conclusion of public hearing with respect to recomendibility of
the project.
MOEF as apex regulatory authority which monitors the compliances of environmental conditions through
its regulatory arms such as.
Central Pollution Control Board (CPCB) &
State Pollution Control Board (SPCB).
·M
·
·
Environmental and SocialImpact Assessment Report72
Section - 4 : Social & Environmental Standard

Table 4.1 : International Conventions and Treaties
4.3 LEGISLATIVE FRAMEWORK
4.4 Other codes and guidelines
The following acts, laws, rules, guidelines and their amendments time to time are applicable for the steel
plant under the study:
1. EIA Manual published by Ministry of Environment & Forests, January 2001 and subsequent
amendment in September, 2006.
2. IS Codes & CPCB Guidelines for Monitoring &Analysis ofAir, Water, Soil, etc.
3. General Environmental, Health, and Safety Guidelines of IFC
4. Environmental, Health, and Safety Guidelines of IFC for Integrated Steel Mills
1. Notification by MOEF on revisedAir Water quqlity standards published in March 2012.
2. Environmental (Protection)Act, 1986 andAmendments.
3. TheAir (Prevention & Control of Pollution)Act, 1981.
4. The Water (Prevention & Control of Pollution)Act, 1974.
5. The Forest ConservationAct, 1980.
6. The Noise Pollution (Regulation and Control) Rules 2000.
7. Manufacture, storage and Import of Hazardous Chemical Rules, 1989
8. SMPV Rules, 2002
9. Gas cylinder Rules, 2004
10. Hazardous Wastes (Management, Handling and Transboundary Movement) Rules, 2008
11. Bio-medical wastes (Management, Handling) Rules, 2011
12. Public Liability InsuranceAct, 1991
13. India Boiler Regulation, 1950
14. ElectricityAct, 2003 and Indian Electricity Rules, 1956
15. Petroleum Rules, 2002
16. Motor VehiclesAct, 1958
17. FactoriesAct, 1948 and Orissa Factories Rules, 1950
Section - 4 : Social & Environmental Standard
Environmental and SocialImpact Assessment Report
73
Sl
No.
Policies /Plan Status
1. United Nation Convention on Biological
Diversity(UNCBD)
Signed in 1992, Ratified in 1994
2. United Nations Framework Convention on
Climate Change (UNFCC)
Signed in June 1992 Ratified in 2001

4.5 IFC
IFC Performance Standard 1- Assessment and management of Environmental and Social risks
and impacts
IFC Performance Standard 2- Labour and working condition
IFC Performance Standard 3- Resource Efficiency and Pollution prevention
IFC Performance Standard 4- Community Health, Safety and Security
PERFORMANCE STANDARDS ON ENVIRONMENT AND SOCIAL SUSTAINABILITY
Environmental and Social Impact assessment has been carried out refer Section 3 and Section 5 of this
report.
Labour and working condition for any industry in India is governed by India Factories Act, Provident Fund
Act, Labour Laws etc.BPSL as a fair and reasonable employer has promoted a working environment
where fair treatment, non-discrimination and equal opportunity of the worker are the main pillar. BPSL has
endeavored to maintain congenial worker management relationship by providing safe and healthy
working conditions. The benefits as provided in the labour laws and other related employee benefits
scheme are provided to all workers including the worker engaged by third parties. As a policy BPSLdo not
employ child labour. With this positive view taken by BPSL the management employee relation is highly
satisfactory without any business disruption in near past.
BPSL has taken effective and meaningful steps for optimizing the utilization of resources for improving
efficiency as regards consumption of material inputs, energy, water etc. by recycling wastes and hot
gases. In the proposed expansion program for achieving 3.0 MTPA finished steel efficient technologies
have been selected from abroad for reducing consumption of fuel and coke (Refer Section 1 Introduction
of the report)
BPSL has selected equipment and ensured plant operation in an environment friendly manner to keep
release of pollutants in the atmosphere well within the permissible limits as envisaged in IFC guidelines,
limits prescribed by Central Pollution Control Board and Ministry of Enviroment and Forest, Govt. of India.
The plant is operated as a zero discharged plant and no pollutants are released in stream, river or other
natural outlets (Refer Social and Environmental ImpactAssessment Section 3 of this report).
BPSL has in place elaborate safety system for ensuring safety and health of the workmen during the
construction stage of the project and during the project lifecycle.
BPSLhas also brought the population around the plant in its ambit of healthcare programme by organizing
health camps and providing potable drinking water. Populations around the plant are also provided
emergency medical care from the plant medical centre.
BPSL has formulated an elaborated onsite emergency preparedness plan to deal with the possible
emergencies which may strike the plant site. A well equipped fire station is functioning round the clock to
deal with any plant fires. The fire station also renders help to put out fire in neighboring areas of the plant.
Environmental and SocialImpact Assessment Report74
Section - 4 : Social & Environmental Standard
IFC Performance Standard 5- land acquisition and involuntary settlement
Performance Standard-6- Biodiversity conservation and sustainable management system.
Performance Standard-7- Indigenous People.
Performance Standard-8- Cultural heritage
About 1304 acres of land was acquired by Orissa infrastructure development corporation Govt of Orissa
and handed over to BPSL for construction of this plant. The proposed expansion of the plant for achieving
the capacity of the plant to 3.0 MTPA will be executed within the acquired land and no additional land
needs to be acquired. As per the assessment of earlier impact study made after the land was taken over
several measures were taken to rehabilitate the project displaced families by providing alternative
accommodation, employment in the project, cash compensation. A proper rehabilitation center already
exist with all social amenities, which were created by BPSL by providing electricity, establishment of
school, development of roads and sanitation facilities as per guidelines of state authorities (refer section 3
of the report).
A grievance mechanism is in place and functioning to mitigate the grievances of the people around the
plant. The mechanism ensures general public and the stakeholders to lodge complaints/ suggestions in
respect to the companies operation which affect their livelihood. The complaints received are promptly
addressed to the satisfaction of the complainant.
To address the grievances of the villagers in the peripheral villages, the district administration has formed
a rehabilitation and periphery development advisory committee for the company. Representative of all the
peripheral villages, district administration and the company are members of this committee. This
committee meets once in a year. All grievances of different villages are deliberated in this forum and
necessary course of action by the company are decided. The company also delivers its action plan
regarding various CSR activities.
BPSL has taken effective measures to protect and conserve the bio-diversity in the plant area and has
promoted sustainable management of living natural resources by adoption of practices which integrate
conservation needs and development. The company has started plantation programme for enriching
ecology and vegetation in and around the plant. A wide green belt has been established all along the
boundery. The tree covers as well as the green belt developed improved the ecological balance of the
area.( refer section 3 of this report).
The land acquired for the plant was thinly populated and was not inhibited by any indigenous people.
The project site was a barren land without any building or structure which to be protected legally. The land
was also not a legally protected cultural heritage area.
Environmental and SocialImpact Assessment Report 75
Section - 4 : Social & Environmental Standard

4. 6 IMPLICATIONS OF EIANOTIFICATION
4.7 STATUTORY CLEARANCES
Table 4.2 : Environmental Clearences
Table 4.3 : Consent to establish
Ministry of Environment and Forests (MOEF), Environmental Impact Assessment (EIA) Notification 1994
and its subsequent amendments in 2006, deal with steel plant related to expansion work, including
modification /alteration in capacity etc. As per the above notification and its amendment of 14 September
2006. Approval/ Clearance of MOEF is required to be obtained before start of project activities at site. This
is required to be done through detailed Environment
th
Assessment Report to be prepared by accredited
agency and submitted to MOEF by Project Proponent.
As stated above the integrated steel plant is being setup in phased manner and accordingly
Environmental Clearance was obtained from Ministry of Environment and Forests, New Delhi in phased
manner as per details described below
Application for obtaining Environmental Clearance for expansion from 2.8 to 3.0 MTPA has been
submitted and the expansion proposal has been cleared by the Expert Appraisal Committee of MOEF on
14 June 2012.The Environmental Clearance letter is likely to be issued within a short period of time.
Similarly Consent to Establish / NOC was obtained from Orissa State Pollution Control Board (OSPCB)
phase wise as described below
Forest Clearance from Ministry of Environment & Forest, Government of India was obtained prior to
startup of this project in the year 2005 vide letter no. 8-58/2004-FC dated 26.05.2005.
Permission for drawl of 100 cusec water from the back water reservoir of Hirakud Dam was obtained from
th
Environmental and SocialImpact Assessment Report76
Section - 4 : Social & Environmental Standard
Sl. No. Description Letter No. & Date
1 Environmental Clearance obtainedfor 1.2 MTPA
J-11011/228/2003 - IA II dated12.05.2004.
2 Environmental Clearance obtainedfor expansion from 1.2 to 2.2 MTPA
J-11011/372/2006 - IA II (I) dated29.03.2007
3 Environmental Clearance obtainedfor expansion from 2.2 to 2.8 MTPA
J-11011/40/2009-IA II (I) dated02.04.2010
Sl. No. Description Letter No. & Date
1Consent to Establish / NOC obtained for1.2 MTPA
31948/IND/II/NOC/2049dated 05.11.2004
2 Consent to Establish / NOC obtained forexpansion from 1.2 to 2.2 MTPA
24551/IND/II/NOC/4041dated 05.10.2006
3 Consent to Establish / NOC obtained forexpansion from 2.2 to 2.8 MTPA
17172/IND/II/NOC/5265dated 20.10.2010

Department of Water Resource, Government of Orissa vide letter no. 20562/WR/Irr-II-Misc-1/2000 dated
17.06.2003.
India's regulatory institutions have published environment standards that must be complied as per
Act/Rule. Further MOEF/CPCB have also published various guidelines on Corporate Responsibility for
Environment Protection (CREP) which are in addition to the Acts & Rules and needs to be monitored by
Regulatory Authorities such as CPCB/OSPCB. Indian Environment Act and Guidelines has specified all
essential parameters which are critical to general health and safety of the people surrounding the project.
The International Standards and Norms for Environment has identified all the possible elements ofemission / discharge with respect toAir, Water, Soil & Noise.
Like any progressive and visionary project proponent, BPSL always aims at sustainability of plant
operation without any hindrance which may occur due to changing environmental norms in foreseeable
future. In view of this, the company BPSL always selects technology which is of world standard and will be
able to meet international guidelines. For example the regulatory norm for particulate matter in ambient air
in India as per law is 100 mg/Nm but BPSL has selected technologies of current expansion from world
leaders with all the latest technologies towards environmental control which will ensure particulate matter
to level of < 50 mg/Nm . All the technologies as indicated below with ESP & Bag Filters will not allow
emission level beyond 50 mg/Nm .
Base technologies are key to environment control and if not adopted at the project & design stage, the
results will not be satisfactory even with stringent Regulations.
Keeping this is view, BPSL has incorporated all measures to meet the environment parameters, meeting
to IFC guidelines value and in line with the frame work of the Equator Principles even if it is not specified in
the present Indian EnvironmentAct/ guidelines but may come up in due course of time
3
3
3
4.8 International Environment standards and Prevailing Standards in India.
Environmental and SocialImpact Assessment Report 77
Section - 4 : Social & Environmental Standard

4.8.1 Comparison amongst performance standards of IFC, MOEF India, CPCBand BPSL
Environmental and SocialImpact Assessment Report78
Table 4.4 : Air Emission Levels for Integrated Steel Mills
Section - 4 : Social & Environmental Standard
Pollutant Units IFC GuidelineValue CPCB/MOEF BPSL
Particulate Matter mg/Nm3 20-50a 50 <50
Oil Mist mg/Nm3 15 NI
NOX mg/Nm3 500, 750 (coke oven) 150 for Cokeoven
151 & 500 forCoke oven
SO2 mg/Nm3 500 500 500VOC mg/Nm3 20 NI 20PCDD/F TEQ/Nm3 0.1 NI
Carbon Monoxide(CO) mg/Nm3 100 (EAF) 300 (coke
oven) NI 1%
Chromium (Cr) mg/Nm3 4 NI 4Cadmium (Cd) mg/Nm3 0.2 NI 0.2Lead (Pb) mg/Nm3 2 NI 2Nickel (Ni) mg/Nm3 2 NI 2Hydrogen Chloride(HCL) mg/Nm3 10 NI 10
Fluoride mg/Nm3 5 NI <5Hydrogen Fluoride(HF) mg/Nm3 10 NI <10
H2S mg/Nm3 5 NI 5Ammonia mg/Nm3 30 NI 30
Benzo(a)pirene mg/Nm3 0.1 NI 0.1
Tar fumes mg/Nm3 5 NI 5NI: Not Indicated

Environmental and SocialImpact Assessment Report 79
Table 4.5 : Effluents Levels for Integrated Steel Mills Sector
Section - 4 :Social & Environmental Standardt
Pollutants Units Guideline Value CPCB / MOEF BPSLpH - 9-Jun 6-8.5 6.5-8.5TSS mg/L 35 100 <35Oil and grease mg/L 10 10 <10Temperature increase 0C <3a 50C 30CCOD mg/L 250 250 250BOD 3Phenol mg/L 0.5 1 0.5Cadmium mg/L 0.01 2 0.01Chromium (total) mg/L 0.5 2 <0.5Chromium (hexavalent) mg/L 0.1 0.1 0.1Copper mg/L 0.5 3 <0.5Lead mg/L 0.2 0.1 0.1Tin mg/L 2 NI 2Mercury mg/L 0.01 0.01 0.01Nickel mg/L 0.5 3 <0.5Zinc mg/L 2 5 <2Cyanides (free) mg/L 0.1 NI 0.1Cyanides (total) mg/L 0.5 0.2 0.2
Nitrate / Nitrogen mg/L 30 10 10Ammonia (NH3) mg/L NI 5 5Dissolved Phosphorous (P) mg/L NI 5 5Fluoride (F) mg/L 5 2 2Sulfides (S) mg/L 0.1 2 <0.1Iron (FC) mg/L 5 3 2PAH mg/L 0.05 NI 0.05
ToxicityAs per
requirementTo be determined on a case specific basis
Environmental and SocialImpact Assessment Report 80
5.0 NTRODUCTION
5.1 Air Pollution Management
Environment Management and Monitoring Plan (EMP) has been prepared based on the present
environmental scenario and predicted impact of the project after expansion in the study area. The primary
purpose of the EMP is to evaluate the environmental management system already in practice at BPSL for
the operating plant and that required after expansion. As discussed in Section 1 (Plant description), the
technology of the production units play critical role in pollution Management. It is a matter of satisfaction
that BPSL has employed the world standard technology. This has contributed effective management of
pollution in the operating plant and for additional units after expansion. This is to ensure that all the
activities associated with construction, operation, and closure that could affect the environment can be
managed, and that responsibilities and appropriate resources can be allocated to all aspects for effective
management as per international standards, equator principles etc.
The major source of air pollution in the existing plant is from DRI Kilns, Sinter plant, Blast Furnace, Boilers
of captive power plant, Lime & Dolomite Plant, besides Electric Arc Furnace, Reheating Furnaces of
Rolling Mills etc.
The Technology of DRI Kiln of Lurgi, Germany, non recovery type Coke Oven of China incorporated
utilization of hot gases in waste heat boilers for generation of electricity. Gases after boiler are cleaned in
ESP to reduce the emissions of PM from the stacks. The ESPs have an efficiency of 99.8%. This limits the
emission of PM from each flue to maximum 50 mg/Nm3. ESP are designed with 50-mg/Nm3 dust
emission.
The low concentration of sulphur in the waste gases (sulphur is removed by dolo) in DRI production will
lead to less emissions of SO2. Moreover the stacks are 75 to 120 m high to ensure sufficient dispersion
(i.e. dilution) of the pollutants.
The burners are designed so as to produce less quantity of NOx inAFBC and CFBC boiler of CPP.
To reduce fugitive dust emission due to handling of iron ore, coal, dust extraction and dust suppression
systems is installed at appropriate locations. The Crusher House is provided with dry type dust extraction
system with bag filters. Plain water type dust suppression system have been provided at all around the
coal/ raw material stockpiles. The dust extraction systems consist of suction hoods, fans and bag filter
units with all accessories. The dust suppression systems consist of water sprinkling systems.
The bottom ash generated from AFBC and CFBC Boilers are taken to the ash pond. To prevent fugitive
dust emissions from the exposed bottom ash, a layer of soil are spread on the ash. In addition, a green belt
is developed around the ash pond surroundings to prevent dispersion of fugitive dust to nearby areas.
Following are the list of pollution control equipment envisaged in the plant.
Section - 5 : Action Plan & Management System
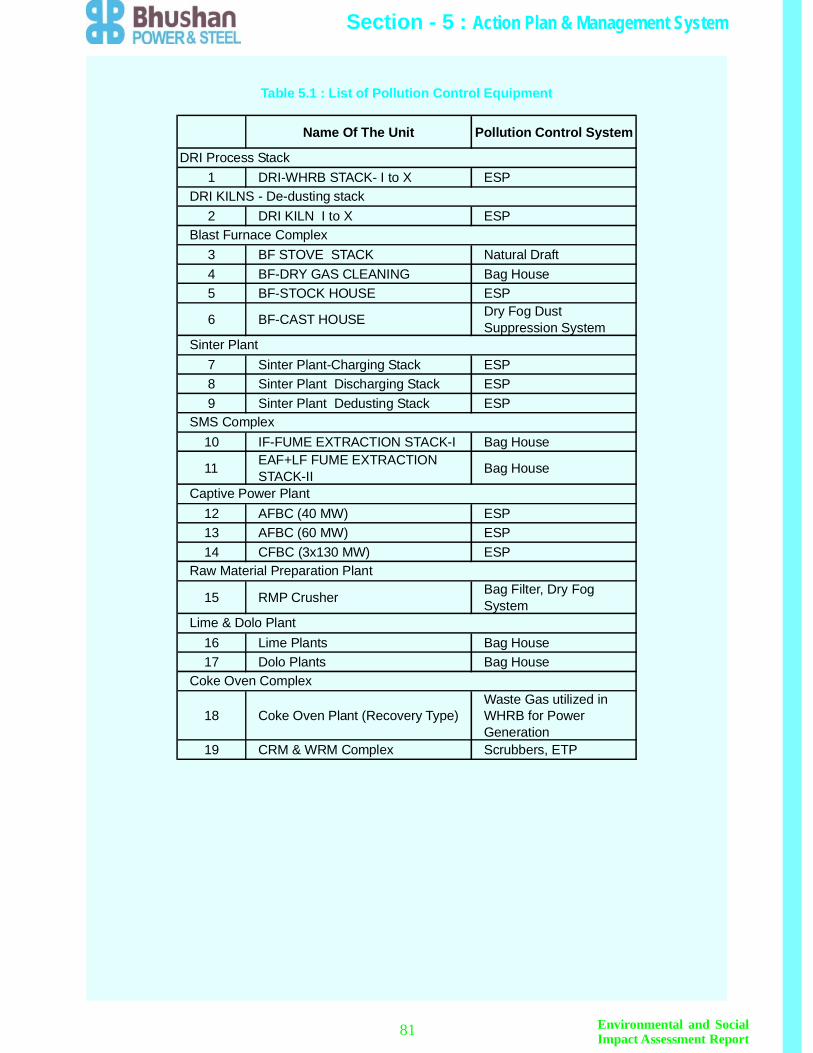
81
Table 5.1 : List of Pollution Control Equipment
Environmental and SocialImpact Assessment Report
Section - 5 : Action Plan & Management System
Name Of The Unit Pollution Control System
1 DRI-WHRB STACK- I to X ESP
2 DRI KILN I to X ESP
3 BF STOVE STACK Natural Draft4 BF-DRY GAS CLEANING Bag House5 BF-STOCK HOUSE ESP
6 BF-CAST HOUSE Dry Fog DustSuppression System
7 Sinter Plant-Charging Stack ESP8 Sinter Plant Discharging Stack ESP9 Sinter Plant Dedusting Stack ESP
10 IF-FUME EXTRACTION STACK-I Bag House
11 EAF+LF FUME EXTRACTIONSTACK-II Bag House
12 AFBC (40 MW) ESP13 AFBC (60 MW) ESP14 CFBC (3x130 MW) ESP
15 RMP Crusher Bag Filter, Dry FogSystem
16 Lime Plants Bag House17 Dolo Plants Bag House
18 Coke Oven Plant (Recovery Type)Waste Gas utilized inWHRB for PowerGeneration
19 CRM & WRM Complex Scrubbers, ETP
Raw Material Preparation Plant
Lime & Dolo Plant
Coke Oven Complex
DRI Process Stack
DRI KILNS - De-dusting stack
Blast Furnace Complex
Sinter Plant
SMS Complex
Captive Power Plant

5.2 Water Pollution Management
5.3 Waste Management
Waste Waters are generated from different facilities of the Plant.
Underflow/Sludge from Raw Water Clarifier and filter backwash water are used in coal washery. Cooling
tower blow down from condenser cooling system and Auxiliary Cooling system are reused for service
water system.
Acidic/Alkaline effluents are generated at the DM Plant and CRM Complex. These effluents are properly
neutralized and treated in ETP after which it can be reused for plant washing, ash conditioning and
sprinkling. Water from coal washery is treated in thickener. Overflow from thickener (clarified water) is
reused in the plant.
Suitable drains are provided around the stockyard. Water is collected into drains around the stockyard,
which may contain washed off suspended solids. The water is treated in WWTP and further reused in the
plant.
All drains are taken to a common Waste Water Treatment Plant. After treatment this water is taken to ash
handling system.
One of the major concerns of steel industry is the disposal of wastes generated at various stages of
processing. The global emphasis on stringent legislation for environmental protection has changed the
scenario of waste dumping into waste management. Because of natural drive to be cost-effective, there is
a growing trend of adopting such waste management measures as would convert wastes into wealth,
thereby treating wastes as by-products.
A is any solid, liquid, or contained gaseous material that is being discarded by disposal, recycling,
burning or incineration. It can be byproduct of a manufacturing process or an obsolete commercial product
that can no longer be used for intended purpose and requires disposal.
generally include any garbage, refuse. Examples of such waste include
domestic trash and garbage; inert construction / demolition materials; refuse, such as metal scrap and
empty containers (except those previously used to contain hazardous materials which should, in principle,
be managed as a hazardous waste); and residual waste from industrial operations, such as boiler slag,
clinker, and fly ash.
shares the properties of a hazardous material (e.g. ignitability, corrosivity, reactivity, or
toxicity), or other physical, chemical, or biological characteristics that may pose a potential risk to human
health or the environment if improperly managed.
Sludge from a waste treatment plant, water supply treatment plant, or air pollution control facility, and other
discarded material, including solid, liquid, semisolid, or contained gaseous material resulting from
industrial operations needs to be evaluated on a case-by-case basis to establish whether it constitutes a
hazardous or a non-hazardous waste.
waste
Solid (non-hazardous) wastes
Hazardous waste
Section - 5 : Action Plan & Management System
Environmental and SocialImpact Assessment Report 82

Essential Steps of Waste Management
5.3.1 Waste Management Planning
5.3.2 Waste Prevention
·
·
·
·
·
·
·
·
·
·
·
·
·
·
·
Establishing waste management priorities at the outset of activities based on an understanding of
potential Environmental, Health, and Safety (EHS) risks and impacts and considering waste
generation and its consequences.
Establishing a waste management hierarchy that considers prevention, reduction, reuse, recovery,
recycling, removal and finally disposal of wastes.
Avoiding or minimizing the generation waste materials, as far as practicable.
Where waste generation cannot be avoided but has been minimized, recovering and reusing waste.
Where waste cannot be recovered or reused, treating, destroying, and disposing of it in an
environmentally sound manner.
Facilities that generate waste should characterize their waste according to composition, source, types of
wastes produced, generation rates, or according to local regulatory requirements. Effective planning and
implementation of waste management strategies should include:
Review of new waste sources during planning, siting, and design activities, including during
equipment modifications and process salterations, to identify expected waste generation, pollution
prevention opportunities, and necessary treatment, storage, and disposal infrastructure
A Collection of data and information about the process and waste streams in existing facilities,
including characterization of waste streams by type, quantities, and potential use/disposition
Establishment of priorities based on a risk analysis that takes into account the potential risks during
the waste cycle and the availability of infrastructure to manage the waste in an environmentally
sound manner
Definition of opportunities for source reduction, as well as reuse and recycling
Definition of procedures and operational controls for on-site storage
Definition of options I procedures I operational controls for treatment and final disposal
Processes should be designed and operated to prevent, or minimize, the quantities of wastes generated
and hazards associated with the wastes generated in accordance with the following strategy:
Substituting raw materials or inputs with less hazardous or toxic materials, or with those whereprocessing generates lower waste volumes
Applying manufacturing process that convert materials efficiently, providing higher product outputyields, including modification of design of the production process, operating conditions, and processcontrols.
Instituting good housekeeping and operating practices, including inventory control to reduce theamount of waste resulting from materials that are out-of-date, off- specification, contaminated,damaged, or excess to plant needs
Instituting procurement measures that recognize opportunities to return usable materials such as
Environmental and SocialImpact Assessment Report83
Section - 5 : Action Plan & Management System

containers and which prevents the over ordering of materials
Minimizing hazardous waste generation by implementing stringent waste segregation to prevent the
commingling of non-hazardous and hazardous waste to be managed
In addition to the implementation of waste prevention strategies, the total amount of waste may be
significantly reduced through the implementation of recycling plans, which should consider the following
elements:
Evaluation of waste production processes and identification of potentially recyclable materialsIdentification and recycling of products that can be reintroduced into the manufacturing process orindustry activity at the siteInvestigation of external markets for recycling by other industrial processing operations located in theneighborhood or region of the facility (e.g., waste exchange)Establishing recycling objectives and formal tracking of waste generation and recycling ratesProviding training and incentives to employees in order to meet objectives
If waste materials are still generated after the implementation of feasible waste prevention, reduction,
reuse, recovery and recycling measures, waste materials should be treated and disposed of and all
measures should be taken to avoid potential impacts to human health and the environment. Selected
management approaches may include one or more of the following:
On-site or off-site biological, chemical, or physical treatment of the waste material to render it non-
hazardous prior to final disposalTreatment or disposal at permitted facilities specially designed to receive the waste. Examplesinclude: composting operations for organic non-hazardous wastes; properly designed, permittedand operated landfills or incinerators designed for the respective type of waste; or other methodsknown to be effective in the safe, final disposal of waste materials such as bioremediation.
Hazardous wastes should always be segregated from non- hazardous wastes. If generation of hazardous
waste can not be prevented through the implementation of the above general waste management
practices, its management should focus on the prevention of harm to health, safety, and the environment,
according to the following additional principles:
Understanding potential impacts and risks associated with the management of any generated
hazardous waste during its complete life cycleEnsuring that contractors handling, treating, and disposing of hazardous waste are reputable andlegitimate enterprises, licensed by the relevant regulatory agencies and following good internationalindustry practice for the waste being handledEnsuring compliance with applicable local and international regulations
·
·
·
·
·
·
·
·
·
·
·
5.3.4 Recycling and Reuse
5.3.5 Treatment and Disposal
5.3.6 Hazardous Waste Management
Environmental and SocialImpact Assessment Report 84
Section - 5 : Action Plan & Management System

5.3.7 Waste Storage
5.3.8 Transportation
5.3.9 Treatment and Disposal
Hazardous waste should be stored so as to prevent or control accidental releases to air, soil, and water
resources in area location where:
Waste is stored in a manner that prevents the commingling or contact between incompatible wastes,
and allows for inspection between containers to monitor teaks or spills. Examples include sufficient
space between incompatibles or physical separation such as walls or containment curbs
Store in closed containers away from direct sunlight, wind and rain
Secondary containment systems should be constructed with materials appropriate for the wastes
being contained and adequate to prevent loss to the environment
Secondary containment is included wherever liquid wastes are stored in volumes greater than 220
liters. The available volume of secondary containment should be at least 110 percent of the largest
storage container, or 25 percent of the total storage capacity (whichever is greater), in that specific
location
Provide adequate ventilation where volatile wastes are stored.
Hazardous waste storage activities should also be subject to special management actions, conducted by
employees who have received specific training in handling and storage of hazardous wastes:
Provision of readily available information on chemical compatibility to employees, including labelling
each container to identify its contentsLimiting access to hazardous waste storage areas to employees who have received proper trainingClearly identifying (label) and demarcating the area, including documentation of its location on afacility map or site planConducting periodic inspections of waste storage areas and documenting the findingsPreparing and implementing spill response and emergency plans to address their accidental releaseAvoiding underground storage tanks and underground piping of hazardous waste.
·
·
·
·
·
·
·
·
·
·
·
·
·
·
On-site and Off-site transportation of waste should be conducted so as to prevent or minimize spills,releases, and exposures to employees and the public. All waste containers designated for off-siteshipment should be secured and labeled with the contents and associated hazards, be properly loaded onthe transport vehicles before leaving the site.
In addition to the recommendations for treatment and disposal applicable to general wastes, the followingissues specific to hazardous wastes should be considered:
Have technical capability to manage the waste in a manner that reduces immediate and futureimpact to the environmentHave all required permits, certifications, and approvals, of applicable government authoritiesHave been secured through the use of formal procurement agreements
Environmental and SocialImpact Assessment Report85
Section - 5 : Action Plan & Management System

5.3.10 MonitoringMonitoring activities associated with the management of hazardous and non-hazardous waste shouldinclude:
Regular audits of waste segregation and collection practicesTracking of waste generation trends by type and amount of waste generated, preferably by facilitydepartments
· Characterizing waste at the beginning of generation of a new waste stream, and periodicallydocumenting the characteristics and proper management of the waste, especially hazardous wastes
· Keeping manifests or other records that document the amount of waste generated and its destination· Periodic auditing of third party treatment, and disposal services including re-use and recycling
facilities when significant quantities of hazardous wastes are managed by third parties. Wheneverpossible, audits should - include site visits to the treatment storage and disposal location
The company Bhushan Power and Steel Ltd. (BPSL) is practicing waste management keeping in view theabove principles of waste management and the guidelines enumerated in the waste management Act bythe Government of India and the Guidelines/ Approval of the monitoring regulatory authority of OrissaState Pollution Control Board.Due to the comprehensive guidelines/Acts in place in India and by practicing effective waste managementtechnique, BPSL is able to recycle/ reuse major portion of solid waste. The balance solid waste is handedover/ taken over byApproved Specialised agency (Approved by Orrisa State Pollution Control Board).
Fly ash from AFBC and CFBC boiler of captive power plant is supplied to cement manufacturer and brickmanufacturer in the nearby area. Only the bottom ash is disposed off in the waste dumping yard asexplained in Section 3.The sludge generating from different effluent treatment plant is handed over to authorised vendors fordisposal at common disposal facility developed for the State of Orissa in association with State PollutionControl Board.
Regular visual inspection of all waste storage collection and storage areas for evidence of accidentalreleases and to verify that wastes are properly labeled and stored. When significant quantities ofhazardous wastes are generated and stored on site, monitoring activities should include:Inspection of vessels for leaks, drips or other indications of lossIdentification of cracks, corrosion, or damage to tanks, protective equipment, or floorsVerification of locks, emergency valves, and other safety devices for easy operation (lubricating ifrequired and employing the practice of keeping locks and safety equipment in standby position whenthe area is not occupied)Checking the operability of emergency systemsDocumenting results of testing for integrity, emissions, or monitoring stations (air, soil vapor, orgroundwater)Documenting any changes to the storage facility, and any significant changes in the quantity ofmaterials in storage
·
·
·
·
·
·
·
·
·
·
·
·
Environmental and SocialImpact Assessment Report 86
Section - 5 : Action Plan & Management System
5.4 Noise Control
5.5 Waste Water Discharge from Plant
5.6 Green Belt Development
In steel plant, crusher area, furnace area, the power generating sets, fans and pumps are the majorsources of noise.Noise generation levels are considered while selecting equipment. Equipment should not generate noisemore than 85 dB (A) at 1m distance.Wherever required noisy equipment have been placed on vibration isolators or surrounded by bafflescovered with noise absorbing material.Personnel working in high noise zones are issued with personal noise protection equipment (e.g. earmuffs, ear plugs) and their duty hours is regulated to control noise exposure levels.
The plant is designed with zero discharge concept hence there is no discharge of any process waste wateror effluent from the plant. Effluent treatment plants are provided for treatment of process waste water andthe treated water is recycled in the system. The surface runoff and storm water is also treated separately inwaste water treatment plants and further used within the plant. However during monsoon storm water mayfind way in the nearby drains.
Trees are important sinks for air pollutants. Trees absorb noise and by enhancing the green cover, improvethe ecology and aesthetics and affect the local micrometeorology. Trees also have major long-termimpacts on soil quality and the ground water table. By using suitable plant species, green belts can bedeveloped in strategic zones to provide protection from emitted pollutants and noise.Plant species suitable for green belts should not only be able to flourish in the area but must also haverapid growth rate, evergreen habit, large crown volume and small / pendulous leaves with smoothsurfaces. All these traits are difficult to get in a single species. Therefore a combination of these is soughtwhile selecting trees for green belt.The green belt have been planted close to the source or to the area to be protected to optimise theattention within physical limitations. A total of 450 acres area will be developed as green belt or greenareas in plant area,Ash pond and nearby areas.
In the steel plant, green belt is developed in vacant areas, around office buildings, around switchyard andstores, along the side of roads, along the plant's boundaries, in the colony and in the ash pond area. Treesof native species, which are planted as mentioned below:
Amaltas (Cassia fistula)Siris (Albizzia lebbeck)Neem (Azadirachta indica)DrupingAshok (Polyalthia longifoila)Gulmohar (Delonix regia)Mango (Mangifera indica)Peepal (Ficus religiosa)Arjun (Terminalia arjuna)Jackfruit (Artocarpus heterophylla)
Environmental and SocialImpact Assessment Report87
Section - 5 : Action Plan & Management System
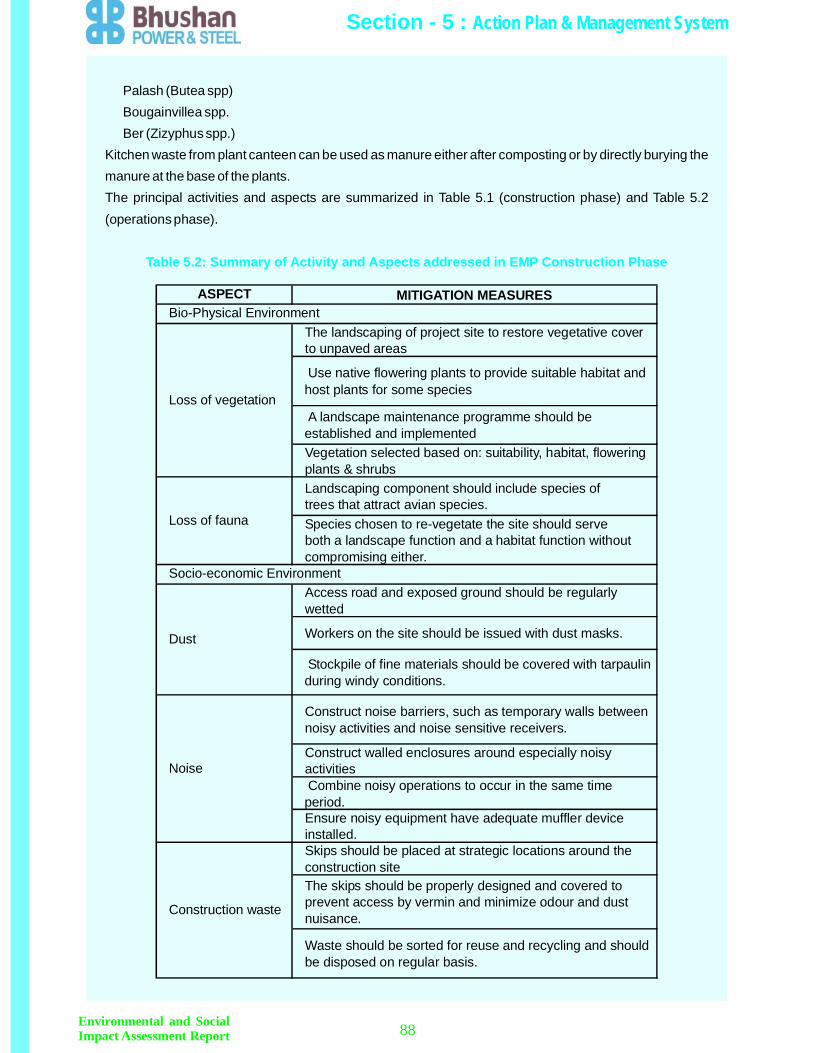
Palash (Butea spp)Bougainvillea spp.Ber (Zizyphus spp.)
Kitchen waste from plant canteen can be used as manure either after composting or by directly burying themanure at the base of the plants.The principal activities and aspects are summarized in Table 5.1 (construction phase) and Table 5.2(operations phase).
Table 5.2: Summary of Activity and Aspects addressed in EMP Construction Phase
Environmental and SocialImpact Assessment Report 88
Section - 5 : Action Plan & Management System
ASPECT MITIGATION MEASURES
The landscaping of project site to restore vegetative coverto unpaved areas
Use native flowering plants to provide suitable habitat andhost plants for some species
A landscape maintenance programme should beestablished and implementedVegetation selected based on: suitability, habitat, floweringplants & shrubsLandscaping component should include species oftrees that attract avian species.Species chosen to re-vegetate the site should serveboth a landscape function and a habitat function withoutcompromising either.
Access road and exposed ground should be regularlywetted
Workers on the site should be issued with dust masks.
Stockpile of fine materials should be covered with tarpaulinduring windy conditions.
Construct noise barriers, such as temporary walls betweennoisy activities and noise sensitive receivers.
Construct walled enclosures around especially noisyactivitiesCombine noisy operations to occur in the same timeperiod.Ensure noisy equipment have adequate muffler deviceinstalled.Skips should be placed at strategic locations around theconstruction siteThe skips should be properly designed and covered toprevent access by vermin and minimize odour and dustnuisance.
Waste should be sorted for reuse and recycling and shouldbe disposed on regular basis.
Construction waste
Bio-Physical Environment
Loss of vegetation
Loss of fauna
Socio-economic Environment
Dust
Noise

Table 5.3 : Summary of Activity and Aspects addressed in EMP Operational Phase
5.7 Environmental Monitoring Plan
5.7.1 EnvironmentalAspects to be monitored
To ensure the effective implementation of the proposed mitigation measures, the broad objectives ofmonitoring plan are:
Several measures have been proposed in the environmental mitigation measures for mitigation ofadverse environmental impacts. These shall be implemented as per proposal and monitored regularly toensure compliance to environmental regulation and also to maintain healthy environmental conditionsaround the steel plant.A major part of the sampling and measurement activities shall be concerned with long term monitoringaimed at providing an early warning of any undesirable changes or trends in the natural environment thatcould be associated with the plant activity. This is essential to determine whether the changes are inresponse to a cycle of climatic conditions or are due to impact of the plant activities. In particular, amonitoring strategy shall be ensured that all environmental resources, which may be subject tocontamination, are kept under review and hence monitoring of the individual elements of the environmentshall be done. During the operation phase Environmental Control Department (ECD) shall undertake allthe monitoring work to ensure the effectiveness of environmental mitigation measures. The suggestions
To evaluate the performance of mitigation measures proposed in the ESIA.To evaluate the adequacy of Environmental ImpactAssessmentTo suggest improvements in management plan, if requiredTo enhance environmental quality.To implement and manage the mitigative measures defined in EMP.To undertake compliance monitoring of BPSL expansion project operation and evaluation ofmitigative measure.
••••••
Environmental and SocialImpact Assessment Report89
Section - 5 : Action Plan & Management System
ASPECT MITIGATION MEASURES
Modification ofsurface drainage
Design storm water drains to permit run off from the buildings roads and all paved areasaround the site system should be adequately designed, stabilized and maintainedparticularly where accumulated run off flows
Wider participation from the local hospitality sector should be encouraged
On-the-job training should be done to enhance the capacity of locals to fill the managerialpositions
Educate, train and motivate staff to practice water conservation.
Institute a comprehensive leak detection and correction programme
Reduce water consumptionStakeholderRelations
Implement a public awareness programme
Implement air pollution control equipment suitably designed at 50 mg/nm3 in the processwhere ever require.
Suppress fugitive emission by suitable means
As far as possible utilize solid waste within plan by recycling them.
If recycling is not possible, dispose as per regulatory requirement
Employment
WaterManagement
Emission to Air
Disposal of solidwaste
given in the Environmental Monitoring Programme (EMP) shall be implemented by the ECD by followingan implementation schedule.In case of any alarming variation in, ground level concentration in ambient air, stack emission, work zoneair and noise monitoring results, performance of effluent treatment facilities etc shall be discussed in theECD and any deviation from norms shall be reported to the higher management for immediate rectificationaction at higher management level. In addition to the monitoring programme the following shall also bedone to further ensure the effectiveness of mitigation measures:
The environmental aspects to be monitored to ensure proper implementation and effectiveness of variousmitigative measures envisaged / adopted during the design and commissioning stage of the proposedexpansion plan are described here under.
The effectiveness of the drainage system depends on proper cleaning of all drainage channels. Regularchecking is being done to see that none of the drains are clogged due to accumulation ofsludge/sediments. The catch-pits linked to the storm water drainage system from the raw materialhandling areas are regularly checked and cleaned to ensure their effectiveness. This checking andcleaning is rigorous during the monsoon season, especially if heavy rains are forecast. The same systemshall follow for the expansion plan also.
It is necessary to monitor the meteorological parameters regularly for assessment and interpretation of airquality data. The continuous monitoring will also help in emergency planning and disaster management.The following data will be recorded and archived:
Periodical monitoring of stack for SPM, SO2, NOx in case of process stacks shall be done to assess theperformance of pollution control facilities installed at the unit. In case emissions are found to exceed thenorms, the 'on duty' personnel shall check the relevant process parameters and take appropriatecorrective action. Presently the emissions from all the stacks are being monitored once a month using themanually operated stack emissions monitoring equipment. However the frequency of monitoring may beincreased if required in accordance with the stipulations of OSPCB or other statutory authoritiesAfter the implementation of expansion plan the stacks given inTable 5.3 shall be monitored.
Environmental audits shall be carried out for expansion project of BPSL to check for compliance withstandards / applicable norms by in-house experts.Third party environmental audits shall be carried out once every year.In addition to the above, all necessary steps will be taken to implement the measures suggested byCentral Pollution Control Board (CPCB) in the Charter on Corporate Responsibility forEnvironmental Protection (CREP) for Integrated Iron and Steel Industry applicable in host country.
Wind speed and directionRainfallTemperature and humidity
•
••
•••
5.8 Maintenance of Drainage System
5.9 Meteorology
5.10 Stack Emissions Monitoring
Environmental and SocialImpact Assessment Report 90
Section - 5 : Action Plan & Management System

Table 5.4 : Stacks to be monitored after the Implementation of the Expansion Plan
5.11 Solid / Hazardous Waste Generation & Utilisation
Green Belt Development
5.12 House Keeping
5.13 Occupational Health and Safety
Further, for the units / facilities commissioned during the BPSL expansion plan the following shall befollowed:A detailed maintenance schedule shall be drawn for all pollution control systems. The maintenance shallbe done strictly as per schedule and guidelines furnished by plant manufacturer.
As elaborated in Section 3, waste generation and utilization management plan is practiced for theoperating plant. For the additional units under 3.0 MTPAthe management will continue.Maximum re-cycling and utilization of generated waste within the plant as per guidelines shall be done.Hazardous waste shall be either sold or dumped in hazardous waste pit as per applicable statutoryconditions.
At present Horticulture department of BPSL is looking after all plantation program within theplant & township area. BPSL shall continue to improve the green cover in the area by planting trees in the open area.The data on area of green cover, survival rate etc be compiled for periodic review. BPSL has alreadyplanted approximately 50,000 trees in almost all possible locations and continuously encourages othersto plant trees in their garden, locality etc. However following plan shall also be made for future program:Annual plans for tree plantation with specific number of trees to be planted shall be made. The fulfillment ofthe plan shall be monitored by the ECD every six months.A plan for post plantation care will be reviewed in every monthly meeting. Any abnormal death rate ofplanted trees shall be investigated.Watering of the plants, manuring, weeding, hoeing will be carried out for minimum 3 years
The BPSL is keeping a very close monitoring of house keeping activities and organising regular meetingsof joint forum at the shop level (monthly), zonal level (once in two months) and apex level (quarterly). Theindividual shop concern is taking care for the house keeping of shops. The same system shall follow for theexpansion plan also.
Presently at BPSL routine medical examination of personnel is being carried out in a systematic
Environmental and SocialImpact Assessment Report91
Shop / Unit Nos. of Stacks(Working)
Monitoring Frequency PerMonth
1. Sinter Plants Process One 12. Coke Ovens four 43. Blast Furnaces Process Three 34. Steel Melting Shop Two 25. Hot Strip Mill (Tunnel Furna ce) Two 26. DRI complex eight 87. Lime Calcination Plant Process Four 2* Parameters = PM, SO2, NOX
Section - 5 : Action Plan & Management System

programme at medical unit. The same procedure will be followed for personnel working for expansionproject.A systematic programme for medical check-up at regular intervals shall be followed for all workersto ascertain any changes in health condition due to the working conditions.
The setting up of the steel plant has improved the socio economic conditions in the surrounding area. Theexpansion plan will further improve the infrastructure; economic conditions thus further improve the socioeconomic development. The communities, which are benefited by the steel plant, are thus one of the keystakeholders for the steel plant. It is suggested that BPSL should have structured interactions with thecommunity to disseminate the measures taken by the steel plant and also to elicit suggestions for overallimprovement for the development of the area.Work ZoneAir QualityIn the existing plant facilities work zone air quality is being monitored regularly to assess the levels ofsuspended Particulate Matter, NOx and SO2 in the work zone.
Noise levels shall be measured at the source of generation. The noise attenuation measures have beentaken at the design stage of the plant itself. However in case of high noise generating equipment which arenot frequented by the plant personnel, the area shall be cleanly marked as 'High Noise" area and theemployees be provided with personal protective equipment like ear plugs/ear muffs.At present Noise levels are being monitored inside the plant regularly. The ECD are keeping a record ofnoise levels and take necessary organizational actions like rotation of workmen, availability and use ofpersonal protective devices, damage to enclosures or insulation layers over enclosures and piping. Afterthe implementation of expansion plan the noise level shall be monitored and all preventive measures shallbe followed. Work zone noise shall be monitored at all units of BPSL.
Presently ambient air quality is being monitored regularly in accordance with CPCB / Orissa StatePollution Control Board (OSPCB) guidelines. Further efforts shall be made to install on line Ambient AirQuality monitoring station in accordance with the CREP.After the implementation of the expansion plan the ambient air shall be regularly monitored as given inTable 5.5.
In normal circumstances there will not be any waste water discharge from plant.
5.14 Socio-Economic Development
5.15 Work Zone Noise Level
5.16 AmbientAir Quality
Table 5.5 : Ambient Air to be monitored
5.17 Waste Water Discharge from Plant
Environmental and SocialImpact Assessment Report 92
Section - 5 : Action Plan & Management System
Description Number of AAQStations
Monitoring Frequency
1. Ambient Air Quality 5 Once (for 24 hours continuous)per month
2. Online ContinuousAAQ Monitoring
3 Continuous
* Parameters = PM, SO2, NOX & CO
5.18 Ambient Noise Level
5.19 Monitoring Plan
5.20 Performance Indicators
5.21 Progress Monitoring and ReportingArrangements
Ambient noise shall be monitored at six locations all along the boundary once in a month.Ground Water MonitoringGround water shall be sampled from up gradient and down gradient to ascertain the trend of variation inthe water quality, if any. In case any adverse trend is noticed, immediate remedial measures shall betaken.Atotal of 5 samples from up gradient and down gradient of BPSLSlag Bank shall be monitored oncein a six months period.
The long-term objective of environment department would be to build environmental awareness andsupport, both within and outside the BPSL management. The other long-term tasks would be to developenvironmental training programme for the target groups of different units of BPSL.
The environmental monitoring plan contains:Performance indicatorsEnvironmental monitoring programmeProgress Monitoring and ReportingArrangementsBudgetary provisionsProcurement Schedules
The physical, biological and social components identified to be particularly significant in affecting theenvironment at critical locations have been suggested as Performance Indicators (PIs). The performanceindicators will be evaluated under two heads:
Environmental condition indicators to determine efficiency of environmental management measures incontrol of air, noise and water pollution and solid waste disposal.Environmental management indicators to determine compliance with the suggested environmentalmanagement measures.
The Performance Indicators and monitoring plans will be prepared for the project for effective monitoring.
The rational for a reporting system is based on accountability to ensure that the measures proposed aspart of the Environmental Monitoring Plan get implemented in the project. The monitoring and evaluationof the management measures are critical activities in implementation of the project. Monitoring involvesperiodic checking to ascertain whether activities are going according to the plans. It provides thenecessary feedback for the project management to keep the programme on schedule. The rational for areporting system is based on accountability to ensure that the measures proposed as part of
Environmental and SocialImpact Assessment Report93
Section - 5 : Action Plan & Management System
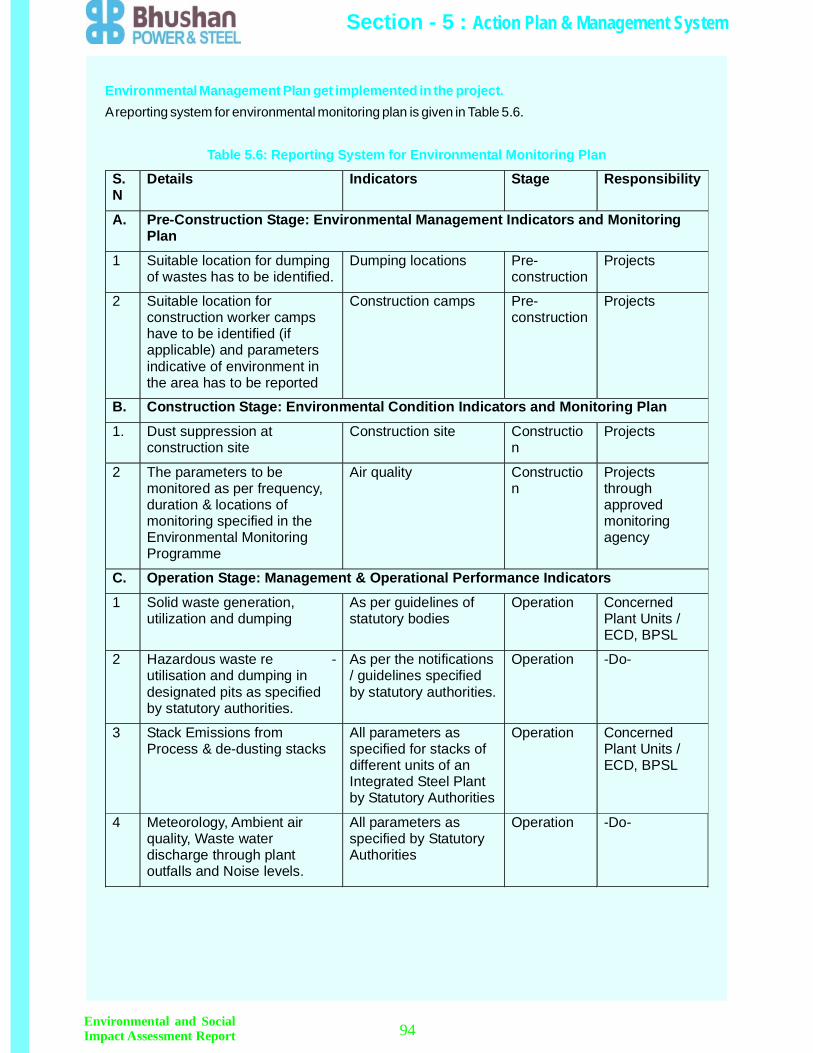
Environmental Management Plan get implemented in the project.
Table 5.6: Reporting System for Environmental Monitoring Plan
Areporting system for environmental monitoring plan is given in Table 5.6.
Environmental and SocialImpact Assessment Report 94
Section - 5 : Action Plan & Management System
S.N
Details Indicators Stage Responsibility
A. Pre-Construction Stage: Environmental Management Indicators and MonitoringPlan
1 Suitable location for dumpingof wastes has to be identified.
Dumping locations Pre-construction
Projects
2 Suitable location forconstruction worker campshave to be identified (ifapplicable) and parametersindicative of environment inthe area has to be reported
Construction camps Pre-construction
Projects
B. Construction Stage: Environmental Condition Indicators and Monitoring Plan1. Dust suppression at
construction siteConstruction site Constructio
nProjects
2 The parameters to bemonitored as per frequency,duration & locations ofmonitoring specified in theEnvironmental MonitoringProgramme
Air quality Construction
Projectsthroughapprovedmonitoringagency
C. Operation Stage: Management & Operational Performance Indicators1 Solid waste generation,
utilization and dumpingAs per guidelines ofstatutory bodies
Operation ConcernedPlant Units /ECD, BPSL
2 Hazardous waste re -utilisation and dumping indesignated pits as specifiedby statutory authorities.
As per the notifications/ guidelines specifiedby statutory authorities.
Operation -Do-
3 Stack Emissions fromProcess & de-dusting stacks
All parameters asspecified for stacks ofdifferent units of anIntegrated Steel Plantby Statutory Authorities
Operation ConcernedPlant Units /ECD, BPSL
4 Meteorology, Ambient airquality, Waste waterdischarge through plantoutfalls and Noise levels.
All parameters asspecified by StatutoryAuthorities
Operation -Do-
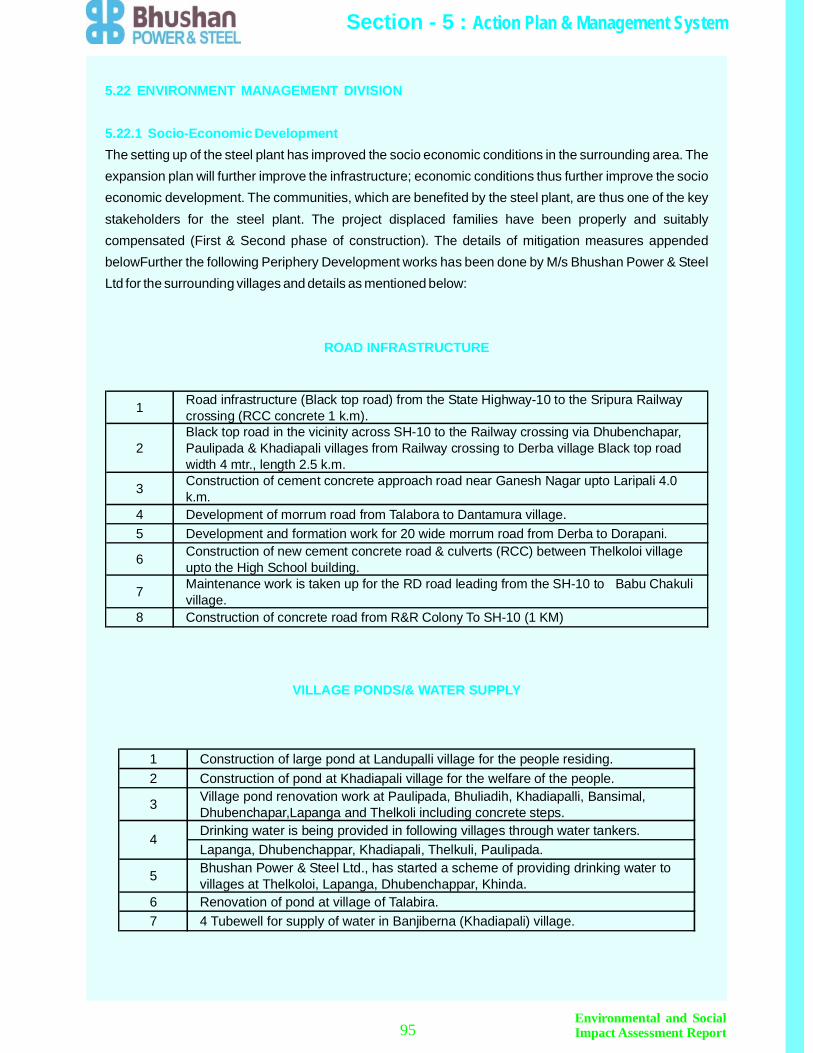
5.22 ENVIRONMENT MANAGEMENT DIVISION
5.22.1 Socio-Economic Development
ROAD INFRASTRUCTURE
VILLAGE PONDS/& WATER SUPPLY
The setting up of the steel plant has improved the socio economic conditions in the surrounding area. Theexpansion plan will further improve the infrastructure; economic conditions thus further improve the socioeconomic development. The communities, which are benefited by the steel plant, are thus one of the keystakeholders for the steel plant. The project displaced families have been properly and suitablycompensated (First & Second phase of construction). The details of mitigation measures appendedbelowFurther the following Periphery Development works has been done by M/s Bhushan Power & SteelLtd for the surrounding villages and details as mentioned below:
Environmental and SocialImpact Assessment Report95
Section - 5 : Action Plan & Management System
1 Road infrastructure (Black top road) from the State Highway-10 to the Sripura Railwaycrossing (RCC concrete 1 k.m).
2Black top road in the vicinity across SH-10 to the Railway crossing via Dhubenchapar,Paulipada & Khadiapali villages from Railway crossing to Derba village Black top roadwidth 4 mtr., length 2.5 k.m.
3 Construction of cement concrete approach road near Ganesh Nagar upto Laripali 4.0k.m.
4 Development of morrum road from Talabora to Dantamura village.5 Development and formation work for 20 wide morrum road from Derba to Dorapani.
6 Construction of new cement concrete road & culverts (RCC) between Thelkoloi villageupto the High School building.
7 Maintenance work is taken up for the RD road leading from the SH-10 to Babu Chakulivillage.
8 Construction of concrete road from R&R Colony To SH-10 (1 KM)
1 Construction of large pond at Landupalli village for the people residing.2 Construction of pond at Khadiapali village for the welfare of the people.
3 Village pond renovation work at Paulipada, Bhuliadih, Khadiapalli, Bansimal,Dhubenchapar,Lapanga and Thelkoli including concrete steps.Drinking water is being provided in following villages through water tankers.Lapanga, Dhubenchappar, Khadiapali, Thelkuli, Paulipada.
5 Bhushan Power & Steel Ltd., has started a scheme of providing drinking water tovillages at Thelkoloi, Lapanga, Dhubenchappar, Khinda.
6 Renovation of pond at village of Talabira.7 4 Tubewell for supply of water in Banjiberna (Khadiapali) village.
4
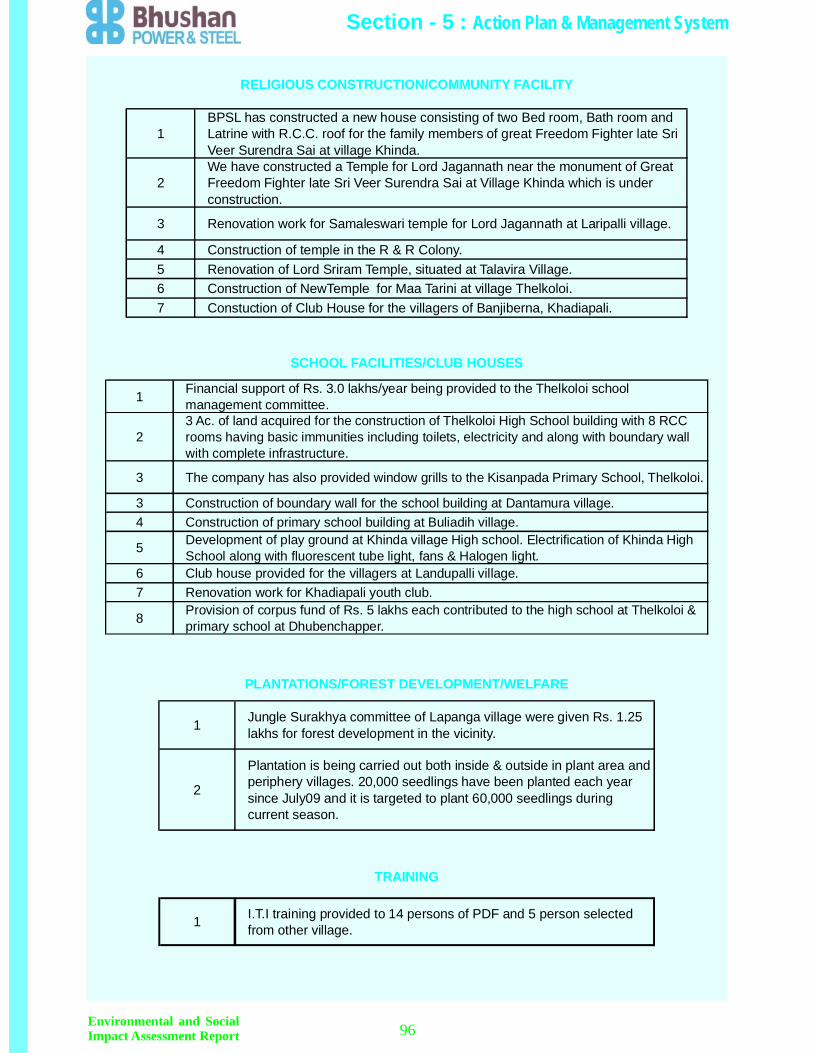
RELIGIOUS CONSTRUCTION/COMMUNITY FACILITY
SCHOOL FACILITIES/CLUB HOUSES
PLANTATIONS/FOREST DEVELOPMENT/WELFARE
TRAINING
Environmental and SocialImpact Assessment Report 96
Section - 5 : Action Plan & Management System
1BPSL has constructed a new house consisting of two Bed room, Bath room andLatrine with R.C.C. roof for the family members of great Freedom Fighter late SriVeer Surendra Sai at village Khinda.
2We have constructed a Temple for Lord Jagannath near the monument of GreatFreedom Fighter late Sri Veer Surendra Sai at Village Khinda which is underconstruction.
3 Renovation work for Samaleswari temple for Lord Jagannath at Laripalli village.
4 Construction of temple in the R & R Colony.5 Renovation of Lord Sriram Temple, situated at Talavira Village.6 Construction of NewTemple for Maa Tarini at village Thelkoloi.7 Constuction of Club House for the villagers of Banjiberna, Khadiapali.
1 Financial support of Rs. 3.0 lakhs/year being provided to the Thelkoloi schoolmanagement committee.
23 Ac. of land acquired for the construction of Thelkoloi High School building with 8 RCCrooms having basic immunities including toilets, electricity and along with boundary wallwith complete infrastructure.
3 The company has also provided window grills to the Kisanpada Primary School, Thelkoloi.
3 Construction of boundary wall for the school building at Dantamura village.4 Construction of primary school building at Buliadih village.
5 Development of play ground at Khinda village High school. Electrification of Khinda HighSchool along with fluorescent tube light, fans & Halogen light.
6 Club house provided for the villagers at Landupalli village.7 Renovation work for Khadiapali youth club.
8 Provision of corpus fund of Rs. 5 lakhs each contributed to the high school at Thelkoloi &primary school at Dhubenchapper.
1 Jungle Surakhya committee of Lapanga village were given Rs. 1.25lakhs for forest development in the vicinity.
2
Plantation is being carried out both inside & outside in plant area andperiphery villages. 20,000 seedlings have been planted each yearsince July09 and it is targeted to plant 60,000 seedlings duringcurrent season.
1 I.T.I training provided to 14 persons of PDF and 5 person selectedfrom other village.

Environmental and SocialImpact Assessment Report97
HEALTH CHECK-UPThe company has organized Regular health camp for the people periphery villages.
DescriptionDate of
Medical Camp Place No. of specialistsNo. of person
examined1. Dr. Arati Nanda (CDMO)2. Dr. Subhash Mandal (Chest Specialist)3. Dr. Deepak Panigrahi (Medical Officer)4. Medicine Specialist.5. Eye Specialist.6. Gyanacologist1. Dr. Arati Nanda (CDMO)2. Dr. Subhash Mandal (Chest Specialist)3. Dr. Deepak Panigrahi (Medical Officer)4. Medicine Specialist.5. Eye Specialist.6. Gyanacologist1. DR. Byomkesh Bohidar (Child Specialist)2. Giridhari Pradhan (Gyanacology)3. Dr. Panchanan Naik (Orthopedic)
4. Dr. Aleka Mohapatra (Medicine Specialist)
5. Dr. Subhash Mandal (Chest Specialist)6. dr. Deepak Panigrahi (Medical Officer)1. Dr. Vivek Acharya2. Dr. Tanuja Panigrahi3. Dr. Chintamani (Gynic)4. Dr. Pranav Kumar (Gynic)5. Dr. Subrat Tripathy (Gynic)6. Dr. Sangram Sawat (Orthopadic)7. Dr. Sachikant Pradhan (Eye)8. Dr. Prasant Pandey (Eye)9. Dr. Samir Mohapatra (Eye)10. Dr. C. swain (Padiatric)11. Dr. B. Rout (Padiatric)12. Dr. Mukesh (Medicine)13. Dr. Devi Prasad (Medicine)14. Dr. Sabyasachi Choudhury (TV/Ches)15. Dr. Manas Tripathy (Surgeon)
1st Medicalcamp
13.04.2006
CommunityCentre R.H
colony,Thelkoloi
326
2nd Medicalcamp
14.07.2006
CommunityCentre R.H
colony,Thelkoloi
385
3rd Medicalcamp
09.04.2007
NodalU.G.M.Eschool,
Thelkoloi
402
4th Medicalcamp
19.02.2009
Thelkoloiground
infront ofrehabilitation
colony
1112
Section - 5 : Action Plan & Management System
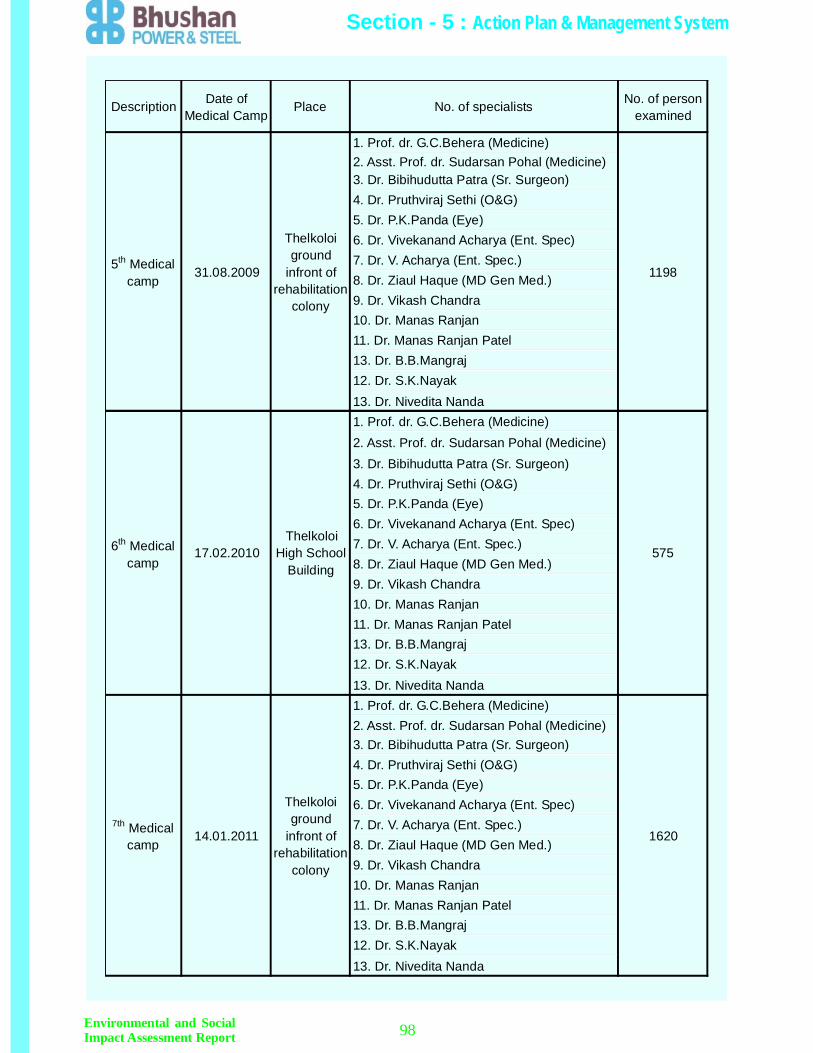
Environmental and SocialImpact Assessment Report 98
Description Date ofMedical Camp
Place No. of specialists No. of personexamined
1. Prof. dr. G.C.Behera (Medicine)2. Asst. Prof. dr. Sudarsan Pohal (Medicine)3. Dr. Bibihudutta Patra (Sr. Surgeon)4. Dr. Pruthviraj Sethi (O&G)5. Dr. P.K.Panda (Eye)6. Dr. Vivekanand Acharya (Ent. Spec)7. Dr. V. Acharya (Ent. Spec.)8. Dr. Ziaul Haque (MD Gen Med.)9. Dr. Vikash Chandra10. Dr. Manas Ranjan11. Dr. Manas Ranjan Patel13. Dr. B.B.Mangraj12. Dr. S.K.Nayak13. Dr. Nivedita Nanda1. Prof. dr. G.C.Behera (Medicine)2. Asst. Prof. dr. Sudarsan Pohal (Medicine)3. Dr. Bibihudutta Patra (Sr. Surgeon)4. Dr. Pruthviraj Sethi (O&G)5. Dr. P.K.Panda (Eye)6. Dr. Vivekanand Acharya (Ent. Spec)7. Dr. V. Acharya (Ent. Spec.)8. Dr. Ziaul Haque (MD Gen Med.)9. Dr. Vikash Chandra10. Dr. Manas Ranjan11. Dr. Manas Ranjan Patel13. Dr. B.B.Mangraj12. Dr. S.K.Nayak13. Dr. Nivedita Nanda1. Prof. dr. G.C.Behera (Medicine)2. Asst. Prof. dr. Sudarsan Pohal (Medicine)3. Dr. Bibihudutta Patra (Sr. Surgeon)4. Dr. Pruthviraj Sethi (O&G)5. Dr. P.K.Panda (Eye)6. Dr. Vivekanand Acharya (Ent. Spec)7. Dr. V. Acharya (Ent. Spec.)8. Dr. Ziaul Haque (MD Gen Med.)9. Dr. Vikash Chandra10. Dr. Manas Ranjan11. Dr. Manas Ranjan Patel13. Dr. B.B.Mangraj12. Dr. S.K.Nayak13. Dr. Nivedita Nanda
7th Medicalcamp
14.01.2011
Thelkoloiground
infront ofrehabilitation
colony
1620
5th Medicalcamp
31.08.2009
Thelkoloiground
infront ofrehabilitation
colony
1198
6th Medicalcamp
17.02.2010Thelkoloi
High SchoolBuilding
575
Section - 5 : Action Plan & Management System

The 8th Medical Camp in the year 2012 is in progress.In all the above health camps medicines were distributed free of cost.
In order to prevent occurrence of any disaster, the plant will be provided with various safety and disastercontrol facilities. The accidents inside the plant affecting workplace in vicinity cannot be ruled out. Work-force inside the plant shall be exposed to various high pressure system pipelines and vessels, acids andchemicals, fuel such as coal and furnace oil and other process equipment which, if not properly operatedand maintained, can cause serious accidents affecting life and property in the vicinity of accident site. Inaddition to these, numerous material handling systems, heavy road transport, high-tension electric lines,level crossings, overhead cranes and various other handling and transport systems always have achances of accidents.
Asituation will be called a `Disaster' if it entails any one or more of the following factors:Risks of loss of human lives -ten or more in one single situation.Loss of property as a consequence of the incident is over Rs.1 crore and/or bears a potential to the above.Asituation which goes beyond the control of the available resource of the plant.A situation apparently may not have much loss but its long-term severity can affect loss of life, productionand property.The types of possible disaster are given below:Type of disastersi) Disaster due to emergencies on account of:
ii) Disaster due to natural calamity on account of :FloodEarth quake / cyclone / Storm / Cloud burst / lightningiii) Disaster due to external factors on account of:
This Emergency Response Plan (ERP) describes the general types of emergency and actions to befollowed, should an emergency occur during the construction and operational phase of the project. TheERP includes:
FireExplosionOil spillageSpillage of toxic chemicals
Food poisoning / water poisoningSabotage
To identify type of major disasters, which may occur in the plant·To collect data on type of disasters, which has happened already in other steel plantsAn action plan to handle disaster.
5.23 Emergency Response Plan
5.23.1 Definition of Disaster
5.23.2 Electrocution
5.23.3 Objectives
••••
••
•••
Environmental and SocialImpact Assessment Report99
Section - 5 : Action Plan & Management System

5.23.4 Identification Of Hazardous Process/Area
5.23.5Electrical premises
5.23.6 Level of Accident
5.25 Plant layout:
LEVEL I
LEVEL II
5.24 DISASTER PREVENTIVE MEASURES
1. Furnaces area -Explosion2. Fuel Oil tanks -
1. Electrical Rooms -Fire & Electrocution2. Transformer area -Fire & Electrocution3. CableTunnel -Fire & Electrocution
If there is any disaster in any part of the plant /work place due to any reason the area which may be affectedcan be classified in the following four classes.1. Level I -Operator level2. Level II -Local/community level3. Level III -Regional/ national level4. Level IV -International levelOnly level I and II class of accidents can be considered for the steel plant.
Under this level, disasters may happen due to fire, explosion, oil spillage and spontaneous ignition ofinflammable materials. This level has probability of occurrence affecting persons inside the plant. Thevarious shops, which have been mentioned as potential hazard areas, will be affected during this level ofaccident.
In case of sabotage/complete failure of all automatic control/warning systems for example in fuel oilstorage area the oil kept in tanks and covered by tank bund may leak out. However, the probability of this isvery low due to adequate security and training of persons of the plant operating such system.
If any disaster takes place it is not easy to control if contingency plans are not available. For effectivecontrol of disaster adequate manpower, technical know-how, alertness and internal help are necessary. Italways betters to take preventive measures to avoid any disaster. In proposed plant following preventionmeasures will be taken to prevent disaster.
Design, manufacture and construction of all plant and machinery's and buildings will be as per nationaland international codes as applicable in specific cases and laid down by statutory authorities. Provision ofadequate access ways for the movement of equipment and personnel are kept. Minimum two numbers ofgates for escape during disaster shall be provided. Sitting of fuel oil storage shall be in protected fenced
Fire & SpillageTurbine Hall ExplosionBoiler Explosion
•••
Environmental and SocialImpact Assessment Report 100
Section - 5 : Action Plan & Management System

area inside tank bend. Water spraying in coal storage area is to be provided
The existing plant is having a well-equipped fire-fighting group for the existing steel plant with 5 officers, 25workers trained in this field. Following fire-fighting equipment are in place and 20% additional work forceand infrastructure will be provided at 3.0 MTPA.- FireTender 4 Nos.- Jeep 4 Nos- Portable Extinguishers Lot- Foam generator Lot- Static tanks Lot
The existing steel plant has a safety department manned by experienced engineers and staff whose mainjob is to bring about safety consciousness amongst the work force in the plant. The safety departmentconduct regular safety awareness courses by organizing seminars and training of the personnel amongthe various working levels.Safety awareness are also created by the various posters highlighting the safe working practices indifferent shops, hazards in working area, public places and roads etc. Safety engineers of the plantconduct regular checks and mock exercises on the safe working of their department and report is given todepartmental head for corrective measures to improve the safety conditions. This department will beproperly augmented at 3.0 MTPA.
5.25.1 Fire Fighting
5.26 Safety
Environmental and SocialImpact Assessment Report101
Section - 5 : Action Plan & Management System
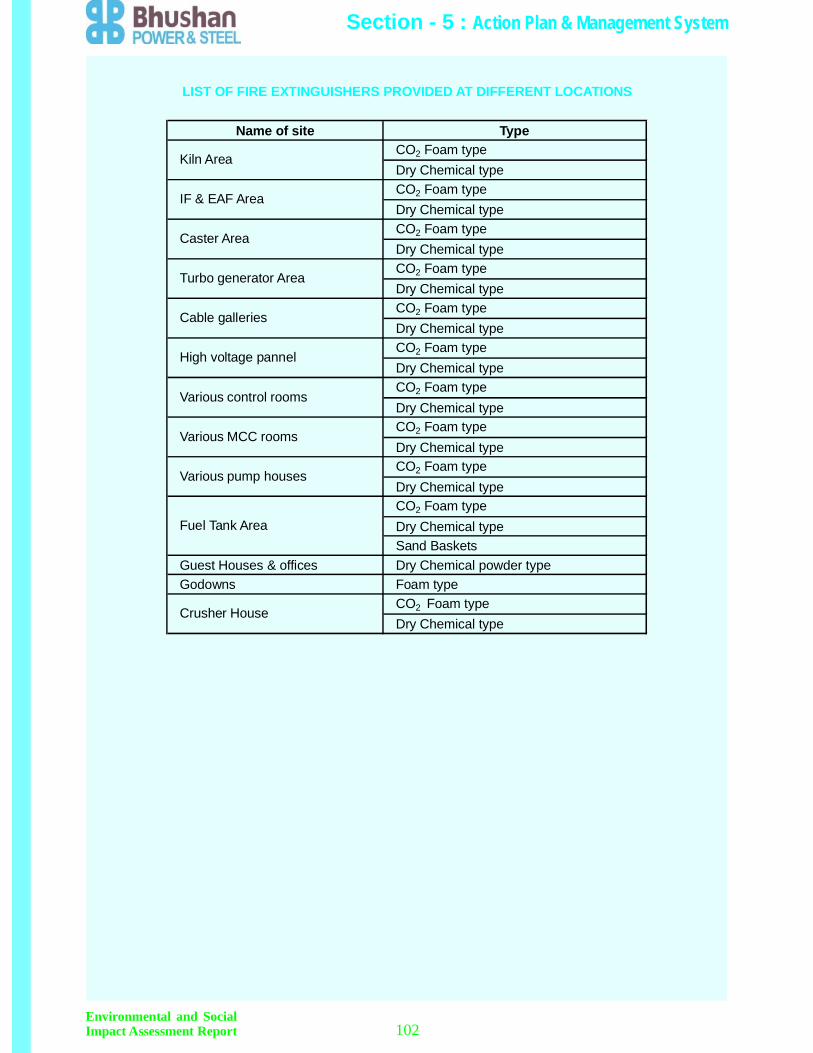
Environmental and SocialImpact Assessment Report 102
LIST OF FIRE EXTINGUISHERS PROVIDED AT DIFFERENT LOCATIONS
Section - 5 : Action Plan & Management System
Name of site TypeCO2 Foam typeDry Chemical typeCO2 Foam typeDry Chemical typeCO2 Foam typeDry Chemical typeCO2 Foam typeDry Chemical typeCO2 Foam typeDry Chemical typeCO2 Foam typeDry Chemical typeCO2 Foam typeDry Chemical typeCO2 Foam typeDry Chemical typeCO2 Foam typeDry Chemical typeCO2 Foam typeDry Chemical typeSand Baskets
Guest Houses & offices Dry Chemical powder typeGodowns Foam type
CO2 Foam typeDry Chemical type
Various control rooms
Various MCC rooms
Various pump houses
Fuel Tank Area
Crusher House
High voltage pannel
Kiln Area
IF & EAF Area
Caster Area
Turbo generator Area
Cable galleries

5.27 Training
5. 28 Functions of Disaster controller
5.28.1 Functions of Officer In-charge:
5.28.2 Functions of Commanding Officers of various services:
A department of training is set up to train officers. They will arrange training on safety accident prevention,first aid, hazard control, house keeping and environmental management. Special emphasis with mockdrills in disaster control will also be planned.CommunicationDuring the proposed modification-cum-expansion of steel plant there is an up-to-date communicationfacilities with telecommunication and wireless, walkie-talkies, telecommunication and loud speakers ineach shop, office and gate to warm workers in case of an accident.Organization to combat contingencyThe contingency plan is prepared from the experiences of accidents that have occurred in various otherSteel plants. The contingency plan being a dynamic plan will need periodical reviews and modificationswith new experiences. Even with all precautionary measures taken to avoid disaster, disaster may occur.To tackle situations during and after disaster, a well-defined contingency plan is a must.A Disaster ControlRoom (DCR) has already been set up having links with all plant control rooms. An officer manning theDCR. On getting information about any accident, the officer verify from the affected plant control room andinform the Disaster Controller (DC) and/or other co-ordinators immediately.The responsible officers of Disaster Control Group assemble in the DCR and formulate control proceduresas per the contingency plans. The functions of the various officers of the Disaster Control Group are asfollows:
Disaster Controller will nominate an officer whose functions will be as follows:To be responsible for the operation of DCR and for the dispatch of messages.To decide on the priority of dispatch of messages.To keep liaison with all activities and give up to date and accurate appreciation of the situation.To be responsible for the efficient organization of the Disaster Control Room.
The Commanding Officers of various services are designated Coordinator (services), Coordinator
To declare "Disaster Emergency" after consulting the Sr. officer available and inform Fire StationControl Room to sound the sirens accordingly and arrange to convey the message in public addresssystemTo report to DCR immediately.To receive messages from the communication center.To take decisions in consultation with the Commanding Officers of different services and conveythem to the disaster point.To be responsible for planning and provisions of assistance from township and from local authorities.To keep higher authorities informed about the situation.The decision of the Disaster Controller on any matter to meet the objective of disaster control plan willbe final.
•
•••
•••
Environmental and SocialImpact Assessment Report103
Section - 5 : Action Plan & Management System
(Operation) and Coordinator (external services).The following are their functions:To report to the Control Post immediately on hearing "Disaster Siren".To keep Disaster Controller posted with the up-to-date information regarding manpower and materialavailable concerning their respective services.To advise Disaster Controller on all matters arising out of disaster.To assist Disaster Controller for provision of material and man power concerning his service.To convey message to his service teams through communication centre after consulting DisasterController.To consult between themselves on matters related to more than one service and to decide on the action tobe taken.
The Commanding Officer of Casualty Services will be medical officer.
On getting a signal from the Disaster Control Room or information on telephone or hearing siren, the Sub-Commanding Officer of the Casualty service will report to hospital and doctor on call duty and first aidpersonnel will report to Disaster Control Room. The Ambulance with the driver will report to DisasterControl Room. First aid parties will render first aid to casualties at the place of occurrence and thoserequiring further treatment would be transported to the nearest hospital by ambulance.In case of extra help from outside or within CMO would contact Co-ordinator (Planning) for help in areassuch as:
It is necessary to give first aid to the persons injured in disaster. There will be two first aid posts to meet theworkload, one post will be near the Disaster Control Room and the other post will be in the townshiphospital.At each post 3 first aid parties shall be kept in rotating shifts of 8 hours.Rescue and repair servicesThe responsibility of effective working of Rescue and Repair Services are with Co-ordinator (Services)and Sub-Commanding Officers as follows:
Each rescue party will be provided with the following equipment:
Extra medical helps from neighboring hospital or main hospitalEvacuating the casualtieEssential assistance in first aid
To extricate persons from the debris of collapsed building and save human lives.To hand over the dead bodies and injured persons to first aid parties.To take immediate steps as may be necessary for the temporary support or demolition of buildingsand structures, the collapse of which is likely to endanger life or obstruct traffic.To cut of supplies of water, steam & gas, electricity to damaged buildings / structures.
Gas mask respiratorFire proximity suits
5.28.3 Casualty services
5.28. 4 FirstAid
5.28.5 Rescue services
PROCEDURE FOR TREATMENT
•••
•••
•
••
Environmental and SocialImpact Assessment Report 104
Section - 5 : Action Plan & Management System

••••••••••
•••
•••
••••
ResuscitatorsPetromax lamp, TorchesAxes/hand sawFire entry suitsFire blanketsRopesLaddersRubber glove (Tested up to 25,000 voltage)BlanketsRubber shoes or Industrial shoes.
To take up quick repairs of the damaged machinery.To take up repair of damaged building roads and culverts.To maintain essential public utility services viz. water, electricity and sewage system.
To co-ordinate fire fighting activitiesTo enforce all regulations for prevention of fire.To request neighboring industries and District Authority for rendering services of their fire fightingcrew under mutual aid schemes, if necessary.
Dispath of vehicle to the place of incident as per orders from the DCR.To get back the vehicle as soon as the work is completed.General administration of the depot including repair and maintenance of vehicle.Storage maintenance and inspection of equipment.
Fire officer will be the Commanding Officer of Fire Fighting Services. Additional strength for fire fightingwhich is beyond the control of fire station will come from security and maintenance personnel and ifrequired form outside fire stations.
The free movement of the fire vehicles and ambulance at the scene of fire/emergency is very importantand therefore, the security personnel on duty must ensure that all the roads at the scene of fire/emergencyare kept clear and free from obstruction. Persons arriving by motor transport at the scene offire/emergency must not park their vehicles within 100 meters of fire, near fire hydrants, at road junctionand at access roads. The ignition key should be left in the vehicles.
Repair services
5.29 Fire fighting services
Functions
Traffic control
Depot and Transport servicesFunctions:
Environmental and SocialImpact Assessment Report105
Section - 5 : Action Plan & Management System

•••
•••••
Maintenance of discipline and moral.Ensuring adherence to the depot duties.Welfare of personnel in the depot.
To provide shelters to affected persons.To arrange enough stock of essential commodities through co-operative society.To arrange cooking of food in canteen supply to place where people are given shelters in township.For plant people, food will be supplied within battery area by mobile vans.To arrange drinking water, if supply is disrupted, with the help of DistrictAuthorities.
The Sub-Commanding Officer and his staff will promptly attend to all major repairs of the essential vehiclesunder his supervision.
The Commanding Officer will contact Co-ordinator external services for arrangement of fuel for vehiclesduring fuel crisis and stop supplying fuel to vehicles other than those, which are in use for disaster control.
Asenior person will head supply service from stores department.
The salvage services will be under the charge of Committee. This committee will be formed taking oneperson from stores and one from production.
Management of proposed Steel plant will nominate one person from administration side and he will be theCommanding Officer of welfare services.Vacant buildings, schools complex and club will be used for housing those rendered homeless.Emergency camps will be set up only in exceptional cases on playing ground. For this purpose necessarymaterial will be brought from nearby market.
One mobile canteen in a motor van/truck will be made available in the plant area. The mobile van will bestationed in Depot.
There will be one cooperative society in township, which will be dealing in essential commodities. TheDistrict authorities during any emergency will further supplement the resources of this society.
Vehicle repair
Fuel
Supply services
Salvage service
5.30 Welfare services
Functions
Mobile canteen
Co-operative Society
Environmental and SocialImpact Assessment Report 106
Section - 5 : Action Plan & Management System

5.31 Security services
Functions
Crash shut down of Units
Function:
Public Relation Service
Alarm System
PublicAddress System.
Chief Security officer will be Commanding Officer, Security Services.
Security services will be primarily responsible for the security of the plant.Commandant in consultation with co-ordinator (external service) will keep a close liaison with local policeand district authorities.
Section head will be the Commanding Officer for Crash Shut down of the units, which are affected and mayfurther aggravate disaster.
To shut down the unit(s) affected and which may cause further disaster.
The Officer-in-Charge of Public Relation Services will look after this job.
On receiving the message of `Disaster' from Disaster Controller, fire station control room attendant willsound SIREN WAILINGTYPE FOR 5 MINUTES. DC will arrange to broadcast disaster message through
On receiving the message of "Emergency Over" from DC the fire station control room attendant will giveAllClear Signal by Sounding Siren straight for two minutes. The features of the alarm system will beexplained to one and all to avoid panic or misunderstanding during disaster.Actions to be taken on hearing the warning signalOn receiving the message of "Disaster" the following actions will be taken.All the co-ordinators will report to the Disaster Control Room even if not contacted by the Cell :The Commanding Officers and Sub-Commanding Officers will report to the place of accident.The Process Unit persons will remain ready in their respective units for crash shut down on the instructionfrom the co-ordinator.The persons from other sections will report to their respective officer.The concerned section (Civil, Engineering Services, Mechanical, Project etc.) will take immediate actionto remove contractors personnel outside the plant gate.The residents of the township will remain alert.
To control the vehicular traffic inside the plant.To help local police in patrolling the area of plant and outside the battery area, necessary.To assist Fire fighting services in fighting fires.To assist in transporting injured persons.To assist local police in patrolling in township and work out adequate arrangement for protection ofproperty.
•••••
Environmental and SocialImpact Assessment Report107
Section - 5 : Action Plan & Management System

Disaster due to natural calamity and external factors
Chemicals/Oil spillage
Cloud burst/lightning
Food poisoning
Closure Plan
Most of the measures & processes shall be same as given under in-house disaster except that the disastercontroller will contact the state / district authorities for necessary instructions to co-ordinate with them.
The possibility of large chemical/oil spillage in the final effluent discharged in reservoir is remote. However,DC will arrange to inform the following:
Cloud burst/lightning may lead to a situation, which could be minor to major emergency. In suchemergency, actions indicated under fire and explosion will be initiated.
In case of food poisoning in plant canteen the following actions will be taken:
Security Personnel and employees will help in evacuating the affected people to various hospitals.
Approach to Closure PlanningThis CDP addresses individual closure issues and action required.
State Pollution Control BoardDistrict authorities and request them to arrange patrolling of the area along with security personnel.District authorities, to warn people in the affected area against fire/hazard that may occur and againstthe adverse effect of using water for any purpose.Disaster Controller along with Commanding Officers takes overall charge of the situation.DC will inform the people of likely affected areas through communication system to leave the areaand move to other safe areas earmarked.DC will inform co-ordinator, external services to inform the District authorities of the disaster andrequest them for help.To arrange medical aid for the affected people.DC will arrange inspection of affected areas to get first hand knowledge of damages occurred.
DC will inform the medical officer of steel plant health center for immediate first aid.DC will contact DistrictAuthorities and seek their help, if necessary.
•••
••
•
••
••
Environmental and SocialImpact Assessment Report 108
Section - 5 : Action Plan & Management System
5.32 ConclusionBPSL is already operating the current 2.2 MTPA stream for the last couple of years and has alreadyestablished environment management system due to which the plant is running efficiently without anyenvironment related problems and also socio-economic issues. The present management team is quitecompetent to deal with the expanded plant of 3.0 MTPA.As mentioned earlier, due to adoption of latest technology of world standards and by world leaders, theenvironment impact on the total plant will not have any effect on environment. After detailed investigation,the ambient air quality is likely to marginally improve when new units of Blast Furnace, Coke Oven andSinter Plant will be commissioned since requirement of DRI for steel production will reduce due toavailability of additional hot metal and EAF can run with use of about 70-75% hot metal. This will in turnsignificantly reduce the energy consumption. The present environment management team may bemarginally be strengthened at 3.0 MTPA. For solid waste management, BPSL has already arrangedadditional lands near to the present ash dump yard for dumping of solid waste.The action plan & management system related to environment and social issues is summarized in table no5.7.
Environmental and SocialImpact Assessment Report109
Section - 5 : Action Plan & Management System
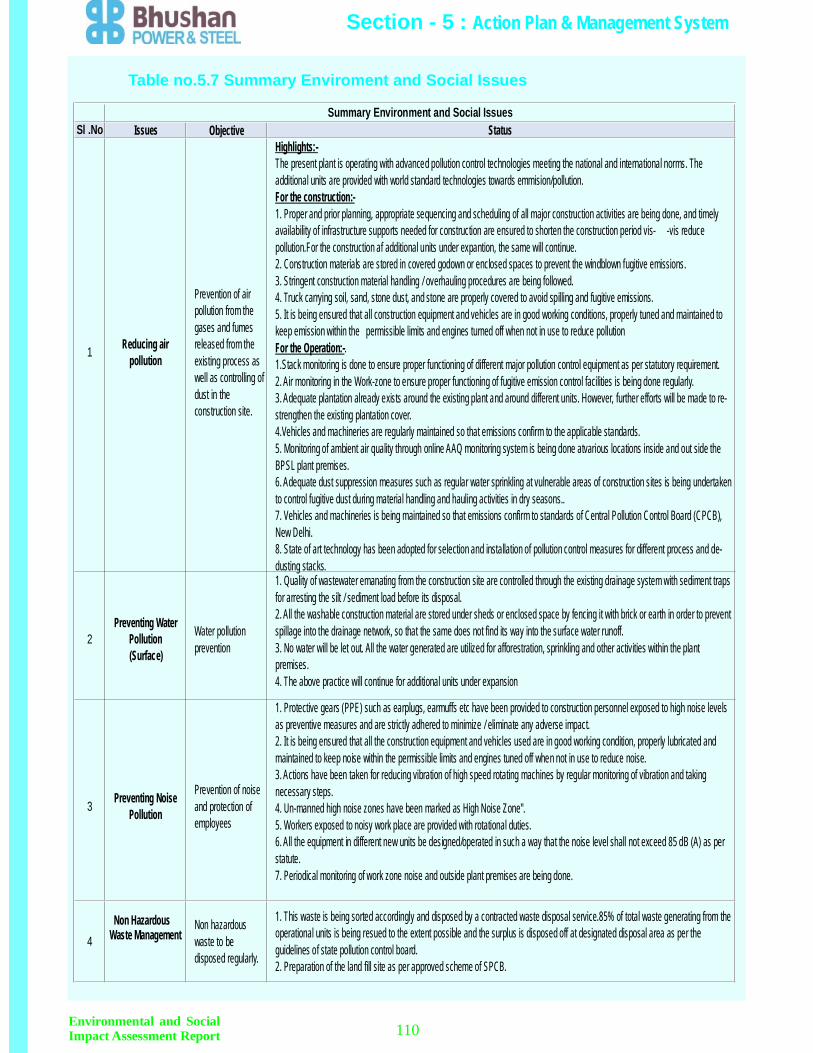
Environmental and SocialImpact Assessment Report 110
Section - 5 : Action Plan & Management System
Table no.5.7 Summary Enviroment and Social Issues
Sl .No Issues Objective Status
1 Reducing airpollution
Prevention of airpollution from thegases and fumesreleased from theexisting process aswell as controlling ofdust in theconstruction site.
Highlights:-The present plant is operating with advanced pollution control technologies meeting the national and international norms. Theadditional units are provided with world standard technologies towards emmision/pollution.For the construction:-1. Proper and prior planning, appropriate sequencing and scheduling of all major construction activities are being done, and timelyavailability of infrastructure supports needed for construction are ensured to shorten the construction period vis- -vis reducepollution.For the construction af additional units under expantion, the same will continue.2. Construction materials are stored in covered godown or enclosed spaces to prevent the windblown fugitive emissions.3. Stringent construction material handling / overhauling procedures are being followed.4. Truck carrying soil, sand, stone dust, and stone are properly covered to avoid spilling and fugitive emissions.5. It is being ensured that all construction equipment and vehicles are in good working conditions, properly tuned and maintained tokeep emission within the permissible limits and engines turned off when not in use to reduce pollutionFor the Operation:-.1.Stack monitoring is done to ensure proper functioning of different major pollution control equipment as per statutory requirement.2. Air monitoring in the Work-zone to ensure proper functioning of fugitive emission control facilities is being done regularly.3. Adequate plantation already exists around the existing plant and around different units. However, further efforts will be made to re-strengthen the existing plantation cover.4.Vehicles and machineries are regularly maintained so that emissions confirm to the applicable standards.5. Monitoring of ambient air quality through online AAQ monitoring system is being done atvarious locations inside and out side theBPSL plant premises.6. Adequate dust suppression measures such as regular water sprinkling at vulnerable areas of construction sites is being undertakento control fugitive dust during material handling and hauling activities in dry seasons..7. Vehicles and machineries is being maintained so that emissions confirm to standards of Central Pollution Control Board (CPCB),New Delhi.8. State of art technology has been adopted for selection and installation of pollution control measures for different process and de-dusting stacks.
2Preventing Water
Pollution(Surface)
Water pollutionprevention
1. Quality of wastewater emanating from the construction site are controlled through the existing drainage system with sediment trapsfor arresting the silt / sediment load before its disposal.2. All the washable construction material are stored under sheds or enclosed space by fencing it with brick or earth in order to preventspillage into the drainage network, so that the same does not find its way into the surface water runoff.3. No water will be let out. All the water generated are utilized for afforestration, sprinkling and other activities within the plantpremises.4. The above practice will continue for additional units under expansion
3 Preventing NoisePollution
Prevention of noiseand protection ofemployees
1. Protective gears (PPE) such as earplugs, earmuffs etc have been provided to construction personnel exposed to high noise levelsas preventive measures and are strictly adhered to minimize / eliminate any adverse impact.2. It is being ensured that all the construction equipment and vehicles used are in good working condition, properly lubricated andmaintained to keep noise within the permissible limits and engines tuned off when not in use to reduce noise.3. Actions have been taken for reducing vibration of high speed rotating machines by regular monitoring of vibration and takingnecessary steps.4. Un-manned high noise zones have been marked as High Noise Zone".5. Workers exposed to noisy work place are provided with rotational duties.6. All the equipment in different new units be designed/operated in such a way that the noise level shall not exceed 85 dB (A) as perstatute.7. Periodical monitoring of work zone noise and outside plant premises are being done.
4Non Hazardous
Waste ManagementNon hazardouswaste to bedisposed regularly.
1. This waste is being sorted accordingly and disposed by a contracted waste disposal service.85% of total waste generating from theoperational units is being resued to the extent possible and the surplus is disposed off at designated disposal area as per theguidelines of state pollution control board.2. Preparation of the land fill site as per approved scheme of SPCB.
Summary Environment and Social Issues

Environmental and SocialImpact Assessment Report111
Section - 5 : Action Plan & Management System
Issues Objective StatusSummary Environment and Social Issues
Sl .No
5 Hazardouswaste management
Hazardous wastesare to be disposedoff as per therequirement of thestatute
1. Hazardous waste such as ETP sludge is being sent to common disposal facility developed by Orissa waste management project inassociation M/s. Ramky Enviro Engineers for proper stabilization and disposal. Used Oil and lubricants are sold to Authorized vendorsfor reprocessing.2. The plant is designed on zero discharge concepts. No process effluent or waste water or effluent is discharged outside the plantboundary. Effluent treatment plant (ETP) of capacity 150 m3/hr is in operation for treatment of effluent generating from CRM complex
6Health
&Safety
Maintenance of safeand healthy workingcondition in theexiting plant as wellas on theconstruction site
1. Company has already setup a dispensary within the plant fully equipped with basic first aid materials. Also two doctors,pharmacists and assistance staff has been engaged for round the clock service. Pre-joining medical examination and periodic healthcheckups of all the employees as well as contractual workers are done in the dispensary. For ensuring better occupational health andsafety the following measures will be provided.2. To avoid accumulation of dust and fumes within the shop floor, proper control measures have been taken by installation of correcttype of pollution control equipment.3. Air conditioning plants are being properly maintained for supplying of cool air to control the instrumentation rooms4. Workers are subjected to regular medical examination according to requirement.5. The workers in the high noise areas are subjected to audiometric test and proper noise reduction equipment are supplied regularly.6. More doctors in plant medical unit are being trained in the field of occupational health as policy matter.7. Proper Housekeeping is being maintained on the shop floor anf the yard.
7 EnvironmentalMonitoring Plan
Regular checkingand monitoring ofenvironment statusof the project sites.
1. Environmental audits shall be carried out for expansion project of BPSL to check for compliance with standards / applicable normsby as being done for the operating plant.2. Third party environmental audits has been carried out.3. Necessary steps have been taken to implement the measures suggested by Central Pollution Control Board (CPCB) in the Charteron Corporate Responsibility for Environmental Protection (CREP) for Integrated Iron and Steel Industry applicable in the host country.
8 Maintenance ofDrainage System
Construction ofdrainage networkwithin the plant andregular checking andmaintenance of
1. Proper cleaning of all drainage channels has been conducted periodically.2. Regular checking is being done to see that none of the drains are clogged due to accumulation of sludge/sediments3. The catch-pits linked to the storm water drainage system from the raw material handling areas are regularly checked and cleanedto ensure their effectiveness
9 Green BeltDevelopment
Development ofgreen belt andextensiveafforestation in theproject site.
1. The data on area of green cover, survival rate etc. has been compiled for periodic review. BPSL has already planted approximately50,000 trees in almost all possible locations and continuously encourages others to plant trees in their garden, locality etc.2. A six monthly review of the health of the plants planted is being carried out.3. Regular watering, manuring and hoeing of the area of the plantation is carried out.
10 Road infrastructure
Development andimprovement ofpublic roads aroundthe project site andneighbouringvillages
1. Road infrastructure (Black top road) from the State Highway Sripura Railway crossing (RCC concrete 1 k.m).2. Black top road in the vicinity across SH Dhubenchapar, Paulipada & Khadiapali villages from Railway crossing to Derba villageBlack top road width 4 mtr., length 2.5 k3. Construction of cement concrete approach road near Ganesh Nagar upto Laripali 4.0 k.m.4. Development of morrum road from Talabora to Dantamura village.5. Construction of new cement concrete road & culverts (RCC) between Thelkoloi village upto the High School building.6. Maintenance work is taken up for the RD road leading from the SH to Babu Chakuli village.7. Construction of concrete road for R&R Colony.

Environmental and SocialImpact Assessment Report 112
Section - 5 : Action Plan & Management System
Issues Objective StatusSummary Environment and Social Issues
Sl .No
11 Village ponds andwater supply
Digging of newponds, renovation ofexisting of villageponds andarrangement fordrinking watersupply
1. Construction of large pond at Landupalli village for the people residing.2. Construction of pond at Khadiapali village for the welfare of the people.3. Drinking water is being provided in following villages through water tankers.(Lapanga, Dhubenchappar, Khadiapali, Thelkuli,Paulipada).4. Village pond renovation work at Paulipada, Bhuliad Bansimal, Dhubenchapar,Lapanga and Thelkoli including concrete steps.5. Drinking water to villages at Thelkoloi, Lapanga, Dhubenchappar, Khinda.6. Renovation of pond at village of Talabira.
12 Communitydevelopment
Construction /renovation oftemples,construction ofhouse for freedomfighter, club housesin the nearbyvillages.
1. BPSL has constructed a new house consisting of two Bed room, Bath room and Latrine with R.C.C. roof for the family members ofgreat Freedom Fighter late Sri Veer Surendra Sai at village Khinda.2. Temple for Lord Jagannath near the monument of Great Freedom Fighter at Village Khinda which is under construction.3. Renovation work for Samaleswari temple for Lord Jagannath at Laripalli village.4. Construction of temple in the R & R Colony.5. Renovation of Lord Sriram Temple.6. Construction of NewTemple for Maa Tarini at village Thelkoloi.7. Constuction of Club House for the villagers of Banjiberna, Khadiapali.8. Club house provided for the villagers at Landupalli village.9. Renovation work for Khadiapali youth club.
13 Augmentation ofeducational facilities
Construction /renovation of schoolbuilding, supportservices for schooletc.
1. Financial support of Rs. 3.0 lakhs/year being provided to the Thelkoloi school management committee.2. 3 Acr. of land acquired for the construction of Thelkoloi High School building with 8 RCC rooms having basic amenities includingtoilets, electricity and along with boundary wall with complete infrastructure.3. The company has also provided window grills to the Kisanpada Primary School, Thelkoloi.4. Construction of boundary wall for the school building at Dantamura village.5. Construction of primary school building at Buliadih village.6. Development of play ground at Khinda village High school. Electrification of Khinda High School along with fluorescent tube light,fans & Halogen light.7. Provision of corpus fund of Rs. 5 lakhs each contributed to the high school at Thelkoloi & primary school at Dhubenchapper.
14Development ofPlantations and
forest
Plantation ofadditional trees andaforestation in areassurrounding theplant.
1.Jungle Surakhya committee of Lapanga village were given Rs. 1.25 lakhs for forest development in the vicinity. Plantation is beingcarried out both inside & outside the plant area and peripheral villages. 20,000 seedlings have been planted each year since July 09and it is targeted to plant 60,000 seedlings during current season.

Environmental and SocialImpact Assessment Report113
Section - 5 : Action Plan & Management System
15 Training
Training of projectdisplaced person forincreasingemployability,induction training fornew employees andregular safetytraining forcompany's andcontractor'sworkmen
1. I.T.I training provided to 14 persons of PDF and 5 person selected from other village.2. Safety training programmes ( classroom and on the job training) organised for permanent and contractor employees in an ongoingbasis3. Fire drill conducted as per requirement4. 92 percent have been trained for rendering first aid treatment
16 Health - Check up
Regular healthcheck up ofemployess to becarried out
1. All employees including contractor workmen undergo pre-employment medical checkup2. Periodical medical examination of employees are carried out with special emphasis for detecting occupational and compensablework related diesease in addition to general health condition of employees.
17 EmergencyPreparedness
Formulation ofelaborate on-siteemergency andpreparedness planfor dealing withpossibleemergencies.
1. An On-site emergency plan which has been duly approved by the Directorate of Factories, Govt of Orissa has been prepared.2. An emergency oragnisation including key personnel has been established.3. A control room equipped with all emergency equipment and communication facilities has been established.4. Mock emergency and evacuation drills are carried out periodically.
18 Rehabilitation ofdisplaced people
Construction ofhousing facilitiesand otherinfrastructure for thepeople displayeddue to the projectconstruction.
1. All families (165 ) displaced due to the project have been given plots in the near by village.2. 155 houses have been built for the displaced families and 10 families obtained for self relocations who have been given adequatecompensation for self relocation.3. For the current phase of expansion, no families will be displaced.
19 Direct employment &Indirect Employment
Generation ofemployment bothdirect and indirectdue to proposedaugmentation ofcapacity to 3.0MTPA of steel.
1. The operating plant of BPSL has provided substantial employment opportunities both direct and indirect for the people around thearea.2. About - 1000 nos. of skilled, semi-skilled and unskilled work force will be employed during construction of expansion project units.3. The expansion project once completed will provide employment - to 15000 nos (direct & indirect) of people approximately.
Issues Objective StatusSummary Environment and Social Issues
Sl .No

Environmental and SocialImpact Assessment Report 114
Section - 5 : Action Plan & Management System
20Development of
Industry around theplant
Encouragement tobe given fordevelopment ofancillary and serviceindustries in andaround the plant
1. Other industries which came up subsequently has also contributed towards the development of ancillary units.2. This has hastened the process of growth of small-scale industrial economy around the steel plant complemented by the servicessector. This is playing and continues to play a major role in the further economic and social development of this area.
21 Creation of planttownship
A township forhousing thecompany employeesto be built.
A small township along with all necessary social amenities has been constructed to provide residential accommodation of about 250officials of plant
22 Traffic Management
Establishment of arailway siding andconstruction of roadinside the plant
1. A railway siding for the purpose has been setup in the plant through which material such as coal, iron ore, etc. are beingtransported through rail.2. Wide road network within the integrated steel complex to access the area for the construction and operation is being established.
Issues Objective StatusSummary Environment and Social Issues
Sl .No

A well established consultation system is working at BPSL, Jharsuguda which is established by District
Administration with Representatives of surrounding area, district administration and BPSL (Refer Section
4). The second attribute of consultation process is through Corporate Social Responsibility (CSR) where
development like School, Road, and Health Camp etc by BPSL is conducted regularly in consultation with
village representative and with their advice.
BPSL is in constant communication with the neighboring community through its welfare office and is
engaged in community development and health care on an ongoing basis.
Section - 6 : Consultation & Disclosure
Environmental and SocialImpact Assessment Report115

Bhushan Power & Steel has established a grievance cell to address the grievances related to social and
environmental issues with respect to operation of the integrated steel plant. The mechanism allows allstake holders to lodge a complaint or suggestion with respect to the company activity. Following are the
different ways to receive the complain
1. Drop boxes are provided at all the gates where any person can drop their complain or suggestion in the
form of letter.
The drop box is checked on daily basis by the PRO who functions under Personnel &Administrative (P&A)
Department.
Based on the type of complain the letter is then forwarded to the concern department with a copy to the
Unit Head.
Aresponse letter / massage is sent to the petitioner acknowledging the receipt of his grievances and also a
tentative time is mentioned for taking action.
Action is initiated by the respective department to check and address the matter within the specified time
frame and after taking the corrective action information is given to the petitioner regarding the same.
2. To address the grievances of the peripheral villagers The District Administration has formed aRehabilitation & Periphery Development Advisory Committee (RPDAC) for the company. The
representatives of all the peripheral villages, District Administration, and the company are the member of
this committee. This committee meets once in a year.
All the grievances of different villages and other members are put forward on this forum and necessary
course of action by the company is discussed.
Company also deliberates its action plan regarding various CSR activities planned for the year.
Note: Also refer IFC Performance Standard 2 Labour and Working Conditions as mentioned in the
Section 4 of this report.
Section - 7 : Grievance Mechanism
Environmental and SocialImpact Assessment Report 116
Sl. No. Year No. of Complain /suggestion received
No. of complain/suggestions addressed
1 2009-10(1st April to 31st march) 3 2
2 2010-11(1st April to 31st march) 6 3
3 2011-12(1st April to 31st march) 4 3

The present environment system of BPSL takes into account the various guidelines and rules ofMOEF/ CPCB enacted for control of pollution in India. It also considers guidelines of InternationalFinance Corporation (IFC), Equator Principles, etc. The attributes of the environment system is asfollows.
•
•
•
•
•
•• The air quality parameters monitored time to time are much below the values indicated in the
present pollution control act in India and are comparable to the values mentioned in IFCguidelines (Refer the Chart below).
The process units of the plant incorporate latest technologies towards pollution control,energy consumption, fuel consumption, automation and control. The technologies for theadditional units selected by BPSl especially towards energy, pollution and CO emissioncontrol are as per world standard
The operating units in the plant have been provided with the pollution control equipmentswith latest technology and all the equipments are performing satisfactorily.
All pollution control equipments installed in the operating plant are meeting the national andinternational standards.
The solid waste collection and disposal procedure is according to the guidelines of nationaland international pollution norms. This is being regularly monitored by statutory inspectionauthorities.
Zero water discharge concept from inception is being effectively monitored.
Pollution control systems in new units are designed to meet the national & internationalstandards.
BPSL environment management team of professionals is quite competent and fully gearedup to meet the requirement of 3.0 MTPAexpansion.
BPSL has installed online ambient air quality monitoring systems at few locations.
Two numbers of waste water treatment plant and ETP are operating efficiently.
The company has been accorded with ISO 9001:2008 and ISO 14001:2004 & ISO/TS 16949certification.
Housekeeping within the plant has been strengthened and objective of cleanliness is beingmet. Plantation over the solid waste reclaimed area is grown and the same has started on thesecond area. Plantation to a tune of about 150000 trees covering area of about 150 to 170acres have been done in and around the plant area.
Pre joining and periodical health checkup of workers are being done at companies owndispensary.
Acoustics have been provided in power plant turbine building and compressor houses
The projected impact due to installation of new units for air emission will be very less and total
2
.
.
•
•
•
•
•
•
•
•
Section - 8 : Conclusion
Environmental and SocialImpact Assessment Report117

values will be still within the international norms and in line with the requirement of IFC EHSGuideline for Integrated Steel Mills and Indian statutory requirements.
All pollution generating units are attached with requisite pollution control equipment withlatest technology and to meet the national and international standards. The monitoringresults also indicate that all the installed pollution control equipments are performingsatisfactorily.
The present waste management of BPSL is commendable meeting the internationalprinciples, guidelines etc. as contained in IFC attributes.
Peripheral development activities are being carried out under CSR in the surroundingregions which has uplifted the socioeconomic condition of the area. Company shallfurther continue to take-up such peripheral development works specifically towardsfurther development in education and medical facility in the region.
The basic principle of socio-economic development of BPSL is periodic consultation ofvarious groups/ communities of surrounding area of the plant. The CSR group of BPSL isresponsible to address all the issues & concerns and ensures resolution therebyensuring effective community engagement process CSR initiative is taken forimplementation after the above process of consultation mechanism is completed.
The various attributes of pollution management of BPSL is regularly being monitored byregulatory authorities of Orissa Pollution Control Board/ MOEF through physical visits/inspection. This is also subjected to scrutiny by Peoples Group/ NGO.
BPSL plant has uplifted the socio-economic condition of the surrounding people. Theliteracy, income, general health, basic amenities etc. have improved.
.
•
•
•
•
•
•
Environmental and SocialImpact Assessment Report 118
Section - 8 : Conclusion
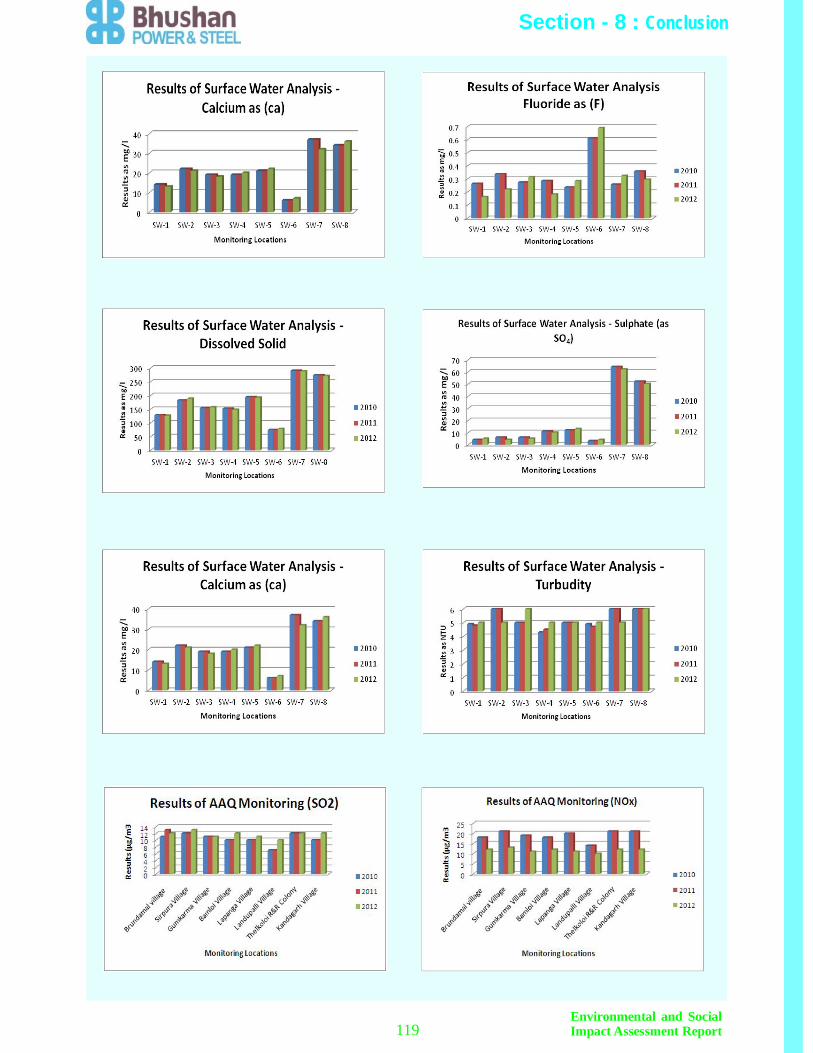
Environmental and SocialImpact Assessment Report119
Section - 8 : Conclusion

Environmental and SocialImpact Assessment Report 120
Section - 8 : Conclusion