Embed Size (px)
Citation preview
CHAPTER 22
Performance Tuningand TroubleshootingSQL Server 2005
Performance and troubleshooting in SQL Server 2005 go hand inhand for database administrators. Most often, troubleshooting aSQL Server comes down to troubleshooting performance issues.
Performance tuning and troubleshooting performance issues areiterative processes consisting of monitoring, troubleshooting,adjusting, and repeating. When you’re troubleshooting perform-ance, it is helpful to have a goal in mind, such as having a specificquery execute in less than X seconds.
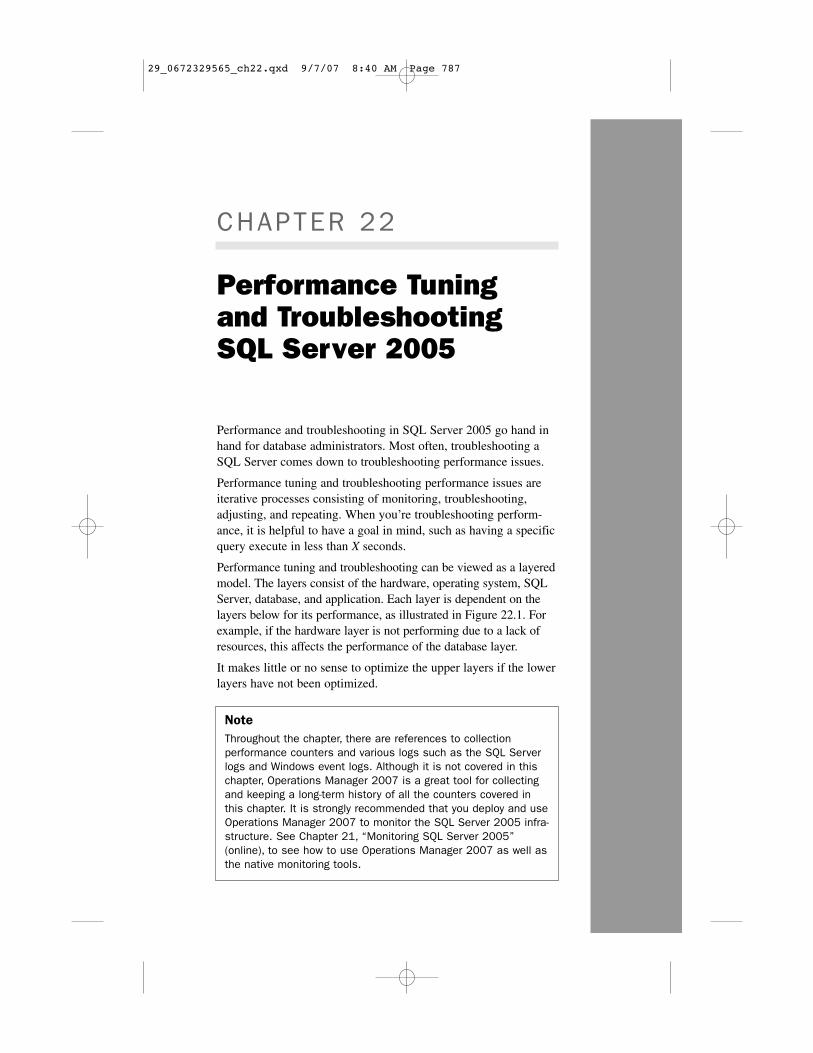
Performance tuning and troubleshooting can be viewed as a layeredmodel. The layers consist of the hardware, operating system, SQLServer, database, and application. Each layer is dependent on thelayers below for its performance, as illustrated in Figure 22.1. Forexample, if the hardware layer is not performing due to a lack ofresources, this affects the performance of the database layer.
It makes little or no sense to optimize the upper layers if the lowerlayers have not been optimized.
NoteThroughout the chapter, there are references to collectionperformance counters and various logs such as the SQL Serverlogs and Windows event logs. Although it is not covered in thischapter, Operations Manager 2007 is a great tool for collectingand keeping a long-term history of all the counters covered inthis chapter. It is strongly recommended that you deploy and useOperations Manager 2007 to monitor the SQL Server 2005 infra-structure. See Chapter 21, “Monitoring SQL Server 2005”(online), to see how to use Operations Manager 2007 as well asthe native monitoring tools.
29_0672329565_ch22.qxd 9/7/07 8:40 AM Page 787
Appropriately, this chapter starts with troubleshooting performance at thelowest level.
788 CHAPTER 22 Performance Tuning and Troubleshooting
Application
Database
SQL Server
Operating System
Hardware
FIGURE 22.1Optimization layers.
Platform Troubleshooting and OptimizationAt the root of almost all optimizations are the hardware and operating systemthat SQL Server resides on, collectively referred to as the platform. Theseareas are likely to be the first place to look to optimize, thus ensuring that theSQL Server 2005 infrastructure rests on a solid platform.
Platform Performance MeasuresIf the hardware is not sufficient for the load placed on it by SQL Server, theresult is performance issues and failures. When you’re troubleshootingperformance, this is one of the first areas to look into.
A set of key performance counters lets you know if the platform is experienc-ing performance problems. Capture these counters to understand how thehardware and operating system are performing at a high level. The objectsand counters are
■ Memory: Pages/sec—The Pages/sec counter exposes the rate at whichpages are read or written to disk during hard page faults. As thememory pages are transferred to and from the relatively slow diskstorage, the system will experience slow performance. The countershould be 20 or less on average, although it may spike. Add memory tothe server if this number is too high.
29_0672329565_ch22.qxd 9/7/07 8:40 AM Page 788
■ Memory: Available Bytes—The Available Bytes counter exposes theamount of physical memory available for allocation. There should be atleast 5MB of free RAM. If there is less than 5MB, consider addingRAM to the server.
■ Network Interface: Bytes Total/sec—The Bytes Total/sec counter isthe per second rate at which data is passing though the network inter-face card (NIC).
■ Physical Disk: % Disk Time—The % Disk Time counter is thepercent time that the disk is busy. This should be less than 55% overany sustained period of time, although it may spike occasionally. If thisnumber is too high, consider adding drives to the array to increase thespindles and spread the load, adding additional channels, or changingthe RAID version to a higher performance version (for example, RAID5 to RAID 0+1).
■ Physical Disk: Avg. Disk Queue Length—The Avg. Disk QueueLength counter exposes the number of disk requests that are waiting inthe queue. According to queuing theory, this should be less than 2 overany sustained period of time or the queue could become backlogged. Ifthis number is too high, consider adding drives to the array to increasethe spindles and spread the load, adding additional channels, or chang-ing the RAID version to a higher performance version (for example,RAID 5 to RAID 0+1).
■ Processor: % Processor Time—The % Processor Time counterexposes the time the processor is doing actual work. This value isarrived at in a backward fashion by measuring the percentage of timethe processor is idle and subtracting that from 100 to get the time theprocessor is busy doing work. This should be less than 80% over anysustained period of time, although it will spike occasionally. If thisnumber is too high, consider adding or upgrading the processors onthe server.
■ System: Processor Queue Length—The Processor Queue Lengthcounter exposes the number of threads in the processor queue. There isa single queue for processor time even on computers with multipleprocessors. If this exceeds 2 per processor (that is, 4 on a 2-processorserver or 8 on a 4-processor server), consider adding or upgrading theprocessors on the server.
Record the data in a sheet similar to Table 22.1. Better yet, enter it into aspreadsheet or a database for long-term storage and a historical record.
789Platform Troubleshooting and Optimization
29_0672329565_ch22.qxd 9/7/07 8:40 AM Page 789
Table 22.1 Hardware Counter DatasheetCounter Name Minimum Maximum Average
Memory: Pages/sec
Memory: Available Bytes
Network Interface: Bytes Total/sec
Physical Disk: % Disk Time
Physical Disk: Avg. Disk Queue Length
Processor: % Processor Time
System: Processor Queue Length
Capturing the Performance MeasuresTo illustrate the process, this section steps you through capturing and analyz-ing the performance counters. For ease of processing, the counters arecaptured to a counter log in the Performance tool.
To capture the counter logs, follow these steps:
1. Select Start, All Programs, Administrative Tools, Performance.
2. Expand the Performance Logs and Alerts folder.
3. Right-click on the Counter Logs and select New Log Settings.
4. Enter SQL Hardware Tuning for the name and click OK.
5. Click Add Counters and add all the counters in Table 22.1.
6. Click Close to close the window.
7. Click OK to save the settings and start the log.
Let the log capture data over a long enough period to capture a good profileof the utilization. Typically, this is at least 24 hours and not more than 7days. You can stop the log collection either manually or on a schedule in thecounter.
To view the logs, follow these steps:
1. Stop the counter log by right-clicking on it and selecting Stop.
2. Click on the System Monitor object.
3. Click on the View Log Data icon.
4. Select Log Files as the data source and add the log file from thecounter log.
5. Click OK to show the graph of the counters in the log.
790 CHAPTER 22 Performance Tuning and Troubleshooting
29_0672329565_ch22.qxd 9/7/07 8:40 AM Page 790
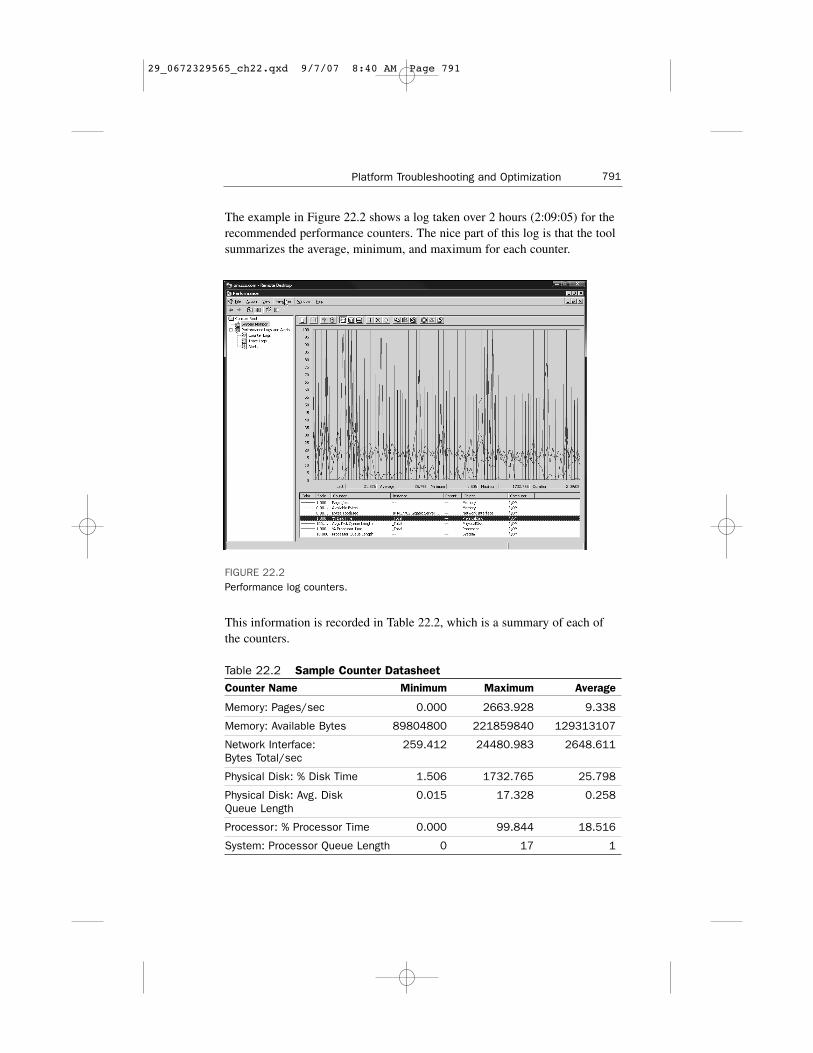
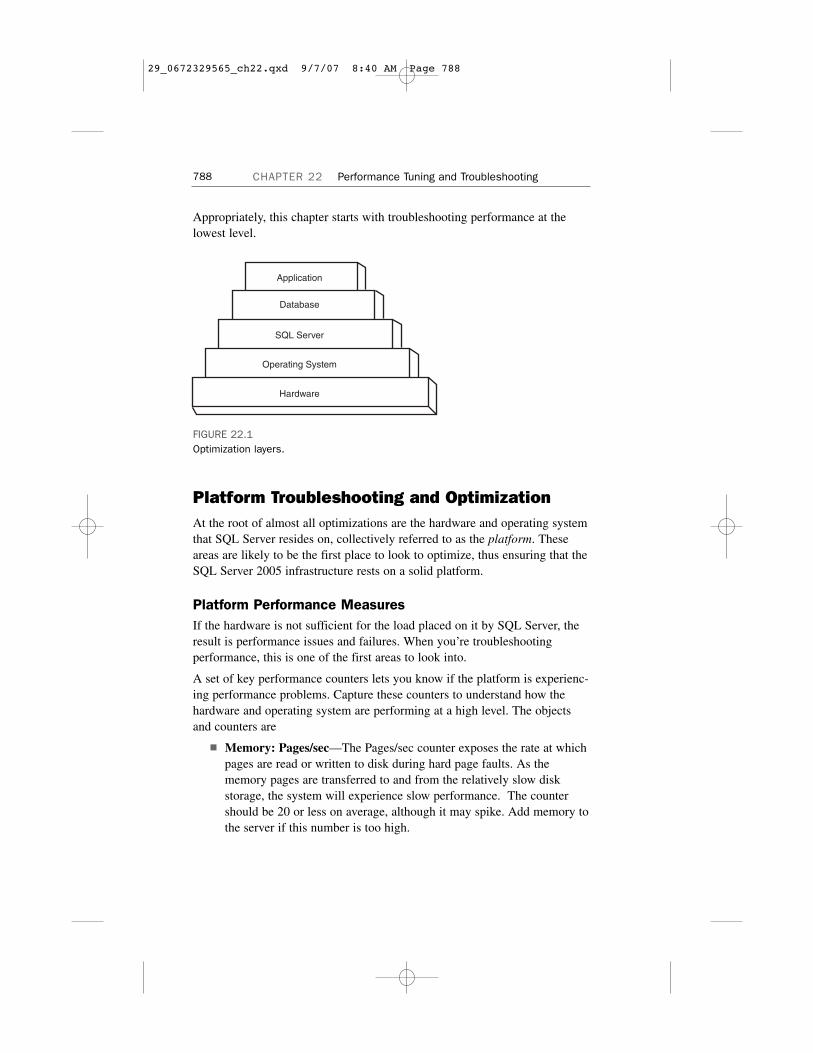
The example in Figure 22.2 shows a log taken over 2 hours (2:09:05) for therecommended performance counters. The nice part of this log is that the toolsummarizes the average, minimum, and maximum for each counter.
791Platform Troubleshooting and Optimization
FIGURE 22.2Performance log counters.
This information is recorded in Table 22.2, which is a summary of each ofthe counters.
Table 22.2 Sample Counter DatasheetCounter Name Minimum Maximum Average
Memory: Pages/sec 0.000 2663.928 9.338
Memory: Available Bytes 89804800 221859840 129313107
Network Interface: 259.412 24480.983 2648.611Bytes Total/sec
Physical Disk: % Disk Time 1.506 1732.765 25.798
Physical Disk: Avg. Disk 0.015 17.328 0.258Queue Length
Processor: % Processor Time 0.000 99.844 18.516
System: Processor Queue Length 0 17 1
29_0672329565_ch22.qxd 9/7/07 8:40 AM Page 791
Based on the previous description of the counters, the following recommen-dations can be made:
■ Memory: Pages/sec—The Pages/sec counter is averaging 9.338 and iswell under the limit of 20 with no sustained peaks.
■ Memory: Available Bytes—Memory is above 89MB even at theminimum and is well above the 5MB guideline.
■ Network Interface: Bytes Total/sec—This value peaking at 24KB islow utilization for a gigabit interface.
■ Physical Disk: % Disk Time—The average of 25% with no sustainedpeaks is well within the guideline of 55% or less.
■ Physical Disk: Avg. Disk Queue Length—The average of 0.258 iswell under the guideline of 2.
■ Processor: % Processor Time—The average of 18.516% is wellwithin the guideline of less than 80% over sustained periods. Thecounter does peak frequently at 55%, but even that is still well withintolerances.
■ System: Processor Queue Length—The system is a dual core, so theaverage of 1 is well within the guideline of 2 per core. There arefrequent peaks to a max of 17, so it might be an area to monitor.
Overall, the sample log shows no hardware performance issues and thus norecommended upgrades, so the platform gets a clean bill of performancehealth.
Component Troubleshooting and OptimizationAt the next level up in the performance diagram is SQL Server 2005. Thisserver is broken into the Database Engine, Replication Services, ReportingServices, Analysis Services, and Integration Services components. These serv-ices are typically subject to performance issues that require troubleshooting.
Each SQL Server 2005 component requires a slightly different approach anddifferent tools to troubleshoot performance.
Database EngineThere are a number of counter objects and counters that SQL Server 2005exposes to monitor the SQL Server Database Engine.
792 CHAPTER 22 Performance Tuning and Troubleshooting
29_0672329565_ch22.qxd 9/7/07 8:40 AM Page 792

The primary counters for performance troubleshooting are
■ SQL Server:Buffer Manager: Buffer Cache Hit Ratio—Specifiesthe percentage of pages found in the buffer cache without having toread from disk. The ratio is the total number of cache hits divided bythe total number of cache lookups over the last few thousand pageaccesses.
■ SQL Server:General Statistics: User Connections—Counts thenumber of users currently connected to SQL Server.
If the Buffer Cache Hit Ratio is too low, you need to install additionalmemory in SQL Server. The value should be at least 90% and ideally at 99%.However, with large databases with extensive access, this number might bedifficult to achieve.
Although there is no specific guideline on the number of users shown by theUser Connections counter, the utilization of SQL Server is proportional to thenumber of users. The more users the server is supporting, the higher the loadon the server.
Other important areas to monitor when troubleshooting the SQL Server 2005Database Engine are the Windows application log and SQL Server error logs.
The Windows Application Log contains application-level logs, includingthose from the SQL Server 2005 application. SQL Server and the SQLServer Agent both log events to the log. These logs should be reviewed whenyou’re troubleshooting SQL Server 2005.
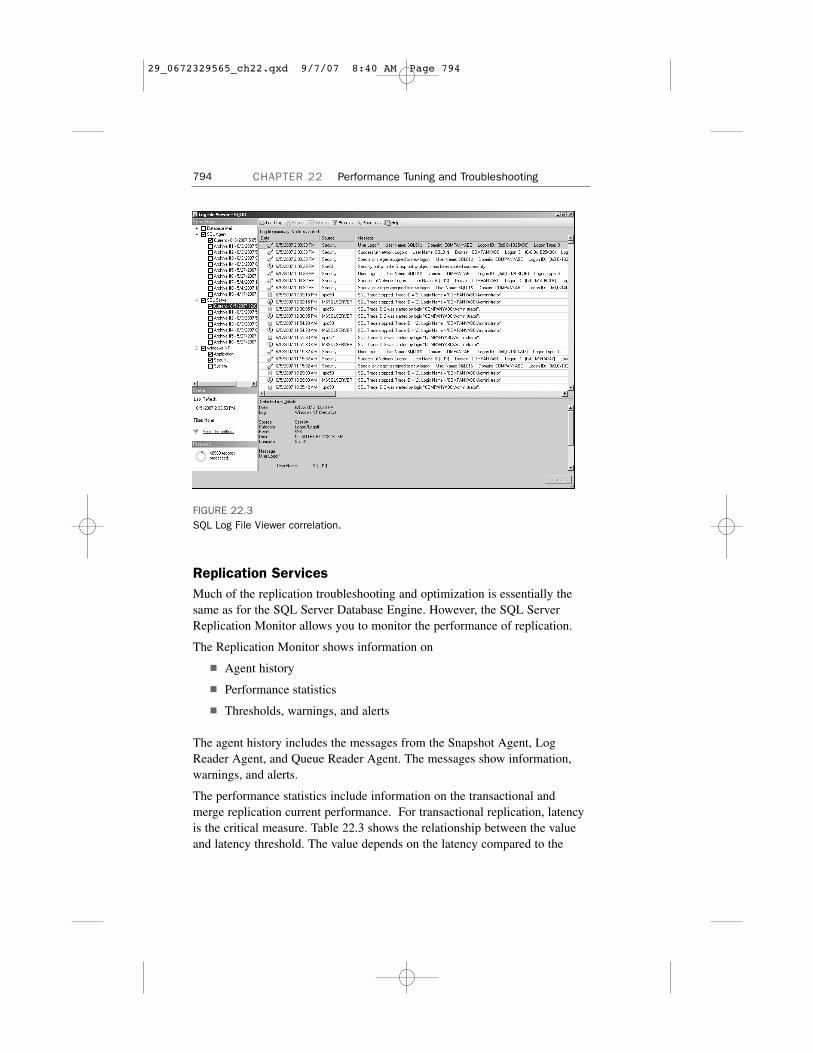
The SQL Server error log contains more detailed information than theWindows application logs and more pertinent to the SQL Server application.The SQL Log File Viewer supports viewing various logs at the same time,interleaving the log entries for easy correlation, as shown in Figure 22.3. Thefigure shows the aggregation of the SQL Agent log, SQL Server log,Windows application log, and Windows security log. This reduces the levelof effort needed to troubleshoot problems because events that are related andcausative can be seen in the same window.
You can access the SQL Server logs from the SQL Server ManagementStudio by selecting Management, SQL Server Logs.
Additional performance troubleshooting measures for the Database Engineare covered in the section “Database Troubleshooting and Optimization” laterin this chapter.
793Component Troubleshooting and Optimization
29_0672329565_ch22.qxd 9/7/07 8:40 AM Page 793
794 CHAPTER 22 Performance Tuning and Troubleshooting
FIGURE 22.3SQL Log File Viewer correlation.
Replication ServicesMuch of the replication troubleshooting and optimization is essentially thesame as for the SQL Server Database Engine. However, the SQL ServerReplication Monitor allows you to monitor the performance of replication.
The Replication Monitor shows information on
■ Agent history
■ Performance statistics
■ Thresholds, warnings, and alerts
The agent history includes the messages from the Snapshot Agent, LogReader Agent, and Queue Reader Agent. The messages show information,warnings, and alerts.
The performance statistics include information on the transactional andmerge replication current performance. For transactional replication, latencyis the critical measure. Table 22.3 shows the relationship between the valueand latency threshold. The value depends on the latency compared to the
29_0672329565_ch22.qxd 9/7/07 8:40 AM Page 794

threshold; that is, a lower number is better. If the latency is 10 seconds andthe threshold is 60 seconds, the latency is 15% of the threshold and thecolumn value shows Excellent.
Table 22.3 Transactional Replication Latency PerformanceExcellent Good Fair Poor Critical
0–34% 35–59% 60–84% 85–99% >100%
For merge replication, performance is rated by comparing the row synchro-nization history of all subscriptions in the publication with the same connec-tion type. The performance measure is expressed as a percentage of themerge subscription compared to the average. A higher number is better. If thepublication subscriber average is 50 rows per second and a subscription issynchronizing at 25 rows per second, the percentage is 50% and the perform-ance value shows Fair. Table 22.4 shows the values.
Table 22.4 Merge Replication PerformanceExcellent Good Fair Poor
151+% 76–150% 26–75% 0–25%
These values can be used to gauge how well replication is performing.
Finally, threshold, warnings, and alerts can be set to notify of performanceissues. This capability is useful for troubleshooting performance issues, inthat it keeps a record of time when performance drops. The thresholds cangenerate warnings and alerts if there are
■ Impending subscription expirations
■ Latency issues (transaction replication)
■ Synchronization delays (merge replications)
■ Subpar performance (merge replications)
All of these help you troubleshoot performance issues with ReplicationServices.
Reporting ServicesReporting Services performance troubleshooting is fundamentally based onthe Database Engine and Windows Internet Information Services (IIS).
795Component Troubleshooting and Optimization
29_0672329565_ch22.qxd 9/7/07 8:40 AM Page 795

In addition to the database tools, the tools used to troubleshoot performanceissues with Reporting Services are
■ Windows Event Viewer
■ Performance Monitor
Because much of the Reporting Services depends on the web services andDatabase Engine, performance problems can be addressed in these areas.
There are two Reporting Services–specific objects in the PerformanceMonitor:
■ MSRS 2005 Web Service, which monitors report server performance
■ MSRS 2005 Windows Service, which monitors scheduled operationsand report delivery
In the objects, MSRS is the acronym for Microsoft Reporting Services. TheMSRS 2005 Web Service performance object includes a collection of coun-ters used to track report server processing of interactive report viewing opera-tions. These counters are reset whenever ASP.NET stops the ReportingServices Web Service. Table 22.5 lists the MSRS 2005 Web Service counters.
Table 22.5 MSRS 2005 Web Service Performance CountersCounter Description
Active Sessions Number of active sessions.
Cache Hits/Sec Number of requests per second for cachedreports.
Cache Misses/Sec Number of requests per second that failedto return a report from cache.
First Session Requests/Sec Number of new user sessions that arestarted from the report server cache eachsecond.
Memory Cache Hits/Sec Number of times per second that reportsare retrieved from the in-memory cache.
Memory Cache Misses/Sec Number of times per second that reportscould not be retrieved from the in-memorycache.
Next Session Requests/Sec Number of requests per second for reportsthat are open in an existing session.
Report Requests Number of reports that are currently activeand being handled by the report server.
796 CHAPTER 22 Performance Tuning and Troubleshooting
29_0672329565_ch22.qxd 9/7/07 8:40 AM Page 796
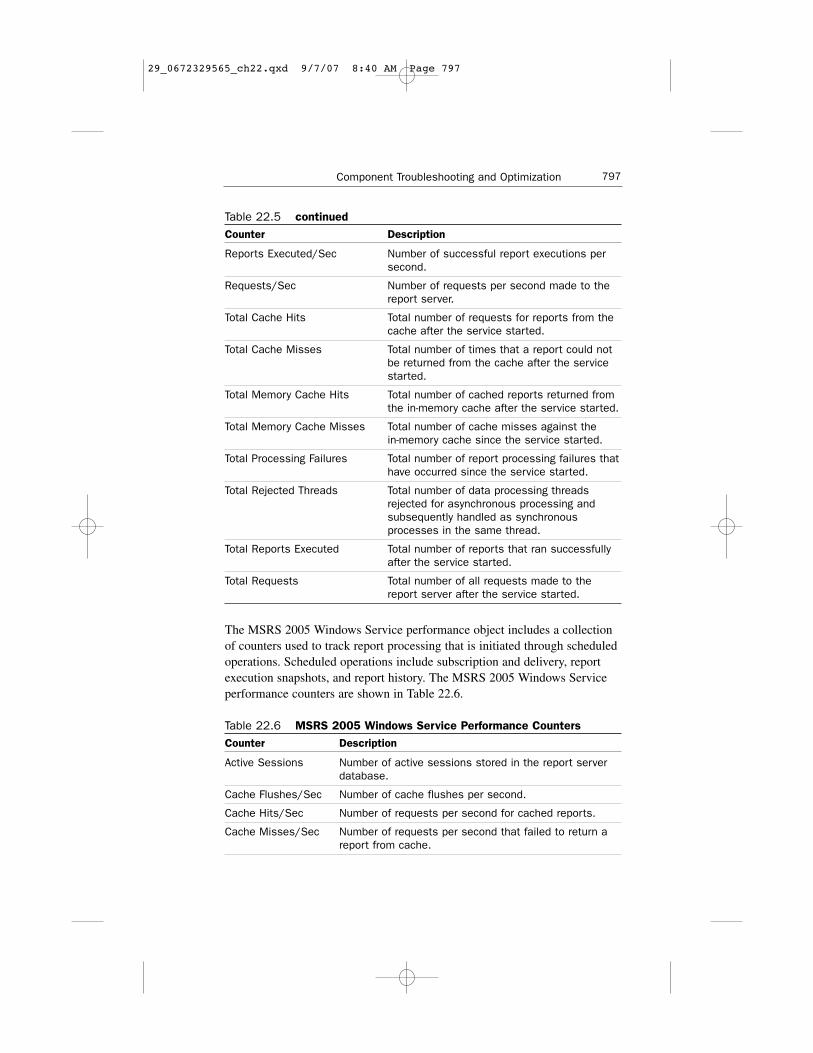
Table 22.5 continuedCounter Description
Reports Executed/Sec Number of successful report executions persecond.
Requests/Sec Number of requests per second made to thereport server.
Total Cache Hits Total number of requests for reports from thecache after the service started.
Total Cache Misses Total number of times that a report could notbe returned from the cache after the servicestarted.
Total Memory Cache Hits Total number of cached reports returned fromthe in-memory cache after the service started.
Total Memory Cache Misses Total number of cache misses against thein-memory cache since the service started.
Total Processing Failures Total number of report processing failures thathave occurred since the service started.
Total Rejected Threads Total number of data processing threadsrejected for asynchronous processing andsubsequently handled as synchronousprocesses in the same thread.
Total Reports Executed Total number of reports that ran successfullyafter the service started.
Total Requests Total number of all requests made to thereport server after the service started.
The MSRS 2005 Windows Service performance object includes a collectionof counters used to track report processing that is initiated through scheduledoperations. Scheduled operations include subscription and delivery, reportexecution snapshots, and report history. The MSRS 2005 Windows Serviceperformance counters are shown in Table 22.6.
Table 22.6 MSRS 2005 Windows Service Performance CountersCounter Description
Active Sessions Number of active sessions stored in the report serverdatabase.
Cache Flushes/Sec Number of cache flushes per second.
Cache Hits/Sec Number of requests per second for cached reports.
Cache Misses/Sec Number of requests per second that failed to return areport from cache.
797Component Troubleshooting and Optimization
29_0672329565_ch22.qxd 9/7/07 8:40 AM Page 797
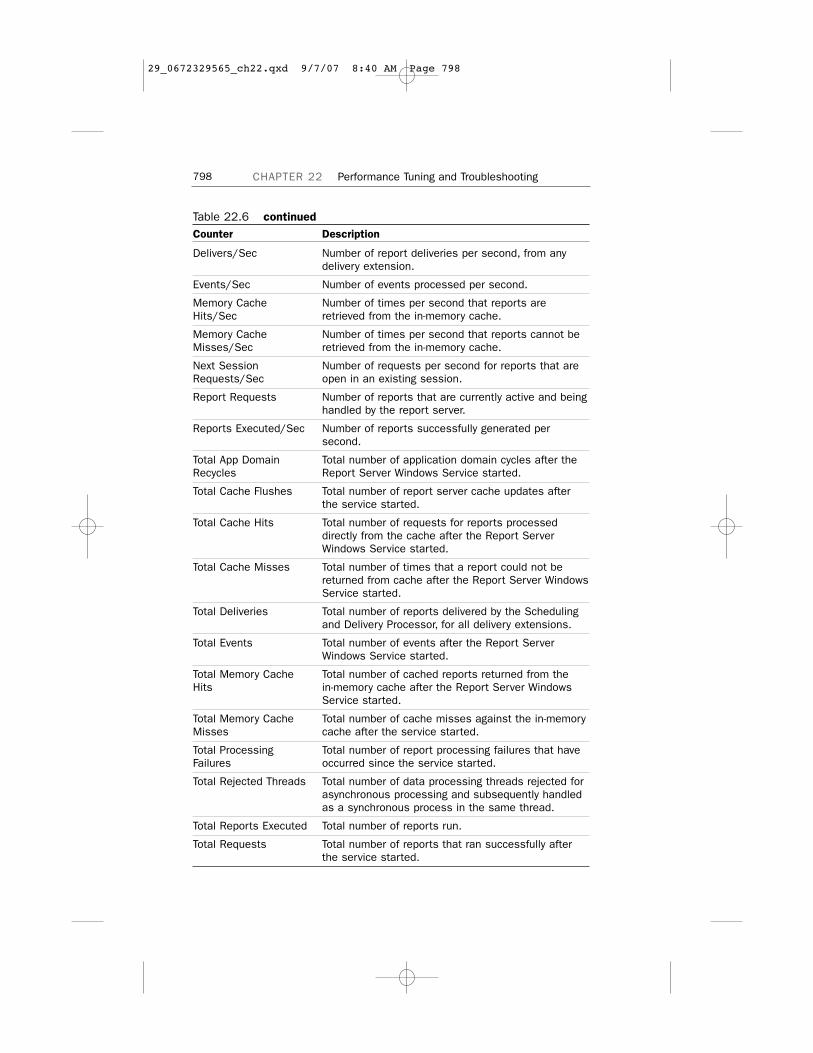
Table 22.6 continuedCounter Description
Delivers/Sec Number of report deliveries per second, from anydelivery extension.
Events/Sec Number of events processed per second.
Memory Cache Number of times per second that reports are Hits/Sec retrieved from the in-memory cache.
Memory Cache Number of times per second that reports cannot be Misses/Sec retrieved from the in-memory cache.
Next Session Number of requests per second for reports that are Requests/Sec open in an existing session.
Report Requests Number of reports that are currently active and beinghandled by the report server.
Reports Executed/Sec Number of reports successfully generated persecond.
Total App Domain Total number of application domain cycles after theRecycles Report Server Windows Service started.
Total Cache Flushes Total number of report server cache updates afterthe service started.
Total Cache Hits Total number of requests for reports processeddirectly from the cache after the Report ServerWindows Service started.
Total Cache Misses Total number of times that a report could not bereturned from cache after the Report Server WindowsService started.
Total Deliveries Total number of reports delivered by the Schedulingand Delivery Processor, for all delivery extensions.
Total Events Total number of events after the Report ServerWindows Service started.
Total Memory Cache Total number of cached reports returned from theHits in-memory cache after the Report Server Windows
Service started.
Total Memory Cache Total number of cache misses against the in-memoryMisses cache after the service started.
Total Processing Total number of report processing failures that have Failures occurred since the service started.
Total Rejected Threads Total number of data processing threads rejected forasynchronous processing and subsequently handledas a synchronous process in the same thread.
Total Reports Executed Total number of reports run.
Total Requests Total number of reports that ran successfully afterthe service started.
798 CHAPTER 22 Performance Tuning and Troubleshooting
29_0672329565_ch22.qxd 9/7/07 8:40 AM Page 798
Both of these sets of counters can be used to monitor and troubleshootperformance issues with Reporting Services.
Analysis ServicesAnalysis Services can be resource intensive, especially for memory. Memoryis used during querying to speed up data retrieval, specifically caching dataresults, calculation results, and dimension data. Memory is also used duringprocessing to store, index, and aggregate data temporarily. If not enoughmemory is available, the analysis jobs can become blocked and killperformance.
Analysis Services can use up to 3GB of memory on a 32-bit platform, but isnot limited to 3GB on a 64-bit platform. For intensive Analysis Servicesapplications, it is important to use 64-bit SQL Server 2005.
Memory allocation in Analysis Services is controlled by two memoryparameters:
■ Memory\TotalMemoryLimit—The upper limit percentage of the totalphysical memory in the server that Analysis Services will use. Thisdefaults to 80%, that is, 80% of the physical memory of the server.
■ Memory\LowMemoryLimit—The lower limit percentage of the totalphysical memory in the server that Analysis Services will use.
These settings can be found on the General page of the properties of theAnalysis Services server in SQL Server Management Studio.
These memory settings are used to guide how Analysis Services managesmemory under the following memory conditions:
■ No Pressure—If the current Analysis Services memory usage is belowthe LowMemoryLimit, the cleaner does not free memory.
■ Some Pressure—If the current Analysis Services memory usage isabove the LowMemoryLimit but below the TotalMemoryLimit, thecleaner starts to free memory where it will not affect performance.
■ High Pressure—If the current Analysis Services memory usage isabove the TotalMemoryLimit, the cleaner aggressively frees memoryeven if it will affect performance.
Given the potential impact on performance that this memory managementcan have, it is important to monitor this when conducting performance trou-bleshooting. Table 22.7 lists the counters that you can use to troubleshootmemory performance issues with Analysis Services.
799Component Troubleshooting and Optimization
29_0672329565_ch22.qxd 9/7/07 8:40 AM Page 799
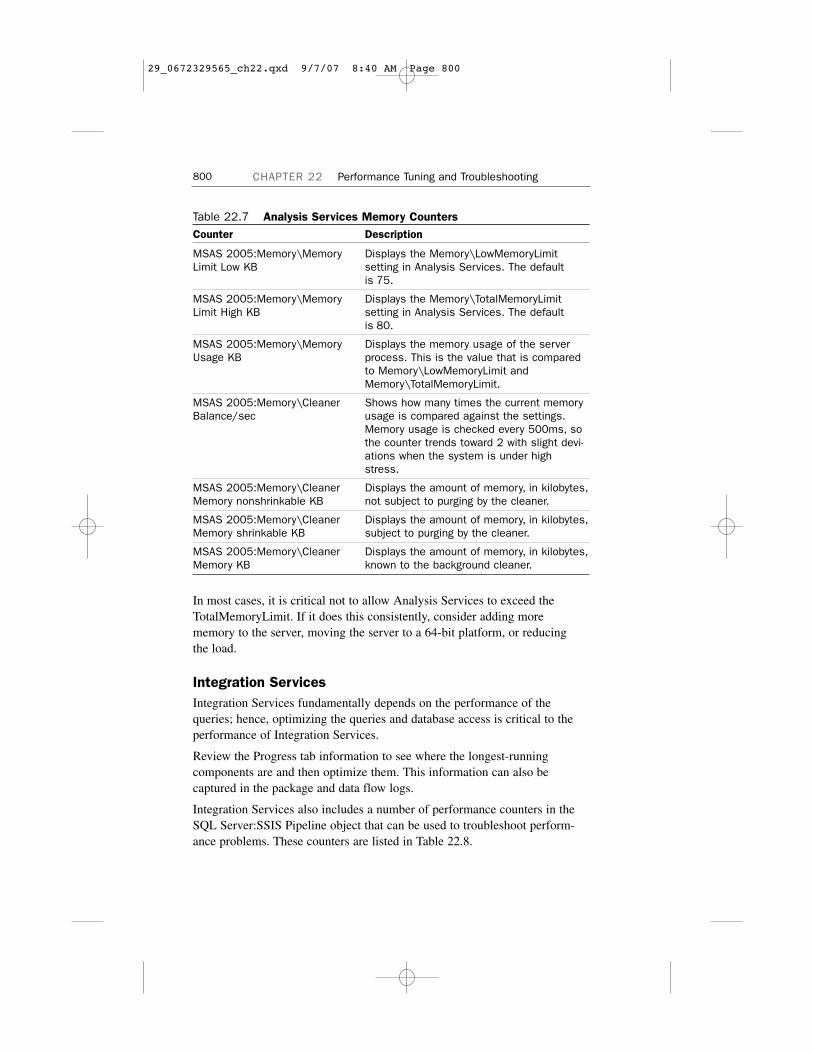
Table 22.7 Analysis Services Memory CountersCounter Description
MSAS 2005:Memory\Memory Displays the Memory\LowMemoryLimit Limit Low KB setting in Analysis Services. The default
is 75.
MSAS 2005:Memory\Memory Displays the Memory\TotalMemoryLimit Limit High KB setting in Analysis Services. The default
is 80.
MSAS 2005:Memory\Memory Displays the memory usage of the server Usage KB process. This is the value that is compared
to Memory\LowMemoryLimit andMemory\TotalMemoryLimit.
MSAS 2005:Memory\Cleaner Shows how many times the current memory Balance/sec usage is compared against the settings.
Memory usage is checked every 500ms, sothe counter trends toward 2 with slight devi-ations when the system is under highstress.
MSAS 2005:Memory\Cleaner Displays the amount of memory, in kilobytes,Memory nonshrinkable KB not subject to purging by the cleaner.
MSAS 2005:Memory\Cleaner Displays the amount of memory, in kilobytes,Memory shrinkable KB subject to purging by the cleaner.
MSAS 2005:Memory\Cleaner Displays the amount of memory, in kilobytes,Memory KB known to the background cleaner.
In most cases, it is critical not to allow Analysis Services to exceed theTotalMemoryLimit. If it does this consistently, consider adding morememory to the server, moving the server to a 64-bit platform, or reducingthe load.
Integration ServicesIntegration Services fundamentally depends on the performance of thequeries; hence, optimizing the queries and database access is critical to theperformance of Integration Services.
Review the Progress tab information to see where the longest-runningcomponents are and then optimize them. This information can also becaptured in the package and data flow logs.
Integration Services also includes a number of performance counters in theSQL Server:SSIS Pipeline object that can be used to troubleshoot perform-ance problems. These counters are listed in Table 22.8.
800 CHAPTER 22 Performance Tuning and Troubleshooting
29_0672329565_ch22.qxd 9/7/07 8:40 AM Page 800
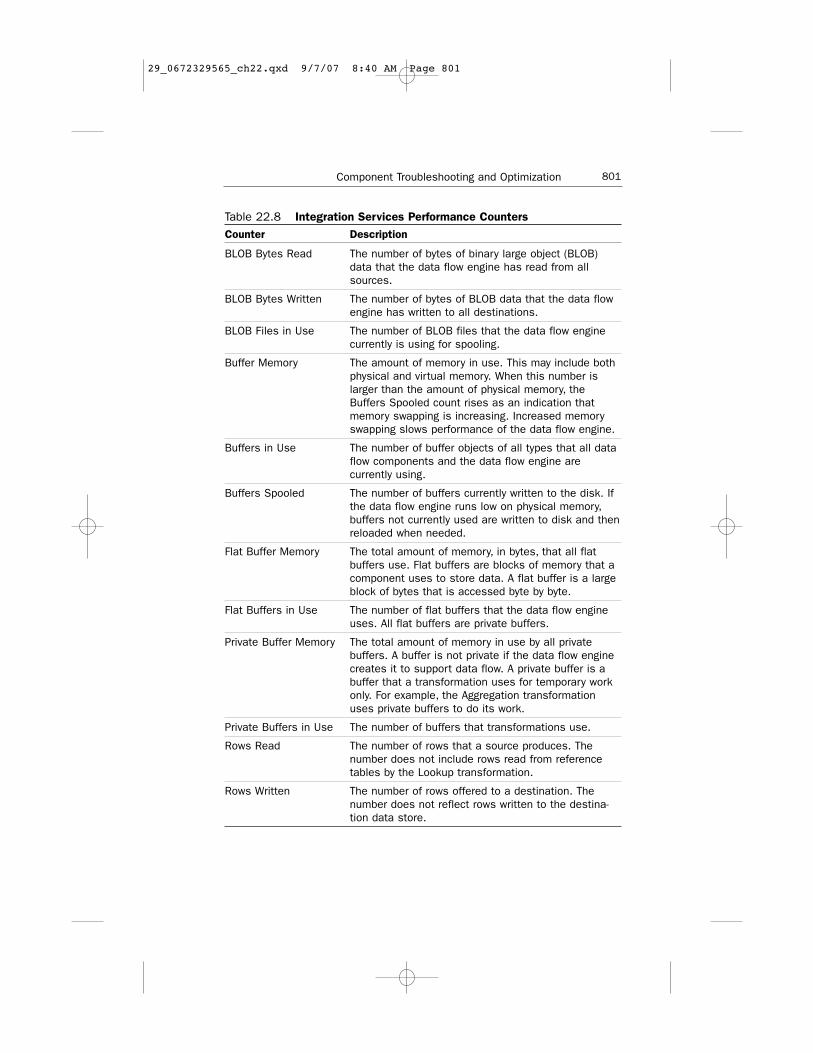
Table 22.8 Integration Services Performance CountersCounter Description
BLOB Bytes Read The number of bytes of binary large object (BLOB)data that the data flow engine has read from allsources.
BLOB Bytes Written The number of bytes of BLOB data that the data flowengine has written to all destinations.
BLOB Files in Use The number of BLOB files that the data flow enginecurrently is using for spooling.
Buffer Memory The amount of memory in use. This may include bothphysical and virtual memory. When this number islarger than the amount of physical memory, theBuffers Spooled count rises as an indication thatmemory swapping is increasing. Increased memoryswapping slows performance of the data flow engine.
Buffers in Use The number of buffer objects of all types that all dataflow components and the data flow engine arecurrently using.
Buffers Spooled The number of buffers currently written to the disk. Ifthe data flow engine runs low on physical memory,buffers not currently used are written to disk and thenreloaded when needed.
Flat Buffer Memory The total amount of memory, in bytes, that all flatbuffers use. Flat buffers are blocks of memory that acomponent uses to store data. A flat buffer is a largeblock of bytes that is accessed byte by byte.
Flat Buffers in Use The number of flat buffers that the data flow engineuses. All flat buffers are private buffers.
Private Buffer Memory The total amount of memory in use by all privatebuffers. A buffer is not private if the data flow enginecreates it to support data flow. A private buffer is abuffer that a transformation uses for temporary workonly. For example, the Aggregation transformationuses private buffers to do its work.
Private Buffers in Use The number of buffers that transformations use.
Rows Read The number of rows that a source produces. Thenumber does not include rows read from referencetables by the Lookup transformation.
Rows Written The number of rows offered to a destination. Thenumber does not reflect rows written to the destina-tion data store.
801Component Troubleshooting and Optimization
29_0672329565_ch22.qxd 9/7/07 8:40 AM Page 801
When you’re troubleshooting a package executing within IntegrationServices, use event handlers to troubleshoot package execution problems.
One of the most resource-intensive and performance-impacting operations issorting within a package flow. This consumes large quantities of memory andprocessing resources. This is true if the package contains either the Sorttransformation or a query within the data flow that includes the ORDER BYclause. The IsSorted hint property can be used to indicate to down-levelcomponents that the data is already sorted and bypass the sorting overhead.
Database Troubleshooting and OptimizationDatabase tuning can result in a tremendous boost in performance and addressthe root cause of many troubleshooting issues. When you’re setting up a data-base, it can be difficult to know exactly what indexes to create because it maynot be completely clear how applications will use the database. Databaseadministrators rarely have insight on the types of queries and data accesspatterns an application will present to the database. On the other end, appli-cation developers rarely have any understanding about the inner workings ofa database and may not even know precisely what their application is doingfrom a data perspective. Given the complexity of the situation, developing afully tuned database for any given application straight out of development isextremely difficult.
Fortunately, it is possible to cut the Gordian knot by capturing the applicationbehavior during actual use and then using that captured data to make tuningrecommendations. There are two specialized tools to do this: SQL ServerProfiler and the Database Engine Tuning Advisor.
The following sections conduct a basic optimization walkthrough to showhow you can use the tools to optimize a database.
SQL Server ProfilerThe SQL Server Profiler tool captures SQL Server 2005 events as they aregenerated on a SQL Server. The captured information, referred to as a work-load, can be reviewed in the UI or saved to a trace file. The workload can beused to analyze performance or can be replayed to conduct N+1 testing. InN+1 testing, the workload would be replayed and the results analyzed.Adjustments would be made to the system, then the workload would bereplayed and the results analyzed again. This is repeated N times until finallyall issues are resolved in the final N+1 time.
802 CHAPTER 22 Performance Tuning and Troubleshooting
29_0672329565_ch22.qxd 9/7/07 8:40 AM Page 802
You can use the tool to
■ Step through queries to troubleshoot problems
■ Identify and optimize slow queries
■ Capture traces for replay or analysis
■ Conduct security audits of database activity
■ Provide input to the Database Engine Tuning Advisor for databaseoptimization
The SQL Server Profiler is invaluable for getting detailed insight into theinternal workings of applications and databases from a real-world and real-time perspective.
Profiler Trace TemplatesThe Profiler tool can capture a wide variety of different event classes anddata columns in the trace. They are easily specified in the trace templates.
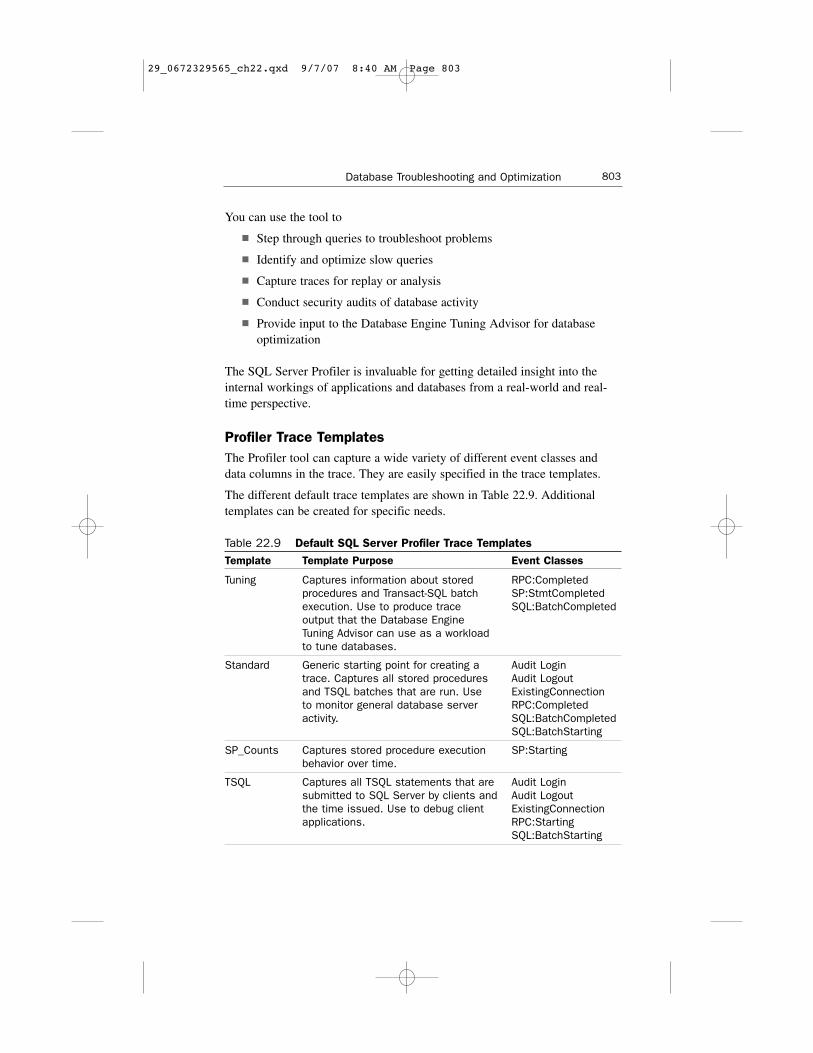
The different default trace templates are shown in Table 22.9. Additionaltemplates can be created for specific needs.
Table 22.9 Default SQL Server Profiler Trace TemplatesTemplate Template Purpose Event Classes
Tuning Captures information about stored RPC:Completedprocedures and Transact-SQL batch SP:StmtCompletedexecution. Use to produce trace SQL:BatchCompleted output that the Database EngineTuning Advisor can use as a workloadto tune databases.
Standard Generic starting point for creating a Audit Logintrace. Captures all stored procedures Audit Logoutand TSQL batches that are run. Use ExistingConnectionto monitor general database server RPC:Completedactivity. SQL:BatchCompleted
SQL:BatchStarting
SP_Counts Captures stored procedure execution SP:Starting behavior over time.
TSQL Captures all TSQL statements that are Audit Loginsubmitted to SQL Server by clients and Audit Logoutthe time issued. Use to debug client ExistingConnectionapplications. RPC:Starting
SQL:BatchStarting
803Database Troubleshooting and Optimization
29_0672329565_ch22.qxd 9/7/07 8:40 AM Page 803
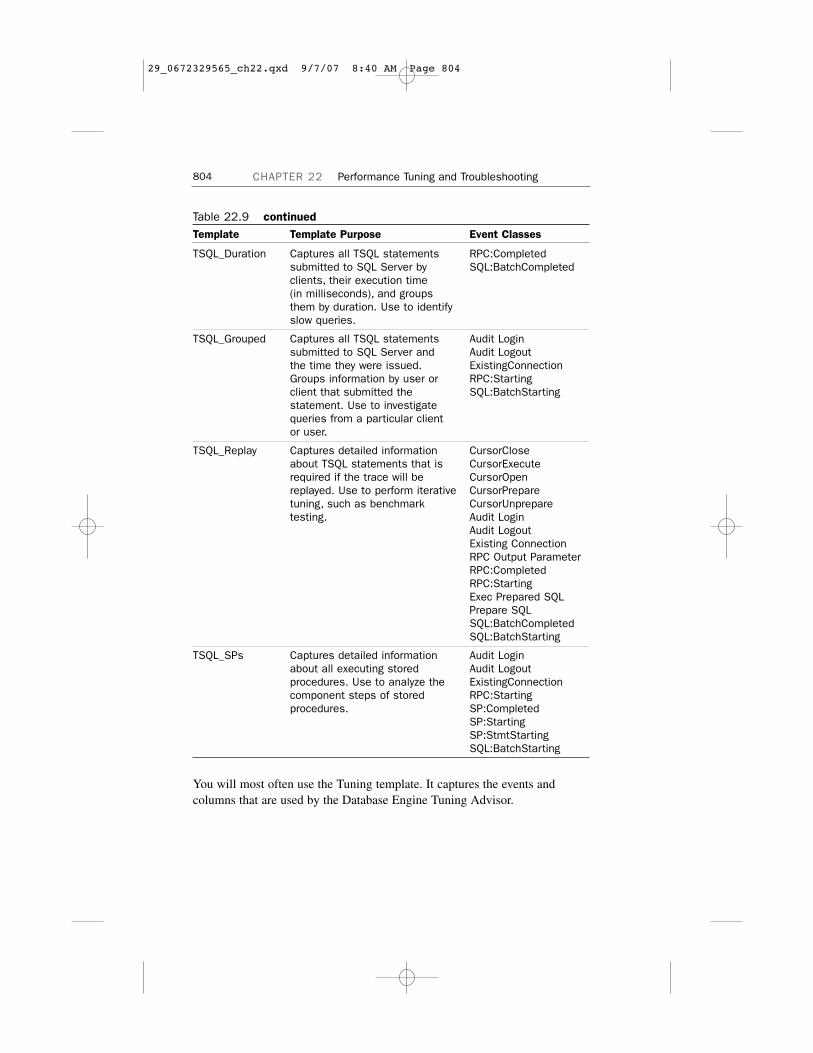
Table 22.9 continuedTemplate Template Purpose Event Classes
TSQL_Duration Captures all TSQL statements RPC:Completedsubmitted to SQL Server by SQL:BatchCompleted clients, their execution time (in milliseconds), and groupsthem by duration. Use to identifyslow queries.
TSQL_Grouped Captures all TSQL statements Audit Loginsubmitted to SQL Server and Audit Logoutthe time they were issued. ExistingConnectionGroups information by user or RPC:Startingclient that submitted the SQL:BatchStartingstatement. Use to investigate queries from a particular clientor user.
TSQL_Replay Captures detailed information CursorCloseabout TSQL statements that is CursorExecuterequired if the trace will be CursorOpenreplayed. Use to perform iterative CursorPreparetuning, such as benchmark CursorUnpreparetesting. Audit Login
Audit LogoutExisting ConnectionRPC Output ParameterRPC:CompletedRPC:StartingExec Prepared SQLPrepare SQLSQL:BatchCompletedSQL:BatchStarting
TSQL_SPs Captures detailed information Audit Loginabout all executing stored Audit Logoutprocedures. Use to analyze the ExistingConnectioncomponent steps of stored RPC:Startingprocedures. SP:Completed
SP:StartingSP:StmtStartingSQL:BatchStarting
You will most often use the Tuning template. It captures the events andcolumns that are used by the Database Engine Tuning Advisor.
804 CHAPTER 22 Performance Tuning and Troubleshooting
29_0672329565_ch22.qxd 9/7/07 8:40 AM Page 804
Database Engine Tuning AdvisorThe Database Engine Tuning Advisor automates the process of selecting anoptimized set of indexes, indexed views, statistics, and partitions and evenprovides the code to implement the recommendations it makes. To make yourlife even easier, you can use the tool to implement recommendations rightfrom within the SQL Server Management Studio console.
The Database Engine Tuning Advisor can work with a specific query or canuse a real-world workload as gathered by the SQL Server Profiler. Theadvantage of the latter approach is that the workload is generated based onactual usage, and the tuning recommendation reflects that.
The Database Engine Tuning Advisor is customizable and allows you toselect the level of recommendation that the tool will recommend. This way,you can maintain the existing database design and make appropriate fine-tuning recommendations for just indexes. Or you can make the existingdesign flexible and then have the tool recommend far-reaching changes to thestructure such as partitioning.
The following sections walk you through running the Database EngineTuning Advisor, starting with capturing a workload.
Capturing a WorkloadThe first part of the process to run the SQL Server Profiler is to capture aworkload. This example uses the Customer database from Chapter 14,“Encrypting SQL Server Data and Communications.” See that chapter for thesteps to create the Customer database.
To capture a workload, follow these steps:
1. Launch SQL Server Management Studio.
2. Open a query window by right-clicking on the server in ObjectExplorer and selecting New Query.
3. Select Start, All Programs, Microsoft SQL Server 2005, PerformanceTools, SQL Server Profiler.
4. Select File, New Trace.
5. Connect to the database engine, in this case SQL01.
6. On the General tab of the Trace Properties, enter Customer DatabaseTrace for the Trace name.
7. Select the Tuning template from the Use the Template pull-down.
805Database Troubleshooting and Optimization
29_0672329565_ch22.qxd 9/7/07 8:40 AM Page 805

8. Check the Save to File box and select a location for the trace file.
9. Change the maximum file size to 100, although this example will notneed this much space.
10. Select the Events Selection tab.
11. Review the events and columns that are preselected by the templateyou chose, in this case the Tuning template. Other templates selectother events and columns.
12. Click Run to start the trace.
The trace window shows the server activity. By selecting any line in the tracewindow, you can review the event class, the duration of the statement (inmilliseconds), the name of the database, the login name of the executingprocess, and even the detailed statement itself in the details window.
Now that the SQL Server Profiler is tracing the events on the server, a work-load needs to be generated. Usually, you would do this during normal opera-tions, and the trace would gather a workload. However, in this example, thereare no normal operations. A series of query statements is executed to simu-late a workload.
Return to the SQL Server Management Studio tool, which was left open atthe query window. Then execute the following series of queries.
The first statement selects all columns from the database:
USE Customer;
GO
SELECT * FROM dbo.Customers;
GO
The first statement returns too many columns, so the following query narrowsthe data to just the columns needed:
SELECT FirstName, LastName, EmailAddress, Occupation, State FROM
➥dbo.Customers;
GO
This statement still returns too many rows, so the following query returns justthe rows of management:
SELECT FirstName, LastName, EmailAddress, Occupation, State FROM
➥dbo.Customers
WHERE Occupation = ‘Management’;
GO
806 CHAPTER 22 Performance Tuning and Troubleshooting
29_0672329565_ch22.qxd 9/7/07 8:40 AM Page 806
However, the rows needed are just for California rather than all states, so thefollowing query returns exactly what is needed:
SELECT FirstName, LastName, EmailAddress, Occupation, State FROM
➥dbo.Customers
WHERE Occupation = ‘Management’ and State = ‘CA’;
GO
This final query should return 192 rows. This is a simple workload, but effec-tive for a demonstration of the process.
The workload has been generated, so the next step is to stop the Profiler tooland save the workload for analysis. Follow these steps:
1. Switch to the SQL Server Profiler tool.
2. Select File, Stop Trace to stop the trace.
3. Scroll through the events and locate each of the query statements thatyou just executed. Note the duration, database, login name for eachstatement, and query for each event.
4. Close the SQL Server Profiler.
Now the workload has been saved and is ready for analysis.
Analyzing the WorkloadRun the Tuning Advisor to analyze the workload as follows:
1. Select Start, All Programs, Microsoft SQL Server 2005, PerformanceTools, Database Engine Tuning Advisor.
2. Connect to the Database Engine, in this case SQL01.
3. In the Workload section on the General tab, select the file that the tracewas saved to, in this case Customer Database Trace.trc.
4. Select the Customer database from the Database for WorkloadAnalysis pull-down.
5. In the Select Databases and Tables to Tune section, check theCustomer database. The configuration should look similar to that inFigure 22.4.
6. Select the Tuning Options tab. There are a number of tuning optionsfor the advisor to use. The advisor, by default, recommends index andstatistic changes but can recommend changes to the physical designstructures as well. Leave these at the default, which is to recommendindex changes only.
807Database Troubleshooting and Optimization
29_0672329565_ch22.qxd 9/7/07 8:40 AM Page 807
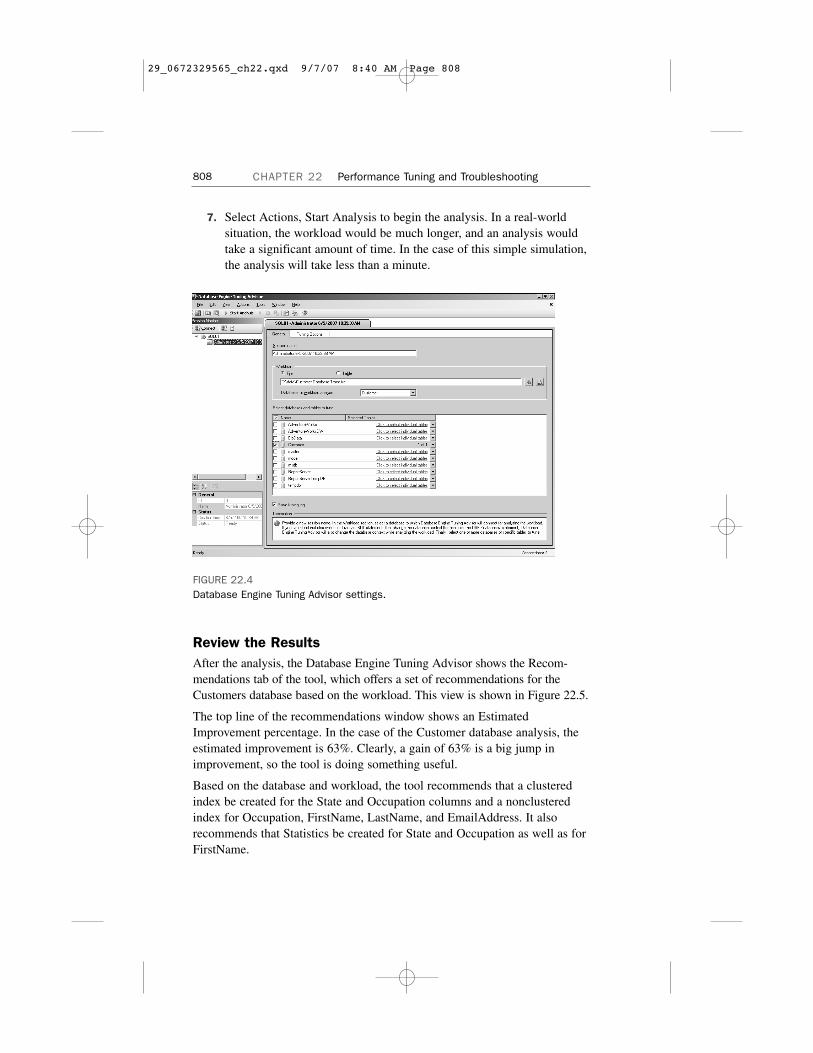
7. Select Actions, Start Analysis to begin the analysis. In a real-worldsituation, the workload would be much longer, and an analysis wouldtake a significant amount of time. In the case of this simple simulation,the analysis will take less than a minute.
808 CHAPTER 22 Performance Tuning and Troubleshooting
FIGURE 22.4Database Engine Tuning Advisor settings.
Review the ResultsAfter the analysis, the Database Engine Tuning Advisor shows the Recom-mendations tab of the tool, which offers a set of recommendations for theCustomers database based on the workload. This view is shown in Figure 22.5.
The top line of the recommendations window shows an EstimatedImprovement percentage. In the case of the Customer database analysis, theestimated improvement is 63%. Clearly, a gain of 63% is a big jump inimprovement, so the tool is doing something useful.
Based on the database and workload, the tool recommends that a clusteredindex be created for the State and Occupation columns and a nonclusteredindex for Occupation, FirstName, LastName, and EmailAddress. It alsorecommends that Statistics be created for State and Occupation as well as forFirstName.
29_0672329565_ch22.qxd 9/7/07 8:40 AM Page 808
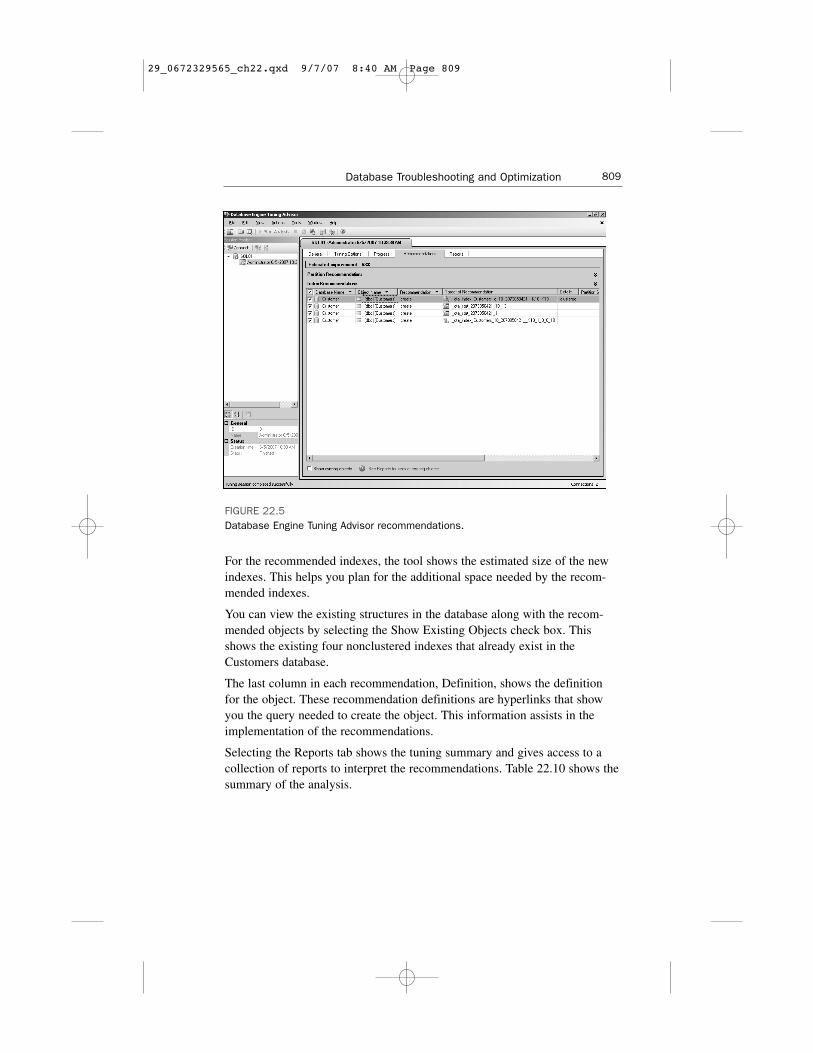
FIGURE 22.5Database Engine Tuning Advisor recommendations.
For the recommended indexes, the tool shows the estimated size of the newindexes. This helps you plan for the additional space needed by the recom-mended indexes.
You can view the existing structures in the database along with the recom-mended objects by selecting the Show Existing Objects check box. Thisshows the existing four nonclustered indexes that already exist in theCustomers database.
The last column in each recommendation, Definition, shows the definitionfor the object. These recommendation definitions are hyperlinks that showyou the query needed to create the object. This information assists in theimplementation of the recommendations.
Selecting the Reports tab shows the tuning summary and gives access to acollection of reports to interpret the recommendations. Table 22.10 shows thesummary of the analysis.
809Database Troubleshooting and Optimization
29_0672329565_ch22.qxd 9/7/07 8:40 AM Page 809

Table 22.10 Database Engine Tuning Advisor Tuning SummaryDescription Value
Date 6/5/2007
Time 10:51:48 AM
Server SQL01
Database(s) to tune [Customer]
Workload file C:\data\CustomerDatabase Trace.trc
Maximum tuning time 47 Minutes
Time taken for tuning 1 Minute
Expected percentage improvement 63.42
Maximum space for recommendation (MB) 3
Space used currently (MB) 2
Space used by recommendation (MB) 2
Number of events in workload 73
Number of events tuned 73
Number of statements tuned 4
Percent SELECT statements in the tuned set 100
Number of indexes recommended to be created 2
Number of statistics recommended to be created 2
In the Tuning Reports section, select the Statement Cost Report from thepull-down menu. The report shows the four query statements in the simulatedworkload. More importantly, it shows the percent improvement that therecommendations will have on each statement. For the more complex state-ment, the recommendations will generate an impressive 95.85% improvementin the performance.
Select the Workload Analysis Report from the pull-down menu. The reportshows the number of query statements in the workload and the net impact ofthe tuning recommendation on the statements. In the case of the example,three statements would have a net decrease in cost and one would have nochange in cost. Cost is measured in the time needed to execute the query.Depending on the recommendation, the cost might actually increase for somequeries, as shown in the report.
Other reports show various aspects of the workload usage, such as whichtables are used in the database and which columns in each table. These areuseful for understanding how the data is being used by the workload.
810 CHAPTER 22 Performance Tuning and Troubleshooting
29_0672329565_ch22.qxd 9/7/07 8:40 AM Page 810
After reviewing the recommendations, you can apply the recommendations tothe database.
Applying the RecommendationsThe Database Engine Tuning Advisor tool provides several options for apply-ing the recommendations:
■ Cut/paste individual recommendations.
■ Apply the recommendation from the tool.
■ Save the recommendations to a file.
On the Recommendations tab, the Definition column of each recommenda-tion is a hyperlink that pops up a window with the TSQL query needed toimplement that specific recommendation. The window shows the specificcode and has a Copy to Clipboard button to copy the code. This code can bepasted directly into the SQL Server Management Studio query window orany other TSQL query tool.
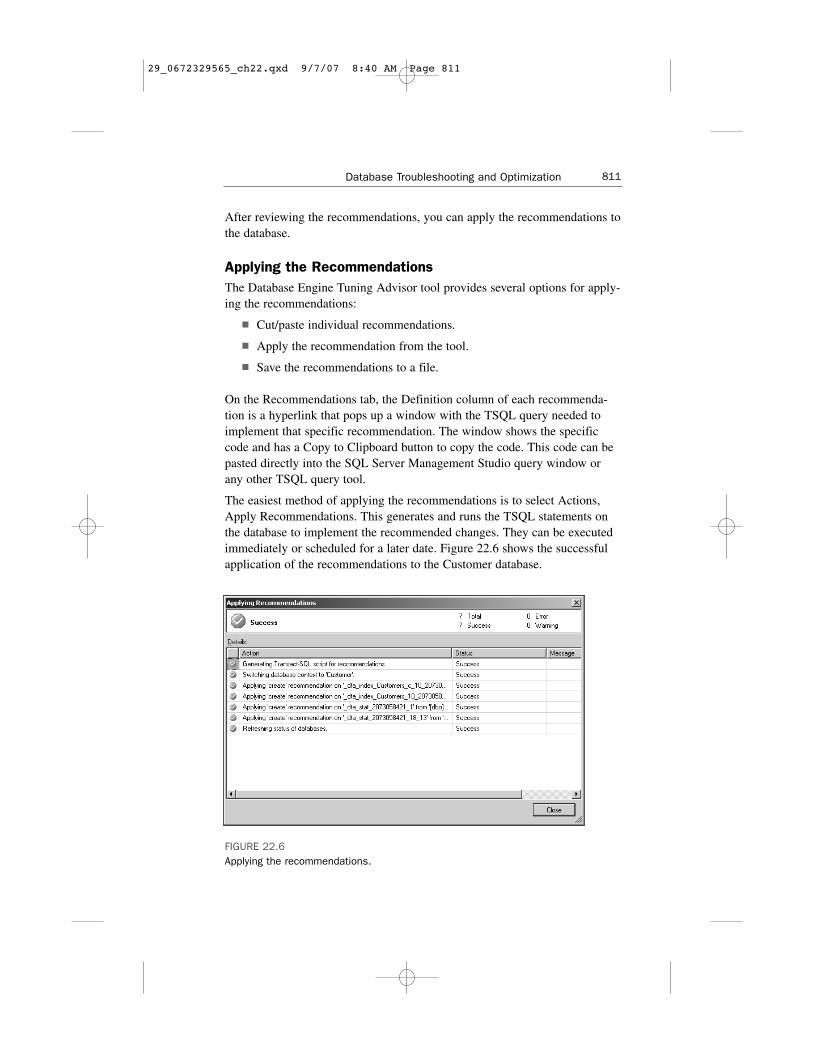
The easiest method of applying the recommendations is to select Actions,Apply Recommendations. This generates and runs the TSQL statements onthe database to implement the recommended changes. They can be executedimmediately or scheduled for a later date. Figure 22.6 shows the successfulapplication of the recommendations to the Customer database.
811Database Troubleshooting and Optimization
FIGURE 22.6Applying the recommendations.
29_0672329565_ch22.qxd 9/7/07 8:40 AM Page 811
The tool also allows the recommendations to be exported to a SQL file forexecution at a later time or editing of the query statements. Select Actions,Save Recommendations to save the query statements to a file.
The saved recommendations for the Customer Database Tuning session are
use [Customer]
go
CREATE CLUSTERED INDEX [_dta_index_Customers_c_10_2073058421__
➥K18_K13]
ON [dbo].[Customers]
(
[State] ASC,
[Occupation] ASC
)
WITH (SORT_IN_TEMPDB = OFF, IGNORE_DUP_KEY = OFF,
➥DROP_EXISTING = OFF, ONLINE = OFF)
ON [PRIMARY]
go
CREATE NONCLUSTERED INDEX
[_dta_index_Customers_10_2073058421__K13_1_3_8_18]
➥ON [dbo].[Customers]
(
[Occupation] ASC
)
INCLUDE ( [FirstName],
[LastName],
[EmailAddress],
[State]) WITH (SORT_IN_TEMPDB = OFF, IGNORE_DUP_KEY =
OFF, DROP_EXISTING = OFF, ONLINE = OFF)
ON [PRIMARY]
go
CREATE STATISTICS [_dta_stat_2073058421_1] ON
➥[dbo].[Customers]([FirstName])
go
CREATE STATISTICS [_dta_stat_2073058421_18_13] ON
➥[dbo].[Customers]([State], [Occupation])
go
These statements can be preserved for documentation or to apply to otherdatabases in a replicated environment.
812 CHAPTER 22 Performance Tuning and Troubleshooting
29_0672329565_ch22.qxd 9/7/07 8:40 AM Page 812
Monitoring Processes with the Activity MonitorThe Activity Monitor in SQL Server Management Studio graphicallydisplays information about
813Database Troubleshooting and Optimization
■ Running processes
■ Blocked processes
■ Process and object locks
■ User activity
Using this information, you can review activity on the SQL Server instancein real-time.
You can launch the Activity Monitor by following these steps:
1. Open SQL Server Management Studio and connect to a DatabaseEngine.
2. Expand the Management folder and select the Activity Monitor.
3. Right-click on the Activity Monitor and select View Processes.
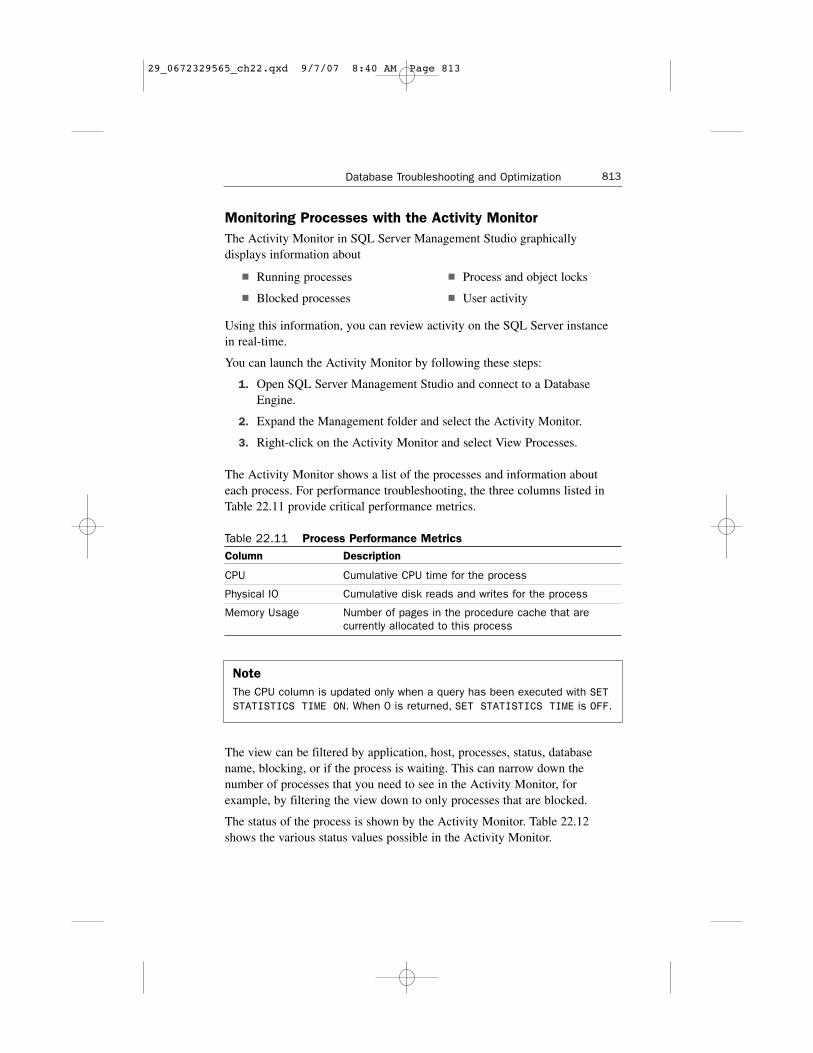
The Activity Monitor shows a list of the processes and information abouteach process. For performance troubleshooting, the three columns listed inTable 22.11 provide critical performance metrics.
Table 22.11 Process Performance MetricsColumn Description
CPU Cumulative CPU time for the process
Physical IO Cumulative disk reads and writes for the process
Memory Usage Number of pages in the procedure cache that arecurrently allocated to this process
NoteThe CPU column is updated only when a query has been executed with SETSTATISTICS TIME ON. When 0 is returned, SET STATISTICS TIME is OFF.
The view can be filtered by application, host, processes, status, databasename, blocking, or if the process is waiting. This can narrow down thenumber of processes that you need to see in the Activity Monitor, forexample, by filtering the view down to only processes that are blocked.
The status of the process is shown by the Activity Monitor. Table 22.12shows the various status values possible in the Activity Monitor.
29_0672329565_ch22.qxd 9/7/07 8:40 AM Page 813
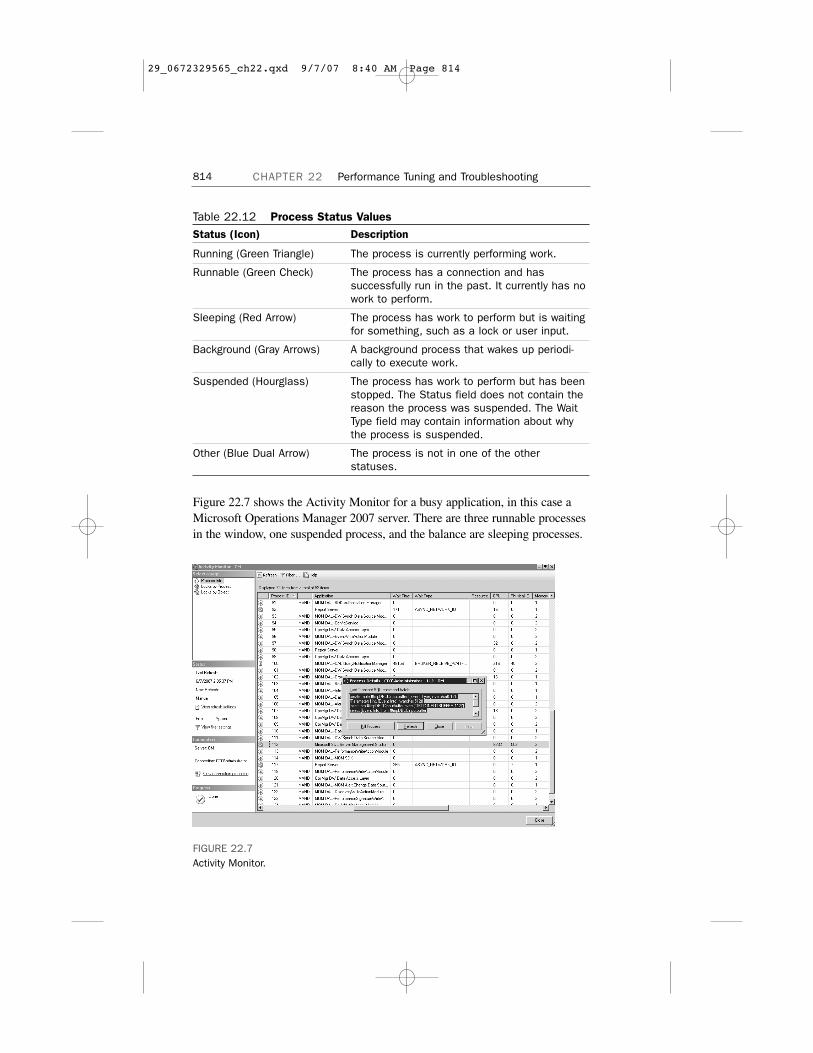
Table 22.12 Process Status ValuesStatus (Icon) Description
Running (Green Triangle) The process is currently performing work.
Runnable (Green Check) The process has a connection and hassuccessfully run in the past. It currently has nowork to perform.
Sleeping (Red Arrow) The process has work to perform but is waitingfor something, such as a lock or user input.
Background (Gray Arrows) A background process that wakes up periodi-cally to execute work.
Suspended (Hourglass) The process has work to perform but has beenstopped. The Status field does not contain thereason the process was suspended. The WaitType field may contain information about whythe process is suspended.
Other (Blue Dual Arrow) The process is not in one of the otherstatuses.
Figure 22.7 shows the Activity Monitor for a busy application, in this case aMicrosoft Operations Manager 2007 server. There are three runnable processesin the window, one suspended process, and the balance are sleeping processes.
814 CHAPTER 22 Performance Tuning and Troubleshooting
FIGURE 22.7Activity Monitor.
29_0672329565_ch22.qxd 9/7/07 8:40 AM Page 814
By right-clicking in the process, you can see the last TSQL command theprocess executed. Process 112 appears in the Process Details window inFigure 22.7. The process used 8232 CPU cycles and 502 disk reads/writes,and is currently using two pages in the memory cache. Compared to the otherprocesses in the window, process 112 is using a lot of CPU and disk I/O.
Application Optimization and TroubleshootingApplication optimization and troubleshooting are typically beyond the scopeof the database administrator. Application developers typically are responsi-ble for the troubleshooting and optimization of applications.
However, you may find that certain query statements are consumingresources or taking a long time. This is typically discovered in database trou-bleshooting and optimization. Therefore, you can take key information andassist developers in their tasks.
Query Analysis with Execution PlanThe Query Editor in the SQL Server Management Studio allows you toanalyze the execution plans of queries to determine their specific breakdownand costs for each step.
For example, consider the following query that runs against the Customerdatabase:
USE Customer;
GO
SELECT FirstName, LastName, EmailAddress, Occupation,
➥YearlyIncome, City, State
FROM dbo.Customers
WHERE Gender = ‘F’ and MaritalStatus = ‘S’ and
YearlyIncome = (SELECT MAX(YearlyIncome)
➥FROM dbo.Customers) ORDER BY City;
GO
This query essentially selects the highest-income single females in Californiaand displays them by city. To analyze this query, follow these steps:
1. Launch the SQL Server Management Studio and open the QueryEditor by selecting New Query.
2. Enter the preceding TSQL query into the editor.
3. Select Query, Display Estimated Execution Plan.
815Application Optimization and Troubleshooting
29_0672329565_ch22.qxd 9/7/07 8:40 AM Page 815
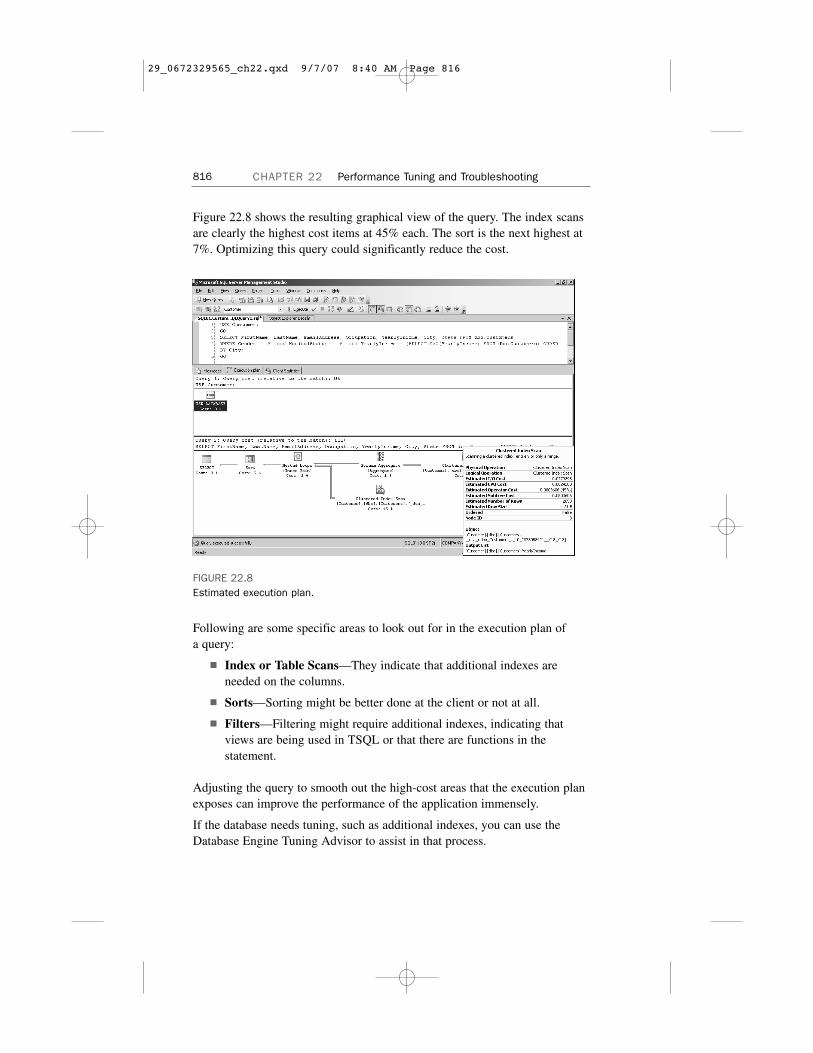
Figure 22.8 shows the resulting graphical view of the query. The index scansare clearly the highest cost items at 45% each. The sort is the next highest at7%. Optimizing this query could significantly reduce the cost.
816 CHAPTER 22 Performance Tuning and Troubleshooting
FIGURE 22.8Estimated execution plan.
Following are some specific areas to look out for in the execution plan ofa query:
■ Index or Table Scans—They indicate that additional indexes areneeded on the columns.
■ Sorts—Sorting might be better done at the client or not at all.
■ Filters—Filtering might require additional indexes, indicating thatviews are being used in TSQL or that there are functions in thestatement.
Adjusting the query to smooth out the high-cost areas that the execution planexposes can improve the performance of the application immensely.
If the database needs tuning, such as additional indexes, you can use theDatabase Engine Tuning Advisor to assist in that process.
29_0672329565_ch22.qxd 9/7/07 8:40 AM Page 816
Query Analysis with the Tuning AdvisorAnother method of troubleshooting a query is to use the Database EngineTuning Advisor to analyze the query. To do this, follow these steps:
1. From the SQL Server Management Studio tool, select Query, AnalyzeQuery in the Database Engine Tuning Advisor.
2. Everything is prepopulated by the SQL Server Management Tool, soselect Actions, Start Analysis to generate recommendations.
3. Review the recommendations, which are to create a clustered indexand to collect statistics.
4. Select Actions, Apply Recommendations to implement the recommen-dations.
5. Click Close to acknowledge the changes.
6. Close the Database Engine Tuning Advisor tool.
This procedure optimizes the database to run the query.
Back in the SQL Server Management Studio Query Editor, select Query,Display Estimated Execution Plan to see the difference in the query execu-tion costs.
Cursors and the Lazy DeveloperAnother area to bring to the attention of application developers is the use ofcursors. A select statement normally returns a set of rows called a resultset,and the application has to work with the entire resultset. A cursor is a data-base object that lets applications work with single rows within the resultset.The cursor allows
■ Positioning within the resultset
■ Retrieving a single row at the current position in the resultset
■ Modifying the row at the cursor position in the resultset
Although this feature makes the developer’s job easy, cursors are resourceintensive. The use of cursors is normally associated with lazy developmentpractices. Extensive use of cursors can affect the performance of the data-base, and their use is generally frowned on.
This information can all be passed on to the application developers forrecommendations on how to optimize the application.
817Application Optimization and Troubleshooting
29_0672329565_ch22.qxd 9/7/07 8:40 AM Page 817

Locking and Deadlock DetectionLocking allows users and processes to synchronize access to data andobjects. This allows users in a multiaccess environment to prevent data frombeing corrupted. For example, when process A begins a transaction to modifya chunk of data X, the SQL Server Database Engine locks that data. Ifprocess B attempts to modify data X before the first transaction finishes,process B is paused (that is, sleeping). After process A finishes, process B isawakened and gets its lock on data X.
This process is all well and good, except when deadlocks occur. A deadlockcondition occurs when two processes are mutually waiting on each other tofree up locks on data. For example, consider if process A locks data Y andthen requests a lock on data Z. At the same time, process B locks data Z andrequests a lock on data Y. Both processes are paused and waiting for theother to free up the lock, which will never happen in theory and the processeswill sleep forever; that is, the processes are deadlocked.
Resources that can deadlock include
818 CHAPTER 22 Performance Tuning and Troubleshooting
■ Locks
■ Worker threads
■ Memory
■ Parallel queries
■ Multiple active resultsets
Deadlocks can completely kill application performance and are unavoidablein a multiuser application such as SQL Server 2005.
Luckily, SQL Server 2005 has a mechanism for dealing with this condition.The SQL Server Database Engine runs deadlock detection to find and resolvethese deadlock conditions. The deadlock detection is somewhat atavistic,basically selecting a deadlock victim and then resolving the situation by
■ Terminating the ill-fated process’s current batch command
■ Rolling back the transaction, which frees all the locks it held
■ Notifying the application with a 1205 error
The other, considerably luckier, process is then free to complete its transac-tion with the deadlock resolved. The deadlock victim is chosen on the basisof the least expensive transaction to roll back. This can be changed by settingthe DEADLOCK_PRIORITY, which allows you or the application developer toforce the selection.
The Database Engine executes deadlock detection on a periodic basis tolocate deadlocks. The default interval is 5 seconds, but if a deadlock is
29_0672329565_ch22.qxd 9/7/07 8:40 AM Page 818
encountered, the process triggers more often until it stops detecting dead-locks. Then it reverts back to the 5-second interval.
Even though deadlocks are resolved, the delays that they cause affectperformance. It is important to monitor SQL Server for errors and review theapplication code or logic if they occur frequently.
SummaryMany of the SQL Server 2005 problems that you are faced with are per-formance related. SQL Server 2005 is a complex application that isfrequently charged with the handling of large datasets and real-timeresponse requirements.
Fortunately, SQL Server 2005 contains the tools and instrumentation to allowyou to easily conduct performance troubleshooting. They include the SQLServer Profiler and the Database Engine Tuning Advisor, which inject artifi-cial intelligence into the performance-tuning process, providing both guid-ance and implementation features.
Best PracticesSome important best practices from the chapter include
■ Conduct performance optimization and troubleshooting at least oncea year.
■ Use the SQL Server Profiler to gather workloads over at least a24-hour period.
■ Use the Database Engine Tuning Advisor to recommend indexes,statistics, and partitions based on the workloads.
■ Apply service packs in a timely manner to take advantage of perform-ance improvements.
■ Specifically, apply Service Pack 2 as soon as possible.
■ Use clustered indexes.
■ Don’t use cursors if at all possible.
■ Use Operations Manager 2007 to automate the collection of perform-ance metrics and to maintain a historical record of the data.
■ Use 64-bit SQL Server 2005 for memory-intensive applications such asAnalysis Services.
■ Configure logging on packages and data flow tasks in IntegrationServices to monitor performance of packages.
819Best Practices
29_0672329565_ch22.qxd 9/7/07 8:40 AM Page 819

29_0672329565_ch22.qxd 9/7/07 8:40 AM Page 820