Embed Size (px)
Citation preview

Environment and Planning Program
Performance Testing of Coagulants to Reduce Stormwater Runoff Turbidity
16th Annual Lower Rio Grande ValleyWater Quality Management & Planning Conference
April 8 – 11, 2014

Environment and Planning Program
Texas Department of Transportation 0-6638
Preparing for EPA Effluent Limitation Guidelines
Jett McFalls, TTIYoung-Jae Yi, TTI Beverly Storey, TTI Michael Barrett, UTDesmond Lawler, UT Brad Eck, UT
David Rounce, UTTed Cleveland, TX TechHolly Murphy, TX TechDesirae Dalton , TX TechAudra Morse, TX TechGeorge Herrmann, TX Tech

Environment and Planning Program
Task 1: Literature Review and Current DOT Practices
Task 2: Controlled Testing of Coagulants
Task 3: Construction Site Field Monitoring
Task 4: Development of Monitoring/Sampling Protocols
Task 5: Statewide Field Testing to determine Effectiveness of Recommended Practices and Sampling Protocols
Task 6: Revision and Submittal of Monitoring/Sampling Protocol
Task 7a: Provide Material for Revision of TxDOT StormwaterManagements Guidelines for Construction Activities
Task 7b: Develop and Conduct Training Workshop
Task 8: Preparation of Reports
Schedule of Research Activities
Environment and Planning Program
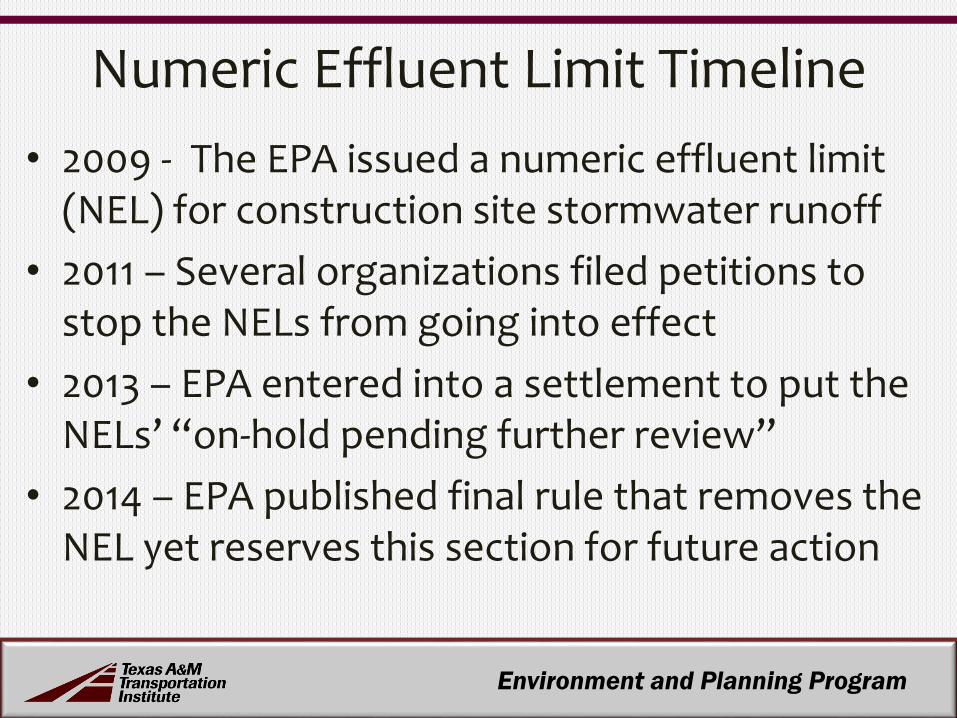
Numeric Effluent Limit Timeline
• 2009 - The EPA issued a numeric effluent limit (NEL) for construction site stormwater runoff
• 2011 – Several organizations filed petitions to stop the NELs from going into effect
• 2013 – EPA entered into a settlement to put the NELs’ “on-hold pending further review”
• 2014 – EPA published final rule that removes the NEL yet reserves this section for future action

Environment and Planning Program
• Current DOT Practices
• Background on Construction Numeric Limits and ELG Development
• Numeric Limits By Other States
• Typical Runoff From Construction Sites
• Existing Construction Site Sampling Programs
Literature Review

Environment and Planning Program
Coagulants/Flocculants
• Coagulation – a process that causes colloids to attract/adhere to each other to form larger particles or flocs
• Flocculation – a process where bridges are formedbetween colloids to form larger particles or flocs
• Examples of coagulants/flocculants
• PAMS – Polyacrylamides
• Chitosan

Environment and Planning Program
Controlled Testing of Coagulants
• Multiple soil samples were collected from highway construction sites across the state (Lubbock, Austin, College Station)
• Properties analysis of samples determined by Midwest Laboratories, Inc (Omaha, NE)
• A modified synthetic stormwater runoff was created using the soil analysis.

Environment and Planning Program
Controlled Testing at Center for Transportation Research (CTR)
Sample pHCa
(mg/ kg)Mg
(mg / kg)
CECa
(meq / 100g)
OrganicMatter
(%)
Sand (%)
Silt (%)
Clay (%)
183ANBC 8.2 4618 149 24.9 1.1 28 36 36
College Station 9.28 3956 231 22.2 1.6 38 40 22
W Loop 8.3 3222 434 20.7 0.7 52 28 20
127 Lub 7.8 2066 509 16.6 0.7 58 22 20
Hearne I 4.8 1195 371 17.8 1.5 18 30 52
Hearne II 7.8 569 64 3.5 0.2 86 6 8
E Texas 5.0 621 134 7.4 0.5 60 12 28
a Cation exchange capacity

Environment and Planning Program
Controlled Testing at Center for Transportation Research (CTR)
PAM Type Molecular Weight (mg/mol)
Charge Density (%)
SF N300 15 Neutral
LMW SF N300 6 Neutral
A 110 10-12 16
A 130 10-12 33
A 150 10-12 50
A 110 HMW 10-14 16
Cyanamer P-21 0.2 10
Chitosan NA Positive
APS #705 NA NA

Environment and Planning Program
Controlled Testing at Center for Transportation Research (CTR)
• Nine flocculants were evaluated using Decanter to remove large particles from soil suspension
• Turbidity was measured to determine flocculanteffectiveness

Environment and Planning Program
Controlled Testing at Center for Transportation Research (CTR)
• Flocculation tests were performed to understand the soil characteristics, polymer characteristics, and doses that promote flocculation.
• Researchers generated turbidity curves as a function of polymer dose added for each modified synthetic stormwater runoff.
• Comparison of these curves and the soil characteristics gives insight about the interactions between the PAM and the particles in the modified synthetic stormwater runoff.

Environment and Planning Program
Controlled Testing at Center for Transportation Research (CTR)
• The higher the molecular weight of the polymer, the longer it’s grappling distance.
• Therefore, flocculants with higher molecular weights are expected to be more effective at promoting flocculation due to their improved ability to bridge particles.
Impact of Molecular Weight on Turbidity Reduction for Modified Synthetic Stormwater Runoff for WLoop Soil

Environment and Planning Program
Controlled Testing at Center for Transportation Research (CTR)
• The non-ionic PAM, SF N300, is the most effective polymer.
• A-110 (16% charge density) is less effective than non-ionic PAM, but more effective than A-150 (highest charge density of 50%).
• The turbidity curves clearly indicate that as charge density increased, the effectiveness of PAM decreased.
• Occurred in all synthetic runoff samples tested.
Effect of Charge Density on Flocculation for Modified Synthetic StormwaterRunoff Using Wloop Soil

Environment and Planning Program
Controlled Testing at Center for Transportation Research (CTR)
• The optimal dose for SF N300 was 10 mg/L compared to the optimal dose for the anionic PAMs of 3 mg/L.
• The optimal dose for the anionic PAMs and the non-ionic PAMsvaried between 1-3 mg/L and 10 mg/L, respectively, for all the synthetic runoff tested.
• The optimal dose for anionic PAMswas lower than those of non-ionic PAMs for kaolinite suspensions.
Most Effective Flocculants for Modified Synthetic StormwaterRunoff Wloop

Environment and Planning Program
Controlled Testing at TTI SEC Lab
• Four different PAM/blanket combinations were evaluated under artificial rainfall simulators
• Total Sediment Loss and Turbidity were determined to evaluate effectiveness

Environment and Planning Program
Controlled Testing at TTI SEC Lab
Surface Condition
No PAM Treated
PAM Treated Difference
Bare soil 52,857 NTU 51,987 NTU -870
Jute ECBover 4,040*
NTUover 4,040*
NTUNA
Excelsior ECB 3,603 NTU 3,450 NTU -153
Straw ECB 4,180 NTU 9,037 NTU +4,857

Environment and Planning Program
Controlled Testing at TTI SEC Lab
Surface Condition
No PAM Treated
PAM Treated Difference
Bare soil 175.50 lb 163.10 lb -12.40
Jute ECB 17.25 lb 19.05 lb +1.80
Excelsior ECB 6.97 lb 5.43 lb -1.54
Straw ECB 0.40 lb 10.17 lb +9.77

Environment and Planning Program
Controlled Testing at TTI SEC Lab• Sediment retention device
testing flume was used to determine effectiveness of SRD with PAM
• Influent & effluent turbidity and flow rate were measured to determine sediment retention effectiveness
Environment and Planning Program
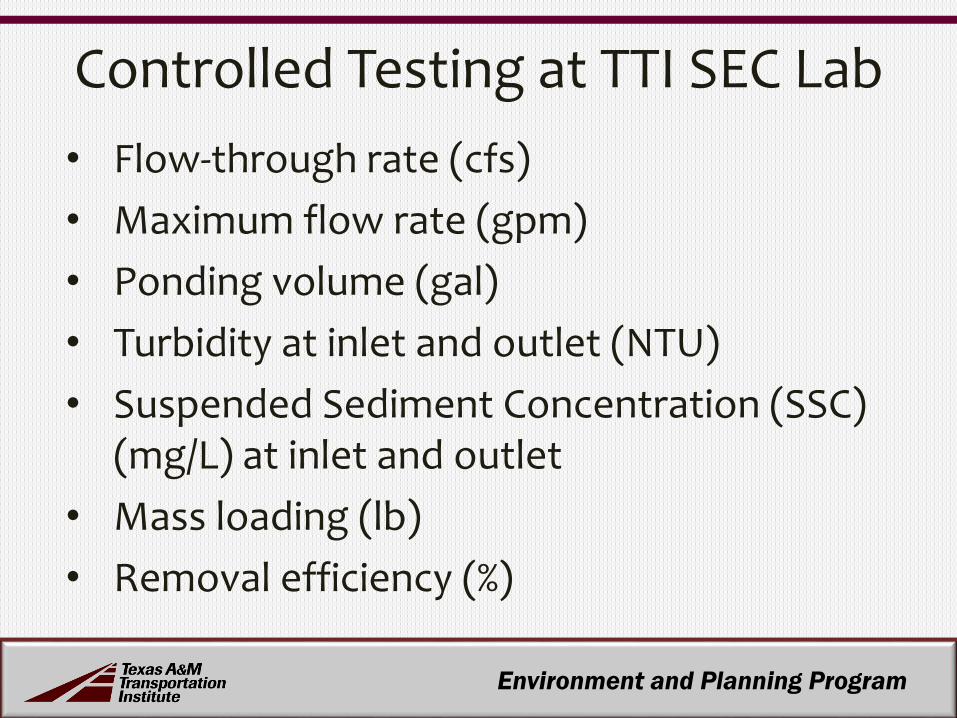
Controlled Testing at TTI SEC Lab
• Flow-through rate (cfs)
• Maximum flow rate (gpm)
• Ponding volume (gal)
• Turbidity at inlet and outlet (NTU)
• Suspended Sediment Concentration (SSC) (mg/L) at inlet and outlet
• Mass loading (lb)
• Removal efficiency (%)

Environment and Planning Program
Controlled Testing at TTI SEC Lab• 12.5 lb of SIL-CO-SIL®49 and 12.5 lb of ball clay was
placed in 1500 gal of water to create sediment-laden water having a SSC of 2000 mg/L.
• The sediment laden water continually stirred in the mixing tank throughout the test.
• The entire 1500 gal of sediment-laden water was emptied into the flume.
• The test monitoring continued until there was no water retained behind the SRD.
• Three repetitions of this test were conducted on SRD before removing it from the installation zone.

Environment and Planning Program
Sediment Removal Efficiency
16%
46%
63%
11%2%
*Average of 3 test runs under controlled conditions

Environment and Planning Program
Construction Site Field Monitoring
To determine ‘typical turbidity’ of TxDOT construction sites stormwater runoff was collected and analyzed from active sites in Bryan, Lubbock, & Austin TxDOT Districts

Environment and Planning Program
Typical Monitoring Sites

Environment and Planning Program
Typical Monitoring Sites

Environment and Planning Program
Watershed 3 Example – Bryan District
• Comprised of two drainage areas and a vegetated swale with five silt fences installed.
• Swale connects to a creek through a vegetated channel.
• Two drainage areas are relatively flat and well tilled.
• Made areas act like detention basin that can hold a large amount of rainfall runoff.
• Drainage areas released turbid water once the rainfall volume exceeds the capacity due to the bare soil.
Environment and Planning Program
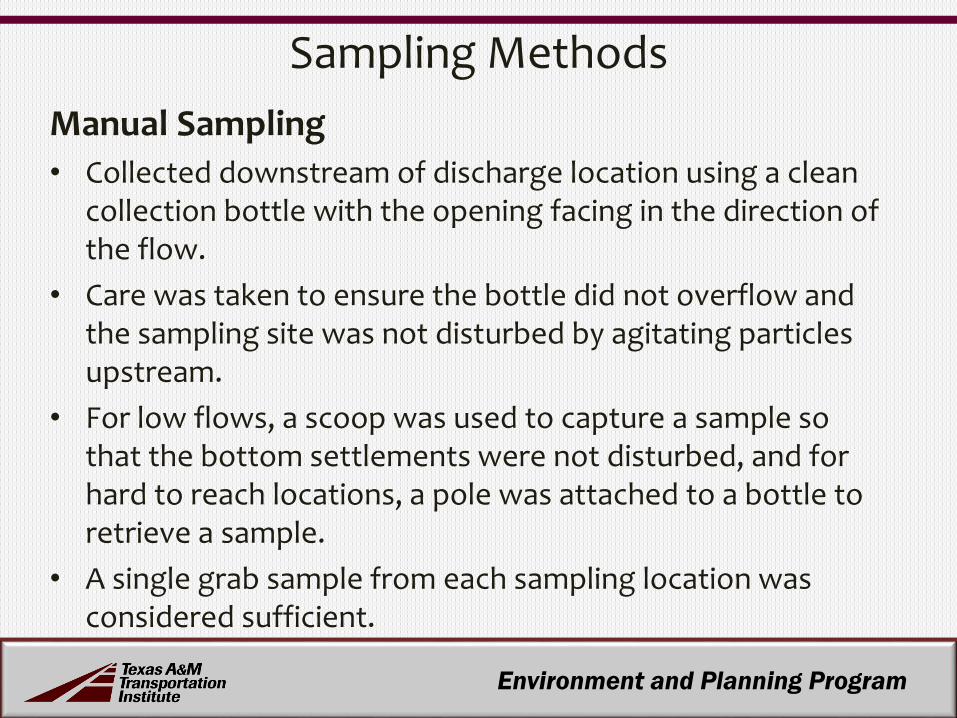
Sampling Methods
Manual Sampling
• Collected downstream of discharge location using a clean collection bottle with the opening facing in the direction of the flow.
• Care was taken to ensure the bottle did not overflow and the sampling site was not disturbed by agitating particles upstream.
• For low flows, a scoop was used to capture a sample so that the bottom settlements were not disturbed, and for hard to reach locations, a pole was attached to a bottle to retrieve a sample.
• A single grab sample from each sampling location was considered sufficient.

Environment and Planning Program
Sampling Methods
Automatic Sampling
• Bryan District used an ISCO 6712 sampler
• Samples were collected once every hour after activated at a certain level of runoff flow.
• An ISCO 730 bubbler flow module was attached to the sampler and read flow depths once every five minutes for selected rain events.
• Turbidity readings were conducted within 48 hours using the Hach 2100N turbidimeterused for the grab samples.

Environment and Planning Program
Turbidity Measurements• Runoff sample analysis followed EPA method 180.1 with two
modifications.
• Modification 1 – used Hach 2100N turbidimeter, which has a range of 0 to 4,000 NTU.
• Modification 2 - The samples were immediately transported to the lab, where they were analyzed for turbidity or stored in the 4°C cold room to be analyzed within 7 days.
• Typically, samples were analyzed within 48 hours, but for some sampling events, analysis was performed after 48 hours.
• Samples were gently shook and the bubbles allowed to dissipate prior to performing the turbidity measurements.

Environment and Planning Program
Discharge Monitoring Example
3.h: 5.72 acres bare soil, flattened
and tilled
3.i: 2.79 acres bare soil, flattened
and tilled
Swale: vegetated
Swale: bare soil flattened and tilled
5 silt fences installed
3.h
3.mix
3.org
3
3.iNo Discharge
1991 NTU
163 NTU
142 NTU
1338 NTU
3 – Final Site Discharge Location
Bryan District Site 1
Area
Sampling Location
Environment and Planning Program
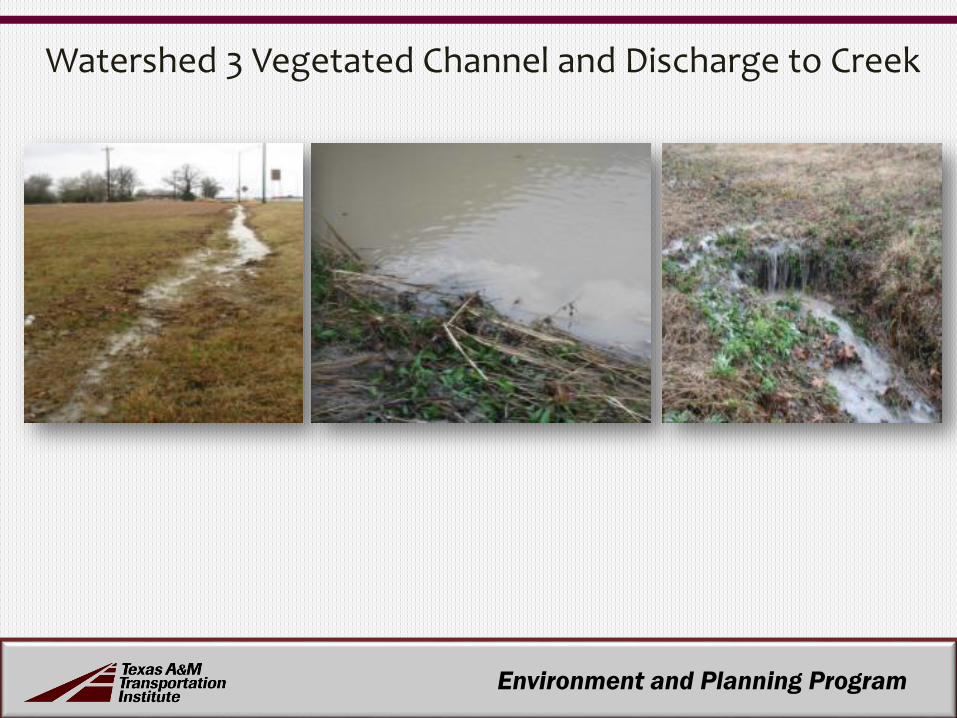
Watershed 3 Vegetated Channel and Discharge to Creek

Environment and Planning Program
Watershed 3 Relatively Flat Drainage Area with Bare Soil

Environment and Planning Program
Watershed 3 Swale with Silt Fence on Bare Soil

Environment and Planning Program
Watershed 3 Sample Turbidity Results
DateRain
(inches)Sampling
TimeTurbidity (NTU) Surface
Condition3.h 3.i 3 3.mix 3.org
12/24/2010 0.66 raining 1334Tilled bare
soil1/9/2011 1.69 1-hr later 1863 1338 1991 163 142
1/16/2011 0.7 raining 197 182 358 75 67
2/3/2012 4.11 6-hr later 4 7 19 32 30
Mulched but no
vegetation
2/4/2012 2.15 1-hr later 19.3 11 7 37 38
2/10/2012 0.20 1-hr later 6 8 N/F - -
2/13/2012 0.54 1-hr later 11 18 19 47 11
2/15/2012 0.45 1-hr later 44 25 73 80 30
2/18/2012 1.16 1-hr later 22 12 12 - -
3/10/2012 2.62 3-hr later 15 3 40 - -
3/20/2012 2.38 raining 37 20 11 - -
3/29/2012 2.27 2-hr later 15 7 5 104 36

Environment and Planning Program
Watershed 3• Runoff samples from the drainage area ‘i’ show
a large disparity in turbidity between two different rain events even though the surface conditions were almost consistent during that period.
• e.g., 1338 NTU in the first event and 182 NTU in the second at the sample point ‘3.i’
• This is probably due to the difference in precipitation volume, 1.69 inches for the first event and 0.7 inches for the second.

Environment and Planning Program
Watershed 3• The swale installed with five silt fences on bare soil
surface did not help reduce turbidity.
• The turbidity at the final outlet ‘3’ in both rain events is greater than the turbidity of discharge from the drainage area ‘3.h’ and ‘3.i’.
• This indicates that the series of swales is an additional source of sediments at first glance.
• However, the turbidity of the accepting creek was not changed much by the construction site discharge
• e.g., 21 NTU from 142 to 163 NTU in the first rain event

Environment and Planning Program
Watershed 3• Silt fences in the swale held a large volume of
water and discharged at the significantly lower flow rate, thus the absolute amount of sediments per time may be lower at the end.
• However, this type of detention is not efficient or effective during rain events beyond the silt fence’s capacity.
• This method will not be able to reduce the flow rate in but, rather has the risk of discharging higher rate of turbid flow when the silt fences fail.

Environment and Planning Program
Results/Conclusions• The PAM application used for erosion control was
not effective in significantly reducing turbidity or soil loss on clay soils with 1:3 slopes.
• Maximum turbidities of all tested ECB treatments were very high, ranging from 3,450 to 9,037 NTU.
• The turbidity of the effluent from the bare soil plot reached 52,857 NTU.
• Average dry soil losses overall agreed with turbidity results.

Environment and Planning Program
Results/Conclusions• Due to the high range of turbidity the efficiency of PAM
could not be determined.
• Although PAM showed a lower turbidity and average dry soil loss on bare soil and excelsior ECB than untreated counterparts, the differences were negligible.
• Furthermore, when applied with jute and straw erosion control blankets the reduction in turbidity decreased.
• This result was unexpected because straw ECBs are typically considered excellent performers in a 1:3 clay soil application.

Environment and Planning Program
Results/Conclusions
• Test results demonstrated that PAM treated sediment control devices were significantly more successful at reducing turbidity than untreated ones
• Removal efficiencies of treated devices ranged from 8% to 18% improvement

Environment and Planning Program
Results/Conclusions• The flocculants tested all performed well at
reducing turbidity
• Dosing rates affect the performance

Environment and Planning Program
Jett McFalls
979.847.8709
Michael E . Barrett
Beverly Storey
979.845.7217


![Managing stormwater systems to reduce the risk of …...Managing stormwater systems to reduce the risk of flooding B.29[18p] Office of the Auditor-General PO Box 3928, Wellington 6140](https://img.dokumen.tips/doc/110x75/5f25c948c40111627053d5a3/managing-stormwater-systems-to-reduce-the-risk-of-managing-stormwater-systems.jpg)