Embed Size (px)
Citation preview

PERFORMANCE TESTING OF ASPHALT CONCRETE CONTAINING
CRUMB RUBBER MODIFIER AND WARM MIX ADDITIVES
by
OMO JOHN IKPUGHA
A thesis submitted to the Department of Chemistry
in conformity with the requirements for
the degree of Master of Science
Queen’s University
Kingston, Ontario, Canada
(December, 2014)
Copyright © OMO JOHN IKPUGHA, 2014.

ii
ABSTRACT
Utilisation of scrap tire has been achieved through the production of crumb rubber modified
binders and rubberised asphalt concrete. Terminal and field blended asphalt rubbers have been
developed through the wet process to incorporate crumb rubber into the asphalt binder. Warm mix
asphalt technologies have been developed to curb the problem associated with the processing and
production of such crumb rubber modified binders. Also the lowered production and compaction
temperatures associated with warm mix additives suggests the possibility of moisture retention in
the mix, which can lead to moisture damage. Conventional moisture sensitivity tests have not
effectively discriminated good and poor mixes, due to the difficulty of simulating field moisture
damage mechanisms. This study was carried out to investigate performance properties of crumb
rubber modified asphalt concrete, using commercial warm mix asphalt technology. Commonly
utilised asphalt mixtures in North America such as dense graded and stone mastic asphalt were
used in this study. Uniaxial Cyclic Compression Testing (UCCT) was used to measure permanent
deformation at high temperatures. Indirect Tensile Testing (IDT) was used to investigate low
temperature performance. Moisture Induced Sensitivity Testing (MiST) was proposed to be an
effective method for detecting the susceptibility of asphalt mixtures to moisture damage, as it
incorporates major field stripping mechanisms.
Sonnewarm™, Sasobit™ and Evotherm™ additives improved the resistance to permanent
deformation of dense graded mixes at a loading rate of 0.5 percent by weight of the binder. Polymer
modified mixtures showed superior resistance to permanent deformation compared to asphalt
rubber in all mix types. Rediset™ WMX improves low temperature properties of dense graded
mixes at 0.5 percent loading on the asphalt cement. Rediset LQ and Rediset WMX showed good
anti stripping properties at 0.5 percent loading on the asphalt cement. The American Association
of State Highway and Transportation Official’s Mechanistic-Empirical Pavement Design Guide
(AASHTO MEPDG) software was used to predict long term low temperature performance of the
mixtures in various areas of Ontario. Sasobit, Rediset LQ and Rediset WMX gave good 15 years
prediction with stone mastic asphalt mixtures but the performance of dense graded mixtures was
less satisfactory.

iii
Acknowledgement
My sincere gratitude goes to my supervisor, Dr. Simon A. M. Hesp, for the kind support and
guidance I enjoyed throughout my study and research. I deeply appreciate his profound inspiration,
invaluable advice, and particularly the opportunity he granted me to embark on a research
programme at Queen’s University. I am thankful to my supervisory committee members; Dr.
Donal Macartney and Dr. Gary W. Vanloon, for their assistance towards a successful completion
of my degree.
Special thanks go out to Michaela McGurn with whom the dynamic creep data was obtained;
Andrew McIntyre, Abiodun Samuel and Ben Rudson who assisted with indirect tensile tests.
Thanks to Warren Lee of the Ministry of Transport for producing thermal cracking data using the
AASHTO MEPDG software. Also, I must acknowledge the cordiality with members of the Hesp
research group: David Sowah-Kuma, Bidur Ghimire and Isaac Omari, their great personalities
made my time of study nothing short of an amazing experience. I am equally grateful to the entire
faculty, staff and students of the Department of Chemistry at Queen’s University.
I wish to thank AkzoNobel Chemicals, Imperial Oil of Canada, the Ministry of Transportation of
Ontario (MTO), the National Sciences and Engineering Research Council of Canada (NSERC),
and the Ontario Tire Stewardship (OTS) for their financial support towards this research.
My heart-felt gratitude goes to my family for their all-time love, kind support and encouragement.
I give God all glory for every precious gift.

iv
Table of Contents
Abstract ............................................................................................................................... ii
Acknowledgements ............................................................................................................. iii
Table of Contents ................................................................................................................ iv
List of Figures ..................................................................................................................... viii
List of Tables ...................................................................................................................... xii
Abbreviations and Acronyms ............................................................................................. xiii
Chapter 1 INTRODUCTION .......................................................................................... 1
1.1 Road Pavement Overview ........................................................................................ 1
1.2 Definition of Asphalt ................................................................................................ 1
1.2.1 Origin and Sources of Asphalt ...................................................................... 2
1.2.2 Constituents of Asphalt ................................................................................. 2
1.3 Asphalt Modification................................................................................................ 2
1.3.1 Crumb Rubber modified Asphalt (CRM) ..................................................... 3
1.3.2 Warm Mix Additives ..................................................................................... 3
1.4 Hot Mix Asphalt ....................................................................................................... 3
1.5 Road Pavement ......................................................................................................... 4
1.6 Cross-section of Pavement ....................................................................................... 5
1.6.1 Surface course ............................................................................................... 5
1.6.2 Base course .................................................................................................... 5
1.6.3 Sub-base ........................................................................................................ 5
1.6.4 Subgrade ........................................................................................................ 5
1.7 Pavement Deterioration ............................................................................................ 6
1.7.1 Fatigue Cracking ........................................................................................... 6
1.7.2 Low Temperature Thermal Cracking ............................................................ 7
1.7.3 Rutting ........................................................................................................... 7

v
1.7.4 Stripping (Moisture Damage) ....................................................................... 8
1.7.5 Ravelling ....................................................................................................... 9
1.7.6 Disintegration ................................................................................................ 9
1.8 Scope and Objective ................................................................................................. 10
Chapter 2 LITERATURE REVIEW .............................................................................. 12
2.1 Viscoelastic Properties of Asphalt ........................................................................... 12
2.2 Performance Grading of Asphalt.............................................................................. 14
2.3 Asphalt Aggregate Interaction ................................................................................. 15
2.4 Asphalt Modification Review .................................................................................. 16
2.5 Types of Polymer Modified Asphalt PMAs ............................................................. 18
2.6 Scrap Tire Applications ............................................................................................ 19
2.7 Crumb Rubber .......................................................................................................... 21
2.8 Rubberised Asphalt Cement Processing .................................................................. 22
2.8.1 Wet Process-High Viscosity (Asphalt Rubber) ....................................... 23
2.8.2 Wet Process- No agitation (Terminal Blend) .......................................... 24
2.8.3 Dry Process .............................................................................................. 25
2.9 Warm Mix Asphalt Technology .............................................................................. 25
2.9.1 History of Warm Mix Asphalt .................................................................... 26
2.10 Warm Mix Additives Field Implementation ........................................................... 28
2.10.1 Organic Chemical Additives ...................................................................... 28
2.10.2 Inorganic Chemical Additives ................................................................... 28
2.10.3 Asphalt Foaming Systems.......................................................................... 28
2.11 Warm Mix Technology in North America ............................................................... 29
2.12 Compatibility of Warm Mix Asphalt ....................................................................... 32
2.13 Moisture Susceptibility ............................................................................................ 33

vi
2.14 Mechanism of Stripping ........................................................................................... 33
2.14.1 Physical- Chemical Reaction ........................................................................ 33
2.14.2 Surface Coatings ........................................................................................... 34
2.14.3 Surface Texture ............................................................................................. 34
2.14.4 Emulsification ............................................................................................... 34
2.15 Techniques for Limiting Moisture Susceptibility ..................................................... 35
2.15.1 Liquid Anti-Strip Agents .............................................................................. 35
2.15.2 Lime Additives............................................................................................. 35
2.15.3 Aggregate Pre-Treatment ............................................................................. 35
2.16 Test Methods for Moisture Susceptibility................................................................. 36
2.17 Moisture Conditioning .............................................................................................. 37
2.18 Test Method ............................................................................................................... 37
2.18.1 Indirect Tensile Tests ...................................................................................... 37
2.18.2 Moisture Induced Sensitivity Test MiST™ .................................................... 40
Chapter 3 MATERIALS AND EXPERIMENTAL PROCEDURES .......................... 42
3.1 Materials ................................................................................................................... 42
3.2 Additives .................................................................................................................. 42
3.3 Moisture Induced Sensitivity Testing (MiST) ......................................................... 43
3.3.1 Sample Preparation, Conditioning and Test Methods ..................................... 44
3.3.2 Mixing ............................................................................................................. 45
3.3.3 Compaction ..................................................................................................... 46
3.3.4 Cutting ............................................................................................................. 47
3.3.5 Percent Air Voids and Bulk Specific Gravity (BSG) Determination ............. 48
3.3.6 Sample Conditioning ....................................................................................... 49

vii
3.3.7 Indirect Tensile Test (IDT) ............................................................................. 51
3.3.8 Visual Inspection ............................................................................................. 52
3.4 Uniaxial Cyclic Compression Test with Partial Confinement (UCCTC) ............... 53
3.4.1 Specimen Preparation for Dynamic Creep Test .............................................. 55
3.4.2 Dynamic Creep Test Procedure....................................................................... 56
3.5 Indirect Tensile Creep and strength Tests ................................................................ 57
3.6 Mechanistic-Empirical Pavement Design Guide ..................................................... 58
Chapter 4 RESULTS AND DISCUSSIONS ................................................................... 60
4.1 Moisture Susceptibility Studies ............................................................................... 60
4.1.1 Percentage Difference in Bulk Specific Gravity ............................................. 62
4.1.2 Tensile Strength Ratio (TSR) .......................................................................... 64
4.1.3 Visual Inspection .......................................................................................... 67
4.2 Uniaxial Cyclic Compression Test with Partial Confinement (UCCTC) ............... 69
4.3 Indirect Tensile Test (IDT) ..................................................................................... 78
4.3.1 Indirect Tensile Strength results ........................................................................ 85
4.4 AASHTO MEPDG Crack Prediction Results ......................................................... 87
Chapter 5 SUMMARY AND CONCLUSIONS ............................................................. 88
REFERENCES .................................................................................................................. 90

viii
List of Figures
Figure 1.1: Hot Asphalt Mix [14] ....................................................................................... 4
Figure 1.2: Cross Section of Asphalt Concrete Pavement [18] .......................................... 6
Figure 1.3: Fatigue Cracking [21] ....................................................................................... 7
Figure 1.4: Low Temperature Cracking [21] ...................................................................... 8
Figure 1.5: Rutting [21] ...................................................................................................... 8
Figure 1.6: Stripping in Pavement [21]............................................................................... 9
Figure 1.7: Pavement exhibiting severe Ravelling ............................................................. 10
Figure 1.8: Severe Fatigue Distress starting to form a Pothole .......................................... 10
Figure 2.1: Mechanical responses of Elastic, Viscous and Viscoelastic Materials [28] ..... 14
Figure 2.2: Acid-Base Composition of typical aggregates [30] ......................................... 17
Figure 2.3: (a) Scrap tire stockpile on landfills [40] ........................................................... 21
Figure 2.3: (b) US Scrap Tire Trends 2005- 2011 [41] ...................................................... 21
Figure 2.4: U.S Scrap tire disposition [41] ......................................................................... 22
Figure 2.5: (a) Crumb rubber used in Asphalt Rubber in California [49] .......................... 24
Figure 2.5: (b) Crumb rubber used in Ontario [49] ............................................................ 24
Figure 2.6: Typical blending units for Terminal Blended projects [49] ............................. 25
Figure 2.7: (a) Asphalt rubber binder [52] .......................................................................... 26
Figure 2.7: (b) Terminal blend binder [52] ......................................................................... 26

ix
Figure 2.8: Classification of application temperatures for asphalt concrete from cold to hot [57]
............................................................................................................................................. 27
Figure 2.9: Feeder (right) and an existing fibre addition line for Aspha-min® Zeolite in Florida
[55] ...................................................................................................................................... 31
Figure 2.10: Specimen loading in Indirect Tension testing device [80] ............................. 39
Figure 2.11: IDT Test equipment set up [79] ..................................................................... 40
Figure 2.12: Moisture Induced Sensitivity Tester (InstroTEK) [77] .................................. 41
Figure 3.1: Schematic diagram of the MiST conditioning device [82] .............................. 45
Figure 3.2: Bucket Mixer .................................................................................................... 46
Figure 3.3: Pine Instruments AFG 2 Superpave™ Gyratory Compactor ........................... 47
Figure 3.4: Struers automated tile saw blade for cutting specimen .................................... 48
Figure 3.5: Dry Conditioning in Zip-lock bags .................................................................. 50
Figure 3.6: MiST conditioning System ............................................................................... 51
Figure 3.7: (a) (b) Results from Visual Inspection of failed Wet Conditioned Specimen ..
............................................................................................................................................. 54
Figure 3.8: Impulse Creep curve showing tangent at turning point [91] ............................ 55
Figure 3.9: Uniaxial Cyclic Compression Test with Partial Confinement (UCCTC) ........ 56
Figure 3.10: (a) and (b) Dense graded and Stone Mastic Asphalt Specimen ..................... 58
Figure 4.1: Percent Swell of Control and 0.5% WMA at 25oC .......................................... 65
Figure 4.2: Tensile strength of DANRAF and Warm mix additives .................................. 68
Figure 4.3: (a) and (b) Fractured surface of test specimen ................................................. 69
Figure 4.4: (a) Air voids of Dense graded mixes TB 26 and TB 27 ................................... 71

x
Figure 4.4: (b) Air voids of Stone mastic asphalt SMA specimen ..................................... 71
Figure 4.5: (a) Strain rate at inflection for TB 26 and TB 27 dense graded specimen ....... 72
Figure 4.5: (b) Strain rate at inflection for AR 28 stone mastic asphalt specimen ............. 74
Figure 4.6: (a) Number of cycles to inflection for dense graded specimen ........................ 75
Figure 4.6: (b) Number of cycles to inflection for stone mastic specimens ....................... 76
Figure 4.7 (a) – (d) Creep compliance for dense graded specimen .................................... 78
Figure 4.8 (a) – (e) Creep compliance for stone mastic asphalt rubber specimen .............. 80
Figure 4.9 (a) Average creep compliance at 50 s for dense graded specimens .................. 82
Figure 4.9 (b) Average creep compliance at 50 s for stone mastic asphalt rubber ............. 83
Figure 4.10 Creep compliance versus load time for dense graded asphalt mixtures .......... 84
Figure 4.11 Average tensile strength for TB dense graded mixes ...................................... 85
Figure 4.12 Average tensile strength for AR stone mastic asphalt ..................................... 85
Figure 4.13 (a) Crack predictions for dense graded asphalt mixtures ................................ 86
Figure 4.13 (b) Crack predictions for stone mastic mixtures .............................................. 87
List of Tables
Table 3.1: Visual condition definitions ............................................................................... 53
Table 4.1: Air Voids of samples for Moisture Susceptibility Test ..................................... 62
Table 4.2: Pre- and Post- Conditioned BSG ....................................................................... 64
Table 4.3: Dry and wet conditioned tensile strength .......................................................... 66
Table 4.4: Summary of MiST results .................................................................................. 69

xi
xii
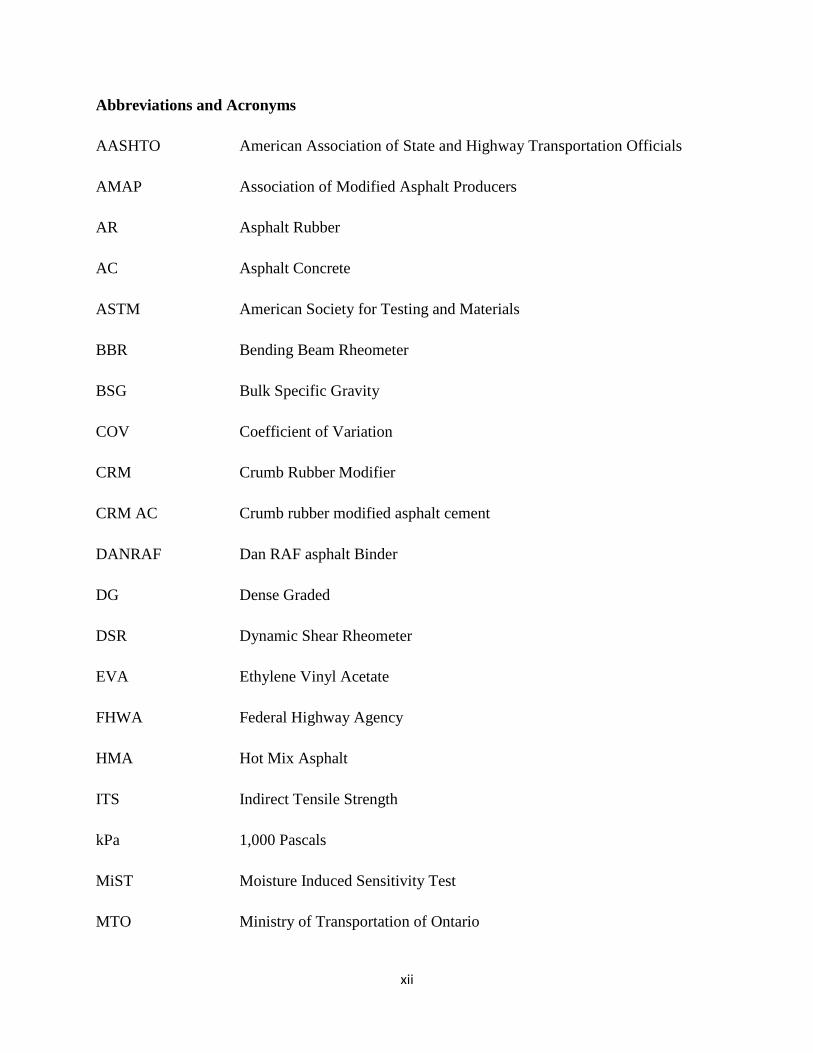
Abbreviations and Acronyms
AASHTO American Association of State and Highway Transportation Officials
AMAP Association of Modified Asphalt Producers
AR Asphalt Rubber
AC Asphalt Concrete
ASTM American Society for Testing and Materials
BBR Bending Beam Rheometer
BSG Bulk Specific Gravity
COV Coefficient of Variation
CRM Crumb Rubber Modifier
CRM AC Crumb rubber modified asphalt cement
DANRAF Dan RAF asphalt Binder
DG Dense Graded
DSR Dynamic Shear Rheometer
EVA Ethylene Vinyl Acetate
FHWA Federal Highway Agency
HMA Hot Mix Asphalt
ITS Indirect Tensile Strength
kPa 1,000 Pascals
MiST Moisture Induced Sensitivity Test
MTO Ministry of Transportation of Ontario
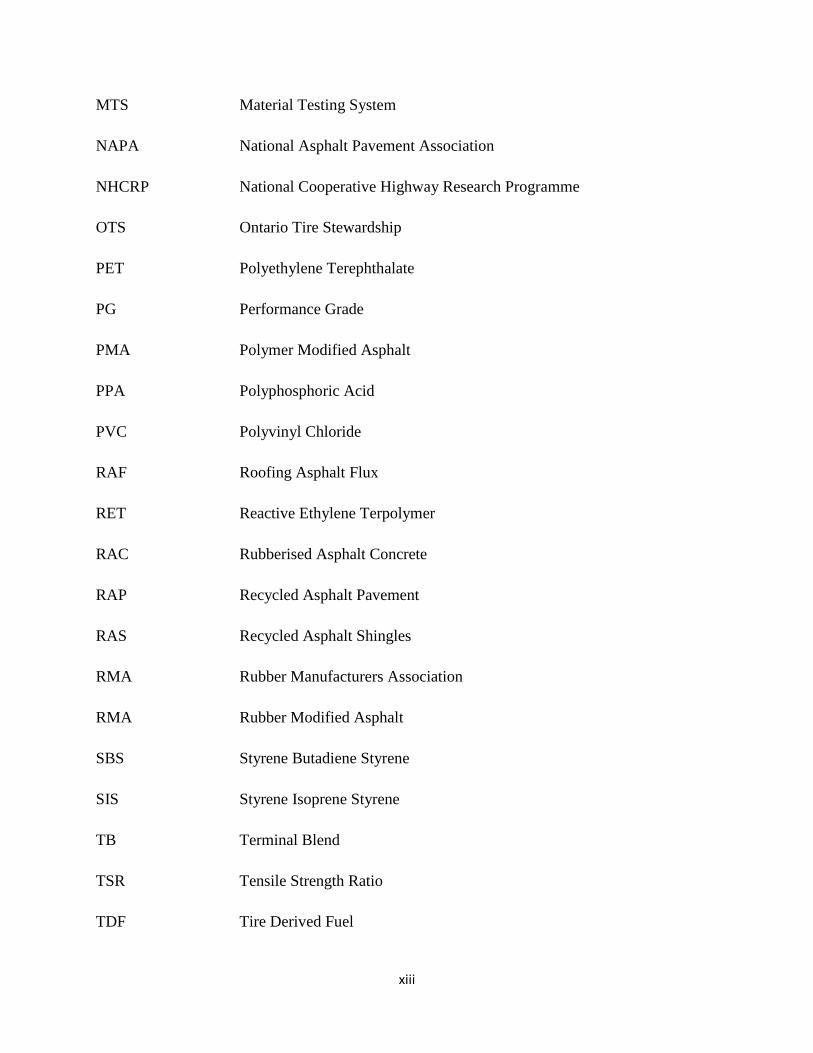
xiii
MTS Material Testing System
NAPA National Asphalt Pavement Association
NHCRP National Cooperative Highway Research Programme
OTS Ontario Tire Stewardship
PET Polyethylene Terephthalate
PG Performance Grade
PMA Polymer Modified Asphalt
PPA Polyphosphoric Acid
PVC Polyvinyl Chloride
RAF Roofing Asphalt Flux
RET Reactive Ethylene Terpolymer
RAC Rubberised Asphalt Concrete
RAP Recycled Asphalt Pavement
RAS Recycled Asphalt Shingles
RMA Rubber Manufacturers Association
RMA Rubber Modified Asphalt
SBS Styrene Butadiene Styrene
SIS Styrene Isoprene Styrene
TB Terminal Blend
TSR Tensile Strength Ratio
TDF Tire Derived Fuel

xiv
WMA Warm Mix Additives
UCCTC Uniaxial Cyclic Compression Test with partial Confinements
Symbols
μm/cycle micrometer per load cycle
% Percent
P Peak Load
D Specimen Diameter
H Specimen Height
T Specimen thickness
π pi (3.142)
°C Degrees Celsius
MPa Megapascals

xv

1
CHAPTER 1
INTRODUCTION
1.1 Road Pavement Overview
A viable system of good highways moving people, goods and services is crucial to our quality of
life. The United Nations Environmental Programme reports that over 80% of the population in
North America lives in urban areas, and projections show that it could get up to 90% by the mid
twenty-first century. Cities have evolved into nerve centres of concentrated production and
consumption of goods and services. Automobiles are an increasing means of mobility, owing to
the vast majority of people living in urban areas. Therefore, improved highways will be needed to
accommodate future demand in transportation. It has also been widely recognised that highways
play an important role in regional and economic growth and development. Motorists are
increasingly aware of the condition of the roads they travel and the general population demands
better roads [1, 2, 3].
Asphalt remains the major choice of material for the construction of roads in North America. The
United States has almost 2.2 million miles of paved roads, over 94% of which is surfaced with
asphalt. Similar reports show that asphalt is used for over 90% of roads in Canada and Mexico [4].
In recent times, the emphasis has shifted from building new roads to the maintenance and
rehabilitation of existing pavement surfaces. Several tons of asphalt pavements are removed for
widening and resurfacing projects and reused [5]. The Virginia Asphalt Association reported that
in 2011, over 3.7 million tons of liquid asphalt binder was saved through the use of Recycled
Asphalt Pavement (RAP) and Recycled Asphalt Shingles (RAS). Hence asphalt is being regarded
as North Americas most recycled material, more than aluminium, paper or plastic [4, 6].
1.2 Definition of Asphalt
Asphalt is a brownish-black solid or semisolid material that occurs naturally or that is obtained as
a by-product of petroleum distillation. It is widely used as a binder for aggregates and sand in road
pavement construction. It is also utilized in the roofing industry where it is mixed with fine
aggregates and fibres to produce water proofing membrane [7]. According to the American Society

2
for Testing and Materials (ASTM), asphalt cement is defined as a “dark brown or black
cementitious material occurring in nature or obtained by crude oil refining where the predominated
material is mainly bitumen” [7].
1.2.1 Origin, and Sources of Asphalt
Asphalt occurs naturally as the product of an immense amount of heat and pressure acting on the
remains of organic material buried deep within the earth. Over time, asphalt can be observed as a
subterranean bituminous material seeping up to the surface. In ancient times such occurrences were
called “tar pits” as they were observed in pools or on the surface of water. There are a number of
such asphalt deposits in various locations around the world which include; the Trinidad “lake”
deposits on the Caribbean Island of Trinidad, the “tar sands” of western Canada, the Gilsonite
deposits of Utah, and the La Brea tar pits of Southern California. Nowadays, asphalt is commonly
obtained as the vacuum residue of the fractional distillation of crude oil [8].
1.2.2 Constituents of Asphalt
Asphalt is a highly complex hydrocarbon mixture, and so, it is a not well-characterised material.
Its hydrocarbon profile includes saturated and unsaturated aliphatic and aromatic compounds with
up to 150 carbon atoms. Asphalts generally contain about 80% by weight of carbon; around 10 %
hydrogen; up to 6 % sulfur; small amounts of nitrogen; and trace amounts of metals such as iron,
nickel, and vanadium. The compounds are classified as asphaltenes or maltenes based on their
molecular weight and solubility in n-hexane or n-heptane. Asphaltenes are of high molecular
weight and are insoluble in these solvents, whereas maltenes have lower molecular weight and are
soluble. Asphalts typically contain about 5-25 % of asphaltenes and can be structurally considered
as a colloid of asphaltene micelles dispersed in the maltene oils [9].
1.3 Asphalt Modification
Since the 1970s, asphalt cements have undergone several forms of modification to improve
performance of the asphalt concrete mix. This became necessary as new crude sources and changes
in production operations drastically reduced the quality and quantity of asphalt available. More so,
poor maintenance funding and the evolution in the high traffic loading caused a decline in the
performance of asphalt performance. Super-paveTM design specifications also require modification

3
of the asphalt binder. Therefore various types of polymers and chemical additives are currently
used to improve the performance of asphalt binder [10].
1.3.1 Crumb Rubber Modified Asphalt (CRM)
Rubberised asphalt involves the use of crumb rubber to enhance the performance of the asphalt
concrete mix. The United States Federal Highway Administration [11] strongly supports the use
of waste rubber in asphalt paving materials. Statistics show that the United States remains the
largest single market for ground rubber, as approximately 12 million waste tires (i.e., over 100,000
tons) are consumed annually [12]. The dry process of producing asphalt rubber involves mixing
the crumb rubber with the aggregates within the asphalt mix, while the wet process involves
blending the crumb rubber with asphalt cement at specific temperatures. The wet process for crumb
rubber modified asphalt improves rutting resistance, resilience modulus and fatigue cracking of
the asphalt mix [13].
1.3.2 Warm Mix Additives
Warm mix additives are waxes or liquid surfactant-based chemicals used to improve the
workability of hot mix asphalt. They lower the viscosity of asphalt mix, thereby reducing
production and compaction temperatures by as much as 40°C. This translates to huge economic
benefits and high production rates and less energy cost is expended on field operations. Also, better
environmental working condition is attained as there are less particulate and gaseous emissions
[10].
1.4 Hot Mix Asphalt
Hot mix asphalt (HMA) also called asphalt concrete (AC), is a material used for construction
projects such as road surfaces, airports and parking lots. It consists of asphalt used as a binder and
mineral aggregates mixed together, placed in layers and then compacted to give the desired
pavement. Before mixing, the aggregates are dried to remove moisture and the asphalt binder is
heated to approximately 200°C to reduce its viscosity. When a homogenous mixture is attained,
paving and compaction is done while the asphalt mixture is still hot. In countries like Canada,
paving is done in summer because in the winter the compacted base will cool the asphalt too fast
before it can be compacted.

4
Superpave, which is short for ‘SUperior PERforming PAVEments,’ is a pavement design system
developed to provide durable pavements that can resist various forms of distress. Key criteria for
the Superpave performance grading of hot mix asphalt include the following:
Figure. 1.1 Hot Asphalt Mix (HMA) [14].
Performance grading of asphalt binders;
Careful selection of aggregates of a particular gradation;
Volumetric proportion of ingredients in the mix;
Compaction specification to get required air voids; and
Evaluation of the mix [15].
1.5 Road Pavement
A pavement is a road structure consisting of graded layers of structural materials set above the
natural soil (or sub-grade), with the basic function of supporting traffic loads safely and
economically. Conventionally, pavement design should meet certain specifications which include:
a surface of good ride quality, adequate skid resistance and favourable light reflection. Another
fundamental consideration for pavement design is to ensure extended functional life with minimal
maintenance and repair frequency. Ultimately, the pavement structure is built to effectively
distribute and reduce the stress transmitted from traffic loads such that they don’t exceed the sub-
grade strength [20, 21]

5
1.6 Cross-Section of Pavement
1.6.1 Surface course: The surface course shown in Fig. 1.2 is constructed with dense graded, hot
mix asphalt concrete (HMA). This layer comes in direct contact with the traffic, and so should
possess sufficient stability and durability to resist distortion under traffic loads. Also, it should
effectively withstand the adverse effects of environmental factors such as air, water and
temperature changes without showing extensive signs of failure. Additionally, surface courses
should prevent water from infiltrating into the underlying layers and provide sufficient smoothness
and skid resistance [22].
1.6.2 Base course: The base course shown in Fig 1.2 may consist of crushed stone, crushed slag
and is often regarded as the most important structural layer of a pavement. It ensures traffic load
distribution and enables adequate sub-surface drainage [18].
1.6.3 Sub-base: The sub-base shown in Fig 1.2 sits beneath the base course and it provides
structural support to the sub-grade layer. It reduces intrusion of fines from the sub-grade thereby
contributing substantially to the foundation of the road structure. In cases where the pavement is
to be constructed over a stiff and superior quality sub-grade, then a sub- base may not be required.
1.6.4 Sub-grade: The sub-grade shown in Fig. 1.2 consists of the natural soil and certain particle
size of aggregates, compacted to specific levels so as not to be overstressed. This layer provides
the right foundation for absorbing the stresses transmitted from the layers above [18].
Figure 1.2 Cross section of asphalt concrete pavement [18].

6
1.7 Pavement Deterioration
Pavement deterioration is the decreasing serviceability caused by defects which develop under the
cumulative effects of traffic loading and environmental conditions [19]. The Ontario Municipal
Road Maintenance and Rehabilitation Guide (2009) suggests that due to their typical resilient
nature, asphalt pavements could last for over twenty years depending on the service conditions.
More so, identifying and promptly tackling early signs of defects could significantly extend the
lifespan of asphalt pavements. There are four commonly identified failure modes in asphalt
pavements: cracking (i.e., low temperature, fatigue and random cracking); rutting; disintegration;
and surface defects like ravelling and bleeding.
1.7.1 Fatigue Cracking
Fatigue cracking (Figure 1.3) is the progressive formation of interconnected cracks in the
pavement structure due to repeated traffic loading. Depending on the dimension of the pavement,
the cracks initiate where the tensile stress is highest and extends to form longitudinal cracks.
Hence, in thin pavements cracks begin from the bottom and extend to the surface giving rise to
bottom-up cracking, while top-down cracking is predominant in thick pavements. Upon repeated
loading, longitudinal cracks connect forming patterns similar to that on the back of an alligator;
hence it is popularly called alligator cracking. Proper selection of Hot Mix Asphalt (HMA) with
an appropriate mix design can significantly reduce fatigue cracking [20].
Figure 1.3 Fatigue cracking [21].

7
1.7.2 Low Temperature Thermal Cracking
Low temperature cracking is the predominant asphalt distress in the northern United States and
Canada. It occurs during cold weather conditions, where pavement contraction results in a build-
up of tensile stress. It is easily identified by recurring transverse cracks that occur at a remarkably
consistent spacing Fig 1.4. Generally, low temperature cracking is common when hard asphalt is
used. Also, extreme aging (oxidation), as a result of high air void contents, can contribute to low
temperature cracking [20].
Figure 1.4 Low temperature cracking [21].
1.7.3 Rutting
Rutting or permanent deformation of the pavement sub-grade is caused by consolidation or
displacement of materials due to repeated traffic loading. This failure mode occurs in the base or
sub- base as a result of excessive stresses, moisture infiltration or a basic design failure. Hence, it
could appear as a depression in the wheel path or as uplift along the sides of the rut (Figure 1.5).
Rutting normally occurs when a pavement is newly constructed and becomes minimal as the
asphalt binder hardens and becomes aged. Rutting is more common in summer when elevated
temperatures soften the asphalt cement [22].

8
Figure 1.5 Rutting [21].
1.7.4 Stripping (Moisture Damage)
Stripping is the gradual loss of adhesion between the asphalt film and the aggregate surface
resulting in the loss of integrity of the hot asphalt mix [16]. So, the pavement becomes susceptible
to various forms of failure by losing its structural stiffness. Factors that contribute to stripping
include; water on pavement with high traffic load, high temperature, nature of aggregates and
binder, and poor compaction. Stripping can lead to other forms of distress such as cracking and
rutting.
Figure 1.6 Stripping in pavement [21].
9
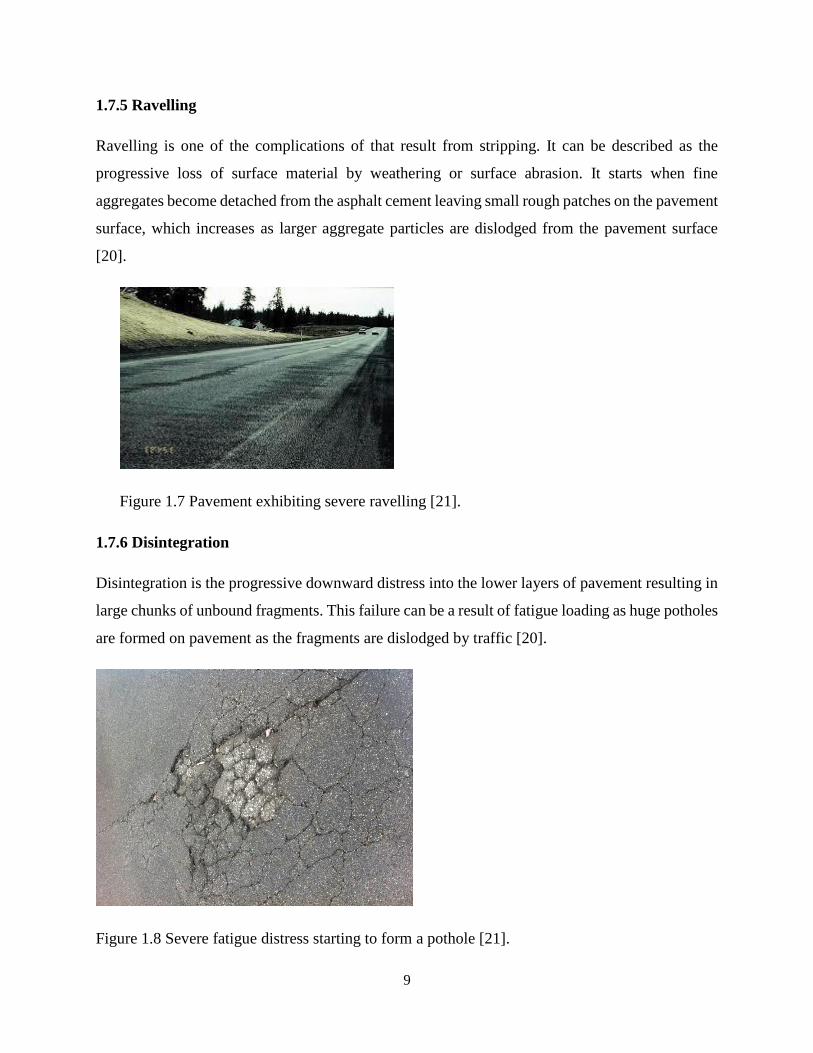
1.7.5 Ravelling
Ravelling is one of the complications of that result from stripping. It can be described as the
progressive loss of surface material by weathering or surface abrasion. It starts when fine
aggregates become detached from the asphalt cement leaving small rough patches on the pavement
surface, which increases as larger aggregate particles are dislodged from the pavement surface
[20].
Figure 1.7 Pavement exhibiting severe ravelling [21].
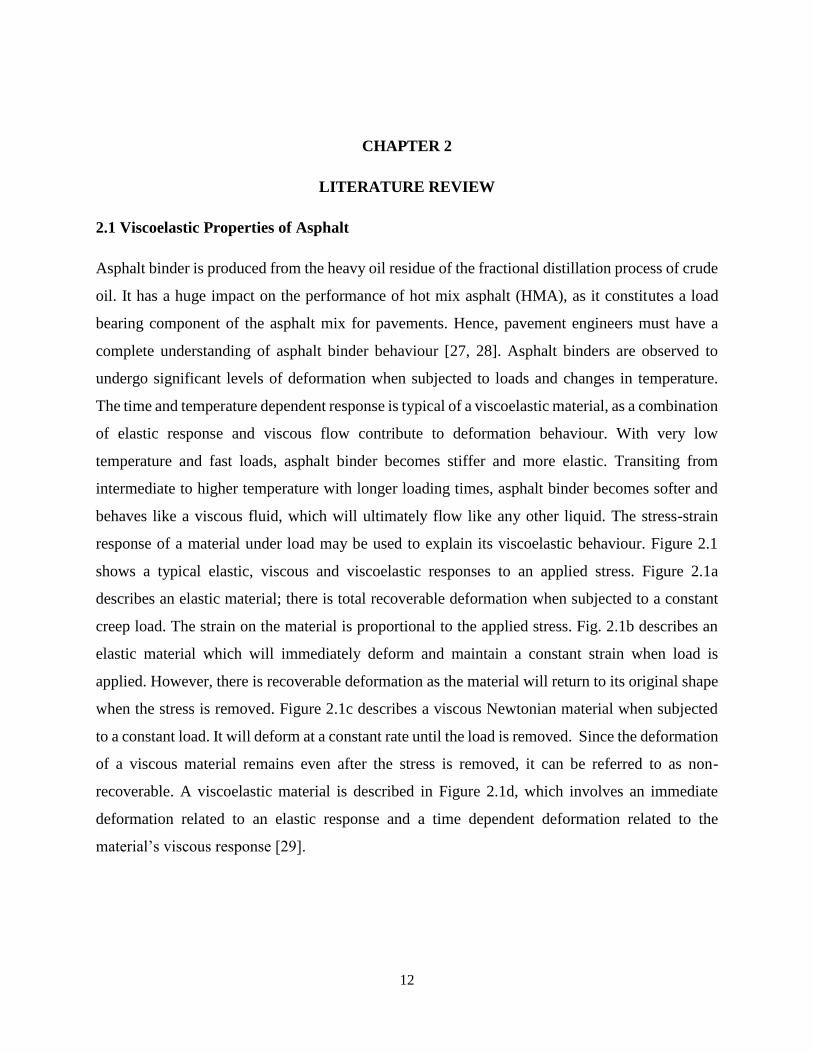
1.7.6 Disintegration
Disintegration is the progressive downward distress into the lower layers of pavement resulting in
large chunks of unbound fragments. This failure can be a result of fatigue loading as huge potholes
are formed on pavement as the fragments are dislodged by traffic [20].
Figure 1.8 Severe fatigue distress starting to form a pothole [21].

10
1.8 Scope and Objectives
The high turnout of scrap tire in the automobile industry poses a major environmental solid
waste problem in North America. Engineers have developed an economically viable way to
solve this problem, based on the fact that the waste tires still contain about 70% good quality
rubber. The utilisation of recycled tire rubber has been used to produce rubberised asphalt
concrete, amongst other important industrial applications [22]. Rubberised asphalt concrete
has better stability and is highly resistant to permanent deformation, thermal cracking and
aging behaviour. Therefore, pavements constructed with rubberised asphalt concrete are
thought to be more durable, produce better drive quality and cost effective to maintain [23].
Generally crumb rubber modified asphalt (CRM) is preferred to other polymers like styrene-
butadiene-styrene (SBS), because it is cheaper to obtain and it provides a dependable solution
to the waste tire rubbers which will otherwise occupy landfills [22].
However, a major drawback with the use of crumb rubber modified asphalt is the resulting
higher viscosity of the asphalt cement, which requires a relatively high temperature to pump
the binder through the plant, and effectively coat the aggregates [22]. Warm mix asphalt
(WMA) technology has been developed to curb this problem. This involves the use of additives
such as waxes, surfactants and other proprietary modifiers. These additives enable the lowering
of the shear viscosity of the asphalt binder, thereby reducing production and compaction
temperatures by as much as 40°C. Warm mix additives improve binder performance by
providing good cracking resistance, moisture resistance, good adhesion and cohesions within
the pavement layers. Another major benefit of the lowered production and compaction
temperatures is that asphalt concrete can be hauled over longer distances to paving sites and
the paving season can be extended especially in cold regions like Canada [24].
Low temperature thermal cracking is a major pavement distress in North America due to the
extreme temperatures during winter months. The mechanism of low temperature cracking is
contraction which causes a build-up of internal stress which exceeds that of the mix. Stress
growth and relaxation cause micro cracks to develop which increase to form larger cracks.
Water can then easily infiltrate the pavement which could cause moisture damage. Crumb
rubber modified asphalt provides a significant improvement in the low temperature
performance of asphalt pavements. Researchers recommend that more studies be carried out

11
on crumb rubber modified asphalt with additives to investigate its long term performance on
asphalt pavements [25].
The objective of this study is to access the high temperature and low temperature performance
behaviour of crumb rubber modified asphalt concrete. Various commercial samples of warm
mix additives are investigated to examine their effect on the performance of asphalt mix.
Specific areas of study include:
Investigation of high temperature permanent deformation behaviour of Asphalt Rubber
(AR) designs, the effect of WMA on resistance to permanent deformation.
Low temperature cracking of AR design and the effect of WMA on the resistance to low
temperature cracking.
Stripping behaviour of hot mix asphalt concrete and the effect of WMA to moisture
damage.
The failure indices of low temperature behavior will be used to provide recommendations as
to Rubberised Asphalt Concrete (RAC) designs suitable for particular locations, especially in
cold regions of Canada. Moisture Induced Sensitivity Testing (MiST) proposes an accelerated
and reliable test for determining moisture sensitivity of asphalt mix, as it incorporates
fundamental field mechanisms for stripping.
12
CHAPTER 2
LITERATURE REVIEW
2.1 Viscoelastic Properties of Asphalt
Asphalt binder is produced from the heavy oil residue of the fractional distillation process of crude
oil. It has a huge impact on the performance of hot mix asphalt (HMA), as it constitutes a load
bearing component of the asphalt mix for pavements. Hence, pavement engineers must have a
complete understanding of asphalt binder behaviour [27, 28]. Asphalt binders are observed to
undergo significant levels of deformation when subjected to loads and changes in temperature.
The time and temperature dependent response is typical of a viscoelastic material, as a combination
of elastic response and viscous flow contribute to deformation behaviour. With very low
temperature and fast loads, asphalt binder becomes stiffer and more elastic. Transiting from
intermediate to higher temperature with longer loading times, asphalt binder becomes softer and
behaves like a viscous fluid, which will ultimately flow like any other liquid. The stress-strain
response of a material under load may be used to explain its viscoelastic behaviour. Figure 2.1
shows a typical elastic, viscous and viscoelastic responses to an applied stress. Figure 2.1a
describes an elastic material; there is total recoverable deformation when subjected to a constant
creep load. The strain on the material is proportional to the applied stress. Fig. 2.1b describes an
elastic material which will immediately deform and maintain a constant strain when load is
applied. However, there is recoverable deformation as the material will return to its original shape
when the stress is removed. Figure 2.1c describes a viscous Newtonian material when subjected
to a constant load. It will deform at a constant rate until the load is removed. Since the deformation
of a viscous material remains even after the stress is removed, it can be referred to as non-
recoverable. A viscoelastic material is described in Figure 2.1d, which involves an immediate
deformation related to an elastic response and a time dependent deformation related to the
material’s viscous response [29].

13
Figure 2.1 Mechanical responses of elastic, viscous and viscoelastic materials [28].
As illustrated, the viscous deformation component ceases when the load is removed, but the
deformation is not recovered. The delayed elastic deformation component is slowly recovered at
a decreasing rate. Hence, when a viscoelastic material is subjected to creep loading, it experiences
only a partial recovery of the deformation [29].
The loading response as illustrated above refers to those within the linear range, where the
deformation is directly proportional to applied load at any time and temperature. This is the basis
for which engineers analyse asphalt binder response to the loading conditions and environmental
stresses encountered on the field [28, 29]. The resistance to deformation as a material property of
asphalt binder can be explained by its relative distribution of its resistance between its elastic
component and its viscous component within the linear range. The relative distribution of the
resistance between the elastic and the viscous component is dependent on the asphalt cement
characteristics and temperature and loading rate [16].
Numerous studies have described various factors which influence the long-term rheological
properties of asphalt binder. Most prominent of which is age hardening, also referred to as
oxidative aging. Asphalt binder consists of hydrocarbons which can be oxidised when exposed to
atmospheric oxygen. Also, volatilization (which is the loss of lighter constituents of asphalt

14
binder), occurs during hot mix asphalt HMA production and environmental service conditions.
Oxidation and volatilization increases the viscosity of asphalt binder and makes it more brittle.
The rate and extent of age hardening effect is determined by time of exposure and service
temperatures.
The most significant effect of age hardening is observed during the production of HMA, where
asphalt binder and aggregate are mixed at elevated temperatures of up to 163oC. This extreme
condition accelerates asphalt binder oxidation and volatilization. Age hardening continues during
transportation to the project site and during compaction, though at a slower rate. During service
life, the rate of age hardening reduces such that changes in rheological properties can only be
observed over long periods [29, 30].
Aging behavior of asphalt binder can be determined by subjecting the binder to simulated aging
conditions and measuring physical parameters like viscosity, dynamic shear rheometer DSR,
bending beam rheometer BBR, and direct tension test. Typical aging simulation tests include:
Thin-film Oven Test (TFOT);
Rolling Thin-Film Oven Test RTFOT); and
Pressure Aging Vessel (PAV).
2.2 Performance Grading of Asphalt
The Strategic Highway Research Program (SHRP) developed the Performance Grading (PG)
system, based on the physical properties of asphalt binder under service conditions [18]. PG
asphalt binders are selected to meet expected climatic conditions and aging considerations with a
level of reliability. The grade notation consists of the high and low portions of the pavement service
temperature. The concern for the high temperature performance is rutting which relates to high
temperature climate. On the low temperature side the major consideration for performance is
thermal cracking. High and low temperatures are graded in 6oC [18]. Therefore a binder identified
as PG 64-10 must meet performance criteria at an average 7 day maximum pavement temperature
of 64oC and also a minimum pavement temperature of -10oC. This gradation comes with a 98%
reliability, i.e. PG 64-10 means that asphalt binder must perform satisfactorily under normal traffic
conditions at the location where the pavement temperature range from -10°C to 64°C throughout

15
its service life with a minimum 98% confidence level. Typically, a high confidence level is adopted
to account for low temperature performance; conditioning time for samples in low temperature
tests is relatively short, and an error in a few degrees can easily reduce confidence level by 50%.
The PG system has enabled the choice of appropriate binder for climatic conditions, thereby
improving pavement performance [16, 18, 27].
2.3 Asphalt Aggregate Interaction
Research has shown that the interaction between asphalt binders and aggregates within mixture
affect the adhesive and cohesive strength of the mixture. In same regard, the bond formation at the
interface between asphalt binder and aggregate largely depends on the chemical composition of
asphalt as well as aggregate. Many compounds of asphalt contain acid-base molecules which
include: alcohol, carbonyl, phenolic, amine, thiol, and other functional groups. On the other hand,
the chemical composition of aggregates used in practice includes a wide variety of mineralogical
components depending on the source [16, 31]. The predominant compounds that make up most
aggregate include; silicon (which are acidic in nature), and calcium carbonate (which are basic in
nature).Figure 2.2 gives examples of aggregates as used in the United States. Logaraj et al. [32]
suggest that the bonding of asphalt acid-base molecules to the basic molecules of aggregates
significantly contributes to the adhesion of HMA.
Figure 2.2 Acid-base composition of typical aggregates [30].

16
Similarly, physical parameters such as surface texture and porosity affect the mechanical bond
between the asphalt and aggregates. These physical and chemical interactions have an impact on
the long term performance properties of HMA pavements such as: high temperature permanent
deformation, low temperature cracking, moisture damage [16, 31].
2.4 Asphalt Modification Review
Since ancient times, asphalt has served several construction purposes mainly due to its binding and
waterproofing properties. Unmodified asphalt is a highly viscous liquid, and so becomes brittle at
low temperatures and soft at high temperatures, which poses a major challenge to its utilization.
Despite the continuous improvement on asphalt production processes, mix design and pavement
design, there are limits to the extent that asphalt can surmount the challenge. Harsh climatic
conditions, accelerated wear and tear as a result of heavy traffic negatively impact the durability
of asphalt pavements [33, 34].
Since the implementation of SHRP PG specifications, asphalt binder modification has gained
prominence, the goal of which is to improve its overall performance properties. Over the past
decade, producers of asphalt binders have developed several additives to enhance their
performance properties. The Association of Modified Asphalt Producers (AMAP), reports that
between 15-20% of all asphalt binders are currently modified. Some of the categories of modifiers
used include:
Block copolymers (SB, SBS, SEBS);
Random copolymers (SBR latex);
Polyolefins;
Reactive ethylene terpolymers (RET);
Crumb rubber;
Chemical additives; and
Engineered binders.
With the use of modifiers, key binder performance properties such as thermal susceptibility (at
temperatures close to paving temperatures), aging at medium and intermediate temperature, and
resistance to rutting and fatigue cracking have been significantly improved [35]. Also, with the use

17
of modified asphalt, more miles of paving can be achieved with reduced structural thickness of
pavements, and the overall durability of the pavement ensures upfront cost savings and reduced
routine maintenance cost. Styrene butadiene styrene (SBS) block copolymers are reported to be
the most successful polymers for producing polymer modified asphalt (PMA) [33, 34, 35].
Some important factors to be considered in the utilization of synthetic polymers to modify asphalt
include: chemical compatibility with the base asphalt, mixing times and temperatures, rheological
benefits and operational handling of the final mix [34]. Chemical incompatibility of the asphalt
and copolymer can be described as a phase separation which results from an imbalance in the
solvency of the maltene fraction of the asphalt. Compatibilizing agents such as aromatic oils are
added to the mix to solve this problem [36, 37].
The Association of Modified Asphalt Producers has shown the effect of mixing time and
temperature on modified asphalt properties and has come up with guidelines for storage, plant
operations and workability of modified hot asphalt mixtures [33].
Catalytic air blowing processes have been developed in asphalt modification. A thermoplastic
polymer such as ethylene vinyl acetate (EVA) is added to the paving asphalt prior to air-blowing
to get the desired asphalt product. This process also significantly reduces the problem of
incompatibility resulting from the increased viscosity of the modified product. Also, a catalyst is
used to improve the efficiency of the air blowing process and also maintains the desired softening
point/penetration relationship of the final product [34, 35].
Polyphosphoric acid or PPA (Hn+2PnO3n+1), a polymer of orthophosphoric acid (H3PO4), has been
used to modify asphalt binders in North America for over 30 years. Statistics show that over 400
million tons of asphalt mixes modified with PPA have been utilized on United States highways in
the past 5 years [38]. PPA is commercially graded based on the content of orthophosphoric acid
(H3PO4), pyrophosphoric acid, triphosphoric acid and higher acid mixture, and so 115% and 105%
orthophosphoric acid grades are commonly available [35]. PPA reacts with some of the
components of asphalt, when used as an additive in the air blowing oxidation process. This
increases the high temperature performance (PG) rating of the asphalt binder without affecting the
low temperature properties. Additionally, it allows for significant reduction in the level of polymer
required to meet elastic recovery requirement in polymer modified asphalt. AMAP holds a position

18
that the correct use of the proper acids in the appropriate amount can improve performance of
paving grade binders; it recommends appropriate testing on the modified asphalt to ascertain the
final product specifications [35].
In 2012, The Federal Highway Administration in conjunction with the Transportation Research
Board and Minnesota Department of Transportation have reviewed laboratory and field
investigations regarding PPA modified asphalt performance in major American highways. Key
findings show that the stiffening effect of PPA on the binder is crude source dependent and
anywhere from 0.5% to over 3% is needed to increase the binder grade. Also, PPA works as a
stiffener and cross linking agent in combination with polymers such as SBS and reactive ethylene
terpolymer, (RET) improving the delayed elastic response of polymer modified binders.
Furthermore, hydrated lime or limestone aggregate could barely reduce the stiffening effect of
PPA on the binder and a 10 year assessment of PPA asphalt modified pavement in several states
showed good performance [39].
2.5 Types of Polymer Modified Asphalt (PMAs)
Asphalt polymer modifiers can be described based on their interaction with the asphalt binder.
‘Passive’ polymers (which include elastomers and plastomers), are preformed and then mixed with
the asphalt binder. Elastomers form molecular 3-dimensional (3D) networks through physical
crosslinking with asphalt binder, imposing strength and elasticity. Styrene-butadiene-styrene
(SBS) and styrene-isoprene-styrene (SIS) typically fall into this category. Plastomers increase
binder viscosity, examples of these include natural rubber, SBR and polyisoprene and
polybutadiene [18, 40].
Alternatively, ‘active’ polymers undergo chemical reactions with specific functionalities in the
binder without crosslinking with asphalt structure. The resulting polymer networks through the
asphalt matrix alter the penetration, viscosity and softening point of the asphalt binder. Examples
of this include ethylene vinyl acetate (EVA), polyvinylchloride, polystyrene, and polyethylene. In
practice, 5% or less polymer content is optimal to obtain desirable properties, and sulphur is added
to improve stability, compatibility and strength to the PMA blend [34, 40].

19
2.6 Scrap Tire Applications
The Rubber Manufacturers Association (RMA) in the United States has developed economically
viable means to utilize scrap tires generated from the automobile industry. RMA partners with
relevant stakeholders like end users, processors and other regulatory bodies to improve awareness
and sustain the potential scrap tire markets in the country. A typical scrap tire landfill is shown in
Figure 2.3 (a) and statistics showing the US scrap tire trend from 2005 to 2011 is shown in Figure
2.3 (b). The amount of scrap tires produced and the percentage realised in the market (or utilised)
can be seen.
Figure 2.3 (a) Scrap tire stockpile on landfills [40].

20
Figure 2.3 (b) US scrap tire trends 2005-2011 [41].
Rubber Manufacturers Association reports that in 2011, 265.8 million scrap tires were generated
in the United States. A total of 35.1 million (or 13.2 %) were culled as used tires. The remaining
230.7 million were utilised in a variety of markets (Figure 2.4): 37.7 % were used as tire-derived
fuels TDF; 24.5 % went to ground rubber applications such as asphalt rubber, rubber mulch,
playgrounds and athletic surfaces; 13 % were disposed in landfills; 8 % were exported overseas;
7.8 % went into civil engineering applications; and 8.9 % went to other unknown uses.
Ground rubber has been used to modify asphalt binder used in paving to improve the performance
of the pavements [41, 42].

21
Figure 2.4 U.S. Scrap tire disposition [41].
In 2009, the Government of Ontario launched the Ontario Used Tire Program to manage all tires
generated annually in Ontario and to execute the clean-up of existing stock piles. The program is
funded by the Industry Stewards within the framework of the Ontario Tire Stewardship (OTS), to
manage end-of-life tires and other related products. The Ontario Used Tire Program contains
targets for collection, reduction, reuse and recycling of on the road and off the road tires. On road
tires include passenger, light truck and medium truck tires while off the road tires refer to
agriculture and logger/skidder motorised vehicles [43].
2.7 Crumb Rubber
Tire rubber is manufactured using a vulcanization process, which is an irreversible action between
elastomers, sulfur and other chemicals, producing crosslinks between the elastomer molecular
chains and leading to the formation of three dimensional chemical networks. The resulting cross-
linked solid product is infusible and insoluble in thermoset liquids, and so the direct reprocessing
and recycling of tire rubber is impossible. Furthermore, disposal of waste tires is a huge task
because tires have a long life and are non-biodegradable. Conventionally, the methods of waste
tire management have been stockpiling or illegal dumping or landfilling, all of which have proved
to be short-term solutions [42, 45]. It is reported that there are 2-3 billion scrap tires stockpiled in
the United States, and the volume of scrap tire generation in developed countries is also on the
increase. The U.S. Environmental Protection Agency enumerates several environmental problems

22
associated with stock piling of waste tires, which include: huge fire outbreaks which are very
difficult to extinguish, causing toxic gaseous emissions; large amount of useful space consumed;
breeding ground for snakes, rodents, dangerous mosquito strains and other pests [46].
An effective way to recycle scrap tire is by producing crumb rubber modifier (CRM) for the
modification of asphalt. It is believed that the asphalt industry has the capacity to utilise over 40
% of scrap tires produced annually. During the recycling process, the steel and the fluff are
removed and the rubber is ground to a granular consistency. The mass could be reduced to the
desired dimensions with the aid of cryogenics or other mechanical means. The particles can be
sized and sorted based on certain criteria such as mesh size. Particle size is expressed as a
dimension (i.e., inches) or mesh (i.e., holes per inch). ‘Mesh’ is a size gradation done by passing
particles through a screen with a given number of holes per inch (e.g., 10 mesh crumb rubber has
passed through a screen with 10 holes per inch resulting in rubber granulates less than a tenth of
an inch). Therefore we can have 5 mesh, 10 mesh, 20 mesh, etc. [23, 40, 46].
2.8 Rubberized Asphalt Cement Processing
Rubber modified asphalt (RMA) usage has gained interest in transport agencies across North
America, because of the technical benefits and potential environmental savings. RMA can be
incorporated into hot mix asphalt (HMA) and laid using routine paving equipment and procedures.
In North America, the performance of rubberized mix asphalt has proved better than the regular
hot mix asphalt [49, 50].
Crumb Rubber Modifier (CRM) is composed of ground scrap tires, threads buffing and other waste
or excess rubber products. It can be processed either through ambient grinding, cryogenic grinding,
or a combination of the two. The type of processing has an impact on the performance of the paving
mixture. Incorporating CRM into asphalt concrete can be done either by the wet or dry process.
The wet process efficiently improves the property of the asphalt mixture. It produces a range of
rubber modified binders from a high viscosity type to no agitation type. So, we have a wet process
high viscosity which involves mixing, while the second type is also a wet process with no mixing
[48, 50].

23
Figure 2.5(a) Crumb rubber used in asphalt rubber in California [49].
Figure 2.5(b) Crumb rubber used in Ontario [49].
2.8.1 Wet Process-High Viscosity (Asphalt Rubber)
According to the ASTM the wet process or field-blended asphalt rubber is defined as ‘‘A blend of
asphalt binder, reclaimed tire rubber, and certain additives in which the rubber component is at
least 15 % by weight of the total blend and has reacted in the hot asphalt binder sufficiently to
cause swelling of the rubber particles’’ [51]. It has been successfully put to use in Arizona,
California and other states. The process involves incorporating the crumb rubber modifier (CRM)
directly into hot asphalt cement (between 205°C and 220°C), before it is mixed into the rubberised
Mix Asphalt (RMA), using a low shear system. After mixing, the CRM-AC blend is maintained
at 165-220°C for at least 45 minutes to one hour. Based on specific material requirement of the
pavement, other extenders, modifiers and/or high natural CRM may be added during this time.
This time duration enables the CRM to absorb a portion of the oils in the asphalt binder, causing
it to swell resulting in increased viscosity and stiffness of the asphalt binder. The resulting material
is a non-homogenous composite consisting of liquid asphalt and rubber solid particles. After the

24
material has attained stability, it is added to the Hot Mix Asphalt (HMA). In practice, high viscosity
type of asphalt rubber contains approximately 18-22 % crumb rubber, with particle size of 2.00
mm (sieve No. 10) to 2.36 mm (sieve No. 8). Typically the wet process or field blended asphalt
rubber is used in gap- or open-graded mixes and chip seal applications. Asphalt rubber has been
successfully put to use in Arizona, California and other states, and it has also found relevance in
Canada [50, 52, 53].
2.8.2 Wet Process - No Agitation (Terminal Blend)
Terminally blended rubber modified technology has been used since the mid-1980s in Florida and
Texas and later on in California, Colorado, Louisiana, Arizona and Nevada. Fine mesh of Crumb
Rubber Modifier (of particle size less than 600 µm, Sieve No. 30) is blended into the hot asphalt
cement at the refinery or the stationary asphalt terminal, and then conveyed to the hot mix
production plant as a finished product [49, 52]. Figure 2.6 shows a typical terminal blending unit.
Figure 2.6 Typical blending units for terminal blended projects [49].
The crumb rubber modifier is fully integrated into the asphalt, producing a homogenous material
similar to polymer modified asphalt, possessing excellent storage stability and very compatible
with finished binder formulation. Terminal blends can use as low as 5 % and as high as 25 %
rubber, depending on application and project requirements. However the no agitation type of
binder contains about 15 to 25 % crumb rubber modifier and does not require even distribution of
the crumb rubber in the binder. Terminal blends have their best performance in dense graded mix,
and could be used for open-graded and gap-graded mixes. They also find relevance in slurry seal
and tack coating applications [49, 52].

25
Figure 2.7 (a) Asphalt-rubber binder (b) Terminal blend binder [52].
2.8.3 Dry Process
Dry process asphalt rubber products are not popular in Canada or the USA. The CRM is added to
the aggregate and binder in dry form, taking up between 1-3 % of the mixture. It is assumed that
the CRM takes up an aggregate component of the mixture. CRM gradations in this case could
range from slightly larger than 50 mm in size to as small as 0.18 mm sieve size [49].
In Canada, the first trials for incorporating scrap tires into asphalt mixtures were between 1980
and 1995. The dry process mix was used and the results of the studies were as follows: performance
of the pavements was usually moderate to poor, worker safety with rubberised asphalt was well
understood and improved upon, and the rubberised asphalt pavement sections could be
successfully recycled [43, 49, 76]. The Ministry of Transportation and the Ministry of the
Environment also carried out performance tests using rubberised asphalt wet-process and dry-
process. Performance tests conducted include visual inspections, distress surveys, deflection and
frictional properties, and pavement profile measurements. The dry-process generally performed
worse than conventional Hot Mix Asphalt, while the wet process performed better than the dry
process and somewhat similar to conventional pavements [49, 76].
2.9 Warm Mix Asphalt Technology
The two conventional asphalt mixtures are hot mix asphalt (HMA) and cold mix asphalt. Over the
past few decades, the warm mix asphalt (WMA) technology has been introduced, and it has gained
significant utilization in the paving industry [49]. Basically, the gradation of the various mixes is
determined by their mixing and compaction temperatures. And so, HMA bears its name because
it is placed and compacted at elevated temperatures [54], it is also the most popular application of

26
asphalt concrete. HMA is mixed between 140-180oC (284-356oF), and compacted at 80-1600C
(175-320oF) [56]. Cold mix asphalts are generally environmentally friendly, however they
produce poor coating of aggregates and the presence of water in the mix reduces the effectiveness
of compaction. Also, a major disadvantage is a prolonged curing time for the cold mix, which
implies longer traffic hold-up after the pavement is laid. Consequently, cold mixes are not suitable
for high traffic volume routes [45, 55]. Figure 2.7 describes the application temperatures for the
various asphalt concrete mixtures.
Figure 2.8 Classification of application temperatures for asphalt concrete from cold to hot
[57].
2.9.1 History of Warm Mix Asphalt
In 1956, the foam asphalt technology was developed in the United States as a means of handling
hot asphalt mixtures at lower temperatures. The technology entailed injecting steam into hot
bitumen, the success of which earned it popularity around the world. Over the next decade, Mobil
Oil Australia improved upon the technology by injecting cold water, rather than steam into the hot
asphalt. This further made the process more practicable [56].
In 1994, research into the use of foamed asphalt bitumen with high binder content gave rise to the
cold mix asphalt technology. The major advantages of the cold mix asphalt technology was energy
efficiency due to less fuel consumption and an environmentally friendly process as there were

27
fewer gaseous emissions. However, a major drawback of the cold mix process was the poor long-
term performance compared to the hot mix asphalt. In 1999, Jenkins et al. introduced the half warm
(HW) mix asphalt technology, and their research involved heating selected aggregates above the
ambient temperature but below 1000C, then injecting foamed asphalt [58].
Warm mix asphalt technology originated from Europe and was reported by Harrison and
Christodulaki [56] at the First International Conference of Asphalt Pavements in Sydney. Koenders
et al. [59] gave a more detailed report at the Eurobitumen Congress in 2000. They considered field
trials using dense graded courses. Their work resulted in the WAM foam, warm asphalt mix with
foamed asphalt. At the Eurobitume congress in 2004, Barthel et al. [56] introduced the use of
synthetic zeolite to produce the warm mix asphalt. The zeolite produced a foaming effect which
improved the workability of the mix. Since 2000, warm mix asphalt technology has been tried in
several European countries (including Norway, United Kingdom and Netherlands), as a means of
handling asphalt mix at somewhat lower temperatures than conventional hot mix asphalt [59].
Initial laboratory and field investigation gave satisfactory results as production temperatures for
warm mix asphalt was within the range of 100-140°C, whereas for hot mix asphalt, it was between
150-170°C [55]. The lower handling temperature of the mix has several advantages: the short term
aging effect on the asphalt binder (due to elevated mixing temperatures) is significantly reduced,
cost effective operations as a result of less fuel consumption and more environmental friendly
practice owing to the reduced production of green-house gases. Additionally, engineering benefits
include better environmental working conditions due to less fumes and odour at plant and paving
site, less wear and tear of asphalt plants, better compaction of the road pavement, improved
logistics of hauling asphalt mix over longer distances to paving site, and extension of paving season
due to the possibility of paving at lower temperatures [60, 61].
The National Centre for Asphalt Technology reports that the use of WMA results in a 30 %
reduction in energy consumption and CO2 emissions. It is also reported that WMA technology
does not require major plant modifications to existing HMA plant system [55].

28
2.10 Warm Mix Additives Field Implementation
Various ingredients used in the warm mix asphalt preparation are patented products, and their
respective manufacturing processes are different. Three major categories include:
2.10.1 Organic Chemical Additives
These are typically paraffin-based organic compounds which melt at about 100°C. They
chemically change the viscosity-temperature behaviour of asphalt when mixed with asphalt binder.
Therefore the mix becomes easy to manipulate and compact (even as low as 90°C), attaining a
more uniform density of the pavement. Careful selection of the additive is necessary so that its
melting point is higher than the expected in-service temperature otherwise permanent deformation
can occur. Also this helps to minimize brittle behaviour of the asphalt at low temperatures [63,
64]. Certain chemical additives act as surfactants and can influence the microscopic interactions
between the aggregates and asphalt. At certain temperature range (typically between 140 and
85oC), they can reduce the frictional forces between aggregates and asphalt in mixture.
2.10.2 Inorganic Chemical Additives
Inorganic chemical additives are crystalline hydrated aluminium silicates, a common example is
synthetic zeolite. These additives can slowly release tiny bubbles of steam into the hot asphalt
cement. These steam bubbles dramatically reduce the bulk viscosity and thereby facilitate
compaction. Thus, it is possible to mix and compact at significantly reduced temperatures [52, 64].
2.10.3 Asphalt Foaming Systems
A more direct method of foaming involves injecting small controlled amounts of water into hot
asphalt. The water is turned to steam and produces a foaming effect which increases the effective
volume of the asphalt binder, reducing its viscosity. Therefore, the binder is able to effectively
coat the aggregate and compaction can be done at lower temperatures [45, 64]. The two phase

29
process involves pre-coating the aggregate with a soft-grade binder, then adding a foamed hard
asphalt which produces a warm mixture of improved workability. The indirect foaming technique
uses a mineral (usually from the zeolite family) as the source of foaming water. The hydrated
crystalline compound loses its water of crystallization at temperatures above 100oC, producing a
controlled foaming effect. Therefore, the mixing and compaction temperature can be reduced for
as long as a 6-7 hour period [52, 63].
2.11 Warm Mix Technology in North America
Warm mix asphalt technology was introduced from Europe in 2002, and since then the United
States has adopted it and become the leading proponent of the technology [65]. During the 2011
construction season, about 18.8% of all the asphalt paving mixtures used in the United States were
produced using warm mix asphalt technology. Across the United States, warm mix asphalt
demonstration projects have been successfully organised and fully adopted in at least a dozen
states, making up a third or more of the total asphalt production [45]. More than 40 State Highway
Agencies have developed and adopted warm mix asphalt specifications. In a bid to support the
development of proven innovations in reducing time taken to complete highway projects, the
Federal Highway Agency (FHWA) set up the ‘‘everyday counts’’ initiative in 2010 [66]. Three
years later, warm mix asphalt is considered by FHWA the most successful in its ‘everyday counts’
initiative. The success of warm mix asphalt has been attributed to a number of industrial
partnerships between the private and public sector working through the Asphalt Technical
Working group. Prominent members of the group include the Federal Highway Administration
(FHWA), American Association of State Highway and Transportation Officials (AASHTO), the
National Asphalt Pavement Association (NAPA), and several asphalt contractors and consultants.
They have learnt about the warm mix asphalt practice in other European countries and promoted
its efficient utilisation in the United States. NAPA has played a key role in the rapid adoption of
warm mix asphalt technology in the US [45, 54, 59]. Figure 2.8 shows an existing facility
converted to accommodate warm mix asphalt at a Florida plant.

30
Figure 2.9 Feeder (right) and an existing fibre addition line for Aspha-min® zeolite in Florida [55].
In the United States, several patented WMA technologies have been studied to understand their
effect in warm asphalt mixtures and rubber modified asphalt mixtures. Aspha-min powder is a
synthetic zeolite which releases its hydration bound water and creates foaming to asphalt binder,
generating a lubricating action that keeps the mix workable at temperature ranging between 130-
140°C [54]. MeadWestvaco Asphalt has developed a chemical additive and a ‘dispersed asphalt
technology’ delivery system called Evotherm. Field testing of Evotherm showed a 100°F reduction
in production temperatures which amounts to 55 % plant energy savings, 45 % reduction in CO2
and SO2 emissions, 60 % reduction in NOX, 41 % reduction in total organic materials, and benzene
soluble fractions below detectable limits [45]. AlzoNobel has developed and tested Rediset Warm
Mix solutions. This technology reduces surface tension between asphalt and aggregate surfaces of
the hot mix, ensures effective binder coating of the aggregates and effectively reduces mixing and
compaction temperature. Hamburg Wheel Track test results for resistance to moisture damage
indicate that Rediset Warm Mix improves the adhesion and cohesive strength of asphalt binder,
thereby increasing resistance to moisture damage [49, 62]. Sasobit, an organic wax (of melting
point of 100°C), when mixed with asphalt binder chemically changes the temperature-viscosity
behaviour of the binder. Therefore, enabling asphalt mixtures to remain workable at a lower
temperature of 90°C. In 2006, The University of Florida conducted study that showed that 1.5 %
of Sasobit did not adversely affect fracture performance of pavements. WMA has been
successfully used for rehabilitation of existing pavements in low temperature conditions; Sasobit
was used for filling deep patches in Frankfurt Airport [45, 54]. Xiao et al. [67] evaluated the

31
rutting resistance in warm mix asphalts containing moist aggregates. Test results indicated that
aggregate source significantly affects the rutting resistance regardless of warm mix additive used.
Comparing several warm mix additives in the test mixtures, Sasobit had the best rutting resistance
while Aspha-min and Evotherm showed similar rut resistance to that of the control.
In Canada, warm mix asphalt technology is being studied and developed. The Ministry of
Transportation Ontario (MTO), along with its partners is leading the research and implementation
through the warm mix asphalt initiative. Since 2008, MTO has conducted over 25 trial contracts
with a combined total volume exceeding 300,000 tonnes, with the objective of understanding the
environmental and engineering benefits of WMA in Ontario. A major component of the contract
was emission and temperature measurements during production and paving of WMA. Also,
asphalt binder tests were carried out to assess WMA pavement performance. In 2011, MTO
specified the use of WMA in 10 % of all the paving contracts awarded and a relative cost evaluation
of WMA and conventional HMA pavements was conducted. Paving contracts in the central region
showed that the WMA binder course was approximately 24 % less than conventional HMA while
the cost of the WMA surface course was approximately 9 % higher than conventional HMA
contracts. This reflected overall neutrality between WMA and HMA based on the relative
quantities of binder and surface course. However, MTO expects a steady decline in the WMA
contract costs, by taking full advantage of the financial benefit of reduced energy consumption in
the production of WMA. In 2010, MTO carried out comparative studies between WMA and
conventional HMA paving operations. Results indicated that dust was reduced by 30 % behind the
paver and 85 % at the location of the paver operator. The benzene soluble fraction was reduced by
63 % behind the paver and 72 % at the location of the paver operator. Measured opacity values
were reduced by a third. Thus, WMA ensures better working conditions for paving crew, and
provides particular benefit to the public while paving in densely populated areas. MTO also
recognises several other benefits of WMA technology, which includes reduced fuel consumption
and gaseous emissions at the asphalt plant, and the potential for long term pavement performance.
Due to the peculiar adverse temperature conditions in Canada, WMA has gained particular interest
in the industry because it improves resistance of the pavement to thermal cracking, the paving
season can be extended, improves compaction and joint quality and asphalt mix can now be hauled
for longer distances.

32
WMA can be used with Recycled Asphalt Pavement (RAP), recycled asphalt shingles, and other
reused materials. WMA facilitates a higher rate of asphalt recycling than conventional HMA due
to its higher workability, by allowing coating and compaction of RAP materials at lower
temperature. Therefore, WMA pavements are considered the most sustainable paving option [68,
69].
In a bid to encourage the use of recycled crumb rubber modifier (CRM) in asphalt pavement, The
Ministry of Transportation Ontario, and the Ontario Tire Stewardship (OTS) have constructed
several trial pavement sections using either field blend asphalt rubber or terminal blend wet process
[70].
2.12 Compatibility of Warm Mix Asphalt
Many benefits of applying crumb rubber modified (CRM) binders into asphalt pavements have
been identified. Amongst these benefits are; reduced thickness of asphalt overlays, decreased
traffic noise and maintenance costs, increased resistance to rutting and cracking and improved long
term performance of the pavements. Also, the fact that CRM binders is a viable means of recycling
waste tires which will otherwise occupy landfills has given it considerable attention. However,
incorporating rubber into asphalt results in higher viscosity of the binder and increases the mixing
and compaction temperature as compared to conventional binders. Therefore, the warm mix
asphalt technology which allows for lower mixing and compaction temperatures has been
identified as a way to address the problems associated with handling rubberised asphalt [45, 65].
Hainan et al. [72] considered the high temperature rutting resistance of CRM binders. Their study
revealed that the rutting resistance depends on the concentration of CRM and test temperatures.
They established that WMA can generally improve CRM binders’ resistance to rutting.
In the United States there has been a debate among stake holders as to the adoption of warm mix
asphalt technology purely for its benefits of lowered emissions and reduced fuel costs [44].
Environmental regulations and the relatively clean nature of HMA make it suitable over WMA
except in specific air pollution areas like Los Angeles. Also, the relatively high cost of WMA
technology considerably offsets the cost savings of energy. It is largely acknowledged that the
reduced viscosity using WMA gives it a strong business case, as this can curb the compaction

33
problems associated with cold weather paving, and improve the efficiency of handing stiff
mixtures [45].
2.13 Moisture Susceptibility
Moisture susceptibility is the tendency of asphalt mixture towards stripping [71]. Stripping is
breaking the adhesive bond between the aggregate surface and the asphalt cement. This occurs
when water gets between the asphalt film and the aggregate surface, replacing asphalt as the
aggregate coating. The asphalt film is then removed by water or water vapour. Stripping has been
identified as a major cause of asphalt distress and has gained the interest of pavement engineers.
Stripping normally starts at an interlayer of the pavement structure rather than the surface. Flushing
or bleeding on the wheel path may be an indication of stripping, coring of these areas is the only
way to determine stripping. Usually stripping can be detected by visual inspection of the cores [17,
22].
2.14 Mechanism of Stripping
2.14.1 Physical-Chemical Reaction
Stripping can be initiated in the base (binder) course, when free water or water vapour infiltrates
(or saturates) the air voids in the asphalt concrete. A steady rise in temperature and pressure can
cause the moisture trapped within the air voids of the concrete to expand. Factors that contribute
to the rise in pore pressure include: cyclic wheel traffic loads; thermal expansion-contraction due
to climate change; freeze-thaw and thermal shock. Void pressure imposes thermal stresses which
can exceed the adhesive (bond) strength of the binder-aggregate surface, and then stripping may
occur. A typical result of this loss of strength in the interlayer is the development of rutting or
shoving in the wheel path [73]. Usually, free water exists from improper drainage or where
drainage is not provided such as high ground water table or pavements built in trench sections. In
some cases, especially in overlays, water can be trapped in the pavement during construction [30].
Therefore pavements with high air voids (usually above 8 %), possess passages that allow the
movement of water and water vapour, and are more likely to strip, especially if functional drainage
is not provided [30].

34
The chemical nature of aggregates can contribute to the resistance to stripping. Positively charged
(basic) aggregate surfaces have better adhesion than negatively charged (acidic) surfaces, and so
aggregates with silica content are more prone to stripping than carbonate aggregates [73]. During
crushing operations, the orientation of the surface molecules is distributed and may reduce the
stripping resistance of the freshly crushed aggregates. Therefore, stock piling the crushed
aggregates for a week allows the surface molecules to reorient and improve the stripping resistance
[73].
2.14.2 Surface Coatings
Asphalt cement does not easily adhere to aggregate particles that are coated with a film of dust.
Also, in the presence of water the aggregates strip readily because the dust creates pinholes in the
asphalt film, allowing water to reach the aggregate. The use of clean dry aggregates is fundamental
to satisfactory pavement performance. Therefore, aggregates should be washed and heated to
temperatures in excess of 212°F, to properly remove the moisture before mixing. Paving should
not be done during rain, or when the surface is damp from dew or previous rain [73, 74].
2.14.3 Surface Texture
Smooth textured aggregates reduce the adhesion between the asphalt binder and aggregates.
Crushing of aggregates should be appropriately carried out to produce aggregates with more
texture [31].
2.14.4 Emulsification
Emulsification occurs when asphalt cements reacts with free water to form an emulsion. Clays
from dirty aggregates, combined with water, pavement heat and traffic pressure can also emulsify
the asphalt. Chemical incompatibility of some anti-strip agents can contribute to stripping. They
act as emulsifiers especially when added in excess [31].
35
2.15 Techniques for Limiting Moisture Susceptibility
Pavements that are susceptible to moisture damage can suffer from distresses which can impact on
performance and increase maintenance costs. To curb this problem, various commercial liquid or
solid anti-strip additives have been developed, which enhance adhesion between aggregates and
asphalt binder.
2.15.1 Liquid Anti-Strip Agents
Liquid anti-strip additives are surface-active agents; they are amine based chemical compounds
that reduce the surface tension between asphalt and aggregates in a mixture. When surface tension
is reduced, adhesion between the asphalt binder and aggregates is significantly improved [34].
Previous studies suggest that anti-strip agents should be heat stable, and could be added to the
asphalt binder before mixing [30, 74].
2.15.2 Lime Additives
Lime additives have been considered as a means of reducing moisture susceptibility of asphalt
mixtures. They could be in the form of hydrated lime (Ca(OH)2), quick lime (CaO), and dolomitic
limes [30]. Usually 1-1.5 % lime by dry weight of aggregate is added to the mix, more quantities
are required when more fines are present in the aggregates, due to the relatively large surface area.
Chemical additives, like hydrated lime, reduce the apparent acidity of the aggregate, thereby
enhancing the chemical interaction between the asphalt and aggregate and prevent stripping [74].
2.15.3 Aggregate Pre-Treatment
Pre-treatment methods can be employed to improve the adhesion of asphalt binder to the aggregate.
Examples of pre-treatment include: preheating to evaporate moisture, weathering, washing to
remove surface coating and crushing [73].

36
2.16 Test Methods for Moisture Susceptibility
Since the 1920s, several tests have been developed to determine moisture damage in asphalt
mixtures. There were tests carried out on loose mixtures and then other tests were done on
compacted mixtures. The first tests conducted on loose mixtures were the static immersion tests
and the boil tests. This was followed by the immersion-compression (AASHTO T165) test which
was carried out on compacted specimens, and was adopted as an ASTM standard. Research work
by Lottman [75] brought about simulating the effects of repeated water pressure on the behavior
of saturated asphalt mixtures. The Lottman test, AASHTO T 283, has widely gained recognition
in the paving industry. Tunnicliff and Root developed a test procedure that takes remarkably less
time to perform. Subsequently, wheel tracking of asphalt mixtures submerged under water gained
popularity in the industry. As a result, the Hamburg wheel-tracking device and the asphalt
pavement analyser have been developed in this category [74, 75].
The SHRP’s Superpave system adopts the AASHTO T 283-03 entitled: ‘‘Resistance of Compacted
Bituminous Mixtures to Moisture Induced Damage’’ [75], as the test procedure for determining
resistance to moisture damage. However, reports within the industry suggest inconsistencies with
laboratory results and field performance. It remains a challenge to asphalt pavement technologies
to develop reliable and practical test procedure for determining moisture damage. An important
consideration in the development and acceptance of a test procedure for moisture damage should
be calibration of the test to the conditions for which it would be applied. Few tests have been
calibrated over a wide spectrum of test conditions. This is as a result of lack of good field
performance databases, and the difficulty of executing the tests [75].
Modification in moisture sensitivity test methods is aimed at enabling proper simulation of
environmental/traffic factors in regards to moisture damage. Qualitative tests help to subjectively
evaluate the stripping potential and they include boiling water test, freeze-thaw pedestal test, quick
bottle test, and rolling bottle method. Quantitative tests provide a value for a specific parameter
such as strength before and after conditioning. These tests include immersion compression test,
indirect tensile test, resilient modulus test, Marshall immersion test and double punch method.

37
2.17 Moisture Conditioning
Moisture conditioning is an integral component of evaluating moisture damage. To determine the
effect of moisture conditioning, research methods compare various properties of mixtures before
and after moisture conditioning. The properties prior to conditioning are usually referred to as
‘‘dry’’ or ”unconditioned’’ while the properties after moisture conditioning are termed ”wet’’ or
”conditioned’’. In the most commonly used AASHTO T-283-03 test method, compacted HMA
samples of air voids between 6.5-7.5 % are used. One half of the samples are saturated to between
70 to 80 %, then subjected to freeze thaw cycles consisting of freezing at 0°F for 16 hours followed
by 24 hours thawing at 140°F and 2 hours at 77°F. However, modifications in test procedures
shows freezing at 0°F for 16 hours as an optional step. Therefore, it is necessary to identify the
exact procedure that was followed while conducting research [73, 74, 75].
2.18 Test Methods
2.18.1 Indirect Tensile Tests
Thermal cracking is the prevailing failure mode of pavement across the Sub-Artic regions
(including Northern United States and Canada). Thermal cracking is caused by pavement
shrinkage resulting from a build-up of stresses during low- temperature conditions. The Strategic
Highway Research Program (SHRP) developed the indirect tensile test (IDT) creep and strength
test, to characterize the resistance of hot mix asphalt mixtures to low-temperature cracking [78,
79]. This method has been standardised with the AASHTO T322, Standard Method of Test for
Determining the Creep Compliance and Strength of Hot Mix Asphalt. Using the indirect test
device, performance parameters like tensile creep compliance, tensile strength and Poisson’s ratio
can be determined [78].
Test mixtures are compacted to designated air voids and produced into cylindrically shaped core
specimens of diameter 150 ± 9 mm and height 38 to 50 mm (typically). The specimen is loaded
(at the desired temperature) in compression across its diametric axis (Figure 2.8), producing
tension in opposite directions perpendicular to and beginning at the line of loading [79].

38
Figure 2.10 Specimen loading in indirect tension testing device [80].
During loading, specimen deformation can be measured on the parallel faces using strain gauge
type extensometers, which can be calibrated for horizontal and vertical displacement ranges. Test
temperatures could range from -30°C to +100°C. Creep compliance is defined as the time-
dependent strain per unit stress, while tensile strength literally means the HMA strength when
subjected to tension.
Tensile creep compliance testing is non-destructive; the loading is controlled and does not exceed
the upper linear elastic boundary of hot mix asphalt (typically 500 microstrain). Therefore the same
specimen can be tested at several temperatures. However, the load must be substantial to cause
sufficient horizontal deformation, giving good resolution of data. Tensile strength testing is a
destructive test; the loading is sustained until tensile failure occurs, rendering the specimen
unusable.
Based on the viscoelastic nature of hot asphalt mixtures, the creep compliance and the tensile
strength are not only dependent on the HMA constituents properties or proportion, and mix
properties (e.g., % air voids), but are also temperature dependent. Additionally, creep compliance
is dependent on the load/unload duration and tensile strength is dependent on loading rate. Figure
2.11 shows the IDT test equipment set up.

39
Figure 2.11 IDT Test equipment set up [79].
In 2004, the National Cooperative highway Research Program NHCRP Report 530 reviewed the
IDT for determining creep compliance and tensile strength, in order to reduce its variability and
improve the precision and reliability of results. Some of the improvement measures include:
maximum load of axial loading device increased from 98 to 100 kN; load measuring device
increased from 98 to 100 kN; high sensitivity of extensometers as the minimum loading is reduced
from 0.25 to 0.1 mm; and wide temperature range of measurement -30 to 10°C [81]. Also, in tensile
strength tests, the mode of determining maximum failure stress (or peak load) has been revised.
During testing, the ‘first failure’ (which is obtained by analysing the deformations on each side of
the specimen), has been disregarded as the peak load. This is partially due to reported damage of
the expensive deformation measuring device, while carrying out strength tests. The tensile strength
is calculated based on the maximum load obtained and the specimen’s dimensions [79].

40
2.18.2 Moisture Induced Sensitivity test MiSTTM
In the past few years researchers from InstroTek Inc. of the USA have done research to develop
test methods, to improve the duration and consistency of determining moisture susceptibility of
asphalt mixtures. In 2012, the InstroTek MiST was introduced as an accelerated conditioning
device to determine the resistance of asphalt mixture to moisture damage.
Figure 2.12 Moisture Induced Sensitivity Tester (MiST InstroTek) [77]
The test method incorporates all the factors necessary to cause stripping: high air voids, presence
of water, high stress, and high temperature. The tests can be conducted at relatively higher
temperatures and pore pressure within compacted samples can be imposed. Therefore, the effects
of a mixture subjected to cyclic load (such as with traffic), at normal temperature conditions can
be established. InstroTek describes the MiST as a robust instrument which can produce stresses
and pore pressures within asphalt mixture at elevated temperatures to accelerate stripping
mechanisms such as displacement, detachment and emulsification. Their criteria for determining
good resistance to stripping include:

41
Density percent difference (or percentage swell) before and after conditioning. The change
in density before and after conditioning must not exceed 1.5 %.
The tensile strength ratio (TSR) of conditioned or ‘wet’ samples to the unconditioned or
‘dry’ samples must be 80 % or higher.
Visual inspection must be carried out to indicate medium to severe stripping of aggregates
[77].
The indirect tensile strength test is a destructive test that measures change in tensile strength
resulting from effects of saturation and moisture conditioning. For the destructive strength tests,
the unconditioned and the conditioned properties are measured in two different sets of samples
having similar air voids. The results are used to predict stripping behaviour of asphalt mixtures,
and to evaluate the effects of anti-strip additives.
Tensile strength ratios (TSR) of dry and wet samples were used to quantitatively measure stripping
potential of hot asphalt mixtures. The TSR was a better indicator than the indirect tensile test
because the latter was not consistent for all mix types. Limiting tensile strength ratio (TSR) values
of 0.7 and 0.8 were used simultaneously for comparison. It was concluded that indirect tensile test
did not satisfactorily differentiate stripping and non-stripping aggregate combinations [75].

42
CHAPTER 3
MATERIALS AND EXPERIMENTAL PROCEDURES
3.1 Materials
Roofing asphalt flux with a PG 51-34 Superpave performance grade was obtained from Coco
Asphalt Engineering and had originally been produced at the Imperial Oil refinery in Nanticoke,
Ontario. Coarse aggregate #1 (HL 1 stone), fine aggregate 1 (washed screenings), fine aggregate
2 (unwashed screenings), and bag house fines were obtained from the Ministry of Transportation
of Ontario.
Highway 655-1 pavement trial from Timmons Ontario comprised: asphalt binder PG 52-34 from
McAsphalt, Ontario, 0.5 % PPA by weight of binder, Coarse aggregate #1 (12.5mm) from
Driftwood Quarry, fine aggregate #1 (screened sand) from Fredrickhouse Plant 1, fine aggregate
#2 (crusher screenings) from Driftwood Quarry.
Highway 427-4 pavement trial from northern Ontario comprised: asphalt binder PG 70-28 from
Canadian Asphalt, 3.0 % SBS polymer by weight of binder, Georgian #1 19MM stone, Georgian
#2 HL3 stone, fine aggregate #1 (puslinch aggregates), fine aggregates #2 1/4inch chip Dufferin.
3.2 Additives
Crumb Rubber Modifier (CRM) was obtained from Liberty Tire Recycling of Brantford, Ontario.
The CRM particle size passed the 30 mesh screen and contained 100 % passenger car tire.
Warm mix additives used in this study were waxes, amine-based surfactants and chemical
additives of proprietary composition. The additives used included;
Evotherm as obtained from McAsphalt Company;
Sonnewarm as obtained from Sonneborn Incorporated;
Rediset LQ 1102 as obtained from Akzo Nobel Surface Chemistry;
Rediset LQ 1106 as obtained from Akzo Nobel Surface Chemistry;
Rediset WMX as obtained from Akzo Nobel Surface Chemistry; and
Sasobit as obtained from Sasol Chemicals North America.

43
3.3 Moisture Induced Sensitivity Testing (MiST)
With the emergence of technologies such as warm mix asphalt which enable production at lower
temperatures, there has been increased awareness of moisture retention in the aggregate and
asphalt mixture. This has led to a modification of the test methods that were historically used for
investigating moisture susceptibility. One of the crucial factors in the development of test methods
for moisture sensitivity of asphalt pavements is the requirement for rapid and sensitive methods
which also give reproducible results [82]. Initial test methods take days to complete, and are not
conducive to a production and quality control environment. Also, currently utilised accelerated
moisture susceptibility methods require over 32 hours of conditioning [82]. The Moisture Induced
Sensitivity Test (MiST) device is designed to be a totally new, quick and logical method for testing
moisture damage susceptibility of asphalt mixes. Essentially, the test is designed to simulate
moisture damage that occurs in hot mix asphalt layers due to water, repeated traffic loading and
elevated in place temperatures [77].
A significant inclusion in the MiST accelerated conditioning system is the concept of pore pressure
applied by water at elevated temperatures. When tire rolls over a wet pavement, the water caught
between the tire and pavement is subjected to high pressures. This forces the water into the
accessible pores. The resulting pressure is reduced as soon as soon as the tire rolls away from the
region allowing the water to drain from the pores back to the surface of the asphalt pavement. The
MiST device replicates this dynamics of scouring and pore pressure by cyclically applying and
removing high pressure from unsaturated compacted samples of hot mix asphalt [77].
Typically, the MiST device is a stand-alone unit, consisting of four basic components: the
hydraulic pump system; the pressure transfer system; the sample tank; and the control electronic
module [77]. The hydraulic system is capable of using standard automatic transmission fluid, and
incorporates a 5 gallon reservoir. The pump is driven by a 1 HP 115 VAC single phase motor and
delivers up to 300 psi. The pressure transfer system consists of a double acting hydraulic cylinder
coupled to a pneumatic cylinder each with a 6 inch stroke. A solenoid valve determines the
direction of flow for the hydraulic fluid and whether the hydraulic piston is extending or retracting.

44
The output of the pneumatic cylinder is coupled to a bladder inside the sample tank and is the
pressure transfer system. The sample is placed into a cylinder to keep the sample from moving
during testing. An O-ring in the top rim of the tank produces a seal once the lid is bolted on. The
tank is filled with water and the lid attached. The water level is topped off using a ball valve on
the top of the lid. The system incorporates a heater which can raise the water temperature up to
60°C. Electronics and software are designed to control the system and allow the user to select the
temperature, the pressure and the number of cycles the process will take [77, 83]. Figure 3.1 shows
a schematic diagram of the MIST conditioning set-up.
Figure 3.1 Schematic diagram of the MiST conditioning device [82].
3.3.1 Sample Preparation, Conditioning and Test Methods
In this study the MiST test was used to examine moisture susceptibility of hot mix asphalt
containing commercially available warm mix additives. Hot mix asphalt concrete briquettes were
prepared in the laboratory according to standard procedures using a Pine Instruments gyratory
compactor. The various aggregate types were placed in the oven at 165oC for 24 hours to ensure
they were completely dry prior to mixing with the asphalt cement. Specific quantities of the various
aggregates were measured using the mix design. Roofing Asphalt Flux (RAF) PG 51- 34 in both
modified and unmodified forms was used to prepare hot asphalt mixtures. Modification was

45
achieved by heating the asphalt binder and adding 0.5 % each of Warm Mix Additives by weight
of the binder. Additives used included Rediset WMX, Rediset LQ 1102, Rediset LQ 1106,
Evotherm, and Sonnewarm. The measured quantities of the aggregates and asphalt were put in the
oven for 2 hours. Also, all mixing tools such as mixing bowls, spatulas, boring rods, and paddles
were kept in the oven to enhance workability of the process.
3.3.2 Mixing
A bucket mixer as in Figure 3.2 was used for mixing. The hot mixing bowl was kept on a scale
and the scale was tarred to zero. Required amount of asphalt for the batch mixture weight was
poured into the bowl, and the bowl was placed into the bucket mixer. The mixing rotor was turned
on and various aggregate types were added into the bucket mixer while paddling until the thorough
coating of the aggregate was attained. A paper disk was placed on the bottom plate of molds, the
mold was placed on a scale and tarred to zero. The required weight of hot mix asphalt was placed
into the molds. The molds were rammed around using a rubber mallet and a boring rod was used
to penetrate the mix several times for proper compaction. Another paper disk was placed on top of
the hot mix, and then the mold was put in the oven at 150°C for 2 hours.
Figure 3.2 Bucket mixer.

46
3.3.3 Compaction
All cores were compacted using the Pine Instruments AFG 2 Superpave gyratory compactor as
shown in Figure 3.3. The compaction was done according to AASHTO T 312 [85], where
compaction pressure, compaction angle and speed of gyration were set to the required values.
Having proposed a specimen height of 177 mm, the compaction mode was set to ‘compact to
height’ and 177 mm height was set.
Figure 3.3 Pine Instruments AFG 2 SuperpaveTM gyratory compactor.
The molds were removed from the oven and allowed to cool to 135oC before compaction. It took
between 7 and 15 gyrations to reach the desired compaction height. After compaction, the molds
were allowed to cool to 80°C, so the sample could be extruded with the aid of the gyratory ram.
The specimen was labelled and allowed to cool to room temperature in preparation for cutting.

47
3.3.4 Cutting
A total of 36 test specimens were prepared from eighteen compacted (191mm) briquettes. Two
core specimens of dimensions 50 mm thickness and 150 mm diameter were cut from each briquette
using a tile saw blade as shown in Figure 3.4.
Figure 3.4 Struers automated tile saw blade for cutting specimens.
Immediately after cutting, specimens were tested for their bulk specific gravity in order to establish
the percent air voids. They were then labelled as follows: DAN RAF 1-6 representing the control
samples with no warm mix additives in the binder; DANRAF RED WMX 1-6 representing asphalt
concrete samples made with Rediset WMX modified asphalt concrete; DANRAF RED LQ 1102
1-6 representing asphalt concrete samples modified with Rediset LQ 1102; DANRAF RED LQ
1106 1-6 representing asphalt concrete samples modified with Rediset LQ 1106; DANRAF EVO
1-6 representing asphalt concrete samples modified with Evotherm; and DANRAF SON 1-6
representing asphalt concrete samples modified with Sonnewarm.

48
3.3.5 Percent Air voids and Bulk Specific Gravity (BSG) Determination
In order to obtain the percent air voids of the specimen, AASHTO T 166-07 [86] methodology
was used. The test first determines the Bulk Specific Gravity (BSG) of each specimen by
calculating the percentage of water that is being absorbed when totally submerged in water. The
BSG was determined by the weight in water, surface dry weight and the dry weights of the
specimen. The weight in water was done by immersing the specimen in a water bath while it is
suspended beneath a balance. The surface dry weight was determined by blotting (or patting) the
specimen with a damp towel and weighed on a top loading scale. The specimen was allowed to air
dry for at least 24 hours, flipping several times to ensure they were properly dried.
A= dry weight of sample
B= sample weight in water
C= surface dry weight of sample
% of Water Absorbed = C−A
C−B × 100
Since the percentage of water absorbed was less than 2%, the BSG was calculated using the
equation:
BSG = A
C−B
The percent air voids of the specimen was calculated using the BSG and the theoretical Maximum
Relative Density (MRD) obtained from AASHTO T-209 as follows:
D = theoretical maximum specific gravity
E = bulk specific gravity
Percent air voids = D−E
D × 100

49
According to AASTO T283-03 [87], high air voids of 7 % ± 1 %, are required for test samples in
determining the resistance to moisture damage. The air voids of all samples prepared in this work
were between 6 and 7 %.
3.3.6 Sample Conditioning
Moisture conditioning was carried out according to AASHTO T 283 [87]. A total of 36 specimens
included a set of 6 unmodified asphalt concrete control specimens, and five sets of the different
warm mix asphalt comprising 6 samples each. Each set of specimens was divided into two subsets
of similar air voids. One subset was subjected to dry testing, i.e. dry conditioning before the
indirect tensile test. While the other subset was subjected to wet testing, i.e. conditioned in the
MIST device before they were subjected to indirect tensile test.
In the dry testing, the specimens were placed in water tight Zip-lock bags and conditioned in a
water bath at 25°C for 2 hours and then taken for tensile strength tests. Figure 3.5 shows the dry
conditioning set-up.
Figure 3.5 Dry conditioning in Zip-lock bags.

50
In the wet testing, three specimens were placed at a time in the MiST specimen conditioning
chamber as seen in Figure 3.6 below.
.
Figure 3.6 MiST conditioning system.
Default pressure settings of 40 psi and 3500 test cycles were used. The test temperature was set at
40°C, based on the PG 51-34 grade of the RAF binder used for sample preparation. The MiST
conditioning process involved the heating stage, dwell time, and the pressure cycling stage.
Lukewarm water was used to fill the sample chamber so as to shorten the heating stage of the test.
The dwell time allowed for the test was 1 hour, i.e. the sample was allowed to remain at the test
temperature before the pressure cycling commenced. In the pressure cycling stage the sample
chamber (and ultimately the sample air voids), was pressurised and depressurised at 40 psi every
cycle. A total of 3500 pressure cycles was achieved in 3 hours.
51
After the pressure cycling stage, the specimens were conditioned by placing directly into a water
bath at 25°C for 2 hours. Thereafter, the post BSG was determined using AASHTO T 166. The
initial dry weight of the specimens was used for this calculation
3.3.7 Indirect Tensile Test (IDT)
The indirect tensile test was used to measure the change in tensile strength resulting from the
effects of accelerated water conditioning of the test specimen. Indirect tensile strength was
performed at 25°C according to the procedure in AASHTO T 322 [78]. IDT strength is evaluated
using the peak load at failure and the dimensions of the sample using the following relationship:
St = 2 × 𝑃 × 1000
𝜋 × 𝑡 × 𝐷
Where;
St = indirect tensile strength, Pa;
P = peak load, kN;
D = diameter of specimen core, mm; and
t = thickness of specimen core, mm [78].
The results were used to predict the asphalt mixture’s susceptibility to stripping and to examine
the effect of different warm mix additives used in the study. The numerical indices of relative
indirect tensile properties was obtained by comparing the average tensile strength of the dry
conditioned specimens with that of the wet MIST conditioned specimens. Relative strength
properties were expressed as tensile strength ratios (TSR), which was calculated as follows;
TSR = 𝑇2
𝑇1
Where;
T1 = average strength of dry subset; and
T2 = average strength of MIST conditioned subset.

52
3.3.8 Visual Inspection
According to AASHTO T 283, the degree of stripping due to conditioning can be determined from
visual inspection of the failed dry and wet test specimens. The degree of stripping can be seen in
Table 3.1 as follows;
Table 3.1 Visual condition definitions [87].
Stripping definition Specimen condition
None Solid specimen with no evidence of asphalt binder withdrawing from
aggregate. Specimen appears black after air-drying.
Slight Solid to slightly soft specimen with evidence of asphalt binder
beginning to withdraw from surface of the aggregates. Specimen
appears black after air drying.
Moderate Specimen is soft easily broken in half with partially exposed
aggregates. Specimen appears slightly grey after air- drying.
Severe Specimen is soft and falls apart, majority of coarse aggregate exposed
with little or no binder. Specimen appears grey after air drying.
Figure 3.7 shows examples of results from visual inspection of specimens used in this study. Figure
3.7a shows typical ‘moderate’ stripping as it shows partially exposed aggregates and slightly grey
after drying. Figure 3.7b show ‘slight’ stripping after conditioning with less amount of exposed
aggregates and a relatively dark specimen after drying.

53
(a) Moderate stripping. (b) Slight stripping.
Figure 3.7 (a) (b) Results from visual inspection of failed wet conditioned specimen.
3.4 Uniaxial Cyclic Compression Test with Partial Confinement (UCCTC)
The mechanisms for permanent deformation include densification and shear deformation, which
are brought about by repeated traffic loads. Permanent deformation can emerge at the pavement
surface as rutting [88]. Research has shown that flexible pavements undergo significant levels of
rutting. Major factors responsible for rutting in the pavement structure are: high temperatures;
overstressed underlying base or sub-base layers due to poor thickness design for stipulated traffic
loads; and weakening of the base or sub-grade due to moisture infiltration. Due to the viscoelastic
nature of asphalt mixtures, their performance depends on temperature and frequency of loading.
Also, air void content and the degree of compaction also impacts on performance [24]. Dolzycki
and Judycki [90] reported that both cohesion and internal friction of mineral aggregate determine
the response of asphalt mix to external load. They considered the prediction of asphalt mix
behaviour and evaluation of mix quality based on results of cyclic compression creep tests with
lateral confinement fully reliable.
Stress patterns on asphalt surface pavement layer include vertical compressive stress due to wheel
loading and horizontal compressive stress created by the response of surrounding medium to
external loading. The horizontal stress confines the asphalt material and hinders its lateral
movement. Thus, internal friction is created within the aggregates. The mobilization of the
aggregate internal friction enhances the resistance of the mix to permanent deformation. In tests
without lateral confinement, lateral movement of material is limited to asphalt binder cohesion
while aggregate internal friction is not fully mobilized. Therefore, tests without lateral confinement

54
are not believed to provide realistic results, as they overestimate the role of asphalt binders in mix
resistance to permanent deformation at high temperature.
Essentially, an impulse creep curve shows three main phases as depicted in Figure 3.8. The first
phase represents strong initial deformation with strain rate and creep rate decreasing with load
cycles. The second phase shows an inflection point where the strain rate and creep rate are
approximately constant. Finally, the third phase is a region of exponentially increasing
deformation with continued loading. The second phase of the pulse creep curve is most important
in evaluating the deformation behaviour of asphalt mix. Usually mixtures which exhibit high
deformation resistance do not have the third phase. The strain rate at the turning point is the most
critical parameter for evaluating the deformation behaviour of asphalt mixtures. The higher this
strain rate, the lower the deformation resistance of the specimen. The deformation can also be
evaluated using the penetration depth (in mm) as a function of the number of cycles [24, 91].
Figure 3.8 Impulse creep curve showing tangent at turning point [91].
Uniaxial Cyclic Compression Test with partial Confinement (UCCTC) [90], is a dependable and
quick laboratory procedure to evaluate the permanent deformation behaviour and creep properties
of compacted asphalt concrete mixtures. This test was developed under the German technical
regulations for testing asphalt for road construction, and it essentially measures the resistance of
asphalt concrete mixtures to deformation. In relation to the asphalt pavement, permanent

55
deformation occurs along wheel tracks and predominantly at high temperatures. The UCCTC
assesses the rutting resistance of asphalt mixtures using the strain rate at the inflection point and/or
dynamic penetration depth measured as a function of load cycles. A high strain rate at inflection
implies low rutting resistance while dynamic penetration measures the extent of deformation under
a specified number of load cycles [24].
Figure 3.9 Uniaxial Cyclic Compression Test with Partial Confinement (UCCTC) [91].
3.4.1 Specimen Preparation for Dynamic Creep Test
Most of the rubberised asphalt projects conducted in the United States and Canada use the wet
process; which involves adding the crumb rubber to the asphalt binder before mixing with
aggregate [52]. This study utilised the wet process to incorporate crumb rubber into asphalt binder.
Crumb rubber was used to modify asphalt via the wet process, producing terminal blend and
asphalt rubber binders. Terminal blend was produced at the terminal, and it utilised RAF and 18%
fine mesh of crumb rubber, by weight of the binder (as practised in Arizona and Texas) [51]. It
was heated at 300oC for 60 minutes, then using a mechanical mixer it was subjected to high
shearing at 220oC for 15 minutes to ensure that the rubber is fully integrated into the binder. Also,
part of the terminal blend binder was set aside as a control while five different warm mix additives
were added to the other part. These additives include: Evotherm, Sonnewarm, Sasobit, Rediset LQ
and Rediset WMX. A batch was made with 1 % additive by weight of the binder while the other
was made by 0.5 % additive by weight of the binder.

56
Asphalt rubber was produced using RAF and 18 % crumb rubber modifier by weight of the binder.
It was heated to between 180-200°C, and then subjected to low shearing. The asphalt rubber binder
gave a highly viscous non-homogenous composite material. The five different warm mix additives
were also added to the asphalt rubber at 0.5 % by weight of the binder.
Both rubberised binders were used to produce hot mix asphalt test specimen using the Pine
Gyratory Compactor as described previously. The terminal blend (TB) asphalt rubber was used to
prepare dense graded hot mix specimens while the asphalt rubber (AR) binder was used to prepare
stone mastic rubberised asphalt concrete. Polymer modified pavement trial sections for Highway
655-1 in Timmons Ontario and 427-4 in nothern Ontario were compacted to produce dense graded
and stone mastic asphalt mixtures respectively, using their respective mix designs.
3.4.2 Dynamic Creep Test Procedure
The compacted dense graded briquettes were labelled: 655-1; TB 26 which corresponds to mixes
containing 1.0 % WMA; and TB 27 for mixes containing 0.5 % WMA. Compacted stone mastic
briquettes were labelled 427-4 and AR 28 containing 0.5 % WMA. Three specimens of 38 mm
thickness and 150 mm diameter were cut from each compacted cylinder using the Struers
automated saw. Test specimens cut from the first briquette were labelled 1 through 3, specimens
from the second briquette labelled 4 to 9, and so on. In total, the labelled samples included: TB
26, 27 and AR 28, which was the control containing only CRM binders; TB 2* EVO and AR 28
EVO, representing samples containing Evotherm; TB 2* SON and AR 28 SON, representing
specimens containing Sonnewarm; TB 2* SAS and AR 28 SAS, representing specimens
containing Sasobit; TB 2* Red WMX and AR Red WMX, representing specimens containing
Rediset WMX; and TB 2* Red LQ and AR 28 Red LQ, representing specimens containing Rediset
LQ. High temperature performace of CRM dense graded TB 26, 27 mixes was compared with
conventional polymer modified mixes using 655-1 which contained reactive polyphosphoric acid.
Also, performance of CRM stone mastic asphalt AR 28 mixes was compared to polymer modified
mixes using 427-4 contaning styrene butadiene styrene polymer.
All dynamic creep tests were conducted in an MTS 651 environmental chamber, using the
dynamic creep procedure. The samples were allowed to condition in the environmental test
chamber for two hours; one hour to reach the test temperature uniformly and one hour required for
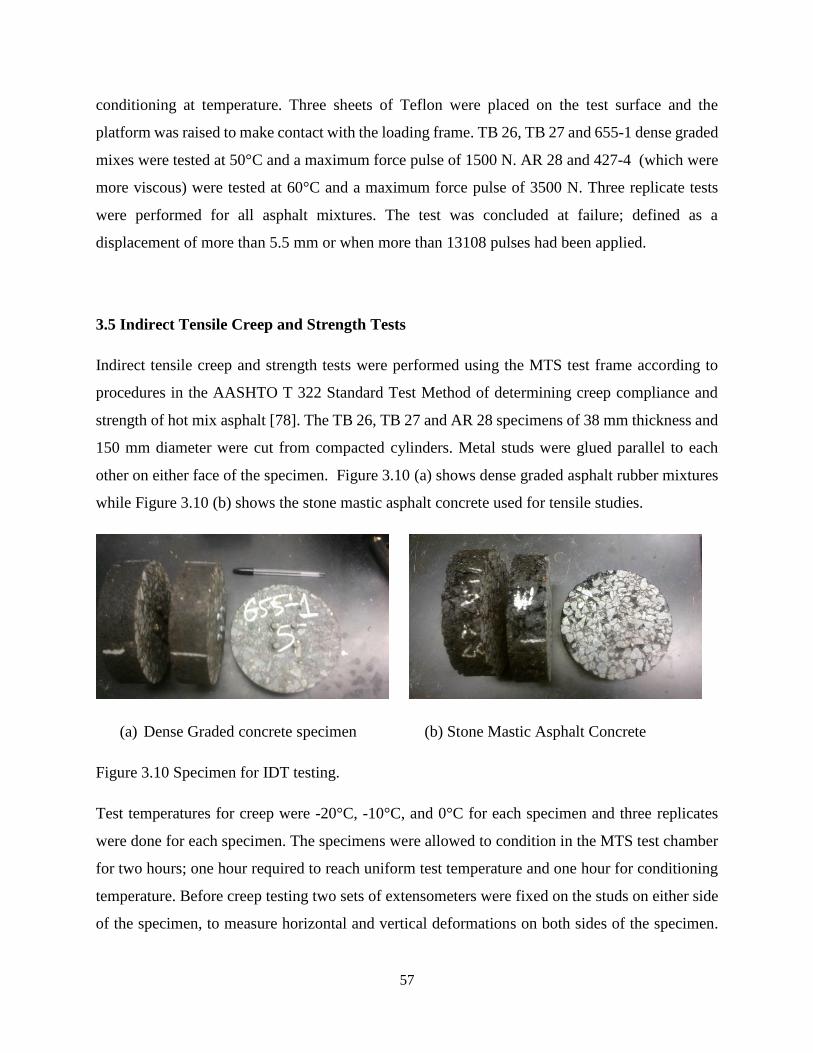
57
conditioning at temperature. Three sheets of Teflon were placed on the test surface and the
platform was raised to make contact with the loading frame. TB 26, TB 27 and 655-1 dense graded
mixes were tested at 50°C and a maximum force pulse of 1500 N. AR 28 and 427-4 (which were
more viscous) were tested at 60°C and a maximum force pulse of 3500 N. Three replicate tests
were performed for all asphalt mixtures. The test was concluded at failure; defined as a
displacement of more than 5.5 mm or when more than 13108 pulses had been applied.
3.5 Indirect Tensile Creep and Strength Tests
Indirect tensile creep and strength tests were performed using the MTS test frame according to
procedures in the AASHTO T 322 Standard Test Method of determining creep compliance and
strength of hot mix asphalt [78]. The TB 26, TB 27 and AR 28 specimens of 38 mm thickness and
150 mm diameter were cut from compacted cylinders. Metal studs were glued parallel to each
other on either face of the specimen. Figure 3.10 (a) shows dense graded asphalt rubber mixtures
while Figure 3.10 (b) shows the stone mastic asphalt concrete used for tensile studies.
(a) Dense Graded concrete specimen (b) Stone Mastic Asphalt Concrete
Figure 3.10 Specimen for IDT testing.
Test temperatures for creep were -20°C, -10°C, and 0°C for each specimen and three replicates
were done for each specimen. The specimens were allowed to condition in the MTS test chamber
for two hours; one hour required to reach uniform test temperature and one hour for conditioning
temperature. Before creep testing two sets of extensometers were fixed on the studs on either side
of the specimen, to measure horizontal and vertical deformations on both sides of the specimen.

58
The specimen with the extensometers attached was placed on the bottom loading strip of the
indirect tensile test fixture. The bottom actuator was raised manually until the specimen’s top just
touches the upper loading strip of the indirect tensile fixture, so to achieve loading over its
diametric axis. Constant loading was initiated to determine creep compliances at -20°C, -10°C and
0°C. At lower temperatures, higher loads are used to establish creep strains because the samples
are stiffer. Therefore 2000 N was used at 0°C, 4000 N was used at -10°C and 6000N was used at -
20°C. The creep compliance was obtained over a period of 100 seconds.
Indirect tensile strength tests were performed in the MTS test frame, according to procedures from
AASHTO T322. The NCHRP Project 9-29 recommends that tensile strength tests should be
conducted at the middle creep test temperature. Strength tests were carried out on three replicates
each of TB 27 and AR 28 specimens. The specimens were conditioned in the MTS specimen
chamber for two hours before testing. Specimens were loaded about the diametric axis at a loading
rate of 12.5 mm/min until failure occurred. At the end of the tests, the maximum failure stress (or
peak load) was obtained for each specimen.
3.6 Mechanistic- Empirical Pavement Design Guide
Mechanistic-Empirical Pavement Design Guide introduced in 2012 is a uniform and
comprehensive set of procedures for the design of rigid, flexible and composite pavements. The
concept of a design guide arose from the need to accurately predict the performance and durability
of pavements as a way of improving design procedures. Better pavement performance reduces
traffic congestion, ensures public safety, and reduces maintenance cost due to lower frequency of
repairs. Prior to the MEPDG, the American Association of State Highway and Transportation
Officials (AASHTO) Design Guide, based on road tests in the 1950’s, was the predominant
specification used to design pavements by most State DOTs [92]. However over the decades, this
empirical guide has developed significant limitations such as the use of 1950’s materials, traffic
volumes and construction methods as well as simple considerations of climate and pavement
layers, and the use of serviceability concept rather than any mechanistic criteria. Having
acknowledged these drawbacks, AASHTO developed a more reliable design, and so the MEPDG
was introduced under the National Cooperative Highway Research Programme (NCHRP) Project
1-37A. The guide considered previous pavement design procedures and also combined some
valuable empirical experience with newly- developed mechanistic models, that utilised stresses,

59
strains and deformations in the pavement in conjunction with transfer functions to predict its
performance. Through the MEPDG, calibrated mechanistic-based prediction models are used to
predict the development of various forms pavement distress, such as rutting and fatigue cracking
[92, 93].
The MEPDG is presented as a user-friendly software characterised by optional design levels,
namely Level 1, Level 2 and Level 3, ranked on order of highest to lowest level of accuracy,
trafficked pavements as well as safety and economic considerations. Typical inputs for Level 1
may include test data or site-specific information, while lower levels will be selected for using
general and historical data [93]. Each model is sensitive to certain inputs which affect the
prediction accuracy, and so it is important to investigate the most useful input and the appropriate
level. A combination of levels can be used to allow for accuracy of inputs plugged into this
software, such as asphalt mix properties specified in Level 1, traffic data in Level 2, and subgrade
properties used in Level 3. In order to easily plug inputs into the software and efficiently
classifying large amounts of data, pavement design is usually considered under three major
categories; traffic volume, climatic conditions and paving material. MEPDG incorporates a
climatic database and Enhanced Climatic Integrated Model (ECIM), which is used to model
temperature and moisture within each pavement layer including the subgrade [93].
With regards low temperature performance as used in this study, the computation process included;
Creep compliance at -20OC, -10OC and 0OC, were inputted into the software.
Creep compliance master curves are integrated into Prony series to determine tensile
properties used in the model
Climatic data and creep compliance is used to predict thermal stress responses
Stress intensity and tensile failure property is used to derive crack propagation using Paris
law.
Climatic data, traffic load, and pavement design is used to develop calibrated models
which is estimate stress intensity and also to predict physical cracking [93].

60
CHAPTER 4
RESULTS AND DISCUSSION
This study was carried out to investigate high temperature and low temperature performance of
asphalt rubber mixtures and some commercial warm mix additives. Indirect tensile tests at low
temperature gave indirect tensile creep and strength data, which were used in the AASHTO
MEPDG software to predict long term performance of the mixtures. Uniaxial Cyclic Compression
Test measures permanent deformation at high temperature and gave data regarding strain rate at
inflection and the number of cycles to inflection. The effect of warm mix additives (1 % and 0.5
%), on performance grade of terminal blend (TB) and stone mastic asphalt (SMA) mixes was
included in the study. Also moisture susceptibility study was carried out using the Moisture
induced Sensitivity Test (MiST) method. Good mixes for moisture susceptibility tests were
identified based on tensile strength ratio and bulk specific gravity. The results used in the studies
are mean values for the creep compliance, tensile strength, air voids, cycles to inflection and the
strain rate at inflection, and bulk specific gravities. The errors was evaluated using the coefficient
of variation (ratio of standard deviation to mean values), and is reported for various parameters
tested.
4.1 Moisture Susceptibility Studies
The specimen air voids have been reported to influence the susceptibility of an asphalt pavement
to moisture damage. When the air voids exceed 8 % by volume, they become interconnected,
allowing water to easily infiltrate HMA which can cause moisture damage through pore pressure.
Therefore, as recommended by the AASHTO T283 test method: ‘’Resistance of compacted asphalt
mixtures to moisture induced damage’ compacted test specimen used for moisture susceptibility
test should have air voids 7 ± 1 % [73]. Using the Superpave volumetric mix procedure, hot asphalt
mixtures were compacted to obtain a target air void of 7 ± 1 %. Summary of the average air voids
for the control (DANRAF) asphalt concrete specimen, and those containing the different warm
mix additives used in this study is given in Table 4.1 below. The COV for the air voids range from
1-2.3 % for these specimen.

61
Table 4.1 Air Voids of samples for Moisture Susceptibility Test.
Sample Name Average Air Voids
(%)
DAN RAF 6.4
DAN RAF RED LQ 1102 6.4
DAN RAF RED WMX 6.4
DAN RAF EVO 6.3
DAN RAF RED 1106 6.3
DAN RAF SON 6.2
Hydraulic scouring is regarded is described as the principal mechanism for stripping in asphalt
pavements. This is the result of repeated generation of pore water pressure in pavement due to
traffic loading [93]. The MiST conditioning incorporates the concept of pore pressure applied by
water at elevated temperatures. This ensures an accelerated conditioning system which depicts the
effects of hydraulic scouring [83]. It is worthy of note that the difference in the MiST and the
conventional AASHTO T283 method lies in the mode of conditioning. The MiST creates an
alternate pressure and vacuum cycle forcing water in and out of the pores of the HMA sample
while the AASHTO T283 uses free-thaw conditioning. Adam Zofka et al. [83] reports that test
methods such as the MiST could potentially improve the efficiency and precision for quality
assurance by providing faster and more reliable results. The InstroTek MiST 9 used in this study
applies pressure at 18.5 cycles/min, which is an improvement on previous versions. Huang et al.
[95], compared results of MiST conditioned and traditional freeze-thaw conditioned samples, with
and without anti-strip additives with various gradations. They determined that the MiST is an
effective way to determine the moisture susceptibility of hot mixtures in the laboratory.
The MiST default settings include: 3500 pressure cycles; temperature range 40oC to 60oC
depending on the PG binder grade (55oC for PG 58, and 60oC for PG grade higher than PG 64);
and pressure of 40 psi [77]. The settings used in this study include: 3500 cycles, pressure of 40
psi and a lower temperature of 40oC. Solaimanian et. al. suggests that the success criteria for
moisture susceptibility test procedure to be adopted for mix design and quality control include:
62
ability to incorporate the mechanism that cause moisture damage, and produce results that match
those occurring in the field under similar conditions; it must be able to effectively discriminate
between poor and good mixtures; it must be repeatable and reproducible; and it must be feasible,
practical and economical enough that it can be included in routine mix design practice [75].
Three important parameters for determining moisture sensitivity include: change in bulk specific
gravity, tensile strength ratio and visual inspection for evidence of stripping.
4.1.1 Percentage Difference in Bulk Specific Gravity (BSG)
The change in bulk specific gravity (also referred to as percentage swell), is a measure of the
density percent difference before and after MIST conditioning. Essentially the change in the bulk
specific gravity is attributed to the effect of pore pressure on the samples brought about by the
MIST conditioning. The conditioning process involves compression and suction flow of entrapped
water in the pore space of samples (known hydraulic scouring), and ultimately leads to stripping
[96]. It is largely speculated that a higher volumetric change of the specimen as a result of MIST
conditioning indicates a weak mixture [82, 96]. The MIST acceptance criteria for the change in
percent BSG is 1.5 % and less.
Using the Core-Lock method the pre and post conditioned BSG of the specimens were determined.
The result is shown in table 4.2 below. For every specimen, the measured specific gravity after
MiST conditioning was lower compared to the values before conditioning. Previous studies [96]
have carried using MIST testing on field cores from the State of Maine in the US. They observed
both increase and decrease in the post conditioned BSG values, which can both be attributed to the
effect of MIST conditioning. Therefore the absolute value of the change in the BSG is considered
rather than the directional change. For all laboratory prepared DANRAF hot mix asphalt concrete
specimens used in this study, there was a decrease in the BSG after MiST conditioning. The
average pre and post conditioning BSG values can be seen in table 4.2 below.

63
Table 4.2 Pre- and Post-Conditioned BSG.
Specimen Name Pre conditioned
average Bulk
Specific Gravity
Post conditioned
average Bulk
Specific Gravity
DAN RAF 2.297 2.205
DAN RAF RED
WMX
2.308 2.291
DAN RAF REDLQ
1102
2.311 2.296
DAN RAF REDLQ
1106
2.305 2.287
DAN RAF EVO 2.308 2.281
DAN RAF SON 2.314 2.294
The absolute value for the percent difference in the bulk specific gravity (or percentage swell), for
DAN RAF control mixtures, and those containing 0.5% of all the warm mix technology used in
this study, measured at 25oC is given in Figure 4.1 below.
Figure 4.1 Percent Swell of Control and 0.5 % WMA at 25oC.
0
0.5
1
1.5
2
2.5
3
3.5
4
4.5
% c
han
ge in
BSG
DANRAF
DANRAF RED WMX
DANRAF RED LQ 1102
DANRAF RED LQ 1106
DANRAF EVO
DANRAF SON

64
As presented by the chart, the control DANRAF specimen containing no WMA showed a
percentage swell value of 4.0 % (greater than 3.5 %), showing the greatest response to MiST
conditioning. Following the MiST acceptance criterion of 1.5 % (or less), the DAN RAF specimen
containing no WMA performed poorly. Results also show that all the warm mix additives used in
this study showed a lower response to MiST conditioning. They all had values lower than 1.5 %,
which is a good mix going by the InstroTek criteria. Comparing the warm mix additives, Rediset
LQ1102 showed the best result with the lowest BSG value of 0.7 %, followed by RED LQ 1106
with a BSG of 0.8 %. Evotherm showed the greatest change in percentage swell among all the
warm mix additives, with a value of 1.18 %. However, these numbers can all be considered to lie
within the repeatability limits of the MiST procedure.
4.1.2 Tensile Strength Ratio (TSR)
Tensile Strength ratio examines the effect of MiST conditioning by comparing the tensile strength
of dry conditioned and wet (MiST) conditioned specimen. Strength data considers the cohesion
and stability of the mix after MiST conditioning. Results for tensile strength studies for the dry
and wet (MiST conditioned) specimens are presented in table 4.3 below. The average tensile
strength of the unmodified DANRAF in dry testing was 122.678 kilopascals whereas it decreases
to 57.02 kilopascals for MiST conditioned specimens. The over 50% decrease in strength results
from the effects of MIST conditioning. The WMA modified specimens showed nearly the same
or higher tensile strength values for the MiST conditioned specimen compared to dry specimens.
Evotherm showed 11% reduction in strength for the MiST conditioned specimens. Incremental
strength were observed for Sonnewarm, Rediset LQ1106 and Rediset WMX showing 2%, 4%, and
8% increase in tensile strength respectively after MiST conditioning. Also, a significant increase
in strength was observed in Rediset LQ 1102, which exhibited 54% increase in strength after MiST
conditioning.
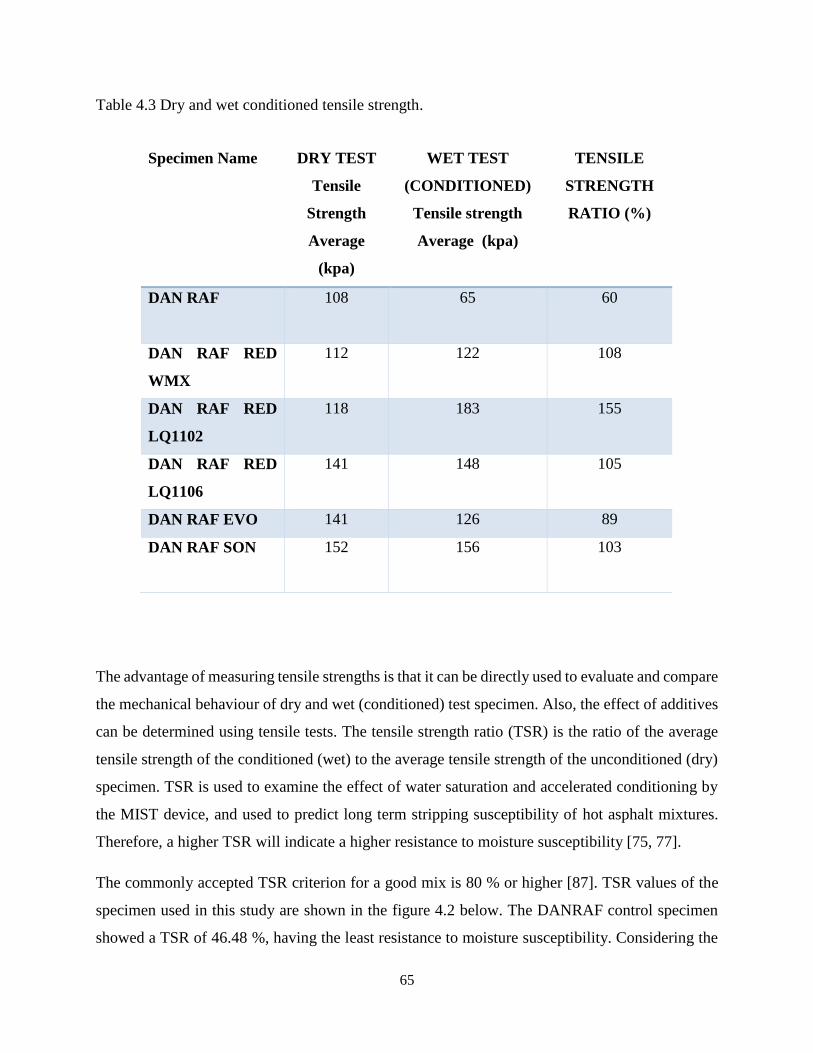
65
Table 4.3 Dry and wet conditioned tensile strength.
The advantage of measuring tensile strengths is that it can be directly used to evaluate and compare
the mechanical behaviour of dry and wet (conditioned) test specimen. Also, the effect of additives
can be determined using tensile tests. The tensile strength ratio (TSR) is the ratio of the average
tensile strength of the conditioned (wet) to the average tensile strength of the unconditioned (dry)
specimen. TSR is used to examine the effect of water saturation and accelerated conditioning by
the MIST device, and used to predict long term stripping susceptibility of hot asphalt mixtures.
Therefore, a higher TSR will indicate a higher resistance to moisture susceptibility [75, 77].
The commonly accepted TSR criterion for a good mix is 80 % or higher [87]. TSR values of the
specimen used in this study are shown in the figure 4.2 below. The DANRAF control specimen
showed a TSR of 46.48 %, having the least resistance to moisture susceptibility. Considering the
Specimen Name DRY TEST
Tensile
Strength
Average
(kpa)
WET TEST
(CONDITIONED)
Tensile strength
Average (kpa)
TENSILE
STRENGTH
RATIO (%)
DAN RAF 108 65
60
DAN RAF RED
WMX
112 122 108
DAN RAF RED
LQ1102
118 183 155
DAN RAF RED
LQ1106
141 148 105
DAN RAF EVO 141 126 89
DAN RAF SON 152 156 103

66
failure criterion, the DANRAF specimen failed as it indicated a poor mixture. All the WMA used
in this study has a significantly higher TSR values. Evotherm had a value of 89 %, while the other
WMA had values over 100 %. Studies suggest that a TSR greater than 100 % indicates an increased
strength with conditioned specimen compared to the unconditioned specimen, and so a better
resistance to stripping. Such a phenomenon has been observed with anti-strip additives such as
lime treated HMA mixtures [73]. Sonnewarm showed a TSR of 102 %, followed by Rediset LQ
1106 with TSR of 105 % and Rediset WMX having TSR of 108%. Rediset LQ 1102 had the
highest TSR of 155 %. Rediset LQ, Rediset WMX and Sonnewarm showed anti-stripping
properties as they improved TSR values. Rediset LQ is warm mix additive that contains chemical
surfactants which reduces the surface tension of asphalt binder, and enables effective coating of
aggregates. In effect, a high chemical bond is formed between asphalt and aggregate which is
resistant to the action of water at the conditioning temperature. The high TSR values indicate
improved adhesion and cohesion of the mix after MIST conditioned, thus suggesting superior anti-
stripping properties of Rediset LQ.
Figure 4.2 Tensile Strength Ratio of DAN RAF and 0.5 % Warm mix additives.
0
20
40
60
80
100
120
140
160
180
Ten
sile
Str
en
gth
Rat
io
DANRAF
DANRAF RED WMX
DANRAF RED LQ 1102
DANRAF RED LQ 1106
DANRAF EVO
DANRAF SON

67
4.1.3 Visual Inspection
Visual inspection of fractured specimen is also a means of identifying moisture damage of hot
asphalt mixtures. According to AASHTO 283, results for visual inspection can range from ‘none’
to ‘severe’ depending on the colour of the fractured surface (when wet and dry), and the ease of
withdrawal of aggregate or asphalt binder film from the surface of the specimen. Visual inspection
is generally believed to be a subjective approach rather than a quantitative evaluation. Sunghwan
Kim et al. [97] believed that despite the subjective approach, visual observation of fractured
specimen could be a means of identifying moisture related adhesion failure. The specimens
containing warm mix additives probably displayed little evidence of moisture damage as they
remained dark after drying, while the control DAN RAF specimens showed higher levels. Figure
4.3 (a) shows the fractured surfaces of the control while Figure 4.3 (b) shows the fractured surfaces
for specimen containing warm mix additives.
(a) Fractured surface of DAN RAF. (b) Fractured surface of DAN RAF + WMA.
Figure 4.3 (a) and (b) showing fractured surfaces of test specimen.

68
The summary of MiST results is shown in Table 4.4 below
Name of Specimen Tensile Strength
Ratio TSR
Bulk Specific
Gravity (Absolute
percentage change)
Visual Inspection
DAN RAF 60 4.0 Moderate extent of
stripping
DAN RAF RED
WMX
108 0.72 Slight stripping
DAN RAF REDLQ
1102
155 0.66 Slight stripping
DAN RAF REDLQ
1106
105 0.79 Slight stripping
DAN RAF EVO
89 1.1 Slight stripping
DAN RAF SON
103 0.86 Slight stripping
For the MIST studies, the coefficient of variation for air voids was between 1-3 %, the measured
BSG was 0.1-0.3 %, while the tensile strength was 6-11 %.
69
4.2 Uniaxial Cyclic Compression Test with Partial Confinement (UCCTC)
Permanent deformation can be described as the accumulation of small amounts of unrecoverable
strain which results from repeated traffic loads. The major evidence of permanent deformation is
in the form of rutting which is associated with high temperature service conditions [25, 98].
Considering the entire pavement structure, evidence of rutting on surface can be as a result of
overstressed underlying base or subgrade layers due to inadequate thickness design, improper
compaction, high traffic loads and moisture infiltration. Studies have shown that all flexible
pavements undergo significant levels of rutting. In asphalt mixtures, the resistance to permanent
deformation largely depends on shear resistance, such that permanent deformation occurs if shear
stress created by repeated loads, exceeds the shear strength of the mix [25, 99]. Therefore,
aggregate properties such as geometry and gradation, as well as the viscoelastic nature of the binder
contribute to permanent deformation behaviour of asphalt mixtures [35]. As reported by Hofbo
and Blab [100] due to the viscoelastic nature of asphalt concrete mixtures, their performance also
depends on temperature and frequency of loading. Therefore conventional mix design procedures
measure stability or strength of asphalt mixtures at high temperatures, as a way of assessing their
permanent deformation behaviour. Factors that affect stability include: tensile strength; resistance
to displacement; and friction which is a combined effect of inter-particle size and mass viscosity.
Among other performance testing, rutting test is necessary for rubberised asphalt concrete in order
to predict its high temperature performance. This study examined the permanent deformation
behavior of rubberised asphalt cement mixtures. The mix types used in this study (and also
commonly utilised in North America) include: dense graded mixes made from terminal blended
(TB) crumb rubber modified (CRM) asphalt binders; and stone mastic asphalt (SMA) mixes made
from asphalt rubber (AR) blends. Also, various warm mix asphalt (WMA) technologies (using 1
% and 0.5 % by weight of binder), were examined to assess their effect on the permanent
deformation behaviour of the mix. The control specimen used to study the effects of WMA were
the TB 26, 27 and AR 28 specimens which contained no additives. The performance of CRM
mixes were compared to conventional premium polymer modified dense graded and stone mastic
mixes. Therefore, polymer modified 655-1 dense graded mixes and 427-4 stone mastic mixes (both
obtained from Ministry of Transport Ontario) were used in the study.

70
Proper compaction during pavement construction significantly improves rutting resistance. With
sufficient compaction ensures that aggregate particles within the mix are well oriented and packed,
producing a well interlocked material mass that is more resistant to shear deformation. Figure
4.4(a) below shows that the dense graded TB 26 and TB 27 had air void ranges 4.5-6 % and 2.8-
3.5 % respectively. From figure 4.4(b), the air void of the stone mastic mixtures are within 4.8 to
5.7 %.
Figure 4.4 (a) Air voids of Dense graded mixes TB 26 and TB 27.
Figure 4.4 (b) Air voids of Stone mastic asphalt SMA specimen.
0.0
1.0
2.0
3.0
4.0
5.0
6.0
7.0
Air Voids
26 (1%)
27 (0.5%)
0.0
1.0
2.0
3.0
4.0
5.0
6.0
7.0
Air Voids

71
The UTCC was used to study the rutting resistance of the rubberised asphalt mixtures taking
dynamic creep parameters at the point of inflection i.e., the point where the strain rate is at
minimum. The important factor in the dynamic creep test on cylindrical specimen is the
measurement of vertical strain due to the increment of vertical stress. Dynamic creep curves were
developed where change in strain given as dynamic penetration depth was expressed as a function
of loading cycles. Figure 4.5 (a) - (e) shows dynamic creep curves obtained for some of the dense
graded and stone mastic specimens used in this study.
Figure 4.5 (a) Dynamic creep curve for 655 dense graded specimen.
Figure 4.5 (b) Dynamic creep curve for TB 27 dense graded specimen.
0
0.1
0.2
0.3
0.4
0.5
0.6
0.7
0.8
0.9
1
0 2000 4000 6000 8000 10000 12000
Pen
etr
ati
on
(m
m)
Load cycles
creep curve
Inflection point
0
1
2
3
4
5
6
0 1000 2000 3000 4000 5000
Pen
etr
ati
on
(m
m)
Load cycles
creep curve
Inflection point

72
Figure 4.5 (c) Dynamic creep curve for TB 26 EVO dense graded specimen.
Figure 4.5 (d) Dynamic creep curve for 427-4 stone mastic asphalt specimen.
Figure 4.5 (e) Dynamic creep curve for AR 28 stone mastic asphalt specimen.
0
1
2
3
4
5
6
7
0 200 400 600 800
Pen
etr
ati
on
(m
m)
Load cycles
creep curve
Inflection point
0
0.05
0.1
0.15
0.2
0.25
0.3
0 2000 4000 6000 8000 10000
Pen
etr
ati
on
(m
m)
Load cycles
creep curve
Inflection point
0
0.1
0.2
0.3
0.4
0.5
0.6
0.7
0.8
0.9
1
0 5000 10000 15000
Pen
etr
ati
on
(m
m)
Load cycles
creep curve
Inflection point

73
The dynamic curves show the point of inflection where the slope is at a minimum. Some of the
creep curves had all three phases discussed earlier (such as TB 27 and TB 26 EVO above).
Conversely some of the specimen did not exhibit a third phase such as 655-1 and 427-4, which is
an indication of high resistance to permanent deformation behavior.
Two performance parameters were considered at the point of inflection: strain rate at inflection
and the number of cycles to inflection. High strain rates at inflection indicate low rutting resistance,
and specimens requiring more load cycles to reach the point of inflection are more resistant to
rutting. Figure 4.6 (a) shows the strain rate at inflection for the dense graded mixes: 655-1;
terminally blended asphalt rubber TB 26 and TB 27 mixtures at 50oC. It should be noted that at
50oC and 1500N, the 655-1 specimen did not fail after 3 hours (at the end of the test). The
maximum number of loading cycles, 13107, was reached for all 655-1 specimen.
Figure 4.6 (a) Strain rate at inflection for TB 26 and TB 27 dense graded mixes.
The dense graded 655-1 mix showed very low strain rates at the point of inflection, which is
indicative of a high resistance to permanent deformation. The 655-1 was made from binders
chemically modified with poly phosphoric acid PPA. Modified asphalt binders have been
reportedly used in USA and Canada to improve performance grade in a safe, durable and
economical manner [38, 39]. The effect of PPA is based on the stiffening effects and increased
0.000000
0.000500
0.001000
0.001500
0.002000
0.002500
Stra
in r
ate
at
Infl
ect
ion
µm
/cyc
le
26 (1%)
27 (0.5%)

74
viscosity impacted on the mixture at the test temperature. Addition of PPA to crumb rubber
modified binders is reported to initiate crosslinking between sulphur contents in the asphaltenes
and maltenes in asphalt binder, producing a macro polymer network. Yadollahi et al. [101]
reported that this produced crumb rubber modified binders with better elastic properties at high
temperatures and lower creep stiffness at lower temperatures. Also softer asphalts are more prone
to rutting, and so mixes made from soft asphalt are less resistant to high temperature rutting
compared with mixes made with harder and more viscous asphalts [25].
Overall, the terminal blended TB 26 and TB 27 dense graded mixes showed lower resistance to
permanent deformation at 50oC (higher strain rate at inflection), compared to the 655-1 control
specimen. Conventional method for wet process terminal blending employs high shear mechanism
to completely depolymerise rubber particles achieving total digestion of rubber particles into
binder. This is done to solve the problem of storage instability resulting from sedimentation of the
rubber crumbs. However, the 30 mesh cryogenically ground crumb rubber produces particle size
that may influence the high temperature performance. Steven et al. [98], compared medium (10-
30 mesh), and fine (40-80 mesh) crumb rubber modifiers in mixes, results suggests that resistance
to rutting improved with particle size of crumb rubber modifier. Wang et al. [102] reported that
finer crumb rubber attains higher viscosity at high temperature and better rutting resistance. It is
believed that finer particles provide enough surface area for swelling, which produces higher
viscosity compared to coarser size. The reduced viscosity of the crumb rubber modified binder
made from the thermo-mechanical process, may have reduced the friction and resistance to internal
displacement within the mix, lowering rutting resistance. Considering the effect of compaction,
the air voids of 655-1 controls were relatively same or lower than those of the terminal blend
rubber mixes, and so the relatively high resistance to permanent deformation at 50oC may be
related to the effect of binder modification.
Since creep properties depend on degree of compaction, a direct comparison between TB 26 and
TB 27 could not be made to determine the effect of warm mix additives. Performance of additives
is based on comparison to the TB specimen containing no additives. Comparing TB 26 and TB 27
with their corresponding warm mix additives, it can be seen that there is a relatively lower strain
rate with the TB 27 containing warm mix additives. TB 27 SON and TB 27 EVO reduced the strain
rate at inflection at 50oC, improving the resistance to permanent deformation behaviour of dense

75
graded mixes. This may imply that lowering the additive content from 1% to 0.5% may improve
the performance to permanent deformation. Figure 4.6 (b) shows the strain rate at inflection for
the stone mastic asphalt mixes: 427-4 and AR 28 specimen also containing 0.5% WMA (by weight
of binder).
Figure 4.6 (b) Strain rates at inflection for AR 28 stone mastic asphalt specimen.
The SMA which is a commonly used gap-graded mixture in Canada contains 100% coarse stone
and asphalt filler mastic. The direct stone to stone contact in the mix provides excellent load
bearing component, improving the durability resistance to permanent deformation [49]. In the
stone mastic asphalt dynamic creep tests, the temperature and the maximum force was raised to
60oC and 3500N respectively, to obtain failure within three hours. Results for the strain rate at
inflection shows that 427-4 had minimal strain rates at inflection, and did not fail at with the
maximum allowable number of cycles (13107), with the test frame. This result indicates that 427-
4 is most resistant to permanent deformation. The high rutting resistance of the 427-4 can be
attributed to 3.0 % Styrene butadiene styrene (SBS), modifier contained in the asphalt binder. SBS
is an elastomeric polymer which improves mix stability by increasing the elastic response, thereby
improving resistance to permanent deformation [35, 103]. The asphalt rubber specimen showed
higher strain rate compared to 427-4 at 60oC, indicating a reduced resistance to permanent
deformation. The warm mix additives had either the same or lower resistance to permanent
deformation at 60oC. AR 28 EVO showed the lowest resistance (meanwhile giving better results
-0.000100
0.000000
0.000100
0.000200
0.000300
0.000400
0.000500
0.000600
0.000700
0.000800
Stra
in r
ate
at
Infl
ecti
on
µm
/cyc
le
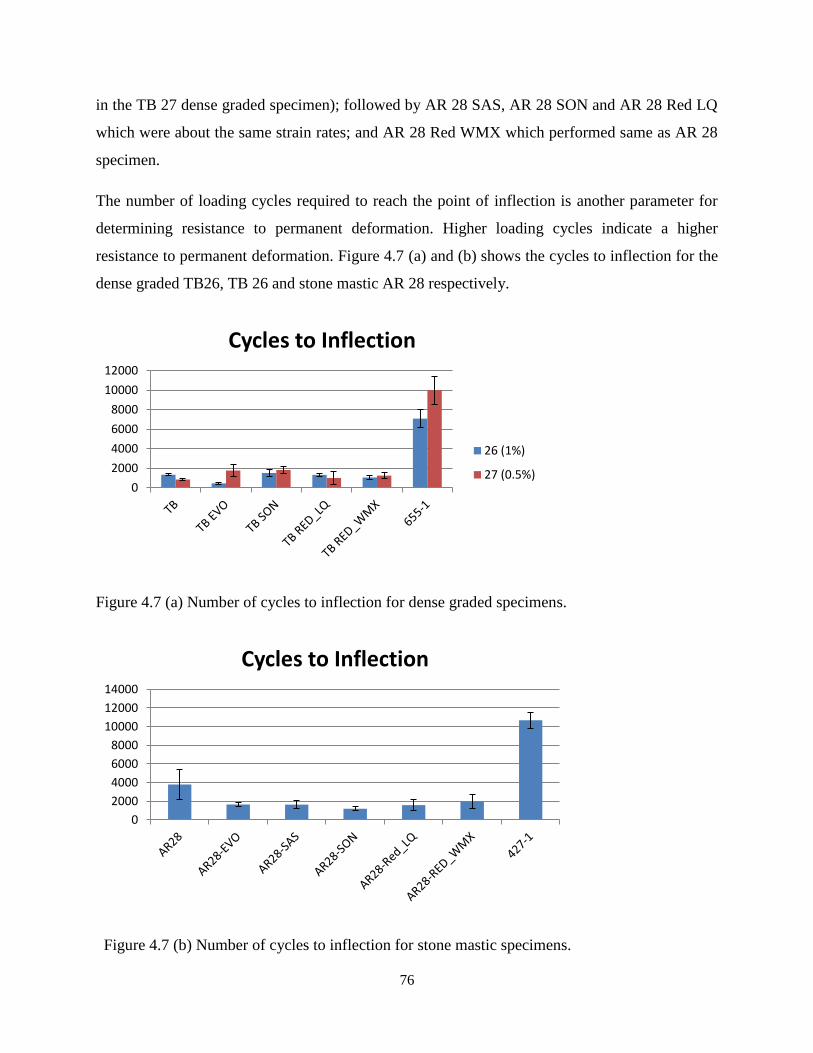
76
in the TB 27 dense graded specimen); followed by AR 28 SAS, AR 28 SON and AR 28 Red LQ
which were about the same strain rates; and AR 28 Red WMX which performed same as AR 28
specimen.
The number of loading cycles required to reach the point of inflection is another parameter for
determining resistance to permanent deformation. Higher loading cycles indicate a higher
resistance to permanent deformation. Figure 4.7 (a) and (b) shows the cycles to inflection for the
dense graded TB26, TB 26 and stone mastic AR 28 respectively.
Figure 4.7 (a) Number of cycles to inflection for dense graded specimens.
Figure 4.7 (b) Number of cycles to inflection for stone mastic specimens.
0
2000
4000
6000
8000
10000
12000
Cycles to Inflection
26 (1%)
27 (0.5%)
0
2000
4000
6000
8000
10000
12000
14000
Cycles to Inflection
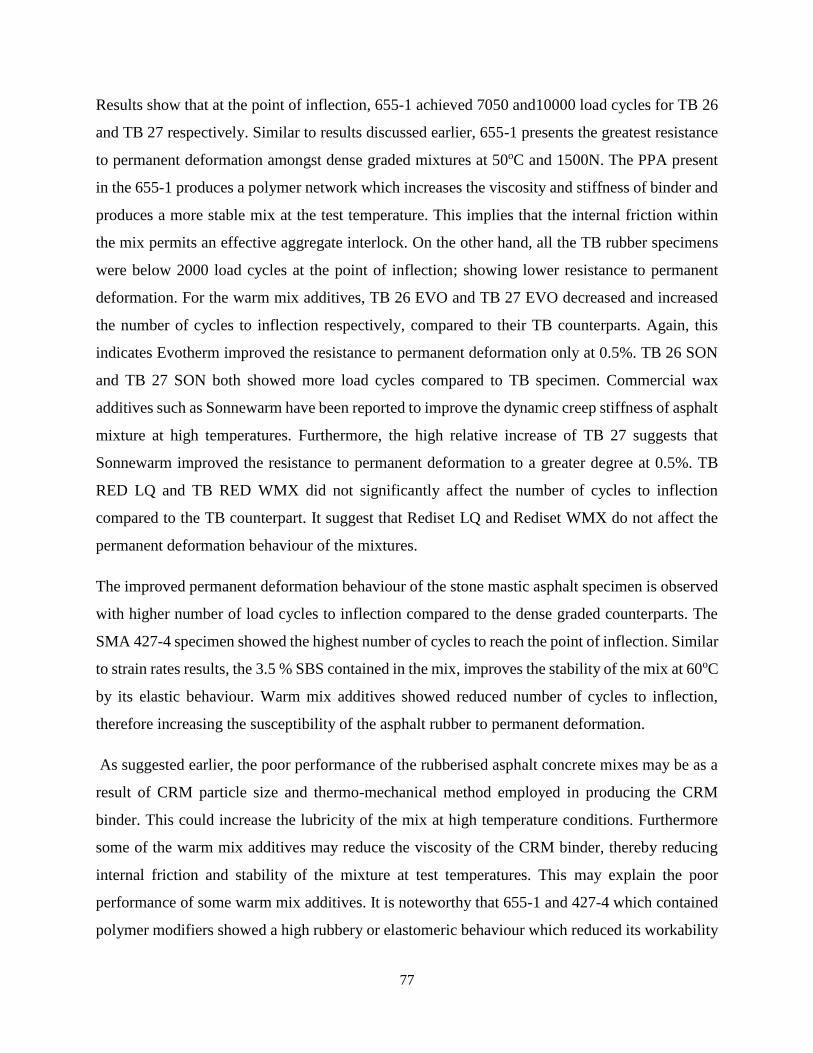
77
Results show that at the point of inflection, 655-1 achieved 7050 and10000 load cycles for TB 26
and TB 27 respectively. Similar to results discussed earlier, 655-1 presents the greatest resistance
to permanent deformation amongst dense graded mixtures at 50oC and 1500N. The PPA present
in the 655-1 produces a polymer network which increases the viscosity and stiffness of binder and
produces a more stable mix at the test temperature. This implies that the internal friction within
the mix permits an effective aggregate interlock. On the other hand, all the TB rubber specimens
were below 2000 load cycles at the point of inflection; showing lower resistance to permanent
deformation. For the warm mix additives, TB 26 EVO and TB 27 EVO decreased and increased
the number of cycles to inflection respectively, compared to their TB counterparts. Again, this
indicates Evotherm improved the resistance to permanent deformation only at 0.5%. TB 26 SON
and TB 27 SON both showed more load cycles compared to TB specimen. Commercial wax
additives such as Sonnewarm have been reported to improve the dynamic creep stiffness of asphalt
mixture at high temperatures. Furthermore, the high relative increase of TB 27 suggests that
Sonnewarm improved the resistance to permanent deformation to a greater degree at 0.5%. TB
RED LQ and TB RED WMX did not significantly affect the number of cycles to inflection
compared to the TB counterpart. It suggest that Rediset LQ and Rediset WMX do not affect the
permanent deformation behaviour of the mixtures.
The improved permanent deformation behaviour of the stone mastic asphalt specimen is observed
with higher number of load cycles to inflection compared to the dense graded counterparts. The
SMA 427-4 specimen showed the highest number of cycles to reach the point of inflection. Similar
to strain rates results, the 3.5 % SBS contained in the mix, improves the stability of the mix at 60oC
by its elastic behaviour. Warm mix additives showed reduced number of cycles to inflection,
therefore increasing the susceptibility of the asphalt rubber to permanent deformation.
As suggested earlier, the poor performance of the rubberised asphalt concrete mixes may be as a
result of CRM particle size and thermo-mechanical method employed in producing the CRM
binder. This could increase the lubricity of the mix at high temperature conditions. Furthermore
some of the warm mix additives may reduce the viscosity of the CRM binder, thereby reducing
internal friction and stability of the mixture at test temperatures. This may explain the poor
performance of some warm mix additives. It is noteworthy that 655-1 and 427-4 which contained
polymer modifiers showed a high rubbery or elastomeric behaviour which reduced its workability

78
during mixing. Coefficient of variation for number of loading cycles to failure ranged from 10-
16%, while the strain rate to failure ranged from 7-23 %.
4.3 Indirect Tensile Test (IDT) Results
The NCHRP report recommends that IDT creep and strength test provides and appropriate estimate
of low temperature performance properties of asphalt pavements [81]. The IDT creep tests give
the relationship between the time dependent strain and applied stress. Creep tests results are
expressed as a power law model of creep compliance. Therefore, creep compliance is the essential
quantity to evaluate low temperature cracking in asphalt pavement, as determines the magnitude
of thermal stress development on the pavement. The creep compliance was obtained for each
specimen at time 0, 10, 20, 50 and 100 seconds. Below the results of Creep compliance for
Terminal blend dense graded rubber mixes and stone mastic asphalt rubber mixes (and those
containing 0.5% WMA), can is seen in Figure 4.8 (a) - (e) and Figure 4.9 (a) - (d) respectively.
The typical viscoelastic nature of asphalt mixtures can be seen in the creep curves. At low
temperatures, the mixtures are stiffer and give lower strain response with applied stress, and
become more elastic at higher temperatures giving higher strain responses. Thus, the creep
compliance at -30oC and -20oC do not change significantly with time. Also, as the temperature
becomes higher (to 0oC), the strain responses become higher producing higher creep compliance
becomes higher.

79
(a) Creep compliance for 655-1
(b) Creep compliance for TB 27
0
0.5
1
1.5
2
2.5
0 20 40 60 80 100
Cre
ep
Co
mp
lian
ce (
1/G
Pa)
Time (s)
655-1
-20 Celsius -10 Celsius 0 Celsius
0
0.2
0.4
0.6
0.8
1
1.2
1.4
1.6
1.8
0 20 40 60 80 100
Cre
ep
Co
mp
lian
ce (
1/G
Pa)
Time (s)
TB 27
-20 Celsius -10 Celsius 0 Celsius

80
(c) Creep compliance for TB 27 SAS.
(d) Creep compliance for TB 27 Rediset blend mixes.
Figure 4.8 (a) - (d) Creep compliance for TB 27 dense graded specimen.
0
0.1
0.2
0.3
0.4
0.5
0.6
0.7
0.8
0.9
1
0 20 40 60 80 100
Cre
ep
Co
mp
lian
ce (
1/G
Pa)
Time (s)
TB 27 SAS
-20 Celsius -10 Celsius 0 Celsius
0
0.5
1
1.5
2
2.5
3
0 20 40 60 80 100
Cre
ep
Co
mp
lian
ce (
1/G
Pa)
Time (s)
TB 27 RED WMX
-20 Celsius -10 Celsius 0 Celsius

81
(a) Creep compliance for 427-4
(b) Creep compliance for AR 28 SON.
0
0.1
0.2
0.3
0.4
0.5
0.6
0 20 40 60 80 100
Cre
ep
Co
mp
lian
ce (
1/G
Pa)
Time (s)
427-4 IDT
-20 Celsius -10 Celsius 0 Celsius
0.000000
0.100000
0.200000
0.300000
0.400000
0.500000
0.600000
0.700000
0.800000
0.900000
0 20 40 60 80 100
Cre
ep
Co
mp
lian
ce (
1/G
Pa)
Time (s)
AR 28 SON
-30 Celsius -20 Celsius -10 Celsius 0 Celsius

82
(c) Creep compliance for AR 28 WMX.
(d) Creep compliance for AR 28 Red LQ.
0.000000
0.100000
0.200000
0.300000
0.400000
0.500000
0.600000
0.700000
0.800000
0 20 40 60 80 100
Cre
ep
Co
mp
lian
ce (
1/G
Pa)
Time (s)
AR 28 WMX
-30 Celsius -20 Celsius -10 Celsius 0 Celsius
0.000000
0.050000
0.100000
0.150000
0.200000
0.250000
0.300000
0.350000
0.400000
0.450000
0 20 40 60 80 100
Cre
ep
Co
mp
lian
ce (
1/G
Pa)
Time (s)
AR 28 Red LQ
-30 Celsius -20 Celsius -10 Celsius 0 Celsius

83
(e) Creep compliance for AR 28 SAS.
Figure 4.9 (a)- (e) Creep compliance for stone mastic asphalt rubber specimen.
The performance of the various mixtures can be compared using creep compliance at 50 s (which
is the mid creep test time). Figure 4.10 (a) and (b) shows the average creep compliance at 50s for
TB and AR test mixtures respectively.
Figure 4.10 (a) Average creep compliance at 50 s for dense graded specimens.
0.000000
0.050000
0.100000
0.150000
0.200000
0.250000
0.300000
0.350000
0 20 40 60 80 100
Cre
ep
Co
mp
lian
ce (
1/G
Pa)
Time (s)
AR 28 SAS
-30 Celsius -20 Celsius-10 Celsius 0 Celsius
0
0.4
0.8
1.2
1.6
2
2.4
655-1 TB 27 TB 27 SAS TB 27 RED WMXCre
ep
co
mp
lian
ce (
1/G
Pa)
-20 -10 0

84
Figure 4.10 (b) Average creep compliance at 50 s for stone mastic asphalt rubber.
The dense graded mixes presented higher creep compliance values compared to the stone masic
asphalt at -10oC. For the dense graded mixtures. Rediset WMX had the highest creep compliance
at 0oC, 655-1 had the highest creep values at -10oC and -20oC. For the stone mastic asphalt,
sonnewarm gave the highest creep compliance values at all temperatures. The viscoelstic property
of the mix is observed when there is a steady rise in creep compliance as with temperature. The
stress relaxation pattern at different temperatures is observed from creep master curves showing
creep compliance as a function of the logarithm of the time (as seen in figure 4.11 below).
0
0.4
0.8
1.2
1.6
2
2.4
427-4 AR 28 RED LQ AR 28 SAS AR 28 SON AR 28 REDWMX
Cre
ep
co
mp
lian
ce (
1/G
Pa)
-20 -10 0

85
Figure 4.11 Creep compliance versus load time for dense graded asphalt mixtures
Though specimen 655-1 has a high creep compliance value, it shows a sharp creep response from
-10oC to 0oC which may not be good performance property. As shown in other studies PPA
contained in asphalt mixtures can reduce low temperature performance properties [104]. Rediset
WMX improves the low temperature performance of TB specimen. Sasobit produced lower creep
compliance and therefore reduce the low temperature performance of TB specimen.
The stone mastic mixtures were stiffer at low temperatures and were not able to relax the stress at
low temperatures compared to the dense graded mixes. Similarly the 427-4 showed showed a sharp
rise in creep compliance with temperature. Which is indicative of a poor mixture. Sonnewarm and
Rediset WMX gave comparable low temperature performance.
4.3.1 Indirect Tensile Strength results
The mean tensile strength results for two test replicates dense graded specimen at -10oC is shown
in figure 4.12 and 4.13 below. High tensile strengths are preferrable because it allows the specimen
to withstand high stress before failure. The highest tensile strength was observed for 655-1,
compared to the TB 27 specimen. The high tensile strength can be attributed to the stone mastic
structure and the stiffening effect of PPA on the mix. The warm mix additives improved the
0
0.5
1
1.5
2
2.5
3
0 1 2 3 4 5 6 7
Cre
ep
Co
mp
lian
ce (
1/G
Pa)
Corrected log time
655-1 TB 27 TB 27 SAS TB 27 RED WMX

86
strength of the rubberised asphalt concrete. Sasobit improved the strength compared to Rediset
WMX.
Figure 4.12 Average tensile strength for TB dense graded mixes.
Figure 4.13 Average tensile strength for AR stone mastic asphalt.
The stone mastic asphalt exibited lower strength values compared to the dense graded mixes,
failing in a relatively brittle manner. The 427-4 modified with SBS elastomers showed the highest
strength. Comparing the warm mix additives, Rediset WMX gave the highest strength followed
by Sonnewarm. Rediset LQ and Sasobit showed similar strength values.
0
0.5
1
1.5
2
2.5
3
3.5
4
4.5
Ten
sile
Str
en
gth
Mp
a
655-1
TB 27
TB 27 RED WMX
TB 27 SAS
0
0.5
1
1.5
2
2.5
Ten
sile
Str
en
gth
in M
Pa
427-4
AR 28 SAS
AR 28 SON
AR 28 WMX
AR 28 RED LQ

87
4.4 AASHTO MEPDG Crack Prediction Results
Creep compliance and tensile strength data were used to obtain the predicted lifetime of laboratory
prepared stone mastic and dense graded asphalt concrete specimens, using the MPEDG software.
The estimated traffic loads and climatic conditions for Highway 655-1 in Timmins, Ontario and
Highway 427-4 in Nothern Ontario were considered to predict the long term cracking behaviour
of various rubberised asphalt concrete used in the study.The failure is defined as 190m of
transverse cracking per kilometer of the road. Summary of the cracking prediction for the dense
graded terminal blend and stone mastic asphalt mixes are shown in figure 4.14 (a) and (b) below.
For the dense graded mixtures, 655-1 containing PPA gave 283 m/km crack length after 15 years
producing the longest time to failure. The terminal blend asphalt rubber specimen gave higher
values of crack length per kilometer, while 0.5 % Sasobit and Rediset WMX did not significantly
increase the predicted years to failure of the mixture. Though they produced favourable creep
compliance results, short predicted lifetime can be attributed to the climatic environment in
Timmons, Ontario.
Figure 4.14 (a) Crack predictions for dense graded asphalt concrete mixtures.
0.00
100.00
200.00
300.00
400.00
500.00
600.00
Cra
ck le
ngt
h in
m/k
m
Time in years
Thermal Cracking Prediction
655-1 TB 27 SAS TB 27 RED WMX TB 27 Threshold value

88
Figure 4.14 (b) Crack prediction for stone mastic mixtures.
Stone mastic asphalt rubber samples containing Sasobit, Rediset LQ and Rediset WMX gave good
predicions giving crack lengths per kilometer of 53.1, 50.2 and 50m respectively. These mixes
also produced good creep compliance behaviour. They all had over 15 years to failure predictions.
Asphalt rubber containing Sonnewarm gave crack predictions of 491 m/km after 15 years, reaching
failure in 1 year. Similarly 427-4 gave predictions of 541 m/km after 15 years, reaching failure in
2 years.
-100.00
0.00
100.00
200.00
300.00
400.00
500.00
600.00
Cra
ck le
ngt
h in
m/k
m
Time in years
Thermal cracking prediction
427-4 AR 28 SAS AR 28 WMX
AR 28 SON AR 28 RED LQ Threshold value

89
CHAPTER 5
SUMMARY AND CONCLUSIONS
Based on the background, experimental procedure, result and discussion of this study, the
following summary and conclusions are provided;
Several test methods have been developed to investigate moisture damage of hot mix
asphalt HMA pavements. Successful test methods incorporate proper simulation of field
mechanisms of moisture damage and measure physical properties related to performance.
Current test methods do not replicate the dynamics of pore pressure and hydraulic scouring
present in the pavement when vehicle tires pass over wet pavement.
Moisture induced test method is an accelerated conditioning system designed to simulate
stripping mechanism that occurs in HMA pavements layers. The MiST test was used to
differentiate HMA mixtures made from RAF binders, and RAF modified with some
common warm mix asphalt WMA technologies. Tensile strength ratio (TSR) and
percentage change in bulk specific gravity were used to determine the effects of hydraulic
scouring and the pore pressure due to MIST conditioning.
Following the MiST criteria, all warm mix additives improved performance of HMA to
moisture damage as they produced TSR values over 80 %. Rediset LQ 1102, 1106 and
Rediset WMX produced TSR values over 100 % which is similar to results obtained from
liquid anti-strip additives such as lime additives.
Stone mastic asphalt concrete showed a higher resistance to permanent deformation than
dense graded mixes as they required greater magnitude of loading cycles to reach point of
inflection and showed lower strain rates at inflection.
Stone mastic and terminal blend controls; 427-4 and 655-1, showed greater resistance to
permanent deformation because of their SBS, RET and PPA contents, respectively. High
viscosity and stiffness of polymer modified binders increase stability of asphalt concrete
mixtures and give superior resistance to permanent deformation.
Dense graded asphalt concrete have higher creep compliance values compared to the stone
mastic concrete specimen.

90
Warm mix additives reduced the resistance to permanent deformation for the stone mastic
asphalt mixtures.
Sasobit and Rediset WMX at 0.5 % gave creep behaviour of terminally blended asphalt
rubber improving their low temperature performance.
Evotherm and Sonnewarm at 0.5 % improved the permanent deformation behaviour of
dense graded mixes while they did not give similar results at 1%
655-1 and 427-4 showed better low temperature tensile strengths compared to asphalt
rubber specimens.
MPEDG crack predictions showed that Sasobit, Rediset LQ and Rediset WMX for stone
mastic asphalt could have over 15 year service life in the Toronto area. Also thermal
cracking prediction showed that Sasobit, Rediset WMX and terminal blended crumb
rubber asphalt mixtures will fail in less than 2 years when used in Northern Ontario areas
such as Timmins.

91
REFERENCES
1. Sehafer, A. The global demand for motorised mobility. Transport research A.32 (6) 455-
477.
2. Wendell C. Jean L ‘’Highway and motorised fact book’’ 40 years of the US Interstate
Highway System: An analysis The Best Investment a Nation Ever Made, 1966.
3. United Nations Environmental Programme, North American Cities, Facts and figures,
2009.
4. Virginia Asphalt association ‘Why choose asphalt’’ www.vaasphalt.org
5. Johnson A. M. Best Practiced Handbook on Asphalt Pavement Maintenance, Minnesota
Technology Transfer Centre ILTAP Program, University of Minnesota, Minnepolis, Feb
2000 pp 1-3.
6. Road Readie Paving, Learn about asphalt. 2014.
7. Senthil, K.P. Effects Of Warm Mix Additives And Dispersants ON Rheological, Aging
and Failure Properties OF Asphalt Cements. M.Sc. Thesis, Department of Chemistry,
Queen’s University, Kingston, Ontario, Canada, 2013.
8. Lecture notes, University of Iowa Civil Engineering materials Period 14- Bituminous
materials (1) 14.1-14.2 CC Swan 53.086.
9. Michael Freemantle, Chemical Engineering News. What’s this stuff? Volume 77 No 4
Nov. 1999.
10. Association of Modified Asphalt Producers, ‘’World of Asphalt’’ Modified Asphalt
binders- Part 1.
11. US Department Of Transportation, Federal Highway Administration. Crumb Rubber
Modifier Sept. 2011.
12. United States Environmental Protection Agency, Municipal Solid Waste 2012.
13. Ali A. H Mashaam, Karim M R Investigation of physical and rheological properties of
aged rubberised bitumen ‘’Advances in Material Science and Engineering Art 239037,
2013.
14. Al- Abdul Wahab, Introduction to Pavement Structures. Lecture Notes, King Fahd
University Of Petroleum and Minerals Chapter 1-2.
15. Global Innovative Campus, Fundamentals of Hot Asphalt Mixtures 2012.
92
16. Togunro Oluranti TP. Low temperature investigations on asphalt binder performance-A
case study on highway 417 trial sections, M.Sc. Thesis, Department of Chemistry, Queen’s
University, Kingston Canada, 2008.
17. Matthew T.V and K.V Krishna, Rao Introduction to Pavement Design. NPTEL-
Introduction to Transport Engineering. May 2006, pp 19.1-19.6.
18. John R. and David W. The Shell bitumen hand book. Thomas Telford Services Limited,
2010.
19. Sharad S. A Cupta A.K IOSR Journal of Mechanical and Civil Engineering. Pavement
Deterioration and its causes ISSN: 2278-1084 pp 9-15.
20. Asphalt Institute Series-2. Superpave Mix Design
21. National Pooled Fund Study 776. Investigation of Low Temperature cracking in Asphalt
pavements 2007-43.
22. Pavement Interactive. Pavement Management 2012. www.pavement
interactive.org/category/pavement
23. Tham N. A Quality and durability of Rubberised asphalt cement and Warm Rubberised
Asphalt Cement, M.Sc. Thesis, Department of Chemistry, Queen’s University, Kingston
Canada, 2013.
24. Rubber Board, Rubberisation of Roads 2002.
25. Abiodun S. Cold In-place recycling With Expanded Asphalt Mix, M.Sc. Thesis,
Department of Chemistry, Queen’s University, Kingston Canada, 2013.
26. John D., Eric H. Warm Mix Asphalt: European Practice. FHWA Report No PL-08-007
American Trade Initiatives, Alexandra Virginia. 2008.
27. Anderson D.A, Christen D.W, Bahia Hu, Physical Properties of Asphalt Cement and the
development of Performance Related Specification. Journal Association of Paving Technol
60:437-475 1991.
28. Chen J.S, Kuo P.H Lin P.S, Huang C. C, Ln K. Y, Experimental and Theoretical
Characterization of the Engineering Behaviour of Bitumen mixed with Mineral Filler.
Mater Struct 41(6): 1015-1024 2008.
29. John P. Z, Micheal E P. Evaluation of Performance Graded Asphalt binder equipment and
testing protocol Department of Civil and Environmental Engineering, Morgantown, West
Virginia. April, 2004.

93
30. Roberts F. L. Kandhal P. S. Brown E. R. Lee D. Y. Kennedy T. W., Hot Mix Asphalt
Materials, Mix Design and Construction National Asphalt Pavement Association
Education, 1996.
31. John D’ Angelo, Michael R., Material Production, Mix Design and pavement Design,
Effects on Moisture Damage, 2003.
32. Logaraj S. Chemistry of Asphalt-Aggregate Interaction- Influence of Additives. Moisture
Damage Symposium, Laramie, Wyo., 2002.
33. Kraton Bitumen Modification- An innovative approach to Polymer Modification for Road
Safety and Longevity., 2012.
34. Henry Kwame Agbovi, Effects of Low Temperature, Repetitive Stress and Chemical aging
on thermal and fatigue cracking in Asphalt Cement Pavement on Highway 417. M. Sc.
Thesis Department of Chemistry, Queens University, Kingston ON. 2012.
35. The Association of Modified Asphalt Producers, an Introduction to Modified Asphalt
Binders Nebraska Asphalt Paving Conference February 2012.
36. Gordon D. A Rheological Properties of Styrene butadiene styrene polymer modified road
bitumen Fuel 82(14): 1709-1719 2003.
37. Duo D, Fu H. Li L. Xiel Yao S. Ku M. Storage Stability and compatibility of Asphalt
binder modified by Styrene Butadiene Styrene graft copolymer. Construction and building
materials 21(7): 1528-1533 2007.
38. Phosphate facts: Use of Polyphosphoric Acid in Asphalt Binders, Applications for Asphalt
paving- Introduction www.phosphatesfacts.org/asphalt-pavement.asp
39. Transport Research Board- Polyphosphoric Acid Modification of Asphalt Binders.
Transportation Research Circular, 2012.
40. Becker Y. Mendez M.P and Rodriguez, R. Y Vision Technologica 9(1), 39 2001.
41. Rubber Manufacturers Association; 2011 U.S Scrap Tire Market Summary, 2013.
42. Rubber News.com RMA Official: Industry must find new markets for ground rubber, 2014.
43. Government of Canada: Environment Canada, Used Tire Recycling Program Ontario 2014.
44. Salman Zafar, Production and Applications of Crumb Rubber, Industrial Waste
Management Recycling: EcoMENA, June 2014.
45. Chandra Akisetty, Evaluation of Warm Mix Asphalt Additives on Performance properties
of Crumb Rubber Modified binder and mixtures, Clemenson University 2008.

94
46. U.S. Environmental Protection Agency, Scrap Tire Technology and Markets Noyes Data
Corporation NJ 1993.
47. Sadhan K. D. Avraam Isayev, Rubber Recycling, 2004.
48. Takallou H. B, Hicks, R. G. Use of Waste Material in Hot Mix Asphalt Issue 1193. 1991.
49. R Gary Hicks, Susan Tighe and DingXin Cheng Rubber Modified Technical Manual.
Ontario Tire Stewardship Toronto, ON Canada, 2012.
50. Mark Belshe P.E, Advantages of Using Recycled Tire rubber in Asphalt Crumb Rubber
Modified Asphalt. Crumb Rubber Modified Asphalt 101, 2012.
51. ASTM D 6114, Standard Specification for Asphalt Rubber Binder.
52. Shakir Shantawi, Comparison of Rubberised Asphalt binders; Asphalt- Rubber and
Terminal blend 2011.
53. Shakir R Glynn H. Asphalt Rubber Maintenance Treatments in California. California
Department of Transportation 2003.
54. Industrial Resources Council. Hot Mix Asphalt Pavement.
55. Asphalt Technology News, NCAT Evaluates Warm Mix Asphalt Vol. 17 2005.
56. Olof kristjansdottir, Warm mix Asphalt for cold Weather paving University of Washington
2006.
57. Federal Highway Administration, United States Department of Transportation, Warm Mix
Asphalt Technologies and Research. www.fhwa.dot.gov/pavement
58. Jenkins K. J. Van De Ven M. F. C. Development of Half Warm foamed bitumen mixes:
State of The Art., 2006.
59. Australian Asphalt Pavement Association, Advisory Note 17. Warm Mix Asphalt- A State
of the art review 2007.
60. Cathrina Barros Caltrans Warm Mix Asphalt ‘State of the Practice’, 2012.
61. Tejash Gandhi Serji Amirkhanian, Laboratory Simulation of Warm Mix Asphalt (WMA)
Binder Aging Characterisation, Department of Civil Engineering, Clemenson Univeristy.
2007.
62. Akzo Nobel RedisetTM, Warm Mix Solution, Warm Mix Additive that also function as an
ant-istripping.
63. European Asphalt Pavement Association, The Use Of Warm Mix Asphalt, 2010.
64. Warm Mix Asphalt Technical Working Group www.warmmixaspalt.com.

95
65. National Asphalt Pavement Association, Warm Mix Asphalt Takes Off
66. United States Department of Transportation, Federal Highway Administraion,
Accelerating Innovation Every day Counts, 2013.
67. Feipeng Xiao, Serji N. Amirkhanian, Bradley J. Putman Evaluation of Rutting Resistance
in Warm Mix Asphalt Containing Moist Aggregates, 2011.
68. Lou Politano Ontario Warm Mix Asphalt- A Greener Alternative to Hot Mix Asphalt,
2012.
69. Transport Research Board Engineering properties, Emission and Field performance of
Warm Mix Asphalt- ‘State of the practice’. NHCRP 9-47A. 2009.
70. Simon A Hesp. Evaluation of Warm Mix Additives on Performance of Crumb rubber
Modifier. Department Of Chemistry, Queens University, Kingston ON. 2001.
71. Elizabeth Rae Hunter, Khaled Ksaibati, Evaluating Moisture Susceptibility of asphalt
mixes, Department of Civil and Architectural Engineering, University of Wyoning.
November 2002.
72. Hainian Wang, Zhanping You, Zhengxia Dang. Effect of Warm Mixture Asphalt (WMA)
additives on high failure temperature properties of crumb rubber modified (CRM) binders,
2012.
73. Transport Association of Canada- Moisture Damage of Asphalt Pavements and Anti-
stripping additives. December, 1997.
74. Asphalt Institute, Cause and Prevention of Stripping in Asphalt Pavements, Educational
Series NO. 10, Asphalt Institute, 1981.
75. Monsour Solaimanian, John Harvey, Maghsoud Tahmoressi, Vivek Tandon. Moisture
Sensitivity of Asphalt Pavements: A National Seminar Topic 3 Test Methods to predict
Moisture Sensitivity of Hot-Mix Asphalt Pavements, 2003.
76. Vince Aurilio, John Emery. Use Of Asphalt Rubber, 1993.
77. InstroTEK Inc. Moisture Induced Sensitivity Test Operation Guide, 2012.
78. American Association of State and Highway Transport Officials, Designation T322-07
Determining the Creep Compliance and Strength of Hot Mix Asphalt (HMA) using Indirect
Tensile Test Device.

96
79. David N Richardson, Steven M. Lusher, Determination of Creep Compliance and Tensile
Strength of Hot Mix Asphalt for wearing courses in Missouri. Missouri University of
Science and Technology. April 2008.
80. Rutgers Pavement Resource Program. Indirect Tensile Tester
81. NHCRP Report 530 Evaluation of Indirect Tensile Test (IDT) Procedures for low-
temperature performance of Hot-Mix Asphalt 2004.
82. Adam Zofka , Alternative Moisture Sensitivity test. The 9th International Conference
‘Environmental Engineering’, May 2014.
83. InstroTEK. The MiST, The Future of Moisture Sensitivity Testing 2012.
84. Ontario Provincial Standard Specification, Material Specification for Hot Mix Asphalt,
2002.
85. American Association of State and Highway Transport Officials T312; Preparing and
Determining density of Hot Mix Asphalt (HMA) Specimens by means of the Superpave
Gyratory Compactor.
86. American Association of State and Highway Transport Officials T 166-07; Bulk Specific
Gravity of Compacted Asphalt Mixtures using Saturated Surface-dry Specimen, 2011.
87. American Association of State and Highway Transport Officials T 283; Resistance of
Compacted Bituminous Mixture to Moisture Induced Damage for Superpave.
88. Miljkovic, M. M. Radenberg, Rutting Mechanisms and Advanced Laboratory Testing of
Assphalt Mixture Resistance against Permanent Deformation. Facta universitatis series:
Architecture and Civil Engineering, Vol. 9, No. 3, 2011, pp. 407-417.
89. Dołżycki, B., J. Judycki. Behaviour of asphalt concrete in cyclic and static compression
creep test with and without lateral confinement. Road Materials and Pavements Design.
Volume 9, No 2.2008, pp. 207 – 22.
90. Technische Prüfvorschriften für Asphalt im Straßenbau (TP Asphalt-StB), Teil 25 A 1:
Dynamischer Stempeleindringversuch an Gussasphalt. Forschungsgesellschaft für
Straßen- und Verkehrswesen (Hrsg.), 2009.
91. Karcher, C. Evaluation of the Deformation Resistance of Asphalt Mixes by Cyclic
Compression Tests. 5th Eurasphalt and Eurobitume Congress, Instabul, 2012.

97
92. Dzotepe, G and Ksaibat, Implementation of the Mechanistic-Emperical Pavement Design
Guide (MEPDG. Department of Civil and Architectural Engineering, University of
Wyoming: Laramie, W. Y., 2010.
93. Guide for Mechanistic-Emperical Design of new and rehabilitated pavement structures,
Final Report. National Coorperative Highway Research Program Transportation Research
Board, Final Report 1-37A, 2004.
94. Tarrer A. and Wagh V. “The Effect of the Physical and Chemical Characteristics of the
Aggregate on Bonding.” Strategic Highway Research Program Report No. SHRP-A/UWP-
91-510; 1991.
95. Huang, B. Chen, X.; Evaluation of Moisture Damage in Hot Mix Asphalt using Simple
Performance and Superpave Indirect Tensile Tests, Construction and Building Materials
22: 1950–1962, 2008.
96. Rajib Mallick, Development of a Rational Procedure for Evaluation of Moisture
Susceptibility of Asphalt Paving Mixes 2003.
97. Sunghwan Kim, Brian J. Coree, Evaluation of Hot Asphalt Moisture Sensitivity Using the
Nottingham Asphalt Test Equipment.
98. Steven Manolis, Simon Hesp, High Temperature Performance of Scrap tire rubber
modified asphalt concrete.
99. Larry Sanctucci, Rut Resistance Asphalt Pavements, Technology Transfer Program.
100. Hofko, B., R. Blab. Assessment of Permanent Deformation Behavior of Asphalt Concrete
by Improved Triaxial Cyclic Compression Testing. Transportation and Development
Institute Congress, Integrated Transportation and Development for a Better Tomorrow,
ASCE, 2011, pp. 396-397.101.
101. Golzin Yadollahi, Hamid Sabbsagh Mollahosseini, Improving the performance of Crumb
Rubber bitumen by means of Poly Phosphoric Acid (PPA) and Vestenamer, additives,
Construction and Building Materials, vol. 25, no 7, pp. 3108-3116, 2011.
102. H Wang, Z. You, J. Mills-Beale, and P. Hao, ‘Laboratory evaluation on high temperature
viscosity and low temperature stiffness of asphalt binder with high percent scrap tire
rubber,’ Construction and building Materials, vol. 26, no. 1,pp 583-590, 2012.
103. Amjad Albayati, Influence of Styrene butadiene rubber on the mechanical properties of
asphalt concrete mixture, 2011.

98
104. Aflaki S., Tabatabaee N.: Proposals for modification of Iranian bitumen to meet the
climatic requirements of Iran Construction and Building Material 2009, 23, 2141-215