Embed Size (px)
Citation preview

George C. Soulas, Thomas W. Haag, Daniel A. Herman, Wensheng Huang,Hani Kamhawi, and Rohit ShastryGlenn Research Center, Cleveland, Ohio
Performance Test Results of the NASA-457M v2 Hall Thruster
NASA/TM—2012-217711
August 2012
AIAA–2012–3940
https://ntrs.nasa.gov/search.jsp?R=20120014613 2018-07-03T01:20:04+00:00Z

NASA STI Program . . . in Profi le
Since its founding, NASA has been dedicated to the advancement of aeronautics and space science. The NASA Scientifi c and Technical Information (STI) program plays a key part in helping NASA maintain this important role.
The NASA STI Program operates under the auspices of the Agency Chief Information Offi cer. It collects, organizes, provides for archiving, and disseminates NASA’s STI. The NASA STI program provides access to the NASA Aeronautics and Space Database and its public interface, the NASA Technical Reports Server, thus providing one of the largest collections of aeronautical and space science STI in the world. Results are published in both non-NASA channels and by NASA in the NASA STI Report Series, which includes the following report types: • TECHNICAL PUBLICATION. Reports of
completed research or a major signifi cant phase of research that present the results of NASA programs and include extensive data or theoretical analysis. Includes compilations of signifi cant scientifi c and technical data and information deemed to be of continuing reference value. NASA counterpart of peer-reviewed formal professional papers but has less stringent limitations on manuscript length and extent of graphic presentations.
• TECHNICAL MEMORANDUM. Scientifi c
and technical fi ndings that are preliminary or of specialized interest, e.g., quick release reports, working papers, and bibliographies that contain minimal annotation. Does not contain extensive analysis.
• CONTRACTOR REPORT. Scientifi c and
technical fi ndings by NASA-sponsored contractors and grantees.
• CONFERENCE PUBLICATION. Collected papers from scientifi c and technical conferences, symposia, seminars, or other meetings sponsored or cosponsored by NASA.
• SPECIAL PUBLICATION. Scientifi c,
technical, or historical information from NASA programs, projects, and missions, often concerned with subjects having substantial public interest.
• TECHNICAL TRANSLATION. English-
language translations of foreign scientifi c and technical material pertinent to NASA’s mission.
Specialized services also include creating custom thesauri, building customized databases, organizing and publishing research results.
For more information about the NASA STI program, see the following:
• Access the NASA STI program home page at http://www.sti.nasa.gov
• E-mail your question to [email protected] • Fax your question to the NASA STI
Information Desk at 443–757–5803 • Phone the NASA STI Information Desk at 443–757–5802 • Write to:
STI Information Desk NASA Center for AeroSpace Information 7115 Standard Drive Hanover, MD 21076–1320

George C. Soulas, Thomas W. Haag, Daniel A. Herman, Wensheng Huang,Hani Kamhawi, and Rohit ShastryGlenn Research Center, Cleveland, Ohio
Performance Test Results of the NASA-457M v2 Hall Thruster
NASA/TM—2012-217711
August 2012
AIAA–2012–3940
National Aeronautics andSpace Administration
Glenn Research CenterCleveland, Ohio 44135
Prepared for the48th Joint Propulsion Conference and Exhibitcosponsored by AIAA, ASME, SAE, and ASEEAtlanta, Georgia, July 30 to August 1, 2012

Acknowledgments
The authors acknowledge David M. Manzella, David T. Jacobson, and Robert S. Jankovsky for the design and fabrication of the NASA-457M v2 Hall thruster. The authors also acknowledge Kevin L. Blake, George W. Readus, and George P. Jacynycz for the fabrication of the thruster, assembly of the test setup, and operation of the vacuum facility.
Available from
NASA Center for Aerospace Information7115 Standard DriveHanover, MD 21076–1320
National Technical Information Service5301 Shawnee Road
Alexandria, VA 22312
Available electronically at http://www.sti.nasa.gov
Trade names and trademarks are used in this report for identifi cation only. Their usage does not constitute an offi cial endorsement, either expressed or implied, by the National Aeronautics and
Space Administration.
Level of Review: This material has been technically reviewed by technical management.

NASA/TM—2012-217711 1
Performance Test Results of the NASA-457M v2 Hall Thruster
George C. Soulas, Thomas W. Haag, Daniel A. Herman, Wensheng Huang, Hani Kamhawi, and Rohit Shastry
National Aeronautics and Space Administration Glenn Research Center Cleveland, Ohio 44135
Abstract
Performance testing of a second generation, 50 kW-class Hall thruster labeled NASA-457M v2 was conducted at the NASA Glenn Research Center. This NASA-designed thruster is an excellent candidate for a solar electric propulsion system that supports human exploration missions. Thruster discharge power was varied from 5 to 50 kW over discharge voltage and current ranges of 200 to 500 V and 15 to 100 A, respectively. Anode efficiencies varied from 0.56 to 0.71. The peak efficiency was similar to that of other state-of-the-art high power Hall thrusters, but outperformed these thrusters at lower discharge voltages. The 0.05 to 0.18 higher anode efficiencies of this thruster compared to its predecessor were primarily due to which of two stable discharge modes the thruster was operated. One stable mode was at low magnetic field strengths, which produced high anode efficiencies, and the other at high magnetic fields where its predecessor was operated. Cathode keeper voltages were always within 2.1 to 6.2 V and cathode voltages were within 13 V of tank ground during high anode efficiency operation. However, during operation at high magnetic fields, cathode-to-ground voltage magnitudes increased dramatically, exceeding 30 V, due to the high axial magnetic field strengths in the immediate vicinity of the centrally-mounted cathode. The peak thrust was 2.3 N and this occurred at a total thruster input power of 50.0 kW at a 500 V discharge voltage. The thruster demonstrated a thrust-to-power range of 76.4 mN/kW at low power to 46.1 mN/kW at full power, and a specific impulse range of 1420 to 2740 s. For a discharge voltage of 300 V, where specific impulses would be about 2000 s, thrust efficiencies varied from 0.57 to 0.63.
Nomenclature
GRC Glenn Research Center HEFT Human Exploration Framework Team ISP In Space Propulsion Program J current Jd discharge current
anode mass flow T thrust V voltage Vd discharge voltage ηa anode efficiency
Introduction
In 2010, NASA established the Human Exploration Framework Team (HEFT) to analyze exploration and technology concepts and provide inputs to the agency’s senior leadership on the key components of a safe, sustainable, affordable, and credible future human space exploration endeavor for the nation (Ref. 1). The team concluded, in part, that the use of a high power (i.e., on the order of 300 kW) solar electric propulsion system could significantly reduce the number of heavy lift launch vehicles required for

NASA/TM—2012-217711 2
a human mission to a near earth asteroid (Refs. 1 and 2). Hall thrusters were found to be ideal for such applications because of their high power processing capabilities and their efficient operation at moderate specific impulses, which leads to reduced trip times that are necessary for such missions (Refs. 2 to 4). Recent electric propulsion system model estimates that considered factors such as cost, mass, fault-tolerance, cost uncertainty, complexity, ground test vacuum facility limitations, previously demonstrated power capabilities, and possible technology limitations have shown that Hall thrusters operating at power levels of 20 to 50 kW are strong candidates for human exploration missions operating at total powers up to 500 kW (Refs. 2 and 5).
An excellent thruster candidate for such a mission is the NASA-457M Hall thruster. This thruster is a 50 kW-class thruster whose development was initiated in 2000 for the NASA Space Solar Power Concept and Technology Maturation Program to enable space solar power systems and other high power spacecraft (Refs. 6 and 7). A laboratory model version of this high power thruster was fabricated and tested with xenon in 2002 at power levels up to 72 kW and at discharge voltages between 300 and 650 V (Refs. 7 and 8). Anode specific impulses were measured to be between 1750 to 3250 s with anode efficiencies between 0.46 and 0.65 on xenon (Refs. 7 and 9). Later tests with this thruster were conducted with a krypton propellant over a similar input power range but with discharge voltages up to 1000 V to achieve even higher specific impulses (Ref. 10). This thruster was further tested with xenon at low discharge voltages (100 to 150 V) to evaluate performance at the low specific impulse range of 800 to 1500 s for near-earth space applications requiring high thrust-to-power (Refs. 8 and 11).
The successful test campaign with the laboratory model NASA-457M led to the development of a higher fidelity version of this thruster, labeled the NASA-457M v2. This work was funded by NASA’s In-Space Transportation Program, whose objective was to advance the technology readiness level of high-power Hall thruster technology (Ref. 12). Thruster fabrication was completed in 2004 and initial checkout testing was initiated thereafter. Unfortunately, program funding was terminated prior to the initiation of performance tests.
Testing of the NASA-457M v2 was re-initiated last fiscal year with funding from NASA’s Human Exploration and Operations Mission Directorate Enabling Technology Development and Demonstration Program (Ref. 13). This program was focused on developing and maturing the technologies needed to reduce cost and expand the capability of future space exploration activities. This fiscal year, this program was transitioned to the NASA’s Office of Chief Technologist Game Changing Technology Division and is called the In Space Propulsion (ISP) project. The program content is still focused on developing and maturing the high power propulsion technologies needed to enhance the agency’s capabilities to explore and move large payloads in space (Ref. 13). Testing of this thruster was re-initiated with funding from both programs.
The test program for the NASA-457M v2 had multiple objectives. These objectives are listed below along with their impacts:
1. To evaluate the performance of the NASA-457M v2 over the full input power range of 5 to 50 kW
with a xenon propellant. This thruster could provide the ISP program with a potential head start in high power Hall thruster development if the thruster meets future mission requirements.
2. Along with NASA-300M thruster performance testing (Ref. 13), to reconstitute a high power Hall thruster testing capability at the NASA Glenn Research Center (GRC). A successful test completion would provide NASA’s ISP program with a test stand for future high power thruster testing.
3. To provide test data for: a) verification of thruster thermal and service life models, as well as vacuum facility models; and b) development of in situ erosion diagnostics. Successful model verification and erosion diagnostics development would decrease thruster development costs and risks for the ISP program by reducing the number of design iterations and service life tests.
4. To provide high power thruster operating characteristics for power processor development. These data would help reduce future power processor development risks.
NASA/TM—2012-217711 3
This paper will only present the performance test results of the NASA-457M v2 and compare them to those of the laboratory model. The thruster and test facility will initially be described. The section thereafter will present the performance test results and compare them to the laboratory model NASA-457M.
Apparatus and Procedures
Thruster
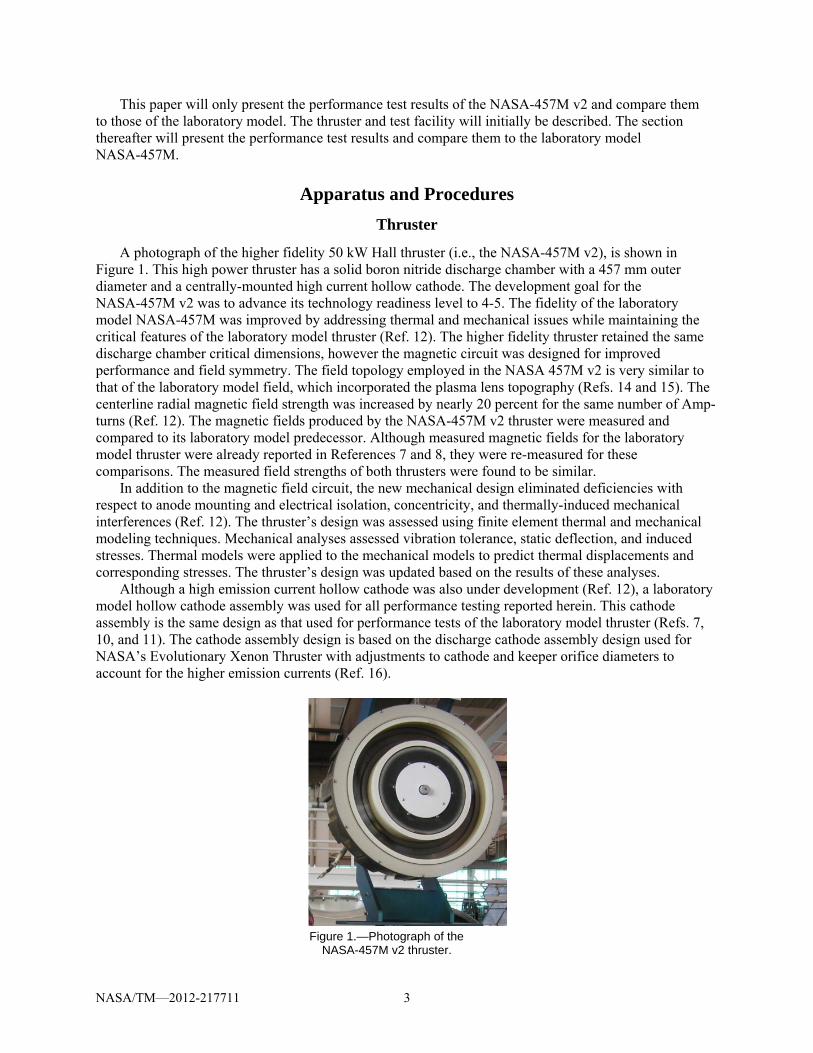
A photograph of the higher fidelity 50 kW Hall thruster (i.e., the NASA-457M v2), is shown in Figure 1. This high power thruster has a solid boron nitride discharge chamber with a 457 mm outer diameter and a centrally-mounted high current hollow cathode. The development goal for the NASA-457M v2 was to advance its technology readiness level to 4-5. The fidelity of the laboratory model NASA-457M was improved by addressing thermal and mechanical issues while maintaining the critical features of the laboratory model thruster (Ref. 12). The higher fidelity thruster retained the same discharge chamber critical dimensions, however the magnetic circuit was designed for improved performance and field symmetry. The field topology employed in the NASA 457M v2 is very similar to that of the laboratory model field, which incorporated the plasma lens topography (Refs. 14 and 15). The centerline radial magnetic field strength was increased by nearly 20 percent for the same number of Amp-turns (Ref. 12). The magnetic fields produced by the NASA-457M v2 thruster were measured and compared to its laboratory model predecessor. Although measured magnetic fields for the laboratory model thruster were already reported in References 7 and 8, they were re-measured for these comparisons. The measured field strengths of both thrusters were found to be similar.
In addition to the magnetic field circuit, the new mechanical design eliminated deficiencies with respect to anode mounting and electrical isolation, concentricity, and thermally-induced mechanical interferences (Ref. 12). The thruster’s design was assessed using finite element thermal and mechanical modeling techniques. Mechanical analyses assessed vibration tolerance, static deflection, and induced stresses. Thermal models were applied to the mechanical models to predict thermal displacements and corresponding stresses. The thruster’s design was updated based on the results of these analyses.
Although a high emission current hollow cathode was also under development (Ref. 12), a laboratory model hollow cathode assembly was used for all performance testing reported herein. This cathode assembly is the same design as that used for performance tests of the laboratory model thruster (Refs. 7, 10, and 11). The cathode assembly design is based on the discharge cathode assembly design used for NASA’s Evolutionary Xenon Thruster with adjustments to cathode and keeper orifice diameters to account for the higher emission currents (Ref. 16).
Figure 1.—Photograph of the
NASA-457M v2 thruster.

NASA/TM—2012-217711 4
Vacuum Facility and Test Support Hardware
As was done with the laboratory model version thruster, performance testing was conducted in NASA GRC’s Vacuum Facility 5. This cylindrical facility is 4.6 m in diameter and 18.3 m long and was pumped with cryogenically-cooled panels and 20 axially distributed oil diffusion pumps. Unlike the laboratory model thruster test (Ref. 7), the thruster was mounted in the main volume of the vacuum facility to ensure low pressures near the thruster. A photograph of the mounted thruster is shown in Figure 2. Facility pressures were measured with an ion gage mounted next to the thruster’s thrust stand mount. Facility pressure uncertainties were estimated by the manufacturer to be within 6 percent of reading. Pressures next to the thruster were less than 4.0×10⁻³ Pa (3.0×10⁻⁵ torr) throughout performance testing.
A gas feed system made of commercially available components was used to feed xenon to the thruster. The gas feed system utilized 1000 and 200 sccm mass flow controllers to provide propellant to the anode and cathode, respectively. Both mass flow controllers were calibrated prior to testing using xenon. Typical uncertainties reported herein were 1.0 percent of reading for the anode mass flow and 1.1 percent of reading for total mass flows.
A commercial discharge power supply was used and was capable of supplying 2000 V at over 100 A with a 5.5 mF output filter capacitance. A 15.3 mF capacitor bank was connected in parallel with the power supply at the electrical feed-throughs of the vacuum facility to filter discharge current oscillations. In addition, separate commercial power supplies were used to power the cathode heater, cathode keeper, and electromagnets.
A null-type inverted pendulum thrust stand was used during performance testing, which is identical to the one used in References 7 and 8. The power cables were fed to the thruster using a “water fall” configuration to minimize thermal drift (Ref. 16). In-situ thrust stand calibrations were performed prior to and after all performance tests. In addition, the thruster was periodically powered off during performance testing to measure the thermal drift, which was used to correct the thrust measurements reported herein. Thrust uncertainty was estimated to be 2 percent of reading (Refs. 7 and 16).
Figure 2.—Photograph of the NASA-457M
v2 thruster mounted in NASA’s Vacuum Facility 5.

NASA/TM—2012-217711 5
A data logger was used to measure and record thruster currents, voltages, and mass flow rates, as well as facility pressures. All data logger measurements were calibrated prior to testing using calibrated meters. Current uncertainties were estimated to be within 0.3 percent of reading for discharge currents and within 0.6 percent of reading for all other currents. Voltage uncertainties were estimated to be within 0.1 percent of reading for discharge voltages and within 0.04 percent of reading for all other voltages.
The test also included a number of other diagnostics to address the other test objectives listed earlier. These diagnostics are listed below:
1. Optical diagnostics were included to support the development of an erosion diagnostic. The thruster downstream insulator was interrogated for neutral insulator material, as well as neutral, singly-charged, and doubly-charged xenon with seven stationary lenses coupled to two spectrometers via fiber optic cables. The near-field plume was also interrogated for neutral and singly-charged xenon with separate cameras.
2. Near- and far-field plasma plume diagnostics were installed on a two axis positioning system to support thruster model development. They included a planar probe for beam current densities, a single Langmuir probe for electron temperatures and number densities, emissive probes for plasma potentials, and Wien filters (more commonly called ExB probes) for charge states.
3. Thermocouples were mounted on the outer ceramic channel wall and on the inner and outer ferromagnetic poles to support thermal model development.
4. Discharge current and voltage probes were used to measure oscillations to support power processor development.
5. Four additional vacuum facility ion gages were mounted at various locations to support facility pressure model development.
Results from these diagnostics will not be reported herein, but most will be the topic of future publications.
Throttling Range and Operating Procedures
The discharge currents, voltages, and powers of this performance test are listed in Table 1. Thruster discharge power was varied from 5 to 50 kW over a 200 to 500 V discharge voltage range. The maximum discharge voltage was set by the maximum anticipated specific impulse required by the HEFT mission, which favored values less than about 2600 s to keep mission durations acceptable (Ref. 2). A discharge voltage of 200 V was selected as the minimum because of the significant decrease in anode efficiencies as a function of discharge voltage. Although performance was originally intended to be measured in 100 V increments, performance was further measured at 250 V because of the large change in anode efficiency between the 200 and 300 V cases. Performance was also measured at 350 V to support erosion diagnostics development.
The maximum discharge current was limited to 100 A because the cathode was not designed to operate at such high currents for extended periods and the discharge power supply was nearing its high current capability. A minimum discharge current of 15 A was selected because of the significant decrease of anode efficiencies as a function of discharge current at that level.
Before the start of performance testing, thruster input power was increased gradually as a function of time to slowly remove moisture absorbed by the discharge channel’s boron nitride, which ultimately permitted stable thruster operation at high powers. This process is referred to as insulator bakeout.
Following insulator bakeout, performance was measured over a several day period. For the first throttle level of a given day, the thruster was operated for at least 1 h before recording thruster performance. Subsequent throttle levels were operated until performance had achieved equilibrium, which typically required at least 10 min of operation at that level. Throughout performance testing, the cathode keeper current was set to 1.0 A and the inner and outer magnet currents were always set equal to each other.

NASA/TM—2012-217711 6
TABLE 1.—DISCHARGE THROTTLE LEVELS FOR THE NASA-457M V2 THRUSTER PERFORMANCE TEST
Discharge power,
kW
Discharge current, A vs. Discharge voltage, V
200 V 250 V 300 V 350 V 400 V 500 V
5 a25 20 16.7
6 - - - - 15
7.5 - - - - - 15
10 a50 40 33.3 - a25 -
15 a75 60 50 - 37.5 30
20 a100 80 66.7 57.1 a50 40
25 100 83.3 - 62.5 50
30 100 85.7 a75 60
35 - 87.5 70
40 a100 80
45 90
50 100 aIndicates high magnetic field operation was conducted in addition to high anode
efficiency operation. The thruster was operated in two stable modes: high anode efficiency and high magnetic field
operation. Stable thruster operation is defined here as peak-to-peak discharge current oscillations less than that of the average discharge current. During high anode efficiency operation, anode flows and magnetic fields were adjusted to optimize anode efficiency for all discharge voltages and currents listed in Table 1. Here, anode efficiency, ηa, is defined as:
dda
a VJm
T
2
2
(1)
where T is the measured thrust, am is the anode flow, and Jd and Vd are the discharge current and voltage, respectively. During anode efficiency optimization, peak-to-peak discharge current oscillations were typically 80 percent of the average discharge current. The cathode flow was also set to 8.0 percent of the anode flow. Most of the performance data presented herein were measured with the thruster operated in this manner.
During high magnetic field operation, the thruster was operated at a constant maximum radial magnetic field along the discharge channel centerline for the limited throttling points indicated in Table 1. This radial magnetic field setting was higher than the highest magnetic field setting during high anode efficiency operation. This operating mode simulated the manner in which the NASA-457M laboratory model thruster was operated in References 7 and 8 so that comparisons between the two thruster versions could be made. For this operating mode, the cathode flow was set to values similar to those of References 7 and 8, and 8.0 percent of the anode flow.
Results and Discussions
The following sections present and discuss the results of the performance test. The initial sections present and discuss the discharge and cathode performance results separately. Overall thruster performance is presented and discussed thereafter. In all sections, the results are interpreted and compared to that of the laboratory model version of the thruster, whose performance was reported in References 7 and 8.

NASA/TM—2012-217711 7
Discharge Performance
Anode efficiency as a function of discharge power for the v2 thruster is plotted in Figure 3 for high anode efficiency operation. The uncertainty in discharge power for all results reported herein was estimated to be 0.3 percent of the indicated value and anode efficiency was estimated to typically be 4.2 percent of the indicated value. As the figure shows, anode efficiencies varied from 0.56 to 0.71 and typically increased with increasing discharge voltage. The peak efficiency achieved by the NASA-457M v2 was similar to that of other high power Hall thrusters, such as the NASA-400M, the NASA-300M, and the BHT-20K which achieved peak efficiencies of 0.71, 0.73, and 0.68, respectively (Refs. 16 to 18). The NASA-457M v2, however, outperformed these other thrusters at lower discharge voltages. For example, the NASA-457M v2 demonstrated an anode efficiency range of 0.56 to 0.63 at a discharge voltage of 200 V, while the NASA-400M, the NASA-300M, and the BHT-20K demonstrated anode efficiency ranges of 0.46 to 0.49, 0.51 to 0.57, and 0.51 to 0.54, respectively (Refs. 16 to 18).
Figure 3 also shows that anode efficiency as a function of discharge power generally increased with power at lower powers at each discharge voltage, achieved a peak value at an intermediate power level, and then decreased with power at higher powers. For comparison, anode efficiency as a function of discharge power at various discharge voltages for the laboratory model thruster from References 7 and 8 is plotted in Figure 4. A comparison of the two figures shows two distinct differences. First, the higher fidelity thruster appears to outperform the laboratory model thruster by a difference of 0.05 to 0.18. Second, the laboratory model anode efficiency as a function of discharge power either increased with discharge power, or increased with power at lower powers and then achieved a plateau value for discharge voltages greater than 200 V.
The main reason for the anode efficiency differences between the two thruster versions was differences in how they were operated. The laboratory model thruster was operated with a nearly constant peak centerline radial magnetic field. During performance testing of the v2 thruster, magnetic fields were adjusted to optimize anode efficiency. During this optimization, two stable modes of operation were found. One was at low magnetic field strengths, which produced high anode efficiencies, and the other at high magnetic fields.
Figure 3.—Anode efficiency as a function of discharge power at various discharge
voltages for the NASA-457M v2 during operation in high anode efficiency mode.
0.35
0.40
0.45
0.50
0.55
0.60
0.65
0.70
0.75
0 10,000 20,000 30,000 40,000 50,000
Anode Efficiency
Discharge Power, W
500 V
400 V
300 V
250 V
200 V

NASA/TM—2012-217711 8
Figure 4.—Anode efficiency as a function of discharge power at various
discharge voltages for the laboratory model NASA-457M. Data are from References 7 and 8.
Figure 5.—Anode efficiency as a function of discharge power for the laboratory
model and v2 thrusters at high magnetic fields and high anode efficiencies. Laboratory model data are from References 7 and 8.
To permit a more direct comparison between the two thruster versions, the v2 thruster was operated at
a constant peak radial magnetic field along the discharge channel centerline that was about 75 percent that of the laboratory model thruster. Anode efficiencies as a function of discharge power are shown in Figure 5 for both thrusters at two discharge voltages. The figure shows that when the v2 thruster’s magnetic fields were increased, anode efficiencies decreased between 0.05 and 0.11, with the performance of the v2 thruster approaching that of the laboratory model thruster. Indeed, the performance differences between the two thrusters at high magnetic fields were within measurement uncertainties. In addition, anode efficiency decreases at higher powers were less pronounced. It can be concluded from Figures 3 to 5 that anode performance between the two thruster versions was quite similar, and that the NASA-457M could be operated at lower magnetic field strengths to achieve more optimal anode efficiencies than had been done in the past.
0.35
0.40
0.45
0.50
0.55
0.60
0.65
0.70
0.75
0 10,000 20,000 30,000 40,000 50,000
Anode Efficiency
Discharge Power, W
500 V
400 V
300 V
200 V
0.35
0.40
0.45
0.50
0.55
0.60
0.65
0.70
0.75
0 10,000 20,000 30,000 40,000 50,000
Anode Efficiency
Discharge Power, W
400 V ‐ v2 High Anode Efficiency
400 V ‐ v2 High Magnetic Field
400 V ‐ Lab Model
200 V ‐ v2 High Anode Efficiency
200 V ‐ v2 High Magnetic Field
200 V ‐ Lab Model

NASA/TM—2012-217711 9
The reason for the lower anode efficiencies at high magnetic fields is explored in Figures 6 and 7, which plot thrust as a function of discharge current and discharge current as a function of anode mass flow, respectively, for the two thrusters operating in different modes. As shown in Equation (1), anode efficiency is directly proportional to thrust squared and indirectly proportional to anode mass flow and discharge current. Figures 6 and 7 demonstrate that anode efficiencies were lower at high magnetic fields because, in general, thrusts were lower. However, Figure 6 also shows that this thrust disparity decreased as a function of increasing discharge current for currents 60 A, until thrusts were equal at about 100 A. Regardless, operation with lower magnetic fields still produced higher anode efficiencies for discharge currents 60 A because the thruster was able achieve those thrusts with lower anode mass flows, as shown in Figure 7.
Figure 6.—Thrust as a function of discharge current for the v2 thruster during
high anode efficiency operation and the laboratory model thruster during operation with high magnetic fields at discharge voltages of 200 and 400 V. Laboratory model data are from References 7 and 8.
Figure 7.—Discharge current as a function of anode mass flow for the v2
thruster during high anode efficiency operation and the laboratory model thruster during operation with high magnetic fields. Laboratory model data are from References 7 and 8.
0
500
1000
1500
2000
2500
10 20 30 40 50 60 70 80 90 100 110
Thrust, m
N
Discharge Current, A
400 V ‐ v2; High Anode Eff.
400 V ‐ Lab Model
200 V ‐ v2; High Anode Eff.
200 V ‐ Lab Model
10
20
30
40
50
60
70
80
90
100
110
120
10 20 30 40 50 60 70 80 90 100
Discharge Current, A
Anode Mass Flow, mg/s
v2; High Anode Eff.
Lab Model

NASA/TM—2012-217711 10
This was particularly unexpected because minimizing the discharge current for a given anode flow, and therefore a lower electron current to the anode, is typically expected to yield a more optimal anode efficiency (Ref. 19). The nonlinear behavior of v2 thruster thrust as a function of discharge current for currents 60 A in Figure 6, and its increasing discharge current in Figure 7 as a function of anode mass flow, suggest that beam ion current is decreasing for currents 60 A during high anode efficiency operation. And the integrated beam current densities for the NASA-457M v2 thruster operating at a discharge current and voltage of 100 A and 200 V, respectively, showed that beam ion currents were indeed higher during high magnetic field operation (Ref. 20). However, even though the laboratory model thruster operating with high magnetic fields likely produced a higher ion beam current for discharge currents 60 A as shown in Figure 7, the thrust was still less than or equal to that of the v2 thruster at lower magnetic fields as shown in Figure 6. This suggests that other thrust loss mechanisms are becoming significant during operation with high magnetic fields, such as beam divergence, the ratio of singly-to-multiply charged ions, or coupling voltage losses. In summary, the reason for the lower anode efficiencies at high magnetic fields was lower thrusts, even when data suggested that higher magnetic fields were producing higher beam ion currents.
The reason for the anode efficiency trends with discharge power can be better understood by plotting anode efficiency as a function of discharge current, shown in Figure 8 for the v2 thruster operating at high anode efficiencies. As the figure shows, anode efficiencies achieved peak values between 50 and 70 A for all discharge voltages tested. At discharge currents below this peak value range, anode efficiencies decreased with decreasing discharge current because electron and neutral number densities within the discharge channel were likely too low to support efficient ionization of the propellant. This also occurred during operation at high magnetic field strengths, as shown in Figure 9 for the laboratory model thruster. However, at discharge currents above 50 to 70 A for operation of the v2 thruster at high anode efficiencies, anode efficiencies decreased with increasing current likely because charged particle and neutral number densities within the discharge channel were too high and this led to enhanced electron mobility to the anode. For the laboratory model thruster at high magnetic fields, anode efficiencies either continued to increase with increasing discharge current or achieved plateau values for discharge voltages 300 V. It is speculated that this was due to the higher magnetic fields, which led to a higher Hall parameter and therefore reduced electron mobility and diffusion to the anode. This reduction of electron current to the anode at high magnetic fields is likely the reason that the laboratory model thruster was able
Figure 8.—Anode efficiency as a function of discharge current at various
discharge voltages for the NASA-457M v2 during operation in high anode efficiency mode.
0.55
0.57
0.59
0.61
0.63
0.65
0.67
0.69
0.71
0.73
10 30 50 70 90 110
Anode Efficiency
Discharge Current, A
500 V
400 V
300 V
250 V
200 V

NASA/TM—2012-217711 11
Figure 9.—Anode efficiency as a function of discharge current at various
discharge voltages for the laboratory model NASA-457M during operation with high magnetic fields. Data are from References 7 and 8.
to sustain a lower discharge current for a given anode mass flow at discharge currents 60 A than that of the v2 thruster at lower magnetic fields, as shown in Figure 7. The behavior depicted in Figure 8 is not unique to the NASA-457M v2. It also occurred, for example, with the NASA-400M and BHT-20K at several discharge voltages (Refs. 17 and 18).
Cathode Performance
Cathode keeper voltage as a function of discharge current is plotted in Figure 10 for both operating modes. As the figure demonstrates, cathode keeper voltages were not sensitive to discharge voltages or operating mode and were within 2.1 to 6.2 V throughout the performance test. This was not the case for cathode-to-ground voltages as a function of discharge current for both operating modes, as shown in Figure 11. During operation with high anode efficiency, cathode potentials were always within 13 V of facility ground. However, during operation at high magnetic fields, cathode-to-ground voltage magnitudes increased dramatically, exceeding 30 V, and showed a sensitivity to discharge voltage.
The impacts of higher cathode-to-ground voltage magnitudes during high magnetic field operation has already been explored by Manzella et al., who investigated the impact of cathode mass flow on cathode-to-ground voltages and anode efficiencies for the laboratory model thruster (Ref. 7). They found that decreasing cathode mass flows and increasing discharge currents led to increasing cathode-to-ground voltage magnitudes. In addition to this, increased cathode-to-ground voltage magnitudes led to decreased anode efficiencies. They speculated that this was due to the development of large coupling voltage, which represented a thrust loss mechanism (Ref. 7).
A comparison of the cathode-to-ground voltages measured with the v2 thruster at high magnetic fields to those of the laboratory thruster uncovered two findings:
1. The increasing cathode-to-ground voltage with decreasing discharge current in Figure 11 was due to a
deceasing cathode mass flow. 2. Both thrusters exhibited similar cathode-to-ground voltage magnitudes along with similar sensitivities
to cathode mass flow and discharge current. This confirmed that both thrusters operated similarly during operation with high magnetic fields.
0.35
0.40
0.45
0.50
0.55
0.60
0.65
10 30 50 70 90 110
Anode Efficiency
Discharge Current, A
500 V
400 V
300 V
200 V

NASA/TM—2012-217711 12
Figure 10.—Cathode keeper voltage as a function of discharge current for the
NASA-457M v2 during operation in high anode efficiency and high magnetic field modes.
Figure 11.—Cathode-to-ground voltage as a function of discharge current for
the NASA-457M v2 during operation in high anode efficiency and high magnetic field modes. Cathode mass flows were 8 percent of the anode mass flows.
0
1
2
3
4
5
6
7
10 30 50 70 90 110
Cathode Keeper Voltage, V
Discharge Current, A
High Anode Efficiency
High Magnetic Field
‐35
‐30
‐25
‐20
‐15
‐10
‐5
0
10 30 50 70 90 110
Cathode‐to‐Ground Voltage, V
Discharge Current, A
High Anode Efficiency
200 V ‐High Magnetic Field
400 V ‐High Magnetic Field

NASA/TM—2012-217711 13
It was unclear, however, why the cathode-to-ground voltage sensitivity to cathode flow and discharge current changed so dramatically between the two operating modes. To uncover the root cause, the axial magnetic field strength in the immediate vicinity of the centrally-mounted cathode was measured as a function of the peak radial magnetic field along the discharge channel centerline. The axial magnetic fields in the vicinity of the cathode in the v2 and laboratory model thrusters were found to be directly proportional to the radial field in the discharge channel and nearly identical for the two thrusters. More importantly, this axial magnetic field strength at the cathode assembly exit plane was 65 percent of the peak radial magnetic field along the discharge channel centerline. When the v2 thruster was operated with high anode efficiencies, the axial magnetic field at the cathode assembly exit plane was significantly less than that during high magnetic field operation. In addition to this, the axial magnetic field increased with increasing axial distance from the cathode, achieving a peak value at about 4 cm downstream of the cathode assembly exit plane of both thrusters that was 20 to 30 percent larger than that at the cathode assembly exit plane.
The impact of these strong axial magnetic fields in the vicinity of the cathode is speculated here. The cathode provides electrons to the discharge channel for ionization, ion acceleration, and neutralization of the outgoing ion beam. Positive potential gradients in the vicinity of the cathode assist with transporting electrons to the discharge and ion beam. Strong axial fields at the cathode can impede electron transport to either discharge or outgoing ion beam because electrons become trapped along magnetic field lines. Potential gradients (and therefore coupling voltages) must increase with increasing axial magnetic field strength to enable the required electron transport. At high cathode mass flows, however, increased electron-neutral collisions improve electron mobility to the discharge and ion beam, reducing coupling voltages, and therefore cathode-to-ground voltage magnitudes.
The impact on coupling voltage is important because it is a thrust loss mechanism. And in the prior section, it was determined that the lower anode efficiencies of high magnetic field operation were due largely to lower measured thrusts. So quantifying its impact on thrust could give insight to the cause of the reduced thrust at high magnetic fields. Unfortunately, this effect was not studied in detail during this performance test. However, for one operating point at high magnetic field strength (i.e., for a discharge current and voltage of 50 A and 400 V, respectively), increasing the cathode flow decreased the cathode-to-ground voltage magnitude by 10 V to a level that was comparable to that of high anode efficiency operation. This cathode-to-ground voltage magnitude decrease increased the thrust by about 2 percent. However, this thrust improvement was still 10 percent lower than that measured during high anode efficiency operation. This datum suggests that while coupling voltage did play a role in reducing thrust during high magnetic field operation, it did not account for all of the disparity. To fully account for the thrust disparity, the contributions of multiply charged ions and ion beam divergence to thrust losses would have to be measured.
Overall Thruster Performance
Thrust and thrust-to-power as a function of total thruster input power are plotted in Figures 12 and 13, respectively, for the v2 thruster operating with high anode efficiency. The uncertainty in total power and thrust-to-power for all results reported herein were estimated to be 0.3 and 2.0 percent, respectively, of the indicated values. The peak thrust demonstrated by the NASA-457M v2 was 2.3 N and this occurred at a total thruster input power of 50.0 kW. The thrust was nonlinear as a function of total input power at the higher power levels at each discharge voltage, which was unlike the laboratory model thruster operating with high magnetic fields (Refs. 7 and 8). This was because the total input power was dominated by discharge power. The cause for the nonlinear behavior of thrust as a function of discharge current for a given discharge voltage has already been discussed (see the discussions for Figs. 6 and 7). As shown in Figure 13, the thruster demonstrated a thrust-to-power range of 76.4 mN/kW at low power to 46.1 mN/kW at full power.

NASA/TM—2012-217711 14
Figure 12.—Thrust as a function of total thruster input power at various discharge
voltages for the NASA-457M v2 thruster operating with high anode efficiency.
Figure 13.—Thrust-to-power as a function of total thruster input power at various
discharge voltages for the NASA-457M v2 thruster operating with high anode efficiency.
Specific impulse as a function of total thruster input power is shown in Figure 14 for the NASA-
457M v2 thruster operating with high anode efficiency. The uncertainty in specific impulse was estimated to typically be 2.3 percent of the indicated value. Direct comparisons with the laboratory model thruster were not possible because the laboratory model thruster was operated at fixed cathode flows rather than the 8 percent of anode mass flow used by the v2 thruster. As shown in Figure 14, the v2 thruster demonstrated specific impulse range of 1420 to 2740 s. The figure also shows that the v2 thruster was able to operate at a specific impulse of about 2000 s with a discharge voltage of only 300 V. This is significant because the HEFT trade studies baselined a thruster specific impulse of about 2000 s and lower discharge voltages are typically thought to lead to longer thruster service life capability (Ref. 2).
0
500
1000
1500
2000
2500
0 10,000 20,000 30,000 40,000 50,000
Thrust, m
N
Total Input Power, W
200 V
250 V
300 V
400 V
500 V
45
50
55
60
65
70
75
80
0 10,000 20,000 30,000 40,000 50,000
Thrust‐to‐Power, m
N/kW
Total Input Power, W
200 V
250 V
300 V
400 V
500 V

NASA/TM—2012-217711 15
Figure 14.—Specific impulse as a function of total thruster input power at
various discharge voltages for the NASA-457M v2 thruster operating with high anode efficiency.
Figure 15.—Thrust efficiency as a function of total thruster input power at
various discharge voltages for the NASA-457M v2 thruster operating with high anode efficiency.
The thrust efficiency as a function of total thruster input power is shown in Figure 15 for the
NASA-457M v2 thruster operating with high anode efficiency. The uncertainty in thrust efficiency was estimated to typically be 4.2 percent of the indicated value. As before, direct comparisons with the laboratory model thruster were not possible because it was operated at fixed cathode flows rather than the 8 percent of anode mass flow used by the v2 thruster. Regardless, thrust efficiency is dominated by anode performance, and anode efficiencies comparisons were made between the two thrusters in an earlier section. Thrust efficiencies for the v2 thruster varied from a low of 0.51 at low power to 0.66 at 30 kW with a discharge voltage of 500 V. For a discharge voltage of 300 V, where specific impulses would be about 2000 s, thrust efficiencies varied from 0.57 to 0.63.
1200
1400
1600
1800
2000
2200
2400
2600
2800
0 10,000 20,000 30,000 40,000 50,000
Specific Im
pulse, s
Total Input Power, W
500 V
400 V
300 V
250 V
200 V
0.45
0.50
0.55
0.60
0.65
0.70
0 10,000 20,000 30,000 40,000 50,000
Thrust Efficiency
Total Input Power, W
500 V
400 V
300 V
250 V
200 V

NASA/TM—2012-217711 16
Conclusions
An excellent thruster candidate for a solar electric propulsion system that supports human exploration missions is the 50 kW-class NASA-457M Hall thruster. A laboratory model version had been successfully designed, built, and extensively tested, and the successful test campaign led to the development of a higher fidelity version of this thruster, labeled the NASA-457M v2. Testing of the NASA-457M v2 was re-initiated last fiscal year. Performance test results were reviewed in this report.
The development goal for the NASA-457M v2 was to advance its technology readiness level to 4/5. The higher fidelity thruster retained the same critical discharge chamber dimensions, however the magnetic circuit was designed for improved performance and field symmetry. A laboratory model hollow cathode assembly was used for all performance testing reported herein.
The thruster was mounted in the main volume of NASA GRC’s Vacuum Facility 5. Tank pressures never exceeded 4.0×10⁻³ Pa (3.0×10⁻⁵ torr) during performance testing. Xenon was fed to the thruster through calibrated mass flow controllers and power was provided by commercially available power supplies. A null-type inverted pendulum thrust stand was used to measure thrusts.
Thruster discharge power was varied from 5 to 50 kW over discharge voltage and current ranges of 200 to 500 V and 15 to 100 A, respectively. Anode efficiencies during high efficiency operation for the NASA-457M v2 varied from 0.56 to 0.71. The peak efficiency was similar to that of other state-of-the-art high power Hall thrusters, but outperformed these other thrusters at lower discharge voltages. A comparison of the v2 and laboratory model thruster anode efficiencies showed two differences: 1) the v2 thruster significantly outperformed the laboratory model thruster; and 2) the v2 thruster exhibited a decreasing efficiency with increasing power at high discharge powers.
The main reason for the anode efficiency differences between the two thruster versions was differences in how they were operated. The laboratory model thruster was operated with a nearly constant peak centerline radial magnetic field. During v2 thruster testing, two stable discharge modes of operation were found. One was at low magnetic field strengths, which produced high anode efficiencies, and the other at high magnetic fields. When the v2 thruster was operated at a constant peak radial magnetic field that was 75 percent that of the laboratory model thruster, anode efficiencies decreased between 0.05 and 0.11, with the performance of the v2 thruster approaching that of the laboratory model. This indicated that anode performance between the two thruster versions was actually quite similar and that the NASA-457M v2 could be operated at lower magnetic fields to achieve more optimal anode efficiencies than had been done in the past. The reason for the lower anode efficiencies at high magnetic fields was that operation in this mode produced lower thrusts, even when the data suggested that higher magnetic fields were producing higher beam ion currents. This suggests that other thrust loss mechanisms are becoming significant during operation with high magnetic fields, such as beam divergence, the ratio of multiply charged ions, or coupling voltage losses.
The anode efficiency trends with discharge power for high anode efficiency operation were a function of discharge current. Anode efficiencies achieved peak values between 50 and 70 A for all discharge voltages tested. At discharge currents above peak values, anode efficiencies decreased with increasing current because charged particle and neutral number densities within the discharge channel were too high and this led to enhanced electron mobility to the anode. The laboratory model thruster did not exhibit this trend likely because it was operated at a high magnetic field strength, and therefore a reduced electron mobility and diffusion to the anode.
Cathode keeper voltages were not sensitive to discharge voltages or mode of operation and were within 2.1 to 6.2 V throughout the performance test. During operation with high anode efficiency, cathode potentials were always within 13 V of facility ground. However, during operation at high magnetic fields, cathode-to-ground voltage magnitudes increased dramatically, exceeding 30 V, which was similar to the laboratory model thruster behavior. The root cause was the axial magnetic field strength in the immediate vicinity of the centrally-mounted cathode, which were found to be directly proportional to the radial field in the discharge channel and nearly identical for the two NASA-457M thrusters. More importantly, this axial magnetic field strength was 65 percent of the peak radial magnetic field along the discharge channel

NASA/TM—2012-217711 17
centerline. The speculated impact of these strong axial magnetic fields in the vicinity of the cathode was to increase coupling voltages and, therefore, decrease thrust. Test data suggested that this thrust loss was indeed occurring, however, it did not fully account for the lower thrust during operation with high magnetic fields.
The peak thrust demonstrated by the NASA-457M v2 was 2.3 N at a total thruster input power of 50.0 kW. The thruster also demonstrated a thrust-to-power range of 76.4 mN/kW at low power to 46.1 mN/kW at full power and a specific impulse range of 1420 s to 2740 s. It was able to operate at a specific impulse of about 2000 s with a discharge voltage of only 300 V. This is significant because the HEFT trade studies baselined a thruster specific impulse of about 2000 s and lower discharge voltages are typically thought to lead to longer thruster service life capability. For a discharge voltage of 300 V, thrust efficiencies varied from 0.57 to 0.63.
These performance test results have shown that the NASA-457M v2 thruster is a potential candidate for future high power manned missions. This thruster design, or a derivative of it, could provide NASA with a potential head start for future human space exploration.
References
1. “NASA Exploration Systems Mission Directorate presentation, Human Space Exploration Summary,” http://www.nasa.gov/exploration/new_space_enterprise/home/heft_summary.html, January 2011.
2. Mercer, C.R., et al., “Benefits of Power and Propulsion Technology for a Piloted Electric Vehicle to an Asteroid,” AIAA Paper 2011-7252, September 2011.
3. Capadona, L.A., et al., “Feasibility of Large High-Powered Solar Electric Propulsion Vehicles: Issues and Solutions,” AIAA Paper 2011-7251, September 2011.
4. Brophy, J.R., et al., “300-kW Solar Electric Propulsion System Configuration for Human Exploration of Near-Earth Asteroids,” AIAA Paper 2011-5514, August 2011.
5. Hofer, R.R. and Randolph, T.M., “Mass and Cost Model for Selecting Thruster Size in Electric Propulsion Systems,” AIAA Paper 2011-5518, August 2011.
6. Dunning, J. and Sankovic, J., “NASA’s Electric Propulsion Program,” AIAA Paper 2000-3145, July 2000.
7. Manzella, D.M., Jankovsky, R., and Hofer, R.R., “Laboratory Model 50 kW Hall Thruster,” AIAA Paper 2002-3676, July 2002.
8. Manzella, D.M., “Scaling Hall Thrusters to High Power,” Ph.D. Dissertation, Department of Mechanical Engineering, Stanford University, Stanford, CA, June 2005.
9. Jankovsky, R.S., et al., “NASA’s Hall Thruster Program 2002,” AIAA Paper 2002-3675, July 2002. 10. Jacobson, D.T. and Manzella, D.M., “50 kW Class Krypton Hall Thruster Performance,”
AIAA Paper 2003-4550, July 2003. 11. Manzella, D. and Jacobson, D., “Investigation of Low-Voltage/High-Thruster HALL Thruster
Operation,” AIAA Paper 2003-5004, July 2003. 12. Jacobson, D.T., et al., “NASA’s 2004 Hall Thruster Program,” AIAA Paper 2004-3600, July 2004. 13. Kamhawi, H., et al., “Overview of Hall Thruster Activities at NASA Glenn Research Center,”
32nd International Electric Propulsion Conference, IEPC Paper 2011-339, September 2011. 14. Hofer, R.R., Peterson, P.Y., and Gallimore, A.D., “A High Specific Impulse Two-Stage Hall
Thruster with Plasma Lens Focusing,” IEPC Paper 01-036, 27th International Electric Propulsion Conference, October 2001.
15. Hofer, R.R., Gallimore, A.D., “The Role of Magnetic Field Topography in Improving the Performance of High-Voltage Hall Thrusters,” AIAA-2002-4111, July 2002.
16. Kamhawi, H., et al., “Performance Evaluation of the NASA-300M 20 kW Hall Effect Thruster,” AIAA Paper 2011-5521, August 2011.

NASA/TM—2012-217711 18
17. Peterson, P.Y., Jacobson, D.T., Manzella, D.H., and John, J.W. “The Performance and Wear Characterization of a High-Power High-Isp NASA Hall Thruster,” AIAA Paper 2005-4243, July 2005.
18. Szabo, J., et al., “A Commercial One Newton Hall Effect Thruster for High Power In-Space Missions,” AIAA Paper 2011-6152, August 2011.
19. Kim, V., “Main Physical Features and Processes Determining the Performance of Stationary Plasma Thrusters,” Journal of Propulsion and Power, vol. 14, no. 5, September-October 1998, pp 736-743.
20. Huang, W., et al., “Ion Current Density Study of the NASA-300M and NASA-457M v2 Hall Thrusters,” to be presented at the 48th Joint Propulsion Conference and Exhibit, July-August 2012.


REPORT DOCUMENTATION PAGE Form Approved OMB No. 0704-0188
The public reporting burden for this collection of information is estimated to average 1 hour per response, including the time for reviewing instructions, searching existing data sources, gathering and maintaining the data needed, and completing and reviewing the collection of information. Send comments regarding this burden estimate or any other aspect of this collection of information, including suggestions for reducing this burden, to Department of Defense, Washington Headquarters Services, Directorate for Information Operations and Reports (0704-0188), 1215 Jefferson Davis Highway, Suite 1204, Arlington, VA 22202-4302. Respondents should be aware that notwithstanding any other provision of law, no person shall be subject to any penalty for failing to comply with a collection of information if it does not display a currently valid OMB control number. PLEASE DO NOT RETURN YOUR FORM TO THE ABOVE ADDRESS.
1. REPORT DATE (DD-MM-YYYY) 01-08-2012
2. REPORT TYPE Technical Memorandum
3. DATES COVERED (From - To)
4. TITLE AND SUBTITLE Performance Test Results of the NASA-457M v2 Hall Thruster
5a. CONTRACT NUMBER
5b. GRANT NUMBER
5c. PROGRAM ELEMENT NUMBER
6. AUTHOR(S) Soulas, George, C.; Haag, Thomas, W.; Herman, Daniel, A.; Huang, Wensheng; Kamhawi, Hani; Shastry, Rohit
5d. PROJECT NUMBER
5e. TASK NUMBER
5f. WORK UNIT NUMBER WBS 215133.05.02.03
7. PERFORMING ORGANIZATION NAME(S) AND ADDRESS(ES) National Aeronautics and Space Administration John H. Glenn Research Center at Lewis Field Cleveland, Ohio 44135-3191
8. PERFORMING ORGANIZATION REPORT NUMBER E-18416
9. SPONSORING/MONITORING AGENCY NAME(S) AND ADDRESS(ES) National Aeronautics and Space Administration Washington, DC 20546-0001
10. SPONSORING/MONITOR'S ACRONYM(S) NASA
11. SPONSORING/MONITORING REPORT NUMBER NASA/TM-2012-217711
12. DISTRIBUTION/AVAILABILITY STATEMENT Unclassified-Unlimited Subject Category: 20 Available electronically at http://www.sti.nasa.gov This publication is available from the NASA Center for AeroSpace Information, 443-757-5802
13. SUPPLEMENTARY NOTES
14. ABSTRACT Performance testing of a second generation, 50 kW-class Hall thruster labeled NASA-457M v2 was conducted at the NASA Glenn Research Center. This NASA-designed thruster is an excellent candidate for a solar electric propulsion system that supports human exploration missions. Thruster discharge power was varied from 5 to 50 kW over discharge voltage and current ranges of 200 to 500 V and 15 to 100 A, respectively. Anode efficiencies varied from 0.56 to 0.71. The peak efficiency was similar to that of other state-of-the-art high power Hall thrusters, but outperformed these thrusters at lower discharge voltages. The 0.05 to 0.18 higher anode efficiencies of this thruster compared to its predecessor were primarily due to which of two stable discharge modes the thruster was operated. One stable mode was at low magnetic field strengths, which produced high anode efficiencies, and the other at high magnetic fields where its predecessor was operated. Cathode keeper voltages were always within 2.1 to 6.2 V and cathode voltages were within 13 V of tank ground during high anode efficiency operation. However, during operation at high magnetic fields, cathode-to-ground voltage magnitudes increased dramatically, exceeding 30 V, due to the high axial magnetic field strengths in the immediate vicinity of the centrally-mounted cathode. The peak thrust was 2.3 N and this occurred at a total thruster input power of 50.0 kW at a 500 V discharge voltage. The thruster demonstrated a thrust-to-power range of 76.4 mN/kW at low power to 46.1 mN/kW at full power, and a specific impulse range of 1420 to 2740 s. For a discharge voltage of 300 V, where specific impulses would be about 2000 s, thrust efficiencies varied from 0.57 to 0.63. 15. SUBJECT TERMS Hall thruster; Stationary plasma thruster
16. SECURITY CLASSIFICATION OF: 17. LIMITATION OF ABSTRACT UU
18. NUMBER OF PAGES
26
19a. NAME OF RESPONSIBLE PERSON STI Help Desk (email:[email protected])
a. REPORT U
b. ABSTRACT U
c. THIS PAGE U
19b. TELEPHONE NUMBER (include area code) 443-757-5802
Standard Form 298 (Rev. 8-98)Prescribed by ANSI Std. Z39-18