Embed Size (px)
Citation preview

Performance Report
Trust Board Month 3 - June 2014

2
SECTION CONTENT PAGE
1 Executive Summary 3
2 TDA Accountability Framework Overview 4
3 Monitor Risk Assessment Overview 5
4
Areas of Escalation – A&E 6
Areas of Escalation – Infection Control 7
Areas of Escalation – Cancelled Operations 8
Areas of Escalation – RTT 9
Areas of Escalations – Cancer: Breast Symptomatic Two Week Waits
10
5 Divisional Performance Overview 11
6 Appendix-A : Trust Performance Framework Overview 14
CONTENTS

3
Responsiveness
RTT
A&E
Cancer Targets
Cancelled Ops
Learning Disabilities
Safe
IC: MRSA & C-Diff
VTE
Harm CAS Alerts
Never Events
SIs
Caring
FFT
Inpatients
Complaints Same Sex
Compliance
FFT
A&E
Effectiveness
Mortality
HSMR
Mortality HSMR
Weekend
Weekday Re-admissions
Mortality
SHMI
Well Led
Staff turnover
Staff Sickness
Vacancy Rate Staff
Appraisals
Agency and Bank
Usage
FFT
Response rates
1. Executive Summary - Key Priority Areas June 2014
This report is produced in line with the trust performance management framework which encompasses the NHS TDA and Monitor regulatory requirements. An overview of this is provided in appendix-A at the end of this report.
The above shows an overview of June 2014 performance for key areas within each domain of the NHS TDA Accountability Framework. These domains as per the direction of change by the NHS TDA correlate to those of the CQC intelligent monitoring framework.
The overview references where the trust may not be meeting 1 or more related targets. (Note Cancer RAG rating is for May 2014 as reported one month in arrears)

4
2. TDA Accountability Framework KPIs 2014/15: June 14 Performance (Page 1 of 1)
The trusts self-assessment against the NHS TDA Accountability framework in June 2014 is
as detailed above with a overall quality score of 5.
This places the trust under the category of low risk with no escalation, and under standard
oversight with NHS TDA.
1 2 3 4 5
Special
MeasuresIntervention
Standard
Oversight
Key: Quality/Excalation Score
Responsiveness Domain Effectiveness Domain
Metric Standard YTD May June Movement Metric Standard YTD May June Movement
Referral to Treatment Admitted 90% 90.30% 90.20% Hospital Standardised Mortality Ratio (DFI) 100 79.7 80.4 78.7
Referral to Treatment Non-Admitted 95% 97.70% Hospital Standardised Mortality Ratio - Weekday 100 86.2 86.2 86.2
Referral to Treatment Incomplete 92% 92.17% 92.60% Hospital Standardised Mortality Ratio - Weekend 100 90.8 90.8 90.8
Referral to Treatment Incomplete 52+ Week Waiters
0 3 4 Summary Hospital Mortality Indicator (HSCIC)
100 81 78
Diagnostic waiting times > 6 weeks 1% 0.62% 0.57% Emergency re-admissions within 30 days following an elective or emergency spell at the Trust
5% 3.4% 3.6% 3.2%
A&E All Types Monthly Performance 95% 94.57% 94.46% 95.89% Domain Score 5
12 hour Trolley waits 0 0 0 0
Urgent Ops Cancelled for 2nd time (Number) 0 0 0 0
Proportion of patients not treated within 28 days of last minute cancellation
0% 2.60% 1.50% 1.20% Caring Domain
Certification against compliance with requirements regarding access to health care for people with a learning disability
Compliant Yes Yes Yes
Metric Standard YTD May June Movement
Inpatient Scores from Friends and Family Test 60 63 62
Standard YTD April May Movement A&E Scores from Friends and Family Test 46 48 46
Two Week Wait Standard 93% 97.7% 97.7% 93.5% Complaints 96 103
Breast Symptom Two Week Wait Standard 93% 98.7% 98.7% 88.8% Mixed Sex Accommodation Breaches 0 0 0
31 Day Standard 96% 98.1% 98.1% 97.3% Domain Score 5
31 Day Subsequent Drug Standard 98% 100.0% 100.0% 100.0%
31 Day Subsequent Surgery Standard 94% 100.0% 100.0% 95.2% Well Led Domain
62 Day Standard 85% 85.3% 85.3% 92.2% Metric Standard YTD May June Movement
62 Day Screening Standard 90% 93.0% 93.0% 94.0% IP response rate from Friends and Family Test 30% 35.20% 37.60%
Domain Score 5 A&E response rate from Friends and Family Test 20% 9.30% 33.60%
NHS Staff Survey: Percentage of staff who would recommend the trust as a place of work
61% 61%
Safe Domain NHS Staff Survey: Percentage of staff who would recommend the trust as a place to receive treatment
67% 69&
Metric Standard YTD May June Movement Trust turnover rate 13% 12.30% 15.40%
Clostridium Difficile - Variance from plan 0 0 0 0 Trust level total sickness rate 3.50% 3.47% 3.58%
MRSA bactaraemias 0 2 1 1 Total Trust vacancy rate 11% 12.00% 12.28%
Never events 0 0 0 0 Temporary costs and overtime as % of total paybill 10.69% 7.90%
Serious Incidents 0 45 15 9 Percentage of staff with annual appraisal - Medical 85% 84.70% 84.90%
Percentage of Harm Free Care 95% 94.61% 94.73% Percentage of staff with annual appraisal - non-medical 85% 75.40% 73.30%
Medication errors causing serious harm 0 0 0 0 Domain Score 2
Overdue CAS alerts 0 1 1 1
Maternal deaths 1 0 0 0 Trust Overall Quality Score 5
VTE Risk Assessment 95% 96.40% 97.30%
Domain Score 4

5
3. Monitor Risk Assessment Framework KPIs 2014/15: June 14 Performance (Page 1 of 1)
June 2014 Performance against
the risk assessment framework is
as follows:
The trusts quality governance
rating is ‘Amber/Green’.
The trust CoSSR position is 3,
which rated as ‘Green’.
Areas of underperformance for
quality governance are:
• Cancer Waits- Breast Symptom
Two Week Wait Standard
Further details and actions to
address underperformance are
further detailed in the report.
*Cancer data is reported retrospectively
and is for the period April and May.
Metric Standard Weighting Score YTD May June Movement
Referral to Treatment Admitted 90% 1 0 90.30% 90.20%
Referral to Treatment Non-Admitted 95% 1 0 97.70%
Referral to Treatment Incomplete 92% 1 0 92.17% 92.60%
A&E All Types 4 Hour Standard Monthly Performance 95% 1 0 94.46% 95.89%
62 Day Standard 85% 1 0 84.4% 92.2%
62 Day Screening Standard 90% 1 0 93.0% 94.0%
31 Day Subsequent Drug Standard 98% 1 0 100.0% 100.0%
31 Day Subsequent Surgery Standard 94% 1 0 100.0% 95.2%
31 Day Standard 96% 1 0 98.1% 97.3%
Two Week Wait Standard 93% 1 0 97.7% 93.5%
Breast Symptom Two Week Wait Standard 93% 1 1 98.7% 88.8%
Metric Standard Weighting Score YTD May June Movement
Clostridium Difficile - Variance from plan 0 1 0 0 0 0
Certification of Compliance Leraning Disabilities:
Does the trust have a mechanism in place to identify and flag patients with
learning disabilities and protocols that ensure that pathways of care are
reasonably adjusted to meet the health needs of these patients?
Compliant Yes Yes Yes
Does the trust provide readily available and comprehensible information to
Compliant Yes Yes Yes
Does the trust have protocols in place to provide suitable support for family
carers who support patients with learning disabilitiesCompliant Yes Yes Yes
Does the trust have protocols in place to routinely include training on
providing healthcare to patients with learning disabilities for all staff?Compliant Yes Yes Yes
Does the trust have protocols in place to encourage representation of people
with learning disabilities and their family carers?Compliant Yes Yes Yes
Does the trust have protocols in place to regularly audit its practices for
patients with learning disabilities and to demonstrate the findings in routine
public reports?
Compliant Yes Yes Yes
Data Completeness Community Services:
Referral to treatment 50% 1 0 80% 80%
referral information 50% 1 0 90% 90%
treatment activity 50% 1 0 100% 100%
2 1
Outcomes
1 0
Trust Overall Quality Governance Score
AccessGreen <1.0
Amber Green= >1 and <2
Amber/Red = >2 and <4
Red= >4

6
4. Performance Areas of Escalation (Page 1 of 5 ) - A&E: 4 Hour Standard
Total time in A&E - 95% of patients should be seen within 4hrs Peer Performance – Quarter 1 2014-15
Lead
Director May June Movement 2014/2015 Target
Forecast July - 14
Date expected to meet standard
STG Croydon Kingston King’s College Epsom & St Helier
FA 94.46% 95.8% >= 95% G - 94.89.% 95.09% 95.45% 88.95% 96.46%
The ED target is that 95% or more of patients should be seen and discharged within 4 hours of attending the Emergency Department. The trust met the ED national standard of 95% with performance for all types in June at 95.8%. However, the trust did not meet the target for Q1 based on NTDA methodology (Q1 equates a 13 week period: March 31st to June 29th) with a performance of 94.89%. The trust met performance for actual quarter based on 1st April to 30th June at 95%. A factor affecting performance over the quarter is the change in reporting methodology for VCDU and PDU patients which took effect from May 2014 and has had a negative impact of between 1-1.5% in comparison to previous reporting methodology. Current priorities and actions to sustain and further improve performance to the national standard are as follows:
• The trust is continuing to be supported by the Emergency Care Intensive Support Team (ECIST) to implement the recommendations which developed over a number
of visits over the last 6 months focusing on improving ED patient flow and flow through the organisation (in and out). • Weekly recovery meetings with the CEO and Director of Delivery and Performance continue. This has identified further steps the trust can be taking to improve
performance. • Internal escalation processes to continue in July include:
• Every patient without a plan at 3hours escalated and acted upon • Every time department gets to a 2hour wait to be seen escalated • Every time more than 80 patients in the department escalated
• Formalised board rounds, to be attended and led by GM/SM/HoN on all occasions, to have documented actions and a clear escalation pathway post-12:45 for additional bed capacity requirements and other urgent actions/requirements
• The ED continues to focus on any improvements that can be made to the emergency / urgent pathways. This includes a review and continued development of the Rapid Assessment and Treatment Service (RATS) at the front door and changes to the triage service which have both improved the flow of patients. Changes to the shop floor leadership have now been established and further works continues with the teams to embed this. Work is still on-going to increase the use of the Amb Score for medically referred patients and work is continuing with the specialist teams to reduce delays. In addition to this a capacity review for mental health patients is to be undertaken in ED to ensure better/safer care and a reduction in mental health related breaches in ED.
Performance Overview by Type
ED MIU ED & MIU
(Type 1) (Type
3) (Type 1+3)
Month of June 95.4% 99.6% 95.8%
Quarter to date
(Q1) 94.4% 99.8% 95.00%
Year to date 94.4% 99.8% 95.00%
0
1000
2000
3000
4000
80%
85%
90%
95%
100%ED Q1 2014/15 - Performance by Week
Series2 Series1 Series3

7
3. Performance Areas of Escalation (Page 2 of 5 ) - Infection Control
MRSA Peer Performance – YTD June 2014
Lead
Director May June Movement 2014/2015 Target
Forecast July - 14
Date expected to meet standard
STG Croydon Kingston King’s College Epsom & St Helier
ML 1 1 0 G July- 14 1 0 0 0 0
In 2014/15 the Trust has a target of no more than 40 Cdiff incidents and zero tolerance against MRSA. In June there were 5 Cdiff incidents against a trajectory of 4 for the month. However, overall YTD the trust has had 11 incidences of C-Diff against a trajectory of 14. The trust has 1 case of MRSA infection in May and one in June and thus has breached the zero tolerance standard and 2 for the year. However, with the NTDA still applying the de minimis limit of 6, the trust is within threshold before a penalty score is applied. Performance will be monitored closely to ensure continued compliance.
C-Diff Peer Performance – YTD June 2014 (annual trajectory in brackets)
Lead
Director May June Movement 2014/2015 Target
Forecast July - 14
Date expected to meet standard
STG Croydon Kingston King’s College Epsom & St Helier
ML 3 5 40 G - 11 (40) 4 (17) 3(24) 24 (58) 11 (40)
0
1
2
Apr May Jun Jul Aug Sep Oct Nov Dec Jan Feb Mar
MRSA Incidences 2014/15
0
10
20
30
40
Apr May Jun Jul Aug Sep Oct Nov Dec Jan Feb Mar
Cumulative C-Diff Incidences vs Trajectory 2014/15
C-Diff Incidences 14/15 Trajectory

8
3. Performance Areas of Escalation (Page 3 of 5 ) - Cancelled Operations
Proportion of patients not treated within 28 days of last minute cancellation Peer Performance Comparison – Q1 2014/15
Lead
Director May June Movement 2014/2015 Target
Forecast July - 14
Date expected to meet standard
STG Croydon Kingston King’s College Epsom & St Helier
CC 1.5% 3.1% 0% G July - 14 7.1% 0% 0% 19.9% 0%
The national standard is that all patients whose operation has been cancelled for non clinical reasons should be treated within 28 days. The trust had 64 cancelled operations in June from 3862 elective admissions, 62 of whom were rebooked within 28 days. This accounts for 1.7% of all cancellations. In Quarter 1 there were 179 cancellations in total, and 1.5% (5) were not offered a binding date within 28 days. There were 2 breaches in June, one as a result of mislaid patient notes. The patient has since been given a new date for their procedure. The other breach occurred due to capacity issues and other patients taking clinical priority. This patient has also been give a new date for their operation. The trust pro-actively monitors its elective programme which includes all cancelled operations closely and prioritises them for re-booking. These are also reviewed with commissioners on a monthly basis.
0%
2%
4%
6%
8%
10%
12%
0
10
20
30
40
50
60
70
80
90
Oct-13 Nov-13 Dec-13 Jan-14 Feb-14 Mar-14 Apr-14 May-14
Cancelled Operations for non-clinical reasons Oct-13 to May-14
No. cancelled ops % not treated within 28 days Trend
9
3. Performance Areas of Escalation (Page 4 of 5 ) - RTT
Referral to Treatment - Admitted Peer Performance Comparison – Latest Published May 2014
Lead
Director May June Movement 2014/2015 Target
Forecast July – 14
Date expected to meet standard
STG Croydon Kingston King’s College Epsom & St Helier
DB 90.3% 90.2% 90% G - 90.3% 93.8% 91.6% 79.5% 90.6%
At the end of June there were 3 specialities which failed to meet the admitted standard of 90% and 6 specialties failed to meet the incomplete pathways standard of 92%.
Cardiology as mentioned in last months report will continue to be non-compliant in 2014-15, however the backlog will continue to significantly reduce as the recovery plan and planned additional long-waiter activity is implemented . This will continue to be reviewed with commissioners, and plans adapted accordingly. Key focus and pro-active management continues to be applied to all long waiters., with weekly RTT meetings reviewing all patients over 40 weeks and ensuring the trust does not have any 52+ week waiters, Monthly RTT compliance meetings chaired by an Executive Director continue to review RTT overall and to address issues of escalation from weekly meetings. In addition to this the group will review additional activity planned going forward as part of the national RTT resilience programme. At end of June the trust had 4 patients on incomplete non-admitted pathways waiting 52+ weeks as follows: • 1 General Surgery Patients • 1 Urology patient • 2 ENT patients Root cause analysis is currently being undertaken on the reason for the long wait and pro-active steps are being taken to get the patients booked for imminent treatment.
Referral to Treatment - Incomplete Peer Performance Comparison - Latest Published May 2014
Lead
Director May June Movement 2014/2015 Target
Forecast July - 14
Date expected to meet standard
STG Croydon Kingston King’s College Epsom & St Helier
DB 92.9% 92.6% 92% G - 92.9% 93.7% 94% 92.0% 93.9%
Performance by Treatment Function
Admitted
Performance Incomplete
Performance General Surgery 90.50% 86.0% Urology 90.00% 91.2% Trauma & Orthopaedics 91.70% 90.0% Ear, Nose & Throat (ENT) 86.90% 89.2% Ophthalmology 100.0% Oral Surgery 95.10% 99.1% Neurosurgery 91.70% 92.4% Plastic Surgery 90.90% 92.8% Cardiothoracic Surgery 75.00% 65.4% General Medicine 95.7% Gastroenterology 96.80% 94.5% Cardiology 75.30% 83.4% Dermatology 98.1% Thoracic Medicine 94.2% Neurology 100.00% 97.5% Rheumatology 94.6% Geriatric Medicine 97.0% Gynaecology 92.30% 94.2%
Other 96.50% 98.1%
Total 90.20% 92.60%
0
2000
4000Incomplete Pathways Backlog Profile : June 2013 vs June 2014
Jun-13 Jun-14

10
3. Performance Areas of Escalation (Page 5 of 5 ) - Cancer: Breast Symptom Two Week Wait Standard
Breast Symptom Two Week Wait Standard Peer Performance Latest Published Q4 2014-15
Lead
Director April May Movement 2014/2015 Target
Forecast June - 14
Date expected to meet standard
STG Croydon Kingston King’s College Epsom & St Helier
CC 98.7% 88.8% 93% G July- 14 98.6% 98.5% 92.0% 96.6% -
The trust failed to meet the 14 day breast symptomatic target in May with a performance of 88.8% against a target of 93%. This is the 1st time the trust has failed the target in 14 months. Reasons for underachievement of the target is two-fold and as follows: • Insufficient substantive breast capacity to accommodate the surge in referrals, with 2 consultants on maternity leave in the breast team. The majority of
additional capacity was provided with less than 48 hours, providing insufficient notice to patients. There were therefore a number of patients choosing to be seen outside of the 14 day target.
• Staffing issues in the TWR office – the office was understaffed due to the turnover of temporary staff members. This added administrative delays to contacting patients, again providing insufficient notice to patients. The reliance on temporary staffing has been addressed, with the recruitment of two further permanent members of staff.
0
50
100
150
200
250
82%
84%
86%
88%
90%
92%
94%
96%
98%
100%
No
. of
Pts
tre
ate
d
% P
erf
Breast Symptom Two Week Wait Standard Performance Apr-13 to May-14
No. of Pts treated Actual Perf Target

11
5. Divisional KPIs Overview 2014/15: June 14 Performance (Page 1 of 3)
95.2 95.2

12
5. Divisional KPIs Overview 2014/15: June 14 Performance (Page 2 of 3)

13
3. Divisional KPIs Overview 2014/15: May 14 Performance (Page 3 of 3)
Key Messages:
This section headed ‘Access’ indicates how effective the trust is at providing patients with the appointments and treatment they need and require in
accordance with the national standards and the NHS Constitution.
In June 44.6% of LAS arrivals to patient handover times were within 15 minutes against the target of 100%. SGH are not unusual in this regard as all
trusts within the sector are underperforming Performance against the 30 minute target is better than the month previous and has increased from
89.6% to 98.43%. There were no 60 minute breaches.
The trust will continue to monitor performance closely as fines are applied where patient handovers exceeds 30 and 60 minutes.
Prevention and education of PU’s is important to the trust and throughout 2014/2015, the trust aiming for zero tolerance of avoidable pressure ulcers.
In June there were 2 Grade 3 Pressure Ulcers and no Grade 4’s. The lowest number of Pus the trust has seen since April 2014. All grade 3 and 4
pressure ulcers acquired in our care are investigated as serious incidents, and a. full investigation and Root Cause Analysis is produced for each and
reviewed at the Pressure Ulcer Strategy group, chaired by the Deputy Chief Nurse.
There were 9 serious incidents reported in the month of June, , with all SIs in the month completed within deadline

14
The Performance Management Framework The trust is realigning its Performance Framework with the requirements of the NHS trust Development Authority (TDA) and Monitor. The performance report has been updated to cover the new requirements of the TDA Accountability Framework for trusts and to include greater visibility of performance at Divisional level, alongside trust wide aggregate performance. The TDA Accountability Framework The accountability framework covers three domains – Quality, Finance and Delivering Sustainability. A set of indicators has been identified in each domain and delivery will be evaluated against a threshold and aggregated for each domain. Performance against these indicators will determine a score for each domain. These domain scores in turn contribute towards an overall Escalation score for each trust. The trusts will be rated in one of five categories – Standard Oversight – The organisation has developed a sound FT application and received a ‘Good or Outstanding’ rating from CIH Standard Oversight: Limited or no delivery issues Intervention: The organisation has some delivery issues including clinical and/or financial challenges Intervention: The organisation has significant delivery issues clinical and/or financial challenges Special Measures: The organisation has significant delivery issues, including serious clinical and/or financial challenges or concerns. The trust is also required to sign a self certification on a monthly basis at Board level covering compliance with Monitor’s licence requirements and a set of Board Statements .
St George’s Healthcare NHS trust
Appendix.A – trust Performance Management Framework Overview 2014/15 (Page 1 of 4)
15
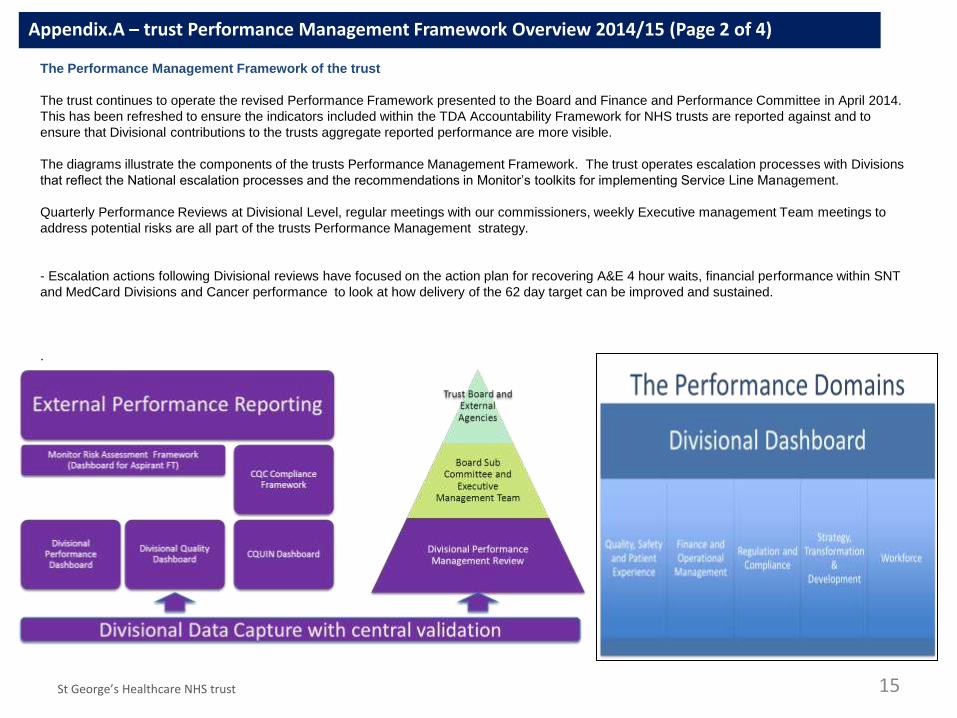
The Performance Management Framework of the trust
The trust continues to operate the revised Performance Framework presented to the Board and Finance and Performance Committee in April 2014.
This has been refreshed to ensure the indicators included within the TDA Accountability Framework for NHS trusts are reported against and to
ensure that Divisional contributions to the trusts aggregate reported performance are more visible.
The diagrams illustrate the components of the trusts Performance Management Framework. The trust operates escalation processes with Divisions
that reflect the National escalation processes and the recommendations in Monitor’s toolkits for implementing Service Line Management.
Quarterly Performance Reviews at Divisional Level, regular meetings with our commissioners, weekly Executive management Team meetings to
address potential risks are all part of the trusts Performance Management strategy.
- Escalation actions following Divisional reviews have focused on the action plan for recovering A&E 4 hour waits, financial performance within SNT
and MedCard Divisions and Cancer performance to look at how delivery of the 62 day target can be improved and sustained.
.
St George’s Healthcare NHS trust
Appendix.A – trust Performance Management Framework Overview 2014/15 (Page 2 of 4)

The Performance Management Framework of the trust
The performance management arrangements includes quarterly reviews for each Division which review and challenge
Divisional progress, with an opportunity for Divisions to share with the Executive team issues of concern.
The trust has extended this process by reporting divisional performance against the metrics within the TDA Accountability Framework, to the Finance and Performance committee on a monthly basis. The trust reports on the vast majority of these metrics within the existing quarterly review process. Work continues to ensure that the Divisional scorecards and the trust scorecard fully reflect all the metrics within the TDA Accountability Framework.
Example 1 Monthly Divisional Reports
A score and RAG rating is applied to the domains within each Division by the Senior Management Team, who use the information provided at the reviews to make a judgement about the Divisions performance and determine where remedial action plans and escalation is required. Work continues to apply a scoring system to our performance framework at Divisional level and to roll that up into an integrated scorecard for each Division and for the trust on a monthly basis.
16
Appendix.A – trust Performance Management Framework Overview 2014/15 (Page 3 of 4)

17
The Accountability Framework
The TDA will assess delivery across three domains as
shown in the diagram :
- Quality
- Finance
- Sustainability
Against each domain trusts will report against a series of
metrics. These are listed in detail in Section 8 : definitions
and metrics
For 2014/15 trusts will be scored using escalation levels 1
to with one being the highest risk rating and 5 the lowest.
This is being done to ensure consistency with the CQC’s
approach to assessing risk.
The trust is also required to sign off self certifications on a
monthly basis at Board level covering progress against FT
milestones, and compliance with Monitor’s license
requirements
St George’s Healthcare NHS trust
1. Special Measures
2. Intervention due to significant delivery issues
3. Intervention due to some delivery issues
4. Standard Oversight- limited or no delivery issues
5. Standard Oversight : Organisation has a developed a sound FT application and received a ‘Good or Outstanding rating from CIH.
Moderation including CQC Rating warning
notices and third party report
Overall Escalation score (1 to 5)
Quality Score (1 to 5)
Finance RAG Assessment
Sustainability Score (1-5)
Caring Score (1-5)
Effective Score (1 to 5)report
Responsive Score (1 to 5)
Safe Score (1 to 5)
Well-led (1to 5)
Key Elements of the Oversight Model
Appendix.A – trust Performance Management Framework Overview 2014/15 (Page 4 of 4)