Embed Size (px)
Citation preview
PERFORMANCE OF URBAN STORMWATER DRAINAGE SYSTEM THROUGH DRY DETENTION POND
(CASE STUDY: KOTA DAMANSARA, SELANGOR)
By
LIEW YUK SAN
Thesis submitted in fulfilment of the requirements for the degree of Master of Science
JULY 2009

ii
ACKNOWLEDGEMENT
First and foremost, I would like to convey my deepest appreciation to my supervisor,
Professor Dr. Aminuddin Ab. Ghani, Deputy Director of River Engineering and
Urban Drainage Research Centre (REDAC) for his technical assistance, guidance
with patience and encouragement throughout my research for 2 years. Apart from
that, I would like to thank my co-supervisor, Professor Dr. Nor Azazi Zakaria who is
also the Director of REDAC for his valuable comments.
Besides that, I would like to extent my gratitude to Ir. Hj. Ahmad Jamaluddin
Shaaban, Director-General of National Hydraulic Research Institute of Malaysia
(NAHRIM), Ir. Dr. Salmah Zakaria, the former Director-General of NAHRIM, Mrs.
Hajah Zalilah Selamat, Senior Researcher from River Research Center, Dr.
Mohamed Roseli Zainal Abidin and Mr. Tan Teow Soon, the former Head of
Hydraulic Engineering Division as well as Tn. Hj. Abd. Jalil Hassan, the former
Senior Researcher for their guidance throughout the project and my colleagues in
River Research Centre, NAHRIM for their support and involvement in this study.
Not to left out my sincere thanks to all the technical team in REDAC especially Mr
Chang Chun Kiat for his assistance particularly in information searching.
Last but not least, special thanks are due to my beloved parent and my siblings for
their warmest care, patience, understanding and support as well as words of
encouragement which made this research possible and complete finally after 2 years.

TABLE OF CONTENTS
Chapter Title Page
iii
ACKNOWLEGDEMENT ii
TABLE OF CONTENTS iii
LIST OF FIGURES viii
LIST OF TABLES xvi
LIST OF ABBREVIATIONS xx
LIST OF SYMBOLS xxii
ABSTRAK xxiv
ABSTRACT xxvi
CHAPTER ONE : INTRODUCTION
1
1.1 Background 1
1.2 Research Objectives 5
1.3 Research Scopes 5
1.4 Research Needs 10
1.5 Thesis Structure 11
CHAPTER TWO : URBAN DRAINAGE SYSTEM
12
2.1 Background 12
2.2 Effects of Urbanization to Drainage 16
2.3 Urban Drainage System in Malaysia 22
2.4 Best Management Practices (BMPs) 25
2.4.1 Dry Detention Pond 29
2.4.2 Extended Detention Pond 29
2.4.3 Wet Detention Pond 31
2.5 Modelling of Drainage System 32
2.6 The Importance of Numerical Modelling 36
2.7 Model Selection and Modelling Approaches 38
2.7.1 Infiltration Loss Models 40
2.7.1.1 Horton Equation 41
2.7.1.2 Green Ampt Model 42

TABLE OF CONTENTS
Chapter Title Page
iv
2.7.1.3 SCS Method 43
2.7.2 Evaporation Loss 45
2.7.3 Overland Flow Modelling 46
2.7.3.1 Time-Area Method 46
2.7.3.2 Linear and Nonlinear Reservoir Representation 48
2.7.3.3 Muskingum Routing Approach 49
2.7.4 Modelling of Pipe and Channel Flow 50
2.7.4.1 Steady Flow Model 51
2.7.4.2 Time-Lag Method 52
2.8 Model Validation 52
2.9 Model Calibration 52
2.9.1 Manning’s Roughness Coefficient 54
2.9.2 Discharge 54
2.9.3 Geometry 55
2.10 Model Verification 55
2.11 Overseas Case Studies 56
2.11.1 United Kingdom 56
2.11.2 Hong Kong 65
2.11.3 Dhaka, Bangladesh 68
2.12 Summary 74
CHAPTER THREE : RESEARCH METHODOLOGY
75
3.1 Introduction 75
3.2 Catchment Hydrologic and Hydraulic Parameter 77
3.2.1 Hydrologic Parameter 77
3.2.1.1 Contour and Catchment Slope 77
3.2.1.2 Landuse 79
3.2.1.3 Hydrologic Soil Group 82
3.2.1.4 Soil Type 83
3.2.1.5 Satellite Images 86

TABLE OF CONTENTS
Chapter Title Page
v
3.2.1.6 Rainfall 88
3.2.1.6.1 Hydrologic Analysis 92
3.2.1.6.2 Intensity-Duration-Frequency Curve
95
3.2.2 Hydraulic Parameter 99
3.2.2.1 River System 99
3.2.2.2 Drainage System 100
3.2.2.3 Water Depth 101
3.2.2.4 Velocity 104
3.3 Dry Detention Pond Designed Capacity 107
3.4 Summary 107
CHAPTER FOUR : DEVELOPMENT OF URBAN DRAINAGE MODEL
108
4.1 Introduction 108
4.2 Urban Drainage Model for Kota Damansara 108
4.3 Data Input 109
4.3.1 Hydrologic Data (Rainfall Data) 109
4.3.1.1 Distribution of Sub-catchment 110
4.3.1.2 Determination of Curve Number 112
4.3.1.3 Time of Concentration (tc) 114
4.3.1.4 Area Reduction Factor for Catchment 115
4.3.2 Hydraulic Data 116
4.3.2.1 Hydraulic and River System Profile 116
4.3.2.2 Manning’s Roughness Coefficient 120
4.4 Summary 120
CHAPTER FIVE : MODEL CALIBRATION
121
5.1 Introduction 121
5.2 Calibration of Hydrologic Model 121
TABLE OF CONTENTS
Chapter Title Page
vi
5.2.1 Soil Antecedent Moisture Content 123
5.2.2 Curve Number, CN for Landuse and Hydrologic Soil Group
127
5.2.3 Hydrology Loss Method 131
5.2.4 Rainfall Intensity Intervals 135
5.3 Calibration of Hydraulic Model 138
5.3.1 Drainage Properties 138
5.3.2 Culvert Property 142
5.4 Statistical Analysis 146
5.4.1 Two-Sample t-test and Regression Analysis 146
5.5 Calibrated Model 148
5.6 Summary 151
CHAPTER SIX : MODEL VERIFICATION
152
6.1 Introduction 152
6.2 Model Verification 152
6.2.1 Selection of Rainfall Case 152
6.2.2 Verification Processes 155
6.3 Statistical Analysis 159
6.3.1 Two Sample t-test and Regression Analysis 159
6.4 Summary 161
CHAPTER SEVEN : RESULTS AND DISCUSSIONS
162
7.1 Introduction 162
7.2 Design Rainfall Simulation 162
7.3 Performance of the Existing Dry Detention Pond 167
7.4 Effects of Landuse Changed 170
7.5 Summary 178
CHAPTER EIGHT : CONCLUSIONS AND RECOMMENDATIONS 181

TABLE OF CONTENTS
Chapter Title Page
vii
8.1 Conclusions 181
8.2 Recommendations for Future Study 182
REFERENCES 183
LIST OF PUBLICATIONS
APPENDICES
Appendix A USDA Textural Triangle
Appendix B Field Infiltration Test Procedures and Methods
Appendix C Annual Maximum Rainfall for Various Duration at DID Ampang (1970 to 2007)
Appendix D Longitudinal Section of River in Dry Detention Pond
Appendix E Plan View of the Overall Cross-Section along the Dry Dentention Pond
Appendix F Survey Plan for Main Drainage Sump in Section 7, 10 and 11
Appendix G Survey Plan for Main Drainage Sump in Section 5 and 6
Appendix H Drainage Profile
Appendix I Weighted CN and Catchment Slope for Sub-catchment with Different Hydrologic Soil Groups under AMC III
Appendix J Calculation of Time of Concentration Using Various Methods
Appendix K Two-Sample T-Test and CI and Regression Analysis: Observed versus Simulated Water Depth and Flow for Rainfall Event on 20 October 2007
Appendix L Two-Sample T-Test and CI and Regression Analysis: Observed versus Simulated Water Depth and Flow for Rainfall Event on 29 November 2007
Appendix M Two-Sample T-Test and CI and Regression Analysis: Observed versus Simulated Water Depth and Flow for Rainfall Event on 26 February 2006
Appendix N Two-Sample T-Test and CI and Regression Analysis: Observed versus Simulated Water Depth and Flow for Rainfall Event on 9 September 2006
Appendix O Two-Sample T-Test and CI and Regression Analysis: Observed versus Simulated Water Depth and Flow for Rainfall Event on 19 March 2008

LIST OF FIGURES
Figures Title Page
viii
1.1 Flooding Problems in Malaysia
2
1.2 Degradation of Water Quality
2
1.3 Erosion and Sedimentation Problem in Malaysia
2
1.4 Location of Study Area
6
1.5 Location of Dry Detention Pond
7
1.6 Condition of Dry Detention Pond during Dry Season
8
1.7 Condition of Dry Detention Pond after Storm Event
8
1.8 Condition at Pond Outlet/Culvert Inlet during Dry Season
9
1.9 Condition at Pond Outlet/Culvert Inlet after Storm Event
9
2.1 Minoan Stone Drain at Palace City of Knossos
13
2.2 The Roman Cistern in Fermo, Italy
13
2.3 Outfall of the Cloaca Maxima
14
2.4 View of the Interior of the Cloaca Maxima
14
2.5 Hydrologic Cycle with Global Annual Average Water Balance Given in Units Relative to a Value of 100 for the Rate of Precipitation on Land
17
2.6 Conceptual Changes in Hydrograph Following Urbanization
19
2.7 Wetland at Putrajaya
24
2.8 Regional Detention Pond in Kota Warisan, Bandar Baru Salak Tinggi, Selangor
24
2.9 Swales in University Science of Malaysia, Engineering Campus, Penang
25
2.10 Porous Pavement for Parking Area, Taman Botani, Putrajaya
25
2.11 Typical Dry Detention Pond
29
2.12 Typical Extended Detention Pond
30
2.13 Dry Extended Detention Pond with Shallow Marsh
31
2.14 Typical Layout of a Wet Detention Pond
32
2.15 Time-Area Method
48

LIST OF FIGURES
Figures Title Page
ix
2.16 Location of the Upper Rea Catchment Used as the Pilot Study Area
58
2.17 Location of Waseley Rain Gauge and Longbridge Level Gauge Used to test the SSRM
60
2.18 Predicted Compared to Observed River Level at Longbridge Level Gauge during the 20th July 2007 Rainfall Event
60
2.19 Predicted Flood for River Rea
61
2.20 Predicted Increases of River Rea Level under Different Scenarios
63
2.21 Predicted Increase in the Extend of Predicted River Flooding at the Downstream End of Hanging Lane Brook
64
2.22 Results of MIKE 21 Overland Flow Simulation around Longbridge Lane for the 20th July 2007 Flood Event
65
2.23 Hong Kong DMP with 8,500 Manholes Node
68
2.24 The Methodology Adopted for Dhaka City Urban Drainage Model
70
2.25 Sketch of the Connection between the Streets and the Pipe System for Dhaka Drainage System
71
2.26 Digital Elevation Model of the Segunbagicha Khal Catchment
72
2.27 Comparison between Simulated and Observed Flooded Locations in Segunbagicha Khal Catchment
73
3.1 Overall Research Methodology
76
3.2 Data Processing Flow Chart
77
3.3 Contour and River System within Study Area
78
3.4 Contour Generation from LiDAR Image
78
3.5 Landuse in 2002 within Catchment Area
80
3.6 Landuse in 2004 within Catchment Area
81
3.7 Landuse within Catchment Area using QuickBird Image 82
3.8 Hydrologic Soil Maps
83
3.9 Soil Infiltration Test on 11 June 2007
84

LIST OF FIGURES
Figures Title Page
x
3.10 Point of Soil Investigation
84
3.11 Soil Investigation Test on 11 November 2008
85
3.12 QuickBird Image for Kota Damansara
87
3.13 LiDAR Image of Kota Damansara
88
3.14 Location of Rain Gauge, Water Level Gauge and Area-Velocity Meter Solar Panel at Dry Detention Pond Outlet/Culvert Inlet
89
3.15 Daily Rainfall Events for the Year of 2006
90
3.16 Daily Rainfall Events for the Year of 2007
90
3.17 Daily Rainfall Events for the Year of 2008
91
3.18 Distribution of Rainfall Events from February 2006 to June 2008
91
3.19 Hydrolograph for Rainfall Event on 26 February 2006
93
3.20 Hydrolograph for Rainfall Event on 9 September 2006
94
3.21 Hydrolograph for Rainfall Event on 29 November 2007
94
3.22 Intensity-Duration-Frequency Curve at Rainfall Station, DID Ampang
96
3.23 Distribution of Rainfall Events from February 2006 to March 2008 with Estimated ARI from Generated IDF Curve
97
3.24 River system within Study Area
99
3.25 Drainage System within Catchment Area
100
3.26 Example of Water Level Reading from Telemetry Station (Feb 2006)
101
3.27 Condition of Dry Detention Pond on 29 March 2007 (Water Depth around 0.25 metre)
102
3.28 Condition of Dry Detention Pond after River Clearing Works on 21 January 2009 (Water Depth around 0.25 metre)
102
3.29 Condition of Dry Detention Pond on 10 May 2008 (Water Depth around 0.3 metre)
103
LIST OF FIGURES
Figures Title Page
xi
3.30 Condition of Dry Detention Pond after River Clearing Works on 12 May 2008 (Water Depth around 0.30 metre)
103
3.31 Condition of Dry Detention Pond and Culvert Inlet after River Clearing Works on 24 March 2008 (Water Depth around 1 metre)
104
3.32 Condition of Dry Detention Pond and Culvert Inlet (Water Depth around 2 metres)
104
3.33 Submerged Pressure Flow Area-Velocity Metre
105
3.34 Water Level and Velocity Data from ISCO Flowlink Software
106
3.35 Discharge versus Water Depth Curve at Pond Outlet/Culvert Inlet using Data from 27 January to 28 February 2008
106
4.1 Model Development Process
109
4.2 Sub-catchments Generation from LiDAR Image
113
4.3 Time of Concentration using Different Methods
114
4.4 Isohyets Map for Maximum Rainfall of 2 Hours on 10 June 2007
115
4.5 Built-in Drainage Network in InfoWorks CS
116
4.6 Built-in River System in InfoWorks CS
117
4.7 Cross Section of Inlet from Forest Area Upstream
117
4.8 Cross Section of the Culvert Inlet at the Downstream of Dry Detention Pond
118
4.9 Longitudinal Section of the River System
118
4.10 Longitudinal Section of the Drainage System at Section 7, Kota Damansara
119
4.11 Culvert Outlet which Served as the Boundary Condition of the Model and set to be Outfall due to the Free Flow
119
5.1 Comparison of Observed and Simulated Water Depth using 3 Different Cases of Antecedent Moisture Content (I, II and III) for Rainfall Event on 20 October 2007 (8-year ARI) at Pond Outlet/ Culvert Inlet
124

LIST OF FIGURES
Figures Title Page
xii
5.2 Comparison of Observed and Simulated Water Depth using 3 Different Cases of Antecedent Moisture Content (I, II and III) for Rainfall Event on 29 November 2007 (2-year ARI)at Pond Outlet/Culvert Inlet
126
5.3 Comparison of Observed and Simulated Water Depth using 4 Different Cases of Hydrologic Soil Groups (A, B, C and B, A and C) for Rainfall Event on 20 October 2007 (8-year ARI) at Pond Outlet/Culvert Inlet
129
5.4 Comparison of Observed and Simulated Water Depth using 4 Different Cases of Hydrologic Soil Groups (A, B, C and B and C) for Rainfall Event on 29 November 2007 (2-year ARI) at Pond Outlet/Culvert Inlet
130
5.5 Comparison of Observed and Simulated Water Depth using 3 Different Cases of Hydrologic Loss Methods (Horton Method, SCS Method and Green- Ampt Method) for Rainfall Event on 20 October 2007 (8-year ARI) at Pond Outlet/Culvert Inlet
132
5.6 Comparison of Observed and Simulated Water Depth using 3 Different Cases of Hydrologic Loss Methods (Horton Method, SCS Method and Green- Ampt Method) for Rainfall Event on 29 November 2007 (2-year ARI) at Pond Outlet/Culvert Inlet
134
5.7 Comparison of Observed and Simulated Water Depth using Two Different Rainfall Intensity Intervals (5 minutes or 15 minutes) for Rainfall Event on 20 October 2007 (8-year ARI) at Pond Outlet/Culvert Inlet
136
5.8 Comparison of Observed and Simulated Water Depth using Two Different Rainfall Intensity Intervals (5 minutes or 15 minutes) for Rainfall Event on 29 November 2007 (2-year ARI) at Pond Outlet/Culvert Inlet
137
5.9 Comparison of Observed and Simulated Water Depth using 3 Different Manning’s n (0.011, 0.012 and 0.013) for Rainfall Event on 20 October 2007 (8-year ARI) at Pond Outlet/Culvert Inlet
140
5.10 Comparison of Observed and Simulated Water Depth using 3 Different Manning’s n (0.011, 0.012 and 0.013) for Rainfall Event on 29 November 2007 (2-year ARI) at Pond Outlet/Culvert Inlet
141
5.11 Comparison of Observed and Simulated Water Depth using 2 Cases of Different Culvert Properties for Rainfall Event on 20 October 2007 (8-year ARI) at Pond Outlet/Culvert Inlet
144
LIST OF FIGURES
Figures Title Page
xiii
5.12 Comparison of Observed and Simulated Water Depth using 2 Cases of Different Culvert Properties for Rainfall Event on 29 November 2007 (2-year ARI) at Pond Outlet/Culvert Inlet
145
5.13 Comparison of Observed and Simulated Water Level at Pond Outlet/Culvert Inlet for Rainfall Event on 20 October 2007 (8-year ARI) (Calibration)
149
5.14 Comparison of Observed and Simulated Water Level at Pond Outlet/Culvert Inlet for Rainfall Event on 29 November 2007 (2-year ARI) (Calibration)
149
5.15 Comparison of Observed and Simulated Flow at Pond Outlet/Culvert Inlet for Rainfall Event on 20 October 2007 (8-year ARI) (Calibration)
150
5.16 Comparison of Observed and Simulated Flow at Pond Outlet/Culvert Inlet for Rainfall Event on 29 November 2007 (2-year ARI) (Calibration)
150
6.1 Comparison of Observed and Simulated Water Level at Pond Outlet/Culvert Inlet for Rainfall Event on 26 February 2006 (25-year ARI) (Verification)
156
6.2 Comparison of Observed and Simulated Water Level at Pond Outlet/Culvert Inlet on 9 September 2006 (4-year ARI) (Verification)
156
6.3 Comparison of Observed and Simulated Water Level at Pond Outlet/Culvert Inlet on 19 March 2008 (1-month ARI) (Verification)
157
6.4 Comparison of Observed and Simulated Flow at Pond Outlet/Culvert Inlet for Rainfall Event on 26 February 2006 (25-year ARI) (Verification)
157
6.5 Comparison of Observed and Simulated Flow at Pond Outlet/Culvert Inlet on 9 September 2006 (4-year ARI) (Verification)
158
6.6 Comparison of Observed and Simulated Flow at Pond Outlet/Culvert Inlet on 19 March 2008 (1-month) (Verification)
158
7.1 Comparison of Water Depth at Culvert Inlet for Various Durations of 2-year ARI Design Rainfall (Simulation)
163

LIST OF FIGURES
Figures Title Page
xiv
7.2 Comparison of Flow at Culvert Inlet for Various Durations of 2-year ARI Design Rainfall (Simulation)
163
7.3 Comparison of Depth at Culvert Inlet for Various Durations of 10-year ARI Design Rainfall (Simulation)
164
7.4 Comparison of Flow at Culvert Inlet for Various Durations of 10-year ARI Design Rainfall (Simulation)
164
7.5 Comparison of Depth at Culvert Inlet for Various Durations of 50-year ARI Design Rainfall (Simulation)
165
7.6 Comparison of Flow at Culvert Inlet for Various Durations of 50-year ARI Design Rainfall (Simulation)
165
7.7 Comparison of Water Depth at Culvert Inlet for Various Durations of 100-year ARI Design Rainfall (Simulation)
166
7.8 Comparison of Flow at Culvert Inlet for Various Durations of 100-year ARI Design Rainfall (Simulation)
166
7.9 Simulations of Water Depth for Various ARI
168
7.10 Simulations of Flow for Various ARI
169
7.11 Peak Flow Attenuation from CH500 (Upstream) to Pond Outlet/Culvert Inlet (Downstream) in Dry Detention Pond for 50-year ARI
169
7.12 Peak Flow Attenuation from CH500 (Upstream) to Pond Outlet/Culvert Inlet (Downstream) in Dry Detention Pond for 100-year ARI
170
7.13 Comparison of Water Depth for Various ARI under Effects of Landuse Changed
172
7.14 Comparison of Flow for Various ARI under Effects of Landuse Changed
173
7.15 Comparison of Volume for Various ARI under Effects of Landuse Changed
173
7.16 Comparison of Water Depth for 50-year ARI for Existing Condition and After Landuse Changed
174
7.17 Comparison of Water Depth for 100-year ARI for Existing Condition and After Landuse Changed
175

LIST OF FIGURES
Figures Title Page
xv
7.18 Comparison of Flow for 50-year ARI for Existing Condition and After Landuse Changed
175
7.19 Comparison of Flow for 100-year ARI for Existing Condition and After Landuse Changed
176
7.20 Example of Conduits Full Flow Condition under Landuse Changed Condition
177
7.21 Example of Conduits Free Flow Condition after Drainage Resized Condition
177
7.22 Comparison of Flow for 50-year ARI for Existing Drainage Condition and Drainage Resize Condition after Landuse Changed
178
7.23 Comparison of Flow for 100-year ARI for Existing Drainage Condition and Drainage Resize Condition after Landuse Changed
178

LIST OF TABLES
Tables Title Page
xvi
2.1 Effects on Environment due to Urbanization
21
2.2 BMP Applicability Matrix
27
2.3 Development Type Summary
28
2.4 Dynamic Assumptions of Different Models
36
2.5 Approximate Pricing of Software Packages
39
2.6 Typical Values for Horton's Infiltration Model
41
2.7 Hydrologic Soil Properties Classified by Soil Texture
45
2.8 Runoff Curve Numbers for Selected Agriculture, Suburban, and Urban Landuses (Antecedent Moisture Condition II)
45
2.9 SSRM Results of the Impact of Urban Creep, Climate Change and Upsizing the Entire Drainage Network on Various Hydrological Parameters for a 1 in 100 Year Storm
62
2.10 The Different Modelling Approaches and Tools Used to Assess the Impact of Development on Flood Risk at Longbridge Lane Flood Location
64
3.1 Percentage of Type of Landuse Versus Category in 2002
79
3.2 Percentage of Type of Landuse Versus Category in 2004
80
3.3 Percentage of Type of Landuse Versus Category using QuickBird Image
81
3.4 Soil Investigation Results (June 2007 and November 2008)
86
3.5 Statistic of Rainfall Events from February 2006 to June 2008
92
3.6 Estimated Curve Number for Hydrologic Soil Group B for Landuse
93
3.7 Rainfall Intensity for Various Duration according to Return Period (1-month to 100-year ARI)
95
3.8 Rainfall Events from February 2006 to March 2008 with Estimated ARI from Generated IDF Curve
98
3.9 Summary of Water Level/Depth and Peak Flow for Dry Detention Pond
107

LIST OF TABLES
Tables Title Page
xvii
4.1 Catchment Area According to Sub-catchments
111
4.2 Suggested CN for Each Landuse for Antecedent Moisture Content I, II dan III According to Hydrologic Soil Groups
113
5.1 Rainfall Intensity on 20 October 2007 (8-year ARI)
122
5.2 Rainfall Intensity on 29 November 2007 (2-year ARI)
123
5.3 Comparison of Observed and Simulated Maximum Water Depth using 3 Different Cases of Antecedent Moisture Content (I, II and III) for Rainfall Event on 20 October 2007 (8-year ARI) at Pond Outlet/Culvert Inlet
125
5.4 Comparison of Observed and Simulated Maximum Water Depth using 3 Different Cases of Antecedent Moisture Content (I, II and III) for Rainfall Event on 29 November 2007 (2-year ARI) at Pond Outlet/Culvert Inlet
127
5.5 Comparison of Observed and Simulated Maximum Water Depth using 4 Different Cases of Hydrologic Soil Groups (A, B, C and B, A and C) for Rainfall Event on 20 October 2007 at Pond Outlet/Culvert Inlet
128
5.6 Comparison of Observed and Simulated Maximum Water Depth using 4 Different Cases of Hydrologic Soil Groups (A, B, C and B, A and C) for Rainfall Event on 29 November 2007 at Pond Outlet/Culvert Inlet
131
5.7 Comparison of Observed and Simulated Maximum Water Depth using 3 Different Cases of Hydrologic Loss Methods (Horton Method, SCS Method and Green-Ampt Method) for Rainfall Event on 20 October 2007 (8-year ARI) at Pond Outlet/Culvert Inlet
133
5.8 Comparison of Observed and Simulated Maximum Water Depth using 3 Different Cases of Hydrologic Loss Methods (Horton Method, SCS Method and Green-Ampt Method) for Rainfall Event on 29 November 2007 (2-year ARI) at Pond Outlet/Culvert Inlet
135
5.9 Comparison of Observed and Simulated Maximum Water Depth using Two Different Rainfall Intensity Intervals (5 minutes or 15 minutes) for Rainfall Event on 20 October 2007 (8-year ARI) at Pond Outlet/Culvert Inlet
138
5.10 Comparison of Observed and Simulated Water Depth using Two Different Rainfall Intensity Intervals (5 minutes or 15 minutes) for Rainfall Event on 29 November 2007 (2-year ARI) at Pond Outlet/Culvert Inlet
138

LIST OF TABLES
Tables Title Page
xviii
5.11 Comparison of Observed and Simulated Maximum Water Depth using 3 Different Manning’s n (0.011, 0.012 and 0.013) for Rainfall Event on 20 October 2007 (8-year ARI) at Pond Outlet/Culvert Inlet
142
5.12 Comparison of Observed and Simulated Water Depth using 3 Different Manning’s n (0.011, 0.012 and 0.013) for Rainfall Event on 29 November 2007 (2-year ARI) at Pond Outlet/Culvert Inlet
142
5.13 Comparison of Observed and Simulated Maximum Water Depth using 2 Cases of Different Culvert Properties for Rainfall Event on 20 October 2007 (8-year ARI) at Pond Outlet/Culvert Inlet
146
5.14 Comparison of Observed and Simulated Maximum Water Depth using 2 Cases of Different Culvert Properties for Rainfall Event on 29 November 2007 (2-year ARI) at Pond Outlet/Culvert Inlet
146
5.15 Comparison of the Observed and Calibrated Peak Water Level, Time to Peak Water Level and r2 for Rainfall Event on 20 October 2007 and 29 November 2007
149
5.16 Comparison of the Observed and Calibrated Peak Flow, Time to Peak Flow and r2 for Rainfall Event on 20 October 2007 and 29 November 2007 (Calibration)
150
5.17 Summary of Sensitivity Test
151
6.1 Rainfall Intensity on 26 February 2006 (25-year ARI)
153
6.2 Rainfall Intensity on 9 September 2006 (4-year ARI)
154
6.3 Rainfall Intensity on 19 March 2008 (1-month ARI)
155
6.4 Comparison of the Observed and Calibrated Peak Water Level, Time to Peak and r2 for 3 Rainfall Events on 26 February 2006, 9 September 2006 and 19 March 2008 (Verification)
157
6.5 Comparison of the Observed and Calibrated Peak Flow, Time to Peak Flow and r2 for 3 Rainfall Events on 26 February 2006, 9 September 2006 and 19 March 2008 (Verification)
158
7.1 Results of Water Depth and Flow Comparison of 2-year ARI for Various Rainfall Durations
163
7.2 Results of Water Depth and Flow Comparison of 10-year ARI for Various Rainfall Durations
164
7.3 Results of Water Depth and Flow Comparison of 50-year ARI for Various Rainfall Durations
165

LIST OF TABLES
Tables Title Page
xix
7.4 Results of Water Depth and Flow Comparison of 100-year ARI for Various Rainfall Durations
166
7.5 Results of Simulations of Water Depth and Flow for Various ARI
169
7.6 Details of Flow Attenuation from CH500 to Culvert Inlet for 50-year ARI
170
7.7 Comparison of Water Depth and Flow for 60 minutes-100-year ARI on Design Specification and the Current Condition
170
7.8 The Maximum Water Depth, Water Level and Flow under Various ARI (Condition after Landuse Changed: CN= 95)
174
7.9 The Comparison of Water Depth and Flow for Existing Condition and After Landuse Changed
176
7.10 Summary on the Performance of Dry Detention Pond under Existing and Future Development Condition
180

LIST OF ABBREVIATIONS
xx
ALSM Airborne Laser Swath Mapping
AMC Antecedent Moisture Content
ARI Annual Recurrence Internal
BMPs Best Management Practices
CHI Computational Hydraulics International
CN Curve Number
DAP Drainage Area Planning
DEM Digital Elevation Model
DID Department of Irrigation and Drainage, Malaysia
DMP Drainage Master Plan
DOA Department of Agriculture, Malaysia
DSS Decision Support System
GIS Geographical Information System
HSG Hydrologic Soil Group
IDF Intensity-Duration-Frequency
InfoWorks CS InfoWorks Collection System
IUD Integrated Urban Drainage
JUPEM Department of Survey and Mapping Malaysia
LiDAR Light Detection and Ranging
MOUSE Modelling of Urban Sewers
MSL Mean Sea Level
MSMA Urban Stormwater Management Manual for Malaysia
NAHRIM National Hydraulic Research Institute of Malaysia
PCSWMM Personal Computer Stormwater Management Model
PKNS Pembangunan Kemajuan Negeri Selangor
REDAC River Engineering and Urban Drainage Research Centre
SCS Soil Conservation Services
SMS Short Messaging System
SRTM Shuttle Radar Topography Mission

LIST OF ABBREVIATIONS
xxi
SSRM Strategic Sewer River Model
SWMM Stormwater Management Model
TRRL Transport and Road Research Laboratory
USCS United States Soil Conservation Services
USDA United States Department of Agriculture
USEPA United States Environmental Protection Agencies
UK United Kingdom
WaPUG Wastewater Planning Users Group
WASSP Wallingford Storm Sewer Package
XPSWMM Stormwater and Wastewater Management Model

LIST OF SYMBOLS
xxii
Symbol Definition
∆t Routing interval (h)
A Flow cross-sectional area (m2)
Ai Time-area histogram ordinates (ha)
F(t) Cumulative infiltration (mm)
f(t) Infiltration rate (cm/hr)
fc Minimum or Ultimate Value of fp (m/s)
fo Maximum or Initial Value of fp (m/s)
fp Infiltration capacity of soil (m/s)
g Gravitational acceleration (m/s)
I Inflow (m3/s)
i Number of isochrones area contributing to the outlet
i1 Inflows at beginning of routing period (m3/s)
i2 Inflows at end of routing period (m3/s)
Ia Initial abstraction (mm)
I i Excess rainfall hyetograph ordinates (mm/hr)
k Decay coefficient (s-1)
K Storage coefficient/Hydraulic conductivity
k1 Storage delay times at beginning of routing period (s)
k2 Storage delay times at end of routing period (s)
n Manning’s roughness coefficient
P The accumulated precipitation (mm)
Pe The accumulated runoff (mm)
Q Discharge through A (m3/s)
q1 Outflows from the storage at beginning of routing period (m3/s)
q2 Outflows from the storage at end of routing period (m3/s)
qi The flow hydrograph ordinates (m3/s)
R Hydraulic Radius
r2 Coefficient of Determination (R-squared)
S Storage (m3) / Bed Slope
S1 Storages volume at beginning of routing period (m3)

xxiii
S2 Storages volume at end of routing period (m3)
Sf Friction Slope
So Channel Slope
t time (s)
x Longitudinal direction measured horizontally (m)
Y Depth of flow (m)
η Porosity
τ Dummy variable of time in the integration (s)
Өi Initial moisture content
� Wetting front soil suction head (cm)
LIST OF SYMBOLS

xxiv
KEBERKESANAN SISTEM SALIRAN BANDAR MELALUI KOLAM
TAKUNGAN KERING
(KAJIAN KES: KOTA DAMANSARA, SELANGOR)
ABSTRAK
Lantaran daripada pembangunan yang pesat, banjir kian menjadi. Senario ini
semakin meruncing akibat sistem saliran yang tidak sesuai di kawasan perumahan.
Sekiranya keadaan ini dibiarkan berlanjutan, besar kemungkinan ia akan membawa
risiko banjir yang lebih serius dan lebih kerosakan harta serta kehilangan nyawa.
Sejak pelaksanaan Manual Saliran Mesra Alam (MSMA) pada 2001 oleh
Jabatan Pengairan dan Saliran, langkah-langkah pengurusan yang baik melalui
pembinaan kolam takungan adalah digalakkan. Selepas 8 tahun pelaksanaannya,
kajian untuk mempertimbangkan semula keperluan pembinaan kolam takungan
dengan menilai keberkesanan kolam takungan dari segi kuantiti melalui kaedah
numerikal adalah amat diperlukan.
Kajian ini bertumpu ke atas penilaian sistem saliran khususnya kolam
takungan yang sediada serta menjangka keberkesanan kolam takungan kering
tersebut akibat aktiviti-aktiviti pembangunan pada masa akan datang dengan
menggunakan perisian InfoWorks CS melalui kaedah “Soil Conservation Service
(SCS)”. Kes kajian yang dipilih ialah kolam takungan kering di Seksyen 6, Kota
Damansara, Selangor yang dibina pada tahun 1996 dengan kawasan tadahan
sebanyak 428 hektar. Guna tanah utama di kawasan tadahan tersebut ialah kawasan
perumahan dan rumah kedai di mana ia menyumbang kepada lebih 50% kawasan
tidak telap selain daripada kawasan hutan, sekolah, landskap dan kawasan lapang.
Daripada hasil kajian, ia menunjukkan kolam takungan kering sediada dapat
berfungsi dengan baik untuk hujan kala 100 tahun tanpa banjir di Jalan Cecawi 6/19

xxv
berdekatan dengan kolam takungan. Kolam takungan tersebut juga berupaya
mengurangkan kadaralir sebanyak 39.94 m3/s serta melambatkan masa ke puncak
sebanyak 40 minit untuk hujan kala 50 tahun. Bagi hujan kala 100 tahun, ia dapat
mengurangkan kadaralir sebanyak 42.36 m3/s serta melambatkan masa ke puncak
sebanyak 45 minit.
Dengan pembangunan di kawasan hutan di sebelah hulu kawasan tadahan,
hasil kajian juga menunjukkan ia masih dapat berfungsi dengan baik tanpa banjir
untuk hujan kala 100 tahun di Jalan Cecawi 6/19 berdekatan dengan kolam takungan
kering. Senario ini meningkatkan kadaralir dari 8.88% hingga 52.95% dan ketinggian
air dari 8.09% hingga 28.79% bagi kadaralir pada hujan kala 2, 10, 50 dan 100 tahun.
Namun, masa ke puncak adalah 5 minit lebih lambat berbanding dengan keadaan
sediaada disebabkan aliran penuh di saliran yang melambatkan aliran air ke hilir.
Melalui kes perbandingan keadaan penambahan saiz saliran selepas perubahan guna
tanah dengan keadaan sediaada, ia menunjukkan penambahan kadaralir lebih kurang
30% untuk hujan kala 50 dan 100 tahun dan menpercepatkan masa ke puncak
sebanyak 10 minit.
Pada keseluruhannya, kolam takungan kering sediaada dapat menampung
hujan kala 100 tahun yang dicadangkan dalam MSMA. Pembinaan kolam takungan
perlu digalakkan untuk pembangunan perumahan yang baru bagi mengawal kuantiti
air kerana ia didapati berkesan. Sebarang pembangunan perlu mempertimbangkan
faktor seperti perubahan guna tanah yang akan meningkatkan kadaralir dan kuantiti
air dan permodelan numerikal patut digunakan untuk tujuan penyelesaian masalah
dan membuat keputusan dengan pantas.

xxvi
PERFORMANCE OF URBAN STORMWATER DRAINAGE SYSTEM
THROUGH DRY DETENTION POND
(CASE STUDY: KOTA DAMANSARA, SELANGOR)
ABSTRACT
Due to the rapid development, flooding occurred progressively. This scenario
is worsened if improper drainage systems were implemented. The inattentiveness to
all the problems occurred will generate the possibility for more severe flooding risk
and creates further damages of property and loss of lives.
Since the implementation of Urban Stormwater Management Manual of
Malaysia (MSMA) in 2001 by Department of Irrigation and Drainage, Malaysia, the
Best Management Practices (BMPs) through construction of detention ponds have
been encouraged. After 8 years of implementation, there is a need to reconsider the
recommendation of constructing detention pond for water quantity control by
evaluating performance of the constructed dry detention ponds using computer
modelling.
This research focused on the evaluation of the existing and future
performance under the stress of development of the existing drainage system
particularly the constructed dry detention pond by using InfoWorks CS through
United States Soil Conservation Services Method (SCS).
The case study is dry detention pond at Section 6, Kota Damansara, Selangor
built in 1996 with the total catchment area of approximately 428 hectares. The major
landuses in Kota Damansara are housing areas and shops which contribute more than
50% of impervious areas apart from forest, schools, landscape and fields.
From the research, it is found that the existing pond is functioning well and
could perform well up to the design rainfall of 100-year ARI without flood on

xxvii
Cecawi 6/19 Road nearby. The dry detention pond could attenuate flow at the outlet
of the dry detention pond at 39.94 m3/s and slower by 40 minutes for 50-year ARI
and 42.36 m3/s and slower by 45 minutes for 100-year ARI events.
Under the landuse changed scenario, the existing dry detention pond could
still cater the 100-year ARI design rainfall without flooding at surrounding area. The
scenario show an increase in flow ranging from 8.88% to 52.95% and also increase
in water depth ranging from 8.09% to 28.79% in all simulated cases for 2-, 10-, 50-
and 100-year ARI. However, the time to peak after landuse changed condition is 5
minutes slower for existing scenario due to conduits full flow condition that slow
down the flow to downstream.
The comparison between the existing drainage condition and drainage resized
condition after landuse changed at the outlet culvert of detention pond show an
increase runoff about 30% for both 50- and 100-year ARI and quicker time to peak at
10 minutes.
As overall, the dry detention pond is functioning to cater 50-year ARI
recommended in MSMA. The construction of detention pond needs to be encouraged
for any new housing development to control water quantity. Future development
need to consider landuse changed factor which could induce in more flow generation
and water volume from upper catchment area and it should be studied using the
numerical approaches to solve the problem and ease the decision making processes.

1
CHAPTER 1
INTRODUCTION
1.1 BACKGROUND
Malaysia is geographically sheltered from the “Pacific Rim of Fire” and it is
relatively considered as a safe haven (Wong, 2005). It is free from the ravages and
destructive caused by volcanic eruptions, earthquakes and typhoons (Abdul Malek,
2005). Nevertheless, Malaysia experiencing a higher probability of seasonal flash
flood, landslides and severe haze episodes. Since 20 to 30 years ago, Malaysia is
developing rapidly. The growths of population and urbanisation have brought water
quantity and water quality problems. Issues deal with water quantity are floods
(Figure 1.1) and droughts, while water quality issues (Figure 1.2) may be due to
erosion and sedimentation from uncontrolled development (Figure 1.3) which
deteriorate the quality of water. In urban areas such as Kuala Lumpur and Penang,
improper urban stormwater drainage system design has been one of the causes of
flash flood following an intensive, localised and short-duration thunderstorms. It is
worsened by rubbish dumped which clogged the drain and further blocked the runoff
flow.
In many urban areas, drainage is a completely artificial system of sewers with
pipes and structures to collect and dispose stormwater. There are two types of water
which require drainage namely stormwater and wastewater (Butler and Davies, 2000).

2
Figure 1.1: Flooding Problems in Malaysia
Figure 1.2: Degradation of Water Quality
Figure 1.3: Erosion and Sedimentation Problem in Malaysia

3
Butler and Davies (2000) defines urban stormwater drainage as the facilities
which help to drain rainwater or water resulting from any form of precipitation) that
has fallen on a built up area. Basically, urban stormwater drainage acts as the
carriage of surface water from one drain to another connecting drain or sump, then to
lake, ponds or river system prior to the sea. Stormwater contains some pollutants
resulting from the rain and air or the catchment surfaces. Therefore, if it is not
properly drained, it will cause inconvenient, degradation of water quality, flooding,
environmental problems and further threatening human health.
Urban wastewater drainage is the facilities provided to drain wastewater from
domestic housing areas, industry and other means of water uses. Wastewater
normally contains dissolved material, fine solids and larger solids. Thus, having a
well planned urban wastewater drainage system could maintain a healthy standard of
living at the same time it satisfies the needs of the industry.
Historically, drainage system was developed as soon as humans attempt to
control their environment. Drainage engineer started to design drains for efficient
removal of the excessive surface water from the ground to the rivers or seas. The first
aim was to remove rainwater on the surfaces especially on the roads, and then
disposed via the drain and to the nearest watercourse rapidly. These concepts may
cause damage to the environment and increase the risk of flooding elsewhere.
Nowadays as the environmental issues are getting more concern, the nature of
progress in relation to urban drainage, its consequences, desirability and limits are
being closely reassessed and examined. General attention is diverted to manage the
stormwater in a more natural way.
In 2000, the Department of Irrigation and Drainage, Malaysia (DID)
published the Urban Stormwater Management Manual for Malaysia or in Bahasa
4
Malaysia, “Manual Saliran Mesra Alam Malaysia” (MSMA) that aims to promote
the Best Management Practices (BMPs) in stormwater management. In 1 January
2001, the Cabinet officially approved the MSMA to steer drainage development
(Yong and Md Noh, 2005).
BMPs in stormwater management involved constructing detention and
retention facilities, infiltration trench, groundwater recharge, porous pavements for
infiltration and provision of rough surface such as swales to retard flow reaching the
watercourse and to decrease the peak flow of runoff. After 8 years of the
implementation, this study is needed to reconsider the recommendation of
constructing detention pond for water quantity control by evaluating performance of
the constructed dry detention ponds using computer modelling. InfoWorks
Collection System or InfoWorks CS version 8.5 developed by Wallingford Software
Ltd. is used for model development in the present research.
MSMA uses the concept of stormwater management at source which is
within the catchment and essentially involves runoff quantity and quality
management. As the advancement in computer hardware and software development,
computer modelling of drainage system begins to gain the popularity. The use of
models will encourage far and depth understanding on the operation of the system.
The introduction of the drainage modelling has made huge savings in cost and time.
Urban stormwater drainage modelling is encouraged to be utilized in drainage system
study to research and analyse the high technologies problems occurred. Therefore,
further suggestion on improvement of the drainage system design can be determined
and implemented.

5
1.2 RESEARCH OBJECTIVES
This research will utilize hydraulic software by HR Wallingford which is well
known as InfoWorks CS version 8.5 to model the drainage system in the study areas.
The main objectives of the study are as follows:
i) To determine the hydrology and hydraulic parameters of the catchment,
ii) To analyse on the performance of the existing dry detention pond, and
iii) To predict the performance of the urban stormwater drainage system
through existing dry detention pond in future development
1.3 RESEARCH SCOPES
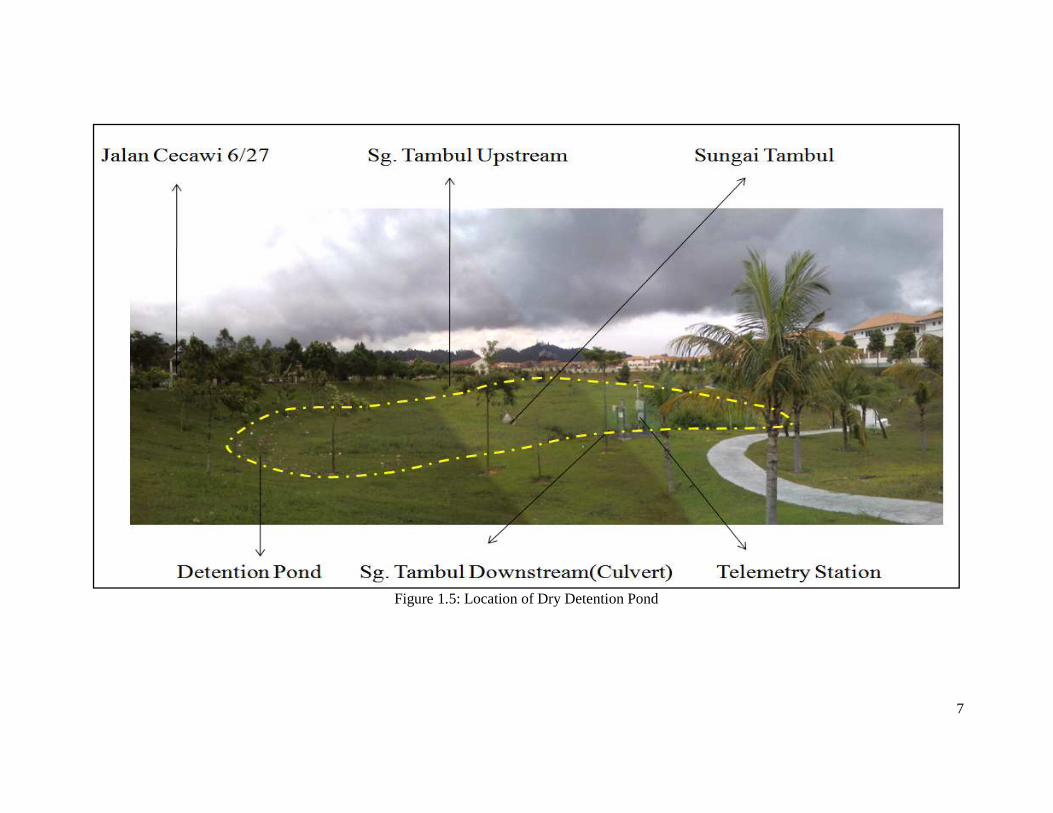
The research site as shown in Figure 1.4 is located at Kota Damansara,
Selangor which is about 10 kilometres from Sungai Buloh, North-South Highway tol.
Sungai Tambul, tributary of Sungai Damansara is the main stream flowing in the
pond. This study focuses on the dry detention pond with an area about 6.55 hectares
as shown in Figure 1.5 situated in Section 6, Kota Damansara, Selangor built in 1996.
The total catchment area contributing to the dry detention pond are comprises of
areas in Section 5, 6, 7, 10 and 11, cover a total of approximately 428 hectares. The
catchment area is further distributed into 177 sub-catchments to study the behaviours
of rainfall-runoff relationship in the ponds. The topography of the project area is
hilly to undulating. The project area rises from 21.72 to 202 metre above mean sea
level (MSL). The nearest road as shown in Figure 1.5 is Jalan Cecawi 6/27 on the left
bank of dry detention pond with ground level of 28 metres above MSL. For this
research, it will only cover the performance of the dry detention pond on water
quantity aspect. Figure 1.6 and Figure 1.7 show the condition of dry detention pond
during dry season and after storm event while Figure 1.8 and Figure 1.9 show the
pond outlet/culvert inlet during dry season and after storm event.

6
Figure 1.4: Location of Study Area
7
Figure 1.5: Location of Dry Detention Pond

8
Figure 1.6: Condition of Dry Detention Pond during Dry Season
Figure 1.7: Condition of Dry Detention Pond after Storm Event

9
Figure 1.8: Condition at Pond Outlet/Culvert Inlet during Dry Season
Figure 1.9: Condition at Pond Outlet/Culvert Inlet after Storm Event

10
1.4 RESEARCH NEEDS
As mentioned in the previous section, the initial aim in providing drainage
system is to remove stormwater from the surfaces, especially roads, to the drain and
the receiving watercourse or sea as quickly as possible. This theory of fast in-fast out
is left with many environmental issues such as pollution, degradation of water quality,
erosion and sedimentation as well as flooding risk.
Due to the rapid development, these issues occur progressively and create
water quantity and quality problems. The reasons leading to the environmental issues
are improper landuse planning and lack of laws, rules and regulations in controlling
current housing development plan. The scenario is worsening if the development has
improper drainage system design or poor maintenance. Moreover, the drainage
systems in some housing areas are already in-placed since 10 to 20 year ago and no
improvement or maintenance of drainage system has been done. The inattentiveness
to all the issues will increase the possibility of more severe flooding risk and create
more damages of properties and loss of lives.
Since the implementation of MSMA in 2001, BMPs through construction of
detention ponds have been encouraged. However, could these detention ponds
perform in controlling the water quantity from development areas? Further, are there
any better drainage systems in urban areas to address the flooding problems? It is
also difficult to justify spending huge sums of money on such facilities as detention
basins, if the receiving waters are not endangered, or if experience suggests that
those measures will be ineffective. It is difficult to analyse the complicated or series
of connecting drains and sump by having the physical models. Thus, the utilizing of
computer model is undeniably a safe of time and cost.

11
Moreover, after 8 years of MSMA implementation, there is a need to
reconsider the construction of detention pond by evaluating the performance of the
detention pond in controlling water quantity by utilizing computer advancement in
modelling. Besides, the dry detention pond for the present study was built in 1996
before implementation of MSMA. Thus, it is needed to evaluate the performance of
the pond under the MSMA requirement. The findings will show on the
appropriateness to include the construction of retention and detention facilities for
any new medium size housing scheme in the future as the study area is
approximately 50% developed housing scheme. This is essential to achieve and help
on recommending improvement of urban drainage for new housing scheme.
1.5 THESIS STRUCTURES
This thesis is organised into eight (8) chapters. Chapter 1 in brief introduces
the problems, objectives and needs for the study. Chapter 2 describes literature
review on Urban Drainage System, Best Management Practices particularly
detention pond and experiences on urban drainage models in foreign countries.
Chapter 3 details the research methodology and catchment hydrologic and hydraulic
parameter while Chapter 4 focuses on model development and data input. Chapter 5
and Chapter 6 cover model calibration and verification respectively. In Chapter 7,
model simulations will be discussed and the final Chapter 8 comprises
recommendations and conclusion.

12
CHAPTER 2
URBAN DRAINAGE SYSTEM
2.1 BACKGROUND
As soon as humans attempted to control their environment, artificial
stormwater drainage systems were developed (Butler and Davies, 2000).
Archaeological evidence depicts that drainage was provided to the buildings of many
ancient civilization such as the Mesopotamians, the Minoans (Crete) and the Greeks
(Athens) (Butler and Davies, 2000). The ruins from Mesopotamian cities contain
well-constructed storm drainage and sanitary sewer system (Burian and Edwards,
2003). The Mesopotamians viewed urban runoff as a nuisance flooding concern,
waste conveyor and a vital natural resource. While, from the Middle Minoan Period
about 1900 to 1700 B.C., the Minoans had constructed the well-built stone drains as
shown in Figure 2.1 which carried sewerage, rainwater and general drainage (Gray,
1940). Ruins from the palace-city of Knossos on the island of Crete indicated that a
two-conduit system was installed, where separate conduits were used in collecting
sewage and rainwater (Burian and Edwards, 2003).
In 1800s, the Roman was the only civilization in all of western Asia and
Europe to build a carefully planned road system with properly drained surfaces. In
addition, rainwater collection system was incorporated into roadway design and
construction. Rainfall from rooftops was collected into a cistern and massive
underground structures as shown in Figure 2.2 built to store water draining from a
large area (Burian and Edwards, 2003).

13
Figure 2.1: Minoan Stone Drain at Palace City of Knossos
(Daedalus Informatics Ltd, 2006)
Figure 2.2: The Roman Cistern in Fermo, Italy. (Burian and Edwards, 2003)
Apart from that, the Romans are well known for their impressive aqueducts
bringing water into the city; and later to meet the urban drainage needs, the artificial
drains were built, of which the best known is “Cloaca Maxima” (Butler and Davies,
2000). It is primarily conduits for the removal of surface drainage (rain water) and
underground water (Gray, 1940). The outfall of the Cloaca Maxima as shown in
Figure 2.3 and Figure 2.4 into the river Tiber is still visible today near the bridge
Ponte Rotto, and near Ponte Palatino, Rome (Wikipedia, 2008).

14
Figure 2.3: Outfall of the Cloaca Maxima (Wikipedia, 2008)
Figure 2.4: View of the Interior of the Cloaca Maxima (Wikipedia, 2008)
Before the 19th century, the word 'sewer' referred to an artificial drainage
channel such as a trench or an open ditch, which used to drain land (The Commission
of Sewers, Isle of Wright, 2008). The English word sewer is derived from an Old
Northern French word, se(u) wiere, which means “to drain off”, related to the Latin
ex-(out) and aqua (water) (Butler and Davies, 2000). This modern meaning of an

15
enclosed, constructed for the passage of human waste evolved much later, owing to
the habit of using sewers or ditches for the disposal of human and household waste
(The Commission of Sewers, Isle of Wright, 2008)
From Oxford English Dictionary, it gives the earliest meaning of sewer as “an
artificial watercourse for draining marshy land and carrying off surface water into a
river or the sea” (Butler and Davies, 2000).
According to Chocat (2000), the major objectives of urban drainage remain
public hygiene, flood protection and pollution control. In developed countries, the
first two objectives have been accomplished and emphasis mainly on pollution
control. However, in developing countries like Malaysia, hygiene and flood
protection are still major issues.
In many part of the world, we can imagine animals living wild in their natural
habitat and humans living in small groups making a very little impact on their
environment. Natural hydrological processes would have prevailed. In the past, there
might experience major floods, but these would not have been made worse by human
alteration of the surface of the natural ground. Even the waste would have been
“treated” in natural processes. The effects of urbanisation to drainage will be
discussed in the next section.
Before the 19th century, urban drainage was viewed as pertinent natural
resources, an efficient waste transport medium, a flooding concern, a nuisance
wastewater, or a transmitter of disease. During the 19th century, the perspective on
urban drainage was significantly modified in Europe and United States. It was
viewed as a highly important public works system worthy of massive expenditures to
prevent disease transmission. At present, urban drainage is considered as a vital
component of a sustainable urban system (Burian and Edwards, 2003).

16
2.2 EFFECTS OF URBANIZATION TO DRAINAGE
Water circulates in the hydrosphere through the maze of paths constituting
the hydrologic cycle. The cycle has no beginning or end, and its many processes
occur continuously (Chow et al., 1988). In nature, when rainwater falls on a natural
surface, some water returns to the atmosphere through evaporation, or transpiration
by plants, some infiltrates the surface as subsurface flow and further percolate deeper
to becomes groundwater and some portion runs off the surface as surface runoff
(Chow et al., 1988 and Butler and Davies, 2000). Figures 2.5 illustrate the hydrologic
cycles.
Butler and Davies (2000) stated that the relative proportions depend on the
nature of the surface and vary with time during the storm. For instance, the surface
runoff tends to increase as the ground becomes saturated. Both groundwater and
surface runoff are likely to find their way to a river, but surface runoff arrives much
faster. The groundwater will eventually contribute to the river system as general base
flow rather than being part of the increase in flow due to any precipitation.

17
Figure 2.5: Hydrologic Cycle with Global Annual Average Water Balance Given in
Units Relative to a Value of 100 for the Rate of Precipitation on Land (Chow et al., 1988)
An undeveloped area or forest is great collectors and storerooms of water.
Their root structure holds together the soil and their leaf litter gets broken down and
combined with minerals to form the equivalent of gigantic sponges which slowly
releasing water into surrounding areas at a dependable rate (World Wildlife Fund,
2009). The ability to grab soil will minimize the problem of erosion and
sedimentation. The infiltrated water into the sub-surface of soil will act as the source
of groundwater recharge. In this condition, even rains continuously from the forest
area, the downstream water level rise can still be controlled. Definitely, flooding
problems can be reduced drastically.
However, urbanization or replacing one part of the natural water cycle with
any artificial system of urban drainage has changed the hydrologic cycles (Butler and
Davies, 2000). Apart from that, numerous studies on the effects of landuse changes,
especially those related to urbanization, show that urbanization can have profound

18
impacts on the hydrologic cycles and its runoff characteristic (Mansell, 2003;
Noorazuan et al., 2003 and Buytaert et al., 2006).
In many urban areas, urban drainage is developed to direct the flow of water
generally originating from rainfall to the river system. The general effect of
urbanization is to reduce the amount of infiltration (Buytaert et al., 2006). In a study
done in Texas, it shows as much as 60% of infiltration is reduced due to urbanization
(Vicars-Groening and Williams, 2006). In reducing infiltration, the speed of runoff
will be increased as surface runoff travels quicker over hard surfaces and through
sewers than it does over natural surfaces and along natural streams (Mansell, 2003).
It has also impacted on daily base flow (Noorazuan et al., 2003) and thus poorer
recharge of groundwater reserves (Butler and Davies, 2000 and Hantush and Kalin,
2006).
There are also numerous studies done in other part of the United States such
as Colorado, Texas and Washington that indicate higher imperviousness in an area
will result greater peak discharge (Leopold et al., 2005; Vicars-Groening and
Williams, 2006 and Davis et al., 2006). According to the United States Forest
Service (2003), peak discharges generated from urban areas can be more than six
times greater than those in rural conditions. In a study done in Texas by Vicars-
Groening and Williams (2006), the results suggest that urbanization profoundly
impacts storm response more than doubling peak discharge and storm runoff volume.
The lag time between the precipitation peak and discharge peak can be reduced by a
factor of up to 8 in urban areas (Mansell, 2003). In other study in Texas, lag time can
decrease to about 25% (Vicars-Groening and Williams, 2006). A conceptual change
in hydrograph following urbanization is shown in Figure 2.6.

Figure 2.6: Conceptual (
The effect of urbanization on the overall response of a catchment tends to be
greater for small, frequent floods ra
the catchment is saturated and the extra runoff from the paved areas will be
(Mansell, 2003). From a study done in Langat River Basin, Malaysia by Noorazuan
et al. (2003), effects of urbanization has increased more than 50% increase of surface
runoff in 10 years time (1983
The other important effect of urbanization is that it increases the
the flood hazard (Mansell
aggravated the flooding problem in Bangladesh.
by storm drains and 60 percent of the land surface is covered by roads and buildings,
flooding frequency increases by a factor of six compar
(Khalequzzaman, 2004).
indicate that the rapid growth of the city from 1966 to 2002 has
effects on the catchments area,
and an increase peak discharge of the urba
Conceptual Changes in Hydrograph Following Urbanization
(Vicars-Groening and Williams, 2006)
The effect of urbanization on the overall response of a catchment tends to be
for small, frequent floods rather than more extreme events. In the latter case,
chment is saturated and the extra runoff from the paved areas will be
From a study done in Langat River Basin, Malaysia by Noorazuan
, effects of urbanization has increased more than 50% increase of surface
time (1983-1994).
The other important effect of urbanization is that it increases the
(Mansell, 2003 and Khalequzzaman, 2004). Rapid urbanization has
looding problem in Bangladesh. In Dhaka, a city that is
and 60 percent of the land surface is covered by roads and buildings,
flooding frequency increases by a factor of six compared to pre-urbanisation period
2004). In a study at metropolitan city of Mashhad, Iran,
indicate that the rapid growth of the city from 1966 to 2002 has excessive destructive
on the catchments area, thus has caused the decrease of impervious surfaces
increase peak discharge of the urban floods (Hosseinzadeh, 2005).
19
rbanization
The effect of urbanization on the overall response of a catchment tends to be
In the latter case,
chment is saturated and the extra runoff from the paved areas will be marginal
From a study done in Langat River Basin, Malaysia by Noorazuan
, effects of urbanization has increased more than 50% increase of surface
The other important effect of urbanization is that it increases the exposure to
apid urbanization has
totally served
and 60 percent of the land surface is covered by roads and buildings,
urbanisation period
Iran, the results
excessive destructive
decrease of impervious surfaces
005).

20
There is also some evidence that urban areas can actually increase the amount
of precipitation. The increase in precipitation in urban areas can be up to 15%
(Mansell, 2003). It is resulted from the higher temperatures in urban areas that will
increase convection and the roughness of the surfaces which enhances the upward
movement of air. However in studies done by Pitman (2004) in southwest Western
Australia and Kaufmann et al. (2006) in Pearl River Delta, China show that urban
precipitation deficit occurs in which urbanization reduces local precipitation. This
reduction may be caused by changes in surface hydrology that extend beyond the
urban heat island effect and energy-related aerosol emissions.
The change of drainage patterns from the provision of artificial stormwater
drainage as well as water supply and foul drainage system has contributed an effect
on the water balance (Mansell, 2003 and Buytaert et al., 2006). An extensive
stormwater drainage system will direct water into channels and rivers rather than
allowing it to infiltrate into the ground. The direct consumption of this water is
generally less than 10% and most of the water will end up either being removed by
the drainage system or recharging the groundwater through leaking pipes (Mansell,
2003).
Another effect of urbanization on drainage is the implication on water quality.
The balance between the sediment transport capacity of a stream or channel and the
amount of sediment delivered from its watershed is disrupted. Uncontrolled or
unregulated development increases stormwater runoff that causes downstream
flooding and accelerates channel erosion and sediment carried downstream (Rohrer,
2004). The rapid runoff of stormwater will also cause pollutants to be washed off the
surface (Mansell, 2003). In an developed environment, there are likely to be more
pollutants on the catchment surface and in the air than there will be in a natural

21
environment. Also, drainage systems in which there is mixing of wastewater and
stormwater may allow pollutants from the wastewater to enter the river (Mansell,
2003). In Malaysia, the problem of wastewater and stormwater mixing will not rather
happen as separated drainage system is used.
In summary, the effects of urbanization on drainage which replaces natural
drainage by urban drainage are to reduce infiltration and groundwater recharge,
produce higher and more sudden peak discharge and flooding frequency.
Urbanisations will disrupt the water balance cycle and hydrologic cycles. In other
extent, it introduces pollutants and increase sediment transport thus degrades the
water quality of the river. Table 2.1 depicts the general effects on environment due to
urbanization compared to rural environment.
Table 2.1: Effects on Environment due to Urbanization (United States Forest Service, 2003)
Element Compared to Rural Environs Contaminants Condensation nuclei
(particles that serve to attract condensation) 10 times more
Paticulates (e.g. soot) 50 times more Gaseous admixtures (mixtures of5–25 times more polluting gases)
5-25 times more
Radiation Total on horizontal surface 0–20% less Ultraviolet, winter 30% less Ultraviolet, summer 5% less
Cloudiness Clouds 5–10% Fog, winter 100% more Fog, summer 30% more
Precipitation Amounts 5–15% more Days with less than 5 mm 10% more Snowfall, inner city 5-10% more Snowfall, lee of city 10% more Thunderstorms 10-15% more
Temperature Annual mean 0.5–3.0°C more Winter minimums (average) 1–2°C more Summer maximums 1–3°C more Heating degree days 10% less
Relative Humidity
Annual mean 6% less Winter 2% less Summer 8% less
Wind speed Annual mean 20-30% less Extreme gusts 10-20% less Calm 5-20% more

22
2.3 URBAN DRAINAGE SYSTEM IN MALAYSIA
In Malaysia, the drainage system is a separate system where different systems
are used to handle stormwater and wastewater separately. This is partly due to easier
system management and the design capacity for the respective system can be
minimized. Apart from that, wastewater and stormwater carried in separate pipes
could avoid pollution associated with them (Butler and Davies, 2000). Despite of the
advantages of the separate system, this type of system can induced higher
construction and material cost due to the usage of two type of piping system to be
utilized for stormwater and wastewater respectively. Separate system requires more
spaces to occupy as compared to combined drainage system. In early year, the
provision of stormwater drainage works was performed by the Hydraulics Branch,
Public Works Department until the formation of Department of Irrigation and
Drainage (DID) in 1st January 1932 (Wikipedia, 2008). DID is under the Ministry of
Natural Resources and Environment since 2004. The maintenance of the sanitary or
wastewater drainage system lies under the Local Authorities, Ministry of Housing
and Local Government.
Traditionally, stormwater management in Malaysia focused primarily on
managing the impacts of flooding by adopting a conveyance-oriented approach (DID,
2000). The traditional drainage systems were designed to collect runoff and
immediately dispose as quickly and efficiently as possible to downstream channel.
This is in order to minimize damage and disruption within the collection area.
The first urban drainage manual, “Planning and Design Procedures No.1:
Urban Drainage Design Standards and Procedures for Peninsular Malaysia” was
published by DID, Malaysia in 1975 (DID, 2008). This manual was prepared as a
guideline for engineers in drainage system design and had been referred by various

23
agencies at federal and state level for the drainage requirements needed in new
development of urban areas. The manual was in use as a guideline for more than
twenty five years since its publication.
However, through the time, a potentially effective and preferable approach to
stormwater management is the storage-oriented approach. A new Stormwater
Management Manual in Malaysia (MSMA) has been introduced and published in
2000 by DID and officially approved by Cabinet in 1 January 2001 to promote this
approaches and steer drainage development (Yong and Md Noh, 2005).
MSMA promotes new approaches to manage the urban drainage in the
country and incorporate the environmental friendly concepts in designing the overall
drainage system in the new develop areas. The control at source concepts has been
strengthened in the manual. There is more emphasis on managing the stormwater in a
more sustainable manner through Best Management Practices (BMPs). BMPs in
stormwater management involves constructing detention and retention facilities such
as dry and wet detention ponds, infiltration, groundwater recharge, porous pavements
for infiltration, swales and provision of rough surface to retard flow reaching the
watercourse and decrease the peak flow of runoff. There are several recent examples
of the implementation of the concepts in new developments in the country. For
instance, at the Federal Government Administrative Center in Putrajaya as shown in
Figure 2.7, this new approach has been applied by incorporating the lake and wetland
as storage and purifier of stormwater. There are new housing developments adopting
the control at source concept as shown in Figure 2.8 such as Kota Warisan, Bandar
Baru Salak Tinggi, Selangor, Sierramas in Kepong, Selangor, Diamond Creek in
Tanjung Malim, Perak and Leisure Farm in Johore. Others implementations include
the constructing of swales as shown in Figure 2.9 to replace the rigid concrete drains

24
at Engineering Campus, Universiti Sains Malaysia, Penang and the provision of
porous pavement for parking as shown in Figure 2.10 in Taman Botani, Putrajaya. In
designing the BMPs for drainage system, a new approach is taken through the use of
available computer models. At present, even though the numerical modelling of
drainage system is still lacking in Malaysia, it is getting more popular in recent years
due to the time and cost saving.
Figure 2.7: Wetland at Putrajaya
Figure 2.8: Regional Detention Pond in Kota Warisan, Bandar Baru Salak Tinggi,
Selangor
Outlet Culvert
Regional Pond
Wetland