Embed Size (px)
Citation preview
This publication is available free of charge from http://dx.doi.org/10.6028/NIST.TN.1850
NIST Technical Note 1850
Performance of Portable Radios
Exposed to Elevated Temperatures
Michelle K. Donnelly
William F. Young
Dennis Camell
http://dx.doi.org/10.6028/NIST.TN.1850
This publication is available free of charge from http://dx.doi.org/10.6028/NIST.TN.1850
NIST Technical Note 1850
Performance of Portable Radios
Exposed to Elevated Temperatures
Michelle K. Donnelly
Fire Research Division
Engineering Laboratory
William F. Young
Dennis Camell
Electromagnetics Division
Physical Measurements Laboratory
This publication is available free of charge from:
http://dx.doi.org/10.6028/NIST.TN.1850
September 2014
U.S. Department of Commerce Penny Pritzker, Secretary
National Institute of Standards and Technology
Willie May, Acting Under Secretary of Commerce for Standards and Technology and Acting Director
This publication is available free of charge from http://dx.doi.org/10.6028/NIST.TN.1850
Disclaimer
Certain commercial entities, equipment, instruments, standards or materials may be identified in this document in
order to describe an experimental procedure, equipment, or concept adequately. Such identification is not intended
to imply recommendation or endorsement by the National Institute of Standards and Technology, nor is it intended
to imply that the entities, standards, materials, or equipment are necessarily the best available for the purpose.
National Institute of Standards and Technology Technical Note 1850
Natl. Inst. Stand. Technol. Tech. Note 1850, 41 pages (September 2014)
CODEN: NTNOEF
This publication is available free of charge from:
http://dx.doi.org/10.6028/NIST.TN.1850

This publication is available free of charge from http://dx.doi.org/10.6028/NIST.TN.1850
iii
Abstract
This study investigates the performance issues associated with the use of handheld portable
radios by fire fighters working in elevated temperature environments. Radios may be vulnerable
to elevated temperatures that can be encountered during firefighting activities. Controlled,
repeatable, well characterized test methods were used to measure radio performance. The radios
were exposed to elevated temperature environments for specific temperatures and times. At
Thermal Class I conditions of 100 °C for 25 min, all of the radios tested maintained frequency
stability. At Thermal Class II conditions of 160 °C for 15 min, all of the radios tested
experienced signal drift of the mean maximum-power frequency. Some of the radios stopped
transmitting during the testing.

This publication is available free of charge from http://dx.doi.org/10.6028/NIST.TN.1850
iv
Table of Contents
Introduction ................................................................................................................... 1
Apparatus and Equipment ............................................................................................ 3
Testing Procedure ......................................................................................................... 8
Results and Discussion .............................................................................................. 10
Conclusions ................................................................................................................. 30
References ................................................................................................................... 31
Acknowledgements ..................................................................................................... 32
Appendix A .................................................................................................................. 33
Appendix B .................................................................................................................. 37

This publication is available free of charge from http://dx.doi.org/10.6028/NIST.TN.1850
1
Introduction
Portable handheld radios are widely used during firefighting operations, and these radios
are often exposed to the elevated temperatures that are typically present in a fire environment.
Radios, like other electronic equipment, can be vulnerable to elevated temperatures. Previous
investigations have shown that radios may suffer physical damage, such as melting and
deforming, as well as operational difficulties when exposed to elevated temperature
environments [1]. Performance problems with portable radios have been identified by the
National Institute for Occupational Safety and Health (NIOSH) as contributing factors in some
fire fighter fatalities [2]. To investigate the impact of elevated temperatures on radio operations,
experiments were conducted to measure the performance of portable radios exposed to elevated
temperatures. The goal of this investigation is to develop scientifically based performance
standards for fire fighter portable radios.
Currently, the National Fire Protection Association (NFPA) has no specific standards in
place for portable radios and other two-way communication devices. These types of devices are
broadly covered by NFPA 1221: Standard for Installation, Maintenance and Use of Emergency
Services Communications Systems [3]. The general usage of two-way portable equipment is
referred to in NFPA 1221 Section 9.3.6. The only requirements in this standard relating to radio
operation in the fire environment are found in Section 9.3.6.2, which states “Portable radios shall
be manufactured for the environment in which they are to be used and shall be of a size and
construction that allow their operation with the use of one hand,” and Section 9.3.6.12, which
states “Portable radios used by first responders who might encounter hazardous conditions likely
to cause fire or explosion because of the release of flammable liquids or gases shall be rated as
Intrinsically Safe by a recognized testing authority, if determined necessary by the AHJ.” No
further information is given to specify details of the “environment” in which the radios are to be
used, and no testing procedures or performance criteria are outlined in the standard.
To address the lack of performance standards for fire fighter portable radio equipment,
the NFPA Technical Committee for Electronic Safety Equipment has proposed the development
of a standard for portable radios used by emergency service personnel. The information in this
paper provides data and performance measurements relevant to the development of the new
standard.
Because of the lack of standards for portable radios, operation guidelines and
performance criteria have been left to the radio manufacturers. Many of the manufacturers list
maximum operating temperatures of 60 °C for the radios to be used by fire fighters. This
temperature falls well below temperatures that a fire fighter could encounter while operating in a
fire environment. Previous work studying the performance of electronic equipment used by first
responders in elevated temperature environments led to the development of a Thermal Class
system for categorizing the operation of electronic equipment exposed to thermal conditions [4].
This publication is available free of charge from http://dx.doi.org/10.6028/NIST.TN.1850
2
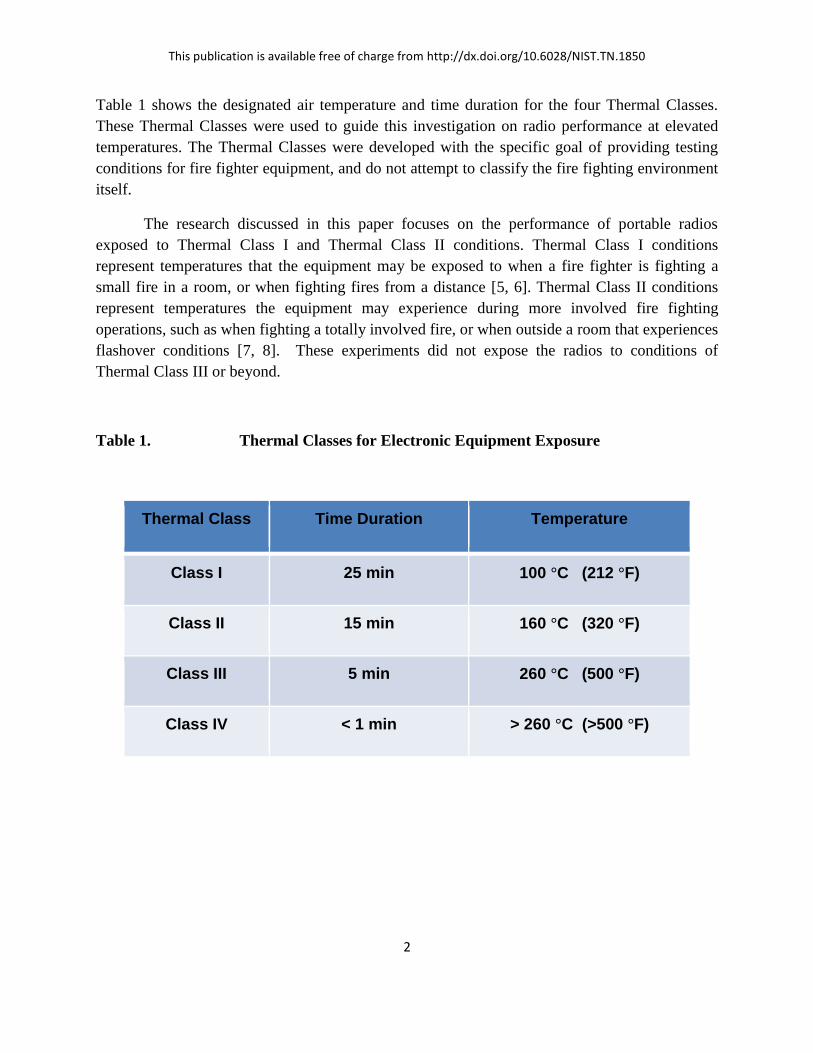
Table 1 shows the designated air temperature and time duration for the four Thermal Classes.
These Thermal Classes were used to guide this investigation on radio performance at elevated
temperatures. The Thermal Classes were developed with the specific goal of providing testing
conditions for fire fighter equipment, and do not attempt to classify the fire fighting environment
itself.
The research discussed in this paper focuses on the performance of portable radios
exposed to Thermal Class I and Thermal Class II conditions. Thermal Class I conditions
represent temperatures that the equipment may be exposed to when a fire fighter is fighting a
small fire in a room, or when fighting fires from a distance [5, 6]. Thermal Class II conditions
represent temperatures the equipment may experience during more involved fire fighting
operations, such as when fighting a totally involved fire, or when outside a room that experiences
flashover conditions [7, 8]. These experiments did not expose the radios to conditions of
Thermal Class III or beyond.
Table 1. Thermal Classes for Electronic Equipment Exposure
Thermal Class Time Duration Temperature
Class I 25 min 100 °C (212 °F)
Class II 15 min 160 °C (320 °F)
Class III 5 min 260 °C (500 °F)
Class IV < 1 min > 260 °C (>500 °F)

This publication is available free of charge from http://dx.doi.org/10.6028/NIST.TN.1850
3
Apparatus and Equipment
Figure 1. NIST Thermal Exposure Flow Loop
The NIST thermal exposure flow loop provided the elevated temperature environment for
the portable radio exposure experiments. The thermal exposure flow loop is electronically
controlled with recirculating airflow, providing a well-defined, repeatable, convective heating
environment. The flow loop can be used to expose items to elevated temperatures with varying
airflow rates and thermal conditions. Figure 1 is a diagram of the thermal exposure flow loop
apparatus. The main parts of the flow loop are the blower, heater, test section, and airflow
return. The flow loop measures 4.09 m in total length from the heater section to the airflow duct,
not including the blower. The top of the flow loop is at a height of 2.49 m. The maximum width
of the flow loop (0.91 m) occurs at the test section. A more detailed diagram of the flow loop is
included in the Appendix, Figure A1.

This publication is available free of charge from http://dx.doi.org/10.6028/NIST.TN.1850
4
The thermal exposure flow loop provides an environment for exposing items to a
convective heat flow at a controlled air temperature up to 300 °C. The air is heated to the desired
temperature using a 50 kW electric air duct heater. A variable speed electric blower located
below the heater circulates the air through the flow loop. The flow can be adjusted, allowing for
control of the air velocity at the test section from 0.5 m/s to 1.4 m/s. A return airflow duct
carries the air back to the blower, where it is recirculated through the loop.
Items to be tested are mounted to a 0.60 m by 0.38 m moving platform located directly
below the test section, which is used to insert and remove items from the test section. The radio
was secured on the platform in the upright position by a support post and equipment holder. A
photograph showing one of the radios on the platform is shown in Figure 2. The support post
and holder are adjusted so the center of the radio body is located at the center of the cross
sectional area of the test section when the radio is inserted in the flow loop. The grips of the
holder in contact with the radio are covered with sleeves made from aramid fabric to insulate the
grips and reduce heat transfer from the grips to the radio. Insulated wiring was used to further
secure the radio in place.
Figure 2. Photo of radio mounted on the flow loop platform

This publication is available free of charge from http://dx.doi.org/10.6028/NIST.TN.1850
5
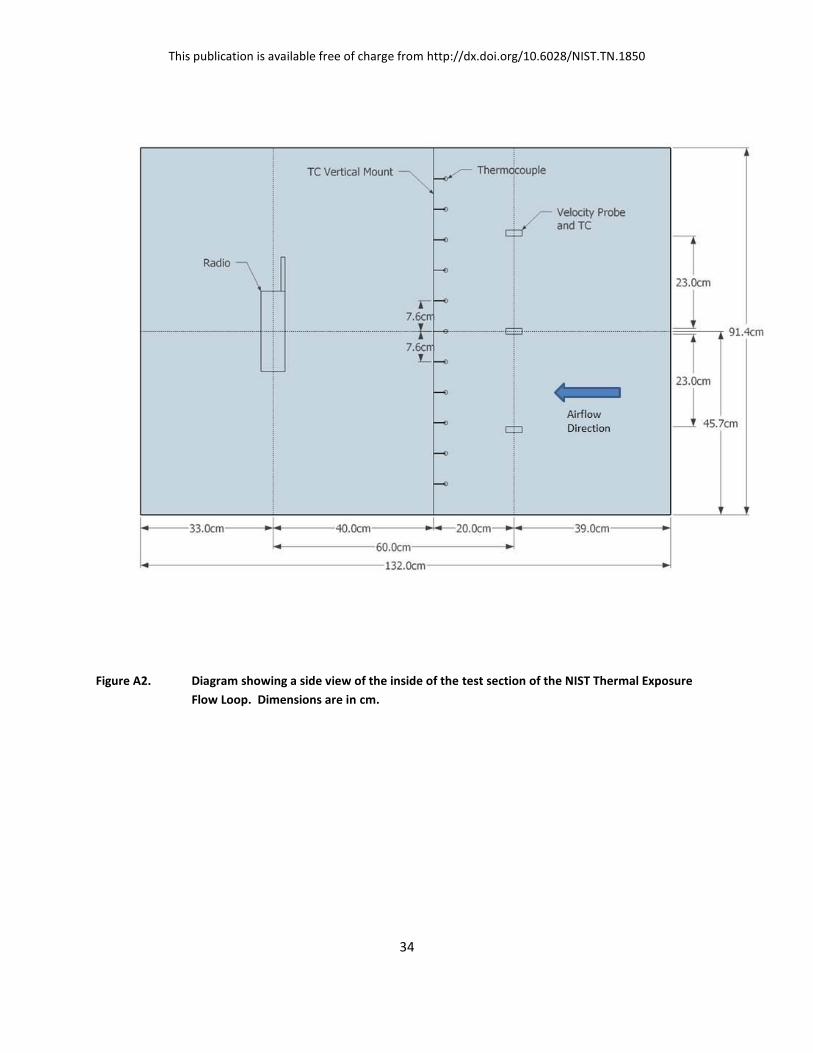
The test section of the flow loop has a 0.91 m by 0.91 m cross sectional area and is 1.3 m
in length. Instrumentation inside the flow loop measures airflow velocities and temperatures.
Experiments may be performed at a constant temperature and velocity or these may be varied
during testing. A diagram showing the side view of the test section of the flow loop, with
detailed dimensions and instrumentation locations is shown in the Appendix, Figure A2. The
bottom of the test section is equipped with a sliding door. The door opens to allow items on the
platform below to access the test section. When the platform is fully raised, it seals the bottom
opening of the test section.
The airflow velocity in the test section was measured using three bidirectional
velocity probes. The center velocity probe was placed at the center of the cross sectional area of
the flow loop, 0.6 m upstream of the radio test location, as shown in Figure A2. An upper
velocity probe was located 23 cm directly above the center probe and a lower probe was located
23 cm directly below the center probe. All three probes were positioned to measure the velocity
in the direction of the airflow. To obtain velocity measurements, the probes used pressure
transducers that measured the differential pressures, and thermocouples that measured the
temperatures at the probe locations. The pressure transducers were factory calibrated, with an
accuracy of ± 1% [9], and the experimental uncertainty was estimated to be ± 10 %. The
uncertainty of the thermocouple measurements was ± 15 %, as discussed below. For all of these
tests, the blower was set to the maximum rate, resulting in an average airflow velocity in the test
section of 1.4 m/s. The estimated total expanded uncertainty (two standard deviations) for the
velocity measurements was ± 18 %.
Temperatures were measured using type-K thermocouples. The sampling rate for the
thermocouple measurements was 1 Hz. Thermocouples located inside the flow loop measured
the airflow temperature at various locations, as shown in Figure A2. Stainless steel sheathed
thermocouples, 3.2 mm diameter, were located next to each of the bidirectional velocity probes
to measure the local temperatures. Ten bare-bead thermocouples, nominally 1 mm diameter,
were positioned on a vertical mount located 0.4 m upstream of the test location and centered
0.46 m from each of the vertical walls of the test section. The thermocouples were spaced 7.6 cm
apart along the vertical mount, starting 7.6 cm below the ceiling of the test section.
The thermocouples were subject to measurement uncertainty due to material variation
and radiative heating from the flow loop. The measurement uncertainty (one standard deviation)
for the thermocouple wire was ± 2.2 °C as listed by the manufacturer [10]. The estimated
experimental uncertainty (two standard deviations) for the thermocouple measurements was
± 15 %. The uncertainties in the remainder of the paper are expressed in terms of estimated
experimental uncertainty (two standard deviations).
Elevated temperature exposure tests were conducted at two of the Thermal Class
conditions described in Table 1, namely Thermal Class I conditions at nominally 100 °C for
This publication is available free of charge from http://dx.doi.org/10.6028/NIST.TN.1850
6
25 min and Thermal Class II conditions at nominally 160 °C for 15 min. The temperature in the
test section of the flow loop was measured using the bare-bead thermocouple located on the
vertical mount at the center of the cross sectional area of the test section, which corresponded to
the height and depth of the center of the radio body during testing. This thermocouple was used
to control the flow loop heater setting. An example of the temperatures measured in the test
section of the flow loop during one of the Thermal Class I exposure tests nominally at 100 °C is
shown in Appendix Figure A3. The plot shows the temperature measured by the thermocouple
located on the vertical mount at the centerline, as well as the temperatures measured by the
thermocouples 7.6 cm above and 7.6 cm below the centerline. Temperatures at these heights are
shown because they fall within the height locations of the radio during testing. The average
temperature at the centerline was 100.2 °C ± 1.7 °C. The average temperature 7.6 cm above the
centerline was 100.2 °C ± 1.4 °C, and the average temperature 7.6 cm below the centerline was
100.1 °C ± 1.7 °C. Similar measurements were made for each test, resulting in average
temperatures between 100 °C and 103 °C, with a maximum expanded variance of 3.2 °C.
For the Thermal Class II exposure tests nominally at 160 °C, an example of the
temperatures measured in the test section is shown in Appendix Figure A4. Again, the
temperatures measured by the thermocouples located on the vertical mount at the centerline,
7.6 cm above and 7.6 cm below the centerline are plotted. For the test shown, the average
temperature at the centerline was 160.1 °C ± 1.7 °C. The average temperature 7.6 cm above the
centerline was 160.4 °C ± 1.2 °C, and the average temperature 7.6 cm below the centerline was
159.8 °C ± 1.7 °C. Similar measurements were obtained for each of the experiments at Thermal
Class II conditions with average temperatures measuring between 159 °C and 162 °C with a
maximum expanded variance of 2.7 °C.
This publication is available free of charge from http://dx.doi.org/10.6028/NIST.TN.1850
7
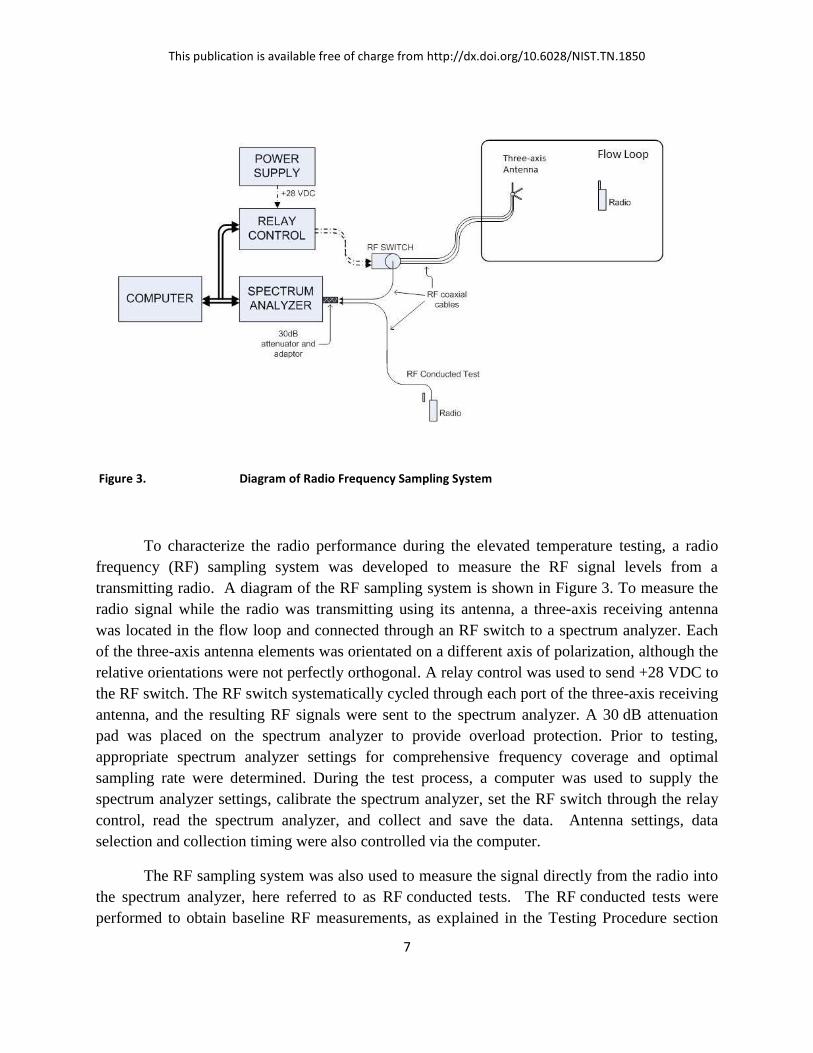
Figure 3. Diagram of Radio Frequency Sampling System
To characterize the radio performance during the elevated temperature testing, a radio
frequency (RF) sampling system was developed to measure the RF signal levels from a
transmitting radio. A diagram of the RF sampling system is shown in Figure 3. To measure the
radio signal while the radio was transmitting using its antenna, a three-axis receiving antenna
was located in the flow loop and connected through an RF switch to a spectrum analyzer. Each
of the three-axis antenna elements was orientated on a different axis of polarization, although the
relative orientations were not perfectly orthogonal. A relay control was used to send +28 VDC to
the RF switch. The RF switch systematically cycled through each port of the three-axis receiving
antenna, and the resulting RF signals were sent to the spectrum analyzer. A 30 dB attenuation
pad was placed on the spectrum analyzer to provide overload protection. Prior to testing,
appropriate spectrum analyzer settings for comprehensive frequency coverage and optimal
sampling rate were determined. During the test process, a computer was used to supply the
spectrum analyzer settings, calibrate the spectrum analyzer, set the RF switch through the relay
control, read the spectrum analyzer, and collect and save the data. Antenna settings, data
selection and collection timing were also controlled via the computer.
The RF sampling system was also used to measure the signal directly from the radio into
the spectrum analyzer, here referred to as RF conducted tests. The RF conducted tests were
performed to obtain baseline RF measurements, as explained in the Testing Procedure section

This publication is available free of charge from http://dx.doi.org/10.6028/NIST.TN.1850
8
below. For the RF conducted tests, the three-axis antenna and RF switch were bypassed and the
radio was connected directly to the spectrum analyzer through a coaxial cable.
Testing Procedure
Prior to each elevated temperature test, an RF conducted test was performed for each
radio to establish a baseline signal for the radio. For the RF conducted tests, the radio was
located outside the flow loop and was at ambient temperature. The radio antenna was removed
and a coaxial cable was connected from the radio directly to the spectrum analyzer. The signal
was triggered by pushing the push-to-talk (PTT) button on the radio. The RF signal was
measured for 60 s. The radio antenna was then replaced, and the portable radio was readied for
elevated temperature testing.
For each elevated temperature test, the portable radio was secured in the equipment
holder on the platform below the test section of the flow loop. The RF sampling system was used
to collect an initial RF signal as measured by the three-axis antenna at ambient temperature. As
with the RF conducted test, the radio signal was triggered with the PTT button, and 60 s of signal
data was collected. But unlike the RF conducted test, the signal was transmitted via the radio
antenna, received by the three-axis antenna, and relayed to the spectrum analyzer through the RF
switch system.
Next, the flow loop blower and heater were started. The airflow velocity and temperature
were selected. When the required airflow velocity and temperature were reached, the bottom of
the flow loop test section was opened and the equipment platform was raised into the test
section. The platform was fully raised, exposing the radio to the heated airflow, and closing the
bottom of the test section. At periodic intervals throughout the experiment, the PTT button on the
radio was depressed using a remote activating arm, and the resulting RF signal was collected by
the three-axis antenna and measured using the RF sampling system. After a predetermined time,
the platform with the radio equipment was removed from the flow loop. Outside of the flow
loop, within 60 s to 90 s after removal of the radio from the flow loop, a final measurement of
the RF signal was collected using the RF sampling system in the three-axis antenna
configuration.
Five different radio models were tested. Three model A radios were tested, and one each
of models B, C, D, and E were tested at each Thermal Class condition. In these tests, the radio
was positioned so that the front face of the radio faced into the direction of the flow. In addition,
the radio was always fully exposed to the flow. It was not placed in any pocket or other
protective device as in previous tests [1]. The purpose for this testing was to provide information
for development of a standard, so the worst case scenario of a fully exposed radio was chosen.
All experiments were performed with the radios set to transmit at a frequency of
162.175 MHz in the very high frequency (VHF) band. This was a local government frequency

This publication is available free of charge from http://dx.doi.org/10.6028/NIST.TN.1850
9
that was available to use for testing. Because the housing materials, oscillator circuity, other
radio components are common to all radios, similar results are expected for radios operating in
other frequency bands.
Battery Considerations
The batteries used to operate the radios under elevated temperature conditions are a
concern due to the adverse effects of heat on batteries. It is important for the batteries to be able
to operate safely when exposed to elevated temperatures. Recently, manufactures have been
using new battery technologies to decrease the size and weight of the batteries and to increase
performance. Most radio manufacturer specifications list the maximum operating temperature for
the batteries as 60 °C.
Some batteries may be hazardous when used in an elevated temperature environment.
Lithium-ion (Li-ion) batteries may pose a danger of fire or explosion when operated in an
elevated temperature environment. Exposure to elevated temperatures can cause a decomposition
reaction in the Li-ion batteries, which can eventually lead to thermal runaway [11, 12]. During
thermal runaway, the temperature and pressure inside the battery rises faster than can be
dissipated, which can result in fire or explosion. The critical temperature for thermal runaway
depends on the specific chemical makeup, but can occur at temperatures around 150 °C to
175 °C [12, 13]. As battery technologies are evolving, battery manufacturers are developing
approaches to improve the thermal performance of these batteries and to safeguard against
thermal failures by installing shutdown separators [13] or adding thermal runaway inhibitors
[14].
Batteries for portable radios are not standardized. Most batteries are specific to the
manufacturer and even to the model of radio. Some radios on the market today offer options for
batteries of different chemical make-up. In some cases, third party batteries are also available.
In most cases, the battery housing makes up some of the body of the radio itself. Because
batteries contribute to the structural integrity of the radio, impact radio performance, and may
introduce additional hazards, it is crucial that the specific battery type used in the radio during
fire fighting operations is included in any elevated temperature exposure testing related to
standards certification. Any fire fighter radio standard should require that the radio body and
battery be tested together as a unit, and that standard certification applies to the radio and battery
as a unit.
For some of the radios tested in this set of experiments, multiple battery types were
available. All of the testing described in this document was performed using radios powered by
nickel-metal hydride (Ni-MH) batteries. The batteries were supplied by the radio manufacturers.
Third-party batteries were not used for these tests.

This publication is available free of charge from http://dx.doi.org/10.6028/NIST.TN.1850
10
Results and Discussion
Conducted Results
The data collected during the measurement process are presented in several forms. The
RF signal as measured directly by the spectrum analyzer was a measurement of the signal power
over the frequency spectrum. When the radio was placed in transmit mode, an RF signal was
generated with the peak signal power ideally occurring at the radio transmitter frequency.
Figure 4 shows a sample RF signal for a conducted test as measured by the spectrum analyzer.
In this sample signal, the signal power was concentrated at the radio’s selected transmission
frequency of 162.175 MHz. The plot represents a snapshot of the RF signal at a given time.
Radio power is shown in decibel-milliwatts (dBm), which is a typical format used in the
communication industry. Power in dBm is plotted on a logarithmic scale, and is offset such that
0 dBm represents 1 mW. A larger number corresponds to a higher power reading. See
Appendix B for further explanation of the radio power measurements. For all of the signal
measurements by the spectrum analyzer, a 30 dB attenuation pad was used to protect the
equipment from overload.
Figure 4. RF measurement for a conducted test as displayed on a spectrum analyzer
-140
-120
-100
-80
-60
-40
-20
162.165 162.17 162.175 162.18 162.185
Conducted Test Sample Signal
Po
wer
(dB
m)
Frequency (MHz)
This publication is available free of charge from http://dx.doi.org/10.6028/NIST.TN.1850
11
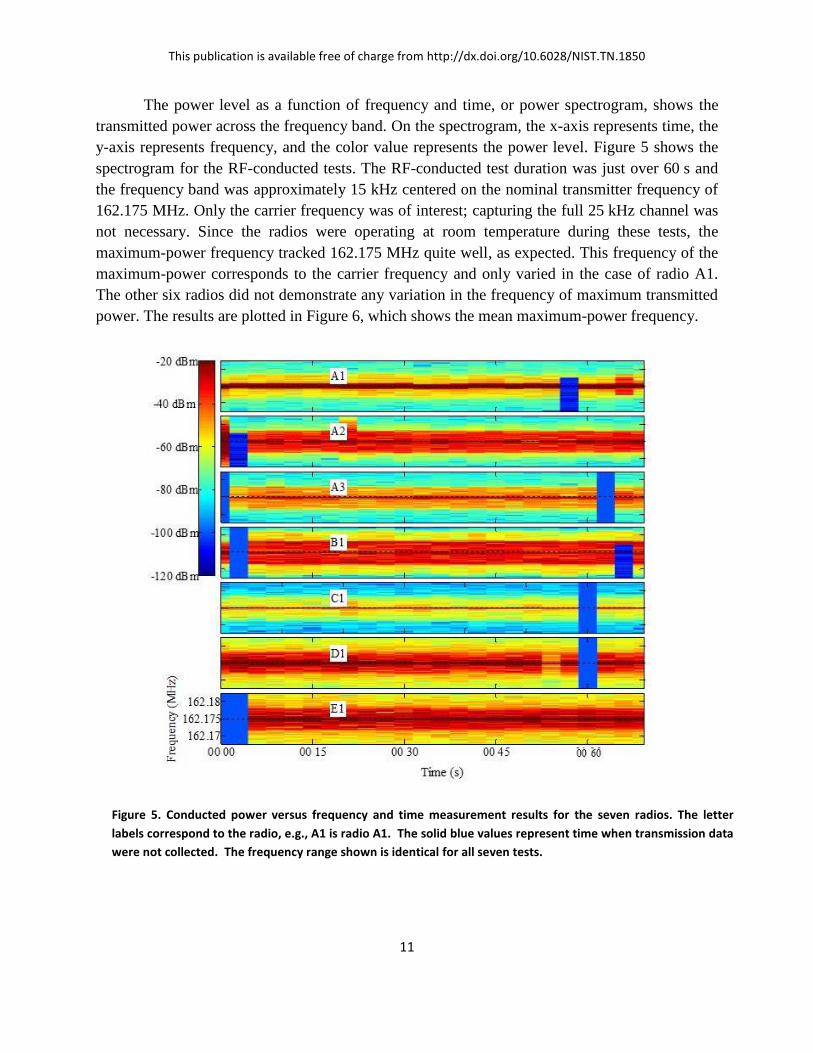
The power level as a function of frequency and time, or power spectrogram, shows the
transmitted power across the frequency band. On the spectrogram, the x-axis represents time, the
y-axis represents frequency, and the color value represents the power level. Figure 5 shows the
spectrogram for the RF-conducted tests. The RF-conducted test duration was just over 60 s and
the frequency band was approximately 15 kHz centered on the nominal transmitter frequency of
162.175 MHz. Only the carrier frequency was of interest; capturing the full 25 kHz channel was
not necessary. Since the radios were operating at room temperature during these tests, the
maximum-power frequency tracked 162.175 MHz quite well, as expected. This frequency of the
maximum-power corresponds to the carrier frequency and only varied in the case of radio A1.
The other six radios did not demonstrate any variation in the frequency of maximum transmitted
power. The results are plotted in Figure 6, which shows the mean maximum-power frequency.
Figure 5. Conducted power versus frequency and time measurement results for the seven radios. The letter
labels correspond to the radio, e.g., A1 is radio A1. The solid blue values represent time when transmission data
were not collected. The frequency range shown is identical for all seven tests.

This publication is available free of charge from http://dx.doi.org/10.6028/NIST.TN.1850
12
To relate the data to a common radio performance metric, Figure 7 shows the
maximum-power frequency as a deviation from the nominal carrier frequency of 162.175 MHz.
In addition, these resulting frequency deviations are expressed in parts-per-million (ppm), and
provide a common measure of frequency stability (see Figure 7). The Federal Communications
Commission (FCC) and the radio manufacturers specify acceptable frequency drift limits in units
of ppm. In order for the received signal to be properly demodulated and to avoid interfering with
adjacent radio frequency channels, the transmitted signal must remain very near the assigned
frequency. Since the amount of acceptable drift in frequency is quite small relative to the carrier
frequency, the change in frequency is measured in ppm rather than percent. The equation for
computing the change in frequency relative to the nominal carrier frequency is as follows:
f c
f 0000001ppmdriftFrequency , (1)
where f c is the carrier frequency and f is the difference between the measured carrier
frequency and the nominal carrier frequency.
A1 A2 A3 B1 C1 D1 E1162.174
162.1745
162.175
162.1755
162.176
Radio
Fre
quen
cy (
MH
z)
Figure 6. Mean maximum-power frequency for the RF conducted tests. The maximum power frequency
corresponded to the carrier frequency. Dash marks indicate 1σ, and triangles indicate 2σ. The standard
deviations, 1σ and 2σ, in the maximum-power frequency for radio A1 were large relative to the standard
deviations measured for the other radios. For radios A2, A3, B1, C1, D1 and E1, 1σ and 2σ were small and are
barely visible behind the data symbols in the plot.

This publication is available free of charge from http://dx.doi.org/10.6028/NIST.TN.1850
13
As Figure 7 shows, only radio A1 demonstrated any significant variation in frequency
stability. The other six radios exhibited a frequency deviation of less than 1 ppm, with 2σ much
less than 1 ppm for all the measurements. Radio A1 showed a mean frequency deviation of less
than 1 ppm, but 2σ was slightly greater than 5 ppm for that frequency deviation. These data can
be compared with standards such as the Telecommunications Industry Association (TIA) on land
mobile radios [15], where the performance criteria are derived from the FCC regulations 47 CFR
90.213 and 90.539. Table 30 of TIA-603-D states that the frequency stability shall be within
5.0 ppm for the 162.175 MHz radios. The RF conducted test results show that while at ambient
temperature before the elevated temperature exposure tests, the radios were all operating within
the FCC frequency stability limits and the TIA standard.
Note that the term deviation is used in two contexts here; one with respect to the change
in frequency relative to the carrier frequency and the other, σ, as in the statistical standard
deviation of the measurement. The uses are consistent with the standard language for describing
the two measures.
A1 A2 A3 B1 C1 D1 E1
-5
-4
-3
-2
-1
0
1
2
3
4
5
Radio
Dev
iati
on (
ppm
)
Figure 7. Mean maximum-power frequency deviation for the RF conducted tests. The frequency deviation was
relative to 162.175 MHz. Dash marks indicate 1σ, and triangles indicate 2σ. For all radios except A1, 1σ and 2σ
were small, and are barely visible behind the data symbols. For radio A1, 1σ was within the TIA-603-D standard
range, however 2σ fell slightly out of the ± 5 ppm range. For the other radios, 1σ and 2σ were well within the
± 5 ppm set forth in the TIA-603-D standard [10].

This publication is available free of charge from http://dx.doi.org/10.6028/NIST.TN.1850
14
100 °C Results
The first set of experiments at elevated temperature conditions were performed at
Thermal Class I conditions of 100 °C for 25 min. In these tests, the three-axis antenna was
located inside the flow loop and the radio used the manufacturer supplied antenna. Due to objects
in the laboratory, the metallic walls of the heat flow loop, the relatively close proximity of the
antenna probe to the transmitting radio, and other experiment limitations, accurate transmitted
power levels were not measurable. However, the carrier frequency was identified by the
maximum-power frequency. Results are shown for each of the three antenna elements.
Figure 8 shows the spectrograms for antenna 1. The carrier frequency is identified by its
relatively high power centered near 162.175 MHz. The solid blue sections (i.e., -100 dBm)
indicate times when the radio was not transmitting. White sections of the plot indicate that the
test was completed. When the radio was transmitting, the measured power level varied across the
frequency range with a maximum level near 162.175 MHz. The radios were on for at least 60 s.
After 60 s, some of the radios were turned on again; this event is evident by a narrow blue solid
line in an otherwise active transmission time. Radio B1 also showed a very narrow active region
when the radio was inadvertently on. The data from this short transmission were not used in the
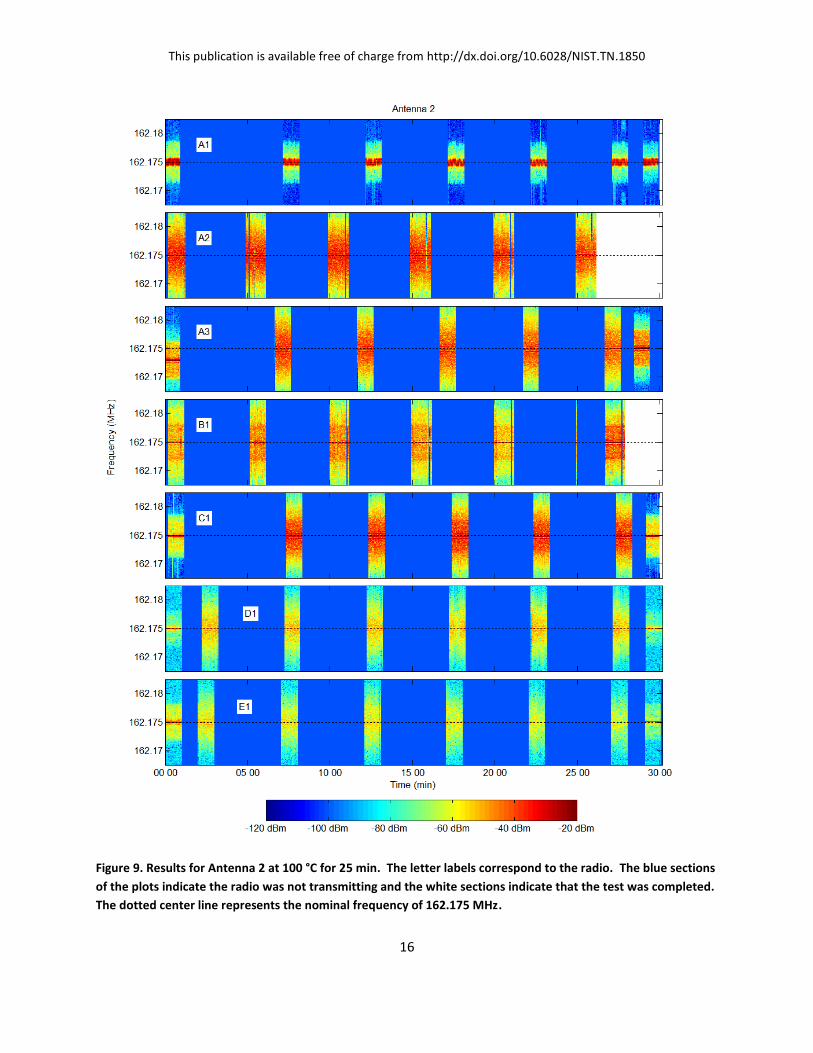
subsequent analysis. Figure 9 and Figure 10 show the results for the other two antenna elements.
The power levels are different, but the same behavior in the carrier frequency was observed.
An important consideration when interpreting the frequency variation is that the data
were collected in a confined metallic structure with the three-axis receiving antenna located in
the near-field (electromagnetic field) of the transmitting radio. This can cause more variability in
the maximum-power frequency than if an RF conducted measurement process is used. The
drawback of an RF conducted measurement is that the radio antenna is not included. Thus, to test
the radios as complete units, these tests were performed with the radio antenna transmitting to
the receiving antenna. The key performance indicator here is the stability of the mean
maximum-power frequency over time.

This publication is available free of charge from http://dx.doi.org/10.6028/NIST.TN.1850
15
Figure 8. Power versus frequency and time measurement results for Antenna 1 at 100 °C for 25 min. The letter
labels correspond to the radio. The blue sections of the plots indicate the radio was not transmitting and the
white sections indicate that the test was completed. The dotted center line represents the nominal frequency of
162.175 MHz.
This publication is available free of charge from http://dx.doi.org/10.6028/NIST.TN.1850
16
Figure 9. Results for Antenna 2 at 100 °C for 25 min. The letter labels correspond to the radio. The blue sections
of the plots indicate the radio was not transmitting and the white sections indicate that the test was completed.
The dotted center line represents the nominal frequency of 162.175 MHz.

This publication is available free of charge from http://dx.doi.org/10.6028/NIST.TN.1850
17
Figure 10. Results for Antenna 3 at 100 °C for 25 min. The letter labels correspond to the radio. The blue
sections of the plots indicate the radio was not transmitting, and the white sections indicate that the test was
completed. The dotted center line represents the nominal frequency of 162.175 MHz.

This publication is available free of charge from http://dx.doi.org/10.6028/NIST.TN.1850
18
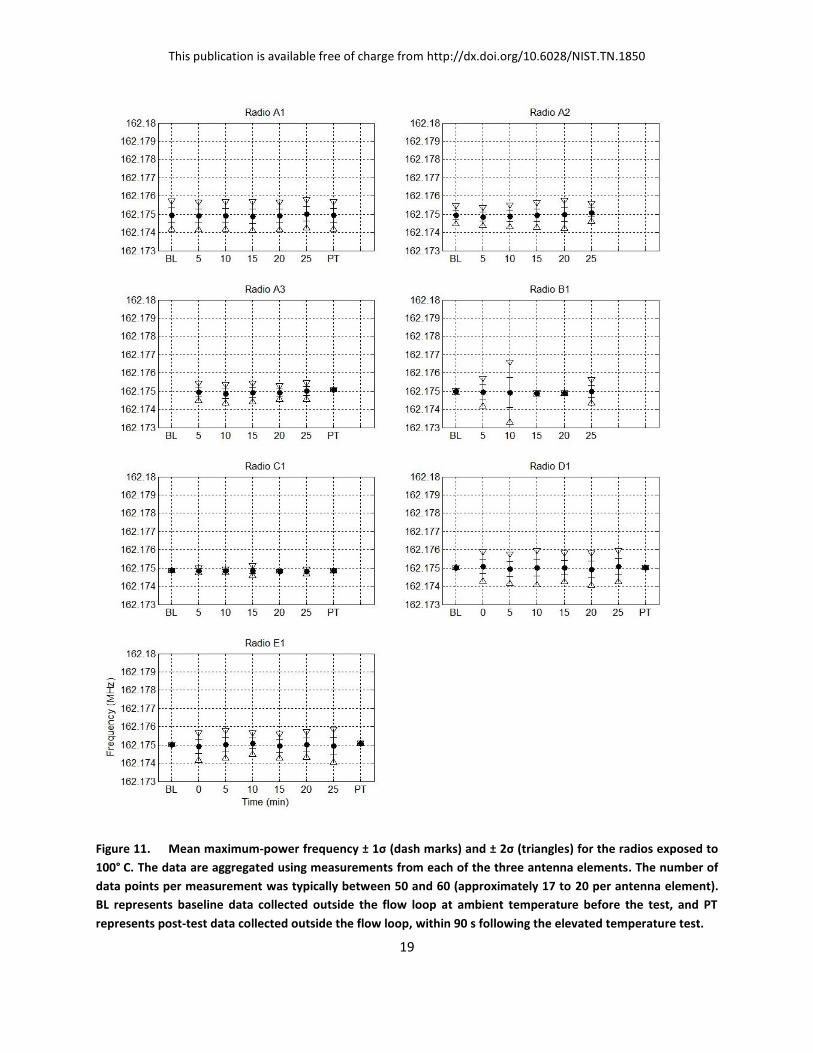
The carrier frequency behavior during the Thermal Class I tests at 100 °C for 15 min was
determined from the aggregate data using the measurements collected from each of the three
different antenna elements. Figure 11 shows the mean maximum-power frequency ± 1σ, as
indicated by dash marks, and ± 2σ as indicated by triangles. The signal data are plotted as a
function of time inside the flow loop. The designation BL on the plots indicates the baseline
measurement of the radio frequency measured at ambient temperature while the radio was
outside of the flow loop before the elevated temperature exposure test. The designation PT on
the plots refers to the post-test measurements collected with the radio outside the flow loop
immediately following the elevated temperature tests, before the radio had a chance to cool.
Measurements plotted in Figure 11 correspond to the active regions shown in the spectrograms.
For most of the measurements, the maximum-power frequency was very close to the mean
maximum-power frequency. The only significant spread occurred in the measurement of radio
B1 at 10 min inside the flow loop. It is not obvious why this variation occurred, but other
measurements for radio B1 exhibited variations similar to the measurements for the other six
radios.
Results for the baseline measurement for radio A3 are not shown because the radio was
initially transmitting at a carrier frequency below 162.174 MHz. However, when the radio was
placed in the flow loop, the radio transmitted with a carrier frequency of 162.175 MHz as
programmed. The first measurement transmission is clearly evident in Figure 8 by the dark red
line offset below the desired center frequency of 162.175 MHz. The cause of the initially
incorrect carrier frequency was not identified. Post-test data for radio A2 and radio B1 are not
shown because this data was not collected. These radios did operate immediately following the
tests at 100 °C, but the data were not recorded.
Figure 12 shows the frequency deviation ± 1σ (indicated by dash marks) and ± 2σ
(indicated by triangles) with respect to the carrier frequency of 162.175 MHz. As in Figure 11,
baseline measurements before the tests are indicated by BL and post-test measurements are
indicated by PT. For all cases, the deviation of the mean maximum-power frequency was less
than 1 ppm. For the measurement of radio B1 at 10 min, 2σ = 11 ppm. For all the other
measurements, 2σ was 6 ppm or less. Results at the Thermal Class I conditions of 100 °C for
25 min indicated that the carrier frequency of all the radios maintained good frequency stability
during elevated temperature exposure.
This publication is available free of charge from http://dx.doi.org/10.6028/NIST.TN.1850
19
Figure 11. Mean maximum-power frequency ± 1σ (dash marks) and ± 2σ (triangles) for the radios exposed to
100° C. The data are aggregated using measurements from each of the three antenna elements. The number of
data points per measurement was typically between 50 and 60 (approximately 17 to 20 per antenna element).
BL represents baseline data collected outside the flow loop at ambient temperature before the test, and PT
represents post-test data collected outside the flow loop, within 90 s following the elevated temperature test.

This publication is available free of charge from http://dx.doi.org/10.6028/NIST.TN.1850
20
Figure 12. Mean maximum-power frequency deviation ± 1σ (dash marks) and ± 2σ (triangles) relative to
162.175 MHz for the 100° C tests. The data were aggregated from the measurements for each of three antenna
elements, and the number of data points per measurement was typically between 50 and 60. BL represents
baseline data collected outside the flow loop at ambient temperature before the test, and PT represents
post-test data collected outside the flow loop, within 90 s following the elevated temperature test.

This publication is available free of charge from http://dx.doi.org/10.6028/NIST.TN.1850
21
Performance results for testing of fire fighter portable radios at Thermal Class I
conditions of 100 °C for 25 min showed that the radios were able to maintain frequency stability
of the maximum-power frequency. A summary of the results is shown in Table 2.
Table 2. Summary of Results for Radio Testing at Thermal Class I
Radio Thermal Class I Exposure 100 °C for 25 min
A1 Radio signal maintained frequency stability.
A2 Radio signal maintained frequency stability.
A3 Radio signal maintained frequency stability.
B1 Radio signal maintained frequency stability.
C1 Radio signal maintained frequency stability.
D1 Radio signal maintained frequency stability.
E1 Radio signal maintained frequency stability.
This publication is available free of charge from http://dx.doi.org/10.6028/NIST.TN.1850
22
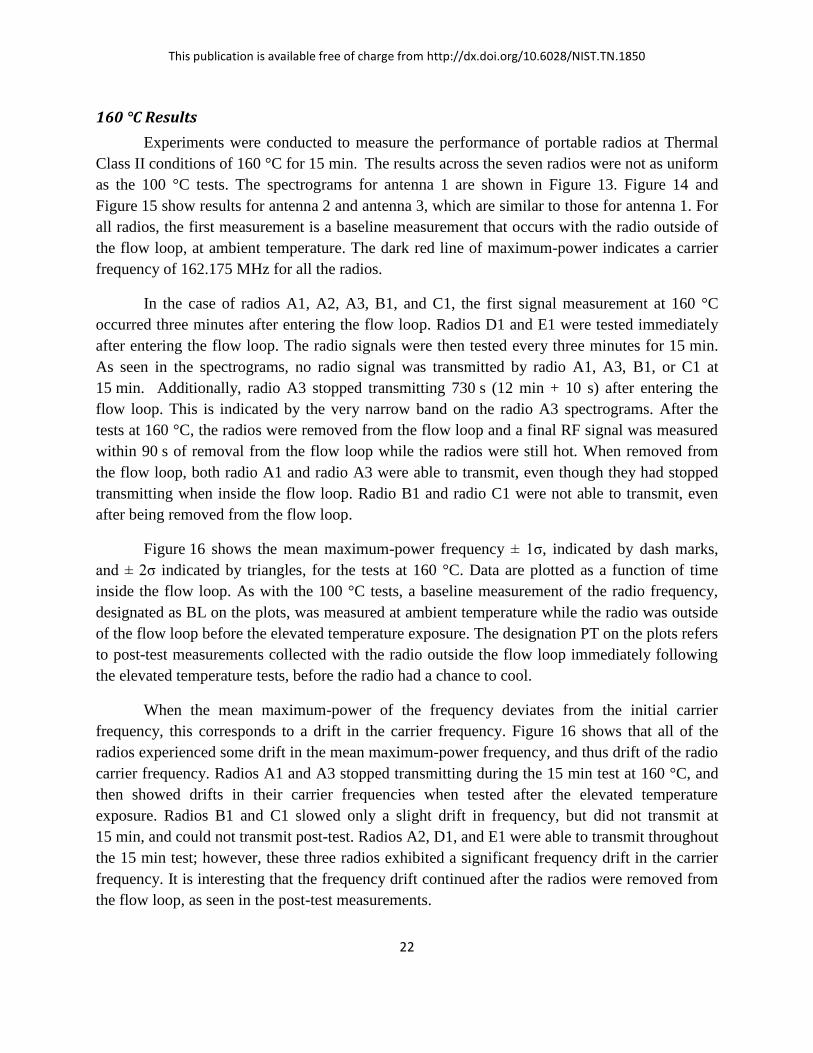
160 °C Results
Experiments were conducted to measure the performance of portable radios at Thermal
Class II conditions of 160 °C for 15 min. The results across the seven radios were not as uniform
as the 100 °C tests. The spectrograms for antenna 1 are shown in Figure 13. Figure 14 and
Figure 15 show results for antenna 2 and antenna 3, which are similar to those for antenna 1. For
all radios, the first measurement is a baseline measurement that occurs with the radio outside of
the flow loop, at ambient temperature. The dark red line of maximum-power indicates a carrier
frequency of 162.175 MHz for all the radios.
In the case of radios A1, A2, A3, B1, and C1, the first signal measurement at 160 °C
occurred three minutes after entering the flow loop. Radios D1 and E1 were tested immediately
after entering the flow loop. The radio signals were then tested every three minutes for 15 min.
As seen in the spectrograms, no radio signal was transmitted by radio A1, A3, B1, or C1 at
15 min. Additionally, radio A3 stopped transmitting 730 s (12 min + 10 s) after entering the
flow loop. This is indicated by the very narrow band on the radio A3 spectrograms. After the
tests at 160 °C, the radios were removed from the flow loop and a final RF signal was measured
within 90 s of removal from the flow loop while the radios were still hot. When removed from
the flow loop, both radio A1 and radio A3 were able to transmit, even though they had stopped
transmitting when inside the flow loop. Radio B1 and radio C1 were not able to transmit, even
after being removed from the flow loop.
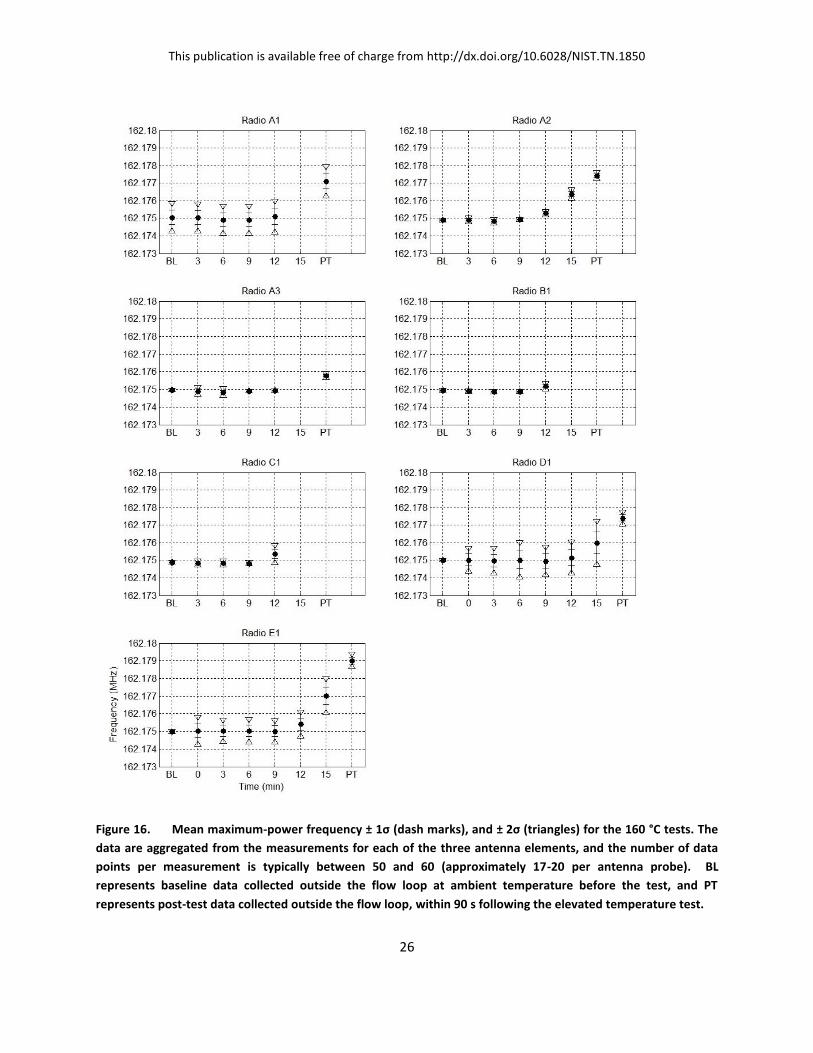
Figure 16 shows the mean maximum-power frequency ± 1σ, indicated by dash marks,
and ± 2σ indicated by triangles, for the tests at 160 °C. Data are plotted as a function of time
inside the flow loop. As with the 100 °C tests, a baseline measurement of the radio frequency,
designated as BL on the plots, was measured at ambient temperature while the radio was outside
of the flow loop before the elevated temperature exposure. The designation PT on the plots refers
to post-test measurements collected with the radio outside the flow loop immediately following
the elevated temperature tests, before the radio had a chance to cool.
When the mean maximum-power of the frequency deviates from the initial carrier
frequency, this corresponds to a drift in the carrier frequency. Figure 16 shows that all of the
radios experienced some drift in the mean maximum-power frequency, and thus drift of the radio
carrier frequency. Radios A1 and A3 stopped transmitting during the 15 min test at 160 °C, and
then showed drifts in their carrier frequencies when tested after the elevated temperature
exposure. Radios B1 and C1 slowed only a slight drift in frequency, but did not transmit at
15 min, and could not transmit post-test. Radios A2, D1, and E1 were able to transmit throughout
the 15 min test; however, these three radios exhibited a significant frequency drift in the carrier
frequency. It is interesting that the frequency drift continued after the radios were removed from
the flow loop, as seen in the post-test measurements.

This publication is available free of charge from http://dx.doi.org/10.6028/NIST.TN.1850
23
Figure 13. Power versus frequency and time measurement results for Antenna 1 at 160 °C for 15 min. A shift in
frequency is indicated by the deep red section of the plots (i.e., the highest power) moving away from the
dotted center line that represents the nominal frequency of 162.175 MHz.

This publication is available free of charge from http://dx.doi.org/10.6028/NIST.TN.1850
24
Figure 14. Results for Antenna 2 tested at 160 °C for 15 min. A shift in frequency is indicated by the deep red
section of the plots moving away from the dotted center line that represents the nominal frequency of
162.175 MHz.

This publication is available free of charge from http://dx.doi.org/10.6028/NIST.TN.1850
25
Figure 15. Results for Antenna 3 tested at 160 °C for 15 min. A shift in frequency is indicated by the deep red
section of the plots moving away from the dotted center line that represents the nominal frequency of
162.175 MHz.
This publication is available free of charge from http://dx.doi.org/10.6028/NIST.TN.1850
26
Figure 16. Mean maximum-power frequency ± 1σ (dash marks), and ± 2σ (triangles) for the 160 °C tests. The
data are aggregated from the measurements for each of the three antenna elements, and the number of data
points per measurement is typically between 50 and 60 (approximately 17-20 per antenna probe). BL
represents baseline data collected outside the flow loop at ambient temperature before the test, and PT
represents post-test data collected outside the flow loop, within 90 s following the elevated temperature test.

This publication is available free of charge from http://dx.doi.org/10.6028/NIST.TN.1850
27
Figure 17. Mean maximum-power frequency deviation ± 1σ (dash marks), and ± 2σ (triangles) relative to
162.175 MHz for the 160 °C tests. The data were aggregated from the measurements for each of three antenna
elements, and the number of data points per measurement was typically between 50 and 60. BL represents
baseline data collected outside the flow loop at ambient temperature before the test, and PT represents
post-test data collected outside the flow loop, within 90 s following the elevated temperature test.
This publication is available free of charge from http://dx.doi.org/10.6028/NIST.TN.1850
28
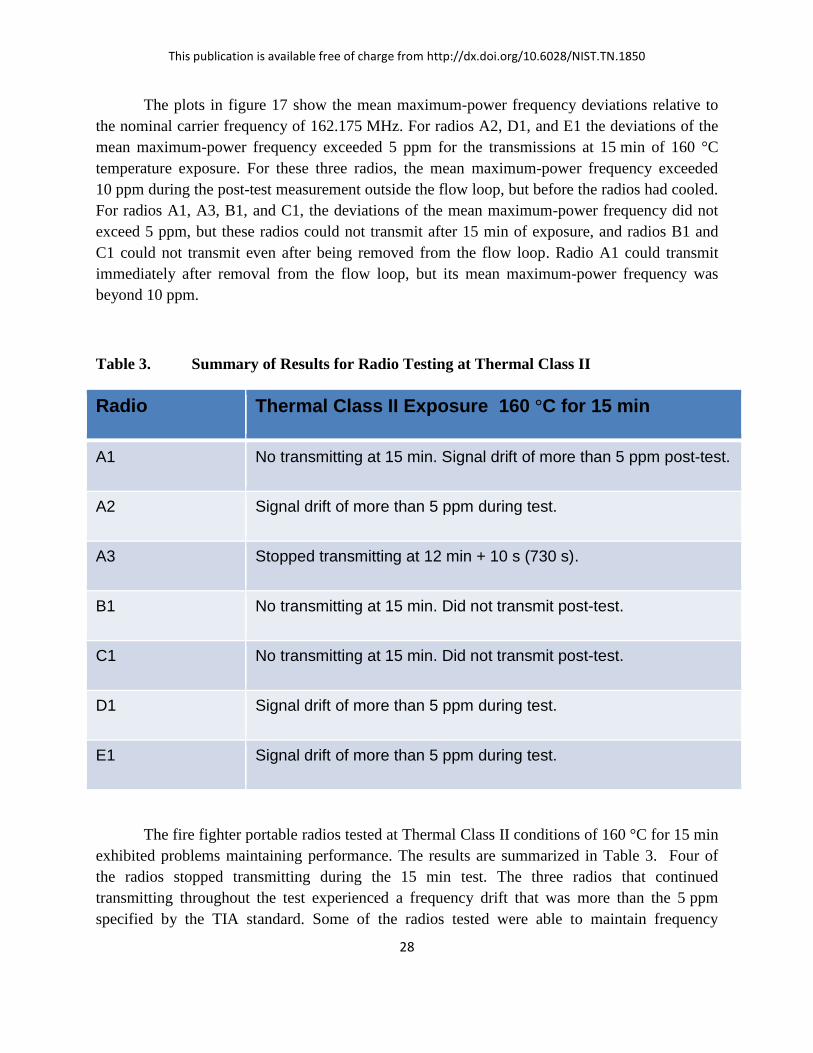
The plots in figure 17 show the mean maximum-power frequency deviations relative to
the nominal carrier frequency of 162.175 MHz. For radios A2, D1, and E1 the deviations of the
mean maximum-power frequency exceeded 5 ppm for the transmissions at 15 min of 160 °C
temperature exposure. For these three radios, the mean maximum-power frequency exceeded
10 ppm during the post-test measurement outside the flow loop, but before the radios had cooled.
For radios A1, A3, B1, and C1, the deviations of the mean maximum-power frequency did not
exceed 5 ppm, but these radios could not transmit after 15 min of exposure, and radios B1 and
C1 could not transmit even after being removed from the flow loop. Radio A1 could transmit
immediately after removal from the flow loop, but its mean maximum-power frequency was
beyond 10 ppm.
Table 3. Summary of Results for Radio Testing at Thermal Class II
Radio Thermal Class II Exposure 160 °C for 15 min
A1 No transmitting at 15 min. Signal drift of more than 5 ppm post-test.
A2 Signal drift of more than 5 ppm during test.
A3 Stopped transmitting at 12 min + 10 s (730 s).
B1 No transmitting at 15 min. Did not transmit post-test.
C1 No transmitting at 15 min. Did not transmit post-test.
D1 Signal drift of more than 5 ppm during test.
E1 Signal drift of more than 5 ppm during test.
The fire fighter portable radios tested at Thermal Class II conditions of 160 °C for 15 min
exhibited problems maintaining performance. The results are summarized in Table 3. Four of
the radios stopped transmitting during the 15 min test. The three radios that continued
transmitting throughout the test experienced a frequency drift that was more than the 5 ppm
specified by the TIA standard. Some of the radios tested were able to maintain frequency
This publication is available free of charge from http://dx.doi.org/10.6028/NIST.TN.1850
29
stability through the first 12 min of Class II exposure. This may suggest that small changes may
enable some radios to meet a Thermal Class II standard requirement.
Future Work
The experiments described here investigate the performance of portable radios exposed to
Thermal Class I and Thermal Class II conditions. Work planned for the next phase of this project
will expose the radios to Class III conditions of 260 °C for 5 min. Although the time duration is
shorter, exposure to 260 °C represents an extreme temperature condition for operation of
electronic equipment. Previous research conducted at temperatures above 160 °C suggests that
the radios currently on the market will experience significant challenges maintaining an adequate
level of performance at this temperature, even for short durations [1].
For the experiments discussed in this document, all testing of the radio transmission was
performed in the VHF band at a frequency of 162.175 MHz. Because the oscillator circuity,
other radio components, and housing materials are common to radios operating in other
frequency bands such as UHF, similar results and frequency drift are also expected with those
radios. Additional work is planned to investigate radio operation at elevated temperatures for
frequencies in the UHF band.
Additional work planned in this area will also consider the impact of elevated
temperatures on portable radio remote speaker microphone accessories. Preliminary testing of
this equipment showed that it was also vulnerable to elevated temperatures [1]. Plans for further
experiments include separate testing of the remote speaker microphone and the connecting cable
assemblies to evaluate performance issues and identify potential weak links in the assemblies.

This publication is available free of charge from http://dx.doi.org/10.6028/NIST.TN.1850
30
Conclusions
The impact of elevated temperatures on the performance of fire fighter portable radios
was investigated to develop scientifically based standards for the radios. Radios were tested at
elevated temperature conditions in the NIST thermal exposure flow loop. An RF sampling
system measured the frequency signals from transmitting radios to measure their performance.
Seven radios were tested at two different Thermal Class conditions, transmitting at a frequency
of 162.175 MHz.
Radios were tested at Thermal Class I conditions of 100 °C for 25 min. All seven of the
radios tested were able to transmit throughout the test durations. All of the radios maintained
frequency stability of the maximum-power frequency throughout the tests.
Radios were tested at Thermal Class II conditions of 160 °C for 15 min. All of the radios
tested experienced some type of performance problem during the testing. Four radios could not
transmit throughout the 15 min of exposure to 160 °C temperatures. The remaining three radios
were able to transmit throughout the 15 min test, but experienced signal drift of the mean
maximum-power frequency, with a deviation from the carrier frequency that exceeded 5 ppm.
The results of these experiments indicate that exposure to Thermal Class II conditions
(elevated temperature conditions of 160 °C for 15 min) can have adverse effects on radio
performance, resulting in drift of the signal frequency and failure to transmit.
This publication is available free of charge from http://dx.doi.org/10.6028/NIST.TN.1850
31
References
[1] Davis, W.D., Donnelly, M.K., and Selepak, M.J., “Testing of Portable Radios in a Fire
Fighting Environment,” National Institute of Standards and Technology, Gaithersburg, MD,
NIST Technical Note 1477, August 2006.
[2] NIOSH Fire Fighter Fatality Investigation and Prevention Program, “A Career Lieutenant
and Fire Fighter/Paramedic Die in a Hillside Residential House Fire – California,” U.S.
Department of Health and Human Services, Public Health Service, Centers for Disease Control
and Prevention, National Institute for Occupational Safety and Health, DHHS (NIOSH)
Publication No.# 2011-13.
[3] National Fire Protection Association, "NFPA 1221: Standard for Installation,
Maintenance and Use of Emergency Services Communications Systems," 2013 Edition, National
Fire Codes, Volume 12, Quincy, MA, 2014.
[4] Donnelly M. K., Davis W. D., Lawson, J. R., and Selepak, M. S., “Thermal Environment
for Electronic Equipment used by First Responders,” National Institute of Standards and
Technology, Gaithersburg, MD, NIST Technical Note 1474, January 2006.
[5] Abeles, Fred J., “Protective Ensemble Performance Standards, Project Fires” Phase 1B
Final Report, Volume 2, Grumman Aerospace Corporation, Bethpage, New York, May 1980.
[6] Abbott, N. J. and Schulman, S., “Protection from Fire: Nonflammable Fabrics and
Coatings,” Proceedings of 1976 International Symposium on Flammability and Fire Retardants.
Ontario, Canada, May 6-7, 1976.
[7] Federal Emergency Management Agency/United States Fire Administration “Minimum
Standards on Structural Fire Fighting Protective Clothing and Equipment: A Guide for Fire
Service Education and Procurement,” FA-137, United States Fire Administration, 16825
South Seton Avenue, Emmitsburg, MD 21727. December 1992.
[8] Foster, J. A., and Roberts, G.V., “Measurements of the Firefighting Environment –
Summary Report,” Central Fire Brigades Advisory Council Research Report number 61, 1994,
Home Office Fire Research and Development Group, Fire Engineers Journal, United Kingdom,
September 1995.
[9] Setra Model 264 Very Low Pressure Transducer Data Sheet Revision E. Setra Systems,
Boxborough, MA., December 2002.
[10] Omega Engineering, Inc., The Omega Temperature Measurement Handbook and
Encyclopedia, Vol. MMX 6th ed., Stamford, CT, Omega Engineering, 2007.
This publication is available free of charge from http://dx.doi.org/10.6028/NIST.TN.1850
32
[11] Bandhauer, T.M., Garimella, S. and Fuller, T.F., “A Critical Review of Thermal Issues in
Lithium-Ion BatteriesReviews - Critical Reviews in Electrochemistry and Solid-State Science
and Technology,” Journal of the Electrochemical Society, Vol. 158, 2011.
[12] Spotnitz, R. and Franklin, J., “Abuse of high-power, lithium-ion cells,” Journal of Power
Sources, Vol. 113, Issue 1, January 2003.
[13] Baginska, M., Blaiszik, B.J., Merriman, R.J., Sottos, N.R., Moore, J.S., and White, S.R.,
“Autonomic Shutdown of Lithium-Ion Batteries Using Thermoresponsive Mircrospheres,”
Advanced Energy Materials, 2012.
[14] Mandal, B.K., Padhi, A.K., Shi, Z., Chakraborty, S. and Filler, R., “Thermal runaway
inhibitors for lithium battery electrolytes,” Journal of Power Sources, Vol. 161, Issue 2, October
2006.
[15] “Land Mobile FM or PM Communications Equipment Measurement and Performance
Standard,” ANSI/TIA-603-D, 2010.
Acknowledgements
This work was sponsored the Department of Homeland Security (DHS) to advance the
development of standards for electronic equipment used by emergency responders.
The authors would like to thank Keith Stakes of NIST for his assistance conducting some of the
experiments and for creating the flow loop diagrams. The authors would also like to thank Roy
McLane and Jay McElroy, both of NIST, for their assistance with the laboratory apparatus and
instrumentation.

This publication is available free of charge from http://dx.doi.org/10.6028/NIST.TN.1850
33
Appendix A: Supplemental Figures
Figure A1. Diagram of the NIST Thermal Exposure Flow Loop. Dimensions are in mm.
This publication is available free of charge from http://dx.doi.org/10.6028/NIST.TN.1850
34
Figure A2. Diagram showing a side view of the inside of the test section of the NIST Thermal Exposure
Flow Loop. Dimensions are in cm.

This publication is available free of charge from http://dx.doi.org/10.6028/NIST.TN.1850
35
Figure A3. Example of temperature measurements inside the test section for a test at nominally 100 °C.
The average temperature at the centerline is 100.2 °C, where 2σ = 1.7. The average temperature 7.6 cm above
the centerline is 100.2 °C, where 2σ = 1.4, and the average temperature 7.6 cm below the centerline is 100.1 °C,
with 2σ = 1.7.
90
95
100
105
110
0 200 400 600 800 1000 1200 1400
Thermocouples in Testing Secion
Nominally 100 oC Test
TC 7.6 cm above centerlineTC at centerline of flow loopTC 7.6 cm below centerline
Te
mp
era
ture
(oC
)
Time (s)

This publication is available free of charge from http://dx.doi.org/10.6028/NIST.TN.1850
36
Figure A4. Example of temperature measurements inside the test section for a test at nominally 160 °C.
The average temperature at the centerline is 160.1 °C, where 2σ = 1.7. The average temperature 7.6 cm above
the centerline is 160.4 °C, where 2σ = 1.2, and the average temperature 7.6 cm below the centerline is 159.8 °C,
with 2σ = 1.7.
150
155
160
165
170
0 200 400 600 800
Thermocouples in Testing Secion
Nominally 160 oC Test
TC 7.6 cm above centerlineTC at centerline of flow loopTC 7.6 cm below centerline
Te
mp
era
ture
(oC
)
Time (s)

This publication is available free of charge from http://dx.doi.org/10.6028/NIST.TN.1850
37
Appendix B: Overview of Power Levels on the Linear and Logarithm Scales
The measured power levels shown in this document are given on the decibel scale, which is a
typical format in the communication industry. This logarithmic transformation to a decibel scale
allows easier visualization and manipulation of the data than in the linear domain. For example,
multiplication in the linear domain becomes addition in the logarithm domain. The magnitude of
the measured signal powers are such that the resulting decibel values may be either positive or
negative. Equations below show the conversion of a linear power quantity to a decibel scale. A
key point in this transformation process is that the linear data are compared relative to a specified
reference value, or in the case, one milliwatt (mW).
mW1
powerlog10)dBm(power 10 (B-1)
To convert back to a linear scale, the following equation is applied.
10 10
(dBm)power
)(mWpower (B-2)
It is useful to look at three different cases when converting to the decibel scale. First, consider a
measured signal of 5 watts (W), which is greater than 1 mW. Using (B-1), we calculate:
37dBm.5000log10mW1
mW 5000log10W5 1010
Next, consider 0.005 mW, which is less than 1 mW. Here (B-1) gives:
dBm.-23005.0log10mW1
mW 0.005log10mW0.005 1010
Finally, consider 1 mW, which is equal to the 1 mW reference. Here (B-1) gives:
dBm.01log10mW1
mW 1log10mW1 1010
Thus, even though the linear data are on a scale from 0 to +∞, on the decibel scale the values can
take on positive and negative values. The decibel representation allows ease in comparing a wide
range in signal levels, e.g., a 5 W value to a 0.005 mW value is the same as comparing 37 dBm
to -23 dBm. The difference on the decibel scale is 37 dBm – (- 23 dBm) = 60 dB, or a factor of
1,000,000. Ranges of this size and greater are common in communication systems.