Embed Size (px)
Citation preview

Copyright © 2007 by Dr. Craig M. Harvey
Copyright © 2012, WSU Center for Operator Performance and Louisiana State University
PERFORMANCE OF CONTROL ROOM OPERATORS IN ALARM MANAGEMENT
Craig M. Harvey, Ph.D., P.E. Dileep Buddaraju, MS student
API Cyberne+cs Symposium, April 19, 2012

Copyright © 2007 by Dr. Craig M. Harvey
Copyright © 2012, WSU Center for Operator Performance and Louisiana State University
We’re All Humans So We Know Human Factors?
Or Do We? Let’s look at an example screen mockup


Copyright © 2007 by Dr. Craig M. Harvey
Copyright © 2012, WSU Center for Operator Performance and Louisiana State University
Let’s Turn to Alarm Systems

Copyright © 2012, WSU Center for Operator Performance and Louisiana State University 9
Regulations n 49 CFR Parts 192 and 195 - Pipeline
Safety: Control Room Management/Human Factors q Alarm management – Each operator must have
written alarm management plan to provide effective controller response to alarms.
n So question is what alarm rate with regulators use to consider you are in compliance?

Copyright © 2012, WSU Center for Operator Performance and Louisiana State University 10
Industry Requirements n EEMUA standards:
q An operator can handle 1 or 2 alarms per ten minutes efficiently
q Can anyone meet that standard?
n Improvements needed in alarm management q Reduce nuisance alarms q Guide the operator in making decision q Introduce automation q Operator input when designing alarm systems q Alarm prioritization process q Alarm presentation design

Copyright © 2012, WSU Center for Operator Performance and Louisiana State University 11
Objectives n Evaluate different alarm rates and its impact
on the operator performance (response time, accuracy of response, acknowledge time).
n Determine the effect of alarms displayed in categorical and chronological alarm displays on the operator's performance.
n Compare Operators to LSU Students

Copyright © 2012, WSU Center for Operator Performance and Louisiana State University 12
Company # Operators
Pipeline 1 10
Refinery 1 5
Pipeline 2 5
Pipeline 3 3
Refinery 2 2
Operators par*cipated – 25 Excluded 2 operators data due to outlining data.
Participating Company Types
Copyright © 2012, WSU Center for Operator Performance and Louisiana State University 13
Experimental Method n A demographic survey information was collected
before starting the proceedings. n All participants were trained about the steps to
be taken and the navigation through the simulation before starting the experiments.
n Operators were given time to understand the simulation by giving them a demo and a practice experiment.
n Experiments were not started until the operators felt comfortable with the simulation.
Copyright © 2012, WSU Center for Operator Performance and Louisiana State University 14
Experimental Method n All 6 experiments were randomized and
tested on the operators n All operators were tested in the morning shift
(from 6 AM). Small breaks were taken by the operators in between the experiments.
n After the experiments, a questionnaire was given to the operators asking for their feedback on the simulation.

Copyright © 2012, WSU Center for Operator Performance and Louisiana State University 15
Experiment Variables n Independent Variables
q Alarm rates q Alarm window
n Dependent Variables q Response time q Accuracy of response q Acknowledge Time

Copyright © 2012, WSU Center for Operator Performance and Louisiana State University 16
Alarm Rates Tested
Categorical display
Chronological display
15 per 10 minutes
20 per 10 minutes 20 per 10 minutes
25 per 10 minutes 25 per 10 minutes
30 per 10 minutes

Copyright © 2012, WSU Center for Operator Performance and Louisiana State University 17
Alarm Distribution n Alarms were balanced to across different alarm rates to
keep workload consistent.
0
5
10
15
20
25
30
35
40
45
50
15 20 25 30
H.HLM
BINB
BOUT
LAP
AP
PSP
PDP
PBP

Copyright © 2012, WSU Center for Operator Performance and Louisiana State University 18
Pipeline Overview

Copyright © 2012, WSU Center for Operator Performance and Louisiana State University 19
2nd Pipeline

Copyright © 2012, WSU Center for Operator Performance and Louisiana State University 20
Station Overview

Copyright © 2012, WSU Center for Operator Performance and Louisiana State University 21
Tank Farm with Dehydrator

Copyright © 2012, WSU Center for Operator Performance and Louisiana State University 22
Dehydrator

Copyright © 2012, WSU Center for Operator Performance and Louisiana State University 23
Tank Farm Downstream

Copyright © 2012, WSU Center for Operator Performance and Louisiana State University 24
Categorical Alarm Display
Copyright © 2012, WSU Center for Operator Performance and Louisiana State University 25
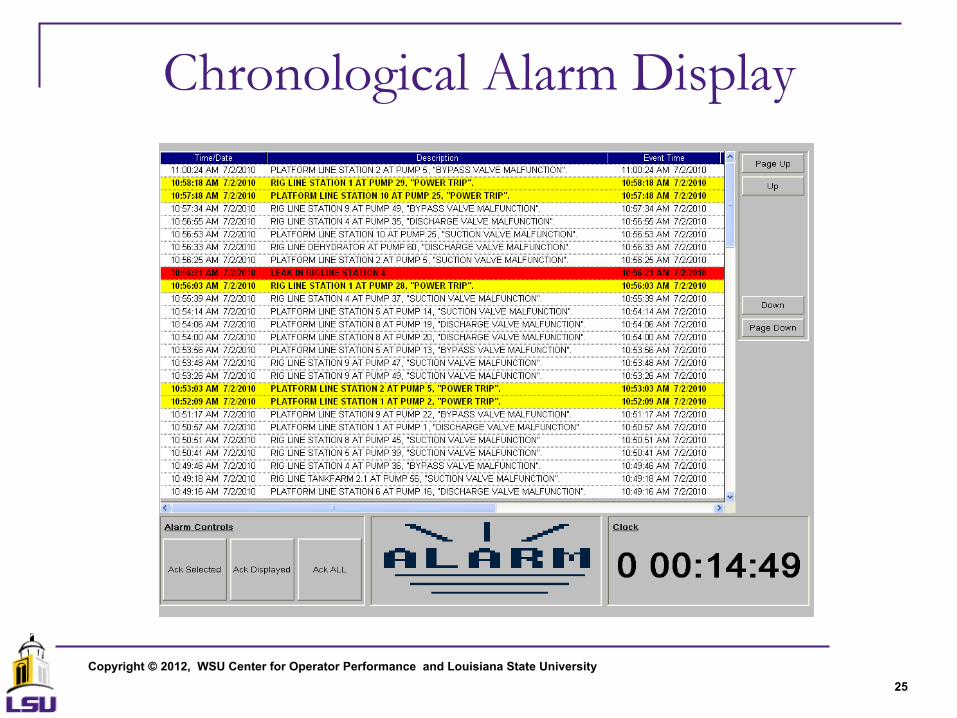
Chronological Alarm Display

Copyright © 2012, WSU Center for Operator Performance and Louisiana State University 26
Hypothesis 1: Accuracy
n Hypothesis 1: Differences exist in participant accuracy of response. (H0: no difference, H1: not equal)
n One way ANOVA test was completed using a 0.05 level of significance.
n Can’t conclude that there is difference between the groups (p>0.05)

Copyright © 2012, WSU Center for Operator Performance and Louisiana State University 27
Hypothesis 1: Accuracy
n No significant difference in operator accuracy found with the increase in the alarm rates.
n Possible reason: complexity of the simulation and the operators tasks designed were simple compared to what they were used to in real world scenario.
Copyright © 2012, WSU Center for Operator Performance and Louisiana State University 28
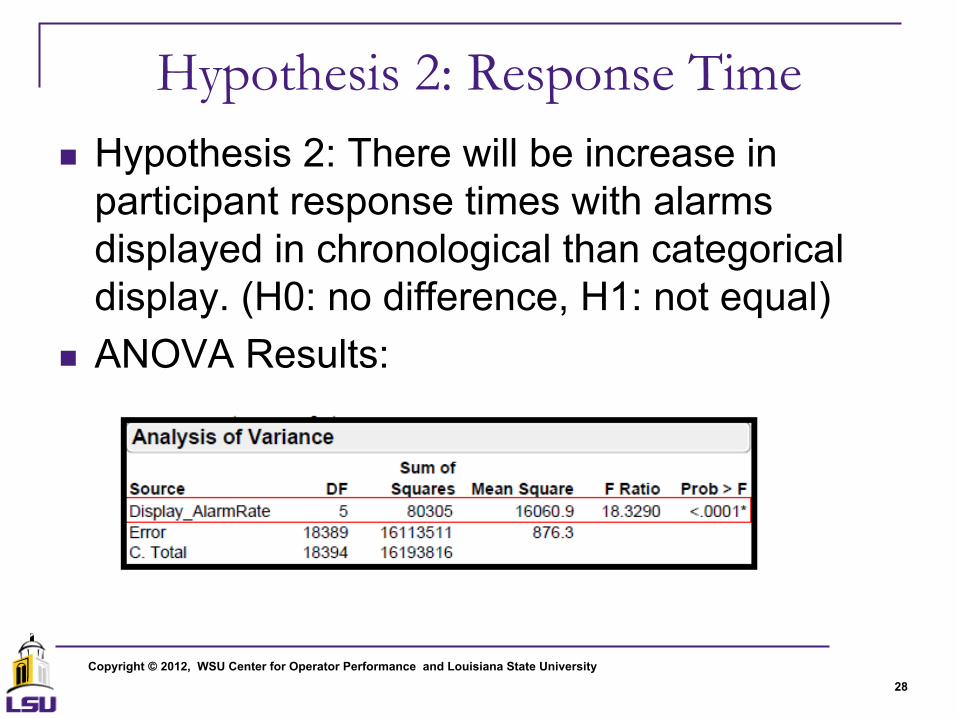
Hypothesis 2: Response Time n Hypothesis 2: There will be increase in
participant response times with alarms displayed in chronological than categorical display. (H0: no difference, H1: not equal)
n ANOVA Results:

Copyright © 2012, WSU Center for Operator Performance and Louisiana State University 29
Hypothesis 2: Display Type
n Tukey’s mean test
q Compared alarm rates 20, 25 as they were tested in both the alarm displays.
q Results show that statistically there are no differences in operator performance between displays, but the means were slightly better in categorical display for higher alarm rate (25)

Copyright © 2012, WSU Center for Operator Performance and Louisiana State University 30
Hypothesis 3: Alarm Rates/Display Type Combined
n Hypothesis 3: Operator response time will change with increased alarm rates. (H0: no difference, H1: not equal)
n Results of an ANOVA test for differences in participant response time.
Copyright © 2012, WSU Center for Operator Performance and Louisiana State University 31
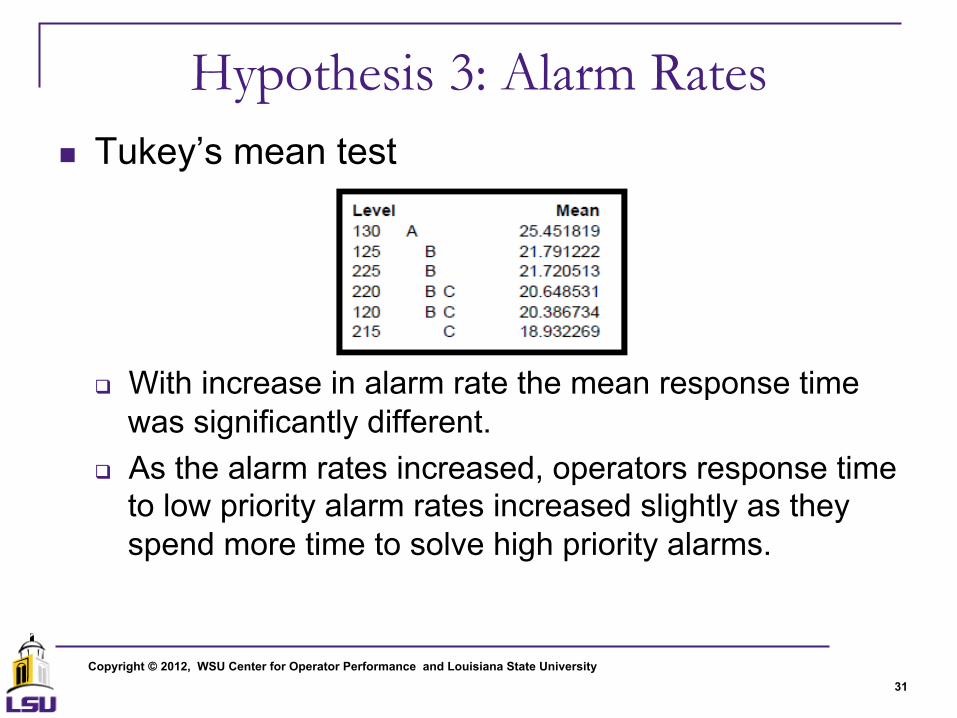
Hypothesis 3: Alarm Rates
n Tukey’s mean test
q With increase in alarm rate the mean response time was significantly different.
q As the alarm rates increased, operators response time to low priority alarm rates increased slightly as they spend more time to solve high priority alarms.

Copyright © 2012, WSU Center for Operator Performance and Louisiana State University 32
Response Time by Alarm Rate

Copyright © 2012, WSU Center for Operator Performance and Louisiana State University 33
Response Time by Alarm Priority

Copyright © 2012, WSU Center for Operator Performance and Louisiana State University 34
Response Time by Age
12 Operators -‐ < = 40 11 Operators -‐ > 40

Copyright © 2012, WSU Center for Operator Performance and Louisiana State University 35
Acknowledge Time Results

Copyright © 2012, WSU Center for Operator Performance and Louisiana State University 36
Alarm Window Preference n Operators overwhelmingly preferred the categorical
display n Those that preferred the chronological stated found it
easier to handled high frequency (low) alarms easier with this display.
20 (80%)
5 (20%)
0
5
10
15
20
25
Categorical Chronological
Alarm Display Preference

Copyright © 2012, WSU Center for Operator Performance and Louisiana State University 37
Operators Comments on the Simulation
n Operators liked the colors used in the simulation due to less eye strain.
n Recognized higher alarm rates as compared to lower alarm rates.
n Most of the operators/supervisors liked the categorical display.

Copyright © 2012, WSU Center for Operator Performance and Louisiana State University 38
Limitations for this Project n Simulation complexity n Shift hours were only daytime and short time
period (6-7 hours) n 25 male operators

Copyright © 2012, WSU Center for Operator Performance and Louisiana State University 39
Student v. Operator Analysis n Student data used
from first alarm studies conducted in 2009
n Operator data collected during 2010-2011 alarm study
10 and 20 alarms per 10 minutes
Categorical and Chronological Display

Copyright © 2012, WSU Center for Operator Performance and Louisiana State University 40
Reaction Time (RT) Results
Source Nparm DF DFDen F Ratio Prob > F Student(S)/Operator (O) 1 1 170.6 8.9883 0.0031* Alarm Rate 1 1 154.6 23.5202 <.0001* Student(S)/Operator (O)*Alarm Rate 1 1 154.6 4.6785 0.0321* Cat.(2)/Chron(1) 1 1 192.4 4.5963 0.0333* Student(S)/Operator (O)*Cat.(2)/Chron(1) 1 1 192.4 0.2371 0.6269 Alarm Rate*Cat.(2)/Chron(1) 1 1 154.6 1.7920 0.1826 Student(S)/Operator (O)*Alarm Rate*Cat.(2)/Chron(1) 1 1 154.6 0.1605 0.6893 p ≤ 0.05 – Significant Items
Fixed Effect Tests

Copyright © 2012, WSU Center for Operator Performance and Louisiana State University 41
RT - Alarm Rates v. Student/Operator
n Students and Operators reaction time for solving an alarm can not be distinguished from one another except at the alarm rate of 20 alarms per 10 minutes q Students performed significantly slower than
operators at 20 alarms per 10 minutes
Level Least Sq Mean (sec) Student,20 A 93.016354 Operator,20 B 47.676607 Student,10 B 31.785469 Operator,10 B 24.217462
Copyright © 2012, WSU Center for Operator Performance and Louisiana State University 42
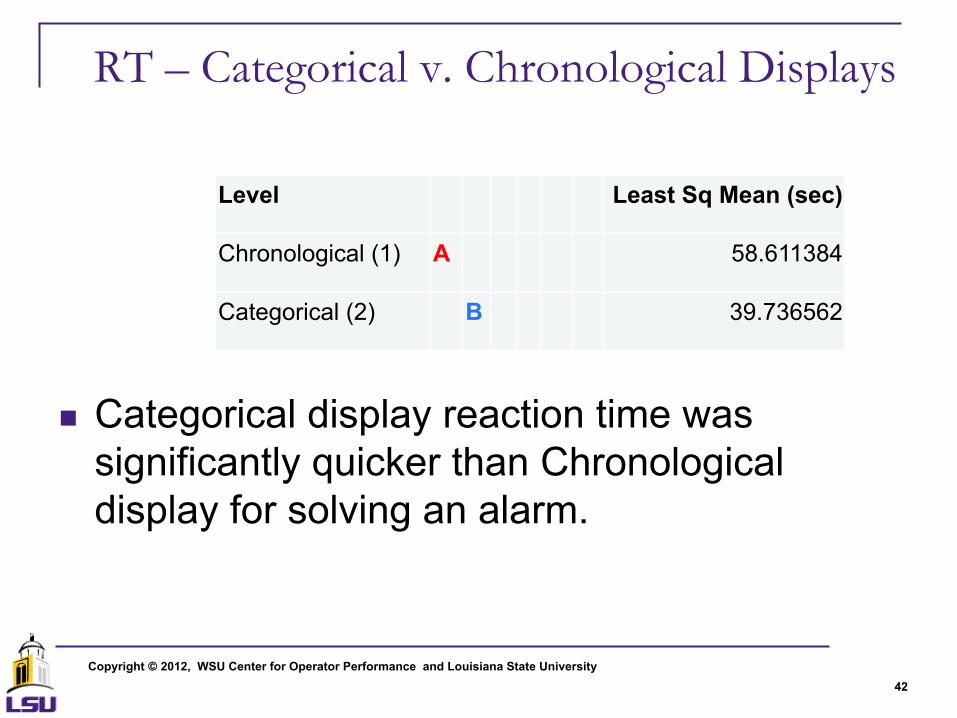
RT – Categorical v. Chronological Displays
Level Least Sq Mean (sec) Chronological (1) A 58.611384 Categorical (2) B 39.736562
n Categorical display reaction time was significantly quicker than Chronological display for solving an alarm.

Copyright © 2012, WSU Center for Operator Performance and Louisiana State University 43
Acknowledgement Time (AT) Results
Source Nparm DF DFDen F Ratio Prob > F Student(S)/Operator (O) 1 1 160.2 0.7331 0.3932 Alarm Rate 1 1 148.9 17.1171 <.0001* Student(S)/Operator (O)*Alarm Rate 1 1 148.9 2.7399 0.1000 Cat.(2)/Chron(1) 1 1 180.2 8.6734 0.0037* Student(S)/Operator (O)*Cat.(2)/Chron(1) 1 1 180.2 0.3802 0.5383 Alarm Rate*Cat.(2)/Chron(1) 1 1 148.9 2.4676 0.1183 Student(S)/Operator (O)*Alarm Rate*Cat.(2)/Chron(1) 1 1 148.9 0.3674 0.5454 p ≤ 0.05 – Significant Items
Fixed Effect Tests

Copyright © 2012, WSU Center for Operator Performance and Louisiana State University 44
AT – Alarm Rates
Level Least Sq Mean (sec) 20 in 10 minutes A 84.093530 10 in 10 minutes B 37.423023
n Users acknowledged alarms for the 10 alarms in 10 minutes rate significantly quicker than 20 alarms in 10 minutes.

Copyright © 2012, WSU Center for Operator Performance and Louisiana State University 45
AT – Categorical v. Chronological Displays
Level Least Sq Mean (sec) Chronological (1) A 78.006207 Categorical (2) B 43.510345
n Categorical display alarms were acknowledged significantly quicker than Chronological displayed alarms.

Copyright © 2012, WSU Center for Operator Performance and Louisiana State University 46
Students v. Operators Conclusions n Operators perform better than students at
higher alarm rates. n The Categorical display performed better
than the Chronological display regardless of the user.

Copyright © 2012, WSU Center for Operator Performance and Louisiana State University 47
Overall Research Limitations n Constrained experiments by alarm rate driven
from EEMUA n Simple Systems compared to real world
systems
Copyright © 2012, WSU Center for Operator Performance and Louisiana State University 48
Future Research n Alarm Management
q Time pressure q Female operators participation q Simulation complexity q Shift length q Shift hours
n Human fatigue q Regulation: Fatigue mitigation – Implement methods to reduce risk associated
with controller fatigue. q PhD Student working on
n Fatigue Readiness to Perform n Eye Tracking to measure fatigue for operators n Handheld worn tools to measure circadian rhythm
q Recent FAA events will cause DOT to explore further n Shift Change n Operator Selection/Performance

Copyright © 2012, WSU Center for Operator Performance and Louisiana State University 49
Outcomes n Current Publications
q Strobhar, D. and Harvey, C. M., (2011). How many alarms can an operator handle, Chemical Processing, 24-27.
q Buddaraju, D., Harvey, C. M., and Knapp, G. (2011). Performance of control room operators in alarm management, 2011 Proceedings IIE Research Conference.
n Working Publications q Journal article on student study work in draft form to be submitted
this summer q Journal article on operator work being created for submission this
summer.


![Hazards Equal Trips or Alarms or Both/media/Documents/Subject Groups/Safety_Lo… · HAZARDS EQUAL TRIPS OR ALARMS OR BOTH ... in this paper embraces both the EEMUA[6] and the UK](https://img.dokumen.tips/doc/110x75/5ad390377f8b9a05208e25a5/hazards-equal-trips-or-alarms-or-both-mediadocumentssubject-groupssafetylohazards.jpg)


![Car Alarms & Smoke Alarms [Monitorama]](https://img.dokumen.tips/doc/110x75/54b6cdf94a7959d84d8b45a5/car-alarms-smoke-alarms-monitorama.jpg)