Embed Size (px)
Citation preview

Int. J. of Life Sciences, 2017, Vol. 5 (3): 345-361 ISSN: 2320-7817| eISSN: 2320-964X
© 2017 |IJLSCI www.ijlsci.in 345
Performance of bread wheat (Triticum aestivum L.) in response to
supplemental irrigation and rate of nitrogen application in
Enderta, Tigray, Northern Ethiopia
Beyenesh Zemichael1, Nigussie Dechassa2
1Tigray Agricultural Research Institute, P.O. Box 498, Mekelle, Tigray, Ethiopia
2Haramaya University, College of Agriculture and Environmental Sciences, P. O. Box 138, Dire Dawa, Ethiopia
*Corresponding author. E-mail: [email protected]
Manuscript details: ABSTRACT
Received: 18.07.2017
Accepted: 17.08.2017
Published : 19.09.2017
Editor:
Dr. Arvind Chavhan
Cite this article as: Beyenesh Zemichael and Nigussie Dechassa (2017) Performance of bread wheat (Triticum aestivum L.) in response to supplemental irrigation and rate of nitrogen application in Enderta, Tigray, Northern Ethiopia; International J. of Life Sciences, 5 (3): 345-361.
Acknowledgements The authors gratefully acknowledge the support of East Africa Agriculture Productivity Project (EAAPP) of the Ethiopian Institute of Agricultural Research for funding this research. The authors wish to express their appreciation also to Ato Muluberhan Kifle and Tesfay G/Tsadik for their help in the analysis of crop wat requirement of the crop Copyright: © 2017| Author (s), This is an open access article under the terms of the Creative Commons Attribution-Non-Commercial - No Derivs License, which permits use and distribution in any medium, provided the original work is properly cited, the use is non-commercial and no modifications or adaptations are made.
Moisture stress and nitrogen deficiency are the most important factors
which limit wheat production in the semi-arid Tigray region of Ethiopia.
Therefore, a field experiment was conducted in Enderta district in the
region during the 2013 and 2014 cropping seasons to elucidate the
response of bread wheat to supplemental irrigation (SI) and rates of
nitrogen application. The experiment was laid out as a randomized
complete block design (RCBD) in a split-plot arrangement with three
replications. Four levels of supplementary irrigation (SI), viz: 0, 50, 75, and
100% (full) of the crop water requirement were assigned to the main plots
whilst, nitrogen levels of 0, 23, 46, 69 and 92 kg N ha-1 were assigned to the
sub-plots. Application of 92 kg N ha−1 with 75% SI increased tiller
production by 94% as compared to the rain-fed treatment. Similarly, plants
that received 100% SI with the application of 69 kg N ha-1 had their heights
significantly increased by about 39%, spike length by 56%, kernel per spike
by 51%, TKW by 47% and aboveground biomass yield by 340% as
compared to no irrigation and no nitrogen application. Maximum grain
yield of 4504kg ha-1 and water productivity of 7.99 kg mm-1 ha-1 was
recorded in response to the application of 100% SI combined with 92 kg N
ha-1, However, the lowest grain yield of 885 kg ha-1 and water productivity
of 2.15 kg mm-1 ha-1 were recorded in response to the rain-fed production
with no application of nitrogen fertilizer.. Based on economic analysis, the
acceptable marginal rate of return of 255% and the highest net benefit
(47004 ETB ha-1) was obtained from the application of 92 kg N ha-1 with
100% supplemental irrigation. It can be concluded that the integration of
92 kg N ha−1 with 100% supplementary irrigation resulted in optimum
grain yield and economic return of the crop.
Key words: Deficit irrigation, economic analysis, N application, water
productivity yield, yield component
RESEARCH ARTICLE
Beyenesh and Nigussie, 2017
346 Int. J. of Life Sciences, Vol. 5(3) September, 2017
INTRODUCTION
Bread wheat (Triticum aestivum L.) one of the most
important small cereal crop which ranks fourth in
terms of area coverage after teff, maize and sorghum.
The crop is also one of the most important cereal crops
being cultivated in the mid and high land areas of
Tigray region cultivated over 100,175 hectares (ha)
with a total production of about 192,507 tons (CSA,
2014).
Nonetheless, the productivity of wheat in the country
is low compared to other wheat producing countries of
the world (Gashaw et al., 2014). Moreover, its average
yield in Tigray has remained by far lower than the
national yield (Mesay et al., 2012). This explicitly
shows that the production of wheat in the Region is
very insufficient to meet the increasing food
demand for the ever increasing population (Gain,
2014).
Though, several socio-economic, abiotic, and biotic
constraints explain these yield gaps; crop production
in the semi-arid highlands of Tigray is restricted by
soil moisture stress and low fertility mainly nitrogen
(Fassil et al., 2009, Araya et al., 2010a). Rainfall is
erratic with intermittent drought spells (Araya et al.,
2010a), short length of growing period (Hadgu et al.,
2013). Mean annual rainfall has been estimated at 650
mm or less over the past few decades (Pender and
Gebremedhin, 2004), and the coefficient of variation is
four times the national level (REST 1995). However,
the risk of water shortage usually happens due to late
onset and early cessation of rainfall. These periods of
water deficit mainly occur during the critical periods
of flowering, grain set and grain filling of wheat as a
result yield is consequently low(Araya et al., 2010 ,
Alemtsehay et al., 2015).
Allen et al. (1998) and Rockström and Barron (2007)
stated that for cereals, the period between grain filling
and maturity was particularly sensitive to drought
stress, with greatest yield reductions occurring when
stress began during or following heading or during
maturation. Water deficit around anthesis may lead to
a loss in yield by reducing spike and spikelet number
and the fertility of surviving spikelets (Giunta et al.,
1993), while water deficit during grain-filling period
reduces grain weight (Royo et al., 2000).
Oweis (2014) reported that supplemental irrigation of
50–200 mm in a season is sufficient to double or more
than double rain-fed yields. Similarly, Oweis and
Hachum (2003) reported that wheat yields can be
increased from 2 tons per hectare to more than 5 tons
per hectare by the conjunctive use and timely
application of only 100 to 200 mm of irrigation water.
Related studies in the country have shown that more
than 80% of the yield reduction and more than 50% of
crop failures in tef and barley can be avoided if SI is
employed during the critical growth stages of the
crops (Araya and Stroosnijder, 2011). SI increased the
yield of tef from less than 1 t ha-1 to 2 tons ha-1 (Yihun
et al., 2013 and Alemtsehay et al., 2015). Similar
results were also reported for Pearl millet (Ashraf et
al., 2001).
However, the most beneficial effects of supplemental
irrigation were obtained in combination with soil
fertility management (Rockström et al., 2003). Plant
available nutrient supply is also essential to maximize
the benefits of additional water captured or saved.
This is especially true for N (Ryan et al., 2009). Several
studies suggested that limited supplemental irrigation
and fertilization during the growth season could
significantly increase water productivity, fertilizer use
efficiency and wheat yield (Pandey et al., 2002;
Mintesinot et al., 2004; Kibe et al., 2006, and Tavakoli
et al., 2010). Furthermore, SI allows modifying crop
calendars to escape climatic extremes and adapt to
climate change (Oweis, 2014).
Supplemental irrigation (SI) is a key strategy, albeit it
is still underused, for unlocking rain-fed yield potential
and water productivity in rain-fed wheat in Tigray
even in areas having perennial water sources in the
study area. Conversely, no research has been
conducted in the study area to elucidate the effect of
application of mineral nitrogen coupled with
supplementary irrigation on the productivity of wheat.
The objective of the study was, therefore, to identify
the optimum rates of nitrogen and supplemental
irrigation that would maximize the productivity of
bread wheat.
MATERIALS AND METHODS
Description of the Experimental Site
A field experiment was carried out for two successive
seasons (2013/ – 2014) under farmers field at
Enderta. The site is geographically located in the
southeast of Tigray at 130 5‘N latitude, 390 5‘ E
longitudes and an altitude of 1970 masl. The area
Performance of bread wheat (Triticum aestivum L.) in response to supplemental irrigation
www.ijlsci.in Int. J. of Life Sciences, Vol. 5(3) September, 2017 347
receives an average annual rainfall of 392 mm of
which 317 mm were received in the 2013 cropping
season. For 2014, the average annual rainfall was 790
mm of which 537 mm were received in the growing
season. The average yearly minimum and maximum
temperatures are 11 and 27 for 2013 and 11 and 26 ◦ C
for 2014, respectively (Mekelle research
Meteorological service). The study site has a one-
season rainfall pattern with extended rainy season
from March to November with the peak season in
August. The main rain season falls from June to
September, during which about 83% of the annual
rainfall occurs. The area is characterized by heavy and
erratic rainfall distribution.
Experimental Materials
A bread wheat variety named Mekelle I which was
released by Mekelle Agricultural Research Centre
(MARC) in 2011 was used as a test crop. It is a semi-
dwarf variety known for its moisture stress resistance
but can perform better under good rainfall. It needs
300- 500 mm rainfall and grows at an altitude of 1980-
2500 meters above sea level. The variety needs 90-95
days to reach maturity (Hintsa et al. 2011).
Treatments and Experimental Design
The experiment was conducted in 2013 and 2014
cropping seasons. The experimental field was laid out
in a randomized complete block design with split plot
arrangement having three replications. Four levels of
supplemental irrigation:( full irrigation or 100 %, 75
% , 50 % of the crop water requirement as well as
rain-fed condition( control) were assigned to main
plots, while nitrogen levels (0, 23, 46, 69 and 92 kg ha-
1) were maintained in subplots.. The size of each plot
was 3 m x 2 m (6m2) and plots and blocks were at the
distances of 0.5 m and 1.5 m apart, respectively. Soil
bunds were constructed around each plot and around
the entire experimental field to minimize nutrient and
water movement from plot to plot. Seeds were sown
into rows of 0.20 m apart and 3 m long. Each plot
consisted of 10 rows. Wheat plants in the two outer
most rows on both sides of a plot as well as 0.2 m on
each end of central rows were considered border
plants and not considered for data collection. The net
plot area that was used for data collection consisted of
6 rows (1.2 m) each 2.6 m in length.
Experimental Procedures
Prior to planting, surface (0 - 20 cm) soil samples, from
twelve spots across the experimental field, were
collected in a zigzag pattern, composited, and analyzed
at Mekelle soil laboratory research center for pH,
texture, soil OC, total N, available P, CEC. for bulk
density, field capacity, permanent wilting point, Soil
bulk density was determined from undisturbed soil
sample taken using a metal cylinder (core sampler) of
known volume (100 cm3) that was driven into the soil
of desired depth and calculated as the ratio of oven dry
weight of soil to a known cylinder core sampler
volume. The water content at field capacity was
determined in the laboratory by using a pressure
(porous) plate apparatus by applying -1/3 bar to a
saturated soil sample. When water is no longer leaving
the soil sample, the soil moisture was taken as field
capacity. Permanent wilting point was also determined
by using pressure membrane apparatus by applying -
15 bars to a saturated soil sample. When water is no
longer leaving the soil sample, the soil moisture was
taken as permanent wilting point. The improved
recommended wheat variety known as Mekelle I was
seeded on 19th July in 2013 and 12th July in 2014 by
hand drilling with a row spacing of 20cm at a seeding
rate of 150 kg ha-1.
The full dose of P fertilizer (20 P) was applied as triple
super phosphate (46% P2o5) at planting, while N was
split applied (half of the dose at planting and half at 30
days after emergence) as Urea: 46% N) according to
the treatments. The improved wheat variety (Mekelle
I) used as test crop which was hand drilled at 150 kg
ha-1 rate with a row spacing of 20 cm was planted on
July 19th and 12th of 2013 and 2014 cropping seasons,
respectively. The size of each plot was 3 m x 2 m
(6m2). Weeds were removed by hand weeding two
times at 30 and 55 days after crop emergence. The
crop was harvested on 29th October and 2th November,
2013 and 2014 respectively.
Determination of Irrigation Water Requirement
The field was irrigated based on the water
requirement (CWR) of the crop after the rain stopped
(Clarke et al., 1988). To estimate the CWR, irrigation
scheduling and irrigation water requirement (IWR) of
the crop the CropWat 8 for windows was used.
Modified FAO Penman-monteith method (Allen et al.,
1998) was used for calculating reference crop evapo-
transpiration (ETO). For the computation of ETo,
meteorological data such as rainfall, Tmax, Tmin,
relative humidity, sunshine hours and wind speed
were used from nearby weather station.

Beyenesh and Nigussie, 2017
348 Int. J. of Life Sciences, Vol. 5(3) September, 2017
The respective crop coefficient for initial, middle and
late growth stages were adopted from the FAO
Penman-monteith method for wheat. Soil data like
total available water (194 mm/m), maximum rain
infiltration rate (30mm/day), rooting depth (3m),
initial soil moisture depletion (45%) and initial
available soil moisture (106 mm/m) were used to
calculate crop irrigation schedule.
Seventy percent of application efficiency was
considered as surface method of water application was
used. Irrigation scheduling of the crop was computed
using FAO CROPWAT program (Allen et al., 1998) by
considering soil type with fixed interval and variable
depth (refill to field capacity). Ten days fixed interval
and refill to field capacity irrigation scheduling criteria
was adopted. Since there was no rainfall received
during the later growth stage net irrigation
requirement was taken to be equal to Etc. The depth
applied to other treatments was taken simply as
percentage of the optimal irrigation.
Based on CROPWAT computer program the total
amount of supplemental irrigation water for 0%, 50%,
75% and 100% SI treatments were 0, 93, 140, 187
mm, respectively. The computed depth of irrigation
water was applied through a partial flume (7.0 cm
height) as per the treatment. First irrigation was
applied on 21 September based on the irrigation
regimes. The second and third irrigation was applied
on 29 September and 09 October 2013. The equivalent
values for the aforementioned treatments in 2014
were 0, 52, 71, 95 mm and applied on 1 October and
10 October.
Data Collection and Measurements
Days to maturity (DM): Physiological maturity was
calculated by counting the number of days from 50 %
emergence to the stage when 90% of the plant reaches
physiological maturity. Data on productive tillers and
plant stand of the plots at harvest were recorded from
randomly selected area of 0.25 m2 (0.5 x 0.5m) at four
sites and expressed as tiller population per meter
square. Plant height (PHT), spikes length (SPL),
Number of seeds per spike (NSPS) was determined
from 10 random sampled plants per plot during
physiological maturity. Grain yield and biomass yield
per plot was determined from the middle 6 rows of
each plot to avoid border effects. Total biomass was
determined by weighing the shoots along with the
seeds using Salter balance. Grain yield was recorded
after cautiously separating the grain from the straw,
cleaned and adjusted to 12.5% seed moisture
content using a hand seed moisture tester
instrument. The thousand grain weights was
determined by counting the number of seeds
randomly taken from each plot and recorded on 12.5
% moisture basis. Harvest index (HI) was calculated as
the ratio of grain to above ground biomass yield.
Water productivity
The productivity of total applied water (WP) is defined
as crop yield per unit volume of total water supplied
(Molden, 1997).
WP = Crop yield kg-1
Water supplied (P+I mm)
Where,
I = irrigation water (mm),
P = the precipitation (mm) during the
growing season.
Economic analysis was performed following the
CIMMYT partial budget methodology (CIMMYT, 1988).
Economic analysis was done using the prevailing
average market prices for inputs at planting and for
outputs at the time of crop harvest. The average local
market price of wheat was 11.29 Birr kg-1, straw 0.68
Birr kg-1, the cost of urea was 12.48 Birr kg-1, and
application cost was 2 Birr kg-1. Labor cost for
irrigation was 16.97, 12.75 and 8.51 man-days per
hectare for 100%, 75% and 50% SI treatments,
respectively. One man-day cost was Birr 100. Fuel cost
was Birr 14.08 liter-1. All costs and benefits were based
on the average of the two years. Percent MRR was
calculated as changes in NB (raised benefit) divided by
changes in cost (raised cost).
Finally all data were analyzed following statistical
procedures of SAS version 9.2. Whenever treatment
effects were significant, the means were separated
using the least significant difference (LSD) and LSD
fisher procedures at the probability level of( p < 0.05).
Homogeneity of variances was also evaluated using
the F-test as described by Gomez and Gomez (1984).
Since the F-test has showed homogeneity of the
variances of the two years for most of the agronomic
parameters, combined analysis was used.

Performance of bread wheat (Triticum aestivum L.) in response to supplemental irrigation
www.ijlsci.in Int. J. of Life Sciences, Vol. 5(3) September, 2017 349
RESULTS AND DISCUSSION
Soil physico-chemical properties
The soil in the study area is vertisol with clay texture
(Rowell, 1994) with a particle size distribution of 45%
clay, 30% silt and 25% sand. High clay content may
indicate the better water and nutrient holding capacity
of the soil in the experimental site. The soil reaction is
almost neutral to slightly neutral according to the
rating of (Tekalign , 1991) indicating that it is suitable
for growing most crops (FAO, 2008).Wheat grows
under a wide range of soil pH, with permissible ranges
of 5.5-7.0 (Gooding and Davies, 1997). Based on the
limit set by Hazelton and Murphy (2007), the soil had
high CEC. The data further revealed that the soil is low
in available P (Cottenie, 1980) and low total N content
and organic matter (Tekalign , 1991), which indicating
that NP is inadequate for maximum crop production in
this soil, causing an important constraint to wheat
production. Therefore, the soils need amendment for
successful crop production. The soil falls in category of
non saline soils (Hazelton and Murphy (2007).
Phenological and Morphological Attributes
Days to maturity was significantly (P<0.01) influenced
by the main effects of supplemental irrigation, N
fertilization and their interaction, year of cultivation
and nitrogen rates by year of cultivation interaction
(Appendix Table I). Table 1 showed that the treatment
that received 100% SI level at application rates of 69
kg N ha-1 delayed maturity by 23% as compared to no
irrigation and no nitrogen was applied. But differences
were not significant with the treatment that received
100% SI at application rates of 92 kg N ha-1and 46 kg N
ha-1.
Table 1. Mean values of days to maturity and plant height of bread wheat as influenced by the interaction effect
of nitrogen rates by supplemental Irrigation levels.
Supplemental irrigation N rate (kg ha-1) Days to maturity Plant height (cm)
Control (no irrigation) 0 83.50k 64.71m
23 84.67jk 67.10l
46 85.67ij 67.53kl
69 86.33hi 69.57jk
92 86.17i 69.83j
50% CWR 0 87.67h 72.48i
23 91.00ef 74.22ghi
46 91.83rf 83.05cde
69 90.67f 81.95de
92 92.33e 81.12e
75% CWR 0 89.17g 73.17hi
23 90.67f 75.37fgh
46 100.50c 82.92cde
69 102.00ab 84.53bc
92 101.17bc 83.47cd
100% CWR 0 96.17d 75.87fg
23 100.50c 76.73f
46 102.83a 86.77b
69 103.00a 89.47a
92 102.83a 83.81cd
LSD (0.05)
1.40 2.29
CV (%)
2.58 1.26
Year
2013
76.21b 92.33b
2014
78.14a 94.53a
LSD (0.05)
0.72 0.43
Means of the same parameter in a column followed by the same letter are not significantly different at P = 0.05
according to LSD Fishers Protected Test. CWR= crop water requirement

Beyenesh and Nigussie, 2017
350 Int. J. of Life Sciences, Vol. 5(3) September, 2017
Table 2. Mean values of days to maturity and productive tiller production of Bread wheat as influenced by the
interaction of nitrogen rate and growing Season.
N rate(kg ha-1)
Days to maturity Productive Tillers m-2
2013 2014 2013 2014
0 88.4e 89.0d 161g 184ef
23 90.7d 92.8c 187de 226b
46 94.2b 96.2a 194cd 222b
69 94.1b 96.9a 176f 223b
92 94.2b 97.0a 200c 258a
LSD (0.05) 1.01 9.00
CV(%) 1.26 5.50
Means of the same parameter in a column followed by the same letter are not significantly different at P = 0.05
according to LSD Fishers Protected Test.
Interaction effects among nitrogen rates and year
were significant. In both seasons, days to maturity was
prolonged with the increase in nitrogen rates.
Significantly longest maturity (97) and 94 days was
recorded with application of 92 kg N ha-1 for 2014 and
2013 seasons respectively. The possible reason for
long maturity in 2014 might be attributed to the better
moisture condition and nitrogen fertilizer that favored
the growth of the crop, delayed senescence and
extended grain filling duration. While, the shortest
maturity in 2013 might be due to the moisture stress
that accelerated senescence. The results are in
agreement with Westage (2003) and Akram et al.
(2004) who stated that water stress-induced
accelerated senescence after anthesis and shorten the
duration of grain filling by causing premature
desiccation of the endosperm. A similar result on
cotton has been reported by Owen et al. (2011).
Plant height of bread wheat was significantly (P <
0.01) varied in response to supplemental irrigation, N
fertilization and their interaction and cropping season
(Appendix Table I). Table 1 showed that the treatment
that received 100%SI with nitrogen application rates
of 69 kg N ha−1 increased plant height by about 39 %
as compared to no irrigation and no nitrogen was
applied. The increase in plant height in response to
this treatment might be primarily due to the
contribution of higher N rates and supplementary
irrigation which improved vegetative growth, cell
expansion and enlargement. This result is in
agreement with Ayoub et al. (1994); and Muhammad
et al. (2012) who have reported direct relationship of
nitrogen application to plant height through
elongation of internodes.
Plant height has significantly (P<0.01) varied across
years. The highest plant height (89.47cm) was
recorded during 2014 cropping season as compared
(83.80cm) to 2013. The highest plant height of wheat
plant in 2014 might be attributed to relatively
adequate water which helps the plant to utilize the
available nutrient to grow fast and taller, produce
more vegetative and reproductive growth than in 2013
with lower rainfall.
Yield components
Productive tiller:
The number of productive tillers m-2 was significantly
(P < 0.01) influenced by supplemental irrigation, N
fertilization rates and their interaction as well as year
of cultivation and its interaction by nitrogen rates
(Appendix Table 1).
Application of 92 kg N ha−1 with 75% SI or 100% SI
level increased tiller production by 94% and 92% as
compared to the control treatment (Table 3). This
result is in line with Kibe et al. (2006) and Malhi et al.
(2006) who stated that increasing irrigation water
during heading to flowering stages of wheat and
nitrogen uptake increased tiller production of wheat.
They also noted that stimulatory effects of N on
tillering through cytokinin synthesis are known to
result into more number of effective tillers of wheat. In
contrast, plants in control (140 m-2) recorded the
lowest number of fertile tillers which might be
attributed to relatively low soil moisture content at the
growth stages of anthesis and booting, which may have
stressed the crop, thereby reducing survival of
productive tillers (Kibe et al., 2006).

Performance of bread wheat (Triticum aestivum L.) in response to supplemental irrigation
www.ijlsci.in Int. J. of Life Sciences, Vol. 5(3) September, 2017 351
Nitrogen rate and year of cultivation interact
significantly to affect number of productive tillers
(Table 2). The highest rate of nitrogen application (92
kg ha-1) increased tiller production by 24% during the
2013 cropping season and by 40% during 2014
cropping season compared to the control treatment.
Spike length: Spike length of bread wheat was
significantly (P>0.001) influenced by supplemental
irrigation levels, N fertilization rates and their
interaction as well as cropping season and its
interaction with supplemental irrigation (Appendix
Table I).
Spike length of wheat was significantly (P<0.01)
affected by the interaction effect of nitrogen rates and
supplemental irrigation levels. The treatment where
nitrogen was applied at the rate of 69 kg N ha-1 and
irrigated with 100 % SI level increased spike length by
about 36% in comparison with no irrigation and no
nitrogen treatment (Table 3).
Spike length has significantly (P<0.01) affected due to
supplemental irrigation and this also varied across
years. In this regard, the highest supplemental
irrigation level increased spike length by 46 % during
the 2014 cropping season and by 28 % during 2013
cropping season as compared to their respective
control (Table 4). The increase in spike length in 2014
might be associated to the better utilization of
nutrients using the adequate moisture of the season
which helps the crop to better utilize the nutrient and
made the plant more efficient to express its potential
in photosynthetic activity and influence to increase
length of spike. Attia and Barsoum (2013); and Shirazi
et al. (2014) also indicated that irrigation resulted in
increased spike lengths of wheat compared with non-
irrigated treatment.
Table 3. Mean values of productive tiller, spike length, seeds per spike, 1000 kernel weight and harvest index as
influenced by nitrogen rates and Supplemental Irrigation levels interaction
Supplemental irrigation Levels
N levels kg ha-1 Productive Tiller
m-2
Spike length (cm)
Seeds per Spike(no)
Thousand seed weight (g)
Control (no irrigation) 0 140.00k 7.23i 31.13m 28.56j
23 150.00k 7.37i 33.63l 29.52j 46 177.67h 7.73ghi 36.31ij 31.32i
69 164.33ij 7.73ghi 35.27jk 29.16j
92 177.10hi 7.77ghi 34.01kl 29.32j
50% CWR 0 163.33j 7.61hi 35.01jkl 32.91h
23 206.67de 8.51ef 38.73gh 34.92g
46 211.67de 9.17d 39.81fg 35.93fg
69 228.34c 8.81de 41.67de 36.42ef
92 236.65bc 8.93de 41.91de 36.07fg
75%CWR 0 203.33def 7.98fgh 37.28hi 36.03fg
23 200.00ef 8.95de 39.58g 37.67de
46 201.65def 9.85c 41.62de 39.05cd
69 191.64fg 9.95bc 42.91cd 40.11bc
92 275.00a 10.15bc 43.47c 39.98bc
100%CWR 0 183.00gh 8.25fg 38.97g 37.47e
23 227.00c 10.45b 41.21ef 39.73bc
46 241.76b 11.25a 43.91c 41.82a
69 213.33d 11.58a 45.96b 41082a
92 270.00a 10.42b 47.59a 42.02a
LSD(0.05) 13 0.54 1.53 1.38
CV% 5.50 4.52 3.01 2.84
Year
2013 183.46b 8.09b 38.09b 34.86b
2014 222.76a 9.87a 40.89a 40.89a
LSD(0.05) 4.06 0.15 0.43 0.37
Beyenesh and Nigussie, 2017
352 Int. J. of Life Sciences, Vol. 5(3) September, 2017
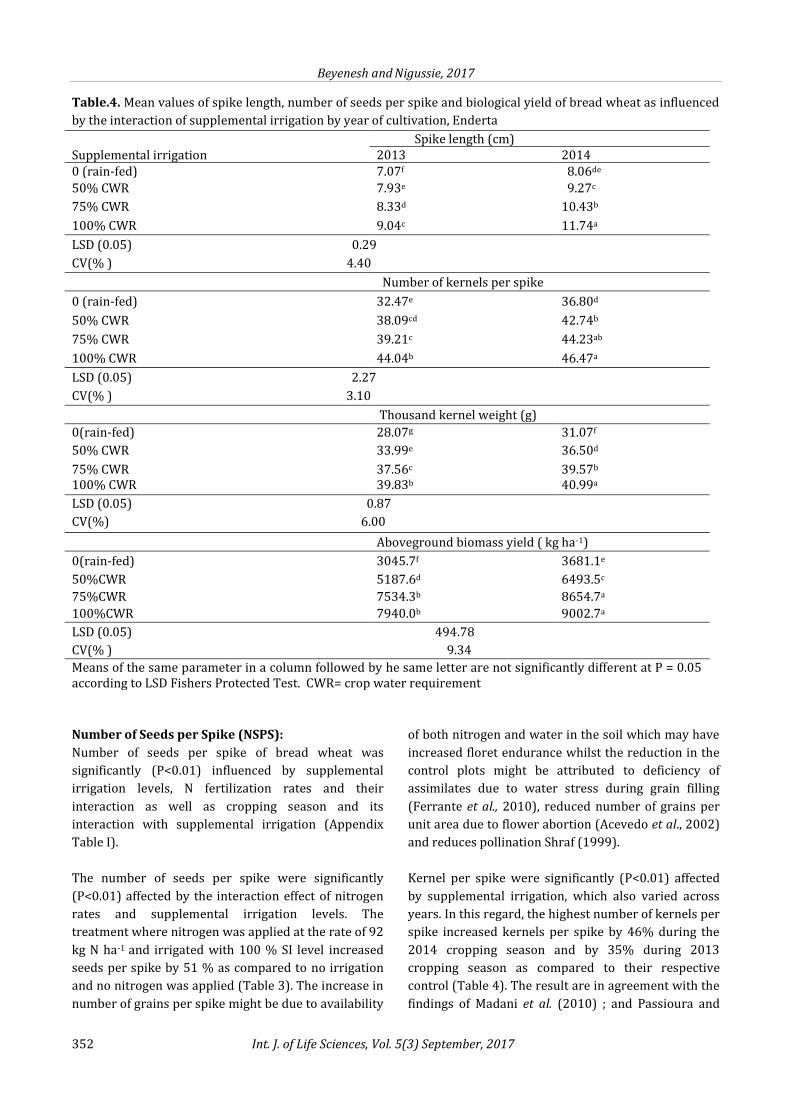
Table.4. Mean values of spike length, number of seeds per spike and biological yield of bread wheat as influenced
by the interaction of supplemental irrigation by year of cultivation, Enderta
Supplemental irrigation Spike length (cm) 2013 2014
0 (rain-fed) 7.07f 8.06de
50% CWR 7.93e 9.27c
75% CWR 8.33d 10.43b
100% CWR 9.04c 11.74a
LSD (0.05) 0.29
CV(% ) 4.40
Number of kernels per spike
0 (rain-fed) 32.47e 36.80d
50% CWR 38.09cd 42.74b
75% CWR 39.21c 44.23ab
100% CWR 44.04b 46.47a
LSD (0.05) 2.27
CV(% ) 3.10
Thousand kernel weight (g)
0(rain-fed) 28.07g 31.07f
50% CWR 33.99e 36.50d
75% CWR 37.56c 39.57b 100% CWR 39.83b 40.99a
LSD (0.05) 0.87
CV(%) 6.00
Aboveground biomass yield ( kg ha-1)
0(rain-fed) 3045.7f 3681.1e
50%CWR 5187.6d 6493.5c
75%CWR 7534.3b 8654.7a
100%CWR 7940.0b 9002.7a
LSD (0.05) 494.78
CV(% ) 9.34
Means of the same parameter in a column followed by he same letter are not significantly different at P = 0.05 according to LSD Fishers Protected Test. CWR= crop water requirement
Number of Seeds per Spike (NSPS):
Number of seeds per spike of bread wheat was
significantly (P<0.01) influenced by supplemental
irrigation levels, N fertilization rates and their
interaction as well as cropping season and its
interaction with supplemental irrigation (Appendix
Table I).
The number of seeds per spike were significantly
(P<0.01) affected by the interaction effect of nitrogen
rates and supplemental irrigation levels. The
treatment where nitrogen was applied at the rate of 92
kg N ha-1 and irrigated with 100 % SI level increased
seeds per spike by 51 % as compared to no irrigation
and no nitrogen was applied (Table 3). The increase in
number of grains per spike might be due to availability
of both nitrogen and water in the soil which may have
increased floret endurance whilst the reduction in the
control plots might be attributed to deficiency of
assimilates due to water stress during grain filling
(Ferrante et al., 2010), reduced number of grains per
unit area due to flower abortion (Acevedo et al., 2002)
and reduces pollination Shraf (1999).
Kernel per spike were significantly (P<0.01) affected
by supplemental irrigation, which also varied across
years. In this regard, the highest number of kernels per
spike increased kernels per spike by 46% during the
2014 cropping season and by 35% during 2013
cropping season as compared to their respective
control (Table 4). The result are in agreement with the
findings of Madani et al. (2010) ; and Passioura and

Performance of bread wheat (Triticum aestivum L.) in response to supplemental irrigation
www.ijlsci.in Int. J. of Life Sciences, Vol. 5(3) September, 2017 353
Angus (2010) who reported that stress after anthesis
reduced pollination, size of the individual grains and
the grain number through abortion of the developing
grains which resulted in the reduction in grain yields.
Thousand Kernel Weight (TKW):
The TKW of bread wheat was significantly (P < 0.01)
influenced by supplemental irrigation levels, N
fertilization rates and their interaction as well as
cropping season and its interaction with supplemental
irrigation (Appendix Table1).
The treatment where nitrogen was applied at the rate
of 92 kg N ha-1 and irrigated with 100% SI level,
increased TKW by 47% as compared to no irrigation
and nitrogen application but this treatment was in
statistical parity with the treatment that received 69
kg N ha-1 of the same SI level (Table 1). The increase in
thousand kernels weight could be attributed to higher
grain weight of well-watered plants which could be
associated with longer grain filling duration and faster
grain filling rate as reported by Li et al. (2000). These
results are in agreement with the findings of Zhang et
al. (1998) who also reported that adequate water at
anthesis not only allowed the plant to increase
photosynthesis rate but also gave extra time to
translocate the carbohydrate to grains which
improved grain size and yield.
The reduction in thousand kernel weight in response
to decreased irrigation may be attributed to water
shortage effects in seed filling period which cause to
the reduction of absorption and translocation of
water and nutrients in plant and reduction of
nutrients translocation rapidity to seeds. This
suggestion is consistent with the findings of Begdelo et
al. (2011) who stated that thousand kernels weight
was reduced under moisture stress conditions.
Thousand kernel weight has significantly (P<0.01)
influenced by the interaction of supplemental
irrigation levels and year of cultivation. The highest
TKW (41g) was recorded during 2014 cropping season
with the application of 100% SI level as compared
(39.8g) to 2013. In this regard, the year explained 3 %
total variability on thousand kernel weight of wheat
(Table 4).In both seasons, thousand kernels weight
progressively increased with increasing the level of
supplemental irrigation. The lowest TKW was
recorded in 2013 than that of 2014 cropping season.
The treatment that received 100% SI level increased
TKW by 31 % and 42% as compared to no irrigation
and no nitrogen was applied in 2014 and 2013
cropping season, respectively. The highest thousand
kernel weight of wheat in 2014 might be attributed to
relatively adequate water which helps the plant to give
extra time to translocate the carbohydrate to grains
which improves grain size than in 2013 with lower
rainfall (Zhang and Oweis, 1998).
Aboveground biomass and Grain Yields
Total aboveground biomass responded significantly (P
< 0.01) to supplemental irrigation, N fertilization rates
and their interaction as well as cropping season and its
interaction with supplemental irrigation (Appendix
Table 1). Table 5 showed that increasing the rate of
nitrogen application from 0 to 92 kg N ha-1 and
supplemental irrigation from zero to 100% had
increased aboveground biomass yield of the wheat
plants consistently. The increases in the aboveground
biomass yield obtained in response to application of
100%, 75% and 50%, SI irrigation combined and 92 kg
N ha-1 over the control treatment were 340%, 58%
and 7%, respectively. However, the aboveground
biomass yield obtained in response to application of
100% irrigation and 92 kg N ha-1 were in statistical
parity with the aboveground biomass yield obtained in
response to the application of 100% irrigation and 69
kg N ha-1. Similar findings were reported by Tavakoli
et al. (2010) who found that irrigation and nitrogen
significantly enhanced biomass yield of wheat, in
which case no significant differences were observed in
biomass production between 66% and 100%
irrigation levels and between nitrogen fertilizer rates
of 60 and 90 kg N ha-1.
The highest aboveground biomass yield obtained at
100% irrigation combined with 69 and 92 kg N ha-1
might be attributed to the synergistic effect of
improved N nutrition and enhanced moisture content
of the soil on growth and photosynthetic efficiency of
the plants, enhanced tillering and delayed senescence
of leaves of the crop which may have resulted in higher
production of dry matter. Moreover, there were no
further statistical yield increases beyond 46 kg ha-1
under non-irrigated plots and 50% SI plots. This could
be possibly due to supra-optimal rates of nitrogen
supply to the plant that was above optimum under
moisture stressed condition.
Aboveground biomass yield varied significantly in
response to supplemental irrigation as well as across
the years (Table 5). In both years, aboveground
biomass yields increased with the increase in SI level.
Beyenesh and Nigussie, 2017
354 Int. J. of Life Sciences, Vol. 5(3) September, 2017
A higher aboveground biomass yield was recorded
during the 2014 cropping year than during the 2013
possibly due to the favorable moisture conditions
during growing period that may have improved the
efficiency of nutrient utilization, and thus the yield
attributing characters and yield of the crop.
The magnitudes of increase in response to 100%
irrigation over the rain-fed, 50% and 75% SI treatme-
nts were 160%, 53%, and 5%, respectively, in 2013.
The equivalent values for the 2014 cropping year were
144%, 39% and 4%, respectively. This may be attribu-
ted to the differences in the amount of rainfall received
during the growing season. Thus, the rainfall of only
317 mm during the growing season of 2013, which
was as much as 537 during the growing season of
2014, may have made the crop respond to irrigation
more vigorously in the former than the latter growing
seasons.
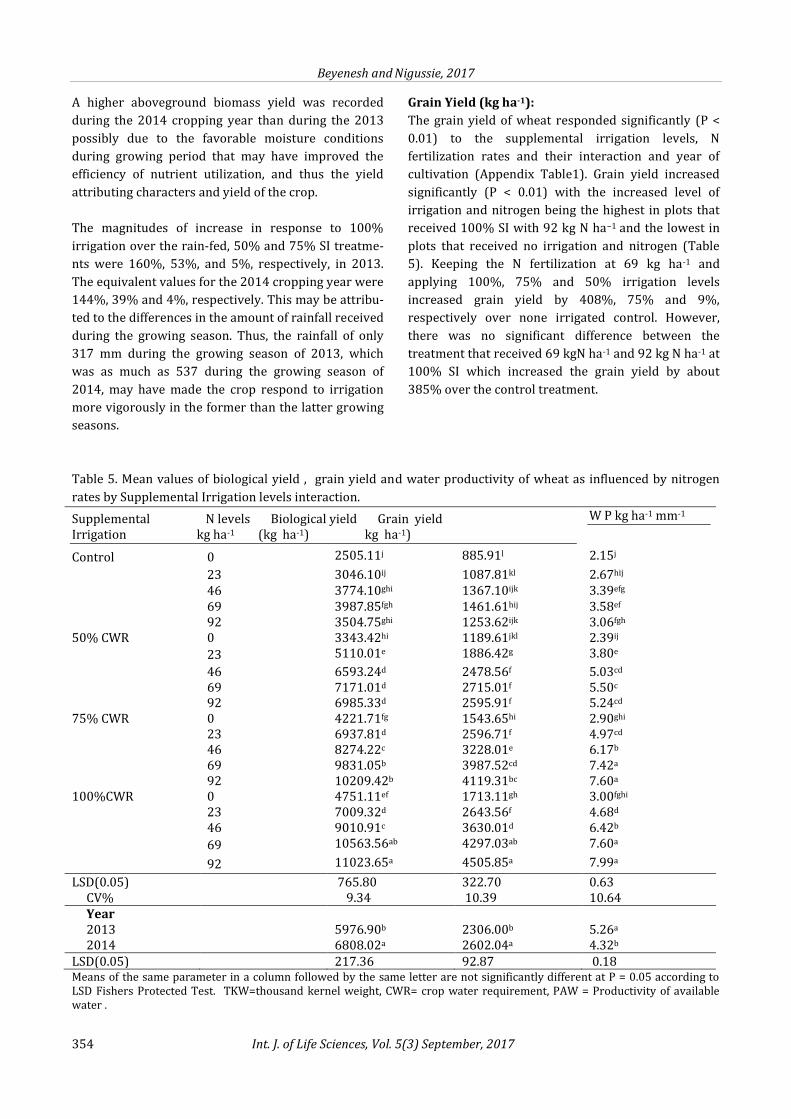
Grain Yield (kg ha-1):
The grain yield of wheat responded significantly (P <
0.01) to the supplemental irrigation levels, N
fertilization rates and their interaction and year of
cultivation (Appendix Table1). Grain yield increased
significantly (P < 0.01) with the increased level of
irrigation and nitrogen being the highest in plots that
received 100% SI with 92 kg N ha−1 and the lowest in
plots that received no irrigation and nitrogen (Table
5). Keeping the N fertilization at 69 kg ha-1 and
applying 100%, 75% and 50% irrigation levels
increased grain yield by 408%, 75% and 9%,
respectively over none irrigated control. However,
there was no significant difference between the
treatment that received 69 kgN ha-1 and 92 kg N ha-1 at
100% SI which increased the grain yield by about
385% over the control treatment.
Table 5. Mean values of biological yield , grain yield and water productivity of wheat as influenced by nitrogen
rates by Supplemental Irrigation levels interaction.
Supplemental N levels Biological yield Grain yield Irrigation kg ha-1 (kg ha-1) kg ha-1)
W P kg ha-1 mm-1
Control 0 2505.11j 885.91l 2.15j
23 3046.10ij 1087.81kl 2.67hij
46 3774.10ghi 1367.10ijk 3.39efg
69 3987.85fgh 1461.61hij 3.58ef
92 3504.75ghi 1253.62ijk 3.06fgh
50% CWR 0 3343.42hi 1189.61jkl 2.39ij
23 5110.01e 1886.42g 3.80e
46 6593.24d 2478.56f 5.03cd
69 7171.01d 2715.01f 5.50c
92 6985.33d 2595.91f 5.24cd
75% CWR 0 4221.71fg 1543.65hi 2.90ghi
23 6937.81d 2596.71f 4.97cd
46 8274.22c 3228.01e 6.17b
69 9831.05b 3987.52cd 7.42a
92 10209.42b 4119.31bc 7.60a
100%CWR 0 4751.11ef 1713.11gh 3.00fghi
23 7009.32d 2643.56f 4.68d
46 9010.91c 3630.01d 6.42b
69 10563.56ab 4297.03ab 7.60a
92 11023.65a 4505.85a 7.99a
LSD(0.05)
765.80 322.70 0.63 CV%
9.34 10.39 10.64
Year 2013
5976.90b 2306.00b 5.26a
2014
6808.02a 2602.04a 4.32b LSD(0.05)
217.36 92.87 0.18
Means of the same parameter in a column followed by the same letter are not significantly different at P = 0.05 according to LSD Fishers Protected Test. TKW=thousand kernel weight, CWR= crop water requirement, PAW = Productivity of available water .

Performance of bread wheat (Triticum aestivum L.) in response to supplemental irrigation
www.ijlsci.in Int. J. of Life Sciences, Vol. 5(3) September, 2017 355
This suggests that the extra N levels greater than 69 kg
N ha-1 had little influence on increasing yield. The
possible reason of increased yield at 100%
supplemental irrigation and nitrogen rates at 69 kg N
ha-1 might be largely attributed to the effect of
nitrogen in sustaining leaf photosynthesis activity,
delaying leaf senescence during grain filling period
and extended duration of grain filling when moisture
supply was not limited. Likewise, supplementary
irrigation upon the cessation of rains may have
allowed remobilization of photoassimilates from
source to sink as was evidenced by Abderrazzak et al.
(2013). The results are in conformity with the findings
of other researchers (Abbas, 2010; Tsegay et al., 2015;
Yihun et al., 2013) who reported supplemental
irrigation at heading; anthesis and early grain filling
period resulted in maximum wheat and tef yields. This
finding is also supported by Tadayon et al. (2012) who
showed that supplemental irrigation at jointing stage
produced greater grain yield and higher water
productivity with application of 100 kg N ha-1.
The lowest grain yield obtained in the control
treatment (885 kg ha-1) might be attributed to reduced
production of photosythate because of deficiencies of
both nitrogen and moisture, which may have resulted
in stomatal closure and early senescence that could
have ultimately affected grain development processes.
Similar results were reported by Akram et al. (2004)
who stated that water stress-induced accelerated
senescence after anthesis shortening the duration of
grain filling and causing premature desiccation of the
endosperm and reducing embryo volume, grain yield,
and kernel weight.
The magnitude of decrease in grain yield in response
to increasing nitrogen from 69 kg N ha-1 to 92 kg N ha-1
under non-irrigated treatment was 14%. A similar
result was reported by Tavakoli et al. (2010) who
described that the lowest response to N was under
rainfed conditions and the highest level (120 kg.N.ha-1)
tended to decrease yields more. While, response to N
were not limited by available water at the 2/3 of full
irrigation level, as they were similar to those at full
irrigation.
The results of this study are also corroborated by the
findings of Thomson and Whitney (1998) who showed
that the most important factors controlling the effect
of nitrogen on crops is water supply. Corbeels et al.
(1998) showed that when water supply was
insufficient, fertilizer nitrogen was inadequately taken
by the plant and some of it may have been lost by
denitrification in an experiment involving a
wheat/sunflower cropping sequence.
The grain yield produced in response to the
application of 69 kg N ha-1 combined with 100%
irrigation, which was agronomically optimum in this
experiment, was five-fold higher than the grain yield
produced in response to the rainfed treatment.
Similarly, this yield was 4-fold, 3-fold, 3-fold, and 3.4-
fold higher than the grain yield produced without
irrigation but with combined applications of 23, 46, 69,
and 93 kg N ha-1 in order mention here. In this
connection, the blanket recommended rate of N
fertilizer in the study area is about 41 kg N ha-1and 46
kg P2O5 (100 kg DAP and 50 kg Urea per hectare)
(Elias, 2002). However, farmers may be applying much
less than even the blanket recommended rate of the
fertilizers possibly because of escalating fertilizers
prices (Bekunda et al., 2010), uncertainty of response
to fertilizers because of frequent moisture stress
during the growing season (Morris et al., 2007). As a
result, the average grain yield of bread wheat obtained
by smallholder farmers under rain-fed condition in the
study area is about 1.5 t ha-1 (TBOARD, 2013), which is
almost equal to the yield obtained under rain-fed
condition (no irrigation), combined with the
application of 69 kg N ha-1 in this study. Thus, the
average grain yield obtained by smallholder farmers in
the study area is only about 1/3rd of the grain yield
obtained in this experiment in response to the
application of 100% supplementary irrigation
combined with 69 kg N ha-1. This result reveals that
farmers in the study area are losing about 66% wheat
grain yield to moisture stress under the rain-fed
production system although the blanket recommended
rate of fertilizer they apply on average to the crop
seems adequate.
The results are in line with the findings of Alemtsehay
et al. (2015) who reported that uptake of N and P by
tef [Eragrostis tef (Zucc.) Trotter] was enhanced in
response to increasing the rates of the fertilizers in the
presence of supplemental irrigation. Araya and
Stroosnijder (2011) also reported that more than 80%
of the yield reduction and more than 50% of crop
failures in tef and barley can be avoided if SI is
employed during the critical growth stages of the
crops.
Beyenesh and Nigussie, 2017
356 Int. J. of Life Sciences, Vol. 5(3) September, 2017
Similarly, Oweis and Hachum (2003) found that wheat
yields increased from 2 tons per hectare to more than
5 tons per hectare in response to the use and timely
application of only 100 to 200 mm of irrigation water.
SI increased the yield of tef from less than 1 t ha-1 to 2
tons ha-1 (Alemtsehay et al., 2015). Similarly, Ashraf et
al. (2001) reported that when water was applied at
mid grain fill pearl millet produced 10 % more grain
yields than with no irrigation.
Water Productivity (WP)
The productivity of total applied water (PAW)
responded significantly (P ≤ 0.01) to supplemental
irrigation levels , N fertilization rates and their
interaction, year of cultivation and the interaction
effect of supplemental irrigation levels by year and
nitrogen rates by year of cultivation(Appendix Table
I). Table 5 showed that increasing the rate of nitrogen
application from 0 to 92 kg N ha-1 with supplemental
irrigation from zero to 100 % SI significantly (P <
0.001) increased water productivity (7.99 kg ha-1 mm-
1) of the crop. Thus, increasing the rate of nitrogen
from 0 N ha-1 to 92 kg N ha-1 and no irrigation to 100
% SI increased WP of the crop by 271% over control.
There was however, no statistical difference with plots
that received 100 % SI level with 69 kg N ha-1 (7.60 kg
ha-1 mm-1) , 75% SI level at application rates of 92 kg N
ha-1 (7.84 kg ha-1 mm-1) and 75% SI level at application
rates of 69 kg N ha-1 (7.41 kg ha-1 mm-1). The findings
of this research indicated that water and nitrogen use
efficiency was greatly increased by supplemental
irrigation. Similar results were reported by (Zhang et
al. 2004; Ali et al. 2007; Oweis et al. 2010).
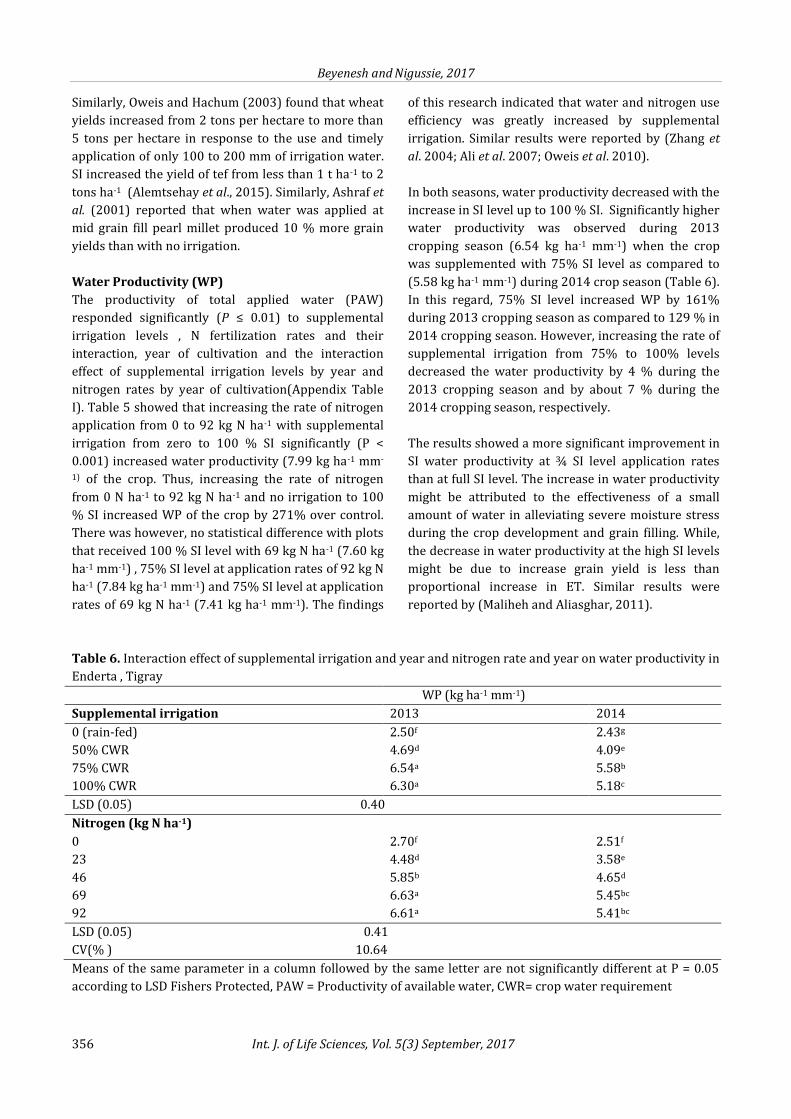
In both seasons, water productivity decreased with the
increase in SI level up to 100 % SI. Significantly higher
water productivity was observed during 2013
cropping season (6.54 kg ha-1 mm-1) when the crop
was supplemented with 75% SI level as compared to
(5.58 kg ha-1 mm-1) during 2014 crop season (Table 6).
In this regard, 75% SI level increased WP by 161%
during 2013 cropping season as compared to 129 % in
2014 cropping season. However, increasing the rate of
supplemental irrigation from 75% to 100% levels
decreased the water productivity by 4 % during the
2013 cropping season and by about 7 % during the
2014 cropping season, respectively.
The results showed a more significant improvement in
SI water productivity at ¾ SI level application rates
than at full SI level. The increase in water productivity
might be attributed to the effectiveness of a small
amount of water in alleviating severe moisture stress
during the crop development and grain filling. While,
the decrease in water productivity at the high SI levels
might be due to increase grain yield is less than
proportional increase in ET. Similar results were
reported by (Maliheh and Aliasghar, 2011).
Table 6. Interaction effect of supplemental irrigation and year and nitrogen rate and year on water productivity in
Enderta , Tigray
WP (kg ha-1 mm-1)
Supplemental irrigation 2013 2014
0 (rain-fed) 2.50f 2.43g
50% CWR 4.69d 4.09e
75% CWR 6.54a 5.58b
100% CWR 6.30a 5.18c
LSD (0.05) 0.40
Nitrogen (kg N ha-1)
0 2.70f 2.51f
23 4.48d 3.58e
46 5.85b 4.65d
69 6.63a 5.45bc
92 6.61a 5.41bc
LSD (0.05) 0.41
CV(% ) 10.64
Means of the same parameter in a column followed by the same letter are not significantly different at P = 0.05
according to LSD Fishers Protected, PAW = Productivity of available water, CWR= crop water requirement

Performance of bread wheat (Triticum aestivum L.) in response to supplemental irrigation
www.ijlsci.in Int. J. of Life Sciences, Vol. 5(3) September, 2017 357
Table 7. Mean marginal rate of return on the effect of nitrogen and supplemental irrigation levels on wheat in
Enderta district, Tigray
Supplemental
irrigation (CWR %)
Applied N
kg ha-1
TCV
(ETB )ha-1
Net benefit
(ETB ha-1)
Raised cost
(ETB ha-1)
Raised benefit
(ETB ha-1)
MRR%
0 0 0.00 10495.0 0.0 0.00 0.00
0 23 724 12144.5 1649.5 724.0 227.83
50 0 1291 12789.3 644.8 567.0 113.72
75 0 1935 16264.3 3475.0 644.0 539.60
50 23 2015 20195.4 3931.1 80.0 4913.88
75 23 2659 27855.3 7659.9 644.0 1189.43
75 46 3333 30732.3 2877.0 674.0 426.85
100 46 3975 38260.9 7528.6 642.0 1172.68
75 69 4007 43658.9 5398.0 32.0 16868.70
100 69 4649 45284.7 1625.8 642.0 253.24
100 92 5323 47004.7 1720.0 674.0 255.19
CWR= crop water requirement, TCV= total cost that vary, MRR= marginal rate of return, ETB= Ethiopian Birr
In general higher water productivity was observed in
2013 compared to 2014 cropping season. The results
are in close collaboration with Magombeyi et al.
(2009) who found large yield responses to
supplementary irrigation of maize, ranging from 67 to
314 %, with the highest responses in the driest years.
They also signify that the significant response of
supplementary irrigation even in the wettest year
reflects the erratic rainfall pattern typical of the semi ‐
arid tropics, and the potential for supplementary
irrigation to bridge dry spells at critical stages .This
study is also in line with Rahman et al. (2000) who
reported that WP is the highest in low rainfall season
and gradually decreased with increasing irrigation
levels in good season.
In both seasons, water productivity decreased when
nitrogen level was increased from 69 to 92 kg N ha-1.
Significantly higher water productivity was obtained
in 2013 (6.63 kg ha-1 mm-1) at application rates of 69 N
kg ha-1 as compared to (5.45 kg ha-1 mm-1) in 2014. In
this regard, the increasing rate of application from 69
N kg ha-1 to 92 N kg ha-1 decreased water productivity
by 4 % during the 2013 cropping season and by about
7 % during the 2014 cropping season, respectively.
Decreased productivity at higher rates was also
reported by Oweis and Hachum, 2003. Moreover, the
application of 69 kg N ha-1 increased water
productivity by 145 % during the 2013 cropping
season and by 117% during 2014 cropping season as
compared to control.
Partial Budget Analysis
Treatments having marginal rates of return (MRR)
below 100% were considered low and unacceptable to
farmers, thus, eliminated (CIMMYT, 1988). This was
because such a return would not offset the cost of
capital and other related costs while still giving an
attractive profit margin to serve as an incentive. The
maximum net benefit of 47004 ETB ha-1 with optimum
marginal rate of return was recorded at the rate of 92
kg N ha-1 supplemented with 100% irrigation, followed
by nitrogen application rates of 69 kg N ha-1
supplemented with 100% irrigation (Table 7).
CONCLUSION
The results of this study have demonstrated that grain
yield, yield components and water productivity of
bread wheat were strongly influenced by
supplemental irrigation and nitrogen application.
Maximum bread wheat grain yield of 4504 kg ha-1 the
highest water productivity 7.99 kg mm-1 ha-1 was
recorded in response to the application of 100%SI
combined with 92 kg N ha-1. However, the lowest grain
yield of 885 kg ha-1 and the lowest water productivity
of 2.15 kg mm-1 ha-1 were recorded in response to the
rain-fed production with no application of any
nitrogen fertilizer. Based on economic analysis, the
acceptable marginal rate of return of 255% and the
highest net benefit (47004 ETB ha-1) was obtained
from the application of 92 kg N ha-1 with 100%
Beyenesh and Nigussie, 2017
358 Int. J. of Life Sciences, Vol. 5(3) September, 2017
supplemental irrigation. The results of the study
indicated that in order to improve the grain yield and
yield components of wheat grown in the clay soils of
Enderta farmers should adopt supplementary
irrigation and adequate fertilization.
Conflicts of interest: The authors stated that no conflicts of
interest.
REFERENCES
Abbas GM (2010) The Effect of Complementary Irrigation in Different Growth Stages on Yield, Qualitative and Quantitative Indices of the Two Wheat (Triticum aestivum L.) Cultivars in Mazandaran, World Academy of Science, Engineering and Technology, 41.
Abderrazza B, Daoui K, Kajji A, Dahan R and Ibriz M (2013) Effects of Supplemental Irrigation and Nitrogen Applied on Yield and Yield Components of Bread Wheat at The Saïs Region of Morocco. 2013. American Journal of Experimental Agriculture, 3(4): 904-913.
Acevado E, Silva P and Silva H (2002) Wheat Growth and Physiology. In: "BreadWheat, Improvement and Production", (Eds.): Curtis, B. C., Rajram, S. and Omez Macpherson, H. FAO Plant Production and Protection Series, 30 PP.
Alemtsehay Tsegay, Vanuytrecht E, Berhanu Abraha, Deckers J, Kindeya Gebrehiwot and Raes D (2015) Sowing and irrigation strategies for improving rainfed tef (Eragrostis tef (Zucc.)Trotter) production in the water scarce Tigray region, Ethiopia.Agricultural Water Management, 150: 81-91.
Allen RG, Periera LS, Raes D and Smith M (1998) Crop evapo-transpiration. Guidelines for computing crop water requirements. FAO Irrigation and Drainage Paper No. 56. FAO, Rome.
Araya Alemgena, Keesstra SD and Stroosnijder L (2010) A new agro-climatic classification for crop suitability zoning in northern semi-arid Ethiopia.Agriculture and Forest Meteorology, 150: 1047-1064.
Araya Alemgena and Stroosnijder L (2011) Assessing drought risk and irrigation need in northern Ethiopia. Agricultural and Forest Meteorology, 151: 425–436.
Akram H, Iqbal MS, Saeed A, Ali A and Nadem MA (2004) Drought tolerance studies of wheat genotypes. Pakistan Journal of Biological Science, 71: 90-92.
Ashraf M, Shehbaz M and Ashraf MY (2001) Influence of nitrogen supply and water stress on growth and nitrogen, phosphorous, potassium and calcium contents in pearl millet. Journal of Plant Biology, 44:459–462.
Attia MA and Barsoum MS (2013) Effect of Supplementary Irrigation and Bio-Fertilization on Wheat Yield Productivity under Rainfed Conditions Alex. Journal of Agricultural Research, 58(.2):149‐157.
Ayoub M, Guertin S, Lussier S and Smith DL (1994) Timing and level of nitrogen fertility effects on spring wheat yield in eastern Canada.Crop Science, 34: 748–56.
Begdelo M, Shirani Rad AH, Noormohammadi G and Tajalli AA (2011) Nitrogen Rates Effect on Some Agronomic Traits of Turnip Rape under Different Irrigation
Regimes. International Journal of Science and Advanced Technology, 1(9):120-125.
CIMMYT (International Maize and Wheat improvement Center).1988. From Agronomic Data to Farmers Recommendations: Economics Training Manual. Completely Revised ed, CIMMYT, Mexico. D.F.
Clarke D, Smith El-Askari K (1998) User’s Guide: Crop Wat4WindowsVersion4.2 .0013. IDIS (UK), FAO (Italy), NWRC (Egypt), p. 43.
Corbeels M, Hofman G and Cleemput O (1998) Residual effect of nitrogen fertilization in a wheat sunflower cropping sequence on a Vertisol under semi -arid Mediterranean conditions.European Journal of Agronomy, 9: 109-116.
CSA (Central Statistical Agency). 2014. Agricultural Sample Survey .Volume V. Report on Area and Production of Major Crops (Private Peasant Holdings, Meher Season Statistical Bulletin. Addis Ababa, Ethiopia.
Elias Esayas (2002) Farmers' perceptions of soil fertility change and management.ISD and SOS Sahel International (UK).EDM Printing Press. Addis Ababa, Ethiopia.
FAO (Food and Agriculture Organization of the United Nations) (2008) Fertilizer and plant nutrition bulletin: Guide to laboratory establishment for plant nutrient analysis. FAO, Rome, Italy, 203 p.
Fassil Kebede and Charles Y (2009) Soil Fertility Status and Numass Fertilizer Recommendation of Typic Hapluusterts in the Northern Highlands of Ethiopia. World Applied Sciences Journal, 6 (11):1473-148.
Ferrante A, Savin R and Slafer GA (2010) Floret development of durum wheat in response to nitrogen availability. Journal of Experimental Botany, 61:4351–4359.
GAIN (Global Agricultural Information Network) (2014) Report: ET1401, Addis Ababa: USDA.
Gashaw Tadesse, Alan de B, Nicholas M and Tangu B (2014) The Impact of the Use of New Technologies on Farmers Wheat Yield in Ethiopia: Evidence from a Randomized Controlled Trial, IFPRI.
Gebre Hadgu, Kinde Tesfaye, Girma Mamo and Belay Kassa (2013) Trend and variability of rainfall in Tigray, Northern Ethiopia: Analysis of meteorological data and farmers’ perception. Acadamic Journal of Environmental Science, 1(8): 159-171.
Giunta F, Motzo R and Deidda M (1993) Effect of drought on yield and yield components of durum wheat and triticale in a Mediterranean environment. Field Crops Research, 33: 399–409.
Gomez KA and Gomez AA (1984) Statistical procedures for agricultural research, second edition, John Wiley and Sons Inc. Toronto.680 pp.
Gooding MJ and Davies WP (1997) Wheat Production and Utilization System, Quality and the Environment. CAB International, UK. London.
Hazelton P and Murphy B (2007) Interpreting soil test results: what do all the numbers mean? CSIRO publishing, Collingwood VIC, Australia.152 p.
Hintsa Gebru, Abraha Hailemariam and Tesfay Belay (2011) Genotype by environment interaction and grain yield stability of early maturing bread wheat (Triticum aestivum L.) genotypes in the drought prone areas of Tigray region, northern Ethiopia. Ethiopian Journal of Applied Science and Technology, 2(1): 51-57.
Performance of bread wheat (Triticum aestivum L.) in response to supplemental irrigation
www.ijlsci.in Int. J. of Life Sciences, Vol. 5(3) September, 2017 359
Kibe AM, Singh S and Kalra N (2006) Water–nitrogen relationships for wheat growth and Productivity in late sown conditions. Agricultural Water Management, 84: 221-228.
Li AG, Hou YS, Wall GW, Trent A, Kimbal BA and Pinter PJ (2000) Free air carbon dioxide enrichment and drought stress effects on grain filling rate and grain filling duration in spring wheat. Crop Science, 40: 1263-1270.
Madani A, Shirani-Rad A, azoki AP, Nourmohammadi G, Zarghami R and Mokhtassi-Bidgoli A (2010) The impact of source or sink limitations on yield formation of winter wheat (Triticum aestivum L.) due to post-anthesis water and nitrogen deficiencies. Plant Soil Enviroment, 56(5): 218–227.
Magombeyi MS and Taigbenu AE (2008) Crop yield risk analysis and mitigation of smallholder farmers at quaternary catchment level: Case study of B72A in Olifants river basin, South Africa. Physics and Chemistry of the Earth, 33: 744 ‐ 756.
Malhi SS, Lemke R, Wang ZH and Chhabra BS (2006) Tillage, nitrogen and crop residueeffects on crop yield, nutrient uptake, soil quality and greenhouse gas emissions. Soil andTillage Research, 90: 171-183.
Maliheh M and Aliasghar M (2011) Optimizing Wheat Water Productivity as affected by Irrigation and Fertilizer-nitrogen Regimes in an Arid Environment. Journal of Agricultural Science, 3(3):143-158.
Mesay Yami, Fekadu Fufa, Terfe Fita and Sultan Usman (2012) Prospects and Challenges of Wheat Production in Ethiopia: Evidence from Major Wheat Producing Regions of the Country Wheat Regional Center of Excellence (WRCoE) Eastern Africa Agricultural Productivity Project (EAAPP) Wheat for Food security in Africa Conference. October 8-12, 2012, Addis Ababa, Ethiopia.
Mintesinot Behailu, Verplancke, H., Van Ranst, E. and Mitiku Haile (2004) Examining Traditional irrigation methods, irrigation Scheduling and alternate furrows irrigation on Vertisols in northern Ethiopia. Agricultural Water Management, 64: 17-27.
Molden D (1997) Accounting for Water Use and Productivity. SWIM Paper 1, International Irrigation Management Institute, Colombo, Sri Lanka.
Morris M, Kelly VA, Kopicki RJ and Byelee D (2007) Fertilizer Use in African Agriculture: Lessons Learned and Good Practices Guidelines.World Bank, Washington, D.C. 144pp
Muhammad AS, Muhammad M, Shawaiz I, Muhammad S, Mahmood-ul-Hassan and Wahid A (2012) Impact of nitrogen nutrition and moisture deficits on growth, yield and radiation use efficiency of wheat (Triticum aestivum L.).African Journal of Biotechnology, 11(75):13980-13987.
Oweis T (2010) Improving agricultural water productivity: a necessary response to water scarcity and climate change in dry areas. Proceedings of the Ninth International Conference on Development of Drylands: Sustainable Development in Drylands- Meeting the Challenge of Global Climate Change, El-Beltagy, A. and Saxena, M. C. (Eds.), 184-196, International Dryland Development Commission, December 2010
Oweis T (2014) The need for a paradigm change: agriculture in water-scarce MENA region. In Holst-Warhaft, G., Steenhuis, T. and de Châtel, F. eds. Water scarcity, security and democracy: a Mediterranean mosaic.
Athens, Global Water Partnership Mediterranean, Cornell University and the Atkinson Center for a Sustainable Future.
Oweis T and Hachum A (2003) Improving water productivity in the dry areas of West Asia and North Africa. In: Kijne, W.J., Barker, R. and Molden, D.(eds) Water Productivity in Agriculture: Limits and Opportunities for Improvement. CAB International, Wallingford, UK, pp. 179–197.
Owen G, Brian GL and Christopher LM (2011) Lint Yield and Crop Maturity Responses to Irrigation in a Short-Season Environment. The Journal of Cotton Science, 15:1–10,
Pandey RK, Maranville JW and Admou A (2002) Tropical wheat response to irrigation and nitrogen in a Sahelian environment. I. Grain yield, yield components and water use efficiency. European Journal of Agronomy, 15: 93–105.
Passioura JB and Angus JF (2010) Improving productivity of crops in water-limited environments. Advances in Agronomy, 106: 37-75.
Pender J and Berhanu Gebremedhin (2004) Impacts of policies and technologies in dryland agriculture: Evidence from Northern Ethiopia. In Challenges and Strategies for Dryland Agriculture, CSSA Special Publication No. 32, Crop Science Society of America and American Society of Agronomy, Madison, WI: 389-416.
Rahman MA, Karim AJ, Shaheed MA and Samad MA (2000) A study on the effect of irrigation and nitrogen fertilization on uptake and efficiency of nitrogen in wheat. Bangladesh. Journal of Agricultural Research, 25(4): 578-588.
REST (Relief Society of Tigray) and NORAGRIC (1995) Farming Systems, Resource Management and Household. Coping Strategies in Northern Ethiopia: Report of a social and agro-ecological baseline study in central Tigray.
Rockström J and Barron J (2007) Water productivity in rain fed systems: overview of challenges and analysis of opportunities in water scarcity prone savannahs. Irrigation Science, 25: 299–311.
Rockström J, Barron J and Fox P (2003) Water productivity in rain fed agriculture: challenges and opportunities for smallholder farmers in drought-prone tropical agroecosystems. In Kijne, J.W., Barker, R. and Molden, D. eds. Water productivity in agriculture: limits and opportunities for improvement, pp. 145–162. Wallingford, UK, CABI.
Royo C, Abaza M, Blanco R, Garcı´a del and Moral LF (2000) Triticale grain growth and morphometry as affected by drought stress, late sowing and simulated drought stress. Austraian. Journal of Plant Physiology, 27:1051–1059.
Rowell D (1994) Soil Science; Methods and Application, Longman Scientific & Technical, 350p
Ryan J, McNeill A, Ibrikci H and Sommer R (2009) Nitrogen in irrigated and rainfed cropping systems of the Mediterranean region. Advance Agronomy, 40: 53-136.
Sharif M (1999) Effect of irrigation at different growth stages on growth and yield performance of wheat cultivars. MSc Thesis, University of Agriculture. Faisalahad.
Shirazi SM, Zardari NH, Yusop Z, Ismail Z and Othman F (2014) Performance of Wheat crop under Different irrigation regimes and nitrogen levels. A field

Beyenesh and Nigussie, 2017
360 Int. J. of Life Sciences, Vol. 5(3) September, 2017
experiment. Journal of Environmental Protection and Ecology,15 (3): 973-982.
Tadayon MR, Ebrahimi R and Tadayyon A (2012) Increased Water Productivity of Wheat under Supplemental Irrigation and Nitrogen Application in a Semi-arid Region. Journal of Agricultural Science Technology, 14: 995-1003.
Tavakoli AR, Oweis T, Ashrafi S, Asadi H, Siadat H and Liaghat A (2010) Improving rainwater productivity with supplemental irrigation in upper Karkheh river basin of Iran.International Center for Agricultural Research in the Dry Areas (ICARDA), Aleppo, Syria, 123pp.
TBOARD (Tigray Bureau of Agriculture and Rural Development) (2013) Crop production annual report, Tigray.
Tekalign Tadese (1991) Soil, plant, water, fertilizer, animal manure and compost analysis.Working Document No. 13.International Livestock Research Center for Africa, Addis Ababa.
Westage ME (2003) Water status and development of maize endosperm and embryo during drought. Crop Science, 34: 76-83.
Yang J, Zhang J, Wang Z and Zhu QL (2001) Water deficit-induced senescence and relationship to the remobilization of pre-stored carbon in wheat during grain filling. Agronomy Journal, 93(1):196-206.
Yihun YM, Haile AM, Schutz B and Erkossa T (2013) Crop water productivity of irrigated teff in a water stress region. Water Resource Management, 27:3115-3125.
Zhang H, Oweis T, Garabet S and Pala M (1998) Water use efficiency and transpiration efficiency of wheat under rain-fed and irrigation conditions in Mediterranean environment. Plant Soil, 201: 295-305.
Zhang Y, Kendy E, Qiang Y, Changming L, Yanjun S and Hongyong S (2004) Effect of soil water deficit on evapo-transpiration, crop yield, and water use efficiency in the North China Plain. Agricultural Water Management, 64 (2): 107–122.
© 2017| Published by IJLSCI

Performance of bread wheat (Triticum aestivum L.) in response to supplemental irrigation
www.ijlsci.in Int. J. of Life Sciences, Vol. 5(3) September, 2017 361
Appendix Table I. Analysis of variance for phonology, growth characteristics, yield and yield components and
water productivity of wheat as affected by , supplemental irrigation and nitrogen rates at Enderta, 2013 and 2014
cropping seasons.
MSE of agronomic variables
Source of variation DF DM PHT PTM SPL NSPS TKW BYLD GYLD HI PAW
Replication 2 15.108 32.85 312.93 2.98 59.8 37.63 224802 56361 1.83 0.49
SI 3 1431.04** 1268.14** 24419.41** 42.87** 478.6** 678.85** 160575812** 28263605** 63.83** 59.4**
Error1 6 2.7194 3.9176 89.38 0.875 6.115 6.196 1491320 243256 2.397 0.756
NL 4 202.57** 467.19** 9903.13** 13.02** 158.05** 45.265 77079680** 13876578** 34.8** 51.61**
SI.NL 12 36.86** 27.34** 3288.58** 1.53** 7.94** 4.0391 5632169** 1206647** 4.30** 3.49**
Error 2 32 2.3792 8.90525 249.89 0.309 2.9044 2.33877 293751 46934 0.835 0.204
Year 1 145.2** 111.16** 46334.7** 95.40** 233.80** 140.83** 20722115** 2629253** 4.953 26.17**
SI.year 3 1.6222 0.05764 15.14 4.39** 1.30** 4.58** 1445703* 172262 2.744 0.9023*
NL.year 4 2.1** 0.0125 1212.2** 0.033 0.300 0.113 201833 30398 0.844 1.137**
SI.NL.year 12 0.0389 0.0125 28.76 0.033 0.300 1.432 156353 20365 0.872 0.1177
Error 3 40 0.60 0.0271 24.70 0.050 0.229 1.042 406979 79652 2.133 0.305
Total 119
DM= days to maturity, PHT= plant height ,PTM= productive tiller m2 , SPL=spike length ,NSPS= number of seeds per spike , BYLD=biological yield, GYLD= grain yield ,HI=
harvest index, PAW= productivity of available water.
Submit your manuscript to a IJLSCI journal and benefit from: ✓ Convenient online submission ✓ Rigorous peer review ✓ Immediate publication on acceptance ✓ Open access: articles freely available
online ✓ High visibility within the field
Email your next manuscript to IJLSCI