Embed Size (px)
Citation preview

\
NASA TECHNICAL NOTE _ - N A S A TN D-4943 e* I
m d - 0 - - m w 04 w- 0 - m
e-= I w- * e=
- n m m 3
Ln- ==E I-- w -
-.P ul-
z
4 m 4 z
- - 2 - = -
LOAN COPY: RETURN TO'
KIRTLAND AFB, N M U AFWL (WLIL-2)
PERFORMANCE OF A TOWED, 48-INCH-DIAMETER (121.92-cm) BALLUTE DECELERATOR TESTED I N FREE FLIGHT AT MACH NUMBERS
I
:' FROM 4.2 TO 0.4
. I
by J. W. U s ~ y
Langley Research Center /:' : Langley Station, Humpton, Va.
/2& Is'
(i I
,""
- N A T I O N A L , AERONAUTICS A N D SPACE A D M I N I S T R A T I O N W A S H I N G T O N , D. C. FEBRUARY 1 9 6 9 I i /
i i
F e .
,, . r .* - I I

TECH LIBRARY KAFB, NM
0132155
NASA TN D-4943
PERFORMANCE OF A TOWED, 48-INCH-DIAMETER (121.92-cm)
BALLUTE DECELERATOR TESTED IN FREE FLIGHT
AT MACH NUMBERS FROM 4.2 TO 0.4
By J. W. U s r y
Langley Research Center Langley Station, Hampton, Va.
Technical Film Supplement L-1002 available on request.
NATIONAL AERONAUTICS AND SPACE ADMINISTRATION
For sale by the Clearinghouse for Federal Scientific and Technical Information Springfield, Virginia 22151 - CFSTI price $3.00
I '

PERFORMANCE OF A TOWED, 48-INCH-DIAMETER (121.92-cm)
BALLUTE DECELERATOR TESTED IN FREE FLIGHT
AT MACH NUMBERS FROM 4.2 TO 0.4
By J. W. Usry Langley Research Center
SUMMARY
A ballute decelerator inflated by ram air was tested in free flight to determine the The decelerator had a 40-inch (101.6-cm) inflation, drag, and stability characteristics.
envelope equatorial diameter and a 10-percent burble fence. It was towed 13.5 feet (4.12 m) aft of a cone-cylinder-flare payload with a maximum diameter of 18.21 inches (46.25 cm). The decelerator w a s deployed at an altitude of 115 000 feet (35.1 km) at a velocity of 4400 ft/sec (1342 m/sec) and inflated at a Mach number of 4.2 and a free- stream dynamic pressure of 163 lb/ft2 (7.8 kN/m2).
The time from the beginning of inflation of the decelerator to full inflation was 0.42 second. Longitudinal loads during inflation were of the same order of magnitude as the steady-state drag load. The decelerator appeared to have excellent stability charac- teristics in pitch and yaw during and after inflation. Roll ra tes of both bodies increased after deployment from a minimum of about 2.6 radians/sec just prior to inflation to a maximum of about 6.8 radians/sec for the decelerator and about 5.8 radians/sec for the payload. The drag coefficient of the decelerator varied from about 1.45 at a Mach num- ber of 1.25 to 0.67 at a Mach number of 4.2.
INTRODUCTION
Towed, supersonic decelerator systems are being considered for use as stabilizers and decelerators of spacecraft, research payloads, and expensive booster components. To serve in this capacity, the decelerator in combination with the primary towing body should be statically and dynamically stable and have a high drag coefficient. In addition, the decelerator should be lightweight, easily deployed and inflated, and, with minor modifica- tions, easily constructed for application over a wide range of velocities and altitudes (ref. 1).
Parachutes have been used extensively to decelerate and stabilize airborne bodies in the subsonic regime. Successful operation at supersonic speeds of at least Mach 2 and
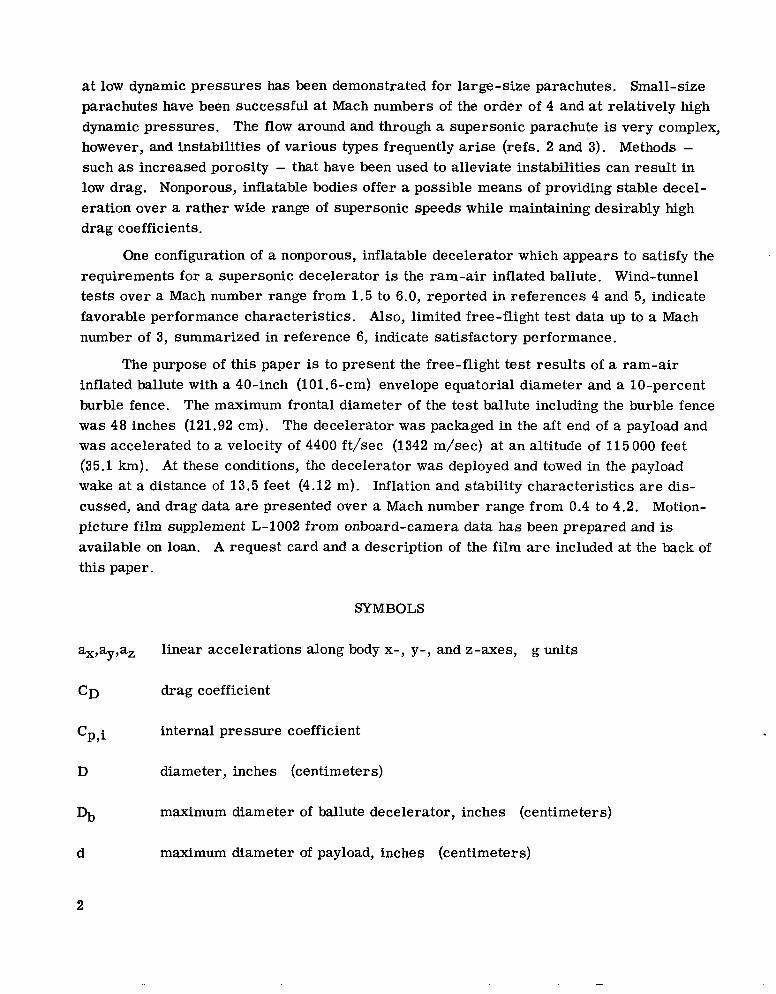
at low dynamic pressures has been demonstrated for large-size parachutes. Small-size parachutes have been successful at Mach numbers of the order of 4 and at relatively high dynamic pressures. The flow around and through a supersonic parachute is very complex, however, and instabilities of various types frequently ar ise (refs. 2 and 3). Methods - such as increased porosity - that have been used to alleviate instabilities can result in low drag. Nonporous, inflatable bodies offer a possible means of providing stable decel- eration over a rather wide range of supersonic speeds while maintaining desirably high drag coefficients.
One configuration of a nonporous, inflatable decelerator which appears to satisfy the requirements for a supersonic decelerator is the ram-air inflated ballute. Wind-tunnel tests over a Mach number range from 1.5 to 6.0, reported in references 4 and 5, indicate favorable performance characteristics. Also, limited free-flight test data up to a Mach number of 3, summarized in reference 6, indicate satisfactory performance.
The purpose of this paper is to present the free-flight test results of a ram-air inflated ballute with a 40-inch (101.6-cm) envelope equatorial diameter and a 10-percent burble fence. was 48 inches (121.92 cm). The decelerator was packaged in the aft end of a payload and was accelerated to a velocity of 4400 ft/sec (1342 m/sec) at an altitude of 115000 feet (35.1 km). At these conditions, the decelerator was deployed and towed in the payload wake at a distance of 13.5 feet (4.12 m). Inflation and stability characteristics are dis- cussed, and drag data a r e presented over a Mach number range from 0.4 to 4.2. Motion- picture film supplement L-1002 from onboard-camera data has been prepared and is available on loan. A request card and a description of the film a r e included at the back of this paper.
The maximum frontal diameter of the test ballute including the burble fence
SYMBOLS
linear accelerations along body x-, y-, and z-axes, g units
drag coefficient
internal pressure coefficient
diameter, inches (centimeters)
maximum diameter of ballute decelerator, inches (centimeters)
maximum diameter of payload, inches (centimeters)

F force measured by tensiometer, pounds (newtons)
g
h
2
M
P
Pi
p,
q
4.20
R
r
S
acceleration due to gravity, feet/second2 (meters/second2)
altitude, feet (kilometers)
towline length, inches (centimeters)
Mach number
roll rate, radians/second
decelerator internal pressure, pounds/foot2 (newtons/meter2)
free - stream pressure, pounds/f oot2 (newtons/me ter2)
pitch rate, radians/second
free- stream dynamic pressure, pounds/foot2 (newtons/me ter2)
radius, inches (centimeters)
yaw rate, radians/second
decelerator reference area (based on envelope equatorial diameter), fee t2 (meter s2)
t time, seconds
V total velocity, feet/second (meters/second)
W weight of payload-decelerator system, pounds (kilograms)
XYY rectangular coordinates of a typical gore section or burble- fence pattern, inches (centimeters)
XYYYZ body-axis system
a! angle of attack, degrees
3

P
77
angle of sideslip, degrees
total incidence angle, degrees
TEST CONFIGURATION
A sketch of the flight-test configuration is shown in figure 1. The length from the payload nose to the rear of the ballute decelerator was 22.1 feet (6.74 m), and the weight was 201 pounds (91.17 kg). The ballute was towed 13.5 feet (4.12 m) downstream of the payload base. The ratio of the maximum diameter of the ballute to the maximum diam- eter of the payload was 2.64. The payload weight prior to deployment was 203 pounds (92.08 kg) and after deployment 184.5 pounds (83.6 kg). The trailing weight including the towline assembly and ballute was 16.5 pounds (7.48 kg). The center of gravity of the pay- load was located 28.6 inches (72.6 cm) aft of the payload nose prior to deployment and 26 inches (66 cm) aft of the payload nose after deployment.
The towline assembly consisted of two snubber lines, the main r i se r line, and a nylon sleeve. The general arrangement at the payload and ballute attachment points is shown in figure 1. The snubber lines absorbed the deployment snatch loads and were cut prior to inflation. The main r i se r line was one continuous nylon line wrapped around the attachment bolts of the payload and ballute. The ends of the main r iser line were stitched near the geometric center of the length. The nylon sleeve prevented the cut snubber lines from flailing the payload and ballute.
Decelerator Description
A sketch of the inflated ballute decelerator is shown in figure 2. The envelope was symmetrical about the longitudinal axis and was formed by combining two surfaces of revolution as defined by the methods of reference 7. The front surface approximated an 80° cone which was truncated to accommodate an adapter ring for the towline attachment and the transmission of loads to the meridional suspension lines and envelope fabric. The equatorial diameter of the envelope was 40 inches (101.6 cm). An inflatable torus (called a burble fence) was incorporated to provide stability at subsonic speeds. (See ref. 8.) The burble fence was 10 percent of the envelope equatorial diameter and resulted in a maximum frontal diameter for the decelerator of 48 inches (121.92 cm).
The ballute envelope was constructed from sixteen gores cut from a single ply of woven fabric. The fabric consisted of a high-temperature nylon material coated with an elastomer to reduce porosity. Sixteen meridional suspension lines, each located in the center of a gore, were wrapped and stitched around the envelope fabric with the ends attached to the adapter ring. The suspension lines carried the longitudinal loads during
4

deployment and inflation, as well as part of the internal pressure load on the back of the decelerator. A typical envelope gore pattern, burble-fence pattern, and the rectangular coordinates of each are depicted in figure 3.
Inflation of the ballute was accomplished by ram-air entering four inlets located diametrically on the envelope periphery. The ram-air inlets were made with a spring- loaded wire, framed at the mouth to insure intial opening. Inflation of the burble fence was accomplished by means of holes in the envelope fabric as shown in figure 3.
Payload Description
The payload was a body of revolution 55.98 inches (142.19 cm) long. A sketch of the payload with dimensions and pertinent details is presented in figure 4. The four principal structural components were the blunted cone-cylinder forebody, an instrument support deck, which was contained in the forebody, a cylindrical centerbody, and the flared afterbody.
The forebody w a s 18.5 inches (46.99 cm) long. It consisted of a hemispherical nose with a radius of 3.76 inches (9.55 cm) and a cone-cylinder section with a 20° half-angle. The forebody enclosed the instrument support deck and both were insulated from the res t of the payload by the telemeter antenna ring.
The cylindrical centerbody was 18.85 inches (47.88 cm) long with a 12-inch (30.48-cm) diameter. The aft end of the centerbody was closed by a cover plate. The plate was machined and threaded on the aft surface to accept the separation bolt which attached the flare to the centerbody.
The afterbody consisted of a loo half-angle flare with four fins. 18.63 inches (47.32 cm) long and had a maximum diameter of 18.21 inches (46.25 cm). The fins had a sweep angle of 20° and a leading-edge radius of 0.1 inch (0.254 cm). cross section of the fin was wedge shaped with a 14O half-angle. A cylindrical sleeve, which was part of a bulkhead in the forward end of the flare, mated with the centerbody cover plate and enclosed the explosive bolt. The inside diameter of the aft end of the sleeve was threaded to accept a tensiometer to which the decelerator towline was attached. The aft end of the flare housed the packaged decelerator during the boost phase of the mission.
The flare was
The
INSTRUMENTATION
A telemeter transmitted nine continuous channels of information. These channels included two longitudinal accelerations; two lateral accelerations; pitch, yaw, and roll rates; a tensiometer measurement of the tension in the towline; two differential pressure
5

measurements on the payload nose; the decelerator internal pressure; and one channel to correlate photographic data with telemetered data. The pressure data were commutated and transmitted on one channel. Each pressure measurement was recorded approximately every 0.1 second.
A motion-picture camera was located in the payload centerbody as shown in figure 4. The lens was parallel to the payload center line, looked rearward, and was located 3.08 inches (7.82 cm) from the center line. The total view angle was 600 with go obstructed by the payload flare. The field of view in a plane at the decelerator was about 3 decelerator body diameters.
The following table lists the instruments, instrument ranges, and the expected accuracy of each instrument:
Instrument
Longitudinal accelerometer . . . . . . . . . . Longitudinal accelerometer . . . . . . . . . . Lateral accelerometers . . . . . . . . . . . . Roll-rate gyro . . . . . . . . . . . . . . . . . Pitch- and yaw-rate gyro . . . . . . . . . . .
I I I Accuracy,
Range percent of total range
-15 to 68g *2
-5 to l g *2
-5 to 5g 1 2
-1 5 to 15 radians/sec rt2
-10 to 10 radians/sec *2
. . . . . . . . . . . . . . . . . . Tensiometer
. . . . . . . . . . . . . -2 to 2 psi (-13.79 to 13.79 kN/m2 Differential pressure
*3 ~~
. . . . . . . . . 0 to 10 psi 1 {O to 68.95 kN/m2 Decelerator internal pr e s sure
The body-axis-system orientation for the measured and computed quantities is * shown in figure 5. in the positive x-, y-, and z-directions. Angles of attack and sideslip were positive when the pressure in the positive y- and z-directions was larger.
Linear accelerations and tensiometer force were measured positive
6
. . . . . . . . .

RESULTS AND DISCUSSION
Test Environment
The test environment was acheived with the use of a three-stage rocket-boosted launch vehicle. The mission profile is shown in figure 6. The payload, after separating from the spent third-stage booster, coasted on an ascending trajectory for approximately 10 seconds before decelerator deployment was initiated. Deployment was accomplished by firing a 2-pound (0.908-kg) weight rearward with a line attached to the decelerator. Approximately 1 second after deployment, the decelerator inflated at h = 115 000 feet (35.1 km) and V = 4380 ft/sec (1335 m/sec) or M = 4.2 and qm = 163 lb/ft2 (7.8 kN/m2). After inflation, the payload-decelerator combination coasted to an apogee altitude of 241 000 feet (73.4 km). On the descending trajectory at an altitude of 20 000 feet (6.09 km), the decelerator and flare section separated from the rest of the payload, and a parachute was deployed. The payload, excluding the flare and decelerator, was recovered.
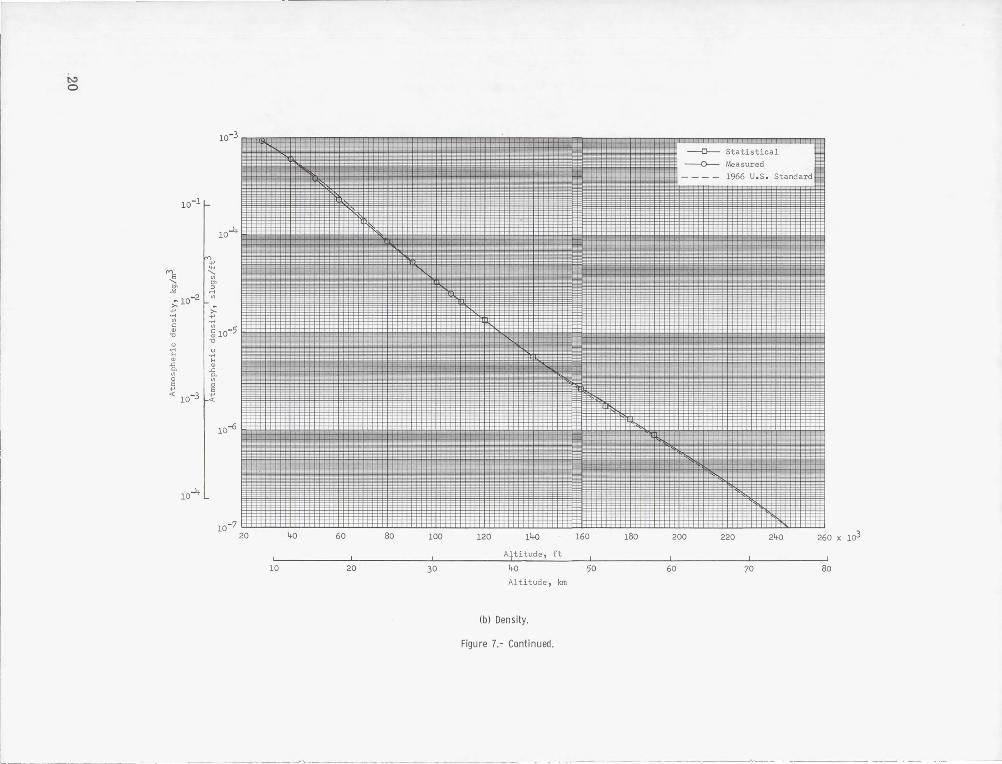
Atmospheric pressure, atmospheric density, and speed-of - sound variations with altitude a r e presented in figure 7. These conditions were measured near the time of flight up to an altitude of 106 000 feet (32.3 km) and were extended to the higher altitudes by means of unpublished statistical data. The flight-test atmospheric conditions a r e compared with the 1966 U.S. Standard Atmosphere in figure 7 and are estimated to be accurate within 3 percent.
Altitude, horizontal range, and velocity data were obtained from the best available radar track of the payload. Altitude and velocity time histories a r e shown in figure 8, and Mach number and dynamic-pressure time histories a r e shown in figure 9. velocity data were obtained by differentiation of the space-position radar data and were estimated to be accurate within 100 ft/sec (30.48 m/sec).
The
Data Presentation
Basic measurements of the pitch and yaw angular rates and the linear accelerations in the y- and z-directions are presented from t = 56 seeonds, about 5 seconds before decelerator deployment, to t = 74 seconds, approximately 13 seconds after deployment. Measured roll rates of the payload and estimated roll rates of the decelerator from the onboard-camera film a r e given from t = 56 seconds and t = 64 seconds, respectively, to the end of camera coverage at t = 115 seconds. Drag-coefficient data for the decel- erator are presented for M = 0.4 to M = 4.2. The drag-coefficient data for the decel- erator were estimated from longitudinal-accelerometer measurements. Estimated drag coefficients of the payload alone for M = 0 to M = 4.2 are included.
7

Decelerator Performance
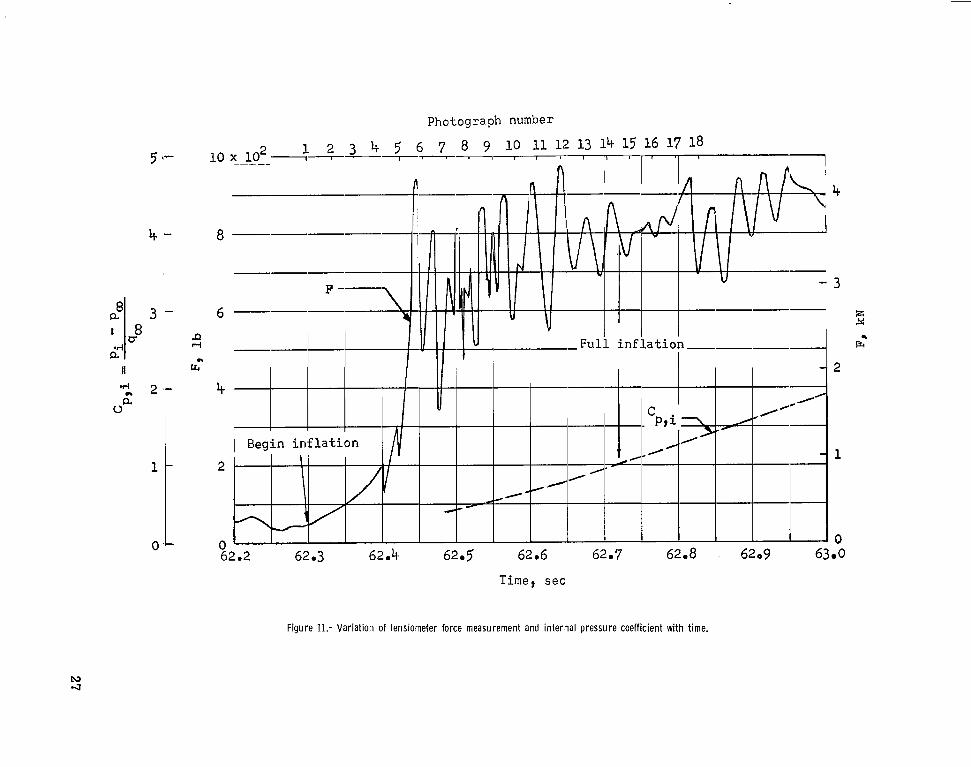
Inflation characteristics. - The inflation sequence was initiated when the decelerator ram-air inlets were exposed to the stream in the payload wake. Photographs taken by the onboard camera showing the inflation sequence are presented in figure 10. Figure 11 shows a history of the measured force in the towline and the decelerator internal pressure coefficient. Also the times at which the photographs of figure 10 were made a r e indicated in figure 11.
The first photograph in the sequence was made just prior to the beginning of infla- tion at t = 62.3 seconds. The photographs which follow were made approximately 0.031 second apart. Inflation to full size w a s assumed to occur when the internal pres- sure coefficient was approximately equal to the maximum external surface-pressure coefficient. The maximum surface-pressure coefficient is 1.0 at M = 4.2. In figure 11 the internal pressure coefficient is about 1.0 at t = 62.72 seconds. Also, photograph number 15 (fig. lo) , made at t = 62.73 seconds, shows that the decelerator has reached its full size. The time to inflate to full size was concluded to be 0.42 second.
The unsteady oscillation in the measured tensiometer force is typical for the ram- air inflated, cone-balloon decelerator and was probably due to the combination of the unsteady loads on the decelerator during the inflation process and the towline elasticity effects. Because of the time duration from the beginning of inflation to full inflation, this type of decelerator does not experience an initial shock load a t inflation much larger than the average value of the drag after inflation. (See fig. 11.)
Stability characteristics. - The stability characteristics of the decelerator were inferred by measuring the motions and loads induced to the payload by the decelerator and by observing the decelerator with a motion-picture camera. Angular rates about the payload body axes and linear accelerations along the axes were measured by rate gyros and accelerometers. Angles of attack and sideslip were determined from measurements of differential pressure between diametrically opposite orifices on the hemispherical nose, from stagnation pressure, and from the estimated dynamic pressure. The methods of reference 9 were utilized to compute the angle of attack:
where
APa! differential pressure between diametrically opposite orifices, psi (N/m2)
8

q, dynamic pressure, psf (N/m2)
stagnation pres sure coefficient CP,t
The angle of sideslip was estimated similarly. For small angles, the total incidence angles were estimated from the following equation:
Roll rates of the decelerator were determined from the onboard-camera film data.
Time histories of the estimated total incidence angles, the basic measurements of pitch and yaw angular rates, and the lateral accelerations in the y- and z-directions are shown in figure 12. Histories of the payload and the decelerator roll rates relative to the body-axis system a r e presented in figure 13.
Basically the results of figure 12 and the onboard-camera data indicate the decel- erator was statically and dynamically stable in the pitch and yaw planes. measurements in the sensitivity ranges of the onboard instruments prohibits a meaningful analysis of the quantitative stability characteristics. cant pitch and yaw rates and lateral loads suggests a minimum of payload-decelerator motions. Prior to decelerator deployment, the payload was coning about a small trim angle of about 10. Just after deployment, the angle reached a maximum of 3.5O but appeared to decrease as the decelerator inflated and reached a steady-state condition. Prior to deployment, t = 61 seconds, the angles were estimated to be accurate to *1.3O, based on an instrument uncertainty of 3 percent of the range; an uncertainty of 3 percent in the density; and an uncertainty of 100 ft/sec (30.48 m/sec) in the velocity. After deployment, the uncertainty in the estimated angles becomes large because of the rapidly decreasing dynamic pressure. At t = 66 seconds, for example, the estimated uncer- tainty was do. The photographic data, however, show that large pitch-yaw motions did not exist during the time interval presented in figure 12. Translations of the decelerator relative to the payload in the yz-plane placed at the decelerator were less than 1/2 the decelerator diameter. Also the decelerator did not have any measurable motion about its center of gravity or about the towline- to-decelerator attachment point.
The lack of
The absence, however, of signifi-
The initial roll rate of the payload (fig. 13) at t = 56 seconds was induced during the third-stage thrusting phase. The roll rates of the payload and decelerator increased from a minimum of about 2.6 radians/sec just prior to inflation to a maximum of about 6.8 radians/sec for the decelerator and about 5.8 radians/sec for the payload. A possible explanation for the increase in the decelerator roll rate and subsequent increase in the payload rate could be the unsymmetrical loading on the variable-shape decelerator
9

during the inflation process. primarily due to the degree of twisting in the towline caused by the relative rates of the two bodies.
(See fig. 10.) The maximum values are believed to be
Drag characteristics. - The drag characteristics of the ballute decelerator including the towline were estimated from onboard-accelerometer measurements, trajectory data, and estimates of the payload drag. The payload drag was calculated by using the best estimates of drag coefficient from references 10, 11, and 12, the free-stream velocity, and the atmospheric density. The decelerator and payload drag-coefficient variations with Mach number a r e depicted in figure 14. The decelerator drag coefficient was estimated from the following equation:
The drag-coefficient data are valid only for the decelerator in the wake of the payload used in this experiment, since the dynamic pressure in the payload wake was unknown and the estimated free-stream dynamic pressure was used in the calculations. The uncertainty in the estimates of the decelerator drag was based on an uncertainty of 3 percent in the atmospheric density; an uncertainty of 100 ft/sec (30.48 m/sec) in the velocity; and an uncertainty of 0.12g (2 percent of the instrument range) in the instrument measurement. The drag coefficient of the decelerator varied from about 1.45 at M = 1.25 to 0.67 at M = 4.2.
A comparison of the drag-coefficient variation with Mach number with that of other similar ballute decelerators (ref. 6), tested in free flight and in the wind tunnel, is shown in figure 15. The two 5-foot-diameter (1.52-m) decelerators were tested in the wake of a cone-cylinder-flare-cylinder; the 22-inch-diameter (55.9-cm) decelerator, behind a blunted ogive; the 7.5-inch-diameter (19.1-cm) model, behind a cone-flare; and the 8-inch-diameter (20.3-cm) model, behind a cone-cylinder. The 5-foot-diameter (1.52-m) decelerator without a separation fence did not fully inflate. This fact could account for the low drag coefficient near M = 2.7. Otherwise, with the exception of the points near M = 1.2, the present data show good agreement with other flight-test and wind- tunnel data for M < 3.9. Reasons for the different trends of the present data and the data for the small-scale models tested in the wind tunnel for M > 3.9 a r e not apparent.
CONCLUDING REMARKS
Inflation, drag, and stability characteristics of a 40-inch-diameter (101.6-cm) inflatable ballute decelerator with a 10-percent burble fence were obtained in free flight. The decelerator was deployed at an altitude of 115 000 feet (35.1 km) at a velocity of
10

4400 ft/sec (1342 m/sec) and was fully inflated at a Mach number M of 4.2 and a free- stream dynamic pressure of 163 lb/ft2 (7.8 kN/m2). The inflation time was 0.42 second.
The decelerator appeared to have excellent stability characteristics in pitch and yaw during and after inflation. Shock loads during inflation were of the same magnitude as the average value of the drag after inflation. The roll rates of the payload and decel- erator increased from a minimum of about 2.6 radians/sec just prior to inflation to a maximum of about 6.8 radians/sec for the decelerator and about 5.8 radians/sec for the payload. Below M = 3.9, with the exception of M = 1.2, the drag-coefficient variation with Mach number compared favorably with other free-flight and wind-tunnel test results on similar ballutes. The drag coefficient of the decelerator varied from about 1.45 at M = 1.25 to 0.67 at M = 4.2.
Langley Research Center, National Aeronautics and Space Administration,
Langley Station, Hampton, Va., November 15, 1968, 124-07-03-05-23.
11
REFERENCES
1. Connors, James F.; and Lovell, J. Calvin: Some Observations on Supersonic Stabili- zation and Deceleration Devices. Paper no. 60-19, Inst. Aeronaut. Sci., Jan. 1960.
2. Maynard, Julian D.: Aerodynamics of Decelerators at Supersonic Speeds. Proceedings of the Recovery of Space Vehicles Symposium. Inst. Aeronaut. Sci., Aug. - Sept. 1960, pp. 48-54.
3. Maynard, Julian D.: Aerodynamic Characteristics of Parachutes at Mach Numbers From 1.6 to 3. NASA TN D-752, 1961.
4. McShera, John T., Jr.: Aerodynamic Drag and Stability Characteristics of Towed Inflatable Decelerators at Supersonic Speeds. NASA TN D-1601, 1963.
5. Deitering, J. S.: Performance of Flexible Aerodynamic Decelerators at Mach Num- bers From 1.5 to 6. AEDC-TDR-63-119, U.S. Air Force, July 1963.
6. Alexander, William C.; and Lau, Richard A.: State-of-the-Art Study for High-Speed Deceleration and Stabilization Devices. GER-12616 (NASA CR-66141), Goodyear Aerosp. Corp., Sept. 10, 1966.
7. Houtz, N. E.: Optimization of Inflatable Drag Devices by Isotensoid Design. AIAA Paper No. 64-437, June-July 1964.
8. McShera, John T.; and Keys, J. Wayne: Wind-Tunnel Investigation of a Balloon as a Towed Decelerator at Mach Numbers From 1.47 to 2.50. NASA TN D-919, 1961.
9. Swalley, Frank E.: Measurement of Flow Angularity at Supersonic and Hypersonic Speeds With the Use of a Conical Probe. NASA TN D-959, 1961.
10. Coltrane, Lucille C.: An Investigation To Determine the Stability Characteristics of Three Supersonic-Impact Ballistic Reentry Shapes at Mach Numbers From 1.2 to 4.2. NASA TM X-735, 1962.
11. Jorgenson, Leland H.; Spahr, J. Richard; and Hill, William A., Jr.: Comparison of the Effectiveness of Flares With That of Fins for Stabilizing Low-Fineness-Ratio Bodies at Mach Numbers From 0.6 to 5.8. NASA TM X-653, 1962.
12. Anon.: Handbook of Supersonic Aerodynamics. Section 8 - Bodies of Revolution. NAVWEPS Rept. 1488 (Vol. 3), U.S. Govt. Printing Office, Oct. 1961.
12

S l e e v e s t r a p
Nylon s l e e v e
r M e i n r i s e r l i n e
\ L M a i n r i s e r l i n e
h u b b e r l i n e s
t L d " , 3 : : % , - * " h i Figure 1.- Sketch of the fl ight-test configuration. Dimensions are in inches (centimeters). (Sketch is not to scale.)

Burble fence
Towline attachment rin
Flgure 2.- Sketch of ballute decelerator. Dimensions are in inches (centimeters). (Sketch Is not to scale,)

k X i ~1.50 (3.81) LL D=O.5O Hole (one hole per gore)
(1.27)
Gore pattern dimensions
X
60 .OO( 152 -40) 63 .OO( 160.02 ) 66.00(167.64) 68.88( 174.96
Burble-f ence pattern dimensions X Y
Figure 3.- Decelerator gore and burble-fence pattern dimensions. Dimensions are in inches (centimeters). (Sketches are not to scale.)

Sta. 0.00 I
18.50 (46.99)
I Camera Telemeter deck 7
view 51')
Telemeter antenna LTensiometer
Figure 4.- Sketch of payload. Dimensions are in inches (centimeters) and degrees. (Sketch i s not to scale.)

V
r\
z
Figure 5.- Body-axis-system orientation.
17

l o t
140
ol
160
Horizontal range, f t
I I I I I I I I I I I I I I 0 10 20 30 40 50 60 70 80 9'0 100 110 120 130
Horizontal range, Ian
Figure 6.- Variation of altitude with horizontal range of the payload.

.to
104
103 N
E "-z ; H :>
'" '" '" H 0.
.~ 102 '" .c 0.
'" 0 E +' «
101
100
- -_._-" -~--' - - ---.--- -_._. -- ---'~-
103 WJllllU IEB -llj I ~H ~llitllj~ III ~ ~ ; ;%>7\ JaM lUIUillll1IlJHU IJ$J&jUJJ u blllllllill t1111J I LlllIj
N +' ... "-;: 101 ; H :>
'" '" '" H 0.
u ." H
'" .c 0.
'" $ 100 «
10-211 11111111 1111111111 1111111111 111111111111111111111111111111 111 11 11111111111111111111111111111 111 1.11111111111 1 w ~ ~ 00 ~ ~ ~ ~ ~ ~ ~ ~ ~x~
Altitude , ft
I I
10 20 30 40 50 60 70 80 Altitude , km
(al Pressure.
Figure 7.- Variation of pressure. density. and speed of sound with altitude .
t\:> o
10-1
~ ~ ;. 10-2
-+' .... '" c:
" "0
-+' .... ';;; '" " -< '"
H ....
" ... .c " 0. .c '" 0. o '"
Statistical
Measured
.~ lU
~ ,,-3 ~,,~ . 11111111111111111111.1111111111111111111111111111 11111111111111111111111111
10...l.t
10-71 1111 11111 11 11111 11111 11111 11111 11111 11111 11111 11111 11111 11111 11111 11111 111 I1 11111 11111 11111 11111 11111 Im_ ~ ~ ~ ~ ~ ~ ~ ~ ~ = = ~ ~x~
Attit ude , ft
10 20 30 ~ 50 60 70 80 Altitude, km
(b) Density.
Figure 7.- Continued.
~~-- --~----

2 80
240
. 200
$ 160 n
0) P
+ .d c, 2 120
80
40
920 940 960 980 1000 1020 1040 1060 1080 1100
J I I I I 280 290 300 3 10 320 330 340
Speed o f sound, f t / s e c
Speed o f sound, m/sec
(c) Speed of sound.
Figure 7.- Concluded.

a1
7(
6C
E Y .. al 3 50 + .A c, -.I
<
40
30
20
'\
'.
\
'\
'\ \ \
\ L \
. 3 150 200
Time, sec
"r 50 m I I 'rc
I I I I I I I I I I
41111 IN I I I I ' h l l l I IY I I I l l I O L n
50 100 200 2 50 300
Time, s e c
Figure 8.- Variat ion of alt i tude and velocity with time.
22

20
18
16
14
N l2
I m
10 0
P
1 8 * n
6
4
2
0
Id 400
360
320
280
P w
5 240 .. G:
: 200 B
D l
s B 160 ?
120
80
40
0,
6
5
4
2
1
0
Decelerator inflation
I I I I ‘u- ~~
I I I I I
1 100
ation
/ I
M- I I
I I J I
I. I
100
150
-r I I I
t 150
200 -%e, sec
2 50 300
7 1 I I I I
J, I I
_I 200 2 50
Time, sec
Figure 9.- Variation of dynamic pressure and Mach number with time.
23

1 4
5 2
3 6
Figure 10.- Onboard-camera photographs. L- 68- lO,034
24

I L
7
8
9
10
11
12
Figure 10.- Continued. L -68-10,035
25

13 16
14 17
,
15 18
Figure 10.- Concluded. L-68- lO,036
l 26
I
~
5 '-
4 -
ffi II
2 2 '- a u
Figure 11.- Variation of tensiometer force measurement and internal pressure coefficient with time.

4
cn
2 P
F
0
1
u)
c, .?I
Z o .. N
m
-1
1
c n 0 .. * -1
++ .-
Deployment ’ \
1-y- 60 62 64 66 68 56
I I !
70 72
i _I
!
74
Time, sec
Figure 12.- Time h is tor ies of payload rl, q, r, a,. and ay.
28

60 80 100 110 120
Time, sec
Figure 13.- Time histories of the payload and decelerator r o l l rates.

0 1
Payload
3
Y.
Estimated
~"j4' I I
2 3 4
Mach number
Figure 14.- Var ia t ion of drag coeff icient w i th Mach number for decelerator and payload.
5
30
. -. .. _.. . . . . ' % I

I
Symbol
0
0
0 A b
0
1.6
CP .)
-P c .rl 0 .rl +l lu al 0 0
0 102
: 08 (-I a
04
Decelerator conf igurat ion
Present
5-ft-diam(lo52-m) ADDPEP
5 -f t -d i am ( 1 52 -m) ADD PEP
22-in. -diarn(.55,9-cm> ALARR
7 .~ - in0-d iam( l9 .1 -cm~ f a b r i c
8-iao-diam(20.3-cm) f a b r i c
Fence he ight , percent
10
10
0
10
10
3 09
~
9 7 7 6
a 7
Type tes t
Free f l i g h t
Free f l i g h t
Free f l i g h t
Wind tunnel
Wind tunnel
Wind tunnel
0 1 2 3 4 5 6
Mach number
Figure 15.- Variation of drag coefficient aith Mach number for several ballute decelerators.
31

i c
A motion-picture film supplement L-1002 is available on loan. Requests will be filled in the order received. You will be notified of the approximate date scheduled.
The film (16 mm, 1 min, color, silent) shows deployment and inflation of the decelerator and the decelerator after inflation.
Requests for the film should be addressed to:
NASA Langley Research Center Att: Langley Station Hampton, Va. 23365
Photographic Branch, Mail Stop 171
- I
I
I
I
I
I
I
I
I
I
I
I
I
I
I
I
I
I
I
Date
Please send, on loan, copy of film supplement L-1002 to TN D-4943.
~~~
Name of organization
. _ _ _ Street number
-
City and State Zip code Attention: Mr .
Title -
$ - 3 2 i
~

NATIONAL AERONAUTICS AND SPACE ADMINISTRATION WASHINGTON, D. C. 20546
OFFICIAL BUSINESS FIRST CLASS MAIL
POSTAGE A N D FEES PAID NATIONAL AERONAUTICS A N D
SPACE ADMINISTRATION
POSTMASTER: If Undeliverable (Section 158 Postal Manual ) Do Not Return
“Tha aeronautical and space activities of the United States shall be condmted so as t o contribate , . , to the expansioiz of hzrman knowl- edge of phenomena in the atmosphere and space. T h e Adniinistration shall provide for the widest practicable and appropriate dissenzination of information concerning i ts activities and the 1.eS24h thereof.’’
. -NATIONAL AERONAUTICS AND SPACE ACT OF 1958
NASA SCIENTIFIC AND TECHNICAL PUBLICATIONS
TECHNICAL REPORTS: Scientific and technical information considered important, complete, and a lasting contribution to existing ,
TECHNICAL TRANSLATIONS: Information published in a foreign language considered to merit NASA distribution in English. . .
SPECIAL PUBLICATIONS: Information knowledge. *~
TECHNICAL NOTES: Information less broad in scope but nevertheless of importance as a contribution to existing knowledge.
TECHNICAL MEMORANDUMS : Informatian receiving limited distribution because of preliminary data, security classifica- tion, or other reasons.
CONTRACTOR REPORTS: Scientific and technical information generated under a NASA contract or grant and considered an important contribution to existing knowledge.
derived from or of value to NASA activities. Publications include conference proceedings, monographs, data compilations, handbooks, sourcebooks, and special bibliographies.
TECHNOLOGY UTILIZATION PUBLICATIONS: Information on technology used by NASA that may be of particular interest in commercial and other non-aerospace applications. Publications include Tech Briefs, ~~~~~~~l~~~ Utilization Reports and N ~ ~ ~ ~ , and Technology Surveys.
Details on the availability of these publications may be obtained from:
SCIENTIFIC AND TECHNICAL INFORMATION DIVISION
NATIONAL AERONAUTICS AND SPACE ADMINISTRATION Washington, D.C. PO546


![MULTILAYER CERAMIC CHIP CAPACITORS€¦ · Type: C1005 [0402 inch], C1608 [0603 inch], C2012 [0805 inch], C3216 [1206 inch], C3225 [1210 inch], C4520 [1808 inch], C4532 [1812 inch],](https://img.dokumen.tips/doc/110x75/5f2a18c3f073e37da14b10b6/multilayer-ceramic-chip-capacitors-type-c1005-0402-inch-c1608-0603-inch-c2012.jpg)