Embed Size (px)
Citation preview

PHD THESIS
Performance of a space-time coded multicarrier CDMA system in
frequency-selective Rayleigh channel
Submitted by
Olanrewaju Bola Wojuola
In fulfilment of the degree of
Doctor of Philosophy in Electronic Engineering at the University of KwaZulu-Natal, Durban,
South Africa
Date of submission
October 2014
Supervised by
Prof. Stanley H. Mneney
As the candidate’s supervisor, I agree to the submission of this thesis.
Signed: _____________________________
Name: ______________________________ Date: ___________________

ii
DEDICATION
Dedicated to God,
the merciful and gracious One;
and to
His Son Jesus Christ.

iii
PREFACE
The research work reported in this thesis was performed by Olanrewaju Bola Wojuola under
the supervision of Professor Stanley H. Mneney at the School of Engineering, University of
KwaZulu-Natal, Durban, South Africa. The research work was supported by German
Academic Exchange Programme (DAAD - Deutscher Akademischer Austausch Dienst), as
well as the Center of Excellence (CoE), and the Centre for Engineering Postgraduate Studies
(CEPS), both of the School of Engineering, University of KwaZulu-Natal, South Africa.
The whole thesis, unless otherwise indicated, is the author's work and has not been submitted
in part, or in whole, to any other University for degree purposes.

iv
ACKNOWLEDGEMENT
My sincere appreciation goes to my supervisor Professor S. H. Mneney for his patience,
kindness guidance, and gentle approach. He is a source of help, encouragement and
motivation.
Special thanks goes to my wife, Rosemary Nike Wojuola, for her kind support, sacrifice,
supplication, patience, forbearance and encouragement throughout the PhD period. She has
been a source of constant support and encouragement. Thank you for being always there for
me. I also thank my son, Toluwanimi, for his endurance, affection and sacrifice. Special
thanks go to Dr Aderemi Adewumi, Dr. Ilesanmi Oluwafemi and Dr Olutayo Oyerinde for
their invaluable support, suggestions and encouragement from the time of admission and at
different stages of the work. Thank you for every way you have made this PhD a reality.
I also wish to express my appreciation to my parents and siblings for their love, sacrifices,
patience, concerns and care in making me who I am today. Thank you very much for every
contribution you have made to my life. My gratitude also goes to the DLCF family in South
Africa.
I wish to express my gratitude to the German Academic Exchange Programme (DAAD -
Deutscher Akademischer Austausch Dienst), as well as the Center of Excellence (CoE), and
the Centre for Engineering Postgraduate Studies (CEPS), both of the School of Engineering,
University of KwaZulu-Natal for supporting this research work.
Thanks to all professors, lecturers and support staff of the university who offered support and
help in the course of my PhD programme.
Above all, I give praise to God for His great mercies and help concerning this PhD
programme.

v
ABSTRACT
The increasing demand for wireless services requires fast and robust broadband wireless
communication for efficient utilisation of the scarce electromagnetic spectrum. One of the
promising techniques for future wireless communication is the deployment of multi-input
multi-output (MIMO) antenna system with orthogonal frequency division multiplexing
(OFDM) coupled with multiple-access techniques. The combination of these techniques
guarantees a much more reliable and robust transmission over the hostile wireless channel.
This thesis investigates the performance of a multi-antenna space-time coded (STC) multi-
carrier code-division multiple-access (MC-CDMA) system in a frequency-selective channel
using Gold codes as spreading sequences.
Spreading codes are known to be central to the performance of spread spectrum systems,
STC MC-CDMA systems inclusive. Initial phase of this research work investigates multiple-
access performance of spreading codes for the communication system. The performance of
different sets of Gold codes for increasing number of interfering users for up to a thousand
users and eight different code lengths, ranging from 31 to 4095-chip Gold codes, were
considered. Simulation results show that odd-degree Gold codes give better bit-error-rate
performance than even-degree Gold codes. Whereas the odd-degree codes exhibited
relatively marginal loss in performance when the system was loaded, their even-degree
counterparts degraded rapidly in performance, resulting in early emergence of an error floor,
culminating in premature system saturation.
Furthermore in this thesis, software simulations were carried to investigate the performance
of a direct-sequence (DS) CDMA system in a flat-fading Rayleigh channel, and a multi-
carrier (MC) CDMA system in a frequency-selective channel using different sets of Gold.
The results showed that in a flat-fading channel, the Gold codes provide a constant coding
gain close to that obtainable in a Gaussian channel. The results also showed that the impact
of longer spreading codes was more pronounced for the MC-CDMA system in a frequency-
selective channel as indicated by significant lowering of error floors. Also, frequency
diversity associated with the use of longer codes coupled with multi-carrier modulation
makes the MC-CDMA system resilient to multi-path effects.

vi
Further still, this thesis investigated the performance of a space-time block-coded (STBC)
CDMA system in a flat-fading channel. Results showed that at low signal-to-noise ratio, the
coding gain provided by the codes surpasses the diversity advantage provided by the use of
the multiple antennas. The results also showed that coding gain between no-diversity link
and its Gold-coded counterpart is the same as that between the transmit-diversity link and its
Gold–coded counterpart. The independence of the diversity advantage provided by multiple
transmit antennas and the coding gain obtainable from the use of the spreading sequences
enables the prediction of the performance of composite space-time block-coded CDMA
systems.
Performance of a STBC OFDM system as well as a STBC MC-CDMA system in frequency-
selective channel was also investigated. Results showed that the combination of diversity
gain from the use of multiple antennas, coupled with coding gain provided by the Gold codes
of the CDMA system, plus the diversity gain resulting from frequency diversity of multi-
carrier transmission and the spectrum-spreading by the CDMA makes the composite STBC
MC-CDMA system resilient to channel fading. This fact is particularly the case for long
codes. For example, with reference to the OFDM transmission, the results showed that a
511-chip Gold-coded STC MC-CDMA system provided a factor of about 3,786 reduction in
error floor.

vii
TABLE OF CONTENTS
PhD Thesis............................................................................................................................................................... i
Dedication............................................................................................................................................................... ii
Preface ................................................................................................................................................................... iii
Acknowledgement ................................................................................................................................................. iv
Abstract................................................................................................................................................................... v
Table of Contents.................................................................................................................................................. vii
Table of Figures ...................................................................................................................................................... x
List of Tables ........................................................................................................................................................ xii
List of Abbreviations ........................................................................................................................................... xiii
1 General Introduction ..................................................................................................................................... 1
1.0 Background ........................................................................................................................................... 1
1.1 Multiple access techniques .................................................................................................................... 2
1.1.1 Time Division Multiple Access ........................................................................................................ 2
1.1.2 Frequency-division multiple-access .................................................................................................. 2
1.1.3 Code-division multiple-access .......................................................................................................... 3
1.2 Problem definition & Research motivation ........................................................................................... 3
1.3 Aims & Objectives ................................................................................................................................ 4
1.4 Original contribution ............................................................................................................................. 5
1.5 Organisation .......................................................................................................................................... 6
2 The Evolution of CDMA ............................................................................................................................... 8
2.0 Introduction ........................................................................................................................................... 8
2.1 History and significance of CDMA....................................................................................................... 8
2.2 Code Division Multiple Access ............................................................................................................. 9
2.3 Spread spectrum codes ........................................................................................................................ 11
2.4 Orthogonal Frequency Division Multiplexing .................................................................................... 12
2.5 Multicarrier CDMA ............................................................................................................................ 13
2.6 MC-CDMA in the indoor channel ...................................................................................................... 16
2.7 Space-Time Coding ............................................................................................................................. 17
2.8 Space-time coded MC-CDMA system ................................................................................................ 17
2.9 Chapter summary ................................................................................................................................ 19
3 Correlation properties of m-sequences and Gold codes ............................................................................... 20
3.0 Introduction ......................................................................................................................................... 20
3.1 Spread spectrum codes ........................................................................................................................ 20
3.2 Generation of the PN codes ................................................................................................................. 22
3.3 Experimentation on the correlation properties of the codes ................................................................ 23

viii
3.4 Generation of longer codes ................................................................................................................. 32
3.5 Signal transmission through a noiseless channel................................................................................. 39
3.6 Signal transmission through a noisy channel ...................................................................................... 39
3.7 Chapter summary ................................................................................................................................ 44
4 Multiple-access performance of Gold codes in a DS-CDMA system .......................................................... 45
4.0 Introduction ......................................................................................................................................... 45
4.1 System model ...................................................................................................................................... 46
4.2 Software simulations ........................................................................................................................... 48
4.3 Performance of odd-degree Gold codes .............................................................................................. 48
4.3.1 Performance for a single user ......................................................................................................... 49
4.3.2 Performance for two to five users ................................................................................................... 49
4.3.3 Performance for higher number of users ......................................................................................... 50
4.3.4 Observations ................................................................................................................................... 55
4.4 Performance of even- versus odd-degree codes .................................................................................. 60
4.4.1 Performance for a single user ......................................................................................................... 60
4.4.2 Performance for a few multiple users ............................................................................................. 60
4.4.3 Performance for higher number of users ........................................................................................ 66
4.4.4 Deductions ...................................................................................................................................... 69
4.5 Loading characteristics of even-degree Gold codes ........................................................................... 71
4.5.1 Performance of degree-6 Gold codes ........................................................................................... 71
4.5.2 Performance of degree-8 Gold codes ............................................................................................ 71
4.5.3 Performance of degree-10 Gold codes ........................................................................................... 71
4.6 Loading characteristics of odd-degree Gold codes ............................................................................. 73
4.6.1 Performance of degree-5 Gold codes ............................................................................................ 73
4.6.2 Performance of degree-7 and degree-9 Gold codes ........................................................................ 74
4.7 Chapter summary ................................................................................................................................ 76
5 Performance of a multicarrier CDMA system ............................................................................................. 77
5.0 Introduction ......................................................................................................................................... 77
5.1 Channel fading .................................................................................................................................... 77
5.2 Fading models ..................................................................................................................................... 79
5.3 Diversity Techniques .......................................................................................................................... 80
5.4 Multicarrier CDMA ............................................................................................................................ 81
5.5 Simulations results and discussion ...................................................................................................... 82
5.5.1 Performance in a flat-fading channel .............................................................................................. 82
5.5.2 Performance in a frequency-selective channel ................................................................................ 87
5.6 Chapter Summary ............................................................................................................................... 91
6 Space-time Coded Multi-carrier CDMA System ......................................................................................... 92
6.0 Introduction ......................................................................................................................................... 92

ix
6.1 MIMO systems .................................................................................................................................... 93
6.2 MIMO channel model ......................................................................................................................... 94
6.3 MIMO channel capacity ...................................................................................................................... 96
6.4 Spatial diversity ................................................................................................................................... 97
6.5 Space-time coding ............................................................................................................................... 97
6.6 Space-time coded MC-CDMA system ................................................................................................ 99
6.7 System model .................................................................................................................................... 100
6.7.1 CDMA without transmit diversity ................................................................................................ 101
6.7.2 Space-time coded CDMA system ................................................................................................. 102
6.7.3 Space-time coded CDMA system with transmit and receive diversity ......................................... 103
6.7.4 Space-time coded multi-carrier CDMA system ............................................................................ 104
6.8 Simulation results and discussion ..................................................................................................... 105
6.8.1 Transmit versus receive diversity ................................................................................................. 105
6.8.2 Space-time block-coded versus CDMA system ............................................................................ 107
6.8.3 Space-time block-coded CDMA system ....................................................................................... 108
6.8.4 Performance in a frequency-selective channel .............................................................................. 112
6.8.5 Space-time coded OFDM system ................................................................................................. 112
6.8.6 Space-time coded MC-CDMA system ......................................................................................... 114
6.9 Chapter summary .............................................................................................................................. 119
7 Conclusion and Future Work ..................................................................................................................... 121
7.0 Introduction ....................................................................................................................................... 121
7.1 Thesis summary ................................................................................................................................ 121
7.2 Future work ....................................................................................................................................... 124
References .......................................................................................................................................................... 126

x
TABLE OF FIGURES
Fig. 1.1. Frame and time slot structure of TDMA ................................................................................................. 2 Fig. 2.1 Digital Direct-Sequence CDMA transmitter and receiver ...................................................................... 10 Fig. 2.2 An OFDM transmitter and receiver ........................................................................................................ 12 Fig. 2.3 Principles of operation of a multicarrier CDMA system showing the (a) transmitter, and (b) receiver.14 Fig. 2.4 Multi-user MC-CDMA system. .............................................................................................................. 15 Fig. 2.5. (a) Uplink and (b) downlink signal transmission. ................................................................................. 16 Fig. 2.6 A space-time coded multicarrier CDMA system .................................................................................... 18 Fig. 3.1 (a) Autocorrelation of three m-sequences. ............................................................................................... 25 Fig. 3.2 (a) Graphs of autocorrelation of other 31-chip m-sequences .................................................................. 27 Fig. 3.3 (a) Graphs of autocorrelation of some other 31-chip m-sequences ........................................................ 29 Fig. 3.4. Graph of (a) autocorrelation for a 31-chip Gold code (b) cross-correlation function for two Gold codes.
.............................................................................................................................................................................. 31 Fig. 3.5. Graphs of autocorrelation and cross-correlation of 127-chip m-sequences .......................................... 33 Fig. 3.6. Graphs of autocorrelation and cross-correlation of 511-chip m-sequences .......................................... 35 Fig. 3.7 Graphs of autocorrelation and cross-correlation of 2047-chip m-sequences .......................................... 37 Fig. 3.8. Signal transmission through a noiseless channel ................................................................................... 39 Fig. 3.9. Baseband CDMA model showing signal transmission through a noisy channel................................... 40 Fig. 3.10. Scatter plots for signal transmission through a noisy Gaussian channel at an SNR of 10 dB for (a) 4-
bit (b) 6-bit (c) 8-bit and 10-bit data. .................................................................................................................... 42 Fig. 3.11. Scatter plots for a 100-bit data transmitted through the noisy Gaussian channel at an SNR of (a) 20
dB (b) 10 dB (c) 0 dB (d) -10 dB and (e) -20 dB. ................................................................................................ 43 Fig. 4.1. Model of a multi-user DS-CDMA system ............................................................................................. 46 Fig. 4.2. Bit-error-rate for a single user ............................................................................................................... 50 Fig. 4.3. Bit-error-rate for two users .................................................................................................................... 51 Fig. 4.4 Bit-error-rate for three users ................................................................................................................... 51 Fig. 4.5 Bit-error-rate for five users. .................................................................................................................... 52 Fig. 4.6 Bit-error-rate for ten users .................................................................................................................... 52 Fig. 4.7 Bit-error rate for 15 users. ...................................................................................................................... 53 Fig. 4.8. Bit-error-rate for 20 users ...................................................................................................................... 53 Fig. 4.9 Bit-error-rate for 25 users ...................................................................................................................... 54 Fig. 4.10. Bit-error-rate for 30 users .................................................................................................................... 54 Fig. 4.11 Bit-error-rate for 33 users .................................................................................................................... 55 Fig. 4.12. Samples of results showing inferior performance of some other sets of Gold codes. ......................... 58 Fig. 4.13 Other samples of results showing inferior performance of some other sets of Gold codes. ................ 59 Fig. 4.14. Performance for a single user .............................................................................................................. 60 Fig. 4.15. Bit-error-rate for two users .................................................................................................................. 61 Fig. 4.16. Bit-error-rate for three users ................................................................................................................ 62 Fig. 4.17. Bit-error-rate for four users ................................................................................................................. 62 Fig. 4.18 Bit-error-rate for five users .................................................................................................................. 63 Fig. 4.19 Bit-error-rate for six users ................................................................................................................... 64 Fig. 4.20 Bit-error-rate for seven users ............................................................................................................... 64 Fig. 4.21 Bit-error-rate for eight users ................................................................................................................ 65 Fig. 4.22 Bit-error-rate for nine users .................................................................................................................. 65 Fig. 4.23. Bit-error rate for 10 users .................................................................................................................... 66 Fig. 4.24. Bit-error rate for 15 users .................................................................................................................... 67 Fig. 4.25. Bit-error rate for 20 users .................................................................................................................... 67 Fig. 4.26. Bit-error rate for 25 users .................................................................................................................... 68 Fig. 4.27. Bit-error rate for 30 users .................................................................................................................... 68

xi
Fig. 4.28 Bit-error rate for 31 users. .................................................................................................................... 69 Fig. 4.29. Performance of degree-6 Gold codes .................................................................................................. 72 Fig. 4.30 Performance of degree-8 Gold codes ................................................................................................... 72 Fig. 4.31 Performance of degree-10 Gold codes ................................................................................................. 73 Fig. 4.32 Performance of degree-5 Gold codes ................................................................................................... 74 Fig. 4.33 Performance of degree-7 Gold codes ................................................................................................... 75 Fig. 4.34 Performance of degree-9 Gold codes ................................................................................................... 75 Fig. 5.1 Performance for a single user in a flat-fading channel ........................................................................... 83 Fig. 5.2. Performance for two users in a flat-fading channel ............................................................................... 84 Fig. 5.3 . Performance in a flat-fading channel for (a) three and (b) four users................................................... 85 Fig. 5.4. Performance in a flat-fading channel for (a) five and (b) six users. ...................................................... 86 Fig. 5.5 Performance of a multicarrier CDMA system in a frequency-selective channel for a single user ......... 88 Fig. 5.6 Performance of a multicarrier CDMA system in a frequency-selective channel in the presence of an
interfering user ...................................................................................................................................................... 89 Fig. 5.7 Performance in a frequency-selective channel for (a) four and (b) five users. ....................................... 90 Fig. 6.1. A MIMO system ................................................................................................................................... 93 Fig. 6.2. MIMO system with nT transmit and nR receive antennas ...................................................................... 95 Fig. 6.3 Space-time coded MC-CDMA system. .................................................................................................. 99 Fig. 6.4 A space-time coded MC-CDMA system .............................................................................................. 100 Fig. 6.5 Transmit versus receive diversity for BPSK modulation ..................................................................... 106 Fig. 6.6 Transmit versus receive diversity for QPSK modulation ..................................................................... 107 Fig. 6.7 Performance of a Gold coded CDMA system versus STBC ................................................................ 108 Fig. 6.8 Performance of a STBC-CDMA system using a 31-chip Gold code as spreading sequence. .............. 109 Fig. 6.9 Performance of a STBC-CDMA system for a 127-chip Gold code ..................................................... 110 Fig. 6.10 Performance of a STBC-CDMA system for a 511-chip Gold code ................................................... 111 Fig. 6.11 Performance of a STBC-CDMA system for a 2047-chip Gold code ................................................. 111 Fig. 6.12 Performance of a space-time coded OFDM system in a four-path frequency selective Rayleigh
channel. ............................................................................................................................................................... 113 Fig. 6.13 Data tips showing the level of error floor for no-diversity and transmit-diversity transmission for the
OFDM system. ................................................................................................................................................... 114 Fig. 6.14 Performance of a space-time coded MC-CDMA system for a 31-chip Gold code ............................ 115 Fig. 6.15 Data tips showing data points for evaluating the performance of the MC-CDMA system for a 31-chip
Gold code............................................................................................................................................................ 115 Fig. 6.16 Performance of a space-time coded MC-CDMA system for a 127-chip Gold code .......................... 117 Fig. 6.17 Performance of a space-time coded MC-CDMA system for a 511-chip Gold code .......................... 118 Fig. 6.18 Performance of a space-time coded MC-CDMA system for a 2047-chip Gold code ........................ 119
xii
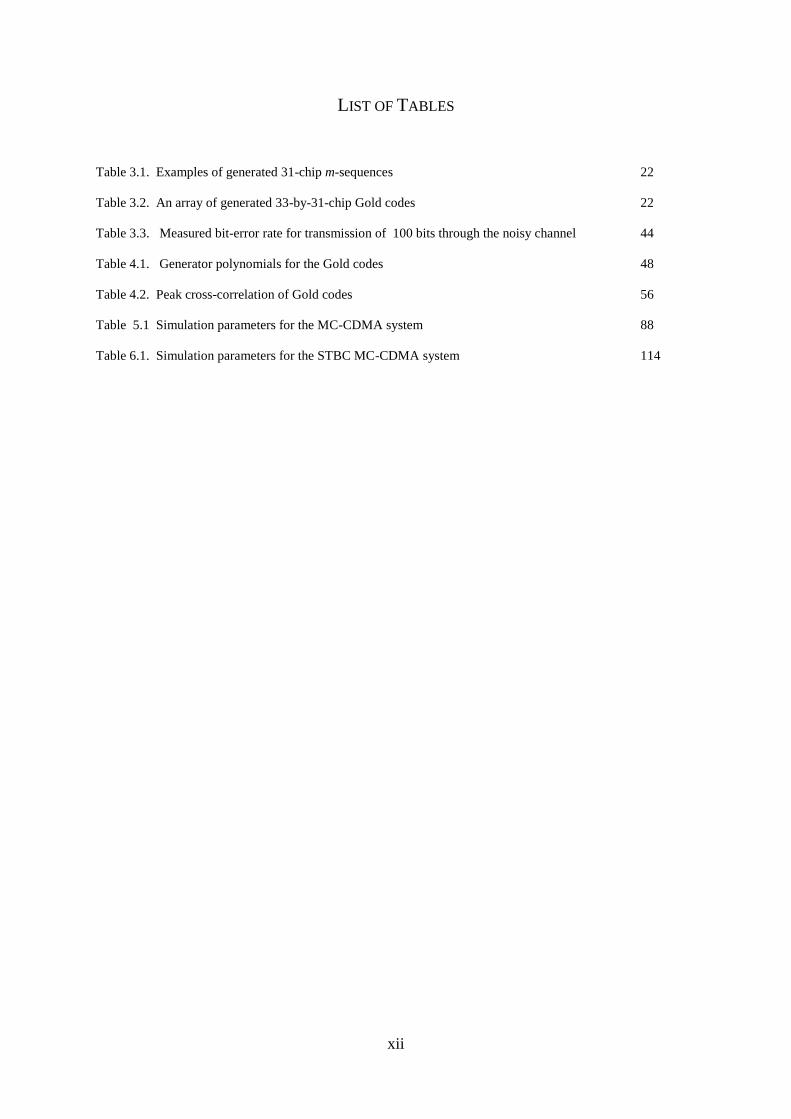
LIST OF TABLES
Table 3.1. Examples of generated 31-chip m-sequences 22
Table 3.2. An array of generated 33-by-31-chip Gold codes 22
Table 3.3. Measured bit-error rate for transmission of 100 bits through the noisy channel 44
Table 4.1. Generator polynomials for the Gold codes 48
Table 4.2. Peak cross-correlation of Gold codes 56
Table 5.1 Simulation parameters for the MC-CDMA system 88
Table 6.1. Simulation parameters for the STBC MC-CDMA system 114

xiii
LIST OF ABBREVIATIONS
BER - Bit-Error Rate
BPSK - Binary Phase Shift Keying
CDMA -Code-Division Multiple-Access
DS - Direct-Sequence
DS-CDMA - Direct Sequence CDMA
FDM - Frequency Division Multiplexing
FDMA -Frequency-Division Multiple-Access
FFT - Fast Fourier Transform
FH-CDMA - Frequency-Hopping CDMA
GPS - Global Positioning System
IFFT - Inverse Fast Fourier Transform
ISI - Inter-Symbol Interference
LFSR - Linear Feedback Shift Register
LOS - Line-of-Sight
MAI - Multiple-Access Interference
MC - Multi-carrier
MC-CDMA - Multicarrier CDMA
MIMO -Multiple-Input Multiple-Output
MT-CDMA - Multi-Tone CDMA
OFDM - Orthogonal Frequency-Division Multiplexing

xiv
PN - Pseudo-noise (PN)
PRN - Pseudo-Random Noise (PRN)
QPSK - Quadrature Phase Shift Keying
SOSTTC -Super-Orthogonal STTC
SSMA - Spread-Spectrum Multiple Access
STBC - Space-Time Block Code
STC - Space-Time Coding
STTC - Space-Time Trellis Code
TDMA - Time-Division Multiple-Access
TH-CDMA - Time-Hopping CDMA
WCDMA - Wideband CDMA

1
Chapter 1
1 General Introduction
1.0 Background
Telecommunications in the current information age is increasingly relying on the wireless
link. It is doubtless to say that wireless communication is one of the fastest-growing aspects
of modern technology. This is particularly applicable to mobile communication. Wireless
communication has made possible a variety of services ranging from voice to data, and now
multimedia [1]. Consequently, demand for new wireless capacity is growing rapidly.
Nevertheless, wireless communication system is constantly faced with diverse challenges.
One of these has to do with numerous users having to share a common channel. Another
challenge is the sparsely available radio frequency spectrum. Added to these is the hostile
nature of the wireless propagation channel, coupled with the increasing demand for higher
data rates and better quality of service.
This chapter gives a brief treatment of common access methods and evolving techniques for
mitigating factors militating against the performance of mobile communication systems,
more precisely the code-division multiple-access (CDMA), leading to an itemization of
research objectives.
The rest of this chapter is organised as follows. Common access techniques are considered in
Section 1.1. The research problem is described in Section 1.2, followed by aims and
objectives in Section 1.3. Section 1.4 provides a summary of original contributions, with a
list of published works resulting from this research. Organisation of the rest of this thesis is
given in Section 1.5.

2
1.1 Multiple access techniques
Wireless communication often involves numerous users having to share a common channel,
which might result in some conflicts among several users wanting to transmit at the same
time. This calls for some form of multiple-access techniques in order to resolve the conflicts
among users. In what follows, we shall be considering basic access techniques [2] in use
today.
1.1.1 Time Division Multiple Access
One of the common access techniques is time-division multiple-access (TDMA), which
involves the use of time slots. The time axis is divided into frames of time slots having
certain duration, Fig. 1.1. Each time slot is allocated to a different user. During this time
slot, the user has the whole channel bandwidth at his disposal. Time slots are separated by
guard times in which transmission by a user is prohibited.
Fig. 1.1. Frame and time slot structure of TDMA
A user generating much less traffic wastes a lot of capacity, although a more generalized
TDMA that allows a user to be assigned more than one time slot per frame, and also allows
for time slots within a frame to be of different duration could minimise the waste. Despite
the capacity-wasting property, TDMA is used today because of its relative simplicity.
Another problem with TDMA is that of achieving necessary synchronization for each user to
know when and how long the user can transmit.
1.1.2 Frequency-division multiple-access
Another common access technique is frequency-division multiple-access (FDMA). In
FDMA, bandwidth of a common channel is divided into frequency bands, with guard bands

3
in-between to achieve a separation between adjacent bands. Each user is assigned a
particular frequency band for his own private use. Thus with FDMA, a user can be part of a
transmission channel all the time.
FDMA has the same capacity-wasting property as TDMA, because if a user has nothing to
transmit, his frequency band cannot be taken over by another user. However, it has an
advantage over TDMA because no synchronization of the users is necessary.
1.1.3 Code-division multiple-access
Code-division multiple-access (CDMA) is another important access technique which relies
on coding to achieve its multiple-access property. It brands each user by assigning each one
with a unique code. Each user is assigned a unique code sequence that is used to encode the
information-bearing signal. The receiver, knowing the code sequence of the user, decodes
the received signal after reception to recover the original data.
The encoding enlarges (spreads) the spectrum of the signal and is therefore also known as
spread-spectrum (SS) modulation. The resulting encoded signal is also called spread-
spectrum signal, and CDMA is often denoted as spread-spectrum multiple access (SSMA).
CDMA is an important communication technique today not only in mobile telephony but also
in satellite navigation.
This thesis focuses on CDMA access technology due to its robustness to fading, and will
invoke multi-carrier modulation to obtain some frequency diversity, and the use of multiple-
antennas and space-time coding which provides space diversity and coding gain.
1.2 Problem definition & Research motivation
The performance of a CDMA system depends greatly on the properties of the code sequences
used for the system. The type of code set bounds on the capability of the system, which can
be changed only by changing the code. In line with this, earlier aspects of this thesis
investigate the performance of certain spreading sequences in multi-user CDMA systems, to
give new insights on the performance of the codes. We investigate the multiple-access
performance of even- and odd-degree Gold codes, which to the best of our knowledge has not
been reported in literature previously.

4
The limited radio frequency spectrum, the harsh mobile environment, and the ever-
increasing demand for wireless applications calls for advanced techniques for combatting the
hostile environmental factors and for more efficient use of the scarce radio spectrum. Among
others, multicarrier modulation and the use of multiple-antennas have emerged as promising
techniques for combatting certain problems associated with the hostile properties of the
wireless channel. The combination of these two techniques with CDMA is a promising
solution to high-speed future wireless communication systems. In consonance with this, this
thesis models the performance of a multiple-input multiple-output (MIMO) space-time-coded
(STC) orthogonal frequency-division multiplexing (OFDM) CDMA system in a fading
channel. The motivation for investigating STC OFDM-CDMA system is because of the
robustness of OFDM-CDMA against channel fading [3], and STC in harnessing diversity
and coding gain for improved system performance [4]. OFDM converts a frequency-
selective channel to a flat-fading channel [5-7]. Furthermore, the combination of OFDM and
CDMA lowers the symbol rate in each subcarrier, the advantage being that a longer symbol
duration makes it easier to quasi-synchronise the transmission, and also enables the use of a
guard interval which helps in eliminating inter-symbol interference (ISI) [3, 4, 8-10].
Significant amount of work has been done on space-time-coded MC-CDMA systems, but
most of existing works involve the use of Walsh-Hadamard codes as spreading sequences
[11-62]. Only a few reported works [63-66] involving the performance of Gold codes in such
systems have been found, and we seek to add to this small collection. In this thesis, we
investigate the performance of a series of Gold codes in a space-time coded CDMA system.
1.3 Aims & Objectives
This thesis aims at developing theoretical model(s) for predicting the performance of a space-
time coded OFDM-CDMA communication system. Objectives of this thesis are:
To study the characteristics of spreading sequences and to select an appropriate one
for the system;
To investigate multiple-access performance of Gold codes in multi-user CDMA
systems;
To model the performance of multi-user CDMA system in a flat-fading channel;

5
To model the performance of multi-user, OFDM-CDMA systems in frequency-
selective channel;
To study and model the performance of a space-time coded OFDM-CDMA system in
a fading channel.
1.4 Original contribution
Implementation of any CDMA-based system is impossible without the availability of spread-
spectrum codes. Therefore among other things in this thesis, spreading sequences were
generated and tested for use in the communication system. Different sets of Gold codes were
obtained from appropriate combination of preferred pairs of m-sequences, using linear
feedback shift registers. Software simulations on correlation properties of the codes were
carried out towards to development of the proposed communication system. The codes were
further validated by using them for signal transmission through a noisy channel.
This thesis also investigated multiple-access performance of even- and odd-degree Gold
codes in a multi-user spread-spectrum system for different sets of Gold codes, ranging from
31-chip to 4095-chip Gold codes, from light to heavy system loading, involving up to about a
thousand simultaneous users. This outcome of the work produced new insights on multiple-
access performance of the codes.
Furthermore in this thesis, software simulations were carried to investigate the performance
of a direct-sequence (DS) CDMA system in a Gaussian and flat-fading Rayleigh channels.
Beginning with this model, multicarrier transmission was then introduced for the realisation
of a multi-carrier (MC) CDMA system. The performance of the MC-CDMA system in a
frequency-selective channel was modelled. The influence of code length on the system
performance was investigated for a given number of tones and data rate for uncoded as well
as coded data transmission.
Further still, by invoking the use of multiple antennas and space-time coding, this thesis
models the performance of a space-time block coded (STBC) MC-CDMA system in a fading
channel, and examines the relative effects or contributions of the system components on
certain performance indicators such as coding gain, error floor and resilience to channel
fading.

6
The work reported in this thesis has resulted in several research papers contributing to the
field of wireless communication. These papers have either been presented at an international
conference, accepted or submitted for publication in accredited, peer-reviewed journals. The
list of papers is as follows:
Conference paper
[1] O. B. Wojuola and S. H. Mneney, "Performance of even-and odd-degree Gold codes
in a multi-user spread-spectrum system," in Wireless Communications, Vehicular
Technology, Information Theory and Aerospace & Electronic Systems (VITAE), 2014
4th International Conference, Aalborg, Denmark, 2014, pp. 1-5.
Journal papers
[2] O. B. Wojuola and S. H. Mneney, "Multiple-access interference of Gold codes in a
DS-CDMA system," SAIEE African Research Journal, vol. Volume 106, pp. 4-10,
2015.
[3] O. B. Wojuola and S. H. Mneney, "Correlation properties and multiple-access
performance of Gold codes," Iranian Journal of Sci. and Tech, Trans. of Electrical
Engineering, (submitted).
[4] O. B. Wojuola and S. H. Mneney, "The evolution of CDMA - a review," South
African Journal of Science, (submitted).
[5] O. B. Wojuola and S. H. Mneney, "Loading characteristics of Gold codes in a spread-
spectrum system," IET Journal of Communications, (submitted).
[6] O. B. Wojuola and S. H. Mneney, "Performance of a space-time coded MC-CDMA
system in a Rayleigh fading channel," IET Journal of Communications, (submitted).
[7] O. B. Wojuola, "Performance of DS-CDMA and MC-CDMA systems in Gaussian
and Rayleigh fading channels," (to be submitted).
1.5 Organisation
The rest of this thesis is organised as follows. Chapter 2 gives a brief presentation of basic
concepts as well as a review of literature on the evolution of CDMA. The treatment includes
a historical review of CDMA and its emergence over time, from the basic DS-CDMA to
multi-carrier CDMA system, as well as space-time-coded multicarrier CDMA systems.
An important element of any CDMA-based system is its spreading sequences or spreading
codes. Hence Chapter 3 deals with spreading sequences and code selection process for the

7
proposed communication system. This is followed by an account of software simulations
carried for the purpose of testing some sets of codes prior to their use in the system. Gold
codes were selected for the development of the proposed system. These codes form the focus
of the chapter that follows.
Chapter 4 investigates the performance Gold codes in a multi-user system, ranging from a
few users to hundreds of users, the outcome of which shows that odd-degree Gold codes have
better performance than their even-degree counterparts.
In Chapter 5, multicarrier transmission is introduced, for the realization of a multicarrier
CDMA system. The chapter examines the performance of a multicarrier CDMA system in a
frequency-selective Rayleigh channels, and considered the influence of code length on the
system performance for a given number of tones and data rate.
Chapter 6 invokes multiple-antenna transmission and space-time coding for the realisation of
a space-time coded multicarrier CDMA system. The performance of the space-time coded
system is modelled, the outcome of which demonstrates performance improvement resulting
from the diversity and the coding gain obtainable from the composite system.
Chapter 7 concludes the thesis with a discussion of the research outcomes and suggestion of
likely future work.

8
Chapter 2
2 The Evolution of CDMA
2.0 Introduction
The significance of code division multiple-access (CDMA) to wireless telephony and satellite
navigation cannot be overemphasized. This chapter gives an overview of the evolution of
CDMA. The treatment includes a historical review of CDMA and its emergence over time,
from the basic DS-CDMA to multi-carrier CDMA systems, as well as space-time-coded
multicarrier CDMA systems. This chapter also gives a treatment of basic principles
underlying this research work.
The rest of this chapter is organized as follows. Section 2.1 gives a brief history of CDMA.
Section 2.2 examines basic principles of operation of CDMA systems, followed by a
consideration of spread-spectrum codes in Section 2.3. Section 2.4 examines orthogonal
frequency-division multiplexing, which happens to be an important multi-carrier technique in
today’s communication systems. This naturally leads to the consideration of multi-carrier
CDMA in Section 2.5. Section 2.6 takes a further look at the multi-carrier CDMA in relation
to the indoor channel. Section 2.7 deals with space-time coding. This is an important
technique for combating the degrading effect of multi-paths propagation on wireless
channels. This is followed by a consideration of space-time-coded multi-carrier CDMA
systems in section 2.8.
2.1 History and significance of CDMA
The advent of CDMA dates back to the 1940s. It was developed originally for the military as
a means of establishing secure, jam-resistant communications [67-72]. Over the years,
however, CDMA has found its way into the larger society because of some other properties
that makes it attractive for commercial and civil use. These properties include: multiple
access capability, enhanced spectrum efficiency, frequency diversity, unity cluster size and

9
simplified frequency planning [2, 67, 68, 73-75]. Today, CDMA has become a significant
worldwide communication technique. Statistics [76] show that the number of CDMA
subscribers grew from about 7.8 million in 1997, to about 577 million in 2010. Viterbi [70]
indicated that as at 2002, over one hundred million consumers would use devices that employ
CDMA technology to provide wireless personal communication or position-location or both.
Another indication of CDMA’s level of significance is the fact that the 3G cell phone system
is based on it. Furthermore, CDMA is the mode of communication in the Global Positioning
System (GPS) [77].
2.2 Code Division Multiple Access
Code Division Multiple Access (CDMA) is a multi-access technique that relies on coding to
achieve its multi-access property. It assigns each user a unique code, and uses this code to
transform (encode) the user’s signal into a wide-band signal. The receiver, knowing the code
sequence of the user, decodes the received signal after reception to recover the original
signal. Because the encoding spreads (enlarges) the spectrum of the signal, CDMA is also
known as spread-spectrum (SS) modulation. CDMA is therefore sometimes denoted as
Spread-Spectrum Multiple Access (SSMA).
CDMA can be classified into four protocol types: Direct Sequence CDMA (DS-CDMA),
Frequency-Hopping CDMA (FH-CDMA), Time-Hopping CDMA (TH-CDMA) and hybrid
CDMA [2, 67, 73], where the last group (hybrid CDMA) is obtained from any combination
of the first three, or CDMA with any other technique.
In digital DS-CDMA, the message signal is multiplied directly by the code signal and the
resulting signal modulates a carrier (Figure 2.1a) for onward transmission through a
communication channel. The receiver (Figure 2.1b) demodulates the received signal, and
also decodes it by correlating the received signal with the code of the user. Because each
user’s unique code has low cross-correlation with the other codes, the receiver is able to
distinguish between users. Correlating the received signal with a code for a certain user de-
spreads (decodes) the signal for the user.

10
Transmitter Receiver
Fig. 2.1 Digital Direct-Sequence CDMA transmitter and receiver
In a wireless channel, due to surrounding objects like walls, buildings and mountains, many
reflections of the signal arrive at the antenna of the receiver along different paths and at
different times. Depending on the phases of the reflected signals, the reflections add up to
cause signal peaks and dips. Hence the channel can be represented by multiple paths having
a real positive gain βl, propagation delay τl and phase shift γl, where l is path index. The
channel impulse response hk(t) for the kth
user for L independent paths can be modelled as
1
( ) ( )kl
Lj
k kl kl
l
h t e t
.
(2.1)
Here it is assumed that βkl,, τkl and γkl are independent of time. However, because of motion
of people, and other time-varying environmental factors, the parameters βkl,, τkl and γkl are, in
general, randomly-varying functions of time, resulting in variation of the received signal
strength - a form of distortion termed fading. More generally, the channel impulse response
is also position-dependent, so that it may be more correctly expressed as ( , )kh t x , where x is
the position variable. By implication, the channel variables βkl,, τkl and γkl are not only time-
dependent, but also position-dependent[78].
The pseudo-noise (PN) code ck(t) for a user k can be denoted as
1
( ) ( )N
i
k k c c
i
c t c P t iT
, 1,1i
kc
(2.2)
where N is length of the code, and Pc is a rectangular pulse with a duration Tc. If bk(t) is a
binary data, spreading is accomplished by multiplying ck(t) with bk(t), after which the
resulting signal is used to modulate a carrier, say, A cos( )c kt , having an amplitude A to
give the transmitted signal

11
( ) ( ) ( )cos( )k k k c ks t Ac t b t t .
(2.3)
The multiplication of the code ck(t) with the data bits bk(t) results in bandwidth expansion.
The bandwidth expansion factor Bc (also called processing gain) is given by
bc
c
TB N
T
(2.4)
where Tb is the data rate, and N is the length of the user’s code. It is assumed that Tb/Tc = N,
so that one code sequence fits into one data bit interval.
At the receiving end, the received signal rk(t) for the user k is obtained by convolving sk(t)
with hk(t) and adding noise so that:
𝑟𝑘 = ∫ 𝑠𝑘(𝜏)ℎ𝑘(𝑡 − 𝜏)𝑑𝜏 + 𝑛(𝑡)
∞
−∞
(2. 5)
where n(t) represents the channel noise. Substituting the expressions for sk(t) and hk(t) into
this integral, and using relevant properties of the Dirac delta δ(t) gives
𝑟𝑘(𝑡) = ∑𝐴𝛽𝑘𝑙𝑒𝑗𝛾𝑘𝑙
𝐿
𝑙=1
𝑐𝑘(𝑡 − 𝜏𝑘𝑙) 𝑏𝑘(𝑡 − 𝜏𝑘𝑙) 𝑐𝑜𝑠(𝜔𝑐(𝑡 − 𝜏𝑘𝑙) − 𝜃𝑘𝑙) + 𝑛(𝑡) (2. 6)
For a linear multi-user system comprising K users, the received signal r(t) is a linear
superposition of the signals for the users, and is given by:
𝑟(𝑡) = ∑∑𝐴𝛽𝑘𝑙𝑒𝑗𝛾𝑘𝑙
𝐿
𝑙=1
𝑐𝑘(𝑡 − 𝜏𝑘𝑙) 𝑏𝑘(𝑡 − 𝜏𝑘𝑙) 𝑐𝑜𝑠(𝜔𝑐(𝑡 − 𝜏𝑘𝑙) − 𝜃𝑘𝑙) + 𝑛(𝑡) (2. 7)
𝐾
𝑘=1
In the absence of a dominant line-of-sight (LOS) signal or a strong received component, gain
𝛽𝑘𝑙 may be modeled as a Rayleigh random variable; while in the presence of a LOS signal
path, it may be modeled as a Rician random variable [4, 79].
2.3 Spread spectrum codes
CDMA codes are pseudo-random numbers, usually referred to as pseudo-noise (PN) or
pseudo-random noise (PRN) codes. The codes are also sometimes called spreading or
spread-spectrum codes. Examples of such codes include maximal linear code sequences,
Gold codes, Walsh-Hadamard codes and Kasami codes [2, 77, 80-84].

12
Spread spectrum codes are known to play a critical role in determining the performance of
spread-spectrum systems. Imperfect code properties yield poor system performance. Code
properties are known to be a cause of multiple-access interference (MAI), an important
limiting factor on the system performance. The significance of spreading codes has made the
search for better codes [80, 82, 85-94] and the mitigation of multiple-access interference [95-
105] important areas of research.
An aspect of such effort is the search for better orthogonal codes. For example in [104],
Chen Hsiao-Hwa, et. al., proposed the generation of perfectly orthogonal complementary
codes for the realisation of an interference-free CDMA system. Although orthogonality is a
desirable property, it does not in itself solve all the code-associated problems of a spread-
spectrum system. Orthogonal codes are excellent in synchronous, but not in asynchronous
environment, in which orthogonality is lost.
2.4 Orthogonal Frequency Division Multiplexing
Orthogonal Frequency Division Multiplexing (OFDM) is a multi-carrier modulation
technique whose basic principle is to split a high-rate data-stream into a number of low-rate
sub-streams that are transmitted simultaneously over a number of subcarriers [3, 5-8, 106,
107]. The following figure illustrates the principle.
Digital
modulationS/P
Pilot
Insertion IFFT
Guard
Insertion P/S
+Digital
DemodP/S
Pilot
Removal FFT
Guard
Removal S/P
channel
AWGN
w(n)
Raw
Data
Output
Data
An OFDM transmitter and reciever
X(k) x(n) x1 (n)
Y(k) y(n) y1 (n)
h(n)Receiver
Transmitter
Fig. 2.2 An OFDM transmitter and receiver
Starting from the transmitter, the raw data (binary information) is first grouped and mapped
according to some form of digital modulation scheme like the binary phase shift keying

13
(BPSK), quadrature phase shift keying (QPSK) or quadrature amplitude modulation (QAM).
The data is then converted from serial into several parallel sub-streams, typically dozens,
hundreds or even thousands. After this, pilot symbols are inserted for the purpose of channel
estimation. Inverse Fast Fourier Transform (IFFT) is then used to transform the data
sequence {X(k)} from frequency domain to give the time domain signal {x(n)}. Following
this, guard time, which is chosen to be larger than the expected delay spread, is inserted to
prevent inter-symbol interference (ISI). The guard time allows multipath components to fade
away before information is extracted from the next symbol. After inserting the guard time,
OFDM signal, which is basically the sum of the subcarrier signals, is obtained. The OFDM
signal is transmitted through the channel. The signal convolves with the channel impulse
response h(n) and also gets corrupted by noise w(n). As shown by the figure, the receiver
carries out an inverse process on the received signal in order to recover the original signal.
OFDM is based on the principle of frequency division multiplexing (FDM). It divides the
signal bandwidth into strips of narrowband sub-channels and sends the parallel data sub-
streams over the narrowband sub-channels. That is, the wideband frequency-selective
channel is divided into a number of parallel narrowband sub-channels, and each of the low-
rate data streams is transmitted by a sub-carrier over one sub-channel. As the number of sub-
channel increases, the bandwidth corresponding to each sub-channel gets narrower, and the
fading on each sub-channel can be considered approximately flat. If the bandwidth of each
sub-channel is chosen to be sufficiently smaller than the coherent bandwidth of the channel,
then each of the sub-carriers sees the channel as being flat-fading. Effectively, OFDM
converts a wideband frequency-selective channel to a flat-fading channel.
2.5 Multicarrier CDMA
Multicarrier CDMA (MC-CDMA), sometimes referred to as multi-tone CDMA (MT-
CDMA), is a hybrid CDMA system, comprising orthogonal frequency division multiplexing
(OFDM) and CDMA, and was first proposed in the nineties [9, 10, 74, 75, 108-110]. The
combination of OFDM and CDMA, as found in the MC-CDMA, provides robustness against
channel fading [3, 4, 8-10].

14
There are different implementations of MC-CDMA technique [4-7, 9, 10, 74, 75, 109-124],
but the principles of operation are the same. The following figure illustrates the basic
principles.
Fig. 2.3 Principles of operation of a multicarrier CDMA system showing the (a) transmitter, and (b) receiver.
In the transmitter, the message or data stream is first converted from serial to, say, Np parallel
symbol streams, having a symbol duration Ts. Each symbol stream is multiplied by the user
code c(t), after which the resulting signal for the pth symbol stream modulates a subcarrier fp.
The subcarriers are orthogonal on the symbol duration and are given by fp = fo+p/Ts, where fo
is RF frequency. The multicarrier signal s(t) is obtained from addition of the different
subcarrier signals. The signal s(t) is transmitted through the channel onto the receiver to give
a received signal r(t). The received signal r(t) is a convolution of s(t) and the channel
impulse response, corrupted by noise. To recover the original data, the receiver carries out
the reverse of what the transmitter does. In actual implementation, fast Fourier transform
(FFT) is normally employed for improved system efficiency.
The previous figure (Fig. 2.3) represents an MC-CDMA system for a single user. The
structure of a multi-user MC-CDMA system will now be examined, as shown by the
following figure, briefly described below.
15
To Channel
c1 (t) cos(2πf1t)
c1(t) cos(2πf2t)
c1(t) cos(2πfNpt)
ΣS/PData
s1(t)
c1(t) cos(2πf3t)
b1(t)
Multi-user MC-CDMA system
To Channel
cK (t) cos(2πf1t)
cK(t) cos(2πf2t)
c1(t)cos(2πfNpt)
ΣS/PData
sK(t)
cK(t) cos(2πf3t)
bK(t)
Data
b2(t)
Data
b3(t)
S/P
Revovered
Data
Revovered
Data
P/S
c1(t)cos(2πf1t)
cos(2πf2t)
cos(2πf3t)
cos(2πfNpt)
P/S
r1(t)
Received
signal
c1(t)
c1(t)
c1(t)
Recovered
Data
LPF
LPF
LPF
LPF
ck(t)cos(2πf1t)
cos(2πf2t)
cos(2πf3t)
cos(2πfNpt)
P/S
r1(t)
Received
signal
ck(t)
ck(t)
ck(t)
Recovered
Data
LPF
LPF
LPF
LPF
𝑏 1(𝑡)
𝑏 𝐾(𝑡)
User 1
User 2
User 3
User K
Transmitters Receivers
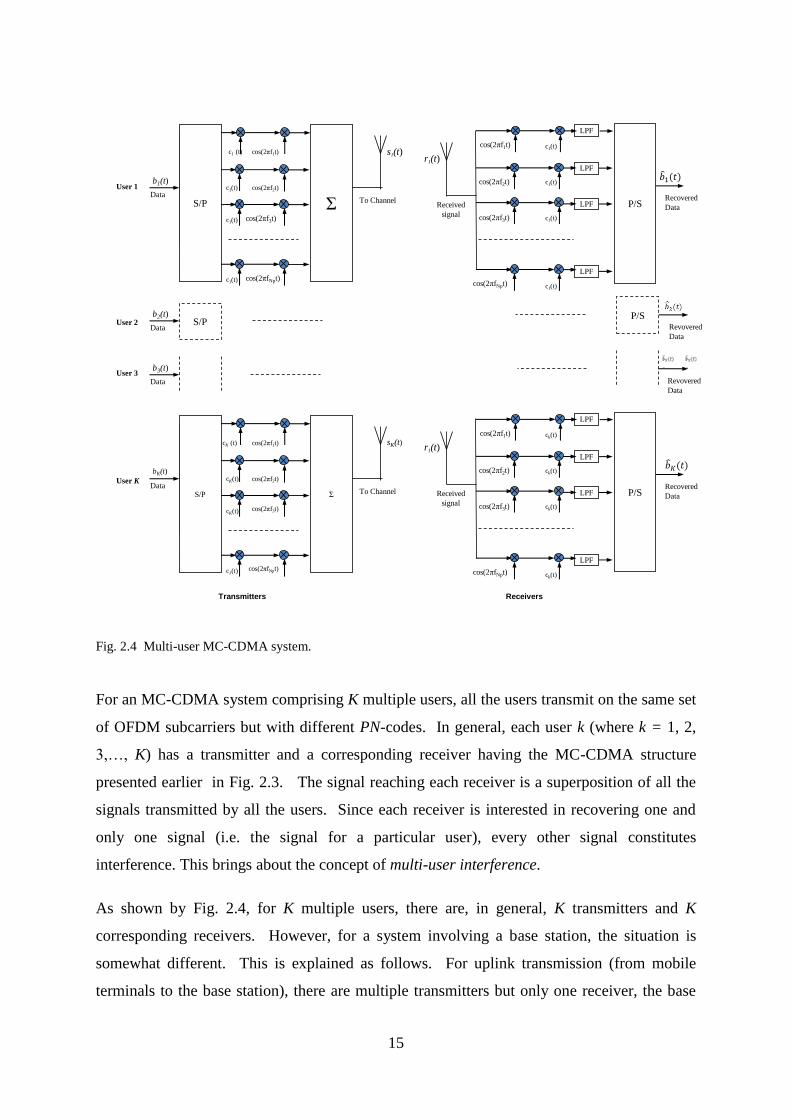
Fig. 2.4 Multi-user MC-CDMA system.
For an MC-CDMA system comprising K multiple users, all the users transmit on the same set
of OFDM subcarriers but with different PN-codes. In general, each user k (where k = 1, 2,
3,…, K) has a transmitter and a corresponding receiver having the MC-CDMA structure
presented earlier in Fig. 2.3. The signal reaching each receiver is a superposition of all the
signals transmitted by all the users. Since each receiver is interested in recovering one and
only one signal (i.e. the signal for a particular user), every other signal constitutes
interference. This brings about the concept of multi-user interference.
As shown by Fig. 2.4, for K multiple users, there are, in general, K transmitters and K
corresponding receivers. However, for a system involving a base station, the situation is
somewhat different. This is explained as follows. For uplink transmission (from mobile
terminals to the base station), there are multiple transmitters but only one receiver, the base

16
station (Fig. 2.5a). That is, the multi-user system of Fig. 2.4 reduces to that having just one
receiver (i.e. a K-to-1 system). The converse is the case for downlink transmission: the base
station becomes the only transmitter sending signals to multiple receivers - the mobile
terminals (Fig. 2.5b). This example is more of an outdoor network, but is used here to
illustrate the principles. An example of indoor systems having a similar uplink-downlink
topology is a server communicating wirelessly with some other terminals of a local area
indoor network.
(a) Uplink (b) Downlink
Mobile terminals Mobile terminals Base station Base station
Fig. 2.5. (a) Uplink and (b) downlink signal transmission.
2.6 MC-CDMA in the indoor channel
It is doubtless to say that over the years, much work has been done on MC-CDMA systems.
However, literature survey shows that not much of available literature relates to the
performance of MC-CDMA in the indoor channel. This is therefore an open research topic.
In saying this however, a careful consideration of merits or otherwise of the system in the
indoor channel might be useful, in the light of propagation characteristics of the channel.
A useful parameter for evaluating the merits of a MC-CDMA system in an indoor channel is
the delay spread. Reported values of the delay spread vary widely, ranging from about 3 –
300 ns [79]. For example, reported values include: less than 22 ns for a line of sight (LOS)
measurement in a 10 x12-meter size office, less than 55 ns in a non-LOS measurement with
transmitter and receiver separated by 7 - 20 meters, and wall partitions [125]; between 20 and
50 ns for 3 x 4-meter small- and 4 x 8-meter medium-size offices [126], 15 - 300 ns for

17
various factory environments having between 25 000 to 150 000 square meter of factory
space [127], under 100 ns at several university buildings, classrooms, small-room offices, an
auditorium, a library and a machine room [128], etc. Nowin this thesis we will assume mean
rms delay spread of 20, 50 and 150 ns for small, medium and large indoor channels
respectively. This translates to coherent bandwidth of 50, 20 and 6.67 MHz for the small,
medium and large indoor channel respectively. Consider a wideband CDMA (WCDMA)
having a transmission bandwidth of 5 MHz. By comparing this value to the mean rms delay
spreads, it is obvious that the transmission bandwidth is less than the least of the channel
coherent bandwidths. This implies that with respect to the WCDMA, the indoor channel is
flat-fading. Hence, multicarrier modulation may not be of much performance advantage in
the indoor channel, except in large indoor environments. Even in such large environments,
the frequency diversity inherent in CDMA provides enough compensation that could make
multicarrier transmission unnecessary for the indoor channel.
2.7 Space-Time Coding
Space-time coding (STC) is a method for transmitting data in multi-antennae systems. It
encodes a data stream across different transmit antennae and time slots, so that multiple
redundant copies of the data stream can be transmitted through independent fading channels.
By doing so, more reliable detection can be obtained at the receiver. Space-time coding helps
in exploiting the diversity or spatial multiplexing gain of Multiple-Input-Multiple-Output
(MIMO) systems [3].
2.8 Space-time coded MC-CDMA system
Space-time coding (STC) is known to be an effective diversity technique for combating
channel fading without bandwidth penalty. STC combines transmit diversity with coding
scheme. In recent years, different types of space-time coding schemes, including space-time
block codes (STBC), space-time trellis codes (STTC), concatenated STBC-STTC, and super-
orthogonal STTC (SOSTTC) have been studied [129]. STBC, first proposed by Alamouti in
1998 [130], and later generalised by Tarokh [131, 132], provides diversity gain but no coding
gain. However, the attractiveness in STBC includes its ability to achieve maximum possible
diversity advantage, coupled with the simplicity of its implementation and decoding

18
algorithm [12]. On the other hand, STTC provides both diversity and coding gain, but at the
expense of complexity of implementation and decoding.
Space-time coding is designed primarily for flat-fading channels. Consequently, STC
schemes cannot be applied as-is to frequency-selective wideband CDMA systems. However,
the combination of orthogonal frequency division multiplexing (OFDM) with code-division
multiple access (CDMA), as found in multicarrier CDMA (MC-CDMA) removes this barrier,
giving the opportunity to use space-time coding schemes in broadband frequency-selective
channels. Basic principles of operation of STC MC-CDMA system are briefly described as
follows.
Raw data is space-time coded into parallel data sub-streams which are distributed across
parallel MC-CDMA modulators (Fig. 2.6). The MC-CDMA modulators process the data
sub-streams, and transmit them over OFDM sub-carriers, across different MT transmit
antennae and time slots. The signals propagate through the channel, convolves with the
channel impulse response, mix with noise, and are thus picked up by 𝑛𝑅 receive antennae. To
recover the original data, the receiver carries out an inverse process on the received signal -
the MC-CDMA demodulators demodulate the signals and then pass them on to the space-
time decoder to recover the original data.
Space-time coded MC-CDMA system
Space-
time
Deoding
MC-CDMA
Demod1
MC-CDMA
DemodnR
:
:
MC-CDMA
Demod2Output
Data
Space-time
Coding
MC-CDMA
Mod 1
MC-CDMAMod
nT
:
:
MC-CDMA
Mod 2
Raw
Data
Fig. 2.6 A space-time coded multicarrier CDMA system
In recent years, significant amount of work has been done on space-time-coded MC-CDMA
systems, with most of the work being on STBC MC-CDMA systems [11-13, 16, 18, 19, 27,
31, 33, 35, 38-40, 42-45, 53, 58, 133-135], and very limited fraction on STTC MC-CDMA
19
and concatenated STTC-STBC MC-CDMA systems [12, 49, 59, 136], and none on SOSTCC
MC-CDMA systems. Literature survey also shows that a larger fraction of existing works
involves the use of Walsh-Hadamard codes as spreading sequences [11-62]. Only a few
reported works [63-66] involving the use of Gold codes in STC MC-CDMA systems are
found in literature. This thesis contributes to this small pool of works by investigating the
performance of a series of Gold codes in a STBC CDMA system.
2.9 Chapter summary
This chapter presented a brief review of evolution of CDMA, from its early days of military
applications, to present emerging forms of the technology, as well as its significance to
worldwide wireless telephony and satellite navigation. This chapter also presented principles
of operation of CDMA and associated technology, including OFDM multicarrier signal
transmission and space-time coding. Furthermore, this chapter identified certain gaps in
research that could be explored, which include the investigation of performance of certain
classes of space-time coded multicarrier CDMA systems.

20
Chapter 3
3 Correlation properties of m-sequences and Gold codes
3.0 Introduction
In the previous chapter, general concepts relating to CDMA-based systems were given. In
this chapter, we shall be focusing on an important element of CDMA systems – spreading
codes. Doing this is essential because the performance of a CDMA system is affected by the
properties of its spreading codes. Successful implementation of a CDMA-based system
requires the use of right set of codes having necessary properties for multiple-access
applications. This chapter gives an overview of spreading sequences and code selection
process for the proposed communication system. This is followed by an account of software
simulations carried out for the purpose of testing selected sets of codes prior to their use in
the system. In the last section of this chapter, selected codes are used for signal transmission
through a noiseless as well as a noisy channel. This prepares the ground for the development
of the proposed communication system.
The rest of this chapter is organised as follows. Section 3.1 gives an overview of spread
spectrum codes. Section 3.2 gives an account of code generation for the development of the
communication system. Sections 3.3 and 3.4 present results of tests carried out on essential
properties of the codes. Sections 3.5 and 3.6 give initial results on the use of the codes for
signal transmission through a communication channel. This chapter concludes with a
summary in Section 3.7.
3.1 Spread spectrum codes
Spread spectrum codes are pseudo-noise (PN) codes, and examples of such codes include
maximal linear code sequences, Gold codes, Walsh-Hadamard codes and Kasami codes [80-

21
84]. Maximal linear code sequences (often abbreviated as maximal or m-sequences) are
commonly implemented using Linear Feedback Shift Register (LFSR). An m-sequence
represents LFSR sequence with its maximum possible period, which is 2n – 1, where n is the
length of the shift register. M-sequences have an excellent autocorrelation function which is
given by [2, 137-140]
𝜑(𝑗) = {𝑁 𝑗 = 0 −1 1 ≤ 𝑗 ≤ 𝑛 − 1 .
(3.1)
However, m-sequences have poor cross-correlation properties: the cross-correlation function
between any pair of m-sequences of the same period can have relatively large peaks [138,
141] which make them unsuitable for CDMA applications. Another limitation is that the
number of available m-sequences is too small for CDMA applications.
Walsh-Hadamard code is another class of spreading sequences commonly found in literature.
The codes have excellent performance when synchronisation is perfect, but this condition
cannot always be guaranteed in practice. The codes perform well in synchronous but not in
asynchronous transmission. Their usefulness is therefore limited to downlink transmission.
Apart from this, the number of available Walsh-Hadamard codes is relatively limited.
Gold codes are a type of PN sequences with better periodic cross-correlation properties that
make them appropriate for CDMA systems. They are derived from certain pairs of m-
sequences called preferred sequences. Preferred sequences are unique because when they are
combined appropriately, any two of them produce a huge number of Gold codes. Gold codes
exhibit triple-valued cross-correlation function [2, 137-140] with values {-1, -t(m), t(m)-2}
where
𝑡(𝑚) = { 2(𝑚+1)/2 + 1 𝑚 odd 2(𝑚+2)/2 + 1 𝑚 even.
(3.2)
For example, if m = 10, t(m) = 65, giving the cross-correlation values as {-1, -65, 63}. This
implies for a 10-stage shift register, the maximum value of cross-correlation for any pair of
the Gold code is 65. This can be compared to the maximum cross-correlation for m-
sequences which is 383.
Kasami code is another class of PN-code having properties similar to that of Gold codes.
According to Prasad [2], Gold codes are among the most popular codes in use, their
favourable correlation properties being a factor. For the current work, Gold codes will be
used.

22
3.2 Generation of the PN codes
The initial stage of the research work involved generation of spread-spectrum codes. The
following Table 3.1 shows m-sequences that were generated using linear feedback shift
registers. Each of the m-sequences is 31-chip long, obtained from a 5-stage shift register.
Table 3.2 below shows an array of 33 Gold codes, each is also 31-chip long, generated from
MATLAB simulations. The 33 Gold codes were obtained by combining the first m-sequence
with a modulo-2 addition of time-shifted versions of the second m-sequence. This shows the
huge number of Gold codes that can be generated from a combination of just a pair of m-
sequences, and it highlights an important advantage of Gold codes over m-sequences, because
the number of available m-sequences is generally too small for CDMA applications.
Table 3.1. Examples of generated 31-chip m-sequences
m-sequence1 1 1 1 1 1 0 0 1 1 0 1 0 0 1 0 0 0 0 1 0 1 0 1 1 1 0 1 1 0 0 0
m-sequence2 1 1 1 1 1 0 0 1 0 0 1 1 0 0 0 0 1 0 1 1 0 1 0 1 0 0 0 1 1 1 0
m-sequence3 1 1 1 1 1 0 1 1 0 0 1 1 1 0 0 0 0 1 1 0 1 0 1 0 0 1 0 0 0 1 0
Table 3.2. An array of generated 33-by-31-chip Gold codes
S/N Gold Codes
1.
2. 3.
4.
5. 6.
7.
8. 9.
10.
11. 12.
13.
14. 15.
16.
17. 18.
19.
20.
21.
22.
23. 24.
25.
26. 27.
1 1 1 1 1 0 0 1 1 0 1 0 0 1 0 0 0 0 1 0 1 0 1 1 1
1 1 1 1 1 0 0 1 0 0 1 1 0 0 0 0 1 0 1 1 0 1 0 1 0 0 0 0 0 0 0 0 0 1 0 0 1 0 1 0 0 1 0 0 1 1 1 1 0 1
1 0 0 0 0 1 0 1 0 0 1 1 1 1 0 0 0 1 1 1 0 0 0 1 0
0 1 0 0 0 1 1 1 1 1 1 0 1 0 0 0 0 0 0 0 0 1 1 0 1 0 0 1 0 0 1 1 0 1 0 0 0 0 0 1 0 0 0 1 1 1 1 0 1 0
0 0 0 1 0 1 1 0 0 0 1 1 0 1 1 1 0 0 1 0 0 0 0 0 1
1 0 0 0 1 1 1 0 0 1 1 0 1 1 0 1 1 0 1 0 1 1 1 0 0 1 1 0 0 0 0 1 0 0 1 0 0 0 0 0 0 1 1 1 0 1 0 0 1 0
1 1 1 0 0 1 0 0 0 1 0 1 0 1 1 0 0 1 0 0 1 0 1 0 1
0 1 1 1 0 1 1 1 0 1 0 1 1 1 0 1 0 0 0 1 1 0 1 1 0 1 0 1 1 1 1 1 0 1 1 0 1 1 0 0 0 1 0 1 1 0 0 1 1 1
0 1 0 1 1 0 1 0 0 0 0 1 1 0 1 0 0 1 1 0 0 1 1 1 1
1 0 1 0 1 0 0 0 0 1 1 1 1 0 1 1 0 0 0 0 1 1 0 1 1 0 1 0 1 0 0 0 1 0 1 0 0 1 0 1 1 1 0 1 1 1 0 0 0 1
0 0 1 0 1 1 0 1 1 1 0 1 0 0 1 1 1 1 1 0 0 0 1 0 0
1 0 0 1 0 0 1 1 1 0 0 1 1 1 1 1 1 1 0 0 1 1 1 1 0 0 1 0 0 1 1 0 0 1 0 1 1 1 0 0 1 1 1 0 1 1 0 0 1 1
1 0 1 0 0 0 1 1 0 0 1 0 1 0 1 0 1 1 0 1 0 0 1 0 1
1 1 0 1 0 1 0 0 1 1 1 0 0 0 1 1 0 1 0 1 0 1 1 1 0
1 1 1 0 1 1 1 1 0 0 0 0 0 1 1 1 1 0 0 1 0 1 0 1 1
1 1 1 1 0 0 1 0 1 1 1 1 0 1 0 1 1 1 1 1 0 1 0 0 1
0 1 1 1 1 1 0 0 0 0 0 0 1 1 0 0 1 1 0 0 0 1 0 0 0 0 0 1 1 1 0 1 1 0 1 1 1 0 0 0 0 0 1 0 1 1 1 0 0 0
1 0 0 1 1 0 0 0 1 1 0 0 1 1 1 0 0 0 0 1 0 0 0 0 0
1 1 0 0 1 0 0 1 0 0 0 1 0 0 0 1 0 0 1 1 0 1 1 0 0 0 1 1 0 0 0 0 1 1 1 1 1 1 1 1 0 1 0 1 0 0 1 0 1 0
0 1 1 0 0 0
0 0 1 1 1 0 0 1 0 1 1 0
0 1 1 1 1 1
1 1 1 0 1 1 0 0 1 0 0 1
1 1 0 0 0 0
0 0 1 1 0 0 1 1 0 0 1 0
1 0 1 1 0 1
0 0 0 0 1 0 1 1 0 1 0 1
0 0 1 1 1 0
0 1 0 0 1 1 0 1 1 1 0 1
0 1 1 0 1 0
1 1 1 0 0 1 1 0 1 0 0 0
0 0 0 0 0 0
0 1 0 1 0 0
1 1 1 1 1 0
0 0 1 0 1 1
0 1 0 0 0 1 1 1 1 1 0 0
1 0 1 0 1 0
1 0 0 0 0 1 1 0 0 1 0 0

23
28.
29. 30.
31.
32. 33.
1 0 1 1 0 1 0 1 1 0 0 0 1 0 0 1 0 1 1 0 1 1 0 0 1
1 1 0 1 1 1 1 1 1 0 1 1 0 0 1 0 1 0 0 0 1 0 0 0 0 0 1 1 0 1 0 1 0 1 0 1 0 1 1 1 1 0 1 1 1 1 0 1 0 0
0 0 1 1 0 0 0 0 0 0 1 0 0 0 0 1 1 0 0 0 0 0 1 1 0
0 0 0 1 1 1 0 1 0 1 1 0 0 1 1 0 1 1 1 1 1 1 1 1 1 0 0 0 0 1 0 1 1 1 1 0 0 0 1 0 1 0 1 0 0 0 0 0 1 1
1 0 0 1 1 0
0 0 0 1 1 1 1 1 0 1 1 1
1 0 1 1 1 1
1 0 0 0 1 1 0 0 0 1 0 1
3.3 Experimentation on the correlation properties of the codes
After generating the m-sequences and the Gold codes, software simulations were carried out
on their autocorrelation and cross-correlation properties. Autocorrelation and cross-
correlation of code sequences indicate the number of agreements minus the number of
disagreements when the code or codes are compared chip by chip. Mathematically, periodic
cross-correlation function for sequences xn and yn can be represented as [142, 143]
𝑟𝑥,𝑦(𝑙) = ∑ 𝑥𝑛𝑦𝑛+𝑙.
𝑁−1
𝑛=0
(3. 3)
Hence, autocorrelation function may be expressed as:
𝑟𝑥,𝑥(𝑙) = ∑ 𝑥𝑛𝑥𝑛+𝑙.
𝑁−1
𝑛=0
(3. 4)
Auto-correlation plot for m-sequences is double-valued, with a peak only at zero shift point.
This is an invaluable property because it allows a receiver to discriminate between signals on
a yes-no basis. Because of the well-defined autocorrelation function of m-sequences, a
system may use the same code for modulation by treating its phase-shifted version as a
different code. An example of a typical system employing this technique is the global
positioning system. Unfortunately however, cross-correlation of m-sequences is not so well-
behaved as their autocorrelation, and this limits their use in multi-access communication
systems.
Figure 3.1(a) shows the graph of autocorrelation of each of the m-sequences, while Figure
3.1(b) shows the results of cross-correlating one m-sequence with another. Figure 3.1(a)
confirms the autocorrelation property of m-sequences, as predicted by equation 3.1.
However, the cross-correlation graphs, Fig. 3.1(b), deserve a close look. The cross-
correlation of m-sequences is generally believed to be random-valued. In contrast, Fig. 3.1(b)

24
indicates that it is not random but triple-valued. A close look at the graphs shows that the
cross-correlation values correspond to those predicted by Equation (3.2) for Gold codes.
This observation implies that the m-sequences have the same cross-correlation property as
Gold codes.
In general, cross-correlation of m-sequences is random-valued. In contrast, cross-correlation
of preferred pairs is triple-valued. When such preferred pairs are combined appropriately,
they generate a huge number of Gold codes. These are unique properties of preferred pairs.

25
Fig. 3.1 (a) Autocorrelation of three m-sequences.
0 10 20 30 40 50 60 70 80-10
0
10
20
30
40
shifts
valu
e o
f corr
ela
tions
autocorrelation for m-sequence 1
0 10 20 30 40 50 60 70 80-10
0
10
20
30
40
shifts
valu
e o
f corr
ela
tions
autocorrelation for m-sequence 2
0 10 20 30 40 50 60 70 80-10
0
10
20
30
40
shifts
valu
e o
f corr
ela
tions
autocorrelation for m-sequence 3
0 5 10 15 20 25 30 35 40 45-10
-5
0
5
10
shifts
valu
e o
f corr
ela
tions
Cross-correlations of m-sequences 1 and 2
0 5 10 15 20 25 30 35 40 45-10
-5
0
5
10
shifts
valu
e o
f corr
ela
tions
Cross-correlations of m-sequences 1 and 3
0 5 10 15 20 25 30 35 40 45-10
-5
0
5
10
shifts
valu
e o
f corr
ela
tions
Cross-correlations of m-sequences 2 and 3
These cross-correlations behave like Gold codes - surprising

26
Fig. 3-1(b) Cross-correlation of the three m-sequences.
0 10 20 30 40 50 60 70 80-10
0
10
20
30
40
shifts
valu
e o
f corr
ela
tions
autocorrelation for m-sequence 1
0 10 20 30 40 50 60 70 80-10
0
10
20
30
40
shifts
valu
e o
f corr
ela
tions
autocorrelation for m-sequence 2
0 10 20 30 40 50 60 70 80-10
0
10
20
30
40
shifts
valu
e o
f corr
ela
tions
autocorrelation for m-sequence 3
0 5 10 15 20 25 30 35 40 45-10
-5
0
5
10
shifts
valu
e o
f corr
ela
tions
Cross-correlations of m-sequences 1 and 2
0 5 10 15 20 25 30 35 40 45-10
-5
0
5
10
shifts
valu
e o
f corr
ela
tions
Cross-correlations of m-sequences 1 and 3
0 5 10 15 20 25 30 35 40 45-10
-5
0
5
10
shifts
valu
e o
f corr
ela
tions
Cross-correlations of m-sequences 2 and 3
These cross-correlations behave like Gold codes - surprising
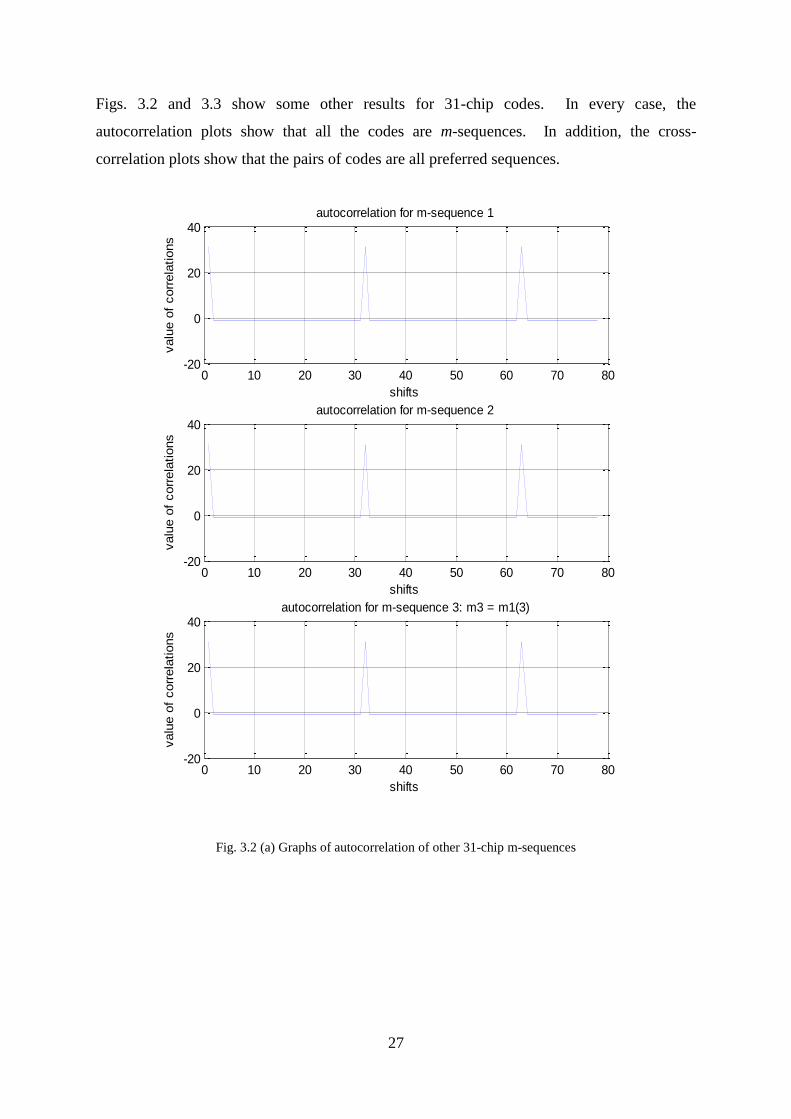
27
Figs. 3.2 and 3.3 show some other results for 31-chip codes. In every case, the
autocorrelation plots show that all the codes are m-sequences. In addition, the cross-
correlation plots show that the pairs of codes are all preferred sequences.
Fig. 3.2 (a) Graphs of autocorrelation of other 31-chip m-sequences
0 10 20 30 40 50 60 70 80-20
0
20
40
shifts
valu
e o
f corr
ela
tions
autocorrelation for m-sequence 1
0 10 20 30 40 50 60 70 80-20
0
20
40
shifts
valu
e o
f corr
ela
tions
autocorrelation for m-sequence 2
0 10 20 30 40 50 60 70 80-20
0
20
40
shifts
valu
e o
f corr
ela
tions
autocorrelation for m-sequence 3: m3 = m1(3)
0 10 20 30 40 50 60 70 80 90-10
-5
0
5
10
shifts
valu
e o
f corr
ela
tions
Cross-correlations of m-sequences 1 and 2
0 10 20 30 40 50 60 70 80 90-10
-5
0
5
10
shifts
valu
e o
f corr
ela
tions
Cross-correlations of m-sequences 1 and 3: m3 = m1(3)
0 10 20 30 40 50 60 70 80 90-20
0
20
40
shifts
valu
e o
f corr
ela
tions
Cross-correlations of m-sequences 2 and 3
These x-corr shows that the m-seq obtained by decimating code1 results in code2: m3 = m1(3)

28
Fig. 3.2 (b) Graphs of cross-correlation of the 31-chip m-sequences of Fig. 3-2(a)
0 10 20 30 40 50 60 70 80-20
0
20
40
shifts
valu
e o
f corr
ela
tions
autocorrelation for m-sequence 1
0 10 20 30 40 50 60 70 80-20
0
20
40
shifts
valu
e o
f corr
ela
tions
autocorrelation for m-sequence 2
0 10 20 30 40 50 60 70 80-20
0
20
40
shifts
valu
e o
f corr
ela
tions
autocorrelation for m-sequence 3: m3 = m1(3)
0 10 20 30 40 50 60 70 80 90-10
-5
0
5
10
shifts
valu
e o
f corr
ela
tions
Cross-correlations of m-sequences 1 and 2
0 10 20 30 40 50 60 70 80 90-10
-5
0
5
10
shifts
valu
e o
f corr
ela
tions
Cross-correlations of m-sequences 1 and 3: m3 = m1(3)
0 10 20 30 40 50 60 70 80 90-20
0
20
40
shifts
valu
e o
f corr
ela
tions
Cross-correlations of m-sequences 2 and 3
These x-corr shows that the m-seq obtained by decimating code1 results in code2: m3 = m1(3)

29
Fig. 3.3 (a) Graphs of autocorrelation of some other 31-chip m-sequences
0 10 20 30 40 50 60 70 80-20
0
20
40
shifts
valu
e o
f corr
ela
tions
autocorrelation for m-sequence 1
0 10 20 30 40 50 60 70 80-20
0
20
40
shifts
valu
e o
f corr
ela
tions
autocorrelation for m-sequence 2
0 10 20 30 40 50 60 70 80-20
0
20
40
shifts
valu
e o
f corr
ela
tions
autocorrelation for m-sequence 4: m4 = m1(5)
0 10 20 30 40 50 60 70 80 90-10
-5
0
5
10
shifts
valu
e o
f corr
ela
tions
Cross-correlations of m-sequences 1 and 2
0 10 20 30 40 50 60 70 80 90-10
-5
0
5
10
shifts
valu
e o
f corr
ela
tions
Cross-correlations of m-sequences 1 and 4: m4 = m1(5)
0 10 20 30 40 50 60 70 80 90-10
-5
0
5
10
shifts
valu
e o
f corr
ela
tions
Cross-correlations of m-sequences 2 and 4: m4 = m1(5)
...

30
Fig. 3-3(b) Graphs of cross-correlation of 31-chip the m-sequences of Fig. 3-3(a)
0 10 20 30 40 50 60 70 80-20
0
20
40
shifts
valu
e o
f corr
ela
tions
autocorrelation for m-sequence 1
0 10 20 30 40 50 60 70 80-20
0
20
40
shifts
valu
e o
f corr
ela
tions
autocorrelation for m-sequence 2
0 10 20 30 40 50 60 70 80-20
0
20
40
shifts
valu
e o
f corr
ela
tions
autocorrelation for m-sequence 4: m4 = m1(5)
0 10 20 30 40 50 60 70 80 90-10
-5
0
5
10
shifts
valu
e o
f corr
ela
tions
Cross-correlations of m-sequences 1 and 2
0 10 20 30 40 50 60 70 80 90-10
-5
0
5
10
shifts
valu
e o
f corr
ela
tions
Cross-correlations of m-sequences 1 and 4: m4 = m1(5)
0 10 20 30 40 50 60 70 80 90-10
-5
0
5
10
shifts
valu
e o
f corr
ela
tions
Cross-correlations of m-sequences 2 and 4: m4 = m1(5)
...

31
Figure 3.4(a) shows the autocorrelation of one of the Gold codes, selected from the family of
Gold codes of Table 3.2. Figure 3.4(b) shows the cross-correlation graph for two of the Gold
codes. These graphs agree with the theoretical predictions for Gold codes.
(a)
(b)
Fig. 3.4. Graph of (a) autocorrelation for a 31-chip Gold code (b) cross-correlation function for two Gold codes.
0 5 10 15 20 25 30 35 40 45-10
-5
0
5
10
shifts
valu
e o
f corr
ela
tions
Cross-correlations of two 31-chip Gold codes
0 10 20 30 40 50 60 70 80-10
0
10
20
30
40
shifts
valu
e o
f corr
ela
tions
Autocorrelation for a 31-chip Gold code
0 5 10 15 20 25 30 35 40 45-10
-5
0
5
10
shifts
valu
e o
f corr
ela
tions
Cross-correlations of two 31-chip Gold codes
0 10 20 30 40 50 60 70 80-10
0
10
20
30
40
shifts
valu
e o
f corr
ela
tions
Autocorrelation for a 31-chip Gold code

32
Although the 31-chip codes that have just been presented provide useful models, they are not
suitable as spreading elements for practical spread-spectrum systems because of their short
length. The 31-chip codes may only support a few simultaneous users at their best. Practical
applications require longer codes [141]. In the next section, simulations involving longer
codes will be presented.
3.4 Generation of longer codes
Longer codes, including 127-, 511- and 2047-chip codes were also generated and
investigated. Fig. 3.5 shows the results for 127-chip m-sequences. This figure involves four
different m-sequences, numbered 1 to 4. On this figure, the first four graphs are
autocorrelation plots, while the rest are cross-correlation plots. The autocorrelation plots
confirm that the codes are indeed m-sequences, while the cross-correlation plots show that
any pair of the m-sequences constitutes a preferred pair.
Fig. 3.6 shows results for 511-chip m-sequences. On this figure, the autocorrelation plots (the
first four plots) confirm that the sequences are m-sequences. The cross-correlation plots
between m-sequence pairs 1 and 3 as well as 1 and 4 are triple-valued, confirming that the
pairs are preferred sequences. The cross-correlation plots between m-sequence pairs 2 and 4
are also triple-valued, which indicate that they are preferred pairs with respect to one another.
That is, m-sequence 4 is a preferred pair of both m-sequence 1 and 2. The cross-correlation
plot between sequence 1 and sequence 2 confirms that they are not preferred pairs. The same
applies to pairs 2 and 3, as well as 3 and 4.
Fig. 3.7 shows results for 2047-chip codes. Among other things, the cross-correlation graphs
between m-sequence pairs 1 and 3 as well as 1 and 4 are triple-valued, confirming that these
pairs are preferred sequences. The cross-correlation plots of the remaining parings confirm
that they are not preferred pairs.

33
Fig. 3.5. Graphs of autocorrelation and cross-correlation of 127-chip m-sequences
0 50 100 150 200 250 300 350-100
0
100
200
shifts
valu
e o
f corr
ela
tions
autocorrelation for m-sequence 1
0 50 100 150 200 250 300 350-100
0
100
200
shifts
valu
e o
f corr
ela
tions
autocorrelation for m-sequence 2
0 50 100 150 200 250 300 350-100
0
100
200
shifts
valu
e o
f corr
ela
tions
autocorrelation for m-sequence 3: m3 = m1(3)
0 50 100 150 200 250 300 350-100
0
100
200
shifts
valu
e o
f corr
ela
tions
autocorrelation for m-sequence 4: m4 = m1(5)
0 50 100 150 200 250 300 350-20
0
20
shifts
valu
e o
f corr
ela
tions Cross-correlations of m-sequences 1 and 2
0 50 100 150 200 250 300 350-20
0
20
shifts
valu
e o
f corr
ela
tions
Cross-correlations of m-sequences 1 and 3
0 50 100 150 200 250 300 350-20
0
20
shifts
valu
e o
f corr
ela
tions
Cross-correlations of m-sequences 2 and 3
0 50 100 150 200 250 300 350-20
0
20
shifts
valu
e o
f corr
ela
tions
Cross-correlations of m-sequences 1 and 4
0 50 100 150 200 250 300 350-20
0
20
shifts
valu
e o
f corr
ela
tions
Cross-correlations of m-sequences 2 and 4
0 50 100 150 200 250 300 350-20
0
20
shifts
valu
e o
f corr
ela
tions Cross-correlations of m-sequences 3 and 4)
Decimation: m3 = m1(3), m4 = m1(5)

34
Fig.3.5 contd. Graphs of autocorrelation and cross-correlation of 127-chip m-sequences
0 50 100 150 200 250 300 350-100
0
100
200
shifts
valu
e o
f corr
ela
tions
autocorrelation for m-sequence 1
0 50 100 150 200 250 300 350-100
0
100
200
shifts
valu
e o
f corr
ela
tions
autocorrelation for m-sequence 2
0 50 100 150 200 250 300 350-100
0
100
200
shifts
valu
e o
f corr
ela
tions
autocorrelation for m-sequence 3: m3 = m1(3)
0 50 100 150 200 250 300 350-100
0
100
200
shifts
valu
e o
f corr
ela
tions
autocorrelation for m-sequence 4: m4 = m1(5)
0 50 100 150 200 250 300 350-20
0
20
shifts
valu
e o
f corr
ela
tions Cross-correlations of m-sequences 1 and 2
0 50 100 150 200 250 300 350-20
0
20
shifts
valu
e o
f corr
ela
tions
Cross-correlations of m-sequences 1 and 3
0 50 100 150 200 250 300 350-20
0
20
shifts
valu
e o
f corr
ela
tions
Cross-correlations of m-sequences 2 and 3
0 50 100 150 200 250 300 350-20
0
20
shifts
valu
e o
f corr
ela
tions
Cross-correlations of m-sequences 1 and 4
0 50 100 150 200 250 300 350-20
0
20
shifts
valu
e o
f corr
ela
tions
Cross-correlations of m-sequences 2 and 4
0 50 100 150 200 250 300 350-20
0
20
shifts
valu
e o
f corr
ela
tions Cross-correlations of m-sequences 3 and 4)
Decimation: m3 = m1(3), m4 = m1(5)

35
Fig. 3.6. Graphs of autocorrelation and cross-correlation of 511-chip m-sequences
0 200 400 600 800 1000 1200-500
0
500
1000
shifts
valu
e o
f corr
ela
tions
autocorrelation for m-sequence1
0 200 400 600 800 1000 1200-500
0
500
1000
shifts
valu
e o
f corr
ela
tions
autocorrelation for m-sequence2
0 200 400 600 800 1000 1200-500
0
500
1000
shifts
valu
e o
f corr
ela
tions
autocorrelation for m-sequence3: m3 = m1(3)
0 200 400 600 800 1000 1200-500
0
500
1000
shifts
valu
e o
f corr
ela
tions
autocorrelation for m-sequence4: m4 = m1(5)
0 200 400 600 800 1000 1200-50
0
50
100
shifts
valu
e o
f corr
ela
tions Cross-correlations of m-sequences 1 and 2
0 200 400 600 800 1000 1200-50
0
50
shifts
valu
e o
f corr
ela
tions
Cross-correlations of m-sequences 1 and 3
0 200 400 600 800 1000 1200-200
-100
0
100
shifts
valu
e o
f corr
ela
tions
Cross-correlations of m-sequences 2 and 3
0 200 400 600 800 1000 1200-50
0
50
shifts
valu
e o
f corr
ela
tions
Cross-correlations of m-sequences 1 and 4
Correlation plots for 511-chip m-sequences.
0 200 400 600 800 1000 1200-50
0
50
shifts
valu
e o
f corr
ela
tions
Cross-correlations of m-sequences 2 and 4
m-seq3 and m-seq4 are preferred generated by decimating m-seq1
0 200 400 600 800 1000 1200-100
0
100
shifts
valu
e o
f corr
ela
tions Cross-correlations of m-sequences 3 and 4
Decimation: m3 = m1(3), m4 = m1(5)

36
Fig. 3-6 contd. Graphs of autocorrelation and cross-correlation of 511-chip m-sequences
0 200 400 600 800 1000 1200-500
0
500
1000
shifts
valu
e o
f corr
ela
tions
autocorrelation for m-sequence1
0 200 400 600 800 1000 1200-500
0
500
1000
shifts
valu
e o
f corr
ela
tions
autocorrelation for m-sequence2
0 200 400 600 800 1000 1200-500
0
500
1000
shifts
valu
e o
f corr
ela
tions
autocorrelation for m-sequence3: m3 = m1(3)
0 200 400 600 800 1000 1200-500
0
500
1000
shifts
valu
e o
f corr
ela
tions
autocorrelation for m-sequence4: m4 = m1(5)
0 200 400 600 800 1000 1200-50
0
50
100
shifts
valu
e o
f corr
ela
tions Cross-correlations of m-sequences 1 and 2
0 200 400 600 800 1000 1200-50
0
50
shifts
valu
e o
f corr
ela
tions
Cross-correlations of m-sequences 1 and 3
0 200 400 600 800 1000 1200-200
-100
0
100
shifts
valu
e o
f corr
ela
tions
Cross-correlations of m-sequences 2 and 3
0 200 400 600 800 1000 1200-50
0
50
shifts
valu
e o
f corr
ela
tions
Cross-correlations of m-sequences 1 and 4
Correlation plots for 511-chip m-sequences.
0 200 400 600 800 1000 1200-50
0
50
shifts
valu
e o
f corr
ela
tions
Cross-correlations of m-sequences 2 and 4
m-seq3 and m-seq4 are preferred generated by decimating m-seq1
0 200 400 600 800 1000 1200-100
0
100
shifts
valu
e o
f corr
ela
tions Cross-correlations of m-sequences 3 and 4
Decimation: m3 = m1(3), m4 = m1(5)

37
Fig. 3.7 Graphs of autocorrelation and cross-correlation of 2047-chip m-sequences
0 500 1000 1500 2000 2500 3000 3500 4000 4500-2000
0
2000
4000
shifts
valu
e o
f corr
ela
tions
autocorrelation for m-sequence1
0 500 1000 1500 2000 2500 3000 3500 4000 4500-2000
0
2000
4000
shifts
valu
e o
f corr
ela
tions
autocorrelation for m-sequence2
0 500 1000 1500 2000 2500 3000 3500 4000 4500-2000
0
2000
4000
shifts
valu
e o
f corr
ela
tions
autocorrelation for m-sequence3: m3 = m1(3)
0 500 1000 1500 2000 2500 3000 3500 4000 4500-2000
0
2000
4000
shifts
valu
e o
f corr
ela
tions
autocorrelation for m-sequence4: m4 = m1(5)
0 500 1000 1500 2000 2500 3000 3500 4000 4500-200
0
200
shifts
valu
e o
f corr
ela
tions Cross-correlations of m-sequences 1 and 2
0 500 1000 1500 2000 2500 3000 3500 4000 4500-100
0
100
shifts
valu
e o
f corr
ela
tions
Cross-correlations of m-sequences 1 and 3
0 500 1000 1500 2000 2500 3000 3500 4000 4500-200
0
200
shifts
valu
e o
f corr
ela
tions
Cross-correlations of m-sequences 2 and 3
0 500 1000 1500 2000 2500 3000 3500 4000 4500-100
0
100
shifts
valu
e o
f corr
ela
tions
Cross-correlations of m-sequences 1 and 4
Correlation plots for 1023-chip m-sequences.
0 500 1000 1500 2000 2500 3000 3500 4000 4500-100
0
100
200
shifts
valu
e o
f corr
ela
tions
Cross-correlations of m-sequences 2 and 4
m-seq3 and m-seq4 are preferred generated by decimating m-seq1
0 500 1000 1500 2000 2500 3000 3500 4000 4500-200
0
200
shifts
valu
e o
f corr
ela
tions Cross-correlations of m-sequences 3 and 4
Decimation: m3 = m1(3), m4 = m1(5)

38
Fig. 3-7 contd. Graphs of autocorrelation and cross-correlation of 2047-chip m-sequences
0 500 1000 1500 2000 2500 3000 3500 4000 4500-2000
0
2000
4000
shifts
valu
e o
f corr
ela
tions
autocorrelation for m-sequence1
0 500 1000 1500 2000 2500 3000 3500 4000 4500-2000
0
2000
4000
shifts
valu
e o
f corr
ela
tions
autocorrelation for m-sequence2
0 500 1000 1500 2000 2500 3000 3500 4000 4500-2000
0
2000
4000
shifts
valu
e o
f corr
ela
tions
autocorrelation for m-sequence3: m3 = m1(3)
0 500 1000 1500 2000 2500 3000 3500 4000 4500-2000
0
2000
4000
shifts
valu
e o
f corr
ela
tions
autocorrelation for m-sequence4: m4 = m1(5)
0 500 1000 1500 2000 2500 3000 3500 4000 4500-200
0
200
shifts
valu
e o
f corr
ela
tions Cross-correlations of m-sequences 1 and 2
0 500 1000 1500 2000 2500 3000 3500 4000 4500-100
0
100
shifts
valu
e o
f corr
ela
tions
Cross-correlations of m-sequences 1 and 3
0 500 1000 1500 2000 2500 3000 3500 4000 4500-200
0
200
shifts
valu
e o
f corr
ela
tions
Cross-correlations of m-sequences 2 and 3
0 500 1000 1500 2000 2500 3000 3500 4000 4500-100
0
100
shifts
valu
e o
f corr
ela
tions
Cross-correlations of m-sequences 1 and 4
Correlation plots for 1023-chip m-sequences.
0 500 1000 1500 2000 2500 3000 3500 4000 4500-100
0
100
200
shifts
valu
e o
f corr
ela
tions
Cross-correlations of m-sequences 2 and 4
m-seq3 and m-seq4 are preferred generated by decimating m-seq1
0 500 1000 1500 2000 2500 3000 3500 4000 4500-200
0
200
shifts
valu
e o
f corr
ela
tions Cross-correlations of m-sequences 3 and 4
Decimation: m3 = m1(3), m4 = m1(5)

39
3.5 Signal transmission through a noiseless channel
In this section, we shall start developing and testing software models for the proposed
communication system. The development process begins with the simulation of a baseband
CDMA for signal transmission through a noiseless, non-fading channel, Fig. 3.8. Basically,
this model involves PN-encoding-decoding. Since the transmission is through a noiseless
channel, it is expected that every transmitted signal should be received without any errors.
That is, the bit-error-rate (BER) should be zero, regardless of the length of the data stream
being transmitted. Simulation results that were obtained confirmed this to be the case. The
model was simulated for 4-bit, 8-bit, 13-bit as well as one million-bit random data streams,
and in every case, the signal reception was without errors. The outcome of the simulation
helped in further validating the Gold codes. Were the transmitted bits recovered with errors,
it would mean that the Gold codes are faulty codes.
Information Sequence
PN Generator
x m(t)
c(t)
b(t)
Encoding
PN Generator
xr(t)
c(t)
𝑏 ( )
Decoding
channel
h(n)
Fig. 3.8. Signal transmission through a noiseless channel
3.6 Signal transmission through a noisy channel
As part of initial phase of the system development process, models were simulated for signal
transmission through a noisy channel. We shall begin with a brief treatment of the
underlying theory, as illustrated by Fig. 3.9. As shown by this figure, binary information
stream b(t) is first digitally modulated to give a modulated signal m(t). The modulated signal
is then encoded with a PN-code c(t), after which the signal convolves with channel impulse
response h(n), and then becomes corrupted by noise n(t). To recover the original information
stream, the receiver carries out the reverse process. The recovered output 𝑏 (𝑡) is then
compared with the original information stream b(t) to determine the number of errors, for bit-
error-rate (BER) analysis.
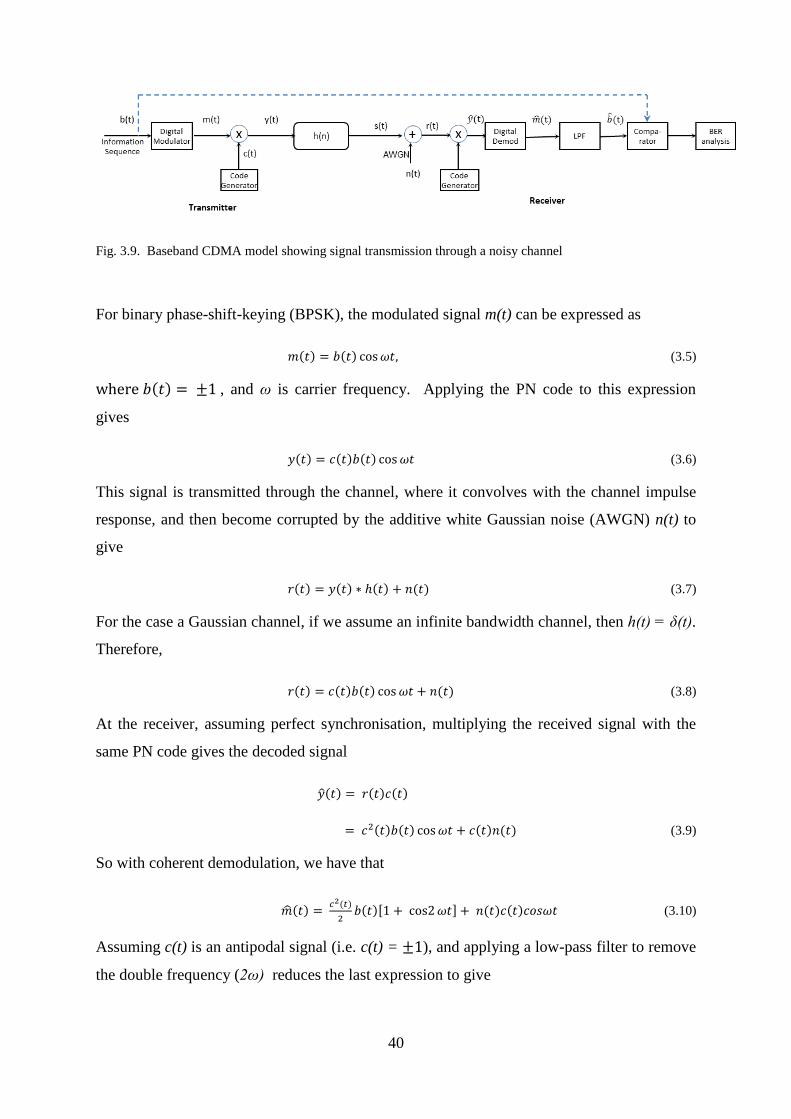
40
Fig. 3.9. Baseband CDMA model showing signal transmission through a noisy channel
For binary phase-shift-keying (BPSK), the modulated signal m(t) can be expressed as
𝑚(𝑡) = 𝑏(𝑡) cos𝜔𝑡, (3.5)
where 𝑏(𝑡) = ±1 , and ω is carrier frequency. Applying the PN code to this expression
gives
𝑦(𝑡) = 𝑐(𝑡)𝑏(𝑡) cos𝜔𝑡 (3.6)
This signal is transmitted through the channel, where it convolves with the channel impulse
response, and then become corrupted by the additive white Gaussian noise (AWGN) n(t) to
give
𝑟(𝑡) = 𝑦(𝑡) ∗ ℎ(𝑡) + 𝑛(𝑡) (3.7)
For the case a Gaussian channel, if we assume an infinite bandwidth channel, then h(t) = δ(t).
Therefore,
𝑟(𝑡) = 𝑐(𝑡)𝑏(𝑡) cos𝜔𝑡 + 𝑛(𝑡) (3.8)
At the receiver, assuming perfect synchronisation, multiplying the received signal with the
same PN code gives the decoded signal
�̂�(𝑡) = 𝑟(𝑡)𝑐(𝑡)
= 𝑐2(𝑡)𝑏(𝑡) cos𝜔𝑡 + 𝑐(𝑡)𝑛(𝑡) (3.9)
So with coherent demodulation, we have that
�̂�(𝑡) = 𝑐2(𝑡)
2𝑏(𝑡)[1 + cos2𝜔𝑡] + 𝑛(𝑡)𝑐(𝑡)𝑐𝑜𝑠𝜔𝑡 (3.10)
Assuming c(t) is an antipodal signal (i.e. c(t) = ±1), and applying a low-pass filter to remove
the double frequency (2ω) reduces the last expression to give

41
𝑏 (𝑡) = 𝑏(𝑡)
2 ± 𝑛(𝑡)𝑐𝑜𝑠𝜔𝑡 (3.11)
Since n(t) is a random noise, passing this signal through an integrator will help in suppressing
the second term for a recovery of the original data.
For initial testing, a few random bits were BPSK-modulated, encoded with Gold codes and
then transmitted through the noisy channel at a signal-to-noise ratio (SNR) of 10 dB.
Recovered output bit streams were then examined visually for errors. In addition, scatter
plots (Fig. 3.10) of received data bits were generated. Because of noise, it is expected that
the received data bits should scatter (cluster) around ideal BPSK constellation points. Fig.
3.10 confirmed this to be the case. In addition, because of the value of the SNR (10 dB) used
for the simulation, it is expected that data bits should be recovered without errors.
Simulation results confirmed this to be the case: in every case, all the data bits were
recovered without errors.
Following the initial testing with a few random bits, the binary information stream was
increased to a hundred bits, after which the transmission process was repeated for different
values of SNR. Fig. 3.11 shows the scatter plots of received data for SNR values of 20, 10, 0,
-10 and -20 dB. It is expected that as SNR decreases, the received data bits should scatter
further away from ideal BPSK constellation points (±1). These results confirm this. In
addition, it is expected that as SNR goes down, errors should creep into the recovered bit
streams. Simulation results confirmed this to be the case, as shown by Table 3.3. This table
shows that as SNR decreases, BER worsens.

42
(a)
(b)
(c)
(d)
Fig. 3.10. Scatter plots for signal transmission through a noisy Gaussian channel at an SNR of 10 dB for (a) 4-
bit (b) 6-bit (c) 8-bit and 10-bit data.

43
(a)
(b)
(c)
(d)
(e)
Fig. 3.11. Scatter plots for a 100-bit data transmitted through the noisy Gaussian channel at an SNR of (a) 20
dB (b) 10 dB (c) 0 dB (d) -10 dB and (e) -20 dB.

44
Table 3.3. Measured bit-error rate for transmission of 100 bits through the noisy channel
SNR (dB) Bits received in error BER
20 0 0
10 0 0
0 0 0
-10 2 0.0200
-20 27 0.2700
3.7 Chapter summary
This chapter began with an overview of spreading sequences and code selection process for
the proposed communication system. This was followed by an account of software
simulations carried on m-sequences and Gold codes. The simulations involved generation of
the codes, and experimentation on their correlation properties. Gold codes were selected in
preference to other spreading sequences because of their favourable correlation properties.
Added to this is the fact that large number of Gold codes can easily be generated for multiple-
access applications. This chapter also initiated the development and testing of the proposed
communication system. Signal transmission through a noisy channel for a baseband CDMA
system using the Gold codes as spreading sequences was modelled and tested. The work
reported in this chapter provides a foundation for the rest of this research work.

45
Chapter 4
4 Multiple-access performance of Gold codes in a DS-CDMA system
4.0 Introduction
In the previous chapter, an account of code selection process was given. The current chapter
investigated multiple-access performance of the class of code, the Gold codes, selected for
the development of the proposed communication system.
Spreading codes play critical role in determining the performance of spread-spectrum
systems. Code properties are known to be a cause of multiple-access interference (MAI), an
important limiting factor on the system performance. The significance of spreading codes
has made the search for better codes [80, 82, 85-94] and the mitigation of multiple-access
interference [95-105] important areas of research.
An aspect of such effort is the search for better orthogonal codes. For example in [104],
Chen Hsiao-Hwa, et al proposed the generation of perfectly orthogonal complementary codes
for the realisation of an interference-free code division multiple access (CDMA) system.
Although orthogonality is a desirable property, it does not in itself solve all the code-
associated problems of a spread-spectrum system. Orthogonal codes are excellent in
synchronous, but not in asynchronous environment, in which orthogonality is lost.
This chapter investigates the performance of an important class of code, the Gold codes, to
provide new insights on their properties for better system performance. The codes are
significant today not only in mobile wireless communication but also in satellite navigation.
They are used as spreading codes in Wideband code-division multiple-access (WCDMA)
system and as access codes in the global positioning system (GPS). They are also potential
candidates for emerging technologies like the space-time coded multicarrier CDMA system.
In this chapter, we investigate the performance of odd-degree and even-degree Gold codes in
a multi-user system, ranging from a few users to hundreds of users. The outcome of this

46
investigation shows that the odd-degree Gold codes are more resistant to multiple-access-
interference, thereby making them better suited than their even-degree counterparts for use in
multi-user systems.
A conference paper [144] based on research results of this chapter was presented by the
writer at the Global Wireless Summit Conference 2014, Aalborg, Denmark. A journal paper
[145] on the results has also been published in South-African Institute of Electrical
Engineers African Research Journal.
The rest of this chapter is organised as follows. In Section 4.1, the system model is
presented. Sections 4.2 - 4.4 give results of simulations of bit-error-rate performance of
even- and odd-degree Gold codes. Sections 4.5 – 4.7 deal with loading characteristics of the
codes, as a further test on their multiple-access performance. Section 4.8 concludes this
chapter with a summary.
4.1 System model
Consider a multi-user DS-CDMA system comprising K users, Fig. 4.1.
Fig. 4.1. Model of a multi-user DS-CDMA system
For this system, the received signal r(t) is a linear superposition of the signals for the users,
and is given by
𝑟(𝑡) = ∑∑𝐴𝛽𝑘𝑙𝑒𝑗𝛾𝑘𝑙
𝐿
𝑙=1
𝑐𝑘(𝑡 − 𝜏𝑘𝑙) 𝑏𝑘(𝑡 − 𝜏𝑘𝑙) 𝑐𝑜𝑠(𝜔𝑐(𝑡 − 𝜏𝑘𝑙) − 𝜃𝑘𝑙) + 𝑛(𝑡)
𝐾
𝑘=1
(4. 1)
where k is user index, l is path index, L is number of paths, βkl is path gain for user k and path
l, τkl is propagation delay, γkl is phase shift, ck is spreading code for user k, bk is binary data,

47
ωc is carrier frequency, t is time and n(t) is channel noise. Let user-1 be the reference user.
Assuming coherent demodulation, the receiver output z(m) for mth
bit during the bit duration
Tb of the user is given by
𝑧1(𝑚) = ∫ 𝑟(𝑡)𝑐1( ) cos𝜔𝑐𝑡 𝑑𝑡
(𝑚+1)𝑇𝑏
𝑚𝑇𝑏
= ∫ {∑ ∑𝐴𝛽𝑘𝑙𝑒𝑗𝛾𝑘𝑙
𝐿
𝑙=1
𝑐𝑘(𝑡 − 𝜏𝑘𝑙) 𝑏𝑘(𝑡 − 𝜏𝑘𝑙) 𝑐𝑜𝑠(𝜔𝑐(𝑡 − 𝜏𝑘𝑙) − 𝜃𝑘𝑙) + 𝑛(𝑡)
𝐾
𝑘=1
} 𝑐1( )cos𝜔𝑐𝑡 𝑑𝑡
(𝑚+1)𝑇𝑏
𝑚𝑇𝑏
= ∫ {∑𝐴𝛽1𝑙𝑒𝑗𝛾1𝑙𝑐1(𝑡 − 𝜏1𝑙)𝑏1(𝑡 − 𝜏1𝑙)𝑐𝑜𝑠(𝜔𝑐(𝑡 − 𝜏1𝑙) − 𝜃1𝑙)
𝐿
𝑙=1
} 𝑐1( ) cos𝜔𝑐𝑡 𝑑𝑡
(𝑚+1)𝑇𝑏
𝑚𝑇𝑏
+ ∫ {∑ ∑𝐴𝛽𝑘𝑙𝑒𝑗𝛾𝑘𝑙
𝐿
𝑙=1
𝑐𝑘(𝑡 − 𝜏𝑘𝑙) 𝑏𝑘(𝑡 − 𝜏𝑘𝑙) 𝑐𝑜𝑠(𝜔𝑐(𝑡 − 𝜏𝑘𝑙) − 𝜃𝑘𝑙)
𝐾
𝑘=2
} 𝑐1( ) cos𝜔𝑐𝑡 𝑑𝑡
(𝑚+1)𝑇𝑏
𝑚𝑇𝑏
+ ∫ 𝑛(𝑡)𝑐1( )cos 𝜔𝑐𝑡 𝑑𝑡
(𝑚+1)𝑇𝑏
𝑚𝑇𝑏
= 𝑧11 + 𝑧12 + 𝑧13 (4.2)
where
𝑧11 = ∫ {∑𝐴𝛽1𝑙𝑒𝑗𝛾1𝑙𝑐1(𝑡 − 𝜏1𝑙)𝑏1(𝑡 − 𝜏1𝑙)𝑐𝑜𝑠(𝜔𝑐(𝑡 − 𝜏1𝑙) − 𝜃1𝑙)
𝐿
𝑙=1
} 𝑐1( ) cos𝜔𝑐𝑡 𝑑𝑡
(𝑚+1)𝑇𝑏
𝑚𝑇𝑏
,
𝑧12 = ∫ {∑ ∑𝐴𝛽𝑘𝑙𝑒𝑗𝛾𝑘𝑙
𝐿
𝑙=1
𝑐𝑘(𝑡 − 𝜏𝑘𝑙) 𝑏𝑘(𝑡 − 𝜏𝑘𝑙) 𝑐𝑜𝑠(𝜔𝑐(𝑡 − 𝜏𝑘𝑙) − 𝜃𝑘𝑙)
𝐾
𝑘=2
}𝑐1( ) cos𝜔𝑐𝑡 𝑑𝑡
(𝑚+1)𝑇𝑏
𝑚𝑇𝑏
and
𝑧13 = ∫ 𝑛(𝑡)𝑐1( )cos 𝜔𝑐𝑡 𝑑𝑡
(𝑚+1)𝑇𝑏
𝑚𝑇𝑏
(4. 3)
z11 represents the desired signal for the reference user, z12 is interference term, and z13 is
noise term.
Definition
Let the code length N = 2n -1. Gold code is said to be an odd-degree code if n is odd; and an
even-degree code if n is even. For example,
if n = 5, the code is odd-degree, and N = 25 -1 = 31;
if n = 6, the code is even-degree, and N = 26 -1 = 63.

48
4.2 Software simulations
For the present investigation, Gold codes were generated for degree n = 5, 6, …,12,
corresponding to the code length N = 31, 63, 127, 255, 511, 1023, 2047 and 4095
respectively. The codes were obtained from appropriate combinations of preferred pairs of
m-sequences (Table 4.1).
Table 4.1. Generator polynomials for the Gold codes
n 𝑃𝑖𝑛(𝑥)
*Generator polynomial N
5 𝑃15(𝑥) 𝑥5 + 𝑥2 + 1 31
𝑃25(𝑥) 𝑥5 + 𝑥4 + 𝑥3 + 𝑥2 + 1
6 𝑃16(𝑥) 𝑥6 + 𝑥5 + 1 63
𝑃26(𝑥) 𝑥6 + 𝑥5 + 𝑥4 + 𝑥 + 1
7 𝑃17(𝑥) 𝑥7 + 𝑥6 + 1 127
𝑃27(𝑥) 𝑥7 + 𝑥4 + 1
8 𝑃18(𝑥) 𝑥8 + 𝑥7 + 𝑥6 + 𝑥 + 1 255
𝑃28(𝑥) 𝑥8 + 𝑥7 + 𝑥5 + 𝑥3 + 1
9 𝑃19(𝑥) 𝑥9 + 𝑥5 + 1 511
𝑃29(𝑥) 𝑥9 + 𝑥8 + 𝑥7 + 𝑥2 + 1
10 𝑃110(𝑥) 𝑥10 + 𝑥7 + 1 1023
𝑃210(𝑥) 𝑥10 + 𝑥9 + 𝑥8 + 𝑥5 + 1
11 𝑃111(𝑥) 𝑥11 + 𝑥9 + 1 2047
𝑃211(𝑥) 𝑥11 + 𝑥10 + 𝑥9+𝑥7 + 1
12 𝑃112(𝑥) 𝑥12 + 𝑥11 + 𝑥10 + 𝑥4 + 1 4095
𝑃212(𝑥) 𝑥12 + 𝑥11 + 𝑥10 + 𝑥2 + 1
*𝑃1𝑛(𝑥) and 𝑃2
𝑛(𝑥) are the generator polynomials of the preferred pair used for obtaining corresponding set of Gold codes of degree n.
Software simulations were carried out for the transmission of random QPSK symbols for
uncoded as well as coded data transmission, through a Gaussian channel of zero mean and
unit variance Gaussian noise. The deployment of a Gaussian channel, as opposed to the use
of a fading channel, is beneficial to prevent channel fading from obscuring certain important
deductions. Following signal recovery, original transmitted data was compared with
recovered data for the determination of system bit-error-rate for the various sets of codes. The
simulations for the various code lengths were carried out simultaneously during the same
simulation session, thereby ensuring consistency of simulation conditions. Results of the
simulations will now be examined, starting with odd-degree Gold codes.
4.3 Performance of odd-degree Gold codes
This section presents results of simulations that were carried out for a single as well as
multiple users.

49
4.3.1 Performance for a single user
Here we consider simulation results for a single user, Fig. 4.2. The right-most curve on this
figure is that of uncoded data transmission for a single user. The figure shows close
agreement between analytic and simulation results for the uncoded data transmission. An
analytic result is obtained by direct implementation of an analytic expression; simulation
result is obtained by sending random data through the channel, and then counting the number
of bits in error at the receiving end. For the uncoded data transmission, the analytic equation
for the BER is: 𝐵𝐸𝑅 = 𝑄 (√2 (𝐸𝑏
𝑁0)), where Q is q-function, and Eb/N0 is bit-energy-per-
noise ratio. For reference purposes, this curve will be retained on all results to be presented
in this thesis. The rest of the curves on Fig. 4.2 show the performance for coded data
transmission for different code lengths.
Clearly, Fig. 4.2 shows that longer Gold codes give better error-rate performance. The figure
also shows that the use of Gold codes brings about some coding gain. With reference to
uncoded data transmission, at a BER of 10-4
, the Gold codes provide coding gain of about
15.6, 21.7, 27.8 and 33.9 dB when N = 31, 127, 511 and 2047, respectively. From this we see
that there is a constant 6.1-dB-step in coding gain between adjacent code lengths, which can
be explained in terms of the ratio of the process gain of the codes.
It should be noted that the penalty for the coding gain obtained from the use of Gold codes is
increase in bandwidth requirements. Each 6-dB improvement in coding gain corresponds to
quadrupling of the bandwidth.
4.3.2 Performance for two to five users
Next, we shall consider the results for a few multiple users. Figs. 4.3 to 4.5 show BER for
two, three and five users respectively. A look at these figures shows that increase in number
of interferers worsens the system BER. That is, MAI worsens with increasing system load.
The results show, for example, that for the code length N = 31 chips, at an SNR of -5 dB,
BER is 1.1 x 10⁻³
for a single user, 2.1 x 10⁻²
for two users, 4.9 x 10⁻²
for three users and 1.1 x
10-1
for five users. The BERs for the other code lengths (N = 127, 511 and 2047) show a
similar trend.

50
Fig. 4.2. Bit-error-rate for a single user
4.3.3 Performance for higher number of users
We shall now consider simulation results for higher numbers of users. Figs. 4.6 to 4.11 show
the BER for 10, 15, 20, 25, 30 and 33 users respectively. As with the previous results, these
figures show that as the number of users increase, the system BER becomes worse, resulting
from increasing MAI. For the code length N = 31 chips, for example, the results show that at
an SNR of 8 dB, BER is 3.13 x 10⁻⁴
for a ten users, 6.98 x 10⁻⁴
for 15 users, 2.94 x 10⁻³
for 20
users, 7.71 x 10⁻³
for 25 users,1.45 x 10-2
for 30 users and 1.92 x 10⁻²
for 33 users. Because
of the MAI, obtaining the same BER for a system involving a higher number of simultaneous
users requires higher SNR. For example for the 31-chip code, obtaining a BER of 10-4
requires an SNR of about -3.27 dB for a single user (Fig.4.2), 4.01 dB for five users (Fig.
4.3c), 7.28 dB for 10 users, 11.07 dB for 20 users and 14.32 dB for 30 users (Figs 4.4a, c &
e).
-30 -20 -10 0 10 20 30 40
10-4
10-3
10-2
10-1
100
SNR (dB)
BE
R
CDMA in AWGN channel for 1 users
uncoded (analytic)
uncoded (simulation)
N = 31
N = 127
N = 511
N = 2047

51
Fig. 4.3. Bit-error-rate for two users
Fig. 4.4 Bit-error-rate for three users
-30 -20 -10 0 10 20 30 40
10-4
10-3
10-2
10-1
100
SNR (dB)
BE
R
CDMA in AWGN channel for 2 users
uncoded (analytic)
uncoded (simulation)
N = 31
N = 127
N = 511
N = 2047
-30 -20 -10 0 10 20 30 40
10-4
10-3
10-2
10-1
100
SNR (dB)
BE
R
CDMA in AWGN channel for 3 users
uncoded (analytic)
uncoded (simulation)
N = 31
N = 127
N = 511
N = 2047

52
Fig. 4.5 Bit-error-rate for five users.
Fig. 4.6 Bit-error-rate for ten users
-30 -20 -10 0 10 20 30 40
10-4
10-3
10-2
10-1
100
SNR (dB)
BE
R
CDMA in AWGN channel for 5 users
uncoded (analytic)
uncoded (simulation)
N = 31
N = 127
N = 511
N = 2047
-30 -20 -10 0 10 20 30 40
10-4
10-3
10-2
10-1
100
SNR (dB)
BE
R
CDMA in AWGN channel for 10 users
uncoded (analytic)
uncoded (simulation)
N = 31
N = 127
N = 511
N = 2047

53
Fig. 4.7 Bit-error rate for 15 users.
Fig. 4.8. Bit-error-rate for 20 users
-30 -20 -10 0 10 20 30 40
10-4
10-3
10-2
10-1
100
SNR (dB)
BE
R
CDMA in AWGN channel for 15 users
uncoded (analytic)
uncoded (simulation)
N = 31
N = 127
N = 511
N = 2047
-30 -20 -10 0 10 20 30 40
10-4
10-3
10-2
10-1
100
SNR (dB)
BE
R
CDMA in AWGN channel for 20 users
uncoded (analytic)
uncoded (simulation)
N = 31
N = 127
N = 511
N = 2047

54
Fig. 4.9 Bit-error-rate for 25 users
Fig. 4.10. Bit-error-rate for 30 users
-30 -20 -10 0 10 20 30 40
10-4
10-3
10-2
10-1
100
SNR (dB)
BE
R
CDMA in AWGN channel for 25 users
uncoded (analytic)
uncoded (simulation)
N = 31
N = 127
N = 511
N = 2047
-30 -20 -10 0 10 20 30 40
10-4
10-3
10-2
10-1
100
SNR (dB)
BE
R
CDMA in AWGN channel for 30 users
uncoded (analytic)
uncoded (simulation)
N = 31
N = 127
N = 511
N = 2047

55
Fig. 4.11 Bit-error-rate for 33 users
4.3.4 Observations
The simulation results that have just been presented confirm that as the number of users
increases, the system BER becomes worse. This is consistent with expectation because
increasing the number of simultaneous users implies higher MAI. However, a closer look at
the results reveals that the simulation results have some surprises, explained as follows.
As the number of users increase, system BER is expected to degrade faster for shorter Gold
codes. A reason for this is that shorter codes have higher peak cross-correlation coefficients,
Table 4.2. Also, by the virtue of their length, shorter codes approach full-load condition
earlier than longer codes.
-30 -20 -10 0 10 20 30 40
10-4
10-3
10-2
10-1
100
SNR (dB)
BE
R
CDMA in AWGN channel for 33 users
uncoded (analytic)
uncoded (simulation)
N = 31
N = 127
N = 511
N = 2047

56
Table 4.2. Peak cross-correlation of Gold codes*
n N t(n) t(n)/φ(0)
3 7 5 0.7143
4 15 9 0.6000
5 31 9 0.2903
6 63 17 0.2698
7 127 17 0.1339
8 255 33 0.1294
9 511 33 0.0646
10 1023 65 0.0635
11 2047 65 0.0318
12 4095 129 0.0315 *In the last column, peak cross-correlation function, t(n), for Gold
code sequence is normalised by peak autocorrelation function φ(0).
Apart from this, for any given code length, BER is expected to increase rapidly as full-load is
approached. For example, the BER for a 31-chip Gold code is expected to increase rapidly,
to flatten out horizontally, and to exhibit an error floor as the number of users approaches 31.
In connection with this, the slopes of the BER curves for different code lengths are expected
to become increasingly different when the number of users increases. In contrast, the
simulation results give no indication of this: even under full load, the 31-chip Gold code does
not show any error floor or system saturation.
As a consequence of the difference in rate of degradation of BER with increasing number
users, coding gains between BER curves of adjacent code lengths are expected to become
increasingly unequal, as opposed to a single-user case, where the coding gain is constant. In
contrast to this, the simulation results show no significant difference in coding gain between
BERs of adjacent code lengths. The set of curves appear to maintain similar slopes at high
SNR, with no visible difference in their coding gain.
The following are likely explanations for these surprising results:
Selected reference user. Any set of Gold codes comprises N+2 members. Two of
these represent the preferred pair of m-sequences from which the remaining members
are derived. In every instance of the current investigation, one of the preferred pairs
was used for the encoding (and the decoding) of the data stream of the reference user.
Hence, the outcome of the simulation indicates that the preferred pair has low cross-
correlation with the rest of the code set.

57
Peak correlation coefficient. Peak correlation coefficient (Table 4.2) only gives the
peak value that the correlation function of a Gold code could have, but not the
frequency of occurrence or the distribution of the peaks. If the peak value happens to
be few and sparsely distributed for a particular code set, its degrading effect on MAI
may not be very significant.
Bipolarity of Gold codes. Gold codes are bipolar codes, being +1 at one instant, and
-1 at another. The same fact applies to the cross-correlation coefficients of the codes.
As a result, there is the possibility of interference from one user cancelling out that of
another. If a code set happens to be well-behaved, the mutual cancelling of the
interference from offending users might turn out to enhance the system BER
performance.
Synchronisation. For this simulation, perfect synchronisation was assumed, and this
might be a factor.
At first sight, the absence of error floor even when the system was heavily loaded raises a
question on the validity of the simulation results. Regarding this, further investigation
reveals that the outstanding performance is peculiar to the sets of Gold codes that have just
been considered. Additional results show that some other sets of Gold codes lack such
excellent performance. Fig. 4.12 and 4.13 shows examples of these. These codes exhibited
error floor and system saturation when the system was significantly loaded The inferior
performance of this set of codes forms our next point of consideration.

58
Fig. 4.12. Samples of results showing inferior performance of some other sets of Gold codes.
-30 -20 -10 0 10 20 30 40
10-4
10-3
10-2
10-1
100
SNR (dB)
BE
R
CDMA in AWGN channel for 10 users
uncoded (analytic)
uncoded (simulation)
N = 63
N = 255
N = 1023
N = 4095
-30 -20 -10 0 10 20 30 40
10-4
10-3
10-2
10-1
100
SNR (dB)
BE
R
CDMA in AWGN channel for 20 users
uncoded (analytic)
uncoded (simulation)
N = 63
N = 255
N = 1023
N = 4095

59
Fig. 4.13 Other samples of results showing inferior performance of some other sets of Gold codes.
-30 -20 -10 0 10 20 30 40
10-4
10-3
10-2
10-1
100
SNR (dB)
BE
R
CDMA in AWGN channel for 33 users
uncoded (analytic)
uncoded (simulation)
N = 63
N = 255
N = 1023
N = 4095
-30 -20 -10 0 10 20 30 40
10-4
10-3
10-2
10-1
100
SNR (dB)
BE
R
CDMA in AWGN channel for 60 users
uncoded (analytic)
uncoded (simulation)
N = 63
N = 255
N = 1023
N = 4095

60
4.4 Performance of even- versus odd-degree codes
Here we consider results of further investigation relating to the performance of the codes, for
simulations involving both even- and odd-degree codes. We shall adopt a treatment similar
to that used in section 4.3, beginning with e results for a single user.
4.4.1 Performance for a single user
Fig. 4.14 shows performance for a single user. Clearly as expected, this figure shows that
longer Gold codes give better error-rate performance. The figure also shows that with
reference to the uncoded data transmission, at a BER of 10-4
, the codes provide coding gain
of about 14.8, 17.4, 20.6, 23.8, 26.9 and 29.9 dB when N = 31, 63, 127, 255, 511 and 1023
respectively. This gives a constant coding gain of about 3.03 dB-step between adjacent code
lengths, which is in line with the spreading factors of the codes.
Fig. 4.14. Performance for a single user
4.4.2 Performance for a few multiple users
We shall now consider the results for multiple users. Figs. 4.15 to 4.18 show BER for two to
five users respectively. A look at these figures shows that for all the code lengths, increase in
number of users results in decibel loss. For example, the figures show that for N = 31,
maintaining a BER of 10-4
requires an SNR of -0.25, 1.60, 2.95 and 3.94 dB for two, three,
-30 -20 -10 0 10 20 30 40
10-4
10-3
10-2
10-1
100
SNR (dB)
BE
R
CDMA in AWGN channel for 1 users
uncoded (analytic)
uncoded (simulation)
N = 31
N = 63
N = 127
N = 255
N = 511
N = 1023

61
four and five users respectively. With reference to a single user (Fig. 4.14), this is equivalent
to a decibel loss of 3.24, 5.09, 6.44 and 7.43 dB respectively. This performance loss is
expected, in connection with elevated multiple-access interference (MAI) resulting from
increase in number of interferers.
In addition to the general trend, a close look at the figures show that the rate of performance
degradation is higher for the code length N = 63. This is noticeable on Figs. 4.16 to 4.18 for
three to five users respectively, which shows the curve for N = 63 suffering higher decibel
losses than those of other code lengths. Its graph for four users is seen to cross over that of N
= 31, and worse still for five users. This behaviour was initially not expected. The
significance of this seeming artefact will become obvious as we consider the system
performance for higher number of users.
Fig. 4.15. Bit-error-rate for two users
-30 -20 -10 0 10 20 30 40
10-4
10-3
10-2
10-1
100
SNR (dB)
BE
R
CDMA in AWGN channel for 2 users
uncoded (analytic)
uncoded (simulation)
N = 31
N = 63
N = 127
N = 255
N = 511
N = 1023

62
Fig. 4.16. Bit-error-rate for three users
Fig. 4.17. Bit-error-rate for four users
-30 -20 -10 0 10 20 30 40
10-4
10-3
10-2
10-1
100
SNR (dB)
BE
R
CDMA in AWGN channel for 3 users
uncoded (analytic)
uncoded (simulation)
N = 31
N = 63
N = 127
N = 255
N = 511
N = 1023
-30 -20 -10 0 10 20 30 40
10-4
10-3
10-2
10-1
100
SNR (dB)
BE
R
CDMA in AWGN channel for 4 users
uncoded (analytic)
uncoded (simulation)
N = 31
N = 63
N = 127
N = 255
N = 511
N = 1023

63
Fig. 4.18 Bit-error-rate for five users
We shall now consider simulation results for higher numbers of users. Figs. 4.19 to 4.22
show the BER for six to nine users. As with the previous results, a look at these figures
shows degradation in performance when the number of users increases: the BER curves for
all the code lengths shifts to the right, implying decibel loss, which in turn indicates
worsening BER.
However, another look at Figs. 4.19 to 4.22 shows that as the number of users increases, the
performance for N = 63 degrade quite rapidly if compared with other code lengths. The
graph (for N = 63) is seen to continue its crossing-over behaviour, culminating in the
emergence of an error floor. The results show that the 63-chip code has a worse performance
than its shorter 31-chip counterpart, which is not expected. More will be said about this later.
Another look at Figs. 4.19 to 4.22 shows that the performance for N = 255 is following the
trend observed for N = 63. This will become more obvious as we consider the results for
higher number of users.
-30 -20 -10 0 10 20 30 40
10-4
10-3
10-2
10-1
100
SNR (dB)
BE
R
CDMA in AWGN channel for 5 users
uncoded (analytic)
uncoded (simulation)
N = 31
N = 63
N = 127
N = 255
N = 511
N = 1023

64
Fig. 4.19 Bit-error-rate for six users
Fig. 4.20 Bit-error-rate for seven users
-30 -20 -10 0 10 20 30 40
10-4
10-3
10-2
10-1
100
SNR (dB)
BE
R
CDMA in AWGN channel for 6 users
uncoded (analytic)
uncoded (simul)
N = 31
N = 63
N = 127
N = 255
N = 511
N = 1023
-30 -20 -10 0 10 20 30 40
10-4
10-3
10-2
10-1
100
SNR (dB)
BE
R
CDMA in AWGN channel for 7 users
uncoded (analytic)
uncoded (simul)
N = 31
N = 63
N = 127
N = 255
N = 511
N = 1023

65
Fig. 4.21 Bit-error-rate for eight users
Fig. 4.22 Bit-error-rate for nine users
-30 -20 -10 0 10 20 30 40
10-4
10-3
10-2
10-1
100
SNR (dB)
BE
R
CDMA in AWGN channel for 8 users
uncoded (analytic)
uncoded (simul)
N = 31
N = 63
N = 127
N = 255
N = 511
N = 1023
-30 -20 -10 0 10 20 30 40
10-4
10-3
10-2
10-1
100
SNR (dB)
BE
R
CDMA in AWGN channel for 9 users
uncoded (analytic)
uncoded (simula)
N = 31
N = 63
N = 127
N = 255
N = 511
N = 1023

66
4.4.3 Performance for higher number of users
We shall now consider simulation results for higher numbers of users. Figs. 4.23 to 4.28
show the BER for ten to thirty users, in steps of five. As with the previous results, these
figures show that as the number of users increase, all the codes suffer loss in performance.
More importantly however is the BER for N = 63, which can be seen to degrade at an
alarming rate, such that for 30 users, its performance has basically flattened out to a BER of
about 0.5. The BER for N = 255 can also be seen to follow a similar trend. In addition, a
close look at the figures indicates that BER for N = 1023 is following the same behaviour.
Therefore we can expect that with further increase in number of users, the BER for N = 255
and N = 1023 will develop error floors, and ultimately system saturation, of the kind that we
now see for N = 63.
Fig. 4.23. Bit-error rate for 10 users
-30 -20 -10 0 10 20 30 40
10-4
10-3
10-2
10-1
100
SNR (dB)
BE
R
CDMA in AWGN channel for 10 users
uncoded (analytic)
uncoded (simul)
N = 31
N = 63
N = 127
N = 255
N = 511
N = 1023

67
Fig. 4.24. Bit-error rate for 15 users
Fig. 4.25. Bit-error rate for 20 users
-30 -20 -10 0 10 20 30 40
10-4
10-3
10-2
10-1
100
SNR (dB)
BE
R
CDMA in AWGN channel for 15 users
uncoded (analytic)
uncoded (simul)
N = 31
N = 63
N = 127
N = 255
N = 511
N = 1023
-30 -20 -10 0 10 20 30 40
10-4
10-3
10-2
10-1
100
SNR (dB)
BE
R
CDMA in AWGN channel for 20 users
uncoded (analytic)
uncoded (simul)
N = 31
N = 63
N = 127
N = 255
N = 511
N = 1023

68
Fig. 4.26. Bit-error rate for 25 users
Fig. 4.27. Bit-error rate for 30 users
-30 -20 -10 0 10 20 30 40
10-4
10-3
10-2
10-1
100
SNR (dB)
BE
R
CDMA in AWGN channel for 25 users
uncoded (analytic)
uncoded (simul)
N = 31
N = 63
N = 127
N = 255
N = 511
N = 1023
-30 -20 -10 0 10 20 30 40
10-4
10-3
10-2
10-1
100
SNR (dB)
BE
R
CDMA in AWGN channel for 30 users
uncoded (analytic)
uncoded (simul)
N = 31
N = 63
N = 127
N = 255
N = 511
N = 1023

69
Fig. 4.28 Bit-error rate for 31 users.
4.4.4 Deductions
The simulation results that have just been presented confirm that, generally, the system BER
becomes worse when the number of simultaneous users increases, which is expected.
However, the sharp difference in the rate of degradation for different code lengths demands
some consideration. Being from the same family, all the codes would normally be expected
to exhibit similar behaviour. In contrast, the simulation results showed that this is not the
case. An attempt is hereby made as follows to explain this situation.
Compared to other code lengths, the simulation results show that the BER for N = 63 degrade
more rapidly when the number of users increases. This resulted in early emergence of an
error floor for the code length, ultimately resulting in premature system saturation. The
results also give good indication that N = 255 and N = 1023 have similar behaviour. Now,
these three sets of codes are even-degree codes (n even). This implies that this behaviour is
peculiar to even-degree Gold codes.
-30 -20 -10 0 10 20 30 40
10-4
10-3
10-2
10-1
100
SNR (dB)
BE
R
CDMA in AWGN channel for 31 users
uncoded (analytic)
uncoded (simul)
N = 31
N = 63
N = 127
N = 255
N = 511
N = 1023

70
In contrast to the above, the simulation results show that BER for N = 31, 127 and 511
exhibited relatively marginal degradation in performance when the system was loaded. The
codes suffered less dB-loss, and maintained their steep, high-SNR slopes regardless of
elevated number of users. Now, these set of codes are odd-degree codes (n odd), meaning that
the positive characteristics are peculiar to odd-degree Gold codes. Hence, we conclude that
in a multi-user environment, odd-degree Gold codes have better BER performance than even-
degree Gold codes. An implication of this is that the odd-degree Gold codes have better
cross-correlation properties than their even-degree counterparts.
There is a further observation on the present discourse. Ordinarily for a given family of
spreading codes, a longer code is expected to give better performance than a shorter code. In
contrast, the simulation results show that when the number of users is four or more, 63-chip
Gold codes give progressively worse performance than 31-chip Gold codes. The same
pattern is noticeable among the remaining even- and odd-degree codes. Thus we conclude
that a longer code will not necessarily give a better performance.

71
4.5 Loading characteristics of even-degree Gold codes
The on-going examination of the performance of the Gold codes was further investigated by
considering the loading characteristics of a complete set of codes for each degree or code
length. The code set for each degree was subjected to loading, from light to heavy loading.
The outcome of the investigation is presented as follows, starting with even-degree codes, for
n = 6, 8 and 10, corresponding to code length N = 63, 255 and 1023 respectively.
4.5.1 Performance of degree-6 Gold codes
Fig. 4.29 shows the simulation results for degree-6 Gold codes. This figure shows that as the
number of users increases, the system BER becomes worse. Furthermore, when full-load is
approached, the rate of the performance degradation becomes rapid, resulting in emergence
of an error floor. This behaviour is expected, in connection with increase in multiple-access
interference (MAI) when the number of users increases. As at 10 users (about one-sixth full-
load), the performance can be seen to flatten out to a BER of about 10-1
.
4.5.2 Performance of degree-8 Gold codes
We shall now consider simulation results for degree-8 Gold codes, which corresponds to N =
255. Fig. 4.30 shows the results. As with the previous figure, this figure shows that BER
becomes worse when the number of users increases, ultimately resulting in emergence of an
error floor. However, comparing Fig. 4.29 with Fig. 4.30 shows that the 255-chip code is
able to support more users. This is in agreement with fundamental theory, the 255-chip code
being a longer code. Whereas only 10 users cause the BER of a 63-chip code to flatten out to
a BER of 10-1
, it takes about 100 users (two-fifth full-load) to make the performance a 255-
chip code to degrade to the same BER.
4.5.3 Performance of degree-10 Gold codes
We shall now consider simulation results for degree-10 Gold codes, which corresponds to N
= 1023. Fig. 4.31 shows the results for the codes. A look at this figure shows a behaviour
similar to that observed in the other even-degree codes that have just been considered. There
is degradation in BER, resulting in emergence of an error floor when number of users is
elevated. For the 1023-chip codes however, the results show that it takes about 500 users
(about half full-load) for the BER to degrade to about 10-1
.

72
Fig. 4.29. Performance of degree-6 Gold codes
Fig. 4.30 Performance of degree-8 Gold codes
-30 -20 -10 0 10 20 30 40
10-4
10-3
10-2
10-1
100
SNR (dB)
BE
R
BER for 63-chip Gold code
uncoded (analytic)
uncoded (simul)
1 users
3 users
5 users
10 users
20 users
30 users
40 users
60 users
65 users
-30 -20 -10 0 10 20 30 40
10-4
10-3
10-2
10-1
100
SNR (dB)
BE
R
BER for 255-chip Gold code
uncoded (analytic)
uncoded (simul)
1 users
3 users
5 users
10 users
20 users
40 users
100 users
150 users
257 users

73
Fig. 4.31 Performance of degree-10 Gold codes
4.6 Loading characteristics of odd-degree Gold codes
Having examined loading performance of even-degree codes, we shall now consider
simulation results for odd-degree Gold codes, for n = 5, 7 and 9, corresponding to code
length N = 31, 127 and 511 respectively.
4.6.1 Performance of degree-5 Gold codes
Here we consider simulation results for degree-5 Gold codes, Fig. 4.32. A look at this figure
shows that the performance of this code set is strikingly different from the ones that have just
been considered. The differences are enumerated as follows:
i. Performance degradation is not rapid but gradual for this current set of codes.
ii. When the system is heavily loaded, the codes maintain their high-SNR steep slope.
iii. There is no serious system saturation when the system is heavily loaded, even up to
full system load.
iv. For this code set, the BER performance curves exhibit no error floor.
-30 -20 -10 0 10 20 30 40
10-4
10-3
10-2
10-1
100
SNR (dB)
BE
R
BER for 1023-chip Gold code
uncoded (analytic)
uncoded (simul)
1 users
10 users
20 users
30 users
50 users
100 users
500 users
1000 users
1025 users

74
v. When fully loaded, the code performance is still as good as that of an uncoded, single-
user system.
The performance of this set of codes is surprisingly better than expected. We shall now
consider simulation results for other sets of odd-degree codes.
4.6.2 Performance of degree-7 and degree-9 Gold codes
Fig. 4.33 shows simulation results for degree-7 Gold codes. By comparing this figure with
the previous one, it is obvious that the two set of codes have similar performance
characteristics, enumerated in the previous subsection. The same behaviour can be seen in
Fig. 4.34 for degree-9 Gold codes. These indicate that the desirable behaviour is peculiar to
the odd-degree Gold codes.
Fig. 4.32 Performance of degree-5 Gold codes
-30 -20 -10 0 10 20 30 40
10-4
10-3
10-2
10-1
100
SNR (dB)
BE
R
BER for 31-chip Gold code
uncoded (analytic)
uncoded (simul)
1 users
2 users
3 users
4 users
5 users
10 users
20 users
30 users
33 users
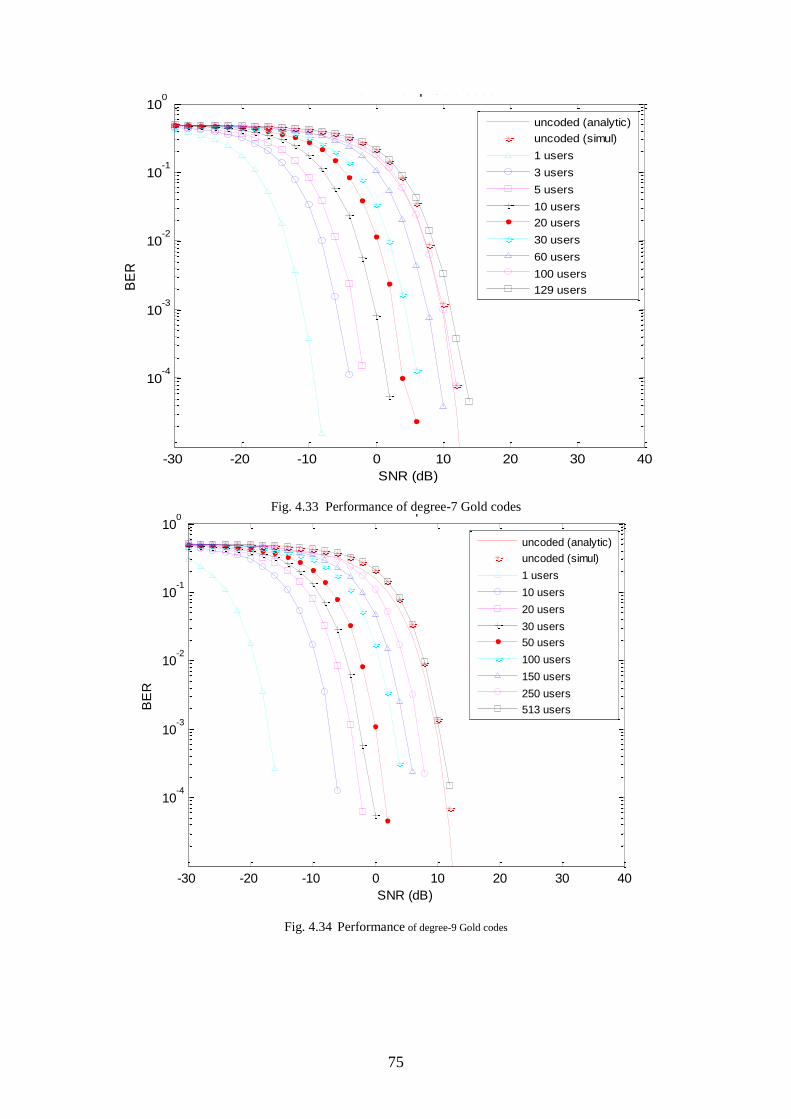
75
Fig. 4.33 Performance of degree-7 Gold codes
Fig. 4.34 Performance of degree-9 Gold codes
-30 -20 -10 0 10 20 30 40
10-4
10-3
10-2
10-1
100
SNR (dB)
BE
R
BER for 127-chip Gold code
uncoded (analytic)
uncoded (simul)
1 users
3 users
5 users
10 users
20 users
30 users
60 users
100 users
129 users
-30 -20 -10 0 10 20 30 40
10-4
10-3
10-2
10-1
100
SNR (dB)
BE
R
BER for 511-chip Gold code
uncoded (analytic)
uncoded (simul)
1 users
10 users
20 users
30 users
50 users
100 users
150 users
250 users
513 users

76
4.7 Chapter summary
This chapter investigated the performance of even- and odd-degree Gold codes in a multi-
user direct-sequence spread-spectrum system. The investigation entailed software
simulations for different sets of codes, ranging from 31-chip to 2047-chip Gold codes, from
light to heavy system loading, involving up to about a thousand simultaneous users. Results
of the investigation showed that odd-degree Gold codes have better multiple-access
performance than their even-degree counterparts. Whereas the latter exhibited error floor and
system saturation when the system was loaded, no such performance degradation was
noticeable in the former. The results suggest that odd-degree Gold codes are better suited for
multiple-access applications than their even-degree counterparts.

77
Chapter 5
5 Performance of a multicarrier CDMA system
5.0 Introduction
The previous chapter entails the performance of Gold codes using a direct sequence CDMA
system. The current chapter extends the treatment by introducing multi-carrier transmission,
to give a multicarrier CDMA system.
The significance of wireless communication in today’s technology cannot be over-
emphasised. It is one of the fastest-growing segments of modern technology. However,
many challenges remain in the design of wireless systems. One of this is performance
degradation due to channel fading. Diversity is known to be one of the best techniques for
mitigating the effects of fading, and is the main idea behind performance advantage provided
by a multicarrier CDMA system, which happens to be a focus of this chapter. This chapter
models the performance of a DS-CDMA system and a multicarrier CDMA system in
Rayleigh fading channels.
The rest of this chapter is organised as follows. Basic concepts on channel fading are
presented in Section 5.1, followed by fading models in Section 5.2. Section 5.3 and 5.4 give
an overview of diversity techniques and multicarrier CDMA respectively. Section 5.5
presents simulation results on the system performance in a Rayleigh fading channel. This
chapter concludes with a summary in Section 5.6.
5.1 Channel fading
In wireless communications, fading [146-148] refers to variation or loss in received signal
strength resulting from reflection or obstructions of the transmitted signal. Fading may vary
with time, geographical position or radio frequency. It may either be due to multi-path

78
propagation or shadowing from obstacles affecting the wave propagation. Multi-path
propagation originates from the presence of reflectors in the environment, creating multiple
signal paths. As a result, the receiver sees the superposition of multiple copies of the
transmitted signal coming from different paths. Each signal copy experience differences in
attenuation, phase shift and path delay while travelling from source to receiver. This can
cause interference, which is either constructive or destructive, amplifying or attenuating the
signal power seen at the receiver. Strong destructive interference is often referred to as a
deep fade and may result in temporary failure of communication due to a severe drop in
signal strength.
Depending on the rate of change of received signal strength, fading can either be slow-fading
or fast-fading, and is measured relative to channel coherence time. Coherence time is a
measure of the minimum time required for the magnitude change of the channel to become
uncorrelated from its previous value. Slow-fading arises when the coherence time of the
channel is large relative to the delay constraint of the channel. It describes a situation where
the channel impulse response varies at a rate much slower that the rate of change of the
transmitted signal. In this case, the time duration of a transmitted symbol Ts is small
compared with the channel coherent time Tc. Such a channel can be assumed to be time-
invariant over a number of symbol intervals. Slow fading can be caused by events such as
shadowing, where a large obstruction such as a hill or large building obscures the main signal
path between the transmitter and the receiver. Fast-fading occurs when the coherence time
of the channel is small relative to the time duration of transmitted symbol. In this regime, the
amplitude and phase change imposed by the channel varies considerably over the period of
use.
In a fast-fading channel, the transmitter may take advantage of the variations in the channel
conditions using time diversity to help increase robustness of the communication to a
temporary deep fade. In a slow-fading channel, it is not possible to use time diversity
because the transmitter sees only a single realization of the channel within its delay
constraint. A deep fade therefore lasts the entire duration of transmission and cannot be
mitigated using coding.
The coherence time of the channel is related to a quantity known as the Doppler spread,
which results from Doppler shift. Doppler spread refers to the difference in Doppler shifts

79
between different signal components. In general, coherence time Tc is inversely related to
Doppler spread Ds, typically expressed as 𝑇𝑐 ≈ 1 𝐷𝑠⁄ .
In terms of range of frequencies involved, fading can also be described as being frequency
non-selective or frequency-selective. In frequency non-selective fading, otherwise known as
flat-fading, the coherence bandwidth of the channel is larger than the signal bandwidth.
Therefore, all frequency components of the signal will experience the same magnitude of
fading. In frequency-selective fading, the coherence bandwidth of the channel is smaller
than the bandwidth of the signal. Different frequency components of the signal therefore
experience different degrees of fading. The coherence bandwidth measures the bandwidth
over which two frequencies of a signal are likely to experience comparable or correlated
amplitude fading.
5.2 Fading models
The wireless channel is a multipath channel. The channel impulse response h(t) can be
represented by
1
( ) ( )kl
Lj
k kl kl
l
h t e t
, (5.1)
where l is path index, L is number of paths, βl is path amplitude, τl is propagation delay and
γl, the phase shift. Interference among the multipath components results in fading.
Amplitude fading in a multipath environment follows different distributions depending on the
presence or absence of a dominating strong component, among other factors. In the absence
of a strong dominating component, the amplitude has a Rayleigh distribution (and hence
Rayleigh fading) with a probability density function (pdf) given by [2, 4, 5, 79]:
2
2 2( ) exp
2
r rP r
, 0r , (5.2)
where σ is the Rayleigh parameter. The mean and the variance of the distribution are √𝜋/2𝜎
and (2 −𝜋
2)𝜎2 respectively. If, in addition to low-level scattered paths, there is a strong
dominating path (e.g. a line-of-sight path), the amplitude follows Rician distribution, whose
pdf is given by [2, 4, 5, 79]:

80
2 2
2 2 2( ) exp
2o
r r v rvP r I
, 0r , (5.3)
where Io is zeroth-order modified Bessel function of the first kind, v is the magnitude of the
dominant component, and σ2 is proportional to the power of the scatter Rayleigh components.
The Rician parameter 𝐾 = 𝑣2
2𝜎2, represents the ratio of the power associated with the
dominant component and the scattered path components in the multipath channel [2, 4, 5, 79].
For a non-fading channel, the channel has an infinite bandwidth and the channel impulse
response is equal to a delta-dirac function, i.e. h(t) = δ(t) .
5.3 Diversity Techniques
Diversity can be achieved in time, frequency, or space [147, 148]. Time diversity is
achieved when different time slots are used to transmit identical message with the time
separation between different transmissions to ensure independent fade. This provides replicas
of the transmitted signal across time by a combination of channel coding and time
interleaving. In time diversity, the receiver suffers from time delay before receiving the
entire transmitted signal for onward processing. This time delay results in bandwidth
inefficiency.
Spatial diversity is implemented by using multiple antennas separated enough to ensure that
individual signals are uncorrelated. Spatial diversity may be receive or transmit diversity. In
receive diversity, multiple antennas are employed at the receive side, while in transmit
diversity, multiple antennas are deployed at the transmit side. Two other forms of spatial
diversity are polarization diversity and angular diversity. Angular diversity uses directional
antennas to achieve diversity, and it involves different versions of the sent signals being
collected from different angular directions. Polarization diversity method uses vertically and
horizontally polarized signals to achieve diversity. Polarization diversity does not require
separate location of the antenna but its diversity is limited to two.
In frequency diversity, different carrier frequencies are used to transmit identical messages.
To ensure independent fades across different replica of the transmitted signal, the carrier
frequencies must be separated by more than the coherence bandwidth of the channel.

81
5.4 Multicarrier CDMA
In a frequency-selective channel, since different frequency components of the signal are
affected independently, it is highly unlikely that all parts of the signal will be simultaneously
affected by a deep fade. A multicarrier (MC) CDMA systems take advantage of this fact to
employ frequency diversity to provide robustness to fading, and is one of the basis why
multicarrier modulation provides performance improvement to the wireless communication
system. Orthogonal frequency-division multiplexing (OFDM), as found in the MC-CDMA,
simply converts a frequency-selective channel into a parallel collection of flat-fading
channels. The sub-carriers (sub-channels) have the minimum frequency separation required
to make their time domain waveforms orthogonal while the signal frequency spectrum
corresponding to the different subcarriers overlap. As a result, the available bandwidth is
utilized more efficiently. In general, OFDM technique for wireless communication systems
has a high spectral efficiency compared with frequency division multiplexing (FDM) scheme.
In addition, it is very robust to selective fading and has a low computational complexity due
to the type of computational method with which it is implemented.
Orthogonal frequency division multiplexing (OFDM) is a class of multicarrier modulation in
which information is carried over many lower rate subcarriers. Modern version of OFDM
involves the use of fast Fourier transform, which helps in reducing implementation
complexity of the multi-carrier system. Considering that the complex symbols to be
transmitted in a P-subcarrier OFDM system with a pass bandwidth B are denoted
by (𝑋−𝑃 2⁄ , … , 𝑋−1, 𝑋1𝑋2, … , 𝑋𝑃) , one P-subcarrier OFDM symbol can be represented
mathematically by [149]
𝑠(𝑡) = { ∑ 𝑋𝑛𝑒𝑗2𝜋𝑓𝑘𝑡, 𝑓𝑜𝑟 𝑝𝑇 − 𝑇𝑤 − 𝑇𝑔 ≤ 𝑡 ≤ 𝑘𝑇 + 𝑇𝐹𝐹𝑇 + 𝑇𝑤 (5. 4)
𝑃 2⁄
𝑝=𝑃 2⁄ ,𝑘≠0
0 𝑜𝑡ℎ𝑒𝑟𝑤𝑖𝑠𝑒
where 𝑓𝑝 is the frequency of the pth subcarrier, 𝑇𝐹𝐹𝑇 = 𝑃𝑇𝑠 is the duration of the total number
of FFT-points, 𝑇𝑠 is the sampling rates, 𝑇𝑔 is the duration of the cyclic prefix, and 𝑇𝑤 is the
duration of the windowing. The transmitted OFDM signal can be demodulated by applying
inverse operations to (1.14) as
𝑥𝑝 =1
𝑇𝐹𝐹𝑇∫ 𝑠(𝑡)𝑒−2𝜋𝑓𝑝𝑡𝑑𝑡.
𝑇𝐹𝐹𝑇
𝑡=0
(5. 5)

82
FFT operation ensures that the generated subcarriers are orthogonal because each bin of an
IFFT corresponds to the amplitude and phase of a set of orthogonal sinusoid.
Although there are different variants of the multicarrier CDMA system [4-7, 9, 10, 74, 75,
109-124], all are based on the same principle, which is the breaking of the wideband signal
bandwidth into a set of parallel orthogonal frequency sub-channels.
5.5 Simulations results and discussion
Software simulations were carried out to investigate the performance of a DS-CDMA system
in a flat-fading Rayleigh channel as well as a MC-CDMA system in a frequency-selective
channel. Random QPSK symbols generated and transmitted through the channel using
different sets of Gold codes as spreading sequences. The influence of code length on the
system performance was investigated for a given number of tones and data rate. At the
receiving end, recovered data were compared to the original transmitted data for the
determination of bit-error-rate (BER). Parametric BER graphs were generated for the
evaluation of the system performance. Results of the simulations will now be presented as
follows.
5.5.1 Performance in a flat-fading channel
Here we shall be presenting the performance of a direct-sequence CDMA system in a flat-
fading channel. Multicarrier transmission is not used here for the simple reason that there is
no advantage in using multiple carriers in a flat-fading channel. (The essence of using
multicarrier transmission is to convert a frequency-selective channel to flat-fading channels.
Since the channel currently under consideration is flat-fading, the use of multi-carrier
transmission is not necessary.)
We shall now examine the performance of the DS-CDMA system in a Rayleigh flat-fading
channel for a sample frequency of 10 kHz and a maximum Doppler shift of 83.3 Hz. Fig. 5.1
shows the results for uncoded and coded data transmission for a single user. This figure
clearly shows the effects of channel fading on the system performance. It is obvious that the
system has worse BER in the flat-fading channel than in a Gaussian channel. Higher SNR
(or power) is required to obtain any given BER in the fading channel than in a Gaussain
channel. As with a Gaussian channel however, it can be seen that the use of Gold codes
provides better BER, if compared to uncoded data transmission. The codes provide constant

83
coding gain between adjacent code lengths. At a BER of 10-4
, the Gold codes provide coding
gain of about 11.0, 17.4 and 22.5 dB for N = 31, 127 and 511 respectively. This is equivalent
to a constant coding gain of about 5.75 dB between adjacent code lengths, which is just a
little less than that of a Gaussian channel. The results also show that a longer code gives
better error rate performance, though at the expense of increased transmission bandwidth.
Fig. 5.1 Performance for a single user in a flat-fading channel
Next, we shall examine results for multiple users in the flat-fading channel. Fig. 5.2 shows
BER for a particular user in the presence of another interfering user. It is easy to see the
degrading effects of fading on the system performance. Of particular interest is the
emergence of an error floor, a feature that is absent in a Gaussian channel. While it is true
that the presence of an interfering user and hence multiple-access interference (MAI) is a
factor in the emergence of the error floor, the results show that channel fading is more
responsible for it than does code properties. This is buttressed by the fact that in a Gaussian
channel, there was no error floor, even when the system was fully loaded (Chapter 4). This
can be compared to the present situation in which error floor appears even for only two users.
-30 -20 -10 0 10 20 30 40
10-4
10-3
10-2
10-1
100
SNR (dB)
BE
R
CDMA in flat-fading channel for 1 users
uncoded AWGN
uncoded flat-fading
N = 31
N = 127
N = 511
N = 2047

84
Hence, with a mitigation of the fading effect of the channel, it should be possible to get the
codes to perform significantly well as in a Gaussian channel.
It is noteworthy that the emergence of the irreducible error floor is delayed for longer codes.
Also the error floor is significantly less for longer codes. This is due to the fact that longer
codes have higher capacity for accommodating more users.
Fig. 5.2. Performance for two users in a flat-fading channel
We shall now examine results for higher number of users in the flat-fading channel. Fig. 5.3
and 5.4 show BER for three to six multiple users. Here again, effects of channel fading on
the system performance can be seen. Ignoring the error floor region, it can be seen that
coding gain between adjacent code lengths remains constant when the number of users is
elevated, which is similar to the behaviour observed for the codes in a Gaussian channel.
-30 -20 -10 0 10 20 30 40
10-4
10-3
10-2
10-1
100
SNR (dB)
BE
R
CDMA in flat-fading channel for 2 users
uncoded AWGN
uncoded flat-fading
N = 31
N = 127
N = 511
N = 2047

85
(a)
(b)
Fig. 5.3 . Performance in a flat-fading channel for (a) three and (b) four users
-30 -20 -10 0 10 20 30 40
10-4
10-3
10-2
10-1
100
SNR (dB)
BE
R
CDMA in flat-fading channel for 3 users
uncoded AWGN
uncoded flat-fading
N = 31
N = 127
N = 511
N = 2047
-30 -20 -10 0 10 20 30 40
10-4
10-3
10-2
10-1
100
SNR (dB)
BE
R
CDMA in flat-fading channel for 4 users
uncoded AWGN
uncoded flat-fading
N = 31
N = 127
N = 511
N = 2047

86
(a)
(b)
Fig. 5.4. Performance in a flat-fading channel for (a) five and (b) six users.
-30 -20 -10 0 10 20 30 40
10-4
10-3
10-2
10-1
100
SNR (dB)
BE
R
CDMA in flat-fading channel for 5 users
uncoded AWGN
uncoded flat-fading
N = 31
N = 127
N = 511
N = 2047
-30 -20 -10 0 10 20 30 40
10-4
10-3
10-2
10-1
100
SNR (dB)
BE
R
CDMA in flat-fading channel for 6 users
uncoded AWGN
uncoded flat-fading
N = 31
N = 127
N = 511
N = 2047

87
5.5.2 Performance in a frequency-selective channel
The system performance in a frequency-selective, Rayleigh channel was also modelled for a
MC-CDMA system. A four-path channel with constant path delays was assumed. Number
of subcarriers was kept fixed at 64. Table 5.1 shows the simulation parameters. Simulation
results for the MC-CDMA system will now be presented.
Table 5.1 Simulation parameters for the MC-CDMA system
Modulation type QPSK
Frame size 64 QPSK symbols
No. of subcarriers 64
Cyclic extension (25%) 16 symbols
Carrier frequency 900 MHz
Max Doppler shift 83.33 Hz
Sample Frequency 10 kHz
Number of paths 4
Path gains(dB) 0 -20 -30 -40
Path delays (μs) 0 1 5 10
Fig. 5.5 shows BER versus signal-to-noise ratio for a single user. There is no interfering
user. This curve clearly shows that in terms of BER, the system performance is better for
longer codes, which is expected. In the performance curves, the appearance of irreducible
error floor can be seen. This error floor cannot be attributed to MAI, as there is no interfering
user here. Rather, the error floor can be attributed to destructive interference originating from
multi-paths. This observation is important because it indicates that primarily, irreducible
error floor is not due to multiple-access performance of the codes, but channel fading. This
situation can be compared to that of a flat-fading (single-path) channel where there is no error
floor for a single user.
Another look at these results shows that for N = 31 and 127, the BER performance is worse
in a frequency-selective channel than in a flat-fading channel. The opposite is the case for N
= 511 and 2047. Among other things, the results show that for N = 31 and 127, error floor
emerges earlier in a frequency-selective channel than in a flat-fading channel. In addition,
the level of error floor is higher in the frequency-selective channel than in a flat-fading
channel.
Now turning to N = 511 and 2047, no error floor is visible up to the BER regions that was
considered by this work. While it is desirable to see the system performance in lower BER
regions, investigating this would require generating results for lower BER regions, but the

88
time required to run simulations for this makes it impracticable. For example, obtaining
results for a BER of 10-7
may require running the simulations continuously for about 700
days1, which is not feasible.
Fig. 5.5 Performance of a multicarrier CDMA system in a frequency-selective channel for a single user
It is useful to note that in Fig. 5.5, the error floor is notably reduced for longer codes. In fact,
for the BER range under consideration, the error floor cannot be seen for 511 and 2047 code
lengths. Another point of interest is the presence of diversity gain on the performance curves.
It can be seen that longer codes provides higher diversity gain. The origin of these desirable
features can be explained as follows. As we increase code length for a fixed data rate, chip
duration decreases. This increases transmission bandwidth, such that the signal is spread
over wider bandwidth. Since different frequency components of the signal are affected
independently, it is very unlikely that every part of the signal will be affected at the same
time by a deep fade. This frequency diversity makes longer codes more resilient to fading
1 The simulation results reported here involves a minimum BER of about 10-5, and the simulation took about a week (7 days) to run. Going
down to a BER of 10-7 requires processing hundred-fold the number of data samples for the BER of 10-5. This would therefore require the simulation running continuously for about 700 days, which is not practicable.
-30 -20 -10 0 10 20 30 40
10-4
10-3
10-2
10-1
100
SNR (dB)
BE
R
MC-CDMA in frequency-selective Rayleigh channel for 1 users
uncoded AWGN
uncoded flat-fading
N = 31
N = 127
N = 511
N = 2047

89
effects, thereby making the longer codes to give better BER, at the expense of wider
transmission bandwidth.
We shall now examine the performance of the multicarrier system for multiple users. Fig. 5.6
shows the BER for a particular user in the presence of an interfering user. It can be seen that
the system BER is slightly worse than when there was no interfering user, which obviously is
due to MAI. As expected, the results confirm again that longer Gold codes give better error
rate performance.
Fig. 5.7 (a) and (b) shows performance curves for four and five users. This also shows that
the MAI effect of interfering users is marginal. Furthermore, the results show that for
multiple users (five users in this case), the multicarrier CDMA in the frequency-selective
channel outperforms the DS-CDMA in a flat-fading channel.
Fig. 5.6 Performance of a multicarrier CDMA system in a frequency-selective channel in the presence of an
interfering user
-30 -20 -10 0 10 20 30 40
10-4
10-3
10-2
10-1
100
SNR (dB)
BE
R
MC-CDMA in frequency-selective Rayleigh channel for 2 users
uncoded AWGN
uncoded flat-fading
N = 31
N = 127
N = 511
N = 2047

90
(a)
(b)
Fig. 5.7 Performance in a frequency-selective channel for (a) four and (b) five users.
-30 -20 -10 0 10 20 30 40
10-4
10-3
10-2
10-1
100
SNR (dB)
BE
R
MC-CDMA in frequency-selective Rayleigh channel for 4 users
uncoded AWGN
uncoded flat-fading
N = 31
N = 127
N = 511
N = 2047
-30 -20 -10 0 10 20 30 40
10-4
10-3
10-2
10-1
100
SNR (dB)
BE
R
MC-CDMA in frequency-selective Rayleigh channel for 5 users
uncoded AWGN
uncoded flat-fading
N = 31
N = 127
N = 511
N = 2047

91
It might have been observed that results presented here for the fading channels are limited to
a few users. Reason for this is explained as follows. The simulation model for the system in a
fading channel is computationally intensive and takes long time to run. Sometimes, the
simulation has to run continuously for days before giving an output. The higher the number
of users, the longer the time required. Hence to minimise the time penalty, it was necessary
to limit the number of users to just a few.
5.6 Chapter Summary
This chapter presented results of simulations for the performance of the communication
system in a Rayleigh fading channel. The results show that in a flat-fading channel, the codes
provide a constant coding gain close to that obtainable in a Gaussian channel. The impact of
longer spreading codes is more pronounced for the MC-CDMA system in a frequency-
selective channel as indicated by significant lowering of error floors. Also, frequency
diversity associated with the use of longer codes coupled with multi-carrier modulation
makes the MC-CDMA system resilient to multi-path effects. In the next chapter, simulation
results on a space-time coded MC-CDMA system shall be presented.

92
Chapter 6
6 Space-time Coded Multi-carrier CDMA System
6.0 Introduction
Space-time coding (STC) is known to be an effective diversity technique for combating
channel fading without bandwidth penalty. STC combines transmit diversity with coding
scheme. This chapter models the performance of a multiple-antenna space-time coded multi-
carrier (MC) code-division multiple-access (CDMA) system.
Although significant amount of work has been done on space-time-coded MC-CDMA
systems, available literature shows that existing works have been largely limited to the use of
Walsh-Hadamard codes as spreading sequences, as confirmed by the following references
[11-62]. To the best of our knowledge, cases involving the use of Gold codes as spreading
sequences in space-time coded MC-CDMA systems are not common in literature. In this
chapter, we investigate the performance of Gold codes in a space-time block-coded CDMA
system.
Space-time coding is designed primarily for flat-fading channels. However, many wideband
wireless channels are frequency-selective in nature. Consequently, STC schemes cannot be
applied as-is to wideband systems. However, the combination of multi-carrier modulation
with CDMA removes this barrier. Multicarrier modulation, as found in orthogonal
frequency-division multiplexing (OFDM) converts a wideband frequency-selective channel
to a set of narrow-band, flat-fading channels, thereby giving the opportunity to use STC
schemes in broadband frequency-selective channels. In a MC-CDMA system, multiple-
access is achieved by having different users transmit on the same set of sub-carriers but with
different spreading sequences.

93
STC systems are multi-antenna systems. Therefore, Sections 6.1 to 6.3 gives basics of multi-
antenna systems. This is followed by fundamental theory on STC in Section 6.4 and 6.5.
Section 6.6 gives system description of a space-time coded MC-CDMA system. Section 6.7
develops a mathematical model of the communication system. Section 6.8 presents results
and discussion of software simulations that were carried out on the system performance. This
chapter concludes with a summary in Section 6.9.
6.1 MIMO systems
In. Multiple-input multiple-output (MIMO), which involves the use of multiple antennas at
both transmitter and receiver ends of wireless communication systems, has received attention
both from industries as well as from academic communities. On the other hand, OFDM
technique has emerged as a popular multi-carrier modulation technique to combat some
problems associated with physical properties of wireless channels such as multipath fading
and inter-symbol interference. The combination of MIMO technology with OFDM technique,
along with CDMA is a promising solution for future broadband wireless communication
systems. Amalgamation of these techniques is a potential means of increasing the throughput
and quality of service of future wireless communication.
In general, a MIMO system comprises nT transmit antennas and nR receive antennas.
Consequently, the system has a channel matrix H having nT x nR dimensions. Fig. 6.1 shows
a schematic diagram of a MIMO system.
...
1
x1
x2
2
1
...
2
y1
y2
𝑛𝑅𝑛𝑇
𝑥𝑛𝑇𝑦𝑛
Fig. 6.1. A MIMO system

94
Because of the advantages associated with the use of multiple antennas at both the transmitter
and the receive end of a communication system, MIMO systems have been an important
subject of modern research. Prominent among the advantages are diversity gain and
multiplexing gain [147, 148].
Diversity gain can be achieved with the aid of STC techniques. The deployment of STC
enables the transmission of the same data symbol from multiple transmit antennas. The
received data symbols, at each of the receive antennas, are superposition of all the transmitted
data symbols. As such, the receiver will detect the same transmitted data symbol several
times and at different antenna positions in space. As long as the fading for each transmission
link between a pair of transmit and receive antennas in the MIMO system can be assumed to
be independent of each other, the transmitted data symbols can be detected with higher
accuracy at the receiver of the MIMO system. In this way, the bit–error-rate (BER)
performance of the system can be significantly enhanced. The performance improvement is
referred to as diversity gain.
Multiplexing gain is achieved with the aid of spatial multiplexing techniques. The technique
involves simultaneous transmission of multiple streams of data symbols independently on
different transmit antennas, and received via different receive antennas. This increases the
data rate since instead of sending symbols via the same antenna serially, consecutive symbols
equal to the number of transmit antennas can be sent in parallel. Multiplexing gain refers to
this increase in data rate, and is obtained at no additional bandwidth expenditure. Whereas
achieving diversity gain only requires multiple antennas at either end of the communication
system, achieving multiplexing gain requires multiple antennas at both ends of the link.
6.2 MIMO channel model
Consider a MIMO communication system [147, 148] having 𝑛𝑇 transmit and 𝑛𝑅 receive
antennas as shown by Fig. 6.2. At time t, the signals 𝑥𝑡,𝑖, 𝑖 = 1,… , 𝑛𝑇 are simultaneously
transmitted from 𝑛𝑇 transmit antennas. Each transmitted signal is affected by channel fading,
and received at each of 𝑛𝑅 receive antennas. If we consider a flat-fading channel with the
channel gain hi,j between receive antenna j and transmit antenna i, then the received signal at
received antenna j at time t is given by

95
𝑟𝑡𝑗= ∑ℎ𝑖,𝑗𝑥𝑡,𝑖 + 𝜂𝑡,𝑗
𝑛𝑇
𝑖=1
, (6. 1)
where 𝜂𝑡,𝑗 is the additive Gaussian noise at the receiving antenna j at time t. Consider that
the channel is quasi-stationary, that is, the fading coefficients (or path gains) ℎ𝑖,𝑗 are constant
over a certain time period 𝑇′, and from period to period they are varied independently. The
rate of fading is determined by the value of 𝑇′. If the data block is transferred during the time
T < 𝑇′, the fading is said to be slow. In this case the coefficients ℎ𝑖,𝑗 are constant during the
entire transmission period. The signals transmitted during the time period T from 𝑛𝑇
transmitting antennas can be represented using a (𝑇 × 𝑛𝑇) matrix X given by
𝐗 = [
𝑥1,1 ⋯ 𝑥1,𝑛𝑇
⋮ ⋱ ⋮𝑥𝑇,1 ⋯ 𝑥𝑇,𝑛𝑇
]. (6.2)
Similarly, the received signal can be represented in the form of (𝑇 × 𝑛𝑅) − matrix R given
by
𝐑 = [
𝑟1,1 ⋯ 𝑟1,𝑛
⋮ ⋱ ⋮𝑟𝑇,1 ⋯ 𝑟𝑇,𝑛
] . (6.3)
...
1
x1
x2
2
1
...
2
r1
r2
𝑛𝑅𝑛𝑇
𝑥𝑛𝑇𝑟𝑛
MIMODecoder
MIMOEncoder
h11
h12
ℎ𝑛𝑇𝑛𝑇
SinkSource
Fig. 6.2. MIMO system with nT transmit and nR receive antennas

96
Assuming 𝑇 < 𝑇′ , such that the channel fading coefficient are constant during the
transmission period, the fading channel coefficients may also be written in the form of (𝑛𝑇 ×
𝑛𝑅) − matrix H given by
𝐇 = [
ℎ1,1 ⋯ ℎ1,𝑛
⋮ ⋱ ⋮ℎ𝑛𝑇,1 ⋯ ℎ𝑛𝑇,𝑛
]. (6.4)
.
Then, we can write (6.1) in matrix form as
𝑹 = 𝑯.𝑿 + 𝓝. (6.5)
where 𝓝 is noise matrix given by
𝓝 = [
𝜂1,1 ⋯ 𝜂1,𝑛
⋮ ⋱ ⋮𝜂𝑇,1 ⋯ 𝜂𝑇,𝑛
]. (6.6)
6.3 MIMO channel capacity
It has been shown in information-theoretical studies of wireless channels that MIMO channel
capacity is increased significantly compared to the capacity of single-input/single-output
(SISO) systems. Recently, researchers have actively engaged in an effort to exploit this new
potential of MIMO channel capacity.
Channel capacity can be defined as the maximum error-free data rate that a channel can
support. Claude Shannon in [146] derived the capacity of an AWGN channel as
𝐶 = 𝐵log2(1 + 𝛾), (6.7)
where B is channel bandwidth, and 𝛾 is the average received signal–to-noise-ratio (SNR).
The capacity of a deterministic SISO channel is given by [14]
𝐶 = log2(1 + 𝜌|𝐻|2), (6.8)
where
2H is the normalized channel power transfer characteristic and 𝜌 is the average SNR
at each receiver.
For a deterministic MIMO channel, the channel capacity is given by [147, 148]
𝐶 = log2 [de (𝐈nR+
𝜌
𝑛𝑇𝐇𝐇𝑯)],
(6.9)

97
while for an ergodic MIMO channel, the capacity is given by [146]
𝐶 = 𝐸H {𝐵 log2 [de (𝐈nR+
𝜌
𝑛𝑇𝐇𝐇𝑯)]}, (6.10)
where 𝐸𝐇 denotes expectation with respect to H, 𝐈nR is 𝑛𝑇 × 𝑛𝑅 identity matrix and det[A] is
the determinant of matrix A.
6.4 Spatial diversity
Fading can cause the effective SNR at the receiver of a communication system to drop
drastically thereby making reliable recovery of the transmitted signal impossible. The
inability of a communication system to recover the transmitted signal at the receiver, results
in loss of communication (outage) which is undesirable in any communication system.
Diversity is a technique used in MIMO systems to combat channel impairments by providing
replicas of the transmitted signal to the receiver, which fades independently. If the multiple
transmitted signals undergo independent fading, the probability that the entire transmitted
signal will undergo simultaneous deep fade is minimized. As a result, the probability of
outage is reduced in system employing spatial diversity. The diversity gain Gd is given as
[147, 148]
𝐺𝑑 = lim𝛾→∞𝑙𝑜𝑔(𝑃𝑒)
𝑙𝑜𝑔(𝛾) , (6.11)
where Pe is the error probability of the received signal and is the received SNR.
6.5 Space-time coding A key feature of MIMO systems is the ability to turn multi-path propagation, traditionally a
pitfall in wireless transmission into a benefit for the user. MIMO effectively takes advantage
of random channel fading. The prospect of many orders of magnitude improvement in
wireless communication performance at no extra cost of the spectrum is largely responsible
for the interest in MIMO systems.
Space-time coding schemes combine the channel code design and the use of multiple transmit
and receive antennas. The encoded data is split into N streams that are simultaneously
transmitted using nT transmit antennas. The received signal is a linear superposition of these

98
simultaneously transmitted symbols corrupted by noise and fading. Space-time decoding
algorithms as well as channel estimation techniques are incorporated at the receiver in order
to achieve diversity advantage and coding gain.
Different types of space-time codes have been proposed in literature. These include space-
time block codes (STBC), orthogonal space-time block codes (OSTBC), space-time trellis
codes (STTC) and super-orthogonal space-time trellis codes (SOSTTC) [129, 147, 148].
STTC provides both diversity and coding gain, but its complexity of decoding increases
exponentially with diversity level and transmission rate. In contrast, STBC [130-132] as an
alternative provides diversity but no coding gain. However, the attractiveness in STBC
includes its ability to achieve maximum possible diversity advantage, coupled with the
simplicity of its implementation and decoding algorithm [12].
Consider a space-time block code transmit diversity scheme involving two transmit antennas.
Its generator matrix G for orthogonal design is given by [130, 131]:
𝑮𝟐 = ( 𝑥1 𝑥2
−𝑥2∗ 𝑥1
∗ ) (6.12)
where columns signifies transmit antennas and the rows signifies time instances. Thus, at
time t = 1, 𝑥1 and 𝑥2 will be transmitted from antenna 1 and 2 respectively, while at time t =
2, −𝑥2∗ and 𝑥1
∗ will be transmitted from antenna 1 and 2 respectively. Assuming a single
receive antenna and fading coefficient to be constant over two consecutive time slots, the
received signal is given as
𝑟1 = ℎ1𝑥1 + ℎ2𝑥2 + 𝜂1, (6.13)
𝑟2 = −ℎ1𝑥2∗ + ℎ2𝑥1
∗ + 𝜂2, (6.14)
where h1 and h2 signifies the coefficients of the channel and 𝜂1and 𝜂2 the channel noise.
For a space-time block code scheme involving four transmit antennas, transmission matrix G
for real orthogonal design is given by [131, 147, 148]
𝑮𝟒 = (
𝑥1 𝑥2 𝑥3 𝑥4
−𝑥2 𝑥1 − 𝑥4 𝑥3
−𝑥3 𝑥4 𝑥1 − 𝑥2
−𝑥4 −𝑥3 𝑥2 𝑥1
) (6.15)

99
6.6 Space-time coded MC-CDMA system A space-time coded MC-CDMA system combines the positive advantages of STC,
multicarrier (OFDM) modulation with that of a CDMA system. Fig. 6.3 shows system
block of a space-time coded MC-CDMA system for a single user. Here, the user source
signal, represented by the vector X, is first space-time coded by the STC encoder into parallel
sub-streams xi, where i = 1, 2, 3,…, nT, where nT is the number of transmit antennas. The
CDMA encoder then encodes each sub-stream using the user’s unique code. Following this,
each of the encoded sub-streams is placed on a subcarrier for onward transmission via the
multiple transmit antennas through the wireless channel. The transmitted sub-streams
convolves with the channel, and are then picked up by the receive antennas. At any time
instant, the signal detected by each receive antenna is a summation of all the signals coming
from the nT transmit antennas. To recover the original signal, the receiver carries out the
reverse process on the detected signal.
Spac
e-ti
me
Enco
der
OFDM Mod
OFDMMod
Spac
e-ti
me
Dec
od
er
OFDM Demod
OFDMDemod
CDMA Encoder
CDMA Encoder
CDMADecoder
CDMA Decoder
Source
X
Sink
Y
Fig. 6.3 Space-time coded MC-CDMA system.
Fig. 6.4 is another block diagram of the STC MC-CDMA system showing details of signal
transformation through the communication system. This is described as follows. In the
transmitter, the source signal is first space-time coded by the STC encoder into sub-streams.
Each sub-stream is converted from serial to, say, Np parallel symbol streams, having a symbol
duration Ts. Each symbol stream is multiplied by the user code c(t), after which the resulting
signal for the pth symbol stream modulates a subcarrier fp. The subcarriers are orthogonal on
the symbol duration and are given by fp = fo+p/Ts, where fo is RF frequency. The multicarrier
signal s(t) is obtained from addition of the different subcarrier signals. The resulting OFDM
symbols are transmitted simultaneously from the individual transmit antennas. The received
signal r(t) is a convolution of s(t) and the channel impulse response, corrupted by noise. To

100
recover the original data, the receiver carries out the reverse of what the transmitter does. In
actual implementation , inverse fast Fourier transform (IFFT) and fast Fourier transform
(FFT) are normally employed by the OFDM modulator at the transmit and the receive end
respectively for improved system efficiency. For details, the reader may refer to Chapter 2 of
this thesis.
Fig. 6.4 A space-time coded MC-CDMA system
Fig. 6.4 represents an MC-CDMA system for a single user. A multi-user system has as many
of these structures as the number of users running in parallel.
6.7 System model
Starting from basic principles, we shall now be developing a mathematical description of the
communication system.

101
6.7.1 CDMA without transmit diversity
Let us first describe a CDMA system without transmit diversity nor multicarrier modulation.
The transmitted signal sk,t for user k at time t can be expressed as
𝑠𝑘,𝑡 = 𝑐𝑘(𝑡)𝑏𝑘,𝑡𝑐𝑜𝑠(𝜔𝑐𝑡 − 𝜃𝑘)
where ck(t) is a code sequence for the user, bk is the user binary data, ωc is carrier frequency,
and θk is phase angle. The code sequence ck(t) can be expressed as
𝑐𝑘(𝑡) = ∑𝑐𝑘𝑖𝑃𝑐(𝑡 − 𝑖𝑇𝑐), 𝑐𝑘
𝑖 ∈ {−1,1}, (6. 16)
𝑁
𝑖=1
where Pc is a pulse having a chip duration Tc. Let ℎ𝑘(𝑡) represent channel impulse response
for the user, where
ℎ𝑘(𝑡) = ∑𝛽𝑘𝑙𝑒𝑗𝛾𝑘𝑙𝛿(𝑡 − 𝜏𝑘𝑙).
𝐿
𝑙=1
(6. 17)
where βkl, is path gain for user k and path l, τkl is propagation delay, γkl is phase shift, l is path
index and L is number of paths. Received signal rk,t for the user at time t is given by
𝑟𝑘,𝑡 = ∫ 𝑠𝑘,𝑡(𝜏)ℎ𝑘(𝑡 − 𝜏)𝑑𝜏 + 𝑛𝑘,𝑡 (6. 18)∞
−∞
where nk,t represents channel noise. By substituting the expressions for sk,t and hk(t) into this
integral, we can show that:
𝑟𝑘,𝑡 = ∑𝛽𝑘𝑙𝑒𝑗𝛾𝑘𝑙
𝐿
𝑙=1
𝑐𝑘(𝑡 − 𝜏𝑘𝑙) 𝑏𝑘(𝑡 − 𝜏𝑘𝑙) 𝑐𝑜𝑠(𝜔𝑐(𝑡 − 𝜏𝑘𝑙) − 𝜃𝑘𝑙) + 𝑛𝑘,𝑡 (6. 19)
For a multi-user system comprising K users, the received signal r(t) is a linear superposition
of the signals for all users, and is given by
𝑟(𝑡) = ∑∑𝐴𝛽𝑘𝑙𝑒𝑗𝛾𝑘𝑙
𝐿
𝑙=1
𝑐𝑘(𝑡 − 𝜏𝑘𝑙) 𝑏𝑘(𝑡 − 𝜏𝑘𝑙) 𝑐𝑜𝑠(𝜔𝑐(𝑡 − 𝜏𝑘𝑙) − 𝜃𝑘𝑙) + 𝑛𝑘,𝑡 (6. 20)
𝐾
𝑘=1
Let user-1 be the reference user. Assuming coherent demodulation, the receiver output z(m)
for mth
bit during the bit duration Tb of the user is given by

102
𝑧1(𝑚) = ∫ 𝑟(𝑡)𝑐1( ) cos𝜔𝑐𝑡 𝑑𝑡
(𝑚+1)𝑇𝑏
𝑚𝑇𝑏
= ∫{∑∑𝐴𝛽𝑘𝑙𝑒
𝑗𝛾𝑘𝑙
𝐿
𝑙=1
𝑐𝑘(𝑡 − 𝜏𝑘𝑙) 𝑏𝑘(𝑡 − 𝜏𝑘𝑙) 𝑐𝑜𝑠(𝜔𝑐(𝑡 − 𝜏𝑘𝑙) − 𝜃𝑘𝑙) + 𝑛𝑘,𝑡
𝐾
𝑘=1
} 𝑐1( )cos𝜔𝑐𝑡 𝑑𝑡
(6. 21)
(𝑚+1)𝑇𝑏
𝑚𝑇𝑏
6.7.2 Space-time coded CDMA system
Now consider a CDMA transmit diversity scheme having nT transmit antennas. Let bk,t be the
user data, space-time coded onto the nT transmit antennas. The user data can be represented
by a vector as
𝒃𝒌,𝒕 = {𝑏𝑘,𝑡𝑖 }, 𝑖 = 1,2, … , 𝑛𝑇
= {𝑏𝑘,𝑡1 , 𝑏𝑘,𝑡
2 , … , 𝑏𝑘,𝑡𝑛𝑇} , (6.22)
where 𝑏𝑘,𝑡𝑖 is the user data for antenna i at time t. Transmitted signal 𝑠𝑘,𝑡
𝑖 for the user at
antenna i and time t can be expressed as
𝑠𝑘,𝑡𝑖 =
1
√𝑛𝑇
𝑐𝑘,𝑡𝑏𝑘,𝑡𝑖 𝑐𝑜𝑠(𝜔𝑐𝑡 − 𝜃𝑘) (6. 23)
Channel impulse response ℎ𝑘 𝑖 (𝑡) for the i
th transmit antenna is given by
ℎ𝑘𝑖 (𝑡) = ∑𝛽𝑘𝑙
𝑖 𝑒𝑗𝛾𝑘𝑙𝑖𝛿(𝑡 − 𝜏𝑘𝑙
𝑖 ).
𝐿
𝑙=1
(6. 24)
Received signal 𝑟𝑘,𝑡 for the user at time t is a superposition of the signals coming from all
the transmit antennas, and is given by
𝑟𝑘,𝑡 = 1
√𝑛𝑇
∑ ∫ 𝑠𝑘,𝑡𝑖 (𝜏)ℎ𝑘
𝑖 (𝑡 − 𝜏)𝑑𝜏 + 𝑛𝑘,𝑡
∞
−∞
𝑛𝑇
𝑖=1
. (6. 25)
By following an argument similar to that of the previous section, we can show that:
𝑟𝑘,𝑡 = 1
√𝑛𝑇
∑∑𝛽𝑘𝑙𝑖
𝑘𝑙𝑒𝑗𝛾𝑘𝑙
𝑖
𝐿𝑖
𝑙=1
𝑐𝑘(𝑡 − 𝜏𝑘𝑙𝑖 ) 𝑏𝑘(𝑡 − 𝜏𝑘𝑙
𝑖 ) 𝑐𝑜𝑠(𝜔𝑐(𝑡 − 𝜏𝑘𝑙𝑖 ) − 𝜃𝑘𝑙
𝑖 ) + 𝑛𝑘,𝑡
𝑛𝑇
𝑖=1
(6. 26)

103
where Li is number of paths for the signal transmitted from antenna i. For a multi-user
system comprising K users, the received signal r(t) is a linear superposition of the signals for
the users, and is given by
𝑟(𝑡) =1
√𝑛𝑇
∑∑∑𝛽𝑘𝑙𝑖 𝑒𝑗𝛾𝑘𝑙
𝑖
𝐿𝑖
𝑙=1
𝑐𝑘(𝑡 − 𝜏𝑘𝑙𝑖 ) 𝑏𝑘(𝑡 − 𝜏𝑘𝑙
𝑖 ) 𝑐𝑜𝑠(𝜔𝑐(𝑡 − 𝜏𝑘𝑙𝑖 ) − 𝜃𝑘𝑙
𝑖 ) + 𝑛𝑘,𝑡
𝑛𝑇
𝑖=1
𝐾
𝑘=1
(6. 27)
6.7.3 Space-time coded CDMA system with transmit and receive diversity
The space-time coded CDMA system of the previous section involves multiple transmit but
single receive antenna. The treatment is now extended to a case involving multiple antennas
at both ends. Consider a CDMA system having multiple nT transmit and nR receive antennas.
The space-time coded user data bk,t is given by Equation 6.22 stated earlier. Received signal
𝑟𝑘,𝑡𝑗
at jth
receive antenna and time t is a superposition of the signals coming from all the
transmit antennas. Received signals for the all the receive antennas can be represented by:
𝒓𝒌,𝒕 = {𝑟𝑘,𝑡𝑗}, 𝑗 = 1,2, … 𝑛𝑅
= {𝑟𝑘,𝑡1 , 𝑟𝑘,𝑡
2 , … , 𝑟𝑘,𝑡𝑛 } (6. 28)
Channel impulse response ℎ𝑘 𝑖,𝑗
for the ith
transmit antenna and jth
receive antenna is given by
ℎ𝑘𝑖,𝑗(𝑡) = ∑𝛽𝑘𝑙
𝑖,𝑗𝑒𝑗𝛾𝑘𝑙
𝑖,𝑗
𝛿(𝑡 − 𝜏𝑘𝑙𝑖,𝑗
).
𝐿𝑖,𝑗
𝑙=1
(6. 29)
Following a similar argument to that of the previous section, it can be shown that the signal
received at the jth
receive antenna at time t for a multi-user system comprising K users is
given by
𝑟𝑗(𝑡) = 1
√𝑛𝑇
∑∑∑𝛽𝑘𝑙𝑖,𝑗
𝑒𝑗𝛾𝑘𝑙𝑖,𝑗
𝐿𝑖,𝑗
𝑙=1
𝑐𝑘(𝑡 − 𝜏𝑘𝑙𝑖,𝑗) 𝑏𝑘(𝑡 − 𝜏𝑘𝑙
𝑖,𝑗) 𝑐𝑜𝑠(𝜔𝑐(𝑡 − 𝜏𝑘𝑙
𝑖,𝑗) − 𝜃𝑘𝑙
𝑖,𝑗) + 𝑛𝑘,𝑡
𝑗
𝑛𝑇
𝑖=1
𝐾
𝑘=1
(6.30)
The array of signals {𝑟𝑘,𝑡1 , 𝑟𝑘,𝑡
2 , … , 𝑟𝑘,𝑡𝑛 } from the nT transmit antennas can be combined using
a receive diversity technique such as maximal ratio combining, equal gain combining and
selection combining.

104
6.7.4 Space-time coded multi-carrier CDMA system
Theoretical treatment so far involves single carrier transmission. We shall now be
developing theory for a multicarrier CDMA system. In doing this, we shall approach the
problem by considering OFDM modulation.
Assume that each serial data symbol sub-stream, after space-time coding is converted to, say,
Np parallel symbols, having a symbol duration Ts. Each OFDM frame consists of Np coded
symbols, which modulate Np subcarrier frequencies f0, f1, f2,…, fNp-1, where the subcarrier
frequency fp = fo+p/(NpTs), where fo is RF frequency, and p = 1,2,3, …, Np-1. Considering
that the complex symbols to be transmitted in a NP-subcarrier OFDM system to be
represented by (𝑋−𝑁𝑝 2⁄ , … , 𝑋−1, 𝑋1, 𝑋2, … , 𝑋𝑁𝑝 2⁄ ), one OFDM symbol can be represented
mathematically by [149]
𝑠(𝑡) = { ∑ 𝑋𝑛𝑒𝑗2𝜋𝑓𝑝𝑡, 𝑓𝑜𝑟 𝑝𝑇 − 𝑇𝑤 − 𝑇𝑔 ≤ 𝑡 ≤ 𝑝𝑇 + 𝑇𝐹𝐹𝑇 + 𝑇𝑤 (6. 31)
𝑁𝑝 2⁄
𝑝=−𝑁𝑝 2⁄ ,𝑝≠0
0 𝑜𝑡ℎ𝑒𝑟𝑤𝑖𝑠𝑒
where 𝑓𝑝 is the frequency of the pth subcarrier, 𝑇𝐹𝐹𝑇 = 𝑁𝑝𝑇𝑠 is the duration of the total
number of FFT-points, 𝑇𝑠 is the sampling rates, 𝑇𝑔 is the duration of the cyclic prefix, and
𝑇𝑤 is the duration of the windowing. The transmitted OFDM signal can be demodulated by
applying inverse operations to (6.31) as
𝑥𝑝 =1
𝑇𝐹𝐹𝑇∫ 𝑠(𝑡)𝑒−𝑗2𝜋𝑓𝑝𝑡𝑑𝑡.
𝑇𝐹𝐹𝑇
𝑡=0
(6. 32)
The multicarrier signal s(t) is obtained from addition of the different subcarrier signals. The
resulting OFDM symbols are transmitted simultaneously from the individual transmit
antennas. The received signal r(t) is a convolution of these and the channel impulse
response corrupted by noise. To recover the original data, fast Fourier transform (FFT) is
used at the receiver to reverse the effect of OFDM. In actual implementation in OFDM
systems, to avoid inter-symbol-interference (ISI), cyclic prefix is appended to each OFDM
frame. The cyclic prefix is a copy of the last Lp samples of the OFDM frame, so that the
overall OFDM frame length is Np + Lp. The cyclic prefix is added after IFFT at the
transmitter, and removed at the receiver before FFT.

105
6.8 Simulation results and discussion
Software simulations were carried out to investigate the performance of an OFDM-modulated
as well as a space-time block-coded (STBC) MC-CDMA system in a Rayleigh frequency-
selective fading channel. The channel is modelled as being quasi-static, meaning that the
fading process remains constant during transmission of each data frame. We shall begin by
looking at results for transmit and receive space diversity, followed by the performance of a
CDMA system in flat-fading channel.
6.8.1 Transmit versus receive diversity
This section compares simulation results for transmit and receive diversity for transmission
over a Rayleigh flat-fading channel. The transmit diversity (2 x 1) corresponds to the so-
called Alamouti scheme. For comparison, the results for a no-diversity link (single transmit-
receive antenna) is also shown (Fig. 6.5).
The results (Fig. 6.5) show that using two transmit antennas and one receive antenna (2x1)
provides the same diversity order as the maximal-ratio combined (MRC) system of one
transmit antenna and two receive (1x2) antennas. Also the receive diversity has a 3 dB
advantage when compared to the transmit diversity.

106
Fig. 6.5 Transmit versus receive diversity for BPSK modulation
The previous result involves binary phase shift keying (BPSK) symbols. The next figure
shows similar results for transmission of quadrature phase shift keying (QPSK) modulation.
It can be seen that the change of modulation order does not affect the system diversity. It can
be observed that the 2x1 transmit antenna still provides the same diversity gain as the 1x2
receive diversity, and that the latter has a 3dB advantage over the former. However, the
results show that the analytic 2nd
order curve now coincides with the 1x2 system, and not the
2x1 system.
0 2 4 6 8 10 12 14 16 18 2010
-4
10-3
10-2
10-1
100
Eb/No (dB)
BE
R
Transmit vs. Receive Diversity
No Diversity (1Tx, 1Rx)
Alamouti (2Tx, 1Rx)
Maximal-Ratio Combining (1Tx, 2Rx)
Theoretical 2nd-Order Diversity

107
Fig. 6.6 Transmit versus receive diversity for QPSK modulation
6.8.2 Space-time block-coded versus CDMA system
This section compares the performance of a Gold-coded CDMA system with that of transmit
2x1 and receive 1x2 diversity system for a single user in a flat-fading Rayleigh channel. For
the CDMA, 31-chip Gold code was used as spreading sequence for BPSK symbols. The next
figure shows the results. For comparison, uncoded data transmission for a no-diversity,
transmit and receive diversity are included. Looking at this figure, it can be seen that the use
of Gold code provides coding gain of about 16 dB, compared to the uncoded, no-diversity
case. However, the Gold code provides no diversity gain. This is expected, particularly in a
flat-fading channel. Another look at this results show that in terms of BER, at low SNR (or
Eb/No) the coding gain provided by the Gold code surpasses the diversity advantage
provided by the use of the multiple antenna.
0 2 4 6 8 10 12 14 16 18 2010
-4
10-3
10-2
10-1
100
Eb/No (dB)
BE
R
Transmit vs. Receive Diversity
No Diversity (1Tx, 1Rx)
Alamouti (2Tx, 1Rx)
Maximal-Ratio Combining (1Tx, 2Rx)
Theoretical 2nd-Order Diversity

108
Fig. 6.7 Performance of a Gold coded CDMA system versus STBC
6.8.3 Space-time block-coded CDMA system
This section presents the performance of a space-time block-coded (STBC) CDMA system.
Fig. 6.8 shows the results for a 31-chip Gold code. Looking at this figure, it can be seen that
the STBC-CDMA system provides both diversity and coding gain. The curve for the plain
2x1 system is seen to be parallel to that of the STBC-CDMA system, which clearly shows
that the space-time coding is solely responsible for the diversity gain, while Gold code
encoding is responsible for the coding gain. In the composite STBC-CDMA system, the
diversity advantage of the STBC is complemented by the coding gain of the CDMA, giving
better system performance. Diversity decreases the asymptotic error rate as a function of
signal-to-noise ratio (SNR), while coding gain provides vertical shift of the error performance
curve. At a BER of 10-3
, there exists about 12 dB difference between the coding gain of a
CDMA-only system and its space-time-coded counterpart. This difference in coding gain
grows with decent in BER. Apart from these, the figure also shows that the coding gain
0 5 10 15 20 25 30 35 40
10-4
10-3
10-2
10-1
100
Eb/No (dB)
BE
R
Coded vs uncoded transmission
No Diversity (1Tx, 1Rx)
Tx Diversity (2Tx, 1Rx)
Gold-coded (1Tx, 1Rx, N=31)

109
between the no-diversity link and its Gold-coded counterpart is the same as that between the
transmit-diversity link and its Gold–coded counterpart.
Fig. 6.8 Performance of a STBC-CDMA system using a 31-chip Gold code as spreading sequence.
Fig. 6.9 shows simulation results for a 127-chip Gold code. It can be seen that this figure has
similar features with the results for 31-chip Gold code. However, the 127-chip provides
greater coding gain than the 31-chip Gold code. This is expected, consequent to difference in
process gains of the codes. Fig. 6.10 and 6.11 shows results for a 511-chip and 2047-chip
Gold codes respectively. These figures agree with the observations stated earlier. As
expected, it is clear that a longer code give better error-rate performance, but at the expense
of greater transmission bandwidth as a penalty.
0 5 10 15 20 25 30 35 40
10-4
10-3
10-2
10-1
100
Eb/No (dB)
BE
R
Coded vs uncoded transmission
No Diversity (1Tx, 1Rx)
Tx Diversity (2Tx, 1Rx)
Gold-coded (1Tx, 1Rx, N=31)
Gold-coded (2Tx, 1Rx, N=31)

110
Fig. 6.9 Performance of a STBC-CDMA system for a 127-chip Gold code
-20 -10 0 10 20 30 40
10-4
10-3
10-2
10-1
100
Eb/No (dB)
BE
R
Coded vs uncoded transmission
No Diversity (1Tx, 1Rx)
Tx Diversity (2Tx, 1Rx)
Gold-coded (1Tx, 1Rx, N=127)
Gold-coded (2Tx, 1Rx, N=127)

111
Fig. 6.10 Performance of a STBC-CDMA system for a 511-chip Gold code
Fig. 6.11 Performance of a STBC-CDMA system for a 2047-chip Gold code
-20 -10 0 10 20 30 40
10-4
10-3
10-2
10-1
100
Eb/No (dB)
BE
R
Coded vs uncoded transmission
No Diversity (1Tx, 1Rx)
Tx Diversity (2Tx, 1Rx)
Gold-coded (1Tx, 1Rx, N=511)
Gold-coded (2Tx, 1Rx, N=511)
-30 -20 -10 0 10 20 30 40
10-4
10-3
10-2
10-1
100
Eb/No (dB)
BE
R
Coded vs uncoded transmission
No Diversity (1Tx, 1Rx)
Tx Diversity (2Tx, 1Rx)
Gold-coded (1Tx, 1Rx, N=4095)
Gold-coded (2Tx, 1Rx, N=4095)

112
6.8.4 Performance in a frequency-selective channel
In addition to performance in a flat-fading channel, the system performance in a frequency-
selective Rayleigh channel was also investigated for coded as well as uncoded data
transmission. A four-path channel with fixed path delays and path gains were considered for
a sample frequency of 10 kH. Table 6.1 shows the simulation parameters. The performance
of a space-time coded OFDM system as well as a MC-CDMA system were investigated for a
single user. The number of subcarriers was kept fixed at 64. The channel was modelled as
being quasi-static, meaning that the fading process remains constant during transmission of
each OFDM frame. Cyclic prefix was added after IFFT at the transmitter, and removed at the
receiver before FFT. The simulation results shall now be presented as follows.
Table 6.1. Simulation parameters for the STBC MC-CDMA system
Modulation type QPSK
Frame size 64 QPSK symbols
No. of subcarriers 64
Cyclic extension (25%) 16 symbols
Carrier frequency 900 MHz
Max Doppler shift 83.33 Hz
Sample Frequency 10 kHz
Number of paths 4
Path gains(dB) 0 -20 -30 -40
Path delays (μs) 0 1 5 10
6.8.5 Space-time coded OFDM system
Here, the performance of a space-time coded OFDM system in the frequency-selective
channel is considered. For comparison, the results, Fig. 6.12, show the performance for a
single-antenna, no-diversity (1x1) case, for transmit diversity and MRC receive diversity.
The water-fall region of this figure shows that the transmit and the receive diversity schemes
provide the same diversity gain. This agrees with expectation, both being second-order
diversity schemes. However, the figure shows that the receive diversity has a 3-dB advantage
over the transmit diversity. This is because total transmitted power is modelled to be the
same in both cases, such that the power transmitted from each transmit antenna of the latter is
half that of the former. If the transmitted power is made to be the same in both cases, then
the performance would be identical. It is noteworthy that these features are similar to those
observed for a flat-fading channel.
Another important feature of Fig. 6.12 is the appearance of error floor. This error floor
cannot be attributed to multi-user interference, as there is no interferer here. Rather, it

113
originates from multi-paths characteristic of a frequency-selective channel. The figure shows
that the receive diversity’s 3-dB advantage is lost in the error floor region, such that both
thetransmit and the receive diversity schemes exhibit the same level of error floor.
Compared to no-diversity scheme, the benefit of using multiple-antenna is obvious, as
revealed by the lowering of error floor by the latter. A close look at the performance curves
(see data tips, Fig. 6.13) shows that whereas error floor for no-diversity is about 0.1475, it is
about 0.0738 for transmit diversity (see data tips). Dividing the former by the latter gives
2.001, which indicates that the diversity scheme reduced the error floor by a factor of two.
Fig. 6.12 Performance of a space-time coded OFDM system in a four-path frequency selective Rayleigh
channel.
-40 -30 -20 -10 0 10 20 30 4010
-2
10-1
100
Eb/No (dB)
BE
R
Transmit vs receive diversity in a frequency-selective channel
OFDM - No Div (1Tx, 1Rx)
OFDM - Tx Div (2Tx, 1Rx)
OFDM - MRC (1Tx, 2Rx)

114
Fig. 6.13 Data tips showing the level of error floor for no-diversity and transmit-diversity transmission for the
OFDM system.
6.8.6 Space-time coded MC-CDMA system
This section presents simulation results on the performance of a space-time coded multi-
carrier CDMA system in the frequency-selective channel. Results for STC-OFDM are also
included for the purpose of comparison. Simulations were carried out to investigate the
system performance for Gold codes of different code lengths. Fig. 6.14 shows the results for
a 31-chip Gold code. It is obvious from this figure that a STC MC-CDMA system has better
performance than its STC-OFDM counterpart. Comparing no-diversity transmission shows
that at a BER of 10-1
, the use of the 31-chip Gold codes in the MC-CDMA system provides a
coding gain of about 16.272 dB relative to the OFDM system. For the transmit diversity
scheme, the STC MC-CDMA provides a coding gain of about 15.516, relative to the OFDM
system. Another look at the figure shows that the performance curves of STC MC-CDMA
and the STC OFDM has similar slopes in the waterfall region. This indicates that the MC-
CDMA provides no additional diversity gain to the STC MC-CDMA system. That is, for the
31-chip Gold-coded STC MC-CDMA system, diversity gain originates solely from the use of
the multiple antennas, while coding gain comes from the Gold codes.
-40 -30 -20 -10 0 10 20 30 4010
-2
10-1
100
X: 20
Y: 0.07397
Eb/No (dB)
BE
R
Transmit vs receive diversity in a frequency-selective channel
X: 25
Y: 0.07145
X: 20
Y: 0.1479
OFDM - No Div (1Tx, 1Rx)
OFDM - Tx Div (2Tx, 1Rx)
OFDM - MRC (1Tx, 2Rx)

115
Fig. 6.14 Performance of a space-time coded MC-CDMA system for a 31-chip Gold code
Fig. 6.15 Data tips showing data points for evaluating the performance of the MC-CDMA system for a 31-chip
Gold code
-40 -30 -20 -10 0 10 20 30 4010
-2
10-1
100
Eb/No (dB)
BE
R
Coded vs uncoded transmission
OFDM - No Div (1Tx, 1Rx)
OFDM - Tx Div (2Tx, 1Rx)
OFDM - MRC (1Tx, 2Rx)
MC-CDMA (1Tx, 1Rx, N=31)
MC-CDMA (2Tx, 1Rx, N=31)
-40 -30 -20 -10 0 10 20 30 4010
-2
10-1
100
X: 2.926
Y: 0.2027
Eb/No (dB)
BE
R
Coded vs uncoded transmission
X: -12.59
Y: 0.2007
X: 8.623
Y: 0.1011
X: -7.649
Y: 0.1001
X: 40
Y: 0.1271
X: 30
Y: 0.07377X: 10
Y: 0.05909
OFDM - No Div (1Tx, 1Rx)
OFDM - Tx Div (2Tx, 1Rx)
OFDM - MRC (1Tx, 2Rx)
MC-CDMA (1Tx, 1Rx, N=31)
MC-CDMA (2Tx, 1Rx, N=31)

116
Another important feature in this figure is the level of error floor. It is obvious from Fig.
6.15 that the STC MC-CDMA system has lower error floor than the STC-OFDM system.
For the no-diversity scheme, error floor is about 0.1479 (Fig. 6.13) for OFDM transmission,
and 0.1271 for MC-CDMA. For transmit-diversity scheme, error floor is about 0.0738 for
OFDM transmission, and 0.0591 for MC-CDMA. For the MC-CDMA system, the results
show that the use of transmit diversity provides about 2.164 reduction in error floor.
We shall now consider simulation results for a 127-chip Gold code, as shown by Fig. 6.16.
Looking at this figure, it is obvious that this longer code gives a better performance than its
31-chip counterpart in terms of BER, coding gain, diversity gain and level of error floor. For
the no-diversity transmission at a BER of 0.2, the 127-chip Gold codes provides a coding
gain of about 24.944 dB relative to the OFDM system. Looking at the results for the transmit
diversity scheme shows that for the 127-chip code, the performance curve for the STC MC-
CDMA has steeper slope in the waterfall region than its STC-OFDM counterpart. This
implies that the former has a higher diversity gain than the latter. This can be compared to
the results for 31-chip Gold code, for which the two systems have similar slopes in the
waterfall region. The extra diversity gain observable in the 127-chip system could only be
attributed as coming from MC-CDMA counterpart. The use of a 127-chip code, the MC-
CDMA provides not only coding gain, but also diversity gain.
Now turning to the level of error floor, the results show that for the no-diversity case, error
floor is about 0.04214 for 127-chip MC-CDMA system. With reference to the OFDM
system, this is equivalent to a factor of about 3.51 reduction in error floor. For transmit-
diversity scheme, error floor is about for 0.0088 for the 127-chip MC-CDMA, which is
equivalent to a factor of about 8.4164 reduction in error floor with reference to the OFDM
case.

117
Fig. 6.16 Performance of a space-time coded MC-CDMA system for a 127-chip Gold code
The system performance was also investigated for longer codes. Fig. 6.17 shows the results
for a 511-chip Gold code. Obviously from this figure, this longer code gives better
performance, as indicated by the dramatic increase in diversity gain, and significant drop in
the level of error floor. It is obvious that the slope of the STC MC-CDMA system is
significantly steeper, indicating higher diversity gain. The increase in diversity gain for the
longer 511-chip could only be attributed as coming from the MC-CDMA
-40 -30 -20 -10 0 10 20 30 4010
-3
10-2
10-1
100
X: 5.534
Y: 0.1015
Eb/No (dB)
BE
R
Coded vs uncoded transmission
X: 19.93
Y: 0.04217
X: 20.1
Y: 0.008764
X: -15
Y: 0.09675
OFDM - No Div (1Tx, 1Rx)
OFDM - Tx Div (2Tx, 1Rx)
OFDM - MRC (1Tx, 2Rx)
MC-CDMA (1Tx, 1Rx, N=127)
MC-CDMA (2Tx, 1Rx, N=127)

118
Fig. 6.17 Performance of a space-time coded MC-CDMA system for a 511-chip Gold code
Considering level of error floor, the results show that for the no-diversity case, error floor is
about 0.0016 for 511-chip MC-CDMA system. With reference to the OFDM system, this is
equivalent to a factor of about 93.726 reduction in error floor. For transmit-diversity scheme,
error floor is about for 3.906 x 10⁻⁵
for the 511-chip MC-CDMA, which is equivalent to a
factor of about 3,786 reduction in error floor with reference to the OFDM case.
We shall now consider simulation results for the performance of a 2047-chip code, as shown
by Fig. 6.18. This figure shows dramatic increase in the system performance. The slope of the
performance curves for the 2047-chip code is incomparably steep. The graph also shows
sharp drop in error floor such that the error floor is not even visible within the limit of lowest
BER shown by the figure. Intuition suggests making an attempt to find out the error floor for
the code. However, this would require generating results for lower BER, but the time penalty
required for doing this does not make it feasible. (Results shown here took about two days of
continuous running of simulations. Hence going down in BER by, say, two orders of
magnitude to give a BER of 10-7
would entail processing 100-fold the data samples, and that
will require about 200 days of continuous simulation, which is not practicable.)
-40 -30 -20 -10 0 10 20 30 4010
-5
10-4
10-3
10-2
10-1
100
X: 20
Y: 0.001578
Eb/No (dB)
BE
R
Coded vs uncoded transmission
X: 30
Y: 0.1475
X: 20
Y: 3.906e-005
OFDM - No Div (1Tx, 1Rx)
OFDM - Tx Div (2Tx, 1Rx)
OFDM - MRC (1Tx, 2Rx)
MC-CDMA (1Tx 1Rx, N=511)
MC-CDMA (2Tx 1Rx, N=511)

119
Fig. 6.18 Performance of a space-time coded MC-CDMA system for a 2047-chip Gold code
6.9 Chapter summary
Among other things, this chapter presents results for the performance of a space-time block-
coded multi-carrier CDMA system. The treatment began by examining results for 2x1-
transmit and 1x2-receive diversity schemes, both of which gave similar diversity gain, both
being second-order diversity schemes. This chapter then investigated the performance of a
STBC CDMA system for different chip lengths. Results showed that at low signal-to-noise
ratio, the coding gain provided by the codes surpasses the diversity advantage provided by
the use of the multiple antennas. The results also showed that in a flat-fading channel, coding
gain between no-diversity link and its Gold-coded counterpart is the same as that between the
transmit-diversity link and its Gold–coded counterpart. The independence of the diversity
advantage provided by multiple transmit antennas and the coding gain obtainable from the
use of the spreading sequences enables the prediction of the performance of composite space-
time block-coded CDMA systems.
This chapter also investigated the performance of a space-time coded OFDM system in a
frequency-selective channel. Results showed that the receive diversity’s 3-dB advantage over
its transmit diversity counterpart was lost in the error floor region, such that both the transmit
and the receive diversity schemes exhibited the same level of error floor. The results also
-40 -30 -20 -10 0 10 20 30 40
10-4
10-3
10-2
10-1
100
Eb/No (dB)
BE
R
Coded vs uncoded transmission
OFDM - No Diversity (1Tx, 1Rx)
OFDM - Tx Diversity (2Tx, 1Rx)
OFDM - MRC (1Tx, 2Rx)
MC-CDMA (1Tx, 1Rx, N=2047)
MC-CDMA (2Tx, 1Rx, N=2047)

120
showed that with reference to no-diversity transmission, the diversity schemes reduced the
system error floor by a factor of two.
Results of investigation on the performance of a STC MC-CDMA system was also presented,
and the outcome of which showed that the combination of diversity gain in the use of
multiple antennas, coupled with coding gain provided by the Gold codes of the CDMA
system, plus the diversity gain resulting from frequency diversity of multi-carrier
transmission and the spectrum-spreading by the CDMA makes the composite system resilient
to fading. This fact is particularly the case for long codes.

121
Chapter 7
7 Conclusion and Future Work
7.0 Introduction
This concluding chapter gives a brief summary of the main contributions and findings of this
thesis. Suggestions on likely extension of the work are also itemized in this chapter.
The significance of wireless communication in the present information age cannot be over-
emphasized. From the early days of mobile communication, code-division multiple-access
(CDMA) has been one of the primary multiple-access techniques in mobile technology. The
technique, whose evolution dates back to the 1940s, was primarily for military applications in
its early days, due to its jam-resistant and signal-hiding capability. Over the years however,
CDMA has become an important access technique not only in mobile technology, but also in
satellite communication. This thesis is a contribution to the development of CDMA
technology. A summary of the outcome of the work reported in this thesis is hereby given as
follows.
7.1 Thesis summary
CDMA relies on coding to achieve its multiple-access property. It assigns each user a unique
code, which is used to encode the user signal at the transmitter end. The receiver, knowing
the code sequence of the user, decodes the received signal after reception to recover the
original signal. CDMA codes, called spread-spectrum codes, pseudo-noise (PN) codes or
pseudo-random noise (PRN) codes play a critical role in the performance of CDMA systems.
A CDMA system can do no better than the properties of its codes allow. Poor codes yield
poor system performance. In line with this, initial aspect of this PhD work was directed at
learning about CDMA codes. Different types of codes were considered, out of which Gold
codes were selected.

122
Following the code selection process, different sets of Gold codes were generated, after
which software simulations were carried out on their correlation properties. This was
necessary to confirm that the codes possess expected properties. After experimenting with
the correlation properties of the codes, a CDMA baseband model was simulated for signal
transmission through a noiseless, non-fading channel. Basically, this involved PN-encoding-
decoding, and it helps to further validate the Gold codes. This signal transmission was
carried out for different data sizes, ranging from a few data bits (e.g. 4 bits) up to a million
random bits. Since the transmission was through a noiseless channel, it is expected that every
transmitted signal should be received without any errors. Simulation results agreed with this.
Furthermore, the codes were tested for signal transmission through a noisy channel. In this
case, it was expected that as signal-to-noise ratio (SNR) goes down, errors should creep into
the recovered bit streams. Simulation results confirmed this to be the case: as SNR
decreased, bit-error-rate (BER) worsened. The results were also tested with the aid of scatter
plots.
Following the code testing process, multiple-access performance of even- and odd-degree
Gold codes in a multi-user system was investigated. The investigation entailed software
simulations for different sets of Gold codes, ranging from 31-chip to 4095-chip Gold codes,
from light to heavy system loading, involving up to about a thousand simultaneous users.
Results of the investigation showed that odd-degree Gold codes have better multiple-access
performance than their even-degree counterparts. Whereas the latter exhibited error floor and
system saturation when the system was loaded, no such performance degradation was
noticeable in the former. The results suggest that the odd-degree Gold codes are better suited
for multiple-access applications than their even-degree counterparts.
Any particular code is normally expected to have a maximum number of users that would be
tolerated, a number that is believed to be well below full load. In contrast, simulation results
presented in this thesis showed that with good choice of codes, the number of available codes
can go up to full-load. This is another important contribution of this thesis.
Furthermore in this thesis, software simulations were carried to investigate the performance
of a direct-sequence (DS) CDMA system in a flat-fading Rayleigh channel, and a multi-
carrier (MC) CDMA system in a frequency-selective channel. Random QPSK symbols were
generated and transmitted through the channel using different sets of Gold codes as spreading
sequences. The influence of code length on the system performance was investigated for a

123
given number of tones and data rate for coded as well as uncoded data transmission. The
results showed that a longer code gives better error rate performance, though at the expense
of increased transmission bandwidth. In addition, the results indicated that primarily,
irreducible error floor is not due to multiple-access performance of the codes, but channel
fading. The results also showed that in a flat-fading channel, the Gold codes provide a
constant coding gain close to that obtainable in a Gaussian channel. Apart from this, this
thesis showed that the impact of longer spreading codes was more pronounced for the MC-
CDMA system in a frequency-selective channel as indicated by significant lowering of error
floors. Also, frequency diversity associated with the use of longer codes coupled with multi-
carrier modulation makes the MC-CDMA system resilient to multi-path effects.
Further still, this thesis presented simulation results on the performance of a space-time
block-coded (STBC) MC-CDMA system. The treatment began by examining the
performance of simple transmit and receive diversity schemes, followed by the performance
of a STBC CDMA system. Results showed that at low signal-to-noise ratio, the coding gain
provided by the codes surpasses the diversity advantage provided by the use of the multiple
antennas. The results also showed that in a flat-fading channel, coding gain between no-
diversity link and its Gold-coded counterpart is the same as that between the transmit-
diversity link and its Gold–coded counterpart.
The work on transmit-receive diversity was followed by an investigation of the performance
of a STBC OFDM system in a frequency-selective channel, after which the performance of
the same was compared with that of a STBC MC-CDMA system. Results showed that the
combination of diversity gain from the use of multiple antennas, coupled with coding gain
provided by the Gold codes of the CDMA system, plus the diversity gain resulting from
frequency diversity of multi-carrier transmission and the spectrum-spreading by the CDMA
makes the composite STBC MC-CDMA system resilient to channel fading. This fact is
particularly the case for long codes. For example, with reference to the OFDM transmission,
the results showed that a 511-chip Gold-coded STC MC-CDMA system provided a factor of
about 3,786 reduction in error floor.

124
7.2 Future work Some recommendations on possible future work shall now be highlighted as follows.
Throughout this thesis, perfect synchronization was assumed, which generally does not apply
in practice, particularly in the uplink. Investigating effects of lack of synchronization might
be a worthwhile future work.
In this thesis, knowledge of channel impulse response (CIR) at the receiver was assumed. As
an extension of this work, effect of imperfect knowledge of CIR may be considered.
For the multi-carrier transmission, this thesis assumed fixed number of sub-carriers. A
consideration of the effect of number of sub-carriers on the system performance might be a
useful future work.
This work involved variable transmission bandwidth, consequent to the variable code lengths.
Future work may consider effects of having fixed transmission bandwidth.
This work assumed constant path gains and constant path delays. Future considerations may
extend this work to the case of variable path gains and path delays.
For the frequency-selective channel, four multi-paths were assumed. As an extension, the
simulation may be repeated for some other number of paths.
The investigation on multiple-access performance of Gold codes was carried out for some
representative sets of codes. Thus in the future, the simulation can be carried out on more
code samples. Furthermore, the possibility of developing an analytic solution for the problem
may be explored.
In the simulations for space-time coded systems, single user rather than multiple users was
assumed. Thus, this work can be extended to the case of multiple users.
For space-time coding, considerations was limited to two antennas. Hence, this work can be
extended to that involving higher number of antennas. Apart from this, this work only
considered space-time block codes. As a future extension, other types of space-time codes
can be considered.
In this work, effect of interleaver was not considered. As a future extension, effect of
interleaver on the system performance may be investigated.

125
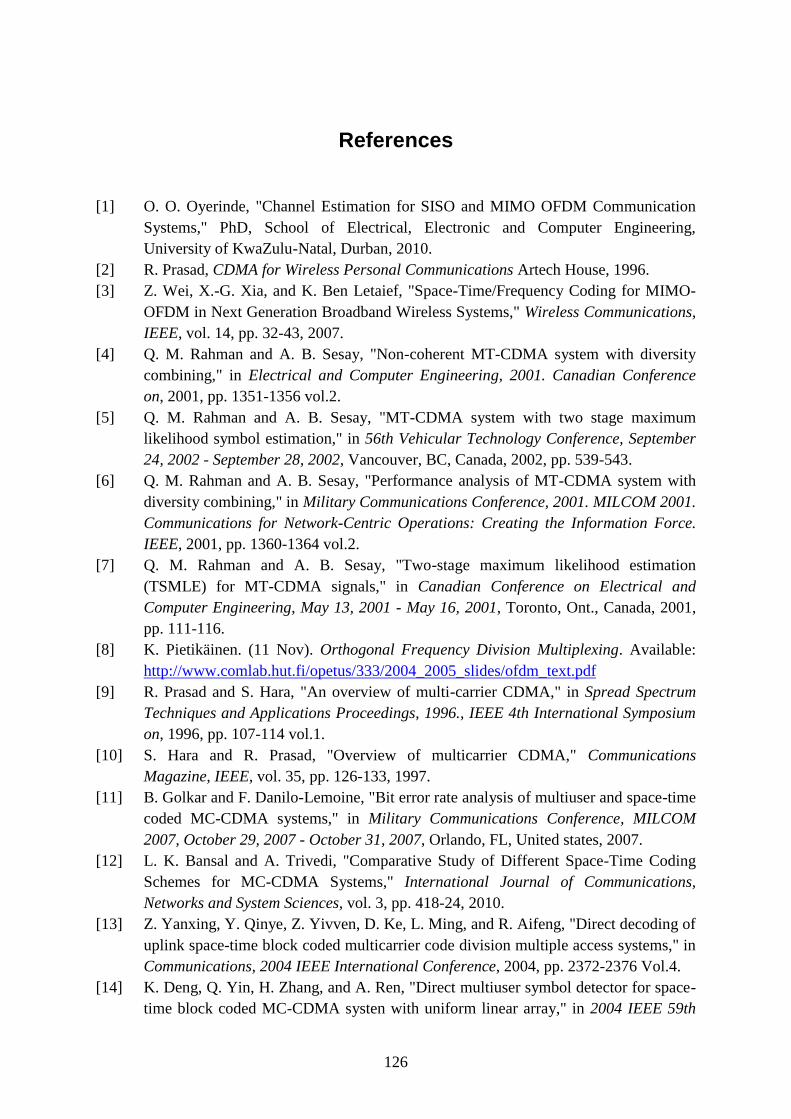
126
References
[1] O. O. Oyerinde, "Channel Estimation for SISO and MIMO OFDM Communication
Systems," PhD, School of Electrical, Electronic and Computer Engineering,
University of KwaZulu-Natal, Durban, 2010.
[2] R. Prasad, CDMA for Wireless Personal Communications Artech House, 1996.
[3] Z. Wei, X.-G. Xia, and K. Ben Letaief, "Space-Time/Frequency Coding for MIMO-
OFDM in Next Generation Broadband Wireless Systems," Wireless Communications,
IEEE, vol. 14, pp. 32-43, 2007.
[4] Q. M. Rahman and A. B. Sesay, "Non-coherent MT-CDMA system with diversity
combining," in Electrical and Computer Engineering, 2001. Canadian Conference
on, 2001, pp. 1351-1356 vol.2.
[5] Q. M. Rahman and A. B. Sesay, "MT-CDMA system with two stage maximum
likelihood symbol estimation," in 56th Vehicular Technology Conference, September
24, 2002 - September 28, 2002, Vancouver, BC, Canada, 2002, pp. 539-543.
[6] Q. M. Rahman and A. B. Sesay, "Performance analysis of MT-CDMA system with
diversity combining," in Military Communications Conference, 2001. MILCOM 2001.
Communications for Network-Centric Operations: Creating the Information Force.
IEEE, 2001, pp. 1360-1364 vol.2.
[7] Q. M. Rahman and A. B. Sesay, "Two-stage maximum likelihood estimation
(TSMLE) for MT-CDMA signals," in Canadian Conference on Electrical and
Computer Engineering, May 13, 2001 - May 16, 2001, Toronto, Ont., Canada, 2001,
pp. 111-116.
[8] K. Pietikäinen. (11 Nov). Orthogonal Frequency Division Multiplexing. Available:
http://www.comlab.hut.fi/opetus/333/2004_2005_slides/ofdm_text.pdf
[9] R. Prasad and S. Hara, "An overview of multi-carrier CDMA," in Spread Spectrum
Techniques and Applications Proceedings, 1996., IEEE 4th International Symposium
on, 1996, pp. 107-114 vol.1.
[10] S. Hara and R. Prasad, "Overview of multicarrier CDMA," Communications
Magazine, IEEE, vol. 35, pp. 126-133, 1997.
[11] B. Golkar and F. Danilo-Lemoine, "Bit error rate analysis of multiuser and space-time
coded MC-CDMA systems," in Military Communications Conference, MILCOM
2007, October 29, 2007 - October 31, 2007, Orlando, FL, United states, 2007.
[12] L. K. Bansal and A. Trivedi, "Comparative Study of Different Space-Time Coding
Schemes for MC-CDMA Systems," International Journal of Communications,
Networks and System Sciences, vol. 3, pp. 418-24, 2010.
[13] Z. Yanxing, Y. Qinye, Z. Yivven, D. Ke, L. Ming, and R. Aifeng, "Direct decoding of
uplink space-time block coded multicarrier code division multiple access systems," in
Communications, 2004 IEEE International Conference, 2004, pp. 2372-2376 Vol.4.
[14] K. Deng, Q. Yin, H. Zhang, and A. Ren, "Direct multiuser symbol detector for space-
time block coded MC-CDMA systen with uniform linear array," in 2004 IEEE 59th

127
Vehicular Technology Conference, VTC2004-Spring: Towards a Global Wireless
World, May 17, 2004 - May 19, 2004, Milan, Italy, 2004, pp. 1456-1460.
[15] A. Ling and L. Milstein, "The effects of spatial diversity and imperfect channel
estimation on wideband MC-DS-CDMA and MC-CDMA," Communications, IEEE
Transactions, vol. 57, pp. 2988-3000, 2009.
[16] M. Mehrkam and A. Z. Asli, "EM-based Multi-User Detection for STBC-MC-CDMA
communication systems," in Signal Processing and Communication Systems, 2009.
ICSPCS 2009. 3rd International Conference on, 2009, pp. 1-6.
[17] D. Falconer, S. L. Ariyavisitakul, A. Benyamin-Seeyar, and B. Eidson, "Frequency
domain equalization for single-carrier broadband wireless systems," Communications
Magazine, IEEE, vol. 40, pp. 58-66, 2002.
[18] P. L. Kafle, A. B. Sesay, and J. McRory, "An iterative MMSE-decision feedback
multiuser detector for space-time coded multicarrier CDMA system," in Canadian
Conference on Electrical and Computer Engineering; Technology Driving
Innovation, 2004, May 2, 2004 - May 5, 2004, Niagara Falls, Canada, 2004, pp. 2281-
2286.
[19] P. L. Kafle and A. B. Sesay, "Iterative semiblind multiuser receivers for a space-time
block-coded MC-CDMA uplink system," IEEE Transactions on Vehicular
Technology, vol. 53, pp. 601-610, 2004.
[20] M. El-Hajjar, O. Alamri, R. G. Maunder, and L. Hanzo, "Layered Steered
Space–Time-Spreading-Aided Generalized MC DS-CDMA," Vehicular
Technology, IEEE Transactions, vol. 59, pp. 999-1005, 2010.
[21] S. Bangwon and A. Jae Young, "LMS adaptive receiver for uplink space-time coded
MC-CDMA systems," in Advanced Communication Technology (ICACT), 2010 The
12th International Conference on, 2010, pp. 839-843.
[22] J.-L. Yu, C.-H. Wu, and M.-F. Lee, "MC-CDMA MIMO systems with quasi-
orthogonal space-time block codes: Channel estimation and multiuser detection,"
International Journal of Communication Systems, vol. 25, pp. 294-313, 2012.
[23] J.-L. Yu, C.-C. Lin, and M.-F. Lee, "MC-CDMA multiple-input multiple-output
systems with space-time block codes," in MAPE2005: IEEE 2005 International
Symposium on Microwave, Antenna, Propagation and EMC Technologies for
Wireless Communications, August 8, 2005 - August 12, 2005, Beijing, China, 2005,
pp. 1492-1495.
[24] M. Juntti, M. Vehkapera, J. Leinonen, V. Zexian, D. Tujkovic, S. Tsumura, et al.,
"MIMO MC-CDMA communications for future cellular systems," Communications
Magazine, IEEE, vol. 43, pp. 118-124, 2005.
[25] P. Nagaradjane, S. N. Chandrasekaran, K. S. Vishvaksenan, and M. Ramakrishnan,
"MIMO multi carrier interleave division multiple access system with multiuser
detection," in Wireless Communication and Sensor Computing, 2010. ICWCSC 2010.
International Conference on, 2010, pp. 1-4.
[26] P. Nagaradjane, S. N. Chandrasekaran, and K. S. Vishvaksenan, "MIMO Multi
Carrier Interleave Division Multiple Access System with Multiuser Detection:
Performance Results," in Int'l J. of Communications, Network and System Sciences,
2010, pp. 413-417.

128
[27] S. Wei and M. G. Amin, "Minimum variance receiver for multicarrier CDMA
systems with space-time coding," in Conference Record of the 37th Asilomar
Conference on Signals, Systems and Computers, 9-12 Nov. 2003, Piscataway, NJ,
USA, 2003, pp. 1152-5.
[28] W. Sun, H. Li, and M. Amin, "MMSE detection for space-time coded MC-CDMA,"
in 2003 International Conference on Communications (ICC 2003), May 11, 2003 -
May 15, 2003, Anchorage, AK, United states, 2003, pp. 3452-3456.
[29] Y. Jung-Lang and W. Chun-Hsien, "Multiuser detection for QO-STBC MC-CDMA
MIMO systems," in Communications and Networking in China, 2009. ChinaCOM
2009. Fourth International Conference on, 2009, pp. 1-5.
[30] Y. Jung-Lang, W. Chun-Hsien, and L. Ming-Feng, "Multiuser receiver design for
MC-CDMA systems with quasi-orthogonal STBCs," in Signal Processing, 2008.
ICSP 2008. 9th International Conference, 2008, pp. 1731-1734.
[31] J.-L. Yu, M.-F. Lee, and C.-C. Lin, "Multiuser receivers for MC-CDMA MIMO
systems with space-time block codes," Signal Processing, vol. 89, pp. 99-110, 2009.
[32] V. T. Vakili and M. T. Mohebbi, "A new scheme for signal reception in MC-CDMA
systems with space-time block coding," in Wireless and Optical Communications
Networks, 2005. WOCN 2005. Second IFIP International Conference on, 2005, pp.
463-467.
[33] Z. Li and M. Latva-aho, "Nonblind and semiblind space-time-frequency multiuser
detection for space-time block-coded MC-CDMA," IEEE Transactions on Wireless
Communications, vol. 4, pp. 1311-1318, 2005.
[34] A. Gusmao, R. Dinis, and N. Esteves, "On frequency-domain equalization and
diversity combining for broadband wireless communications," Communications,
IEEE Transactions, vol. 51, pp. 1029-1033, 2003.
[35] H. Zhihua and V. K. Dubey, "Performance analysis for downlink MC-CDMA systems
with space-time block codes in frequency-selective Rayleigh fading channels," in
ICICS-PCM 2003. Proceedings of the 2003 Joint Conference of the Fourth
International Conference on Information, Communications and Signal Processing
and Fourth Pacific-Rim Conference on Multimedia, 15-18 Dec. 2003, Piscataway, NJ,
USA, 2003, pp. 658-62.
[36] C. Kotchasarn, "Performance analysis of uplink MIMO MC-CDMA systems with V-
BLAST over frequency selective Rayleigh fading channel," in Industrial Electronics
& Applications, 2009. ISIEA 2009. IEEE Symposium on, 2009, pp. 733-736.
[37] P. Xiaoming, L. Zhongding, and F. P. S. Chin, "Performance comparison of different
MIMO configurations for downlink MC-CDMA systems," in Communications
Systems, 2004. ICCS 2004. The Ninth International Conference on, 2004, pp. 281-
285.
[38] H. M. Elkamchouchi and A. M. Medra, "Performance comparison of MIMO space-
time block coded MC-CDMA systems in Nakagami-m fading channel," in Radio
Science Conference, 2009. NRSC 2009. National, 2009, pp. 1-7.
[39] A. Lodhi, F. Said, M. Dohler, and A. H. Aghvami, "Performance comparison of
space-time block coded and cyclic delay diversity MC-CDMA systems," Wireless
Communications, IEEE, vol. 12, pp. 38-45, 2005.

129
[40] M. Valipour and H. Shafiee, "Performance comparison of space-time coded MC-
CDMA systems," in 2005 International Conference on Wireless and Optical
Communications Networks, 6-8 March 2005, Piscataway, NJ, USA, 2005, pp. 458-62.
[41] N. Kumaratharan, E. E. Arnold, J. Venkatesan, and P. Dananjayan, "Performance
Improvement of ICE for Orthogonal STBC MC-CDMA Systems over MIMO
Channels," in Industrial and Information Systems, 2008. ICIIS 2008. IEEE Region 10
and the Third international Conference on, 2008, pp. 1-5.
[42] A. Narzullaev, K. Ryu, and Y. Park, "Performance investigation of space-time block
coded multicarrier DS-CDMA in time-varying channels," ETRI Journal, vol. 28, pp.
684-687, 2006.
[43] J. Bastos and A. Gameiro, "Performance of extended space-time coding techniques
for MIMO MC-CDMA systems," in European Conference on Antennas and
Propagation: EuCAP 2006, November 6, 2006 - November 10, 2006, Nice, France,
2006.
[44] M. Valipour and H. Shafiee, "Performance of MC-CDMA systems with space-time
block codes in frequency selective fading channels," in Communications Systems,
2004. ICCS 2004. The Ninth International Conference on, 2004, pp. 645-649.
[45] J. M. Auffray and J. F. Helard, "Performance of multicarrier CDMA technique
combined with space-time block coding over Rayleigh channel," in IEEE ISSTA 2002
- IEEE International Symposium on Spread Spectrum Techniques and Applications,
2-5 Sept. 2002, Piscataway, NJ, USA, 2002, pp. 348-52.
[46] Z. Li and M. Latva-aho, "Performance of space-time block coded MC-CDMA in
Nakagami fading channels," Electronics Letters, vol. 39, pp. 222-224, 2003.
[47] L. Hang, Y. Wei, T. Zhenhui, and C. Shixin, "Performance of space-time block-coded
MC-CDMA system in multipath fading channel," in Microwave, Antenna,
Propagation and EMC Technologies for Wireless Communications, 2005. MAPE
2005. IEEE International Symposium on, 2005, pp. 1546-1550 Vol. 2.
[48] W. Xinsheng, Y. Wei, T. Zhenhui, and C. Shixin, "Performance of space-time block-
coded multicarrier DS-CDMA system in a multipath fading channel," in IEEE 2005
International Symposium on Microwave, Antenna, Propagation and EMC
Technologies for Wireless Communications, 8-12 Aug. 2005, Piscataway, NJ, USA,
2005, pp. 1551-5.
[49] L. K. Bansal and A. Trivedi, "Performance study of space-time trellis coded MC-
CDMA system employing different detection techniques," in 4th International
Conference on Wireless Communication and Sensor Networks, WCSN 2008,
December 27, 2008 - December 29, 2008, Indore, India, 2008, pp. 137-140.
[50] Z. Fayong, "PIC Receiver for MIMO MC-CDMA Systems Based on LCRLSCMA,"
in Wireless Communications, Networking and Mobile Computing, 2008. WiCOM '08.
4th International Conference on, 2008, pp. 1-4.
[51] M. Vehkapera, D. Tujkovic, L. Zexian, and M. Juntti, "Receiver design for spatially
layered downlink MC-CDMA system," Vehicular Technology, IEEE Transactions on,
vol. 54, pp. 1042-1055, 2005.
[52] L. Hanzo, L.-L. Yang, M. Munster, and B.-J. Choi, "Recital on multicarrier
communications: Space-time coded versus adaptive OFDM/MC-CDMA," in

130
SympoTIC'04 - Joint 1st Workshop on Mobile Future and Symposium on Trends in
Communications - Proceedings, October 24, 2004 - October 26, 2004, Bratislava,
Slovakia, 2004, pp. X-XXVIII.
[53] V. Le Nir, M. Helard, and R. Le Gouable, "Space-time block coding applied to turbo
coded multicarrier CDMA," in 57th IEEE Semiannual Vehicular Technology
Conference. VTC 2003, 22-25 April 2003, Piscataway, NJ, USA, 2003, pp. 577-81.
[54] S. Phrompichai and P. Yuvapoositanon, "A space-time chip semiblind multiuser
receiver based on LMS algorithms," in Communications, 2008. APCC 2008. 14th
Asia-Pacific Conference on, 2008, pp. 1-5.
[55] B. Golkar and F. Danilo-Lemoine, "Space-Time Coding and Spatial Multiplexing in
MIMO Multicarrier CDMA," in Personal, Indoor and Mobile Radio
Communications, 2007. PIMRC 2007. IEEE 18th International Symposium on, 2007,
pp. 1-5.
[56] Z. Cheng and Z. Cuifang, "Space-time multiuser detection for space-time block coded
multicarrier CDMA systems," in 2006 International Conference on Communication
Technology, ICCT '06, November 27, 2006 - November 30, 2006, Guilin, China, 2006.
[57] J. Li, K. B. Letaief, and Z. Cao, "Space-time turbo multiuser detection for coded MC-
CDMA," IEEE Transactions on Wireless Communications, vol. 4, pp. 538-549, 2005.
[58] S. Jamallulil, J. P. Cances, and V. Meghdadi, "Space-time-block-coded transmissions
for downlink MC-CDMA transmissions over frequency-selective fading channels,"
Wireless Personal Communications, vol. 39, pp. 63-79, 2006.
[59] N. Kumaratharan, S. Jayapriya, and P. Dananjayan, "STTC based site diversity
technique for MC-CDMA system," in Control, Automation, Communication and
Energy Conservation, 2009. INCACEC 2009. 2009 International Conference on,
2009, pp. 1-5.
[60] N. Kumaratharan, S. Jayapriya, and P. Dananjayan, "STTC based STBC site diversity
technique for MC-CDMA system," in Computing Communication and Networking
Technologies (ICCCNT), 2010 International Conference on, 2010, pp. 1-6.
[61] S. Phrompichai and P. Yuvapoositanon, "A Time-Reversal Space-Time Chip
Semiblind Receiver for TR-STBC Downlink MIMO MC-CDMA Systems," in
Wireless and Mobile Computing, Networking and Communications, 2009. WIMOB
2009. IEEE International Conference, 2009, pp. 19-23.
[62] P. Yuvapoositanon and S. Suwannajan, "A time-reversal-based space-time block
coded blind adaptive MC-CDMA receiver," in 2009 6th International Conference on
Electrical Engineering/Electronics, Computer, Telecommunications and Information
Technology (ECTI-CON), 6-9 May 2009, Piscataway, NJ, USA, 2009, p. 4 pp.
[63] X. Hu and Y. H. Chew, "On the capacity of multicode and variable spreading gain
multirate space-time block coded multicarrier CDMA systems over frequency
selective Rayleigh fading channel," in Vehicular Technology Conference, 2004.
VTC2004-Fall. 2004 IEEE 60th, 2004, pp. 353-357.
[64] N. Kumaratharan and P. Dananjayan, "STSIC Detection for multi-user MIMO MC-
CDMA systems," in TENCON 2008-2008 IEEE Region 10 Conference, 2008, pp. 1-6.

131
[65] G. Senthilkumar and R. Amutha, "Capacity enhancement of multicarrier code division
multiple access (MCCDMA) using orthogonal complete complementary codes and
adaptive constellations," Scientific Research and Essays, vol. 9, pp. 153-161, 2014.
[66] C. Xu, M. El-Hajjar, R. G. Maunder, L.-L. Yang, and L. Hanzo, "Performance of the
Space-Time Block Coded DS-CDMA Uplink Employing Soft-Output ACO-Aided
Multiuser Space-Time Detection and Iterative Decoding," in Vehicular Technology
Conference (VTC 2010-Spring), 2010 IEEE 71st, 2010, pp. 1-5.
[67] D. L. Nicholson, Spread spectrum signal design. LPE and AJ systems. Rockville,
MD, USA: Computer Science Press, 1988.
[68] A. J. Viterbi, CDMA: principles of spread spectrum communication: Addison-Wesley
Pub. Co., 1995.
[69] A. Viterbi, "Spread spectrum communications--Myths and realities," Communications
Magazine, IEEE, vol. 17, pp. 11-18, 1979.
[70] A. J. Viterbi, "Spread spectrum communications: myths and realities,"
Communications Magazine, IEEE, vol. 40, pp. 34-41, 2002.
[71] R. C. Dixon, Spread spectrum techniques: IEEE Press : [distributed by Wiley], 1976.
[72] S. H. Mneney, "Wireless CDMA for rural application," in AFRICON '96, New York,
NY, USA, pp. 408-13.
[73] R. C. Dixon, Spread spectrum systems, 2nd ed. Chichester, Sussex, UK: Wiley, 1984.
[74] N. Yee and J.-P. Linnartz, "BER of multi-carrier CDMA in an indoor Rician fading
channel," in Proceedings of the 27th Asilomar Conference on Signals, Systems &
Computers, November 1, 1993 - November 3, 1993, Pacific Grove, CA, USA, 1993,
pp. 426-430.
[75] N. Yee, J.-P. M. G. Linnartz, and G. Fettweis, "Multi-carrier CDMA in indoor
wireless radio networks," IEICE Transactions on Communications, vol. E77-B, pp.
900-904, 1994.
[76] T. C. D. Group, "4Q 2010 CDMA SUBSCRIBERS," ReportDec 2010 2010.
[77] L. A. A. F. Base. (2011, 27 October). Fact Sheet: Pseudorandom Noise (PRN) Code
Assignments [World Wide Web]. Available:
http://www.losangeles.af.mil/library/factsheets/factsheet.asp?id=8618
[78] N. Moodley and S. H. Mneney, "Recurrent neural networks for sub-optimal multiuser
detection," Transactions of the South African Institute of Electrical Engineers, vol.
97, pp. 105-111, 2006.
[79] H. Hashemi, "The indoor radio propagation channel," Proceedings of the IEEE, vol.
81, pp. 943-968, 1993.
[80] M. B. Mollah and M. R. Islam, "Comparative analysis of Gold Codes with PN codes
using correlation property in CDMA technology," in Computer Communication and
Informatics (ICCCI), 2012 International Conference on, 2012, pp. 1-6.
[81] P. Samundiswary and P. Viswa Kalyan, "Performance Analysis of WCDMA using
Different Spreading Codes," International Journal of Computer Applications, vol. 38,
pp. 8-11, 2012.
[82] G. Suchitra and M. L. Valarmathi, "Performance of Concatenated Complete
Complementary code in CDMA systems," in Cognitive Wireless Systems
(UKIWCWS), 2009 First UK-India International Workshop on, 2009, pp. 1-5.

132
[83] A. Ziani and A. Medouri, "Analysis of different Pseudo-Random and orthogonal
spreading sequences in DS-CDMA," in Multimedia Computing and Systems
(ICMCS), 2012 International Conference on, 2012, pp. 558-564.
[84] D. Muirhead and M. A. Imran, "Alamouti Transmit Diversity for Energy Efficient
Femtocells," in 2011 IEEE 73rd Vehicular Technology Conference (VTC Spring), 15-
18 May 2011, Piscataway, NJ, USA, 2011, p. 5.
[85] V. V. Barinov, V. S. Kuznetsov, and M. V. Lebedev, "Spreading ensembles with
improved correlation properties for multiple access," in Personal, Indoor and Mobile
Radio Communications, 2005. PIMRC 2005. IEEE 16th International Symposium on,
2005, pp. 1081-1085 Vol. 2.
[86] Z. Gu, S. Xie, S. Rahardja, E. T. Sze, and Y. Xin, "Performance Comparison of
Spreading Sequences in Synchronous MC-CDMA Systems," in Information,
Communications and Signal Processing, 2005 Fifth International Conference on,
2005, pp. 633-637.
[87] G. V. S. Raju and J. Charoensakwiroj, "Orthogonal codes performance in multi-code
CDMA," in Systems, Man and Cybernetics, 2003. IEEE International Conference on,
2003, pp. 1928-1931 vol.2.
[88] C. C. Chen, K. Yao, and E. Biglieri, "Optimal spread spectrum sequences-constructed
from Gold codes," in Global Telecommunications Conference, 2000. GLOBECOM
'00. IEEE, 2000, pp. 867-871 vol.2.
[89] M. Pal and S. Chattopadhyay, "A novel orthogonal minimum cross-correlation
spreading code in CDMA system," in Emerging Trends in Robotics and
Communication Technologies (INTERACT), 2010 International Conference on, 2010,
pp. 80-84.
[90] J. Bi, Y. Wang, H. Tian, and K. Yi, "A new method to design CDMA spreading
sequences," in Communication Technology Proceedings, 2000. WCC - ICCT 2000.
International Conference on, 2000, pp. 526-529 vol.1.
[91] K. Khoongming, G. Guang, and D. R. Stinson, "A new family of Gold-like
sequences," in Information Theory, 2002. Proceedings. 2002 IEEE International
Symposium on, 2002, p. 181.
[92] L. Yu and J. Hu, "An improved Gold code for MC-CDMA system," in
Communications, 1999. APCC/OECC '99. Fifth Asia-Pacific Conference on ... and
Fourth Optoelectronics and Communications Conference, 1999, pp. 644-648 vol.1.
[93] D. Kedia, M. Duhan, and S. L. Maskara, "Evaluation of correlation properties of
Orthogonal spreading codes for CDMA wireless mobile communication," in Advance
Computing Conference (IACC), 2010 IEEE 2nd International, 2010, pp. 325-330.
[94] M. Akhavan-Bahabdi and M. Shiva, "Double orthogonal codes for increasing capacity
in MC-CDMA systems," in Wireless and Optical Communications Networks, 2005.
WOCN 2005. Second IFIP International Conference on, 2005, pp. 468-471.
[95] M. Moinuddin, M. Deriche, A. U. H. Sheikh, and A. Zerguine, "Analysis of multiple
access interference in synchronous downlink CDMA systems with random signature
sequences in AWGN and fading environments," in Signal Processing and Its
Applications, 2007. ISSPA 2007. 9th International Symposium on, 2007, pp. 1-4.

133
[96] A. A. Khan, S. Bashir, and S. I. Shah, "An analysis of the effects of multiple access
interference in DS-CDMA reverse link," in Emerging Technologies, 2005.
Proceedings of the IEEE Symposium on, 2005, pp. 182-187.
[97] D. Carey, D. Roviras, and B. Senadji, "Comparison of multiple access interference in
asynchronous MC-CDMA and DS-CDMA systems," in Signal Processing and Its
Applications, 2003. Proceedings. Seventh International Symposium on, 2003, pp. 351-
354 vol.2.
[98] R. H. Mahadevappa and J. G. Proakis, "Mitigating multiple access interference and
intersymbol interference in uncoded CDMA systems with chip-level interleaving,"
Wireless Communications, IEEE Transactions on, vol. 1, pp. 781-792, 2002.
[99] W. M. Jang, L. Nguyen, and P. Bidarkar, "Multiple access and inter-carrier
interference in OFDM-CDMA with random sequences," Communications and
Networks, Journal of, vol. 7, pp. 21-28, 2005.
[100] L. Xuan and B. Senadji, "Multiple Access Interference Analysis in Asynchronous
GSFH/MC-CDMA Systems," in Wireless Communications and Networking
Conference, 2007.WCNC 2007. IEEE, 2007, pp. 197-201.
[101] S. Nagaraj and M. Bell, "Multiple Sequence Multicarrier CDMA for Interference-free
Multiple Access," in Wireless Telecommunications Symposium, 2006. WTS '06, 2006,
pp. 1-4.
[102] S. Sung-Hyuk and P. J. Voltz, "A multiple-access interference suppression technique
employing orthogonal/random spreading sequences and a novel decentralized receiver
for B-CDMA forward link systems in multipath channels," in Circuits and Systems,
1998. ISCAS '98. Proceedings of the 1998 IEEE International Symposium on, 1998,
pp. 550-553 vol.4.
[103] E. M. Abu Anas and A. K. Mostafa, "A new approach to reduce multi-access
interference in DS-CDMA," in Ubiquitous and Future Networks, 2009. ICUFN 2009.
First International Conference, 2009, pp. 16-21.
[104] C. Hsiao-Hwa, C. Shin-Wei, and M. Guizani, "On Next Generation CDMA
Technologies: The REAL Approach for Perfect Orthogonal Code Generation,"
Vehicular Technology, IEEE Transactions on, vol. 57, pp. 2822-2833, 2008.
[105] I. Mahalakshmi and S. Karunakaran, "Review on codes for multiple access
communications," in Electromagnetic Interference and Compatibility, 2003.
INCEMIC 2003. 8th International Conference, 2003, pp. 213-220.
[106] S. Coleri, M. Ergen, A. Puri, and A. Bahai, "A study of channel estimation in OFDM
systems," in 56th Vehicular Technology Conference, September 24, 2002 - September
28, 2002, Vancouver, BC, Canada, 2002, pp. 894-898.
[107] A. L. Intini, "Orthogonal Frequency Division Multiplexing for Wireless Networks -
Standard IEEE 802.11a," University Of California, Santa Barbara, ReportDec 2000
2000.
[108] Y. Bar-Ness, J. P. Linnartz, and L. Xiangqun, "Synchronous multi-user multi-carrier
CDMA communication system with decorrelating interference canceler," in Personal,
Indoor and Mobile Radio Communications, 1994. Wireless Networks - Catching the
Mobile Future., 5th IEEE International Symposium, 1994, pp. 184-188 vol.1.

134
[109] L. Vandendorpe, "Multitone spread spectrum multiple access communications system
in a multipath Rician fading channel," IEEE Transactions on Vehicular Technology,
vol. 44, pp. 327-337, 1995.
[110] S. Hara and R. Prasad, "DS-CDMA, MC-CDMA and MT-CDMA for mobile multi-
media communications," in Proceedings of Vehicular Technology Conference - VTC,
28 April-1 May 1996, New York, NY, USA, 1996, pp. 1106-10.
[111] Q. M. Rahman, A. B. Sesay, and M. Hefnawi, "Two-stage maximum likelihood
estimation (TSMLE) for MT-CDMA signals in the indoor environment," Eurasip
Journal on Wireless Communications and Networking, vol. 2004, pp. 55-66, 2004.
[112] Q. M. Rahman and A. B. Sesay, "Data sequence detection for MT-CDMA signals," in
Electrical and Computer Engineering, 2002. IEEE CCECE 2002. Canadian
Conference, 2002, pp. 1400-1405 vol.3.
[113] Q. M. Rahman and A. B. Sesay, "Noncoherent MT-CDMA system with post-
detection diversity combining," Electrical and Computer Engineering, Canadian
Journal of, vol. 28, pp. 81-88, 2003.
[114] S. Hara and R. Prasad, "Design and performance of multicarrier CDMA system in
frequency-selective Rayleigh fading channels," Vehicular Technology, IEEE
Transactions on, vol. 48, pp. 1584-1595, 1999.
[115] Q. M. Rahman and A. B. Sesay, "Performance evaluation of non-coherent multi-tone
CDMA system," in 2000 Canadian Conference on Electrical and Computer
Engineering Conference Proceedings. Navigating to a New Era, 7-10 March 2000,
Piscataway, NJ, USA, 2000, pp. 245-9.
[116] Q. M. Rahman and A. B. Sesay, "Performance evaluation of non-coherent multi-tone
CDMA system," in Electrical and Computer Engineering, 2000 Canadian
Conference, 2000, pp. 245-249 vol.1.
[117] Q. M. Rahman and A. B. Sesay, "Post-detection diversity combining for non-coherent
MT-CDMA system in a Rician fading channel," in IEEE 54th Vehicular Technology
Conference (VTC FALL 2001), October 7, 2001 - October 11, 2001, Atlantic City,
NJ, United states, 2001, pp. 1034-1038.
[118] Q. M. Rahman and A. B. Sesay, "Diversity combining for MT-CDMA signals in a
fading channel," in Communications, Computers and signal Processing, 2001.
PACRIM. 2001 IEEE Pacific Rim Conference on, 2001, pp. 140-143 vol.1.
[119] Q. M. Rahman and A. B. Sesay, "Post-detection diversity combining for non-coherent
MT-CDMA system in a Rician fading channel," in Vehicular Technology Conference,
2001. VTC 2001 Fall. IEEE VTS 54th, 2001, pp. 1034-1038 vol.2.
[120] Q. M. Rahman and A. B. Sesay, "TSMLE-based MT-CDMA system in Rician Fading
Channel," in 2002 IEEE Canadian Conference on Electrical and Computer
Engineering, May 12, 2002 - May 15, 2002, Winnipeg, Manitoba, Canada, 2002, pp.
1386-1391.
[121] B. Y. Sang, Y. P. Seung, and G. K. Chung, "Multi-carrier parallel combinatory
DS/CDMA system: bandwidth efficient multiple access scheme for indoor wireless
communication," in Universal Personal Communications Record, 1997. Conference
Record., 1997 IEEE 6th International Conference, 1997, pp. 470-474 vol.2.

135
[122] L. Vandendorpe and O. van de Wiel, "Fractionally spaced decision feedback joint
detection for multitone CDMA systems," in Spread Spectrum Techniques and
Applications Proceedings, 1996., IEEE 4th International Symposium, 1996, pp. 1361-
1365 vol.3.
[123] N. Yee and J.-P. Linnartz, "Controlled equalization of multi-carrier CDMA in an
indoor Rician fading channel," in Proceedings of the 1994 IEEE 44th Vehicular
Technology Conference. Part 3 (of 3), June 8, 1994 - June 10, 1994, Stockholm,
Swed, 1994, pp. 1665-1669.
[124] S.-B. Yun, S. Y. Park, and C. G. Kang, "Multi-carrier parallel combinatory
DS/CDMA system: Bandwidth efficient multiple access scheme for indoor wireless
communication," in Proceedings of the 1997 IEEE 6th International Conference on
Universal Personal Communications, ICUPC'97. Part 1 (of 2), October 12, 1997 -
October 16, 1997, San Diego, CA, USA, 1997, pp. 470-474.
[125] R. Ganesh and K. Pahlavan, "Statistical characterisation of a partitioned indoor radio
channel," IEE Proceedings I (Communications, Speech and Vision), vol. 139, pp. 539-
545, 1992.
[126] A. A. Saleh and R. A. Valenzuela, "A statistical model for indoor multipath
propagation," Selected Areas in Communications, IEEE Journal, vol. 5, pp. 128-137,
1987.
[127] T. S. Rappaport, "Characterization of UHF multipath radio channels in factory
buildings," Antennas and Propagation, IEEE Transactions on, vol. 37, pp. 1058-
1069, 1989.
[128] C. C. Huang and R. Khayata, "Delay spreads and channel dynamics measurements at
ISM bands," in Communications, 1992. ICC '92, Conference record,
SUPERCOMM/ICC '92, Discovering a New World of Communications., IEEE
International Conference on, 1992, pp. 1222-1226 vol.3.
[129] I. B. Oluwafemi and S. H. Mneney, "Review of Space‑ time Coded Orthogonal
Frequency Division Multiplexing
Systems for Wireless Communication," IETE Technical Review (Medknow Publications &
Media Pvt. Ltd.), pp. 417-426, 2013.
[130] S. Alamouti, "A simple transmit diversity technique for wireless communications,"
Selected Areas in Communications, IEEE Journal on, vol. 16, pp. 1451-1458, 1998.
[131] V. Tarokh, H. Jafarkhani, and A. R. Calderbank, "Space-time block codes from
orthogonal designs," Information Theory, IEEE Transactions, vol. 45, pp. 1456-1467,
1999.
[132] V. Tarokh, H. Jafarkhani, and A. R. Calderbank, "Space-time block coding for
wireless communications: performance results," Selected Areas in Communications,
IEEE Journal on, vol. 17, pp. 451-460, 1999.
[133] V. T. Vakili and M. T. Mohebbi, "A new scheme for signal reception in MC-CDMA
systems with space-time block coding," in 2005 International Conference on Wireless
and Optical Communications Networks, 6-8 March 2005, Piscataway, NJ, USA,
2005, pp. 463-7.

136
[134] B. Seo and J. Y. Ahn, "LMS adaptive receiver for uplink space-time coded MC-
CDMA systems," in 12th International Conference on Advanced Communication
Technology: ICT for Green Growth and Sustainable Development, ICACT 2010,
February 7, 2010 - February 10, 2010, Korea, Republic of, 2010, pp. 839-843.
[135] H. Li, W. Yang, Z. Tan, and S. Cheng, "Performance of space-time block-coded MC-
CDMA system in multipath fading channel," in MAPE2005: IEEE 2005 International
Symposium on Microwave, Antenna, Propagation and EMC Technologies for
Wireless Communications, August 8, 2005 - August 12, 2005, Beijing, China, 2005,
pp. 1546-1550.
[136] L. K. Bansal and A. Trivedi, "Comparative study of space-time trellis code
concatenated with space-time block code MC-CDMA system," in 2009 IEEE
International Advance Computing Conference. IACC 2009, 6-7 March 2009,
Piscataway, NJ, USA, 2009, pp. 1099-102.
[137] R. C. Dixon, Spread Spectrum Signals and Systems: IEEE, 1985.
[138] J. G. Proakis and M. Salehi, Digital communications, 2th ed.: McGraw-Hill, 1989.
[139] R. Gold, "Maximal recursive sequences with 3-valued recursive cross-correlation
functions (Corresp.)," Information Theory, IEEE Transactions on, vol. 14, pp. 154-
156, 1968.
[140] R. Gold, "Optimal binary sequences for spread spectrum multiplexing (Corresp.),"
Information Theory, IEEE Transactions on, vol. 13, pp. 619-621, 1967.
[141] R. C. Dixon, Spread Spectrum Systems, 2nd ed.: Wiley John + Sons, 1984.
[142] D. V. Sarwate and M. B. Pursley, "Crosscorrelation properties of pseudorandom and
related sequences," Proceedings of the IEEE, vol. 68, pp. 593-619, 1980.
[143] E. H. Dinan and B. Jabbari, "Spreading codes for direct sequence CDMA and
wideband CDMA cellular networks," Communications Magazine, IEEE, vol. 36, pp.
48-54, 1998.
[144] O. B. Wojuola and S. H. Mneney, "Performance of even-and odd-degree Gold codes
in a multi-user spread-spectrum system," in Wireless Communications, Vehicular
Technology, Information Theory and Aerospace & Electronic Systems (VITAE), 2014
4th International Conference, Aalborg, Denmark, 2014, pp. 1-5.
[145] O. B. Wojuola and S. H. Mneney, "Multiple-access interference of Gold codes in a
DS-CDMA system," SAIEE African Research Journal, vol. Volume 106, pp. 4-10,
2015.
[146] A. Goldsmith, Wireless communications: Cambridge university press, 2005.
[147] B. Vucetic and J. Yuan, Space-time coding: John Wiley & Sons, 2003.
[148] H. Jafarkhani, Space-time coding: theory and practice: Cambridge university press,
2005.
[149] I. B. Oluwafemi, "Super-orthogonal space-time turbo-coded OFDM systems," PhD,
School of Engineering, University of KwaZulu-Natal, Durban, 2012.


![1 Filterbank Multicarr ier and Multicarrier CDMA for ...rolke/content/gpx7iep1t1.pdfApr 15, 2007 · of CDMA and multicarrier technology [11], where pack ets are spread in the frequenc](https://img.dokumen.tips/doc/110x75/6002cb91ff3e600ce77a0b9a/1-filterbank-multicarr-ier-and-multicarrier-cdma-for-rolkecontent-apr-15.jpg)