Embed Size (px)
Citation preview
NCCCS Performance Measures for Student
Success
Dr. Vincent Castano, Director of Institutional EffectivenessJanet Sexton, Office of Institutional Effectiveness (Data Management)
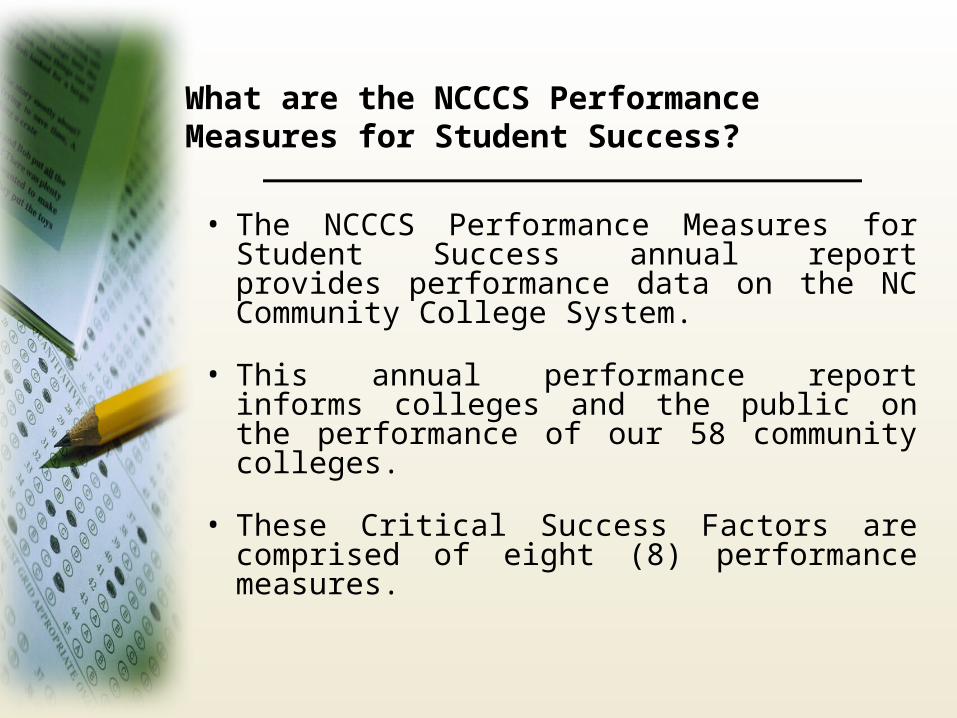
What are the NCCCS Performance Measures for Student Success?
• The NCCCS Performance Measures for Student Success annual report provides performance data on the NC Community College System.
• This annual performance report informs colleges and the public on the performance of our 58 community colleges.
• These Critical Success Factors are comprised of eight (8) performance measures.
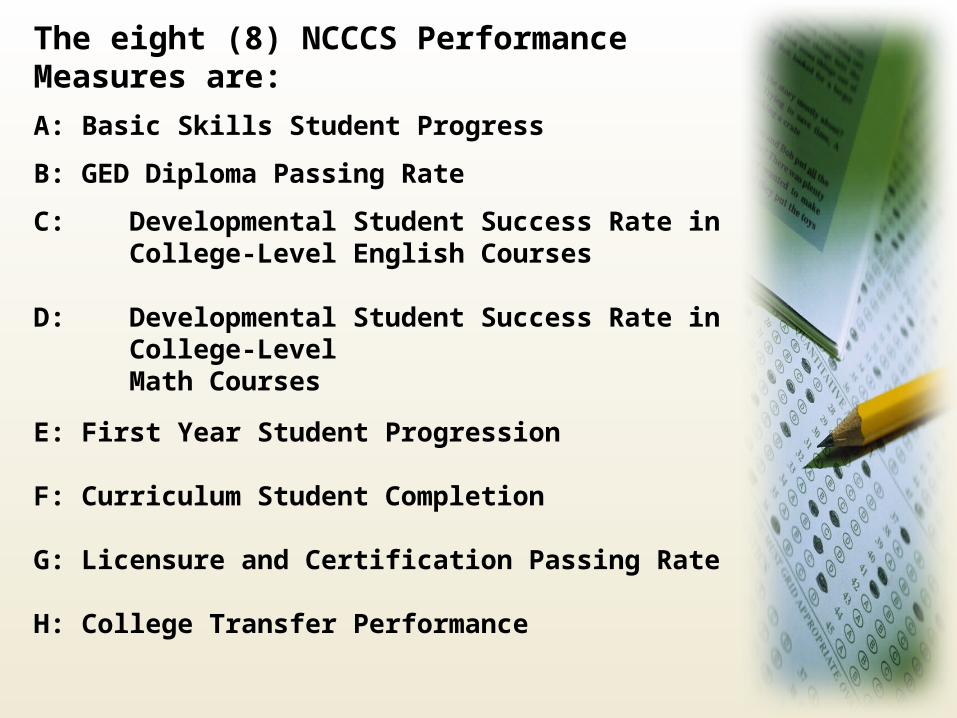
The eight (8) NCCCS Performance Measures are:
A: Basic Skills Student Progress
B: GED Diploma Passing Rate
C: Developmental Student Success Rate in College Level ‐English Courses
D: Developmental Student Success Rate in College Level ‐Math Courses
E: First Year Student Progression F: Curriculum Student Completion G: Licensure and Certification Passing Rate H: College Transfer Performance
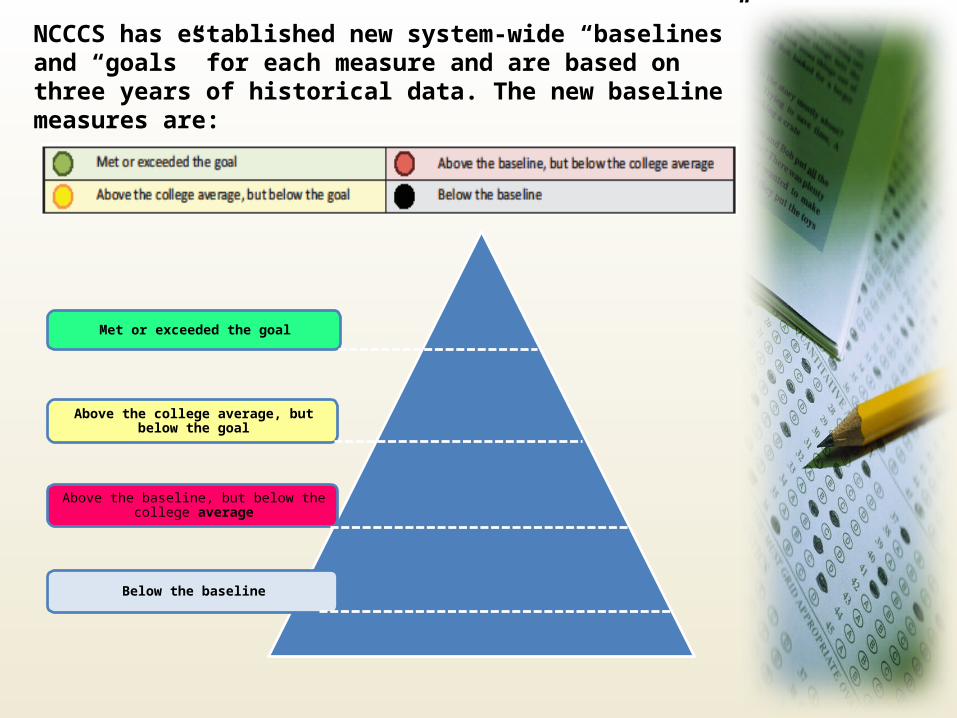
NCCCS has established new system‐wide “baselines” and “goals” for each measure and are based on three years of historical data. The new baseline measures are:
Met or exceeded the goal
Above the college average, but below the goal
Above the baseline, but below the college average
Below the baseline
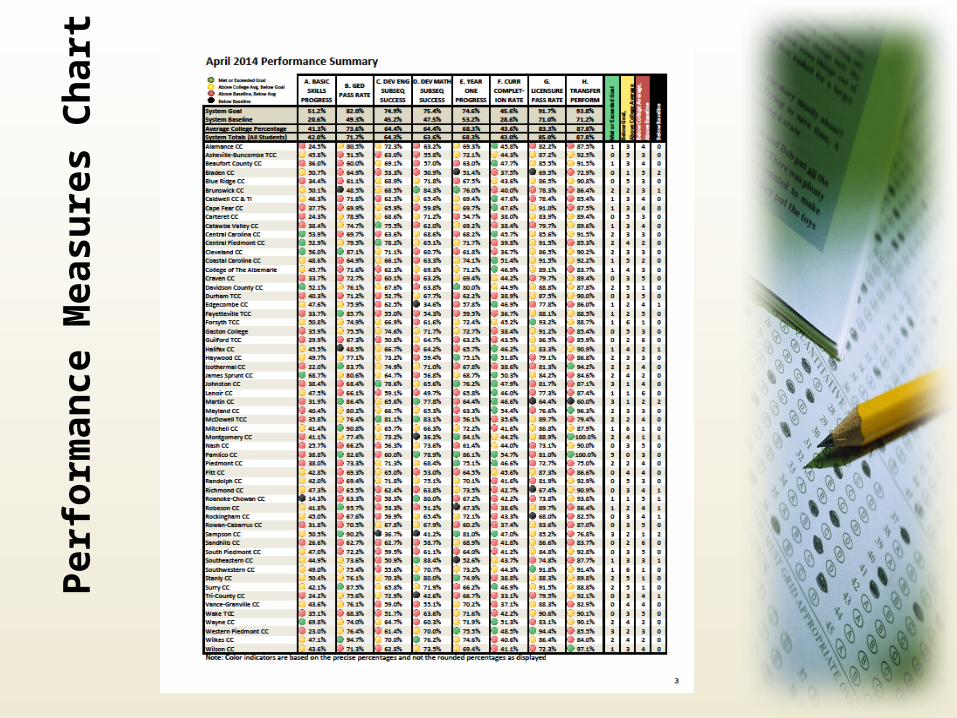
Per
form
ance
Mea
sure
s C
har
t
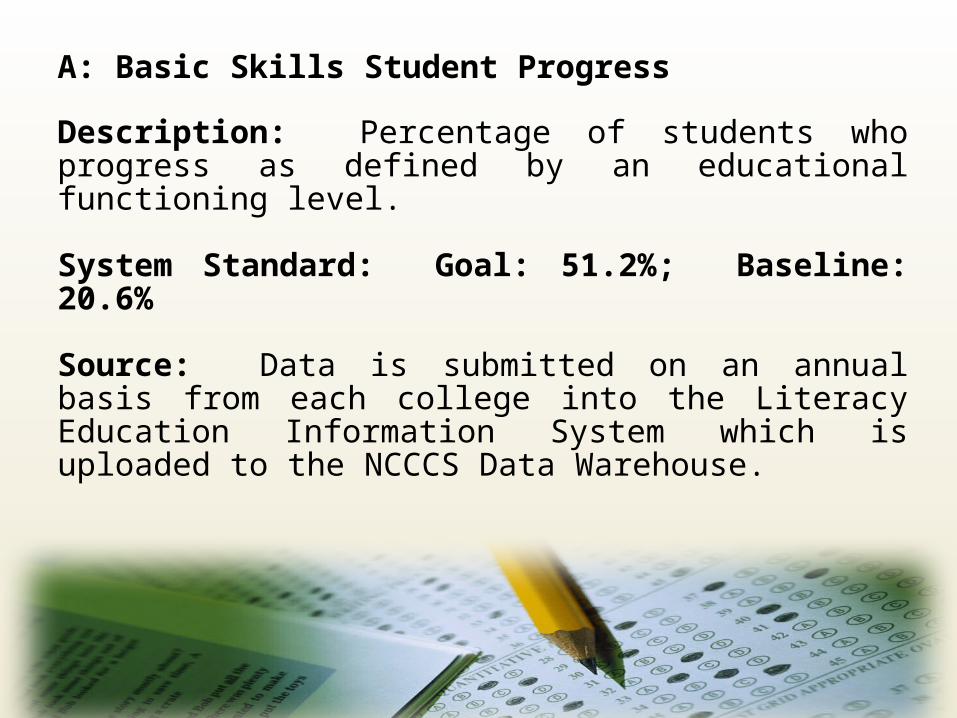
Description: Percentage of students who progress as defined by an educational functioning level.
System Standard: Goal: 51.2%; Baseline: 20.6%
Source: Data is submitted on an annual basis from each college into the Literacy Education Information System which is uploaded to the NCCCS Data Warehouse.
A: Basic Skills Student Progress
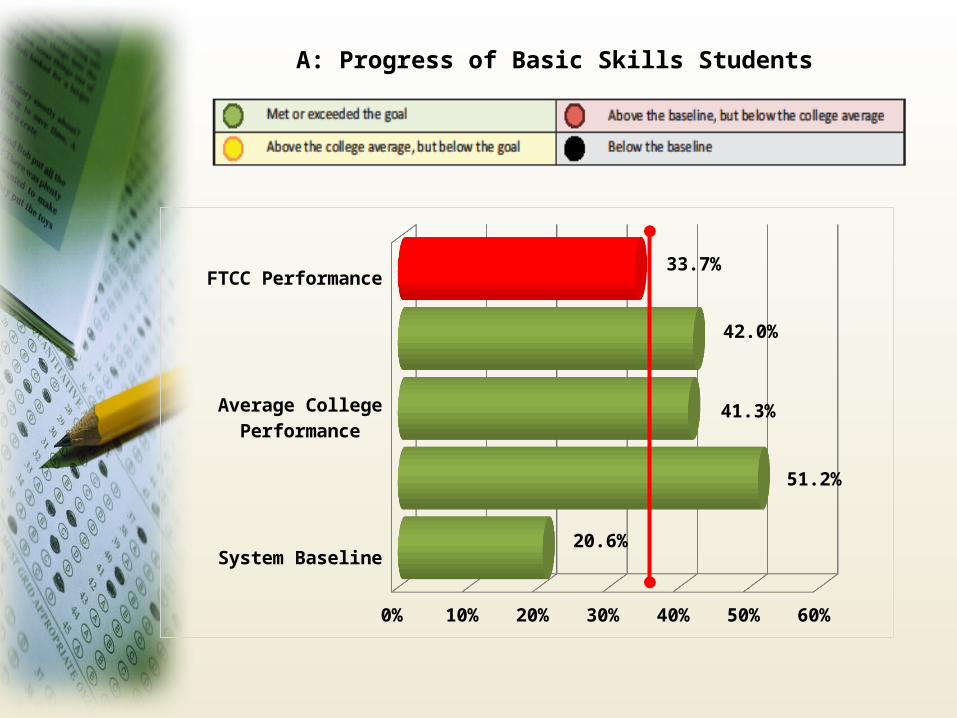
A: Progress of Basic Skills Students
System Baseline
System Goal
Average College Performance
System Total Performance
FTCC Performance
0% 10% 20% 30% 40% 50% 60%
20.6%
51.2%
41.3%
42.0%
33.7%
Description: Percentage of students taking at least one GED test during a program year who receive a GED diploma during theprogram year.
System Standard: Goal: 82.0%; Baseline: 49.3%
Source: Data is submitted on an annual basis from each college into the Literacy Education Information System which is uploaded to the NCCCS Data Warehouse. Oklahoma Scoring GED test files.
B: GED Diploma Passing Rate
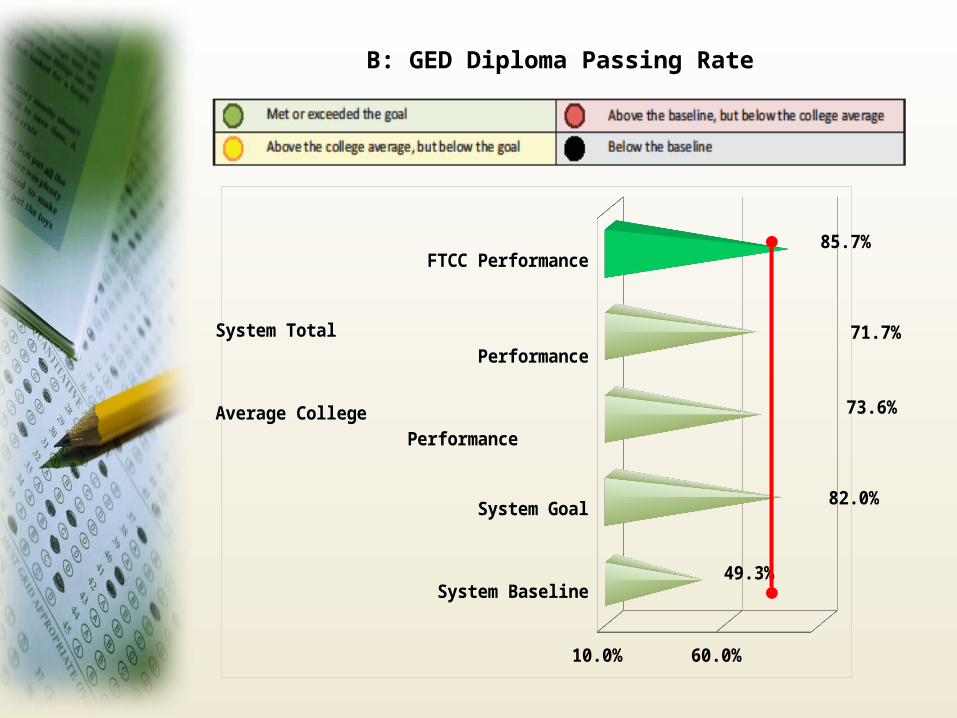
B: GED Diploma Passing Rate
System Baseline
System Goal
Average College Performance
System Total Performance
FTCC Performance
49.3%
82.0%
73.6%
71.7%
85.7%
Description: Percentage of previous developmental English and/or reading students who successfully complete a credit English course with a grade of “P”, “C” or better upon the first attempt.
System Standard: Goal: 74.9%; Baseline: 45.2%
Source: Curriculum Registration, Progress, Financial Aid Report (CRPFAR) data file
C: Developmental Student Success Rate in College Level English ‐Courses
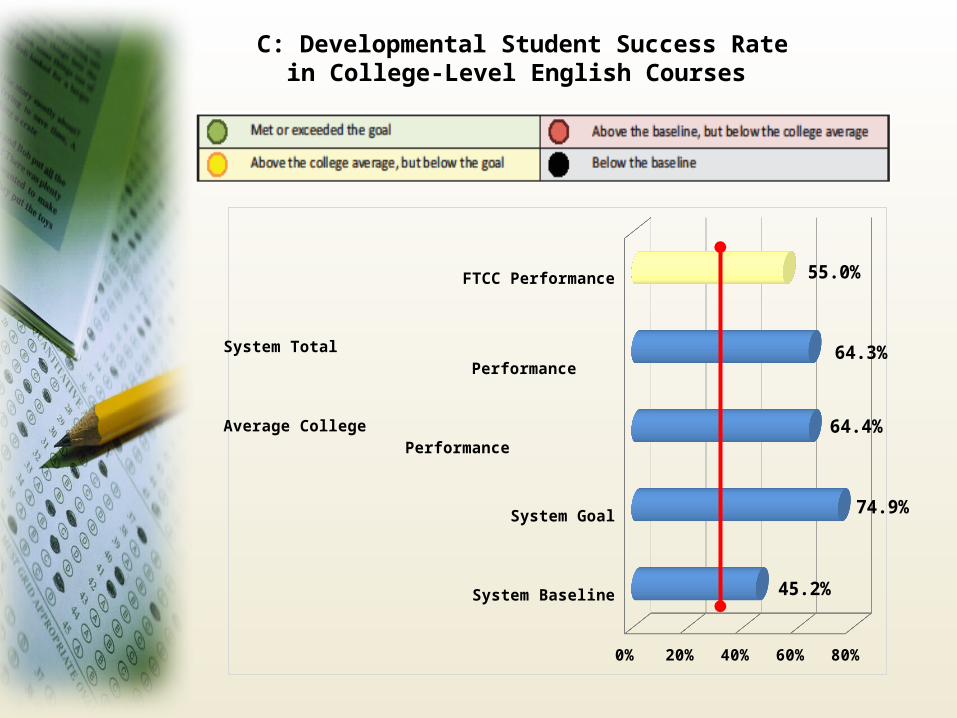
System Baseline
System Goal
Average College Performance
System Total Performance
FTCC Performance
0% 10% 20% 30% 40% 50% 60% 70% 80%
45.2%
74.9%
64.4%
64.3%
55.0%
C: Developmental Student Success Rate in College‐Level English Courses
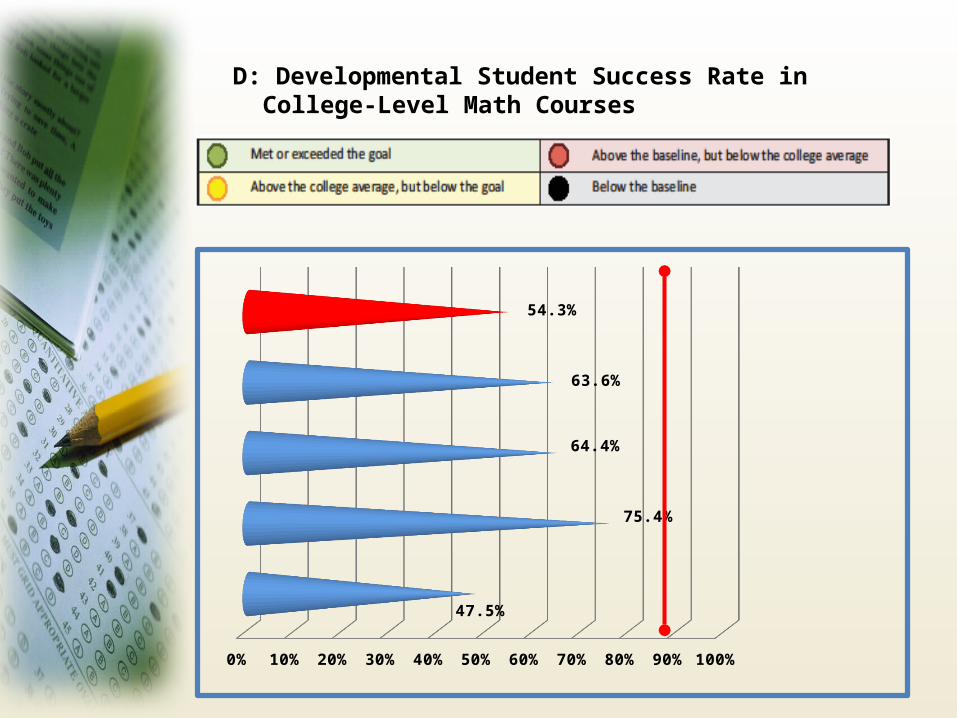
Description: Percentage of previous developmental math students who successfully complete a credit math course with a “C” or better upon the first attempt.
System Standard: Goal: 75.4%; Baseline: 47.5%
Source: Curriculum Registration, Progress, Financial Aid Report (CRPFAR) data file
D: Developmental Student Success Rate in College‐Level Math Courses
Sy
Sy
Av
Sy
FT
0% 10% 20% 30% 40% 50% 60% 70% 80% 90% 100%
47.5%
75.4%
64.4%
63.6%
54.3%
D: Developmental Student Success Rate in College‐Level Math Courses
Description: Percentage of first time fall credential seeking students ‐ ‐attempting at least twelve hours within their first academic year who successfully complete (“P”, “C” or better) at least twelve of those hours.
System Standard: Goal: 74.6%; Baseline: 53.2%
Source: Curriculum Registration, Progress, Financial Aid Report (CRPFAR) data file National Student Clearinghouse
E: First Year Progression
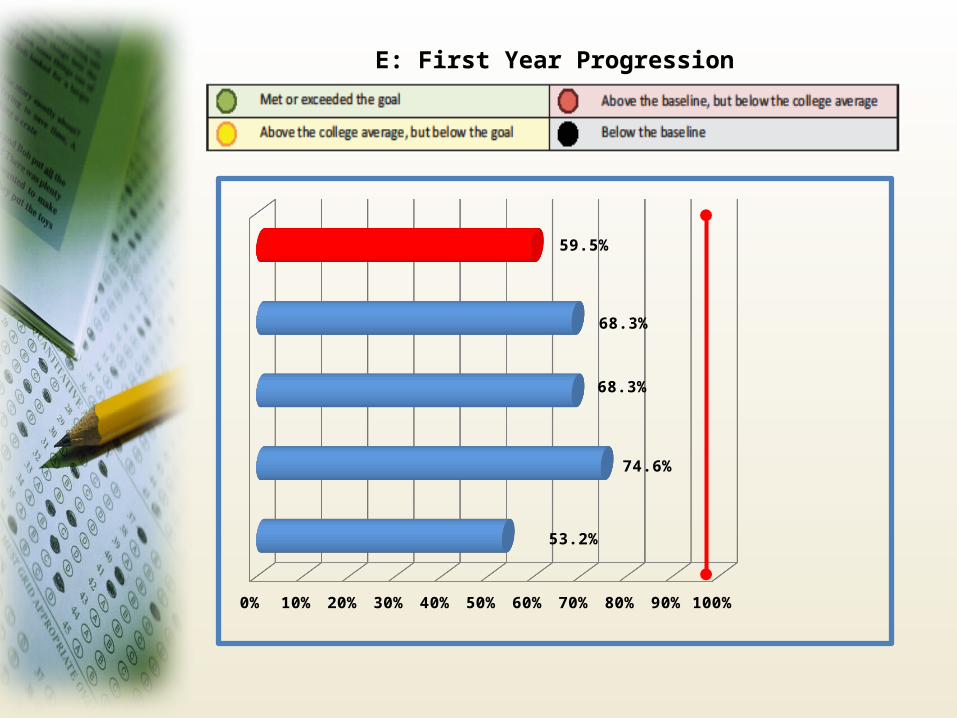
0% 10% 20% 30% 40% 50% 60% 70% 80% 90% 100%
53.2%
74.6%
68.3%
68.3%
59.5%
E: First Year Progression
Description: Percentage of first time fall credential seeking students who ‐ ‐graduate, transfer, or are still enrolled with 36 hours after six years.
System Standard: Goal: 45.6%; Baseline: 28.6%
Source: Curriculum Registration, Progress, Financial Aid Report (CRPFAR) data file & National Student Clearinghouse
F: Curriculum Student Completion
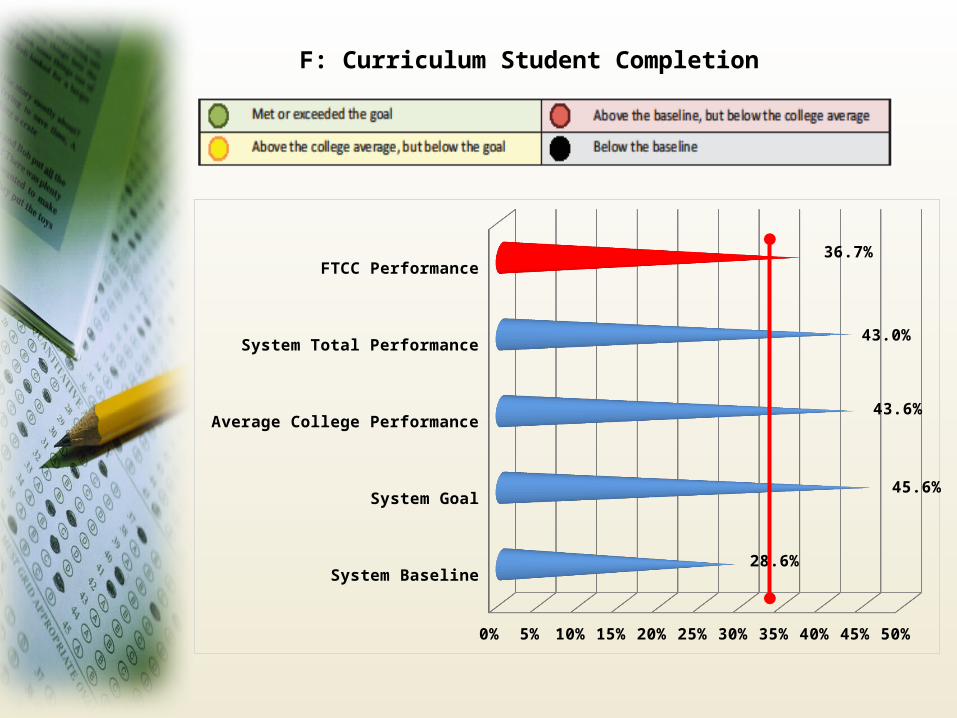
System Baseline
System Goal
Average College Performance
System Total Performance
FTCC Performance
0% 5% 10% 15% 20% 25% 30% 35% 40% 45% 50%
28.6%
45.6%
43.6%
43.0%
36.7%
F: Curriculum Student Completion
Description: Aggregate institutional passing rate of first time test takers ‐on licensure and certification exams. Exams included inthis measure are state mandated exams which candidates must pass before becoming active practitioners.
System Standard: Goal: 91.7%; Baseline: 71.0%
Source: Various licensing agencies.
G: Licensure and Certification Passing Rate
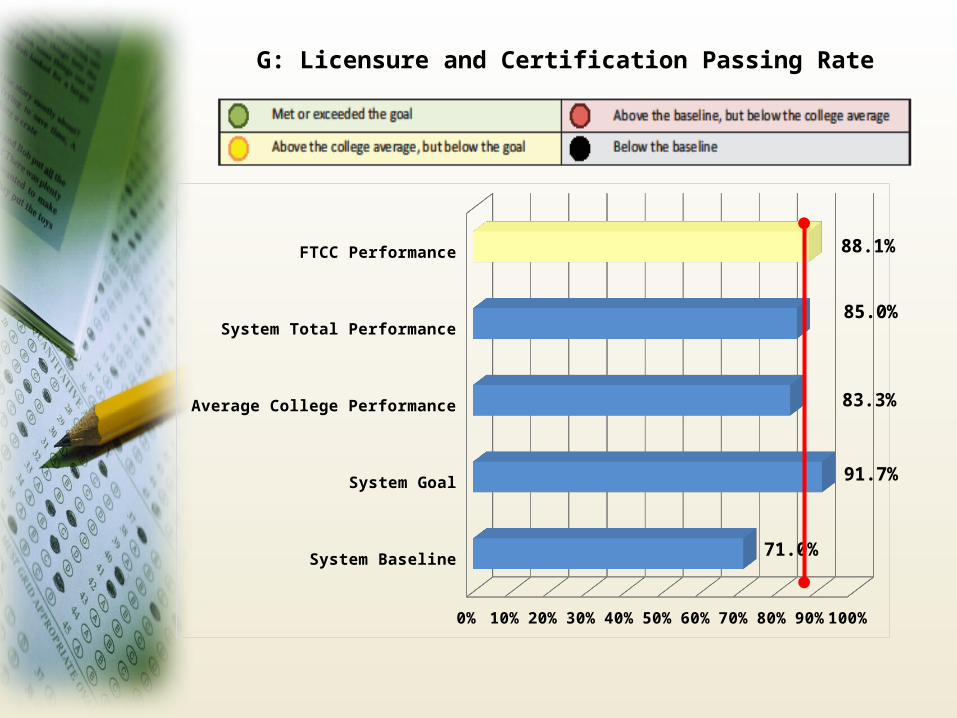
System Baseline
System Goal
Average College Performance
System Total Performance
FTCC Performance
0% 10% 20% 30% 40% 50% 60% 70% 80% 90% 100%
71.0%
91.7%
83.3%
85.0%
88.1%
G: Licensure and Certification Passing Rate
Description: Among community college associate degree completers and those who have completed 30 or more credit hours who transfer to a four‐year university or college, the percentage who earn a GPA of 2.00 or better after two consecutive semesters within the academic year at the transfer institution.
System Standard: Goal: 93.8%; Baseline: 71.2%
Source: Curriculum Registration, Progress, Financial Aid Report (CRPFAR) data file; National Student Clearinghouse ; UNC General Administration; ‐Participating NC Independent Colleges and Universities
H: College Transfer Performance
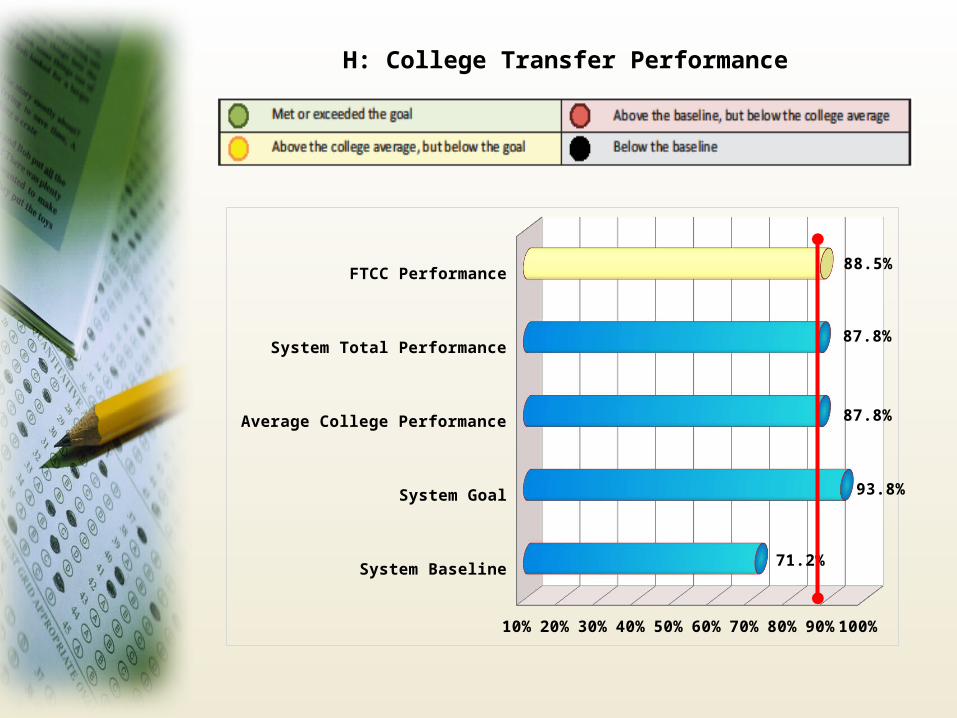
H: College Transfer Performance
System Baseline
System Goal
Average College Performance
System Total Performance
FTCC Performance
10% 20% 30% 40% 50% 60% 70% 80% 90% 100%
71.2%
93.8%
87.8%
87.8%
88.5%
What can we do?Work as a team to ensure FTCC meets or exceeds the NCCCS Critical Success Factors standards.
Identify those students who are most at-risk and apply interventions available through the College to the best of your ability.
Students that do not pass or completely withdraw can negatively impact different aspects of the report.
Collaborate with colleagues regarding best practices to learning from basic skills to curriculum.
Identify perceived deficiencies within your respective areas and collaborate with others to help remediate or improve those aspects.
If you have discovered a best practice that works, share with your colleagues.
Most importantly, communicate!