Embed Size (px)
Citation preview

P E R F O R M A N C E M A D E E A S Y
U S E R G U I D E
MyGo

2
WELCOMEThank you for choosing the MyGo Pro.
The MyGo Pro provides unmatched performance in a convenient format. Novel Full Spectrum Optics deliver 120 optical channels of fluorescence data from every tube for exceptional multiplex PCR. High-performance Peltier elements, combined with solid silver blocks, provide both speed and proven world-leading thermal uniformity. Performance made easy...
3
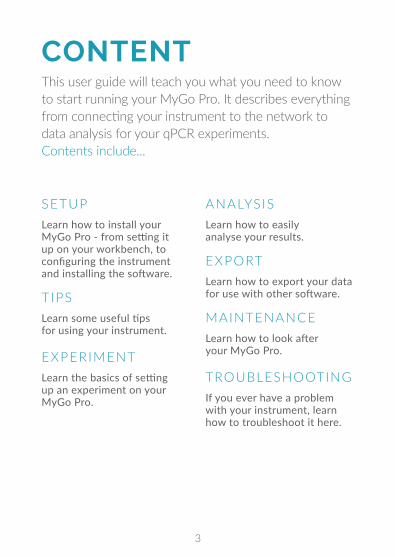
CONTENTThis user guide will teach you what you need to know to start running your MyGo Pro. It describes everything from connecting your instrument to the network to data analysis for your qPCR experiments. Contents include...
SETUPLearn how to install your MyGo Pro - from setting it up on your workbench, to configuring the instrument and installing the software.
TIPSLearn some useful tips for using your instrument.
EXPERIMENT Learn the basics of setting up an experiment on your MyGo Pro.
ANALYSIS Learn how to easily analyse your results.
EXPORT Learn how to export your data for use with other software.
MAINTENANCE Learn how to look after your MyGo Pro.
TROUBLESHOOTINGIf you ever have a problem with your instrument, learn how to troubleshoot it here.

4
1. MYGO PRO QPCR INSTRUMENT 2 . MYGO PRO USER GUIDE3. POWER SUPPLY UNIT AND MAINS CABLE4. ETHERNET CABLE5. USB DRIVE
Please keep the flight case and outer box the MyGo Pro came in, in case you need to protect your MyGo Pro during storage or shipment in future.
Lid
USB Port
SETUPINSTALLING YOUR MYGO PRO
You should have the following items in the MyGo Pro flight case:

5
LID
The lid ensures that tubes are seated correctly in the wells, provides optical isolation, includes a heated lid to reduce condensation, and prevents dust falling into empty wells.
DISPLAY LEDs
The MyGo Pro uses display LEDs to help you understand what the instrument is doing. Here is a summary of these display LEDs.
Blue Initialising
Green Idle
Red Lid open - Please close the lid
Yellow Tubes loaded
Blue Running, low temperature
Pink Running, medium temperature
Red Running, high temperature
Cyan Experiment complete
Red-Flashing Fault detected
USB PORT
Insert the USB drive here to run an experiment from the USB drive.

6
MYGO PRO CONNECTIONSThe MyGo Pro has three connections. One in the front and two in back as shown below:
This is for connecting your MyGo Pro to your LAN or computer.
This is to connect your MyGo Pro to the provided power supply unit.
ETHERNET PORT POWER
Ethernet Port
Power
7
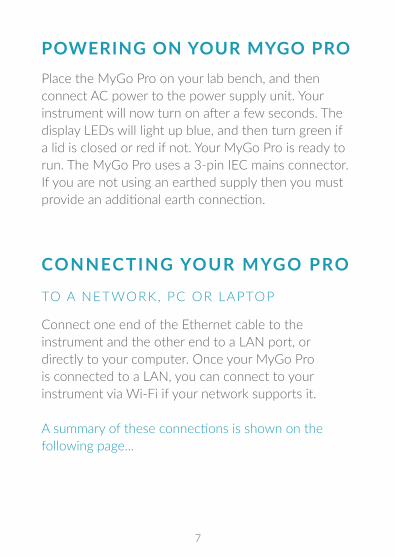
Connect one end of the Ethernet cable to the instrument and the other end to a LAN port, or directly to your computer. Once your MyGo Pro is connected to a LAN, you can connect to your instrument via Wi-Fi if your network supports it.
POWERING ON YOUR MYGO PROPlace the MyGo Pro on your lab bench, and then connect AC power to the power supply unit. Your instrument will now turn on after a few seconds. The display LEDs will light up blue, and then turn green if a lid is closed or red if not. Your MyGo Pro is ready to run. The MyGo Pro uses a 3-pin IEC mains connector. If you are not using an earthed supply then you must provide an additional earth connection.
CONNECTING YOUR MYGO PRO
TO A NETWORK, PC OR LAPTOP
A summary of these connections is shown on the following page...

8

9
MYGO PRO HEATED LIDThe MyGo Pro heated lid will get hot. Please do not touch it. The heated lid will be preheated to 105ºC if user activity is detected. This enables your run to start as soon as possible. After 5 minutes of inactivity the heated lid will be turned off to conserve energy.
Heated LidDo not touch

10
Your MyGo USB drive contains software for Windows, Mac OS X, and Linux operating systems. Please open the software file matching your chosen operating system. The latest version of the software can also be downloaded from our website mygopcr.com.
WINDOWS
Double-click on the Windows installer and follow the on-screen instructions to install your MyGo Pro software on Windows.
MAC OS X
Double-click on the disk image and follow the on-screen instructions to install your MyGo Pro software on your Mac PC.
INSTALLING YOUR MYGO PRO SOFTWARE
11
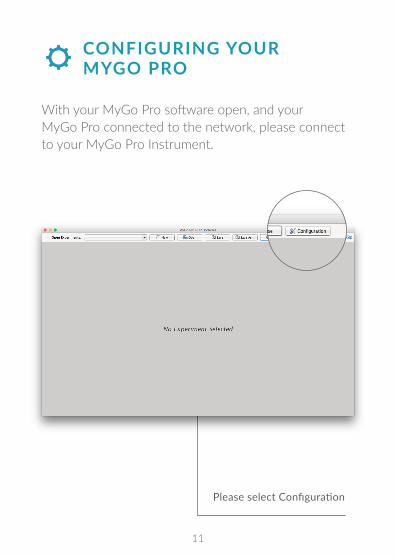
With your MyGo Pro software open, and your MyGo Pro connected to the network, please connect to your MyGo Pro Instrument.
Please select Configuration
CONFIGURING YOUR MYGO PRO
12
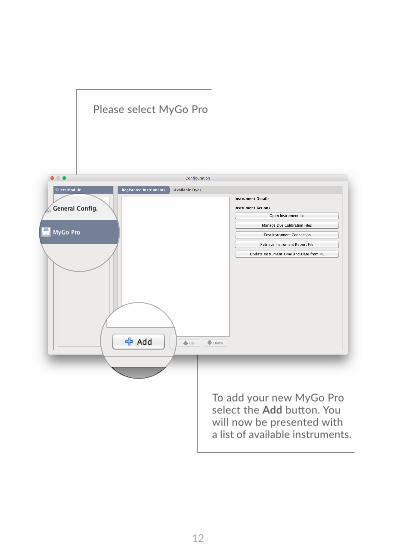
To add your new MyGo Pro select the Add b utton. You will now be presented with a list of available instruments.
Please select MyGo Pro

13
Double-click on the instrument you wish to connect to, or pr ess Select with the instrument selected. The instrument will now be added to the list of Registered Instruments for use in the software.
14
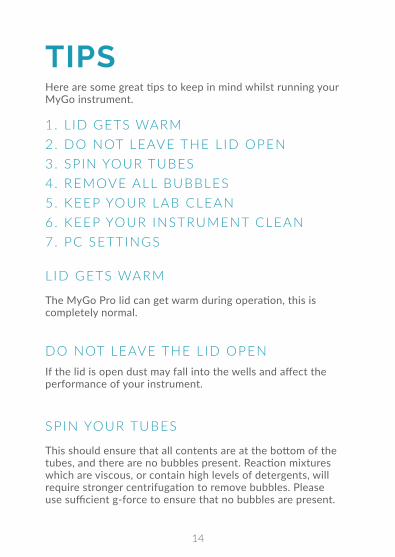
TIPSHere are some great tips to keep in mind whilst running your MyGo instrument.
1. LID GETS WARM 2. DO NOT LEAVE THE L ID OPEN3. SPIN YOUR TUBES4. REMOVE ALL BUBBLES5. KEEP YOUR LAB CLEAN6. KEEP YOUR INSTRUMENT CLEAN7. PC SETTINGS
LID GETS WARM
The MyGo Pro lid can get warm during operation, this is completely normal.
SPIN YOUR TUBES
This should ensure that all contents are at the bottom of the tubes, and there are no bubbles present. Reaction mixtures which are viscous, or contain high levels of detergents, will require stronger centrifugation to remove bubbles. Please use sufficient g-force to ensure that no bubbles are present.
DO NOT LEAVE THE L ID OPENIf the lid is open dust may fall into the wells and affect the performance of your instrument.

15
REMOVE ALL BUBBLES
Bubbles can cause optical artefacts as shown in the graph below. Ensure that no bubbles are present in reaction volumes.
KEEP YOUR LAB CLEAN
Please keep your work space clean including all lab equipment like surfaces, pipettes, and tube racks. This will keep the instrument clean and help maintain good results.
KEEP YOUR INSTRUMENT CLEAN
We recommend a routine cleaning of your instrument. To do so follow the cleaning guide in the Maintenance section.
PC SETTINGS
Please disable all power saving settings e.g. sleep and hibernate.
Inte
nsity
(RFU
)
Cycle
Artefact
16
CREATE A NEW EXPERIMENT
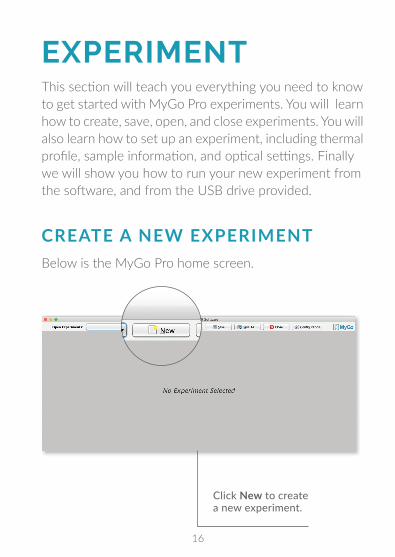
EXPERIMENTThis section will teach you everything you need to know to get started with MyGo Pro experiments. You will learn how to create, save, open, and close experiments. You will also learn how to set up an experiment, including thermal profile, sample information, and optical settings. Finally we will show you how to run your new experiment from the software, and from the USB drive provided.
Below is the MyGo Pro home screen.
Click New to create a new experiment.

17
EXPERIMENT SUMMARY
Once you have created a new experiment the E xperiment Summary w ill be displayed as shown below:
By default the experiment name will be “N ew Experiment” with a date and time stamp, which can be edited.
The summary will give you information about the instrument you are running, the settings chosen, and any useful notes you choose to add about your experiment.
18
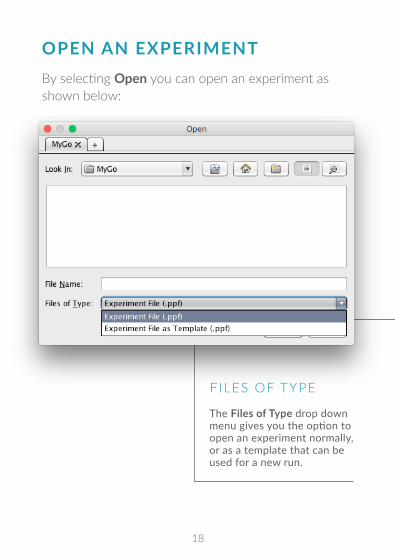
The Files of Type drop down menu gives you the option to open an experiment normally, or as a template that can be used for a new run.
OPEN AN EXPERIMENTBy selecting O pen y ou can open an experiment as shown below:
FILES OF TYPE
19
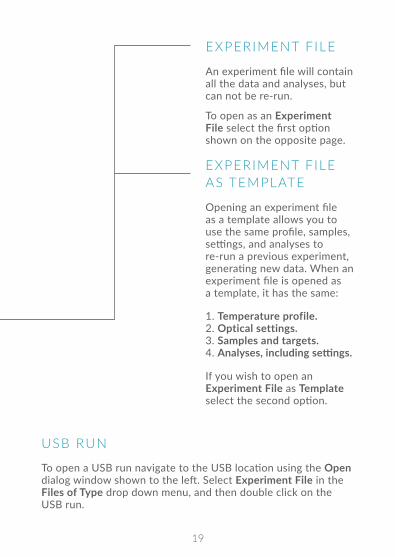
EXPERIMENT FILE
An experiment file will contain all the data and analyses, but can not be re-run.
To open as an Experiment File s elect the first option shown on the opposite page.
EXPERIMENT FILE AS TEMPLATE
Opening an experiment file as a template allows you to use the same profile, samples, settings, and analyses to re-run a previous experiment, generating new data. When an experiment file is opened as a template, it has the same:
1. Temperature profile. 2. Optical settings. 3. Samples and targets. 4. Analyses, including settings.
If you wish to open an E xperiment File as Template s elect the second option.
USB RUN
To open a USB run navigate to the USB location using the Open dialog window shown to the left. Select Experiment File in the Files of Type drop down menu, and then double click on the USB run.

20
SAVING AN EXPERIMENTOnce an experiment has completed it can either be automatically saved to a pre-set location on your computer or manually saved by you. The experiment must be saved before the software is closed to ensure that data is not lost.
AUTOMATIC SAVING
When starting a run you will be prompted with the window displayed below.
Make sure the first checkbox is selected and your experiments will be automatically saved. To prevent the software from showing this dialog again, select the second checkbox. You can change these settings later by clicking Configuration and selecting General Config.
To automatically save your data when the run has finished, firstly click Browse and choose the location to save your run to.
21
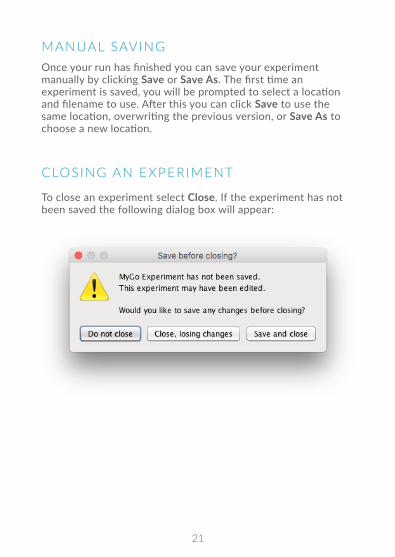
MANUAL SAVINGOnce your run has finished you can save your experiment manually by clicking Save or Save As. The first time an experiment is saved, you will be prompted to select a location and filename to use. After this you can click Save to use the same location, overwriting the previous version, or Save As to choose a new location.
CLOSING AN EXPERIMENT
To close an experiment select C lose. If the experiment has not been saved the following dialog box will appear:

22
SETTING UP A PROFILEIn this section we will cover Hold Times, Programs and setting up a temperature profile.
HOLD TIMESDuring thermal cycling protocols hold times should be chosen to allow for the following: thermal equilibration of reaction volumes; completion of biochemical reactions, for example full length strand extension; and optical data acquisition.
Typically, optical data is acquired at the same temperature that strand extension occurs. By default this time is set to 30s, However, this time can be reduced to a minimum of 17s, to save time, or increased to more than 30s in order to increase PCR efficiency and optical sensitivity.
For other hold times during cycling protocols, by default times are set to 10s. However, this time can be reduced to a minimum of 3s, to save time, or increased to more than 10s in order to increase PCR efficiency.

23
A thermal profile is required to perform an experiment.
Select the profile tab as shown below:
PROGRAMS
To add a program to your experiment click A dd i n the P rograms p ane. Programs can be deleted by selecting them in the list then clicking D elete. The program order can also be altered by selecting the program to move then clicking the U p a nd D own arrows.
24
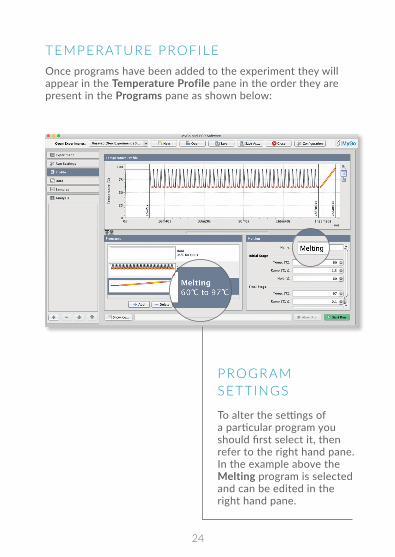
TEMPERATURE PROFILEOnce programs have been added to the experiment they will appear in the T emperature Profile p ane in the order they are present in the P rograms pane as shown below:
PROGRAM SETTINGS
To alter the settings of a particular program you should first select it, then refer to the right hand pane. In the example above the Melting program is selected and can be edited in the right hand pane.
25
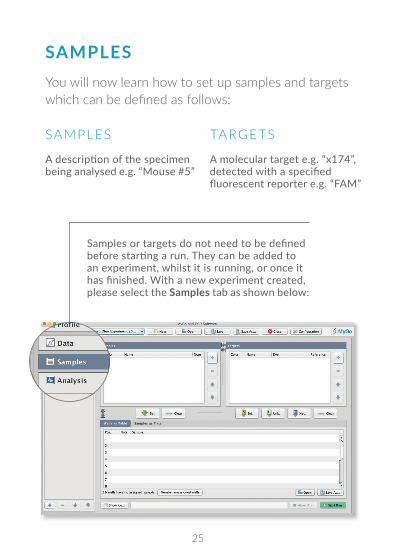
SAMPLESYou will now learn how to set up samples and targets which can be defined as follows:
SAMPLES TARGETS
A description of the specimen being analysed e.g. “Mouse #5”
A molecular target e.g. “x174”, detected with a specified fluorescent reporter e.g. “FAM”
Samples or targets do not need to be defined before starting a run. They can be added to an experiment, whilst it is running, or once it has finished. With a new experiment created, please select the Samples tab as shown below:
26
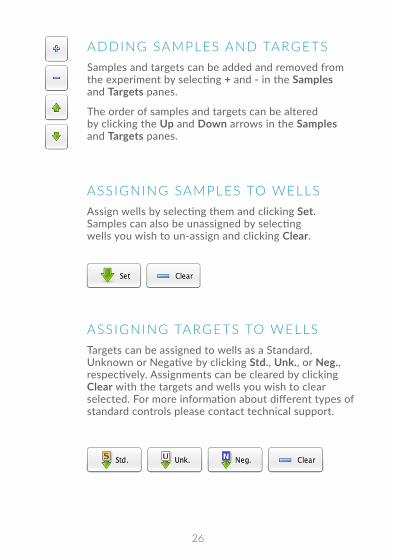
ADDING SAMPLES AND TARGETSSamples and targets can be added and removed from the experiment by selecting + and - in the Samples and Targets panes.
The order of samples and targets can be altered by clicking the Up and Down arrows in the Samples and Targets panes.
ASSIGNING SAMPLES TO WELLS Assign wells by selecting them and clicking Set. Samples can also be unassigned by selecting wells you wish to un-assign and clicking Clear.
ASSIGNING TARGETS TO WELLS Targets can be assigned to wells as a Standard, Unknown or Negative by clicking Std., Unk., or Neg., respectively. Assignments can be cleared by clicking Clear with the targets and wells you wish to clear selected. For more information about different types of standard controls please contact technical support.
27
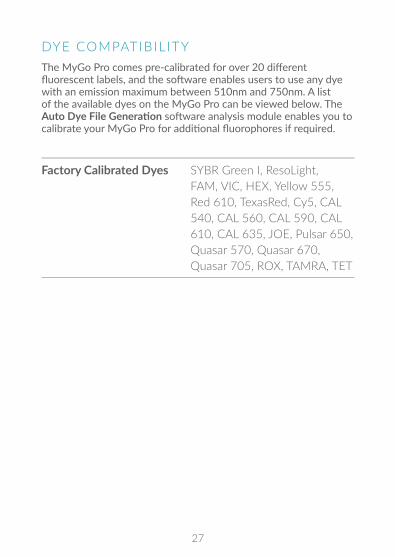
DYE COMPATIBIL ITYThe MyGo Pro comes pre-calibrated for over 20 different fluorescent labels, and the software enables users to use any dye with an emission maximum between 510nm and 750nm. A list of the available dyes on the MyGo Pro can be viewed below. The Auto Dye File Generation software analysis module enables you to calibrate your MyGo Pro for additional fluorophores if required.
Factory Calibrated Dyes SYBR Green I, ResoLight, FAM, VIC, HEX, Yellow 555, Red 610, TexasRed, Cy5, CAL 540, CAL 560, CAL 590, CAL 610, CAL 635, JOE, Pulsar 650,
Quasar 570, Quasar 670, Quasar 705, ROX, TAMRA, TET

28
Sample and target setups can be saved in the following formats:
SAVING AND OPENING A SAMPLE SETUPIf you wish to save or open sample and target information setup you can select Save As., or Open, respectively.
CSV Editable .csv files.
PSD A proprietary locked file format.
RDML The Real-time PCR Data Markup Language (RDML) is a structured and universal data standard for exchanging quantitative PCR (qPCR) data.
29
RUN SETTINGSThe MyGo Pro run settings tab is where you will determine the optical settings, view your dye calibrations and access the advanced settings.
OPTICS SETTINGS
The MyGo Pro will aquire optical data during the hold times. The longer the hold times are the better your optical data will be. Different reagents can require different optical settings.
INTERCALATING DYES
These dyes, for example SYBR Green I, ResoLight and EvaGreen, are bright reagents and require a shorter integration time.
SEQUENCE-SPECIFIC PROBES
These dyes, for example FAM, VIC and HEX, are commonly used for TaqMan genotyping or multiplex experiments. Hydrolysis probes are not as bright as Intercalating dyes and therefore require a longer integration time.
30
INTEGRATION TIME
Integration Time is the exposure time, in seconds, of the optical sensor inside the MyGo instrument during thermal cycling. Brighter reagents require shorter integration times than dimmer reagents.
DYE CALIBRATIONS
Here is where you can review the current dyes present in your experiment. You have the following options when working with dyes in your MyGo Pro software:
OPEN Open dye files from a file to be added to this experiment.
SAVE
Save a dye file from your experiment to a file on your computer. These can then be used on multiple computers and MyGo Pro instruments.
REMOVE
Remove dye files from this experiment. Factory calibrated dye files can not be removed.
RENAME Rename your dye files to your liking.
UPDATE FROM DEVICE Upload dye files from your MyGo Pro to your new experiment.

31
ADVANCED SETTINGS
Here, if necessary, you can tailor optical settings to the characteristics of your assay.
You can adjust Amplification Integration Time to increase, or decrease the sensitivity of the MyGo Pro fluorescence detection system. Longer integration times will provide improved signal to noise with dim fluorescent reporters. Short integration times will reduce the risk of the fluorescence detection system being saturated by very bright fluorescent reporters.
For your convenience, at the end of every run, your MyGo Pro will record a Recommended Amplification Integration Time in the Run Log. Runs where every well contains a strong positive sample will enable your MyGo Pro to estimate the most accurate Recommended Integration Time for your assay.
OPTIMISE MELT ACQUISITIONS
By default your MyGo Pro will use automatically optimised integration time settings during melting analysis. If you want your MyGo Pro to use the Amplification Integration Time during both amplification and melting analysis, deselect this tick box.
32
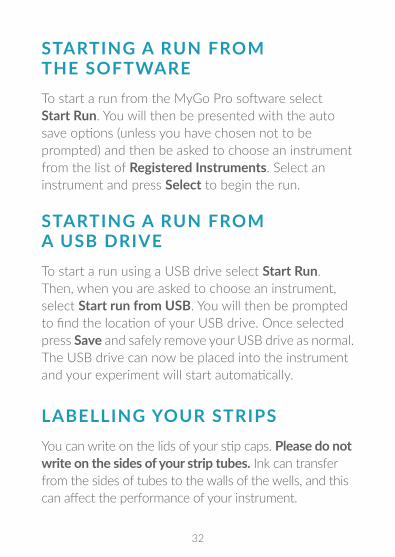
STARTING A RUN FROM THE SOFTWARETo start a run from the MyGo Pro software select S tart Run. Y ou will then be presented with the auto save options (unless you have chosen not to be prompted) and then be asked to choose an instrument from the list of R egistered Instruments. Select an instrument and press S elect t o begin the run.
STARTING A RUN FROM A USB DRIVETo start a run using a USB drive select Start Run. Then, when you are asked to choose an instrument, select Start run from USB. You will then be prompted to find the location of your USB drive. Once selected press Save and safely remove your USB drive as normal. The USB drive can now be placed into the instrument and your experiment will start automatically.
LABELLING YOUR STRIPSYou can write on the lids of your stip caps. Please do not write on the sides of your strip tubes. Ink can transfer from the sides of tubes to the walls of the wells, and this can affect the performance of your instrument.

33
LOADING STRIPS INTO YOUR MYGO PROIn order to ensure that the heated lid is balanced, please make sure that the mount contains at least a strip in rows A and D (as shown in blue below) or single tubes in wells A1, A8, D1 and D8. These positions can be filled with tubes containing reagents, or empty tubes.
A
1 2 3 4 5 6 7 8
C
B
D

34
ANALYSISThis section will teach you about different types of analysis available. These can be grouped into the following groups. For information about more analysis options please contact technical support.
QUANTIFICATION Determine accurate quantities of template or relative expression levels of genes using Absolute Quantification or R elative Quantification.
GENOTYPING Use TaqMan probes or High Resolution Melting to perform SNP genotyping using A utomatic Endpoint Genotyping or A utomatic High Resolution Melt.
MELTING Automatically determine the melting temperature of your amplicons using A utomatic Tm Calling.
RUN FUSION Combine data from multiple runs on your MyGo Pro for analysis together.
35
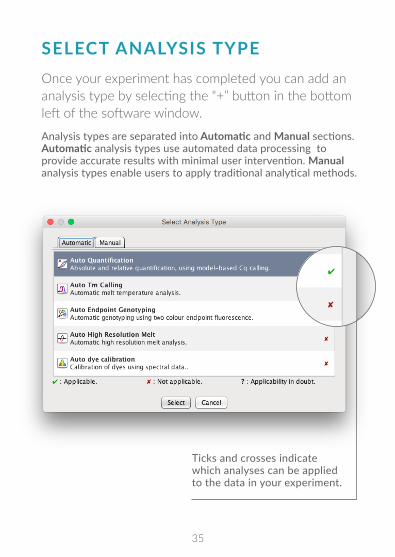
Analysis types are separated into Automatic and Manual sections. Automatic analysis types use automated data processing to provide accurate results with minimal user intervention. Manual analysis types enable users to apply traditional analytical methods.
SELECT ANALYSIS TYPE Once your experiment has completed you can add an analysis type by selecting the “+” button in the bottom left of the software window.
Ticks and crosses indicate which analyses can be applied to the data in your experiment.

36
QUALITY
Quality is a measure of how clean an amplification appears. This value will tend to be higher for amplifications with a clear exponential phase and steady baseline, and lower for noisier or flatter curves.
High
Low
AUTOMATIC QUANTIFICATIONPOSITIVE / NEGATIVE CALLINGThe first step in amplification analysis is to determine which targets have produced a positive amplification curve, and which amplifications have produced a negative amplification curve.
For every amplification curve the software calculates three metrics, these metrics are used to determine which amplifications are positive. These metrics are:
37
High
High
Low
Low
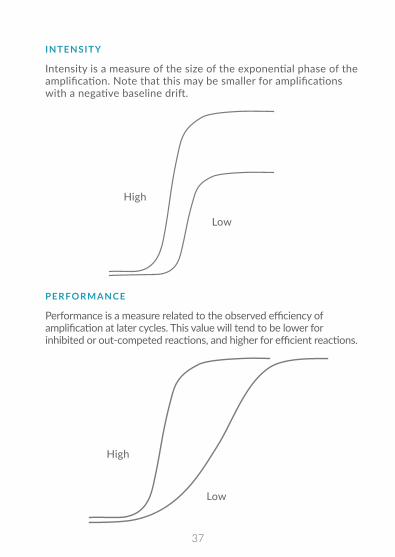
INTENSITY
Intensity is a measure of the size of the exponential phase of the amplification. Note that this may be smaller for amplifications with a negative baseline drift.
PERFORMANCE
Performance is a measure related to the observed efficiency of amplification at later cycles. This value will tend to be lower for inhibited or out-competed reactions, and higher for efficient reactions.

38
The dots represent individual amplification curves in your experiment. All dots that are within the top right of the graph are called positive and will be subject to normalization determined in Advanced Settings.
To switch between “Intensity vs Quality” and “Performance vs Quality” select the Graph Axes drop down menu. All 3 thresholds are used for calling even if they are not currently displayed on the graph.
SETTINGSThe software uses a combination of Quality (Q), Performance (P), and Intensity (I) thresholds to determine if an amplification is positive (green zone) or negative (red zone). All values (Q, P and I) must be above the relevant threshold for an amplification to be called positive. The Settings tab enables you to review metrics for amplifications and set appropriate thresholds.
39
EXCL. CYC. MIN.
The software will exclude at least this number of cycles from data before performing analysis.
AUTO EXCL. CYC.
By default the software will automatically determine which cycles at the beginning of a run exhibit artefacts, and exclude this number of cycles from data before performing analysis. This feature can be disabled by deselecting this option.
ARTEFACT FILTERINGBiochemical and physical factors can cause fluorescence levels to change during a run. These are often observed during early cycles. Filtering out these artefacts can improve the accuracy of amplification analysis. Two settings enable you to control the process of filtering out such artefacts.
40
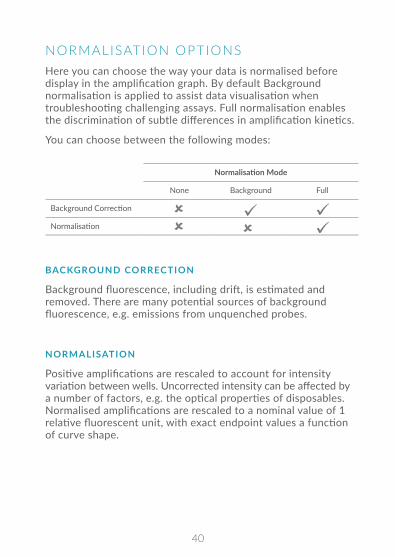
NORMALISATION OPTIONSHere you can choose the way your data is normalised before display in the amplification graph. By default Background normalisation is applied to assist data visualisation when troubleshooting challenging assays. Full normalisation enables the discrimination of subtle differences in amplification kinetics.
You can choose between the following modes:
Normalisation Mode
None Background Full
Background Correction
Normalisation
BACKGROUND CORRECTION
Background fluorescence, including drift, is estimated and removed. There are many potential sources of background fluorescence, e.g. emissions from unquenched probes.
NORMALISATION
Positive amplifications are rescaled to account for intensity variation between wells. Uncorrected intensity can be affected by a number of factors, e.g. the optical properties of disposables. Normalised amplifications are rescaled to a nominal value of 1 relative fluorescent unit, with exact endpoint values a function of curve shape.
41
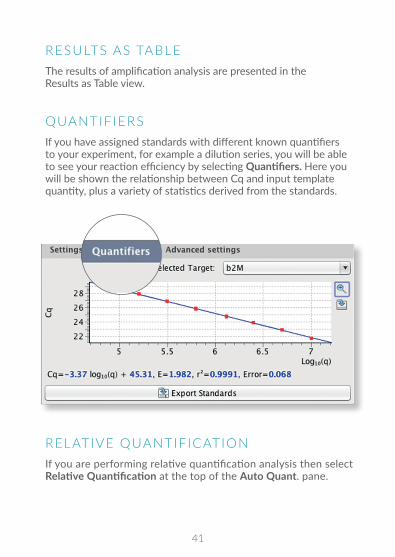
QUANTIFIERS If you have assigned standards with different known quantifiers to your experiment, for example a dilution series, you will be able to see your reaction efficiency by selecting Quantifiers. Here you will be shown the relationship between Cq and input template quantity, plus a variety of statistics derived from the standards.
RESULTS AS TABLE The results of amplification analysis are presented in the Results as Table view.
RELATIVE QUANTIFICATION If you are performing relative quantification analysis then select R elative Quantification a t the top of the A uto Quant. pane.
42
MULTIPLEXINGThe MyGo Pro supports multiplexing with a broad variety of dyes.
FOR BEST RESULTS:
• Ensure that there is no competition between the different PCR in the multiplex reaction.
• Ensure that probes have low background fluorescence, for example by using dual-quenched probes.
• Ensure that probe signal strength is balanced, by using an appropriate concentration of primers and probes.
• Make sure to select the correct dye for each Target.
• Generate assay specific dye files if necessary.
TIPSSpectral properties of fluorophores can vary as a result of many factors, including stereochemistry, sequence context and buffer chemistry. If you observe spectral crosstalk, generate assay specific dye files to compensate for these effects.

43
DYE EXPERIMENTDye file generation allows you to calibrate your MyGo Pro for new dyes that are not included in the factory-calibrated list. This calibration is based on a PCR amplification using the relevant dye or labelled probe.
DYE CALIBRATION RUNYou will need to perform a real time PCR run in order to generate a dye file. Every well of your MyGo Pro should contain the same reagents. These reagents should produce a single PCR product, and a strong signal for the dye that you are calibrating. Create a sample named after the dye that you are calibrating, and assign that sample to all wells.
DYE FILE GENERATION

44
DYE DATA
Select this tab to view the wells that will be used in the calibration.
AMPLIFICATION
Select this tab to view the cycles that will be used in the calibration.
AUTO DYE CALIBRATIONSelect the Auto Dye Calibration option in the Select Analysis Type window. The Auto Dye Calibration analysis module will analyse changes in fluorescence during the dye calibration run to create a new dye file.

45
Select the Use Wells drop down menu and you will see the list of samples present in the experiment. Select the sample you wish to create a dye from.
USE CALIBRATION IN CURRENT EXPERIMENT
By selecting this option your new dye file will appear in the target list in this experiment. This option will not save the dye file to your computer.
EXPORT CALIBRATION TO FILE
Alternatively you can save this new dye file to your Mac or PC.
EXPORT CALIBRATION Select the Dye Data tab and you can choose to export the calibration to a file, or, use it in your current experiment.
46
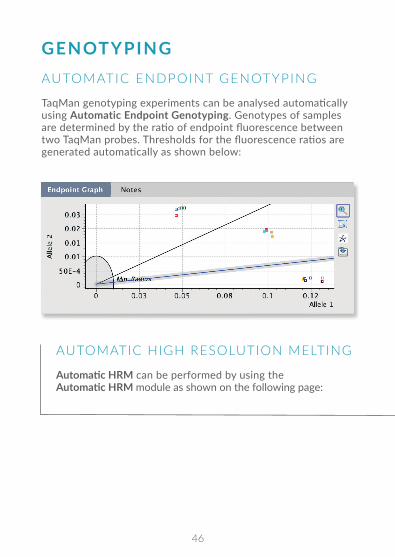
GENOTYPINGAUTOMATIC ENDPOINT GENOTYPING
TaqMan genotyping experiments can be analysed automatically using A utomatic Endpoint Genotyping. Genotypes of samples are determined by the ratio of endpoint fluorescence between two TaqMan probes. Thresholds for the fluorescence ratios are generated automatically as shown below:
A utomatic HRM c an be performed by using the A utomatic HRM m odule as shown on the following page:
AUTOMATIC HIGH RESOLUTION MELTING

47
AUTOMATIC HIGH RESOLUTION MELTING
DIFFERENCE, NORMALIZED AND MELT Once opened the analysis module will automatically determine optimised parameters and generate a set of D ifference, Normalized a nd M elt g raphs.
CLUSTERING
The difference curves will then be converted into a clustering graph showing clusters of different genotypes.
GENOTYPES The software will automatically determine I nferred genotypes b ased on the clustering graph. You can define your control G enotypes u sing the G enotypes p ane.
48
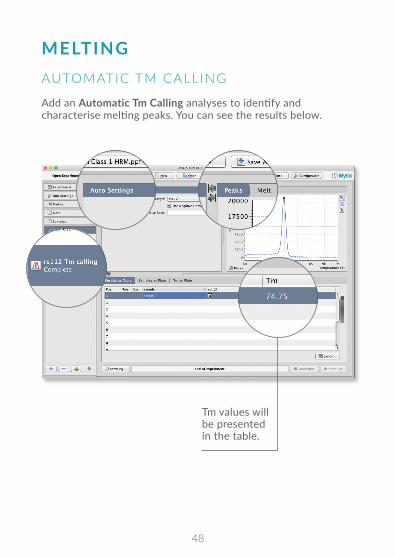
MELTINGAUTOMATIC TM CALLING
Add an Automatic Tm Calling analyses to identify and characterise melting peaks. You can see the results below.
Tm values will be presented in the table.

49
AUTO SETTINGS The user has the option to change the target if the experiment contains more than one target. The signal-to-noise ratio setting determines how big a peak should be before it is called. Increasing this value will increase specificity of peak detection. Decreasing this value will increase the sensitivity of peak detection.
PEAKS AND MELTS The P eaks pane will show you the melt peaks with melting point indicators. The M elts pane will show you the melting curves of the same reactions.

50
RUN FUSIONRun Fusion enables you to combine data from multiple runs from your MyGo Pro together for analysis. To fuse multiple experiments together hold down cmd on a Mac or Ctrl on a PC and select the files you wish to fuse from the open dialog window as shown below.
Select Open and then from the next dialog select Fuse 2 files into one. You can also open files as separate experiments using Open 2 Files.

51
If you are fusing experiments from multiple file locations you must select the first experiment and then select the “+” from the top left of the open file dialogue window as shown below.
Now hold cmd/Ctrl and select the next experiment. Select Open to fuse your experiments together.

52
TABLE EXPORT
EXPORTWhen you have finished analysing your data in the MyGo software, you can export the results in a variety of ways, from raw data to user defined custom reports. This section will take you through the steps you need in order to do this.
From panes showing results in tabular format you can export data using the Export button.
53
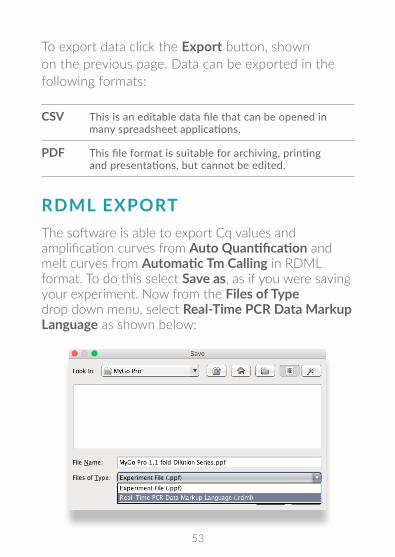
CSV This is an editable data file that can be opened in many spreadsheet applications.
PDF This file format is suitable for archiving, printing and presentations, but cannot be edited.
To export data click the Export button, shown on the previous page. Data can be exported in the following formats:
RDML EXPORT The software is able to export Cq values and amplification curves from Auto Quantification and melt curves from Automatic Tm Calling in RDML format. To do this select Save as, as if you were saving your experiment. Now from the Files of Type drop down menu, select Real-Time PCR Data Markup Language as shown below:

54
GRAPH EXPORT
From panes showing results as graphs, such as amplification and melt curve data can be exported by selecting the button from the below example.
The user can export information as bitmap images (.PNG), Scalable Vector Graphics (.SVG), Character-Separated Variable (.CSV), or Portable Document Format (.PDF).
PNG This is a bitmap image.
SVG A Scalable Vector Graphic is an XML-vector based graphic that can be used where a high resolution scalable graph is required, for example for papers or web design.
CSV This contains information about the graph you are exporting in spreadsheet format.
PDF This contains the graph you are exporting in the Portable Document Format. The graph is in vector format for higher quality.

55
REPORT GENERATION Customisable reports can be generated from your experiment by selecting Experiment Report under the Experiment tab. This provides you with the ability to choose which parts of the data to include in a report. For example, items such as thermal profiles, sample information and various analysis results, e.g. Tm values or quantities can be included, or excluded from reports.
Please select Experiment Report.
56
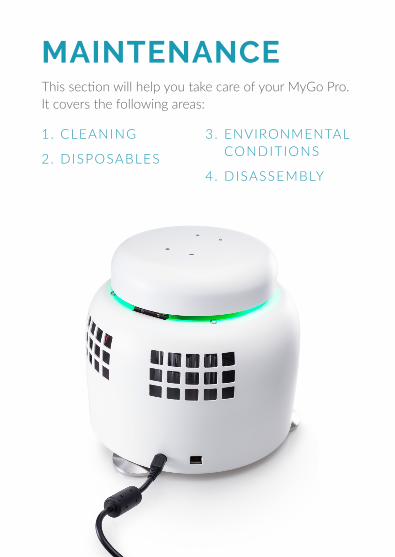
MAINTENANCE This section will help you take care of your MyGo Pro. It covers the following areas:
1 . CLEANING
2. DISPOSABLES
3. ENVIRONMENTAL CONDITIONS
4. DISASSEMBLY
57
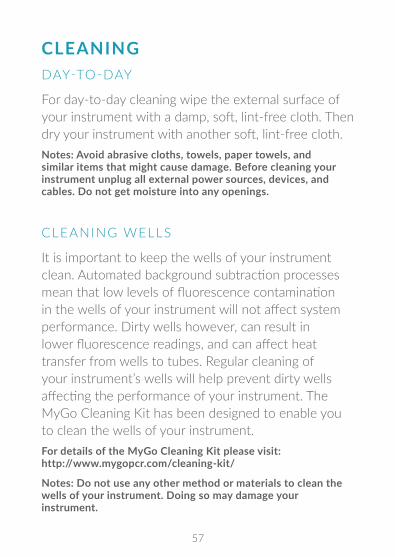
CLEANINGDAY-TO-DAY
For day-to-day cleaning wipe the external surface of your instrument with a damp, soft, lint-free cloth. Then dry your instrument with another soft, lint-free cloth.Notes: Avoid abrasive cloths, towels, paper towels, and similar items that might cause damage. Before cleaning your instrument unplug all external power sources, devices, and cables. Do not get moisture into any openings.
CLEANING WELLS
It is important to keep the wells of your instrument clean. Automated background subtraction processes mean that low levels of fluorescence contamination in the wells of your instrument will not affect system performance. Dirty wells however, can result in lower fluorescence readings, and can affect heat transfer from wells to tubes. Regular cleaning of your instrument’s wells will help prevent dirty wells affecting the performance of your instrument. The MyGo Cleaning Kit has been designed to enable you to clean the wells of your instrument.For details of the MyGo Cleaning Kit please visit: http://www.mygopcr.com/cleaning-kit/
Notes: Do not use any other method or materials to clean the wells of your instrument. Doing so may damage your instrument.

58
DECONTAMINATION
If your instrument needs decontaminating please follow the instructions contained in the MyGo Decontamination Guide.For details of the MyGo Decontamination Guide please visit: http://www.mygopcr.com/decontamination/
Please note that for health and safety reasons you must print and complete a physical copy of the decontamination form, and include this with any instrument or lid that is returned. The form must be sent with the instrument, and we can not accept electronic versions of the form. Failure to comply with these guidelines will result in a charge for decontamination.
DISPOSABLESWe recommend the use of MyGo disposables for optimal results. If you wish to use third party disposables please note the following:
A. Physical dimensions should be the same as the MyGo disposables to ensure that they fit into your instrument, without damaging it.
B. Caps should seal tubes effectively in order to prevent variability caused by evaporation, and to minimise the risk of contamination with PCR products.

59
C. Disposables should have reproducible wall thicknesses, which are thin enough to ensure rapid temperature equilibration, but thick enough to avoid breakages.
In many cases third party disposables will have inferior thermal and optical characteristics, which will reduce the quality of results obtained from the system.
ENVIRONMENTAL CONDITIONSYOUR WORK SPACE
Your MyGo Pro should be placed on a surface that is flat, dry, and not subject to draughts. Do not install your MyGo Pro instrument directly in the flow of air from an air conditioner or fan. Do not install your MyGo Pro instrument in a dusty environment.
PREVENTING CONTAMINATION
Prevent contamination by wearing gloves, using clean tube racks, and filter tips. Make sure tubes are sealed, PCR product is disposed of, and leaks are cleaned immediately.

60
Please note that your MyGo Pro contains no user-serviceable components inside. Any disassembly of your MyGo Pro instrument will void all warranties.
ENVIRONMENTAL OPERATING CONDITIONS
DISASSEMBLY
ENVIRONMENTAL STORING/ TRANSPORTING/PACKING CONDITIONS
Humidity MAX: 80% at +32°C MIN: 30% at +15 to +32°C
Humidity 10% to 95% No condensation
Temperature +15°C to +32°C
Temperature -20°C to +60°C
Pressure 0 to 2000 MAMSL 80 to 106Kpa
Pressure 0 to 3000 MAMSL 70 to 106Kpa

61
This section will help you troubleshoot your MyGo Pro if you think something is wrong.
TROUBLESHOOTING
FAQHere are some frequently asked questions, and the answers.
How do I create a template?
What is the minimum hold time for thermal cycling?
Can I leave my MyGo Pro powered on overnight?
All experiments can be used as a template. Click “Open” and then using the “file type” selection in the file dialog to select the “Template” option, then select the file to open as a template.
For holds during thermal cycling with no optical acquisitions the minimum hold time is 3s. For holds during thermal cycling with optical acquisitions the minimum hold time is 17s.
Yes. It is safe to leave your MyGo Pro overnight, it will enter a low power standby mode.

62
Where is the threshold for determining Cq values in Auto Quant?
Why do some of my amplification curves drop down before rising in Auto Quant?
Why is my Cy5 reaction not working?
Modern methods of determining Cq values are not based on simple thresholds. Modern methods of Cq determination are model based. Auto Quant fits a model of a PCR amplification to the fluorescence data observed. This model fit then enables the estimation of a number of important parameters including Cq values.
Correct background removal in Auto Quant relies on correct qualitative calling. Check that appropriate thresholds are set so that positive amplifications are called positive.
Cy5 is a relatively dim reporter, you may need to increase Integration Time to improve signal to noise with Cy5 labelled hydrolysis probes.

63
ERROR MESSAGESYour MyGo Pro will let you know when something is wrong by displaying an error. Most errors are reported as messages in the Status Bar in the MyGo software. Some errors are reported by the instrument display LEDs.
Status Bar.

64
ActionMessage
ERROR MESSAGES - DISPLAYED IN STATUS BAR
If you encounter an error, please make sure that the instrument is running in a lab within the specified environmental conditions, tubes have been loaded correctly, the lid has been fitted correctly, and all cables are attached correctly and securely. If the error still occurs, you may need to contact technical support with the following actions described below.
Saturation Warning.
Run Prepare Error (followed by one of the following messages)
a) No tubes loaded.
b) Instrument has had a hardware error, and is in failsafe mode.
Please use the log button to view the detailed message - this will tell you which wells saw a saturated reading. To correct, please reduce the integration time setting, or reduce the concentration of dye or probes.
Please follows the instructions in the error message and continue as normal.
65
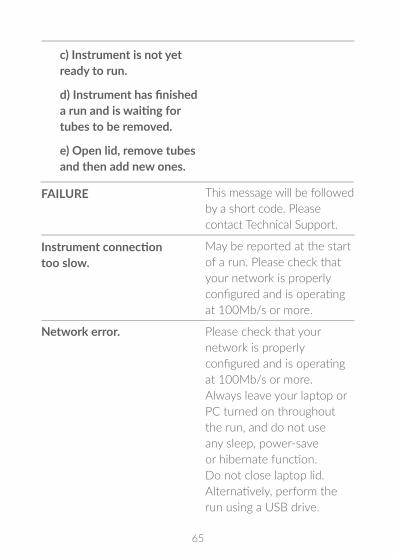
c) Instrument is not yet ready to run.
d) Instrument has finished a run and is waiting for tubes to be removed.
e) Open lid, remove tubes and then add new ones.
FAILURE
Instrument connection too slow.
Network error.
This message will be followed by a short code. Please contact Technical Support.
May be reported at the start of a run. Please check that your network is properly configured and is operating at 100Mb/s or more.
Please check that your network is properly configured and is operating at 100Mb/s or more. Always leave your laptop or PC turned on throughout the run, and do not use any sleep, power-save or hibernate function. Do not close laptop lid. Alternatively, perform the run using a USB drive.
66
ERRORS REPORTED BY THE MYGO PRO DISPLAY LEDS
Some errors are reported by the instrument display LEDs flashing red. If your instrument display LEDs are flashing red, please contact technical support.
SOFTWARE ERRORS
For software issues go to Configuration > About and select Save Software Logs to File.
HARDWARE ERRORS
For Hardware faults go to Configuration > MyGo Pro and select Retrieve Instrument Report Files. Once exported, please make sure you send the error file, the serial number, and the experiment file that contained the error to Technical support. It is OK to send experiments that have not completed and/or were aborted.
ERROR LOG FILESIn the unlikely event that you encounter a problem the software can produce log files. These files help to diagnose the problem.

67
NOTES

68

69
All trademarks are the property of their respective owners. Design and specifications are subject to change without notice.

www.mygopcr.com
Version 003 (EN)
MyGo