Embed Size (px)
Citation preview
Performance indicators for urban transport development in Nigeria
J. O. Onatere, C. Nwagboso & P. Georgakis Faculty of Science and Engineering, University of Wolverhampton, UK
Abstract
Developing countries are experiencing simultaneous growth of population, income and private vehicle ownership, which significantly affects urban transport environment and poses challenges to policymakers and urban transport professionals. Experience shows that the performance of urban transport service delivery in many developing countries is low; policy makers have incomplete information to make decisions and managers and professionals rarely have a clear picture of their operational performance, best practices elsewhere or the desired level of their service provision, which is the case of urban transport services in Nigeria. Urban transport in Nigeria is largely an unregulated market and inadequate both in quality and quantitative terms. Urban transport technology in use in Nigeria is a combination of Para-transit modes, consisting of shared taxis, minibuses, motorcycles and tricycles. Only in the cities of Lagos and Abuja are conventional buses in use, but even in both cities the use of Para-transit modes of transport is obviously dominant. As a matter of fact, Nigeria remains the only country in the world where densely populated cities with over 6 million people do not have an organized urban transport system based on a combination of conventional buses and rail. It will be therefore imperative to identify Key performance indicators (KPIs) that can be used to measure and improve the performance of urban transport services in Nigeria. This paper is focused on the identification of Key Performance Indicators (KPIs) for urban transport development in Nigeria. The KPIs that have been identified in this paper following the performance measurement framework can be used to monitor and evaluate urban transport performance in Nigeria and eventually guide the further development and modernization of urban transport system in Nigeria, in the sense that the KPIs will assist in identifying key areas for improvement and also serve as a guide for transport policy makers in making
Urban Transport XX 555
www.witpress.com, ISSN 1743-3509 (on-line) WIT Transactions on The Built Environment, Vol 138, © 2014 WIT Press
doi:10.2495/UT140461
decisions. The KPIs presented in this paper have been categorized into Safety, Security, Environmental pollution, Financial perspective, Traffic management and Customer satisfaction. Keywords: Key performance indicators, performance measurement, monitoring and evaluation, urban transport development, Nigeria.
1 Introduction
Urbanization has been one of the dominant contemporary processes as a growing share of the global population lives in cities. Considering this trend, urban transportation issues are of foremost importance to support the passengers and freight mobility requirements of large urban agglomerations. Transportation in urban areas is highly complex because of the modes involved, the multitude of origins and destinations, and the amount and variety of traffic. Urban transit is an important dimension of mobility, notably in high-density areas [1–3]. Urban transport needs of all social groups are seldom met, especially in cities of developing countries such as Nigeria whose urban transportation system is far from ideal. This is partly due to a lack of understanding of such needs, a lack of data on the transport trends of different population groups or simple lack of knowledge about the importance of understanding these needs and acting upon them. Densely populated cities in Nigeria such as Lagos and Kano do not have an organized urban transport system. According to various studies that have been carried on urban transport problems in Nigeria, traffic congestion has been identified as one of the most prevalent problems [2, 35].
1.1 Existing situation of urban transportation in Nigeria
Nigeria is urbanizing at a very rapid rate. With a population of approximately 130 million and an area of about one million square kilometres, Nigeria has both the highest population and highest average population density in Africa. Between 2000 and 2004, the proportion of urban population grew from 36% to 38%. Along with urbanization comes a growth in urban transport. The most reliable data on urban transport in Nigeria comes from Lagos, a city with about 15 million inhabitants, making it the sixth largest city in the world. It is also Nigeria’s economic hub and Africa’s fastest growing city at an estimated 6–7% per year [11, 32, 35]. It is estimated that the total vehicle population in Lagos is approximately 1.2 million (representing about 55% of the total vehicle population in Nigeria), out of which, approximately 72,000 are public transport vehicles (mostly micro- and mini-buses). Kano, the commercial and industrial capital for northern Nigeria and the country’s second largest city with about 10 million inhabitants, is facing similar problems of rapid growth of both people and motor vehicles. Urban transport services in Nigeria is unregulated and inadequate both in quality and quantitative terms considering the rate of population growth and the economic condition of an average Nigerian on the affordability of transport services to meet his or her travel demand [11, 32, 35].
556 Urban Transport XX
www.witpress.com, ISSN 1743-3509 (on-line) WIT Transactions on The Built Environment, Vol 138, © 2014 WIT Press

1.1.1 The urban transport problems in Nigeria today are evident in the form of:
Poorly maintained urban road network and road complementary facilities,
Inefficient public transport system, Poor institutional framework leading to poor coordination of urban
transport services, Poor land use transport planning, Poor and ineffective transport management FGN [20].
As a result of these issues and challenges confronting urban transport in Nigeria, it will be therefore necessary to identify KPIs that can be used to measure and improve the performance of urban transport services in Nigeria. This paper is focused on the identification of Key Performance Indicators (KPIs) for urban transport development in Nigeria. The KPIs that have been identified in this paper following the performance measurement framework can be used to monitor and evaluate urban transport performance in Nigeria and eventually guide the further development and modernization of urban transport system in Nigeria, in the sense that the KPIs will assist in identifying key areas for improvement and also serve as a guide for transport policy makers in making decisions. Firstly, the performance measurement process and its stages are explained, followed by the performance measurement framework and finally the presentation of the KPIs and data collection method. The KPIs presented in this paper have been categorized into Safety, Security, Environmental pollution, Financial perspective, Traffic management and Customer satisfaction.
2 The performance measurement process
Performance measurement (PM) is the process of collecting and analyzing data regarding the performance of an organisation or individual Crow [18]. It is used in some or other ways in every business and industry but the form and extent of the measurement systems varies. During the last decades there has been a change from manual to computerized and automatic collection of data, which has resulted in good access to data in most companies. The challenge is therefore now more related to what Key Performance Indicators needs to be used and how to put together and aggregate data, how to present them and how to interpret and use them correctly (Andersen and Fagerhaug [12]).
2.1 Why measure performance?
The underlying drive for performance measurement anchors around the needs to provide feedback from the work or project functionality that is performed. This feedback is part of an organizational feedback control system that is important in order to manage the systems, processes and activities that are measured. This is even more as the tool in the improvement of work or project functionality. Fagerhaug [19] correctly stated that “you cannot manage what you cannot measure, what gets measured gets done, and measurements influence behaviour”.
Urban Transport XX 557
www.witpress.com, ISSN 1743-3509 (on-line) WIT Transactions on The Built Environment, Vol 138, © 2014 WIT Press

Kaplan and Norton [22] stated that companies must use measurement systems if they want to survive and prosper in the information age competition. Lynch and Cross [25], indeed stated, “The purpose of performance measurement is then to motivate behaviour leading to continuous improvement of customer satisfaction, flexibility and productivity”. In Bredrup 1995 [16], a number of specific purposes for performance measurement was listed and concluded that a common denominator is improvement.
2.1.1 In the cycle of continuous improvement, performance measurement plays an important role in:
Identifying and tracking progress against organisational goals, Identifying opportunities for improvement, Comparing performance against both internal and external standards
[18, 29, 30].
2.1.2 Benefits of performance measurement Reduced failure costs, Lower appraisal costs, Increased market share, More productive workforce [18, 29, 30].
2.2 Performance measurement stages
Researchers at Cranfield University have developed a performance measurement and management framework called the “Performance Prism”, which they claim addresses all of an organisation’s stakeholders. The prism consists of five facets that should be considered when developing performance measures: stakeholder satisfaction, strategies, processes, capabilities and stakeholder contribution (Kennerley and Neely [23]). However, in this research various measurement frameworks will be evaluated for best practice, but underpinned by the measurement process stages as follows:
2.2.1 Identification This stage involves choosing/selecting the Key performance Indicators (KPIs) that are worth measuring to meet the organisational goals/needs (Barr [15]).
2.2.2 Monitoring This stage involves the collection of data to check progress against planned targets. It is the formal reporting of evidence that spend and outputs are successfully delivered and milestones met. By tracking changes in outcomes over time, monitoring data plays a key part in evaluation throughout the initiative’s lifetime (Cromack [17]).
2.2.3 Evaluation This stage involves the assessment of the project’s effectiveness and efficiency during and after implementation. This includes measuring the causal effect of the project (or elements within the project) on planned outcomes and impacts,
558 Urban Transport XX
www.witpress.com, ISSN 1743-3509 (on-line) WIT Transactions on The Built Environment, Vol 138, © 2014 WIT Press
assessing whether the anticipated benefits and value for money have been realised and whether any unanticipated impacts occurred Cromack [17].
2.2.4 Implementation At this stage, when everything has been sorted out as regards the organisation’s performance, then comes the decision making process about what to improve, how much to improve it by and how to do the improving (Barr [15]).
2.2.5 Evaluation After implementing, another evaluation needs to be done in order to assess the projects effectiveness and efficiency, whether the anticipated benefits and value for money have been realised and whether any unanticipated impacts occurred (Cromack [17]).
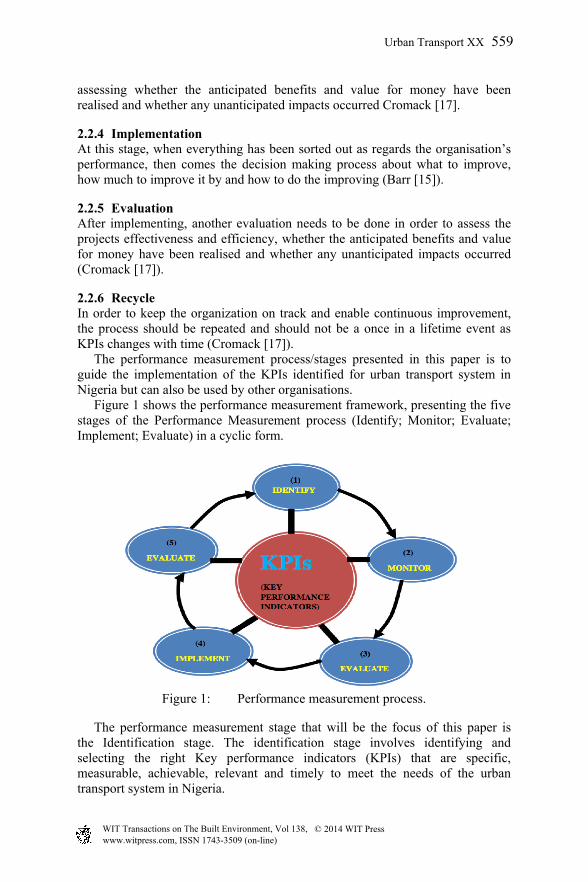
2.2.6 Recycle In order to keep the organization on track and enable continuous improvement, the process should be repeated and should not be a once in a lifetime event as KPIs changes with time (Cromack [17]). The performance measurement process/stages presented in this paper is to guide the implementation of the KPIs identified for urban transport system in Nigeria but can also be used by other organisations. Figure 1 shows the performance measurement framework, presenting the five stages of the Performance Measurement process (Identify; Monitor; Evaluate; Implement; Evaluate) in a cyclic form.
Figure 1: Performance measurement process.
The performance measurement stage that will be the focus of this paper is the Identification stage. The identification stage involves identifying and selecting the right Key performance indicators (KPIs) that are specific, measurable, achievable, relevant and timely to meet the needs of the urban transport system in Nigeria.
Urban Transport XX 559
www.witpress.com, ISSN 1743-3509 (on-line) WIT Transactions on The Built Environment, Vol 138, © 2014 WIT Press
3 Key Performance Indicators (KPIs)
Key Performance Indicators (KPIs) are quantitative and qualitative measures used to review and track an organisation’s progress against its goals. Key performance indicators measure the quality of an organization’s performance and assist in developing performance goals and strategies [42, 43]. Identifying and working with the right KPIs can be quite challenging especially when dealing with the case of a developing economy such as Nigeria. The KPIs identified in this paper for the urban transport development in Nigeria are both quantitative and qualitative; they have been identified through the review of urban transport system in Nigeria and a combination of literatures regarding KPIs that have been applied to other countries [24, 26–28], which were found applicable to the urban transport system in Nigeria. The KPIs are presented in figures 2–7 with most of the measurement units in brackets, the customer satisfaction KPIs will be measured based on the level of customer satisfaction and rating since they are mostly qualitative. Most of the KPIs (if not all) presented in the paper are relevant and important due to the fact that the Nigerian transport industry is still developing and yet to be organized.
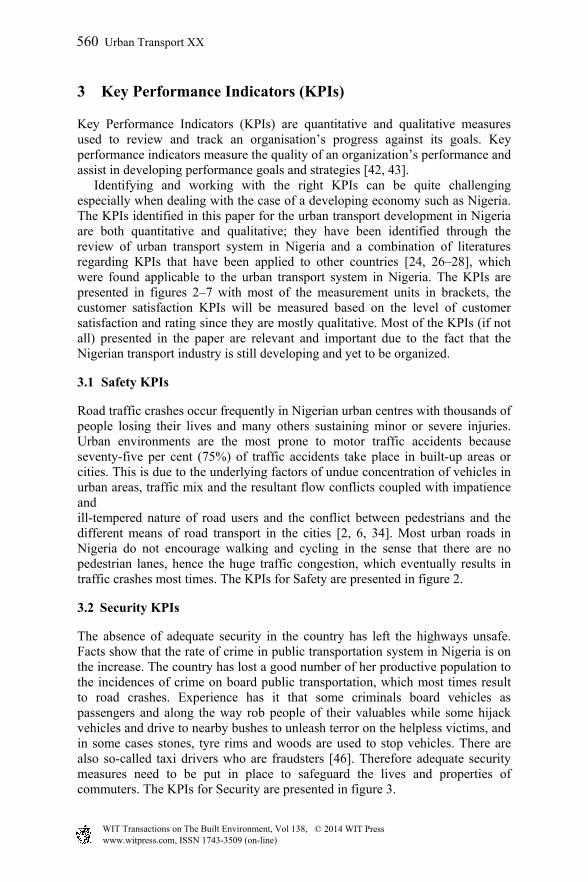
3.1 Safety KPIs
Road traffic crashes occur frequently in Nigerian urban centres with thousands of people losing their lives and many others sustaining minor or severe injuries. Urban environments are the most prone to motor traffic accidents because seventy-five per cent (75%) of traffic accidents take place in built-up areas or cities. This is due to the underlying factors of undue concentration of vehicles in urban areas, traffic mix and the resultant flow conflicts coupled with impatience and ill-tempered nature of road users and the conflict between pedestrians and the different means of road transport in the cities [2, 6, 34]. Most urban roads in Nigeria do not encourage walking and cycling in the sense that there are no pedestrian lanes, hence the huge traffic congestion, which eventually results in traffic crashes most times. The KPIs for Safety are presented in figure 2.
3.2 Security KPIs
The absence of adequate security in the country has left the highways unsafe. Facts show that the rate of crime in public transportation system in Nigeria is on the increase. The country has lost a good number of her productive population to the incidences of crime on board public transportation, which most times result to road crashes. Experience has it that some criminals board vehicles as passengers and along the way rob people of their valuables while some hijack vehicles and drive to nearby bushes to unleash terror on the helpless victims, and in some cases stones, tyre rims and woods are used to stop vehicles. There are also so-called taxi drivers who are fraudsters [46]. Therefore adequate security measures need to be put in place to safeguard the lives and properties of commuters. The KPIs for Security are presented in figure 3.
560 Urban Transport XX
www.witpress.com, ISSN 1743-3509 (on-line) WIT Transactions on The Built Environment, Vol 138, © 2014 WIT Press
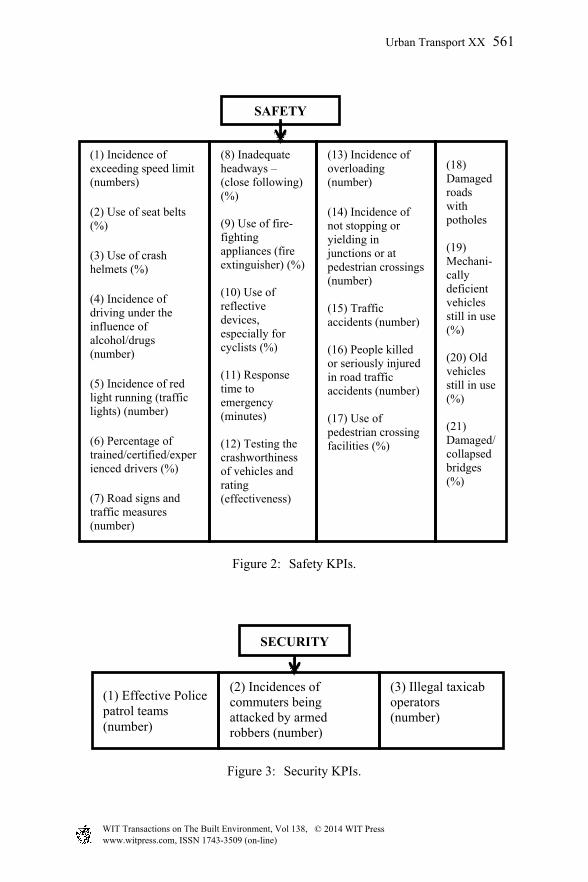
Figure 2: Safety KPIs.
Figure 3: Security KPIs.
(2) Incidences of commuters being attacked by armed robbers (number)
(1) Effective Police patrol teams (number)
(3) Illegal taxicab operators (number)
SECURITY
SAFETY
(1) Incidence of exceeding speed limit (numbers)
(2) Use of seat belts (%)
(3) Use of crash helmets (%)
(4) Incidence of driving under the influence of alcohol/drugs (number)
(5) Incidence of red light running (traffic lights) (number)
(6) Percentage of trained/certified/experienced drivers (%)
(7) Road signs and traffic measures (number)
(8) Inadequate headways – (close following) (%) (9) Use of fire-fighting appliances (fire extinguisher) (%) (10) Use of reflective devices, especially for cyclists (%) (11) Response time to emergency (minutes) (12) Testing the crashworthiness of vehicles and rating (effectiveness)
(13) Incidence of overloading (number)
(14) Incidence of not stopping or yielding in junctions or at pedestrian crossings (number) (15) Traffic accidents (number) (16) People killed or seriously injured in road traffic accidents (number) (17) Use of pedestrian crossing facilities (%)
(18) Damaged roads with potholes (19) Mechani-cally deficient vehicles still in use (%) (20) Old vehicles still in use (%) (21) Damaged/ collapsed bridges (%)
Urban Transport XX 561
www.witpress.com, ISSN 1743-3509 (on-line) WIT Transactions on The Built Environment, Vol 138, © 2014 WIT Press
3.3 Environmental pollution KPIs
Environmental pollution is one of the serious urban transport problems in Nigeria. This is as a result of discharge of effluents and emission from automobiles. Air pollution, including noise generated by circulation is a serious impediment to the quality of life and health of the urban populace [7, 10, 13, 14, 38–40]. The average emission concentration from motor vehicles and motorcycles in Nigeria is on the increase. Study of emission figures showed that the concentration of Total Suspended Particles (TSP); Nitrogen Oxides (NOx); Sulphur dioxide (SO2) and Carbon monoxide (CO) in Lagos and Port Harcourt were above Federal Environmental Protection Agency of Nigeria (FEPA) recommended limit. The TSP concentrations are also high for both cities when compared to WHO (World Health Organization) stipulated standards Abam and Unachukwu [4]. Furthermore, energy consumption by urban transportation has increased and so the dependency on petroleum. The increasing number of old and poorly maintained vehicles on Nigerian roads makes the pollution effect more severe [4, 21, 36, 37]. The KPIs for Environmental pollution are presented in figure 4. The measurement unit for the air pollutants will be in parts per million (ppm) while the noise pollution will be measured in decibels (db).
Figure 4: Environmental pollution KPIs.
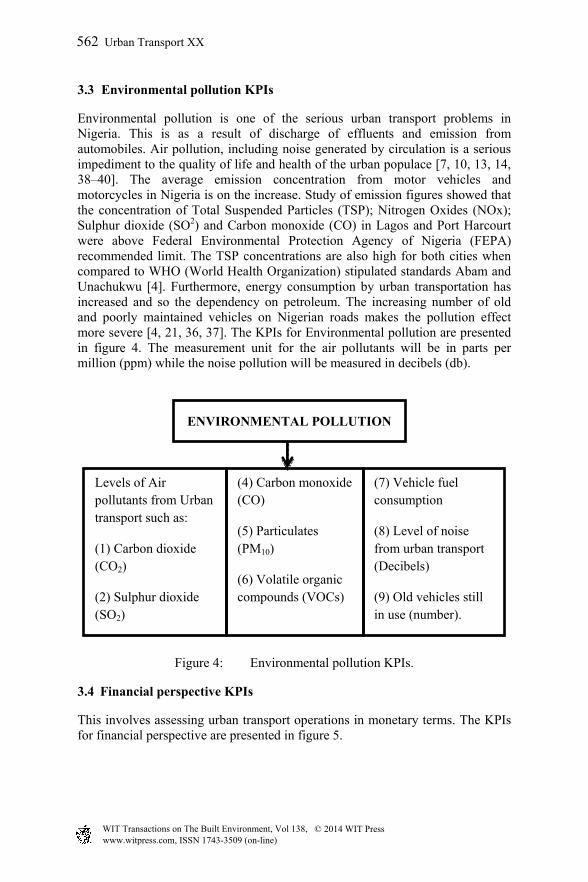
3.4 Financial perspective KPIs
This involves assessing urban transport operations in monetary terms. The KPIs for financial perspective are presented in figure 5.
ENVIRONMENTAL POLLUTION
Levels of Air pollutants from Urban transport such as:
(1) Carbon dioxide (CO2)
(2) Sulphur dioxide (SO2)
(4) Carbon monoxide (CO)
(5) Particulates (PM10)
(6) Volatile organic compounds (VOCs)
(7) Vehicle fuel consumption
(8) Level of noise from urban transport (Decibels)
(9) Old vehicles still in use (number).
562 Urban Transport XX
www.witpress.com, ISSN 1743-3509 (on-line) WIT Transactions on The Built Environment, Vol 138, © 2014 WIT Press
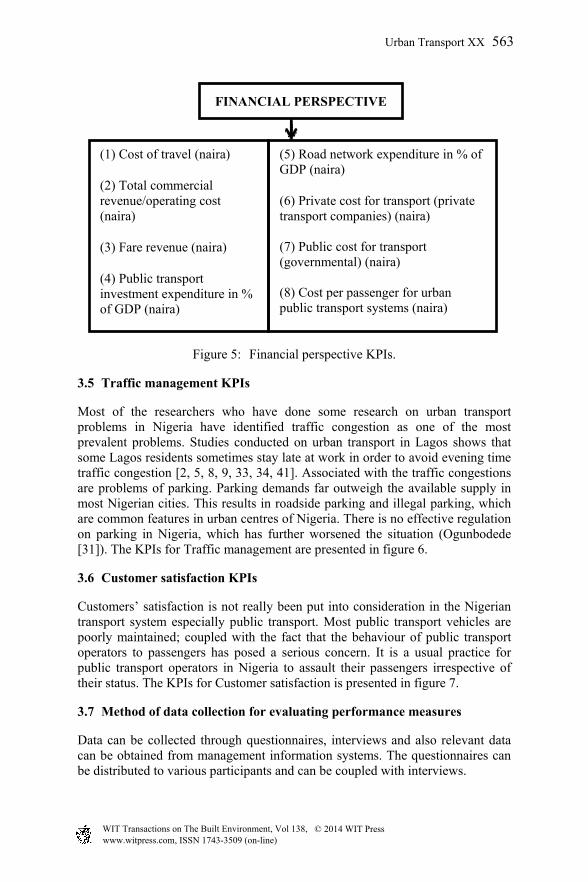
Figure 5: Financial perspective KPIs.
3.5 Traffic management KPIs
Most of the researchers who have done some research on urban transport problems in Nigeria have identified traffic congestion as one of the most prevalent problems. Studies conducted on urban transport in Lagos shows that some Lagos residents sometimes stay late at work in order to avoid evening time traffic congestion [2, 5, 8, 9, 33, 34, 41]. Associated with the traffic congestions are problems of parking. Parking demands far outweigh the available supply in most Nigerian cities. This results in roadside parking and illegal parking, which are common features in urban centres of Nigeria. There is no effective regulation on parking in Nigeria, which has further worsened the situation (Ogunbodede [31]). The KPIs for Traffic management are presented in figure 6.
3.6 Customer satisfaction KPIs
Customers’ satisfaction is not really been put into consideration in the Nigerian transport system especially public transport. Most public transport vehicles are poorly maintained; coupled with the fact that the behaviour of public transport operators to passengers has posed a serious concern. It is a usual practice for public transport operators in Nigeria to assault their passengers irrespective of their status. The KPIs for Customer satisfaction is presented in figure 7.
3.7 Method of data collection for evaluating performance measures
Data can be collected through questionnaires, interviews and also relevant data can be obtained from management information systems. The questionnaires can be distributed to various participants and can be coupled with interviews.
FINANCIAL PERSPECTIVE
(1) Cost of travel (naira)
(2) Total commercial revenue/operating cost (naira)
(3) Fare revenue (naira)
(4) Public transport investment expenditure in % of GDP (naira)
(5) Road network expenditure in % of GDP (naira)
(6) Private cost for transport (private transport companies) (naira) (7) Public cost for transport (governmental) (naira) (8) Cost per passenger for urban public transport systems (naira)
Urban Transport XX 563
www.witpress.com, ISSN 1743-3509 (on-line) WIT Transactions on The Built Environment, Vol 138, © 2014 WIT Press
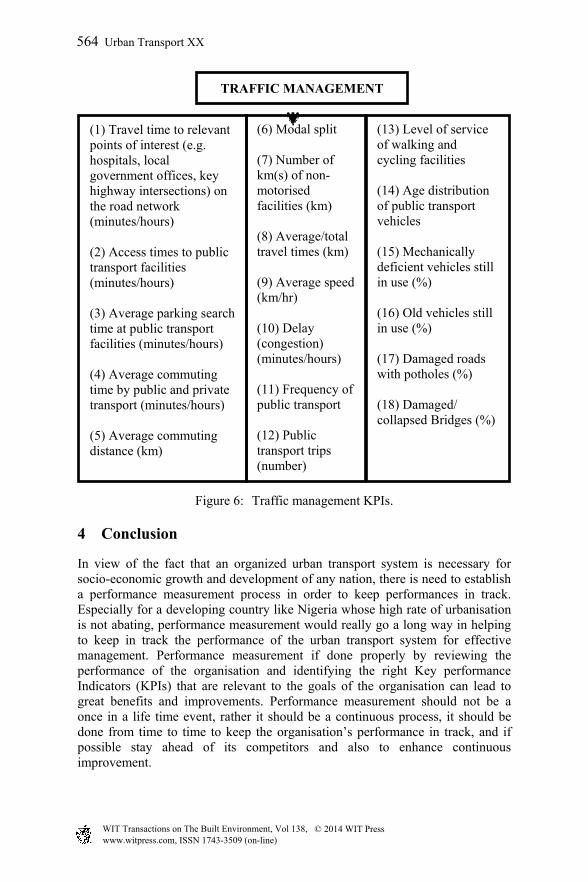
Figure 6: Traffic management KPIs.
4 Conclusion
In view of the fact that an organized urban transport system is necessary for socio-economic growth and development of any nation, there is need to establish a performance measurement process in order to keep performances in track. Especially for a developing country like Nigeria whose high rate of urbanisation is not abating, performance measurement would really go a long way in helping to keep in track the performance of the urban transport system for effective management. Performance measurement if done properly by reviewing the performance of the organisation and identifying the right Key performance Indicators (KPIs) that are relevant to the goals of the organisation can lead to great benefits and improvements. Performance measurement should not be a once in a life time event, rather it should be a continuous process, it should be done from time to time to keep the organisation’s performance in track, and if possible stay ahead of its competitors and also to enhance continuous improvement.
TRAFFIC MANAGEMENT
(1) Travel time to relevant points of interest (e.g. hospitals, local government offices, key highway intersections) on the road network (minutes/hours) (2) Access times to public transport facilities (minutes/hours) (3) Average parking search time at public transport facilities (minutes/hours) (4) Average commuting time by public and private transport (minutes/hours) (5) Average commuting distance (km)
(6) Modal split (7) Number of km(s) of non-motorised facilities (km) (8) Average/total travel times (km) (9) Average speed (km/hr) (10) Delay (congestion) (minutes/hours) (11) Frequency of public transport (12) Public transport trips (number)
(13) Level of service of walking and cycling facilities (14) Age distribution of public transport vehicles (15) Mechanically deficient vehicles still in use (%) (16) Old vehicles still in use (%) (17) Damaged roads with potholes (%) (18) Damaged/ collapsed Bridges (%)
564 Urban Transport XX
www.witpress.com, ISSN 1743-3509 (on-line) WIT Transactions on The Built Environment, Vol 138, © 2014 WIT Press

Figure 7: Customer satisfaction KPIs.
References
[1] Rodrigue, J. The geography of transport systems. 3rd Ed. New York: Routledge. ISBN 978-0-415-82254-1, 2013.
[2] Aderamo, A.J. Urban Transportation problems and challenges in Nigeria: A Planner’s view. Prime Research on Education, 2(3), pp. 198-203, 2012a.
[3] Aworemi, J.R., Abdul-Azeez, I.A. & Olaogun, O.B. A Study of the Performance of Public Transport Company in Niger State, Nigeria. International Journal of Business and Management, 4(11), pp. 73-80 (2009).
CUSTOMER SATISFACTION
(1) Overall journey experience
(2) Customer service
(3) Comfort of ride
(4) Cleanliness on board
(5) Temperature on board
(6) Facilities at motor parks/stops
(7) Availability of seats at motor parks/stops
(8) Crowding during peak times
(9) Cleanliness of motor parks/stops
(10) Maintenance of motor parks/stops
(11) Maintenance of vehicles
(12) Personal safety at motor parks/stops (13) Safety of vehicles at motor parks/stops
(14) Personal safety on board
(15) Accessibility to the motor parks/stops
(16) Accessibility of vehicles
(17) Cost of journey
(18) Frequency of vehicles
(19) Punctuality (departure times and arrival times)
(20) Complaint handling and effective complaint resolution
(21) Average time taken to process claims (days)
(22) Responses to emergency situations (minutes/hours) (23) Satisfaction with road system condition (24) Customer satisfaction with completed projects (25) Percentage of complaints total (26) Behaviour of drivers/conductors
Urban Transport XX 565
www.witpress.com, ISSN 1743-3509 (on-line) WIT Transactions on The Built Environment, Vol 138, © 2014 WIT Press

[4] Abam, F. I. & Unachukwu, G. O. Vehicular Emissions and Air Quality Standards in Nigeria. European Journal of Scientific Research, 34(4), pp.550-560, 2009.
[5] Aderamo, A.J. Route Forms and Traffic Flow in a Medium Sized City. The Case Study of Ilorin, Nigeria. Centrepoint, 8(1), pp. 29-44, 1998.
[6] Aderamo AJ. Transport and the Nigerian Urban Environment. Paper delivered at 45th Annual Conference of the Nigerian Geographical Association held at University of Ilorin, 2002.
[7] Aderamo, A.J. Transport infrastructure and the Nigerian Environment. International Review of Business and Social Sciences, 1(6), pp. 49-66, 2012b.
[8] Adedamila, A.S. Towards Improving Traffic Flow in Lagos. In Onakomaya, S.O. & Ekanem, N.F. (eds.). Transportation in Nigeria’s National Development. Conference proceedings, University of Ibadan, Ibadan, Nigeria, 1977.
[9] Adenle, J.A. Factors Militating Against Free Flow of Traffic in Metropolitan Lagos. In Onakomaya, S.O. and Ekanem, N.F. (eds.) Transportation in Nigeria’s National Development. Conference proceedings, University of Ibadan, Ibadan, Nigeria, 1977.
[10] Adejobi, O.S. Spatio-Temporal Analysis of Noise Pollution Levels in Lagos State: Oshodi-Agege Route Experience. European Journal of Globalization and Development Research, 5(1), pp. 265-286, 2012.
[11] Adeyinka, A.M. Assessment of the Quality of Urban Transport Services in Nigeria. Academic Journal of Interdisciplinary Studies, 2(1), pp. 49-58, 2013.
[12] Andersen, B. and Fagerhaug, T. Performance Measurement explained designing and implementing your state–of the art system, ASQ Quality Press, Milwaukee, Wisconsin, pp. 1-109, 2002.
[13] Anomohanran, O., Iwegbue, C.M.A., Oghenerhoro, O. & Egbai, J.C. Investigation of environmental noise pollution level of Abraka in Delta State Nigeria. Trends in applied sciences research, 3(4), pp. 292-297, 2008.
[14] Aweda, J.O. & Jimoh, Y.A. Health Hazard of Traffic Noise: Perceptions of Dwellers on Tanke – University Road, Ilorin, Nigeria. The Pacific Journal of Science and Technology, 13(2), pp. 322-329, 2012.
[15] Barr, S. Essentials Steps of the Performance Measurement Process. Online http://kpilibrary.com/topics/essentials-steps-of-the-performancemeasurement-process%202009.
[16] Bredrup, H. Performance Measurement in a Changing Competitive Industrial Environment: Breaking the Financial Paradigm, Doctor dissertation, Norwegian University of Science and Technology (NTNU), Department of Production and Quality Engineering, Trondheim, Norway, pp. 36-65, 1995.
[17] Cromack, J. Croxley rail link Monitoring and Evaluation strategy note. Onlinehttp://www.croxleyraillink.com/media/30049/croxley%20rail%20link%20monitoring%20and%20evaluation%20strategy%20note.pdf> 2011.
566 Urban Transport XX
www.witpress.com, ISSN 1743-3509 (on-line) WIT Transactions on The Built Environment, Vol 138, © 2014 WIT Press
[18] Crow, T. Performance Measurement Matters. Online <http:// starfishperformance.com/performance-measurement-matters/> 2012.
[19] Fagerhaug, T. A new Improvement Oriented Method and Model for Self-Assessment for Business Excellence. Doctoral dissertation, Norwegian University of Science and Technology – NTNU, Department of Production and Quality Engineering, Trondheim, Norway, pp. 41-47, 1999.
[20] FGN: Federal government of Nigeria: Draft National Transport Policy, pp. 34-35, 2010.
[21] Moen, E. Vehicle Emissions and Health Impacts in Abuja, Nigeria. Online <http://envstudies.brown.edu/theses/archive20072008/ericamoenthesis.pdf> 2008.
[22] Kaplan, R. S. & Norton, D. P. The Balanced Scorecard – translating strategy into action, Harvard Business School Press, Boston, Massachusetts, pp. 1-189, 1996.
[23] Kennerley, M. & Neely, A. Performance Measurement Frameworks - A Review. 2nd International Conference on Performance Measurement, Cambridge, 2000.
[24] Krynauw, M.N. & Cameroon, J.W.M. National Land Transport Key Performance Indicators (KPIs) as a Measurement of Sustainable Transport: Are we measuring the Right things? Tshwane Metropolitan Municipality, pp. 1-14, 2003.
[25] Lynch, R.L. & Cross, K.C. Measure up! Yardstick for Continuous Improvement, Blackwell Business, Cambridge, USA, pp. 1-90, 1991.
[26] Mckinnon, A. Synchronised Auditing of Truck Utilisation and Energy Efficiency: A Review of the British Government’s Transport KPI Programme. Logistics Research Centre, Herriot-Watt University, Edingburg, 2007.
[27] Mckinnon,A., Edwards J., Piecyk M. & Palmer A. Traffic Congestion, Reliability and Logistical Performance: A Multisectoral Assessment. Logistics Research Centre, Herriot-Watt University, Edingburg, 2008.
[28] Moran, C. Relevance and Reliability of Area-wide Congestion Performance Measures in Road Networks. Doctoral dissertation, Royal institute of technology, school of Architecture and Built environment, Transport and Logistics Division, pp. 39-41, 2011.
[29] Neely, A., Richards, H., Mills, J., Platts, K. & Bourne, M. Designing performance measures: a structured approach. International Journal of Operations and Production Management, 17(11), pp. 1131-1152, 1997.
[30] Neely, A., Richards, H., Mills, J., Platts, K., Bourne, M., Gregory, M. & Kennerly, M. Performance measurement system design: developing and testing a process-based approach. International Journal of Operations and Production Management, 20(10), pp. 1119-1145, 2000.
[31] Ogunbodede F. Urban Transport and the Environment. In Vandu-Chikilo, I; Ogunsanya, A.A; Sumaila AG (eds.) Perspectives on Urban Transportation in Nigeria, NITT, Zaria, 2004.
Urban Transport XX 567
www.witpress.com, ISSN 1743-3509 (on-line) WIT Transactions on The Built Environment, Vol 138, © 2014 WIT Press
[32] Ogunbodede, E. F. Urban Road Transportation in Nigeria From 1960 To 2006: Problems, Prospects And Challenges. Ethiopian Journal of Environmental Studies and Management, 1(1), pp. 1-12, 2008.
[33] Ogunsanya, A. A. Improving Urban Traffic Flow by Restraint of Traffic: The Case of Lagos, Nigeria. Transport, 12, pp. 183-194, 1984.
[34] Ogunsanya, A. A. Directions in Urban Transport Studies in Nigeria. In Ikya, S.G. (ed.). Urban Passenger Transportation in Nigeria, Heinemann Educational Books (Nig.) Plc, 1993.
[35] Ogwude, I.C. Transport Infrastructure and Mobility in Nigeria. JORIND, 9(1), pp. 456-467, 2011.
[36] Ojo, O.O. S. & Awokola, O.S. Investigation of Air Pollution from Automobiles at Intersections on Some Selected Major Roads in Ogbomoso, South Western, Nigeria. Journal of Mechanical and Civil Engineering, 1(4), pp. 31-35, 2012.
[37] Ojolo, S.J., Oke, S.A., Dinrifo, R.R. & Eboda, F.Y. A survey on the effects of vehicle emissions on human health in Nigeria. Journal of Rural and Tropical Public Health, 6(16), pp. 16-23, 2007.
[38] Oloruntoba, E.O., Ademola R.A., Sridhar M. K. C., Agbola S. A., Omokhodion F. O. Ana G.R.E.E. & Alabi R. T. Urban Environmental Noise Pollution and Perceived Health Effects in Ibadan, Nigeria. African Journal of Biomedical Research, 15(2), pp. 77-84, 2012.
[39] Omubo-Pepple, V.B., Briggs-Kamara, M.A. & Tamunobereton-ari, I. Noise pollution in Port Harcourt metropolis: Sources, effects and control. Working and Living Environmental Protection, 7(1), pp. 33-42, 2010.
[40] Onuu, M.U. Road traffic noise in Nigeria: Measurements, analysis and evaluation of nuisance. Journal of Sound and Vibration, 233(3), pp. 391-405, 2000.
[41] Osuji, S.C. and Onyenechere, E.C. The Challenges of Mobility within Owerri City, Nigeria. Canadian Social Science, 9(3), pp. 68-73, 2013.
[42] Henning, T., Mohammed, D.E. and Jung, E.O. A framework for Urban transport benchmarking. Department for International Development, World Bank, pp. 12-18, 2011.
[43] Swan, W. An introduction to key performance indicators. Constructing excellence, pp. 11-19, 2004.
[44] Okunola, R.A. Commuters’ Fear of Crime and the Road Transport Industry: A Study of Ibadan-Sokoto Transport Corridor. The Nigerian Journal of Sociology and Anthropology, 7, pp. 98-120, 2009.
[45] Omidiji, A.A. and Ibitoye S.A. Crime and road crashes prevention in public transportation system in Nigeria: The case study of Kwara, Kogi and Ekiti States. 24th ARRB Conference – Building on 50 years of road and transport research, Melbourne, Australia, 2010.
[46] Iweze, O.D. Travails on the Nigerian Roads: The Case of the Luxury Bus Transport Services. 4th European Conference on African Studies. Uppsala, Sweden, 2011.
568 Urban Transport XX
www.witpress.com, ISSN 1743-3509 (on-line) WIT Transactions on The Built Environment, Vol 138, © 2014 WIT Press