Embed Size (px)
Citation preview
AN D R E W PAR R , S TAT E B O AR D O F E D U C AT I O NJ AN U ARY 7 , 2 0 1 5
T U M WAT E R , WAS H I N G T O N
Performance Gaps:How Washington Students Compare
Nationally and to Peer States
Washington State Board of Education
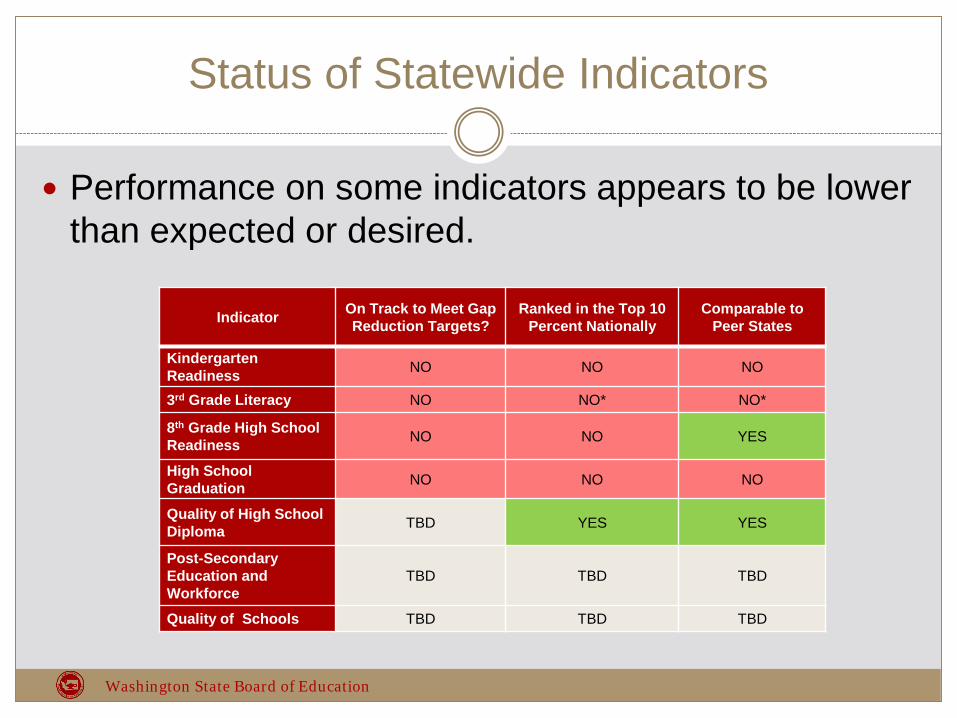
Status of Statewide Indicators
Performance on some indicators appears to be lower than expected or desired.
Indicator On Track to Meet Gap Reduction Targets?
Ranked in the Top 10 Percent Nationally
Comparable to Peer States
Kindergarten Readiness NO NO NO
3rd Grade Literacy NO NO* NO*
8th Grade High School Readiness NO NO YES
High School Graduation NO NO NO
Quality of High School Diploma TBD YES YES
Post-Secondary Education and Workforce
TBD TBD TBD
Quality of Schools TBD TBD TBD
Washington State Board of Education
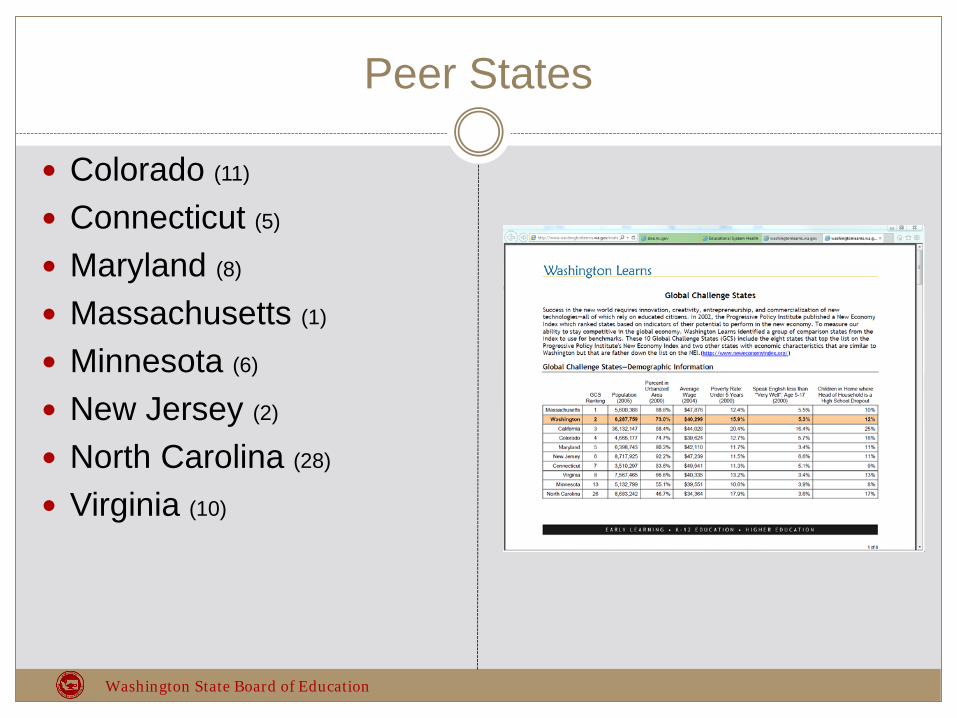
Peer States
Colorado (11)
Connecticut (5)
Maryland (8)
Massachusetts (1)
Minnesota (6)
New Jersey (2)
North Carolina (28)
Virginia (10)
Washington State Board of Education
Performance GapsBased on what?
Performance Gaps Differences in Percent At or Above Proficient Differences in Average Scaled Scores
Based on Poverty Status FRL - Not FRL
Based on Race/Ethnicity White - Black Performance Gap White - Hispanic Performance Gap
Snapshot and Trend Views NAEP
4th and 8th Grade Reading and Math
Washington State Board of Education
Words of Caution
See Bert Stoneberg (2005) article titled Please Don’t Use NAEP Scores to Rank Order the 50 States at http://pareonline.net/getvn.asp?v=10&n=9 for other ideas on how to compare NAEP data
In this work, the NAEP data are Added and subtracted Averaged Reading and math combined Rank ordered
Washington State Board of Education
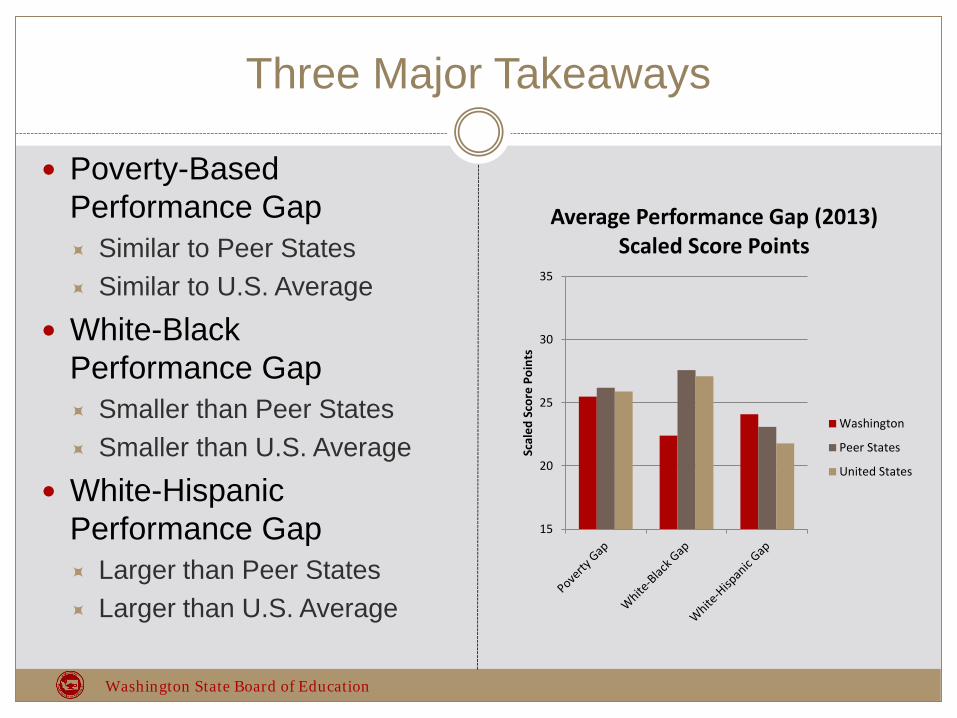
Three Major Takeaways
Poverty-Based Performance Gap Similar to Peer States Similar to U.S. Average
White-Black Performance Gap Smaller than Peer States Smaller than U.S. Average
White-Hispanic Performance Gap Larger than Peer States Larger than U.S. Average
15
20
25
30
35
Scal
ed S
core
Poi
nts
Average Performance Gap (2013)Scaled Score Points
Washington
Peer States
United States
Washington State Board of Education
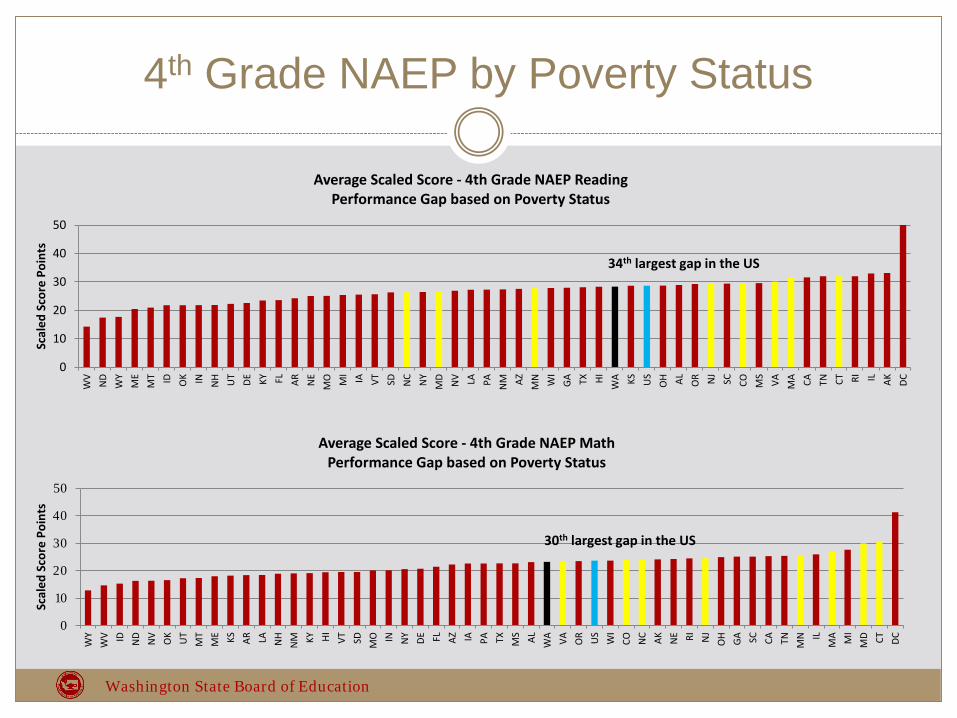
4th Grade NAEP by Poverty Status
0
10
20
30
40
50
WV
ND
WY
ME
MT ID OK IN NH UT DE KY FL AR NE
MO MI IA VT SD N
C NY
MD NV LA PA N
M AZ MN WI
GA TX HI WA KS US
OH AL OR NJ
SC CO MS
VA MA CA TN CT RI IL AK DC
Scal
ed S
core
Poi
nts
Average Scaled Score - 4th Grade NAEP ReadingPerformance Gap based on Poverty Status
0
10
20
30
40
50
WY
WV ID ND NV OK UT
MT
ME KS AR LA NH
NM KY HI VT SD MO IN NY DE FL AZ IA PA TX MS AL WA VA OR US
WI
CO NC AK NE RI NJ
OH GA SC CA TN MN IL
MA MI
MD CT DC
Scal
ed S
core
Poi
nts
Average Scaled Score - 4th Grade NAEP MathPerformance Gap based on Poverty Status
34th largest gap in the US
30th largest gap in the US
Washington State Board of Education
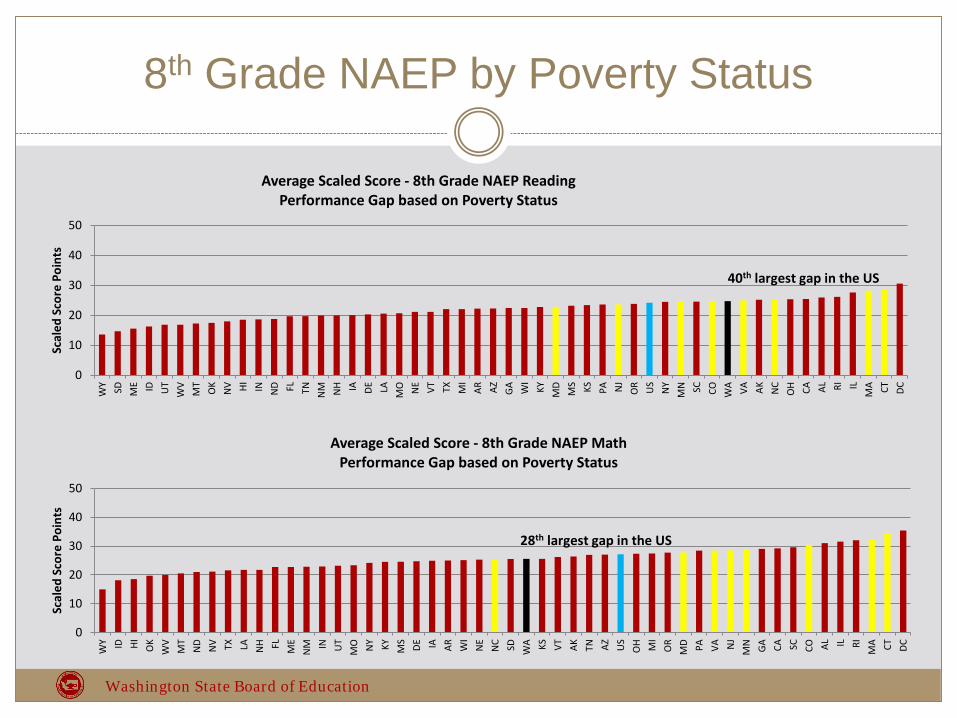
8th Grade NAEP by Poverty Status
0
10
20
30
40
50
WY SD ME ID UT
WV
MT
OK
NV HI IN ND FL TN N
M NH IA DE LA MO NE VT TX MI
AR AZ GA WI
KY MD
MS KS PA NJ
OR US
NY
MN SC CO WA VA AK NC
OH CA AL RI IL
MA CT DC
Scal
ed S
core
Poi
nts
Average Scaled Score - 8th Grade NAEP ReadingPerformance Gap based on Poverty Status
0
10
20
30
40
50
WY ID HI OK
WV
MT
ND NV TX LA NH FL ME
NM IN UT
MO NY KY MS
DE IA AR WI
NE
NC SD WA KS VT AK TN AZ US
OH MI
OR
MD PA VA NJ
MN GA CA SC CO AL IL RI
MA CT DC
Scal
ed S
core
Poi
nts
Average Scaled Score - 8th Grade NAEP MathPerformance Gap based on Poverty Status
28th largest gap in the US
40th largest gap in the US
Washington State Board of Education
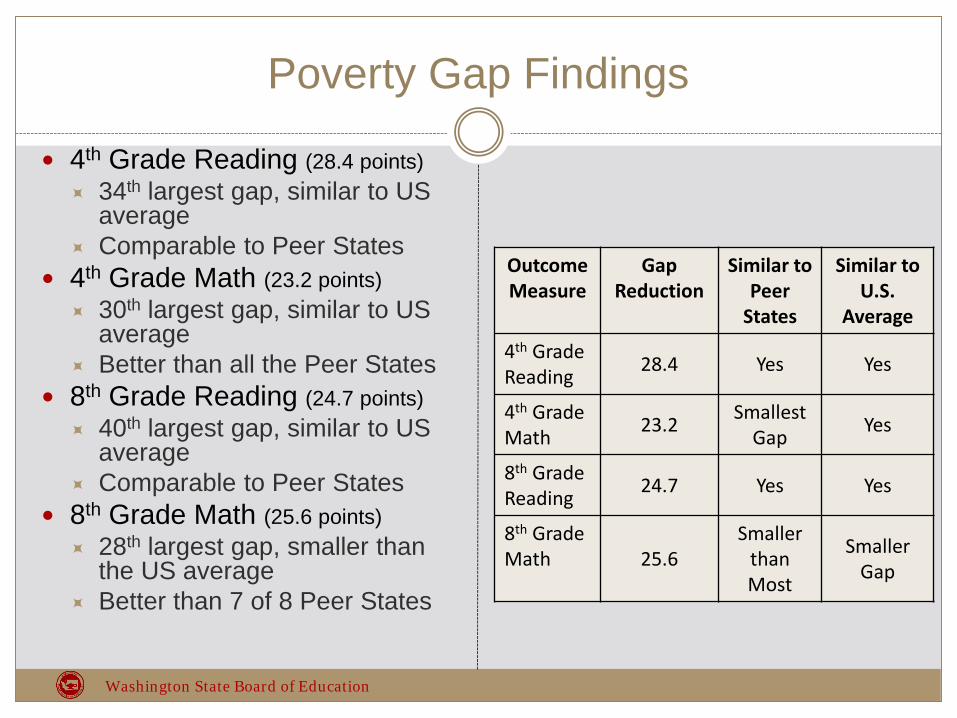
Poverty Gap Findings
4th Grade Reading (28.4 points) 34th largest gap, similar to US
average Comparable to Peer States
4th Grade Math (23.2 points) 30th largest gap, similar to US
average Better than all the Peer States
8th Grade Reading (24.7 points) 40th largest gap, similar to US
average Comparable to Peer States
8th Grade Math (25.6 points) 28th largest gap, smaller than
the US average Better than 7 of 8 Peer States
Outcome Measure
Gap Reduction
Similar to Peer
States
Similar to U.S.
Average
4th Grade Reading 28.4 Yes Yes
4th GradeMath 23.2 Smallest
Gap Yes
8th Grade Reading 24.7 Yes Yes
8th Grade Math 25.6
Smaller than Most
Smaller Gap
Washington State Board of Education
0
10
20
30
40
50
HI WV
NM ND
NH
WA DE IN NY AZ NC KY OK SD GA FL TX PA MN OR AK AL VA AR LA MS
NV TN US NJ
SC NE IA RI
MO MI
KS CA MD CT MA IL
ME
CO OH WI
DC ID MT
UT VT WY
Scal
ed S
core
Poi
nts
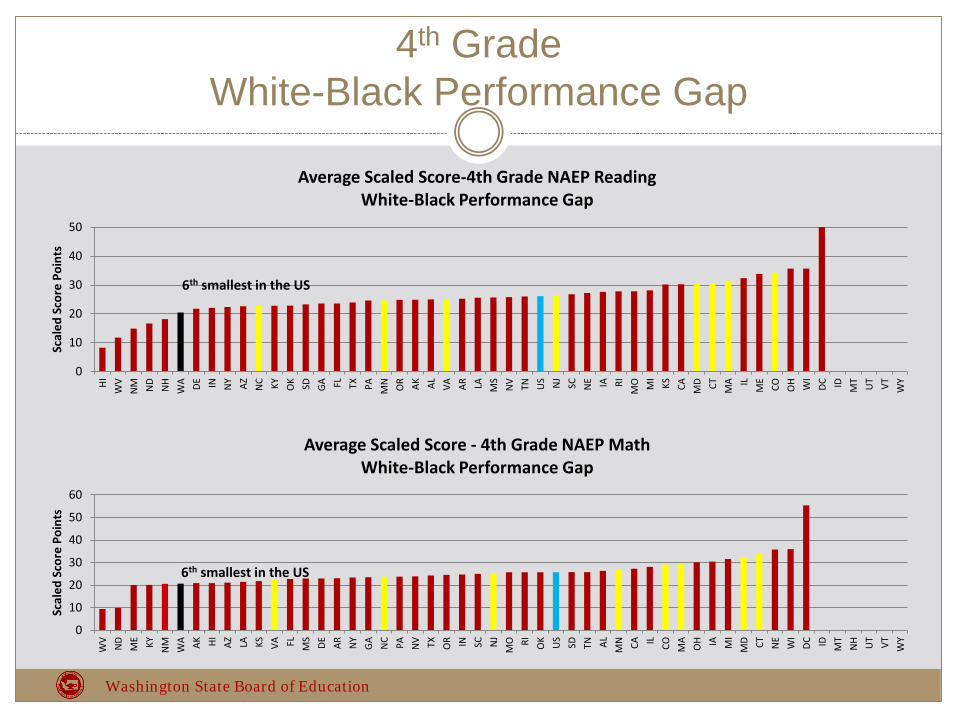
Average Scaled Score-4th Grade NAEP ReadingWhite-Black Performance Gap
4th Grade White-Black Performance Gap
0
10
20
30
40
50
60
WV
ND
ME KY N
M WA AK HI AZ LA KS VA FL MS
DE AR NY
GA NC PA NV TX OR IN SC NJ
MO RI OK US SD TN AL MN CA IL CO MA
OH IA MI
MD CT NE
WI
DC ID MT
NH UT VT WY
Scal
ed S
core
Poi
nts
Average Scaled Score - 4th Grade NAEP MathWhite-Black Performance Gap
6th smallest in the US
6th smallest in the US
Washington State Board of Education
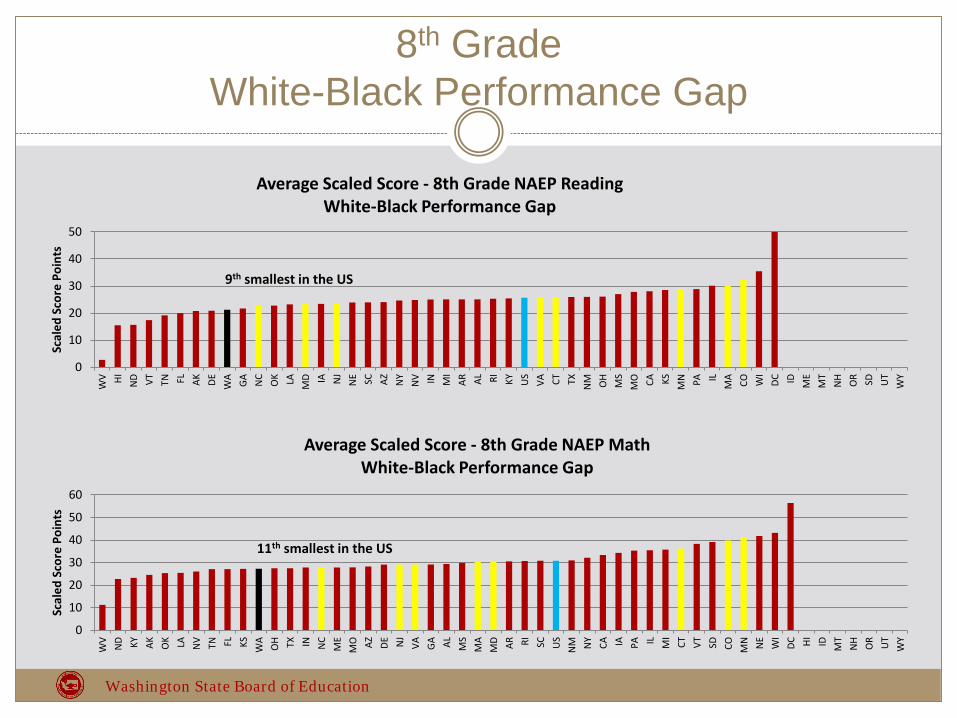
8th GradeWhite-Black Performance Gap
0
10
20
30
40
50
WV HI ND VT TN FL AK DE WA GA NC
OK LA MD IA NJ
NE SC AZ NY
NV IN MI
AR AL RI KY US
VA CT TX NM OH
MS
MO CA KS MN PA IL
MA CO WI
DC ID ME
MT
NH OR SD UT
WY
Scal
ed S
core
Poi
nts
Average Scaled Score - 8th Grade NAEP ReadingWhite-Black Performance Gap
9th smallest in the US
0
10
20
30
40
50
60
WV
ND KY AK OK LA NV TN FL KS WA
OH TX IN NC
ME
MO AZ DE NJ
VA GA AL MS
MA
MD AR RI SC US
NM NY CA IA PA IL MI
CT VT SD CO MN NE
WI
DC HI ID MT
NH OR UT
WY
Scal
ed S
core
Poi
nts
Average Scaled Score - 8th Grade NAEP MathWhite-Black Performance Gap
11th smallest in the US
Washington State Board of Education
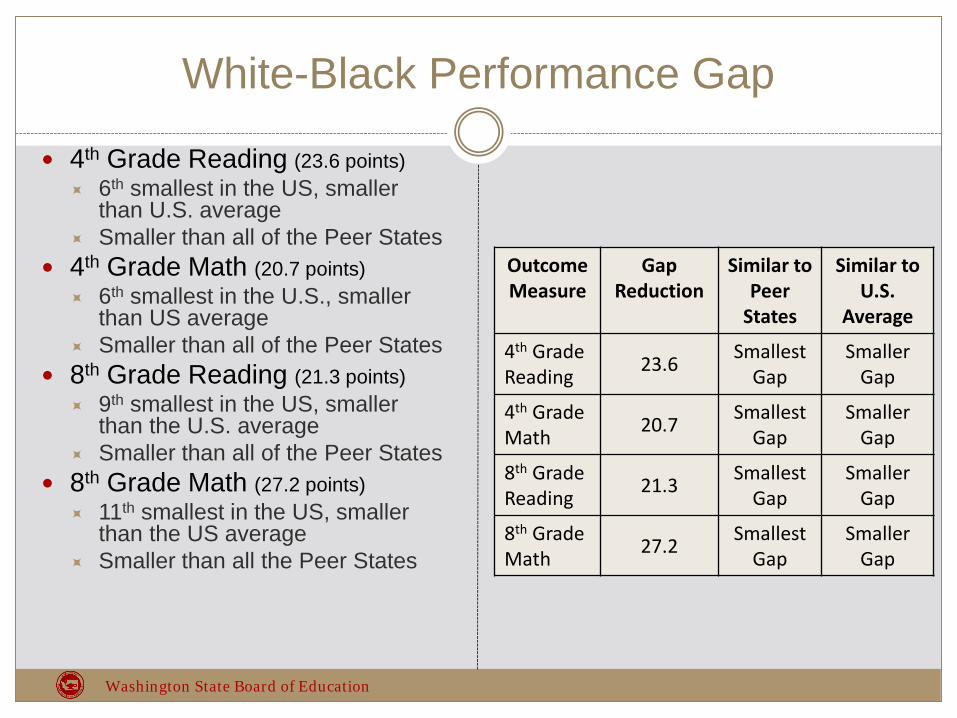
White-Black Performance Gap
4th Grade Reading (23.6 points) 6th smallest in the US, smaller
than U.S. average Smaller than all of the Peer States
4th Grade Math (20.7 points) 6th smallest in the U.S., smaller
than US average Smaller than all of the Peer States
8th Grade Reading (21.3 points) 9th smallest in the US, smaller
than the U.S. average Smaller than all of the Peer States
8th Grade Math (27.2 points) 11th smallest in the US, smaller
than the US average Smaller than all the Peer States
Outcome Measure
Gap Reduction
Similar to Peer
States
Similar to U.S.
Average
4th Grade Reading 23.6 Smallest
GapSmaller
Gap
4th GradeMath 20.7 Smallest
GapSmaller
Gap
8th Grade Reading 21.3 Smallest
GapSmaller
Gap
8th Grade Math 27.2 Smallest
GapSmaller
Gap
Washington State Board of Education
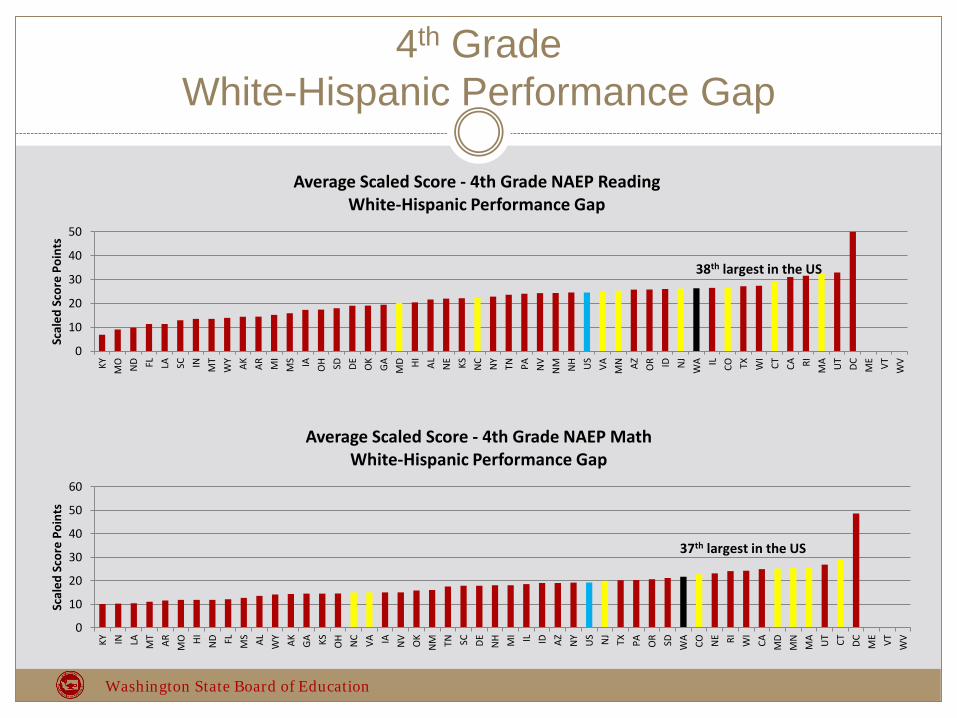
4th GradeWhite-Hispanic Performance Gap
0
10
20
30
40
50
KY MO ND FL LA SC IN MT
WY AK AR MI
MS IA OH SD DE OK
GA MD HI AL NE KS NC NY
TN PA NV
NM NH US
VA MN AZ OR ID NJ
WA IL CO TX WI
CT CA RIM
A UT
DC ME VT WV
Scal
ed S
core
Poi
nts
Average Scaled Score - 4th Grade NAEP ReadingWhite-Hispanic Performance Gap
38th largest in the US
0
10
20
30
40
50
60
KY IN LA MT AR MO HI ND FL MS AL WY AK GA KS OH NC VA IA NV OK
NM TN SC DE NH MI IL ID AZ N
Y US NJ
TX PA OR SD WA CO NE RI WI
CA MD
MN
MA UT CT DC ME VT WV
Scal
ed S
core
Poi
nts
Average Scaled Score - 4th Grade NAEP MathWhite-Hispanic Performance Gap
37th largest in the US
Washington State Board of Education
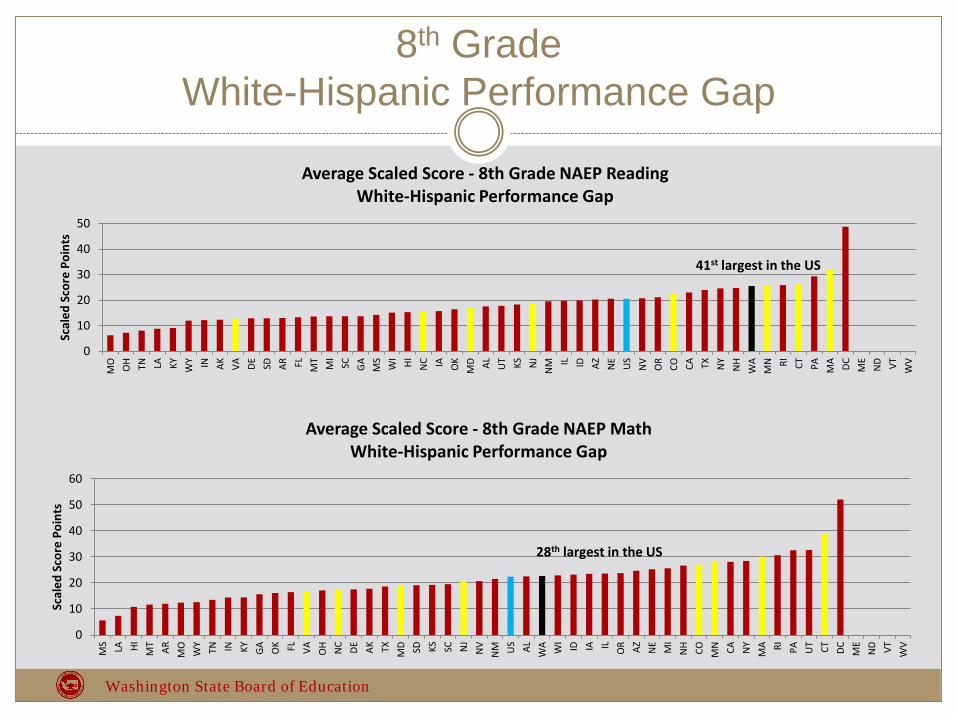
8th GradeWhite-Hispanic Performance Gap
0
10
20
30
40
50
60
MS LA HI MT AR MO
WY
TN IN KY GA OK FL VA OH NC DE AK TX MD SD KS SC NJ
NV
NM US AL WA WI ID IA IL O
R AZ NE MI
NH CO MN CA NY
MA RI PA UT CT DC ME
ND VT WV
Scal
ed S
core
Poi
nts
Average Scaled Score - 8th Grade NAEP MathWhite-Hispanic Performance Gap
0
10
20
30
40
50
MO OH TN LA KY WY IN AK VA DE SD AR FL MT MI
SC GA MS
WI HI N
C IA OK
MD AL UT KS NJ
NM IL ID AZ NE US
NV
OR
CO CA TX NY
NH
WA
MN RI CT PA MA DC ME
ND VT WV
Scal
ed S
core
Poi
nts
Average Scaled Score - 8th Grade NAEP ReadingWhite-Hispanic Performance Gap
41st largest in the US
28th largest in the US
Washington State Board of Education
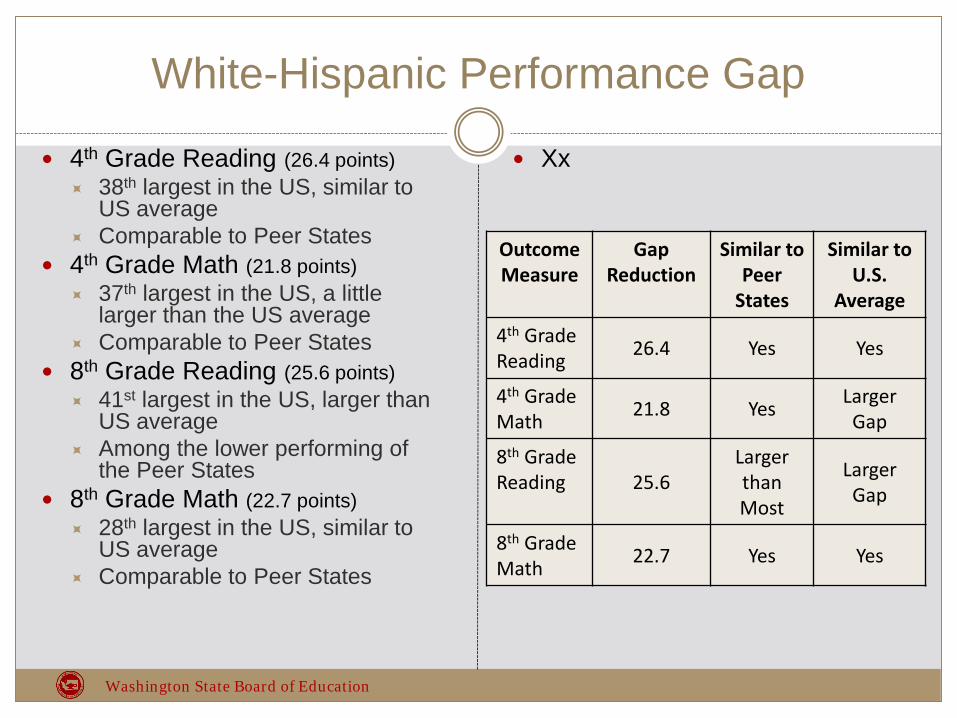
White-Hispanic Performance Gap
4th Grade Reading (26.4 points) 38th largest in the US, similar to
US average Comparable to Peer States
4th Grade Math (21.8 points) 37th largest in the US, a little
larger than the US average Comparable to Peer States
8th Grade Reading (25.6 points) 41st largest in the US, larger than
US average Among the lower performing of
the Peer States 8th Grade Math (22.7 points)
28th largest in the US, similar to US average
Comparable to Peer States
Xx
Outcome Measure
Gap Reduction
Similar to Peer
States
Similar to U.S.
Average
4th Grade Reading 26.4 Yes Yes
4th GradeMath 21.8 Yes Larger
Gap
8th Grade Reading 25.6
Larger thanMost
Larger Gap
8th Grade Math 22.7 Yes Yes
Washington State Board of Education
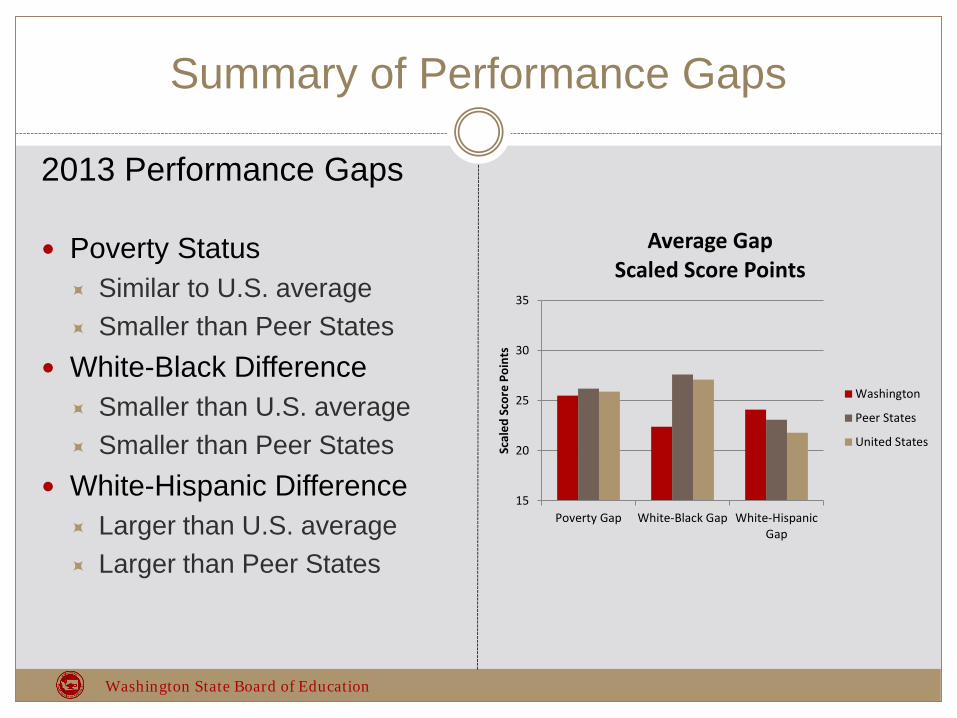
Summary of Performance Gaps
2013 Performance Gaps
Poverty Status Similar to U.S. average Smaller than Peer States
White-Black Difference Smaller than U.S. average Smaller than Peer States
White-Hispanic Difference Larger than U.S. average Larger than Peer States
15
20
25
30
35
Poverty Gap White-Black Gap White-HispanicGap
Scal
ed S
core
Poi
nts
Average GapScaled Score Points
Washington
Peer States
United States
Washington State Board of Education
Recent Statement in the Times
“Statistics from the state Office of Superintendent of Public Instruction show our state ranked in the very bottom five states in closing the racial and ethnic achievement gap for K-12 students…”
(The Seattle Times, December 23, 2014)
Pamela BakerPresident and CEP of the Urban League of Metropolitan Seattle
Washington State Board of Education
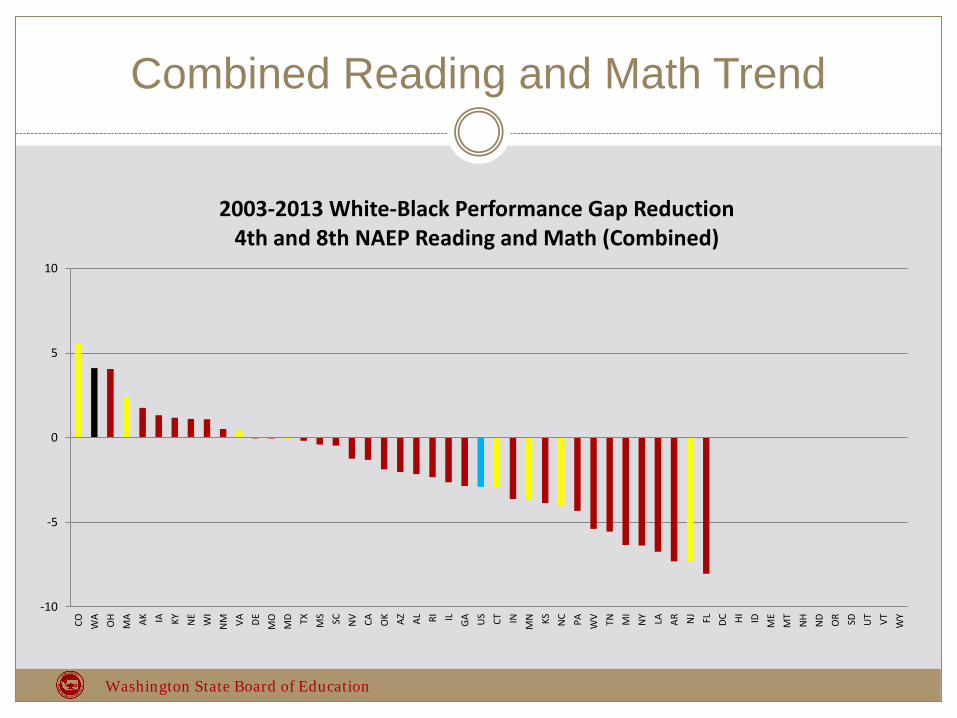
Combined Reading and Math Trend
-10
-5
0
5
10
CO WA
OH
MA AK IA KY NE
WI
NM VA DE MO
MD TX MS SC NV CA OK AZ AL RI IL GA US CT IN MN KS NC PA WV TN MI
NY LA AR NJ FL DC HI ID ME
MT
NH
ND OR SD UT VT WY
2003-2013 White-Black Performance Gap Reduction4th and 8th NAEP Reading and Math (Combined)
Washington State Board of Education
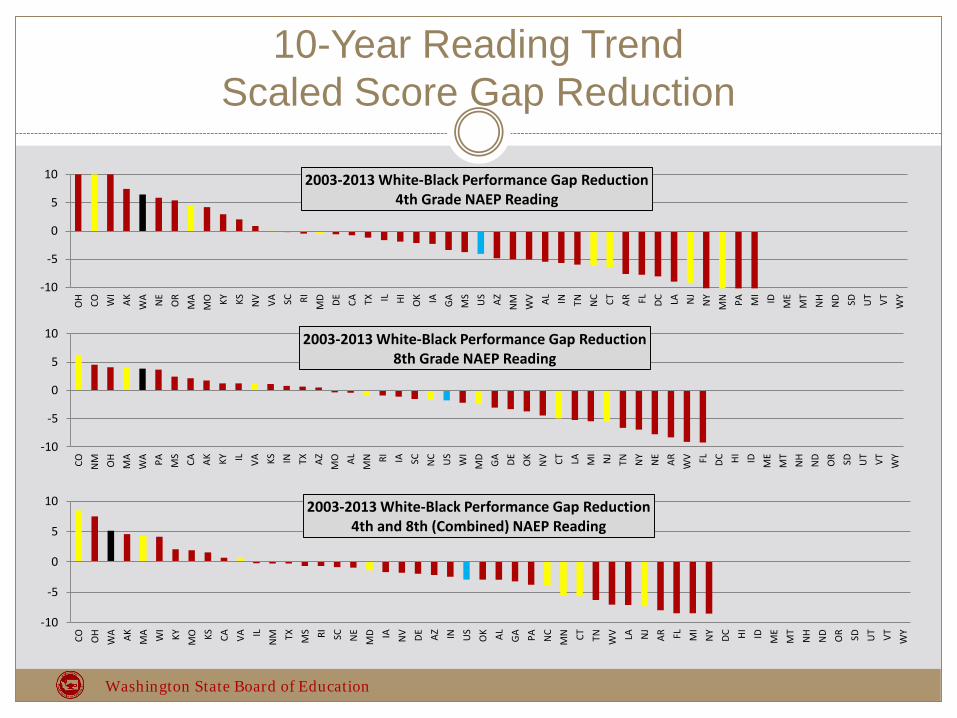
10-Year Reading TrendScaled Score Gap Reduction
-10
-5
0
5
10
OH CO WI
AK WA NE
OR
MA
MO KY KS NV VA SC RI
MD DE CA TX IL HI OK IA GA MS
US AZ N
M WV AL IN TN NC CT AR FL DC LA NJ
NY
MN PA MI ID M
EM
TN
HN
D SD UT VT WY
2003-2013 White-Black Performance Gap Reduction4th Grade NAEP Reading
-10
-5
0
5
10
CO NM OH
MA
WA PA MS
CA AK KY IL VA KS IN TX AZ MO AL MN RI IA SC NC US
WI
MD GA DE OK
NV CT LA MI
NJ
TN NY
NE AR WV FL DC HI ID ME
MT
NH
ND OR SD UT VT WY
2003-2013 White-Black Performance Gap Reduction8th Grade NAEP Reading
-10
-5
0
5
10
CO OH
WA AK MA WI
KY MO KS CA VA IL
NM TX MS RI SC NE
MD IA NV DE AZ IN US
OK AL GA PA NC
MN CT TN WV LA NJ
AR FL MI
NY
DC HI ID ME
MT
NH
ND OR SD UT VT WY
2003-2013 White-Black Performance Gap Reduction4th and 8th (Combined) NAEP Reading
Washington State Board of Education
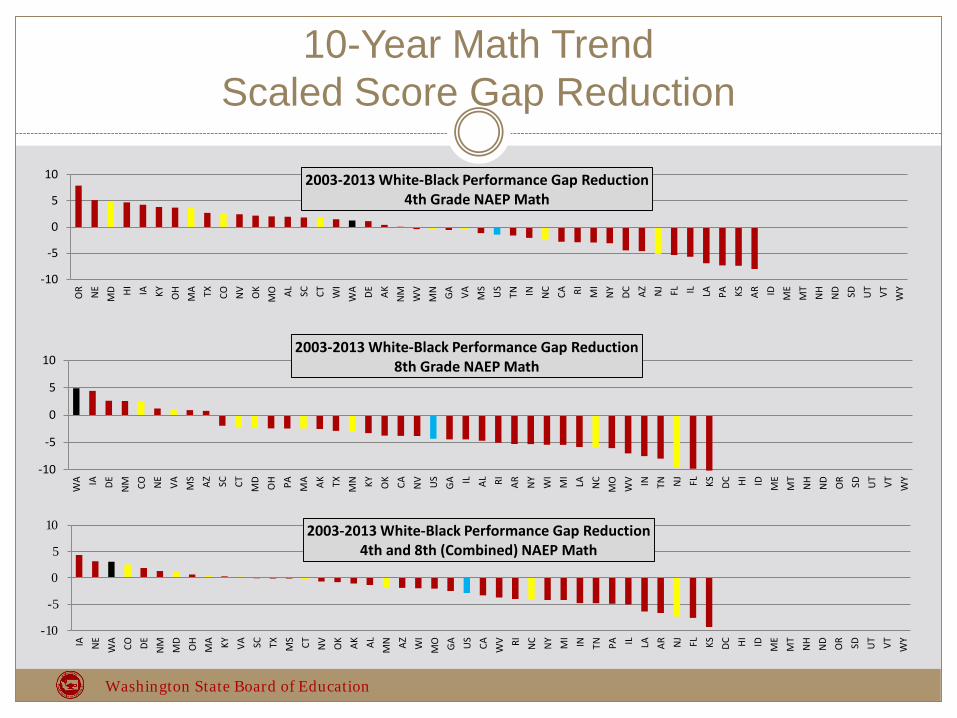
10-Year Math TrendScaled Score Gap Reduction
-10
-5
0
5
10
OR NE
MD HI IA KY OH
MA TX CO NV OK
MO AL SC CT WI
WA DE AK N
M WV
MN GA VA MS
US
TN IN NC CA RI MI
NY
DC AZ NJ FL IL LA PA KS AR ID ME
MT
NH
ND SD UT VT WY
2003-2013 White-Black Performance Gap Reduction4th Grade NAEP Math
-10
-5
0
5
10
WA IA DE N
M CO NE
VA MS AZ SC CT MD
OH PA MA AK TX MN KY OK CA NV US
GA IL AL RI AR NY
WI
MI
LA NC
MO
WV IN TN NJ FL KS DC HI ID ME
MT
NH
ND OR SD UT VT WY
2003-2013 White-Black Performance Gap Reduction8th Grade NAEP Math
-10
-5
0
5
10
IA NE
WA CO DE N
M MD
OH
MA KY VA SC TX MS CT NV OK AK AL MN AZ WI
MO GA US
CA WV RI NC NY MI
IN TN PA IL LA AR NJ FL KS DC HI ID ME
MT
NH
ND OR SD UT VT WY
2003-2013 White-Black Performance Gap Reduction4th and 8th (Combined) NAEP Math
Washington State Board of Education
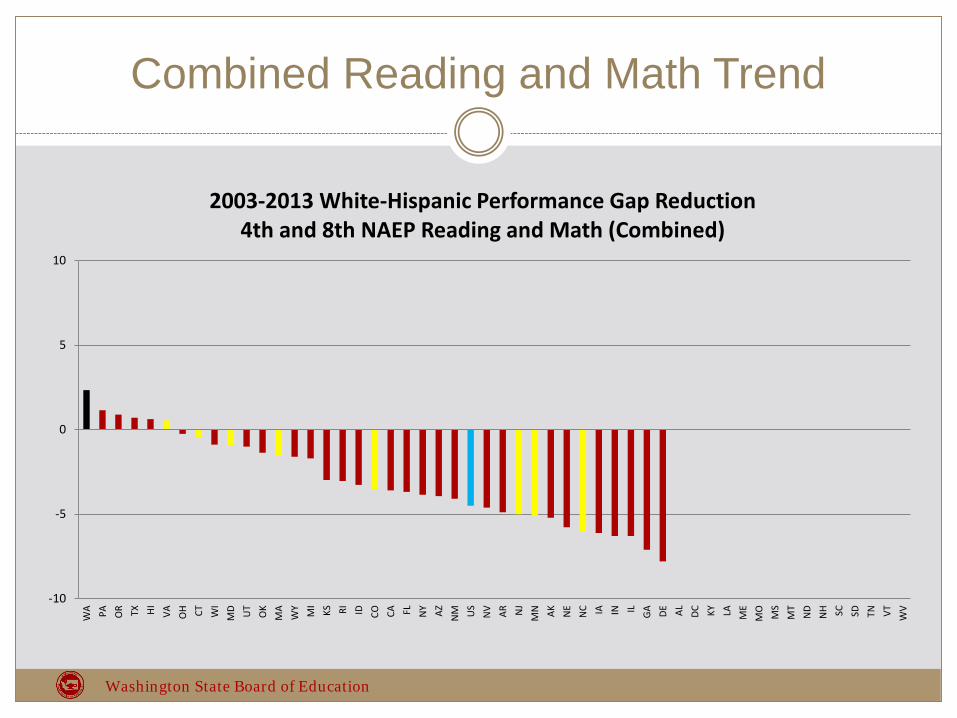
Combined Reading and Math Trend
-10
-5
0
5
10
WA PA OR TX HI VA OH CT WI
MD UT
OK
MA
WY MI
KS RI ID CO CA FL NY AZ N
M US
NV AR NJ
MN AK NE
NC IA IN IL GA DE AL DC KY LA ME
MO
MS
MT
ND
NH SC SD TN VT WV
2003-2013 White-Hispanic Performance Gap Reduction4th and 8th NAEP Reading and Math (Combined)
Washington State Board of Education
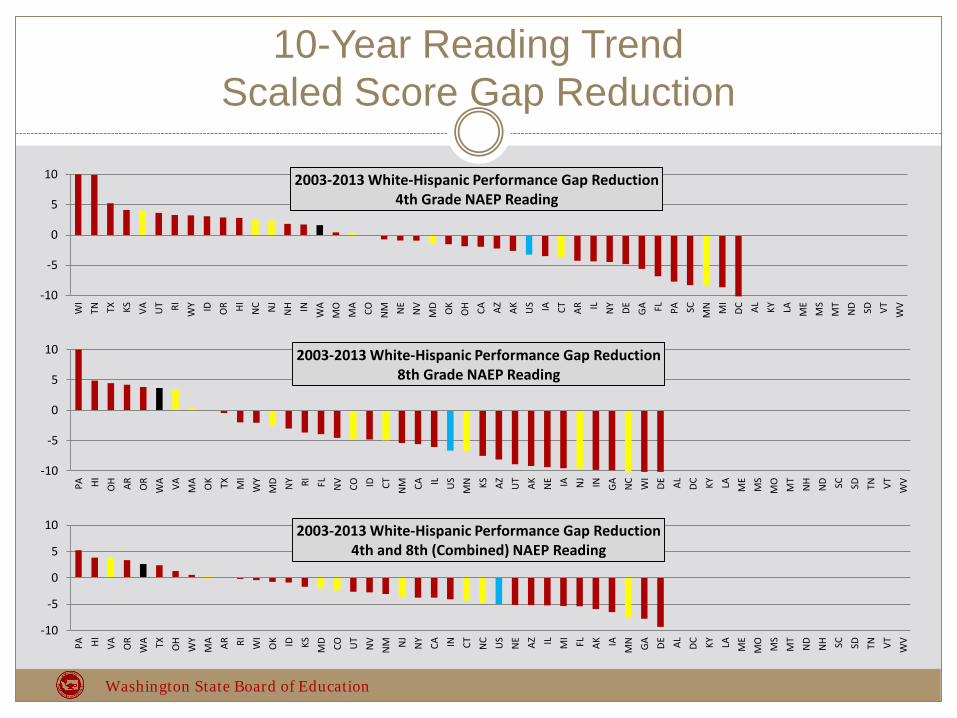
10-Year Reading TrendScaled Score Gap Reduction
-10
-5
0
5
10
WI
TN TX KS VA UT RI WY ID OR HI NC NJ
NH IN WA
MO
MA CO N
M NE
NV
MD OK
OH CA AZ AK US IA CT AR IL NY DE GA FL PA SC MN MI
DC AL KY LA ME
MS
MT
ND SD VT WV
2003-2013 White-Hispanic Performance Gap Reduction4th Grade NAEP Reading
-10
-5
0
5
10
PA HI OH AR OR
WA VA MA OK TX MI
WY
MD NY RI FL NV CO ID CT N
M CA IL US
MN KS AZ UT AK NE IA NJ IN GA NC WI
DE AL DC KY LA ME
MS
MO
MT
NH
ND SC SD TN VT WV
2003-2013 White-Hispanic Performance Gap Reduction8th Grade NAEP Reading
-10
-5
0
5
10
PA HI VA OR
WA TX OH
WY
MA AR RI WI
OK ID KS MD CO UT
NV
NM N
JN
Y CA IN CT NC US
NE AZ IL MI FL AK IA
MN GA DE AL DC KY LA ME
MO
MS
MT
ND
NH SC SD TN VT WV
2003-2013 White-Hispanic Performance Gap Reduction4th and 8th (Combined) NAEP Reading
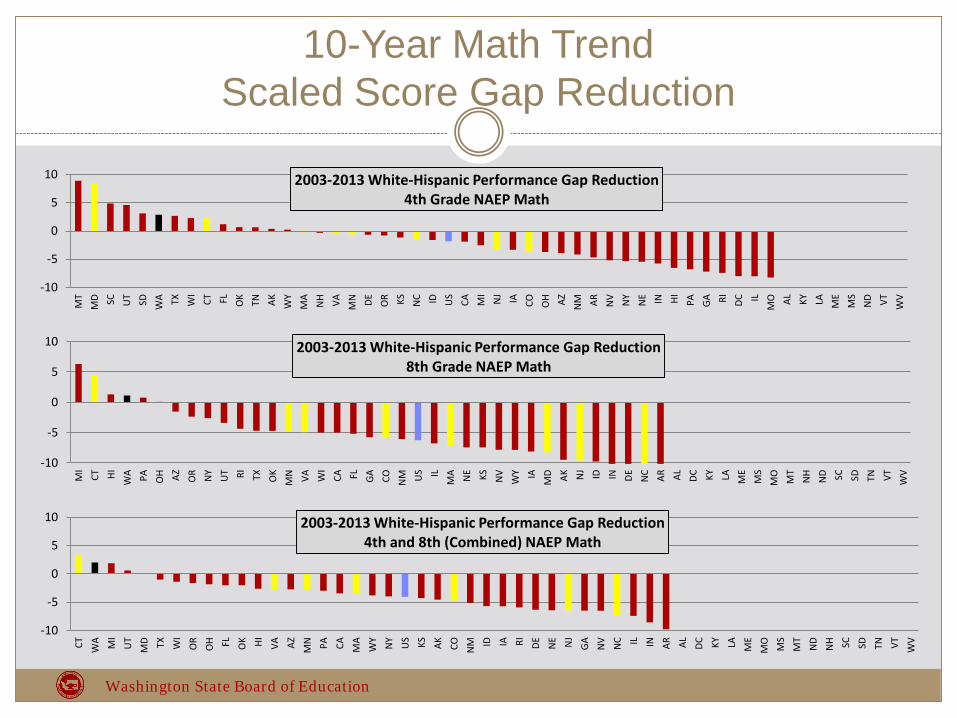
Washington State Board of Education
10-Year Math TrendScaled Score Gap Reduction
-10
-5
0
5
10
MT
MD SC UT SD WA TX WI
CT FL OK TN AK WY
MA
NH VA MN DE OR KS NC ID US
CA MI
NJ IA CO O
H AZ NM AR NV NY
NE IN HI PA GA RI DC IL
MO AL KY LA ME
MS
ND VT WV
2003-2013 White-Hispanic Performance Gap Reduction4th Grade NAEP Math
-10
-5
0
5
10
MI
CT HI WA PA OH AZ OR NY
UT RI TX OK
MN VA WI
CA FL GA CO NM US IL
MA NE KS NV
WY IA
MD AK NJ ID IN DE NC AR AL DC KY LA ME
MS
MO
MT
NH
ND SC SD TN VT WV
2003-2013 White-Hispanic Performance Gap Reduction8th Grade NAEP Math
-10
-5
0
5
10
CT WA MI
UT
MD TX WI
OR
OH FL OK HI VA AZ MN PA CA MA
WY
NY US KS AK CO N
M ID IA RI DE NE NJ
GA NV NC IL IN AR AL DC KY LA ME
MO
MS
MT
ND
NH SC SD TN VT WV
2003-2013 White-Hispanic Performance Gap Reduction4th and 8th (Combined) NAEP Math
Washington State Board of Education
Performance Gaps Are Widening
“Statistics from the state Office of Superintendent of Public Instruction show our state ranked in the very bottom five states in closing the racial and ethnic achievement gap for K-12 students…”
(The Seattle Times, December 23, 2014)
Pamela BakerPresident and CEP of the Urban League of Metropolitan Seattle
Snapshot view – Washington’s performance is similar to national averages and Peer States regarding size of gaps.10-year view – Washington’s performance is among the lowest in the country in closing gaps.
Washington State Board of Education
Contact Information
Contact [email protected] for more information regarding this work.
Washington State Board of Education