Embed Size (px)
Citation preview
Supporting Information
Construction of 1T@2H MoS2 heterostructures in situ from
natural molybdenite with enhanced electrochemical
performance for lithium-ion batteries
ChengLong Peng, Mingming Shi, Fei Li, Yang Wang, Xueqin Liu, HuaSheng Liu and Zhen
Li
Engineering Research Center of Nano-Geomaterials of Ministry of Education,
Faculty of Materials Science and Chemistry, China University of Geosciences, Wuhan,
Hubei 430074, P. R. China
E-mail: [email protected]
Electronic Supplementary Material (ESI) for RSC Advances.This journal is © The Royal Society of Chemistry 2021
Additional figures discussions
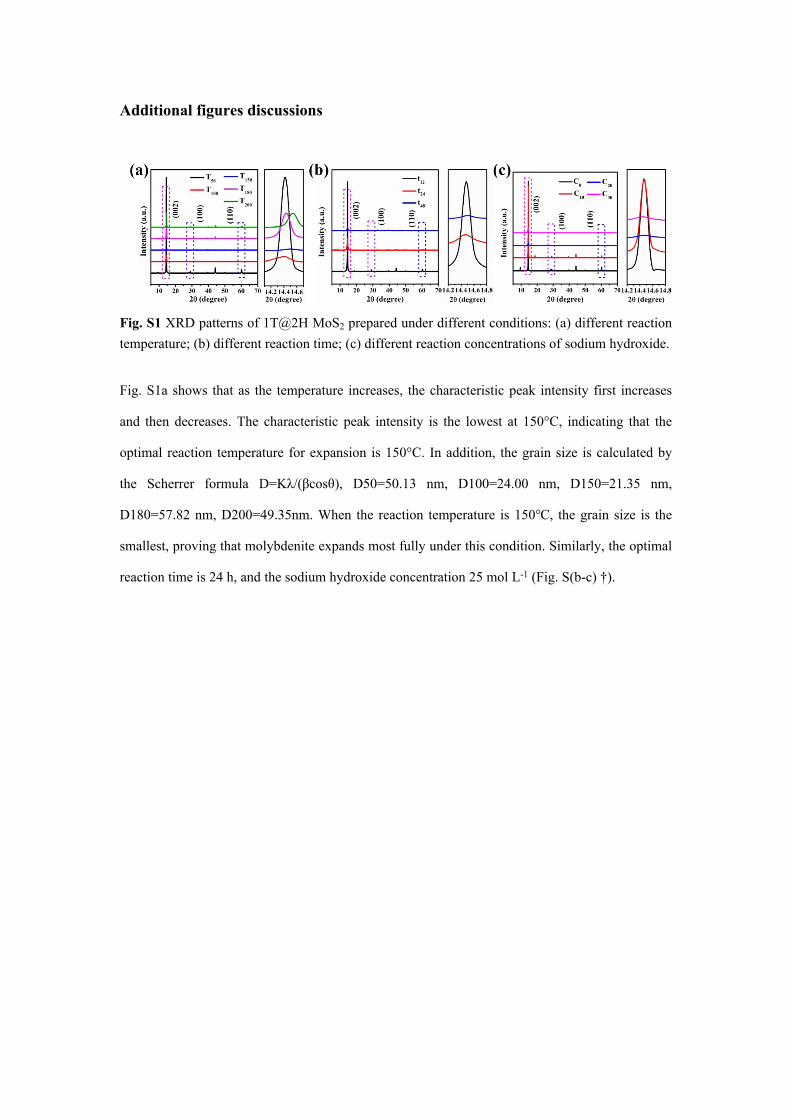
Fig. S1 XRD patterns of 1T@2H MoS2 prepared under different conditions: (a) different reaction temperature; (b) different reaction time; (c) different reaction concentrations of sodium hydroxide.
Fig. S1a shows that as the temperature increases, the characteristic peak intensity first increases
and then decreases. The characteristic peak intensity is the lowest at 150°C, indicating that the
optimal reaction temperature for expansion is 150°C. In addition, the grain size is calculated by
the Scherrer formula D=Kλ/(βcosθ), D50=50.13 nm, D100=24.00 nm, D150=21.35 nm,
D180=57.82 nm, D200=49.35nm. When the reaction temperature is 150℃, the grain size is the
smallest, proving that molybdenite expands most fully under this condition. Similarly, the optimal
reaction time is 24 h, and the sodium hydroxide concentration 25 mol L-1 (Fig. S(b-c) †).
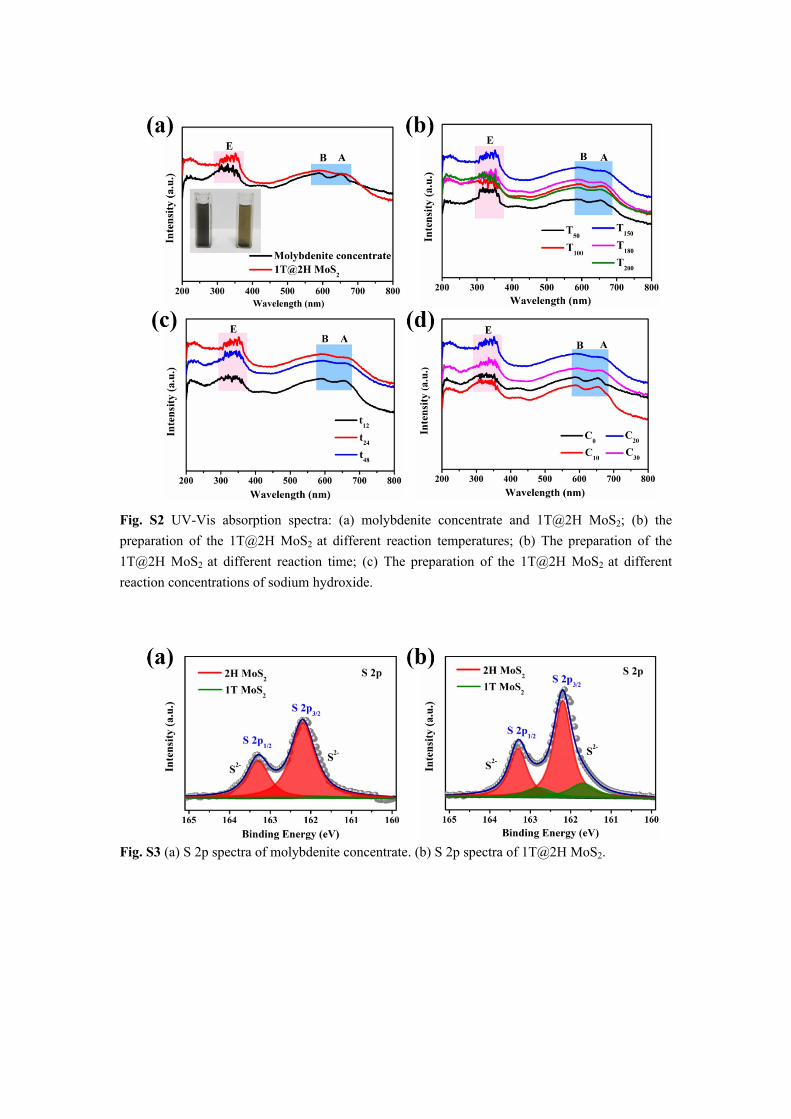
Fig. S2 UV-Vis absorption spectra: (a) molybdenite concentrate and 1T@2H MoS2; (b) the preparation of the 1T@2H MoS2 at different reaction temperatures; (b) The preparation of the 1T@2H MoS2 at different reaction time; (c) The preparation of the 1T@2H MoS2 at different reaction concentrations of sodium hydroxide.
Fig. S3 (a) S 2p spectra of molybdenite concentrate. (b) S 2p spectra of 1T@2H MoS2.
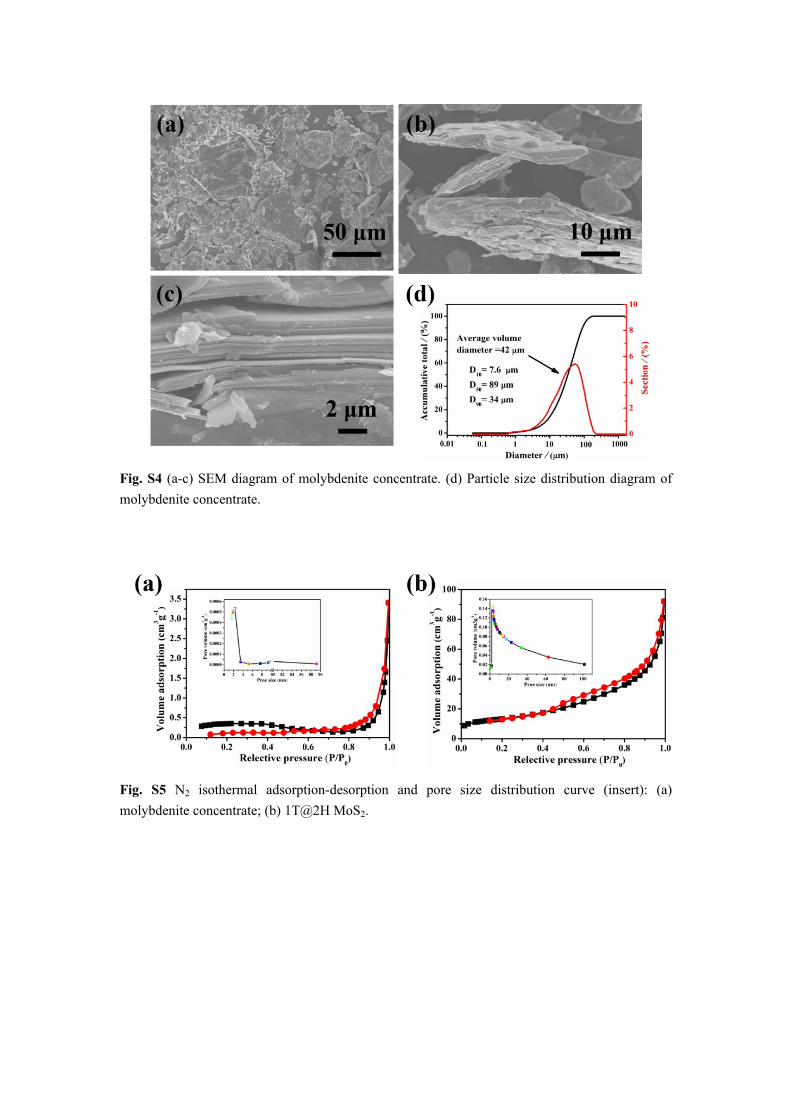
Fig. S4 (a-c) SEM diagram of molybdenite concentrate. (d) Particle size distribution diagram of molybdenite concentrate.
Fig. S5 N2 isothermal adsorption-desorption and pore size distribution curve (insert): (a) molybdenite concentrate; (b) 1T@2H MoS2.
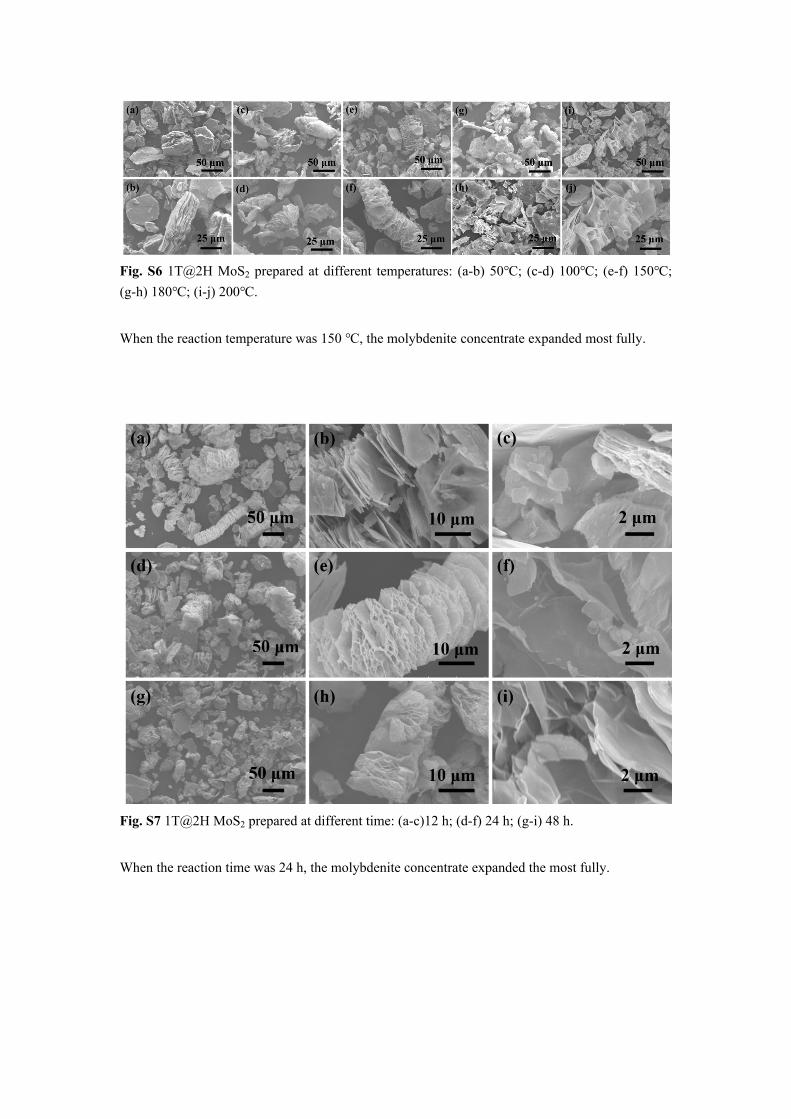
Fig. S6 1T@2H MoS2 prepared at different temperatures: (a-b) 50℃; (c-d) 100℃; (e-f) 150℃; (g-h) 180℃; (i-j) 200℃.
When the reaction temperature was 150 ℃, the molybdenite concentrate expanded most fully.
Fig. S7 1T@2H MoS2 prepared at different time: (a-c)12 h; (d-f) 24 h; (g-i) 48 h.
When the reaction time was 24 h, the molybdenite concentrate expanded the most fully.
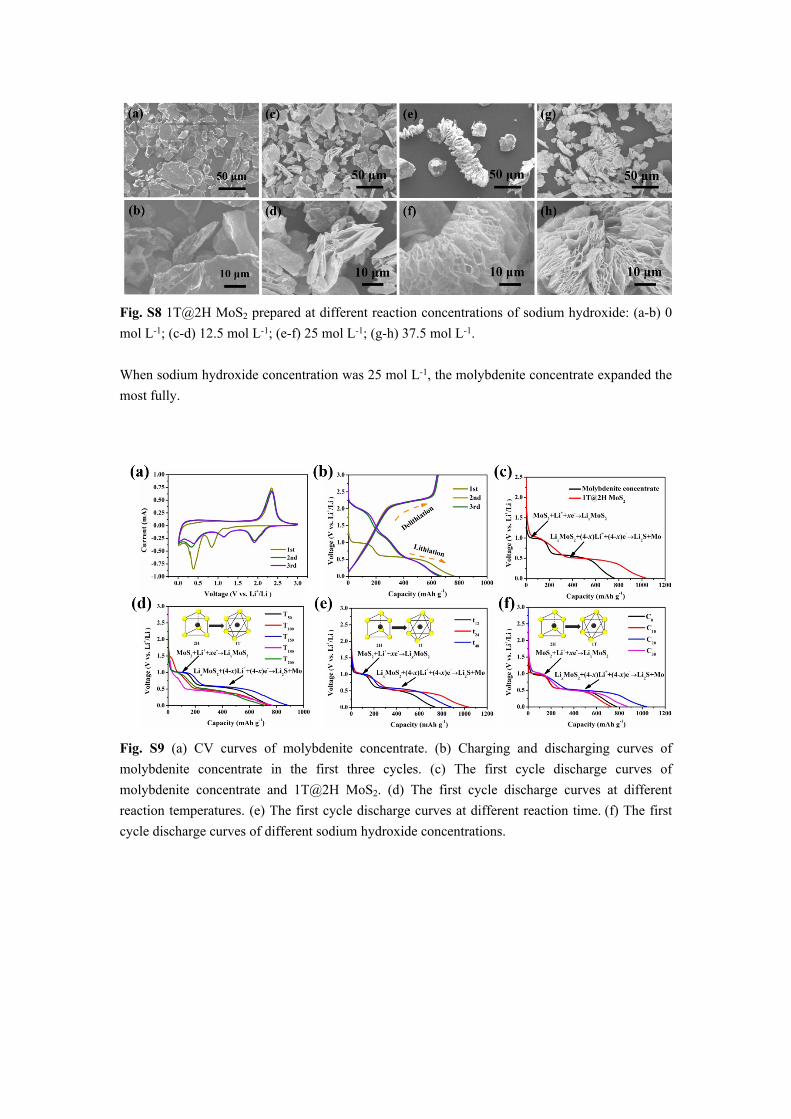
Fig. S8 1T@2H MoS2 prepared at different reaction concentrations of sodium hydroxide: (a-b) 0 mol L-1; (c-d) 12.5 mol L-1; (e-f) 25 mol L-1; (g-h) 37.5 mol L-1.
When sodium hydroxide concentration was 25 mol L-1, the molybdenite concentrate expanded the most fully.
Fig. S9 (a) CV curves of molybdenite concentrate. (b) Charging and discharging curves of molybdenite concentrate in the first three cycles. (c) The first cycle discharge curves of molybdenite concentrate and 1T@2H MoS2. (d) The first cycle discharge curves at different reaction temperatures. (e) The first cycle discharge curves at different reaction time. (f) The first cycle discharge curves of different sodium hydroxide concentrations.

Fig. S10 (a) SEM images of the molybdenite concentrate. (b) 1T@2H MoS2 electrode after 120 cycles at a current density of 100 mA g-1. (c) Separators color contrast after 120 cycles.
Fig. S11 Comparison diagram for the long-cycle performance of molybdenite concentrate and 1T@2H MoS2.
Fig. S12 1T@2H MoS2 rate performances: (a) different reaction temperature; (b) different reaction time; (c) different sodium hydroxide concentrations.
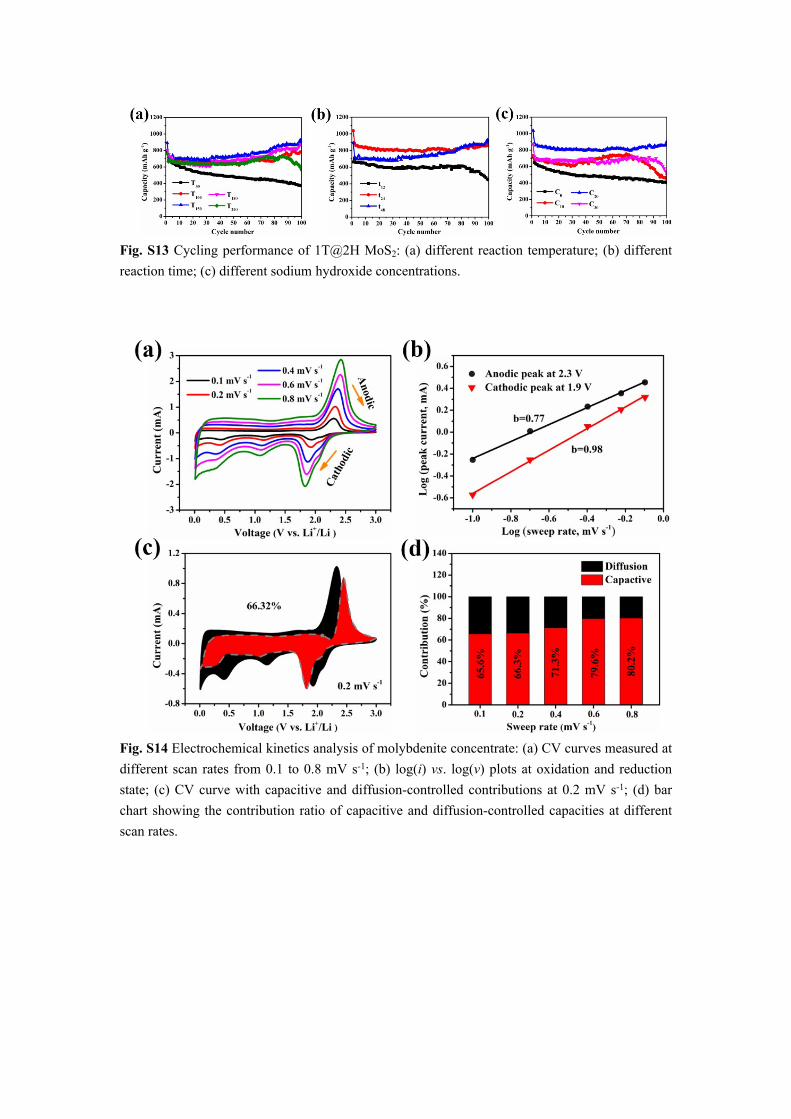
Fig. S13 Cycling performance of 1T@2H MoS2: (a) different reaction temperature; (b) different reaction time; (c) different sodium hydroxide concentrations.
Fig. S14 Electrochemical kinetics analysis of molybdenite concentrate: (a) CV curves measured at different scan rates from 0.1 to 0.8 mV s-1; (b) log(i) vs. log(v) plots at oxidation and reduction state; (c) CV curve with capacitive and diffusion-controlled contributions at 0.2 mV s-1; (d) bar chart showing the contribution ratio of capacitive and diffusion-controlled capacities at different scan rates.
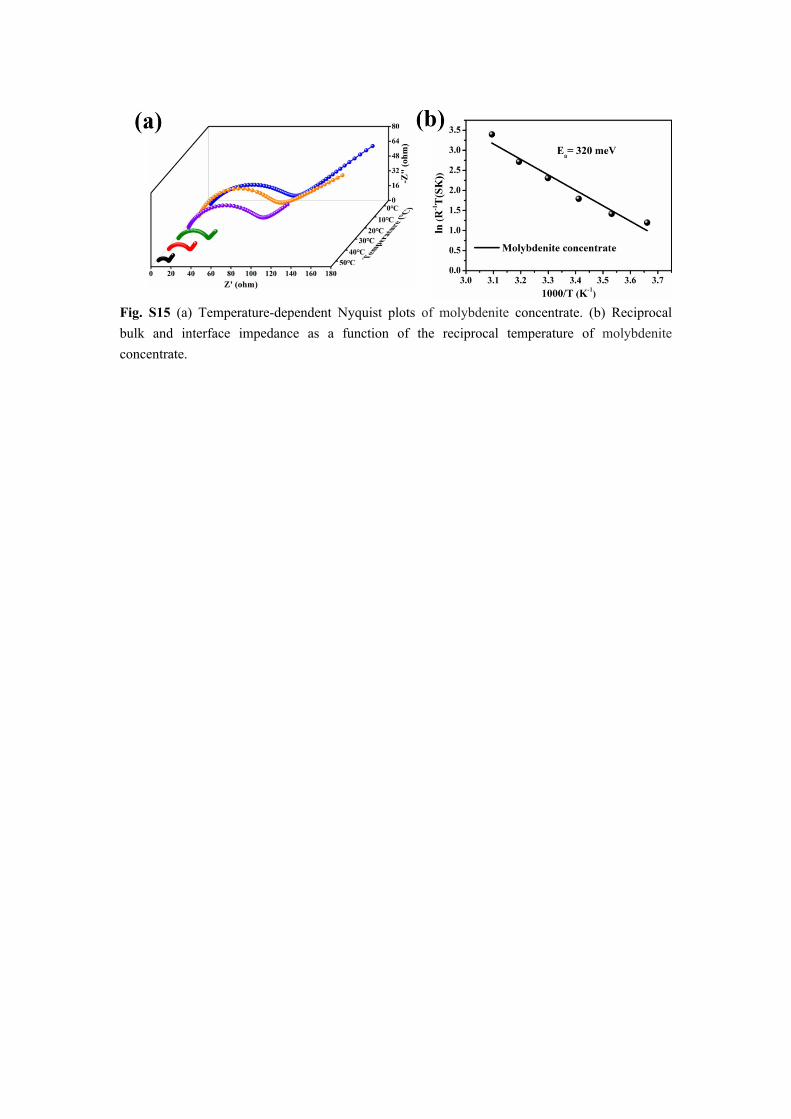
Fig. S15 (a) Temperature-dependent Nyquist plots of molybdenite concentrate. (b) Reciprocal bulk and interface impedance as a function of the reciprocal temperature of molybdenite concentrate.

Table S1 Sample number of 1T @2H MoS2 prepared under different conditions.
Reaction conditions Sample number Detailed parameter
T50 50℃
T100 100℃,
T150 150℃,
T180 180℃,
Temperature (℃)
T200 200℃
t12 12 h
t24 24 hTime (h)
t48 48 h
C0 0 mol L-1
C10 12.5 mol L-1
C20 25 mol L-1Concentration (mol L-1)
C30 37.5 mol L-1
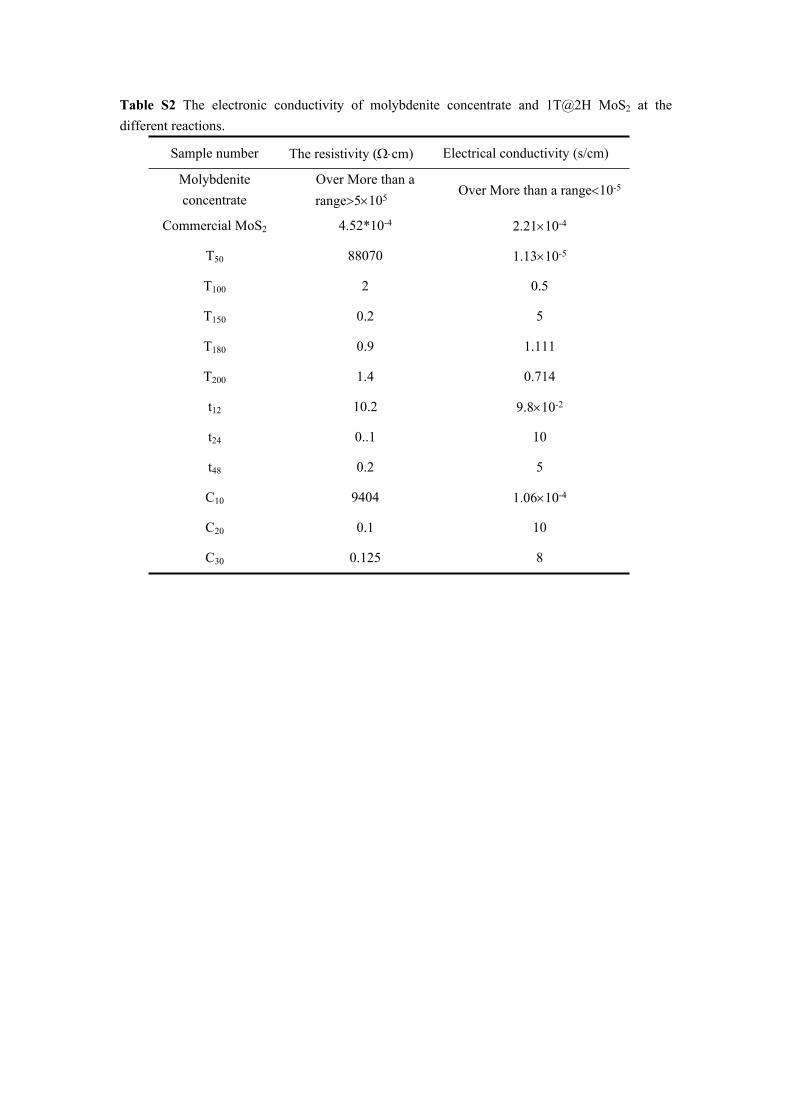
Table S2 The electronic conductivity of molybdenite concentrate and 1T@2H MoS2 at the different reactions.
Sample number The resistivity (cm) Electrical conductivity (s/cm)
Molybdenite concentrate
Over More than a range5105 Over More than a range10-5
Commercial MoS2 4.52*10-4 2.2110-4
T50 88070 1.1310-5
T100 2 0.5
T150 0.2 5
T180 0.9 1.111
T200 1.4 0.714
t12 10.2 9.810-2
t24 0..1 10
t48 0.2 5
C10 9404 1.0610-4
C20 0.1 10
C30 0.125 8
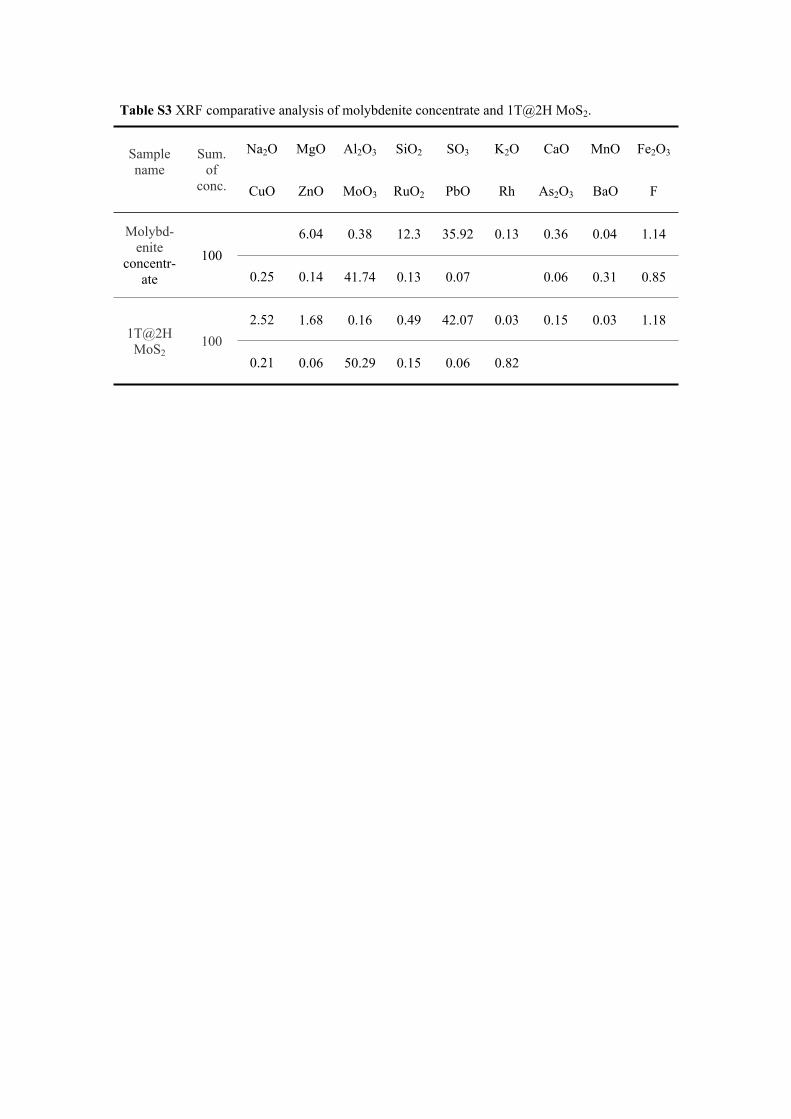
Table S3 XRF comparative analysis of molybdenite concentrate and 1T@2H MoS2.
Na2O MgO Al2O3 SiO2 SO3 K2O CaO MnO Fe2O3Sample name
Sum. of
conc. CuO ZnO MoO3 RuO2 PbO Rh As2O3 BaO F
6.04 0.38 12.3 35.92 0.13 0.36 0.04 1.14Molybd-enite
concentr-ate
1000.25 0.14 41.74 0.13 0.07 0.06 0.31 0.85
2.52 1.68 0.16 0.49 42.07 0.03 0.15 0.03 1.181T@2H MoS2
1000.21 0.06 50.29 0.15 0.06 0.82
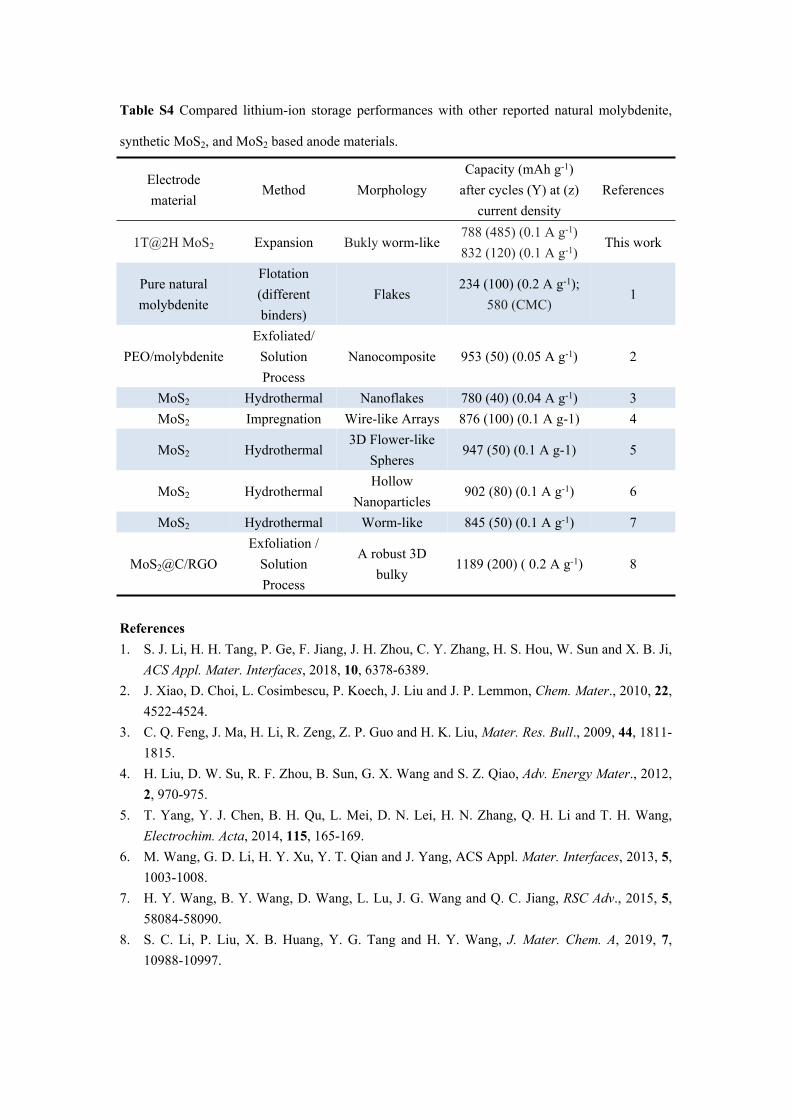
Table S4 Compared lithium-ion storage performances with other reported natural molybdenite,
synthetic MoS2, and MoS2 based anode materials.
Electrode material
Method MorphologyCapacity (mAh g-1)
after cycles (Y) at (z) current density
References
1T@2H MoS2 Expansion Bukly worm-like788 (485) (0.1 A g-1)832 (120) (0.1 A g-1)
This work
Pure natural molybdenite
Flotation (different binders)
Flakes234 (100) (0.2 A g-1);
580 (CMC)1
PEO/molybdeniteExfoliated/
Solution Process
Nanocomposite 953 (50) (0.05 A g-1) 2
MoS2 Hydrothermal Nanoflakes 780 (40) (0.04 A g-1) 3MoS2 Impregnation Wire-like Arrays 876 (100) (0.1 A g-1) 4
MoS2 Hydrothermal3D Flower-like
Spheres947 (50) (0.1 A g-1) 5
MoS2 HydrothermalHollow
Nanoparticles902 (80) (0.1 A g-1) 6
MoS2 Hydrothermal Worm-like 845 (50) (0.1 A g-1) 7
MoS2@C/RGOExfoliation /
Solution Process
A robust 3D bulky
1189 (200) ( 0.2 A g-1) 8
References1. S. J. Li, H. H. Tang, P. Ge, F. Jiang, J. H. Zhou, C. Y. Zhang, H. S. Hou, W. Sun and X. B. Ji,
ACS Appl. Mater. Interfaces, 2018, 10, 6378-6389.2. J. Xiao, D. Choi, L. Cosimbescu, P. Koech, J. Liu and J. P. Lemmon, Chem. Mater., 2010, 22,
4522-4524. 3. C. Q. Feng, J. Ma, H. Li, R. Zeng, Z. P. Guo and H. K. Liu, Mater. Res. Bull., 2009, 44, 1811-
1815.4. H. Liu, D. W. Su, R. F. Zhou, B. Sun, G. X. Wang and S. Z. Qiao, Adv. Energy Mater., 2012,
2, 970-975.5. T. Yang, Y. J. Chen, B. H. Qu, L. Mei, D. N. Lei, H. N. Zhang, Q. H. Li and T. H. Wang,
Electrochim. Acta, 2014, 115, 165-169.6. M. Wang, G. D. Li, H. Y. Xu, Y. T. Qian and J. Yang, ACS Appl. Mater. Interfaces, 2013, 5,
1003-1008.7. H. Y. Wang, B. Y. Wang, D. Wang, L. Lu, J. G. Wang and Q. C. Jiang, RSC Adv., 2015, 5,
58084-58090.8. S. C. Li, P. Liu, X. B. Huang, Y. G. Tang and H. Y. Wang, J. Mater. Chem. A, 2019, 7,
10988-10997.
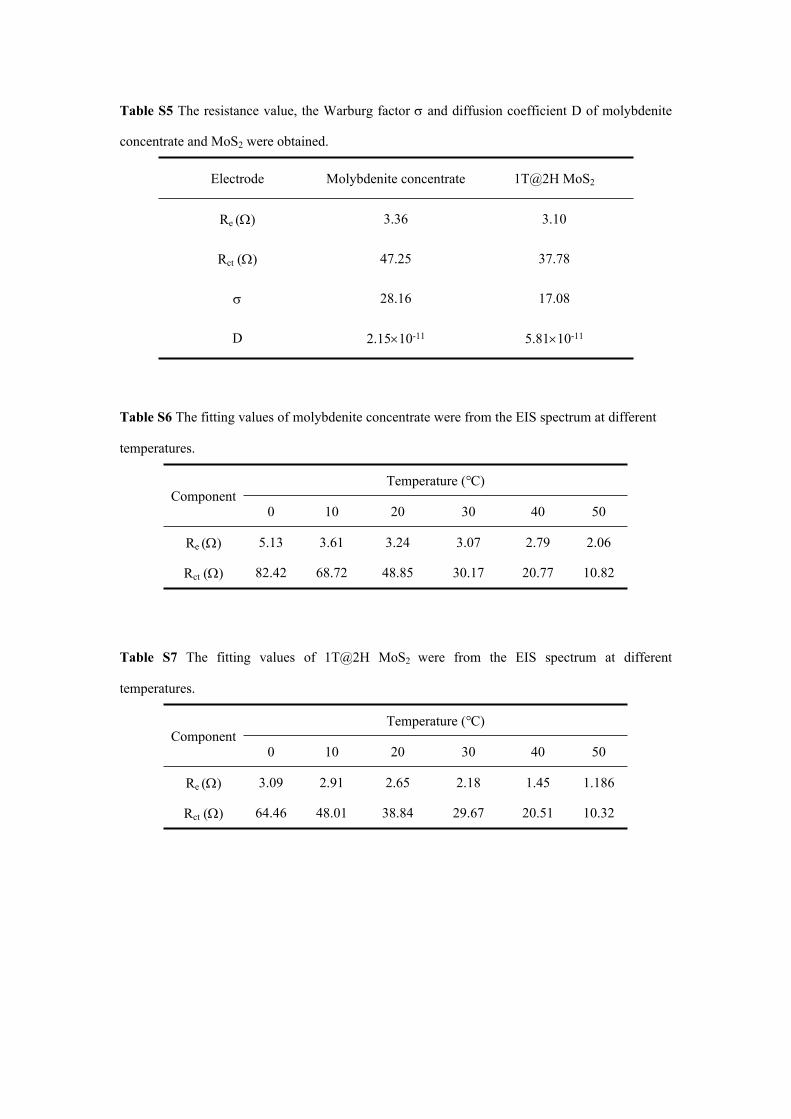
Table S5 The resistance value, the Warburg factor and diffusion coefficient D of molybdenite
concentrate and MoS2 were obtained.
Electrode Molybdenite concentrate 1T@2H MoS2
Re () 3.36 3.10
Rct () 47.25 37.78
28.16 17.08
D 2.1510-11 5.8110-11
Table S6 The fitting values of molybdenite concentrate were from the EIS spectrum at different
temperatures.
Temperature (℃)Component
0 10 20 30 40 50
Re () 5.13 3.61 3.24 3.07 2.79 2.06
Rct () 82.42 68.72 48.85 30.17 20.77 10.82
Table S7 The fitting values of 1T@2H MoS2 were from the EIS spectrum at different
temperatures.
Temperature (℃)Component
0 10 20 30 40 50
Re () 3.09 2.91 2.65 2.18 1.45 1.186
Rct () 64.46 48.01 38.84 29.67 20.51 10.32