Embed Size (px)
Citation preview

Performance evaluation of mobile devices inLong Term Evolution (LTE) during handover
James Guerra – 301006524Shams S Narsinh – 301277255
Team 2ENSC 833 NETWORK PROTOCOLS AND PERFORMANCE
SPRING 2016

PAGE 1
Table of ContentsList of Figures.................................................................................................................................................2
List of Tables ..................................................................................................................................................3
List of Acronyms:.......................................................................................................................................... 4
1 Abstract ........................................................................................................................................................5
2 Introduction................................................................................................................................................5
3 Background .................................................................................................................................................5
3.1 LTE NETWORK ................................................................................................................................5
3.2 LTE HANDOVER ............................................................................................................................ 8
3.2.2 Handover decision ........................................................................................................................ 9
4 Experiments .............................................................................................................................................. 10
4.1 MODELER Capabilities ..................................................................................................................... 10
4.1.1 Validation of handover .................................................................................................................. 11
4. 2 SIMULATION SCENARIOS AND RESULTS ................................................................................. 15
4.2.1 Handover Delay Setup ................................................................................................................. 15
4.2.2 Handover Delay Data ................................................................................................................. 16
4.2.3 Throughput and Delay Setup ..................................................................................................... 18
4.2.4 Throughput and Delay Data ...................................................................................................... 19
5 Discussions and Results ...........................................................................................................................25
5.1 HANDOVER DELAY RESULTS ........................................................................................................25
5.2 Througphput and DELAY Results....................................................................................................25
6 Conclusion ................................................................................................................................................27
6.1 FUTURE WORK.................................................................................................................................27
7 References ................................................................................................................................................ 28
Appendix ..................................................................................................................................................... 29
A. Modeler settings ............................................................................................................................ 29
Application settings .............................................................................................................................29
Profile settings......................................................................................................................................29
LTE Configuration ...............................................................................................................................30
eNodeB .................................................................................................................................................. 31
UE.......................................................................................................................................................... 31
HTTP Server .........................................................................................................................................32
B. GRAPHS FOR OTHER RESULTS ......................................................................................................33

PAGE 2
List of FiguresFigure 1: EPC Logical Nodes ....................................................................................................................... 6
Figure 2: User plane protocol stack ............................................................................................................7
Figure 3: Control plane protocol stack .......................................................................................................7
Figure 4: Reproduced from paper .............................................................................................................. 9
Figure 5(a): RSRP and RSRQ value statistics during handover as shown in Modeler 18.5. ................. 12
Figure 6: eNodeB_1 to eNodeB_3 GTP packet forwarded........................................................................ 13
Figure 7: Best Operational Wideband MCS Index ................................................................................... 13
Figure 8: Connection and Re-establishment attempt statistic for a failed handover........................... 14
Figure 9: EPS Bearer Traffic Sent by eNodeB_1 and eNodeB_2 and EPS bearer traffic receiveed bythe UE .......................................................................................................................................................... 14
Figure 10(a): 3-cell Handover Delay Setup................................................................................................ 15
Figure 10 (b): 7-cell Handover Delay Setup .............................................................................................. 15
Figure 10 (c): 19-cell Handover Delay Setup ............................................................................................. 16
Figure 11: Handover Delay with 10 handovers for each scenario ............................................................ 17
Figure 12: Handover delay with fixed 30 minutes of time frame ............................................................ 17
Figure 13: Handover setup with background traffic ................................................................................. 18
Figure 14: Graph of successful handovers ................................................................................................ 20
Figure 15(a): Video traffic with no background traffic............................................................................ 20
Figure 15(b): Video traffic with background voice traffic ........................................................................ 21
Figure 15(c): Video traffic with background video traffic........................................................................ 21
Figure 15(d): Video traffic with background HTTP traffic ...................................................................... 21
Figure 16(a): EPS Bearer Delay for video traffic with no background traffic.........................................22
Figure 16(b): EPS Bearer Delay for video traffic with video background traffic ...................................22
Figure 16(c): EPS Bearer Delay for video traffic with voice background traffic ....................................23
Figure 16(d): EPS Bearer Delay for video traffic with http background traffic .....................................23
Figure 17(a): Traffic received for video traffic with voice background traffic ...................................... 24
Figure 17(b): Traffic received for voice traffic with HTTP background traffic ..................................... 24
Figure 17(c): Traffic received for voice traffic with voice background traffic ........................................25
Figure 18(a): DAR bits and losses for voice traffic with no background traffic .....................................33
Figure 18(b): DAR bits and losses for voice traffic with video background traffic ...............................33

PAGE 3
Figure 18(c): DAR bits and losses for voice traffic with voice background traffic ................................34
Figure 18(d): DAR bits and losses for voice traffic with HTTP background traffic...............................34
Figure 19(a): DAR bits and losses for HTTP traffic with no background traffic ...................................35
Figure 19(b): DAR bits and losses for HTTP traffic with video background traffic ..............................35
Figure 19(c): DAR bits and losses for HTTP traffic with voice background traffic ...............................36
Figure 19(d): DAR bits and losses for HTTP traffic with HTTP background traffic .............................36
Figure 20(a): EPS Bearer Delay for voice traffic with no background traffic ........................................37
Figure 20(b): EPS Bearer Delay for voice traffic with video background traffic ...................................37
Figure 20(c): EPS Bearer Delay for voice traffic with voice background traffic ....................................38
Figure 20(d): EPS Bearer Delay for voice traffic with HTTP background traffic ..................................38
Figure 21(a): EPS Bearer Delay for HTTP traffic with no background traffic ....................................... 39
Figure 21(b): EPS Bearer Delay for HTTP traffic with video background traffic.................................. 39
Figure 21(c): EPS Bearer Delay for HTTP traffic with voice background traffic................................... 40
Figure 21(d): EPS Bearer Delay for HTTP traffic with HTTP background traffic ................................. 40
List of Tables
Table 1: Application Profiles with specifications ....................................................................................... 11
Table 2: Physical Layer Parameters ............................................................................................................ 11
Table 3: Attributes of Simulations ............................................................................................................. 12
Table 4: Application Settings for Riverbed Modeler 18.5 ....................................................................... 29
Table 5: Profile settings for Riverbed Modeler 18.5..................................................................................30
Table 6: Configurations specific to LTE in Riverbed Modeler 18.5.........................................................30
Table 7: Configurations for eNB in Riverbed Modeler 18.5 ..................................................................... 31
Table 8: Configurations for UE in Riverbed Modeler 18.5 .......................................................................32
Table 9: Specifications for HTTP applications in Riverbed Modeler 18.5 ..............................................32

PAGE 4
List of Acronyms3GPP 3rd Generation Partnership Project
DAR Delay and Retransmitted
eNB (eNodeB) Enhanced node B (Base Station)
EPC Evolved Packet Core
E-UTRAN Evolved Universal Terrestrial Radio Access
HO Handover (Handoff)
HSDPA High Speed Downlink Packet Access
HSS Home Subscriber Server
L1 Physical Layer – Layer 1
L3 Network Layer – Layer 3
LTE Long Term Evolution
MCS Modulation Coding Scheme
OFDMA Orthogonal Frequency Division Multiple Access
PDCP Packet Data Convergence Protocol
PDN Packet Data Network
PGW Packet Data Network Gateway
RLC Radio Link Control Protocol
RSRP Reference Signal Received Power
RSRQ Reference Signal Received Quality
SC – FDMA Single Carrier – Frequency Division Multiple Access
SGW Serving Gateway
UE User Equipment
QPSK Quadrature Phase Shift Keying
QAM Quadrature Amplitude Modulation
VoLTE Voice over LTE
X2 Interface connecting tw0 eNBs
PAGE 5
1 AbstractHandover performance is crucial for modern mobile communications networks, particularly in LTE(Long Term Evolution) because of the tremendous growth of data intensive applications amongstmobile devices. The factors that can affect this handover performance are the type of interface inwhich the handover exists, either X2 or S1 interface; the mobility of the UE and the QCI (Quality ofService Class Identifiers). This project looks at the handover delay time and information loss (e.g.EPS bearer bit loss) in the eNodeB (eNB) – UE and the packet delay (EPS bearer delay) between theeNodeB and UE during handover. Three different applications, namely, Video conferencing, HTTPweb TV and VoLTE (Voice LTE), running on a mobile UE were evaluated with a background traffic.Our results show handover delay increases with an increasing cell count in the network and theaggregate handover delay time increases for higher speeds. The EPS bearer throughput in terms oflosses and “delay and retransmitted bits” is better with using the X2 interface enabled than justwith the S1 interface. The bearer delay on the other hand is affected by the scheduling and load ofthe background traffic than type of interface the handover is happening on.
2 IntroductionModern mobile communications use the LTE technology because of its high data rates and thepromise of fulfilling the internet of things (IoT) implementation. LTE allows for a packet switchmobile network with interactions between people-to-people (P2P), people-to-machine (P2M) andmachine-to-machine (M2M) [5]. It is therefore imperative that the handover experienced by end-users, or user equipment (UEs), be minimized so that certain QoS parameters will be met. Thereare several factors and scenarios that can affect the handover experienced by UEs. This projecthowever, will only focus on evaluating the intra-frequency handover on the X2 and S1 interfacegiven the mobility of the target UE and the background QoS of other UEs. We intend to evaluateperformance by measuring the handover delay when the UE transitions amongst eNodeBs and theloss of information as data transits from EPC to UE.
LTE handover is a fairly well researched area. In [2], the performance evaluation for intra-frequencyhandover for TCP and UDP in terms of throughput in Mbps and downlink delay is evaluated whilevarying the physical layer parameters that influences the handover performance using the A3trigger mechanism. In [7], stochastic analysis of real world devices (smartphones) wherein thehandover interruption time was measured and broken down into further smaller components wasdone. In [5], proposed downlink scheduling algorithms that Qos-aware and/or Channel-aware werepresented and analyzed. The simulations however doesn’t include a handover scenario. In [4], a“handover preparation” algorithm was proposed where multiple handover messages are sent to theUE for a quicker handover.
3 Background
3.1 LTE NETWORK
The term LTE comes from the evolution of UMTS (universal mobile telecommunication system)through Evolved UTRAN (E-UTRAN), although the non-radio component also evolved which is
PAGE 6
now known as the system architecture evolution (SAE). LTE and SAE together forms the evolvedpacket core (EPS). [1]
3.1.1 Evolved packet core (EPC)
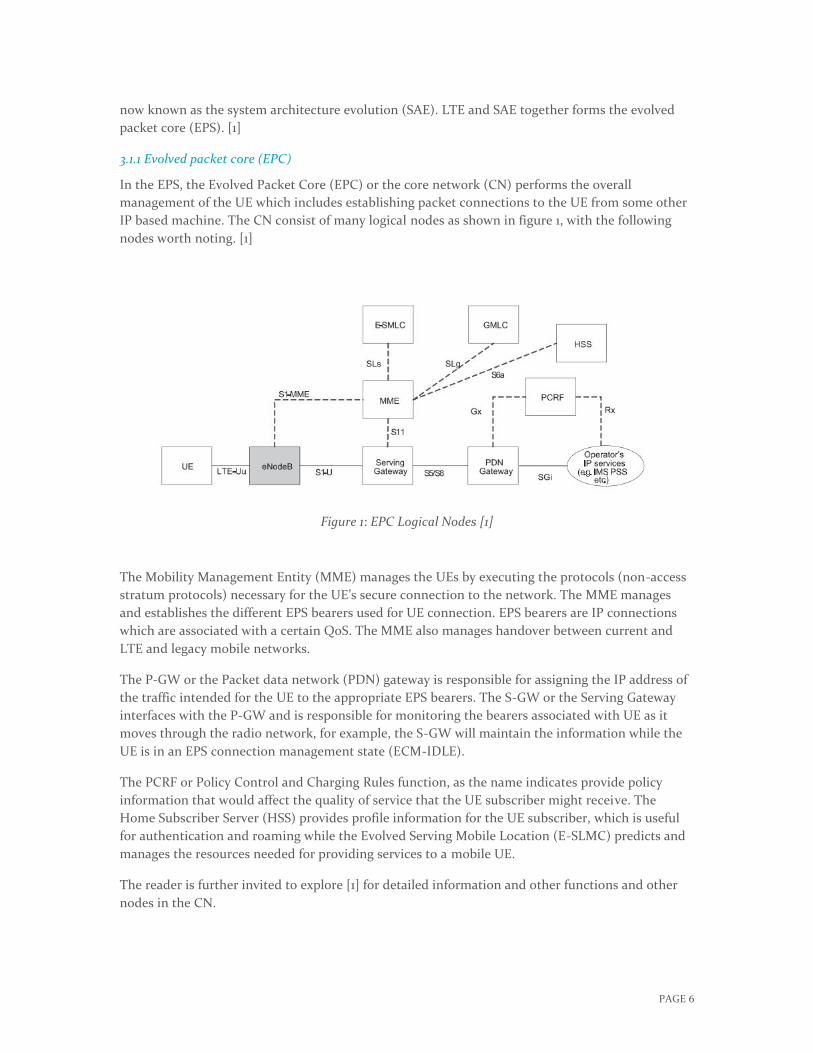
In the EPS, the Evolved Packet Core (EPC) or the core network (CN) performs the overallmanagement of the UE which includes establishing packet connections to the UE from some otherIP based machine. The CN consist of many logical nodes as shown in figure 1, with the followingnodes worth noting. [1]
Figure 1: EPC Logical Nodes [1]
The Mobility Management Entity (MME) manages the UEs by executing the protocols (non-accessstratum protocols) necessary for the UE’s secure connection to the network. The MME managesand establishes the different EPS bearers used for UE connection. EPS bearers are IP connectionswhich are associated with a certain QoS. The MME also manages handover between current andLTE and legacy mobile networks.
The P-GW or the Packet data network (PDN) gateway is responsible for assigning the IP address ofthe traffic intended for the UE to the appropriate EPS bearers. The S-GW or the Serving Gatewayinterfaces with the P-GW and is responsible for monitoring the bearers associated with UE as itmoves through the radio network, for example, the S-GW will maintain the information while theUE is in an EPS connection management state (ECM-IDLE).
The PCRF or Policy Control and Charging Rules function, as the name indicates provide policyinformation that would affect the quality of service that the UE subscriber might receive. TheHome Subscriber Server (HSS) provides profile information for the UE subscriber, which is usefulfor authentication and roaming while the Evolved Serving Mobile Location (E-SLMC) predicts andmanages the resources needed for providing services to a mobile UE.
The reader is further invited to explore [1] for detailed information and other functions and othernodes in the CN.

PAGE 7
3.1.2 E-UTRAN
eNodeBs and UEs comprise the access network for LTE. The access stratum protocols provide theradio related management procedures in the E-UTRAN. The eNodeBs can be linked together usingthe X2 interface while eNodeBs are also connected to the MME by S1 interface. Finally, the eNodeBinterfaces with the UE via LTE – Uu [1].
3.1.3 EPS Network
The EPS interfaces in general can be classified as per function; the user plane and the control planeprotocols. The user plane protocol stack defines the mapping of an IP packet from the P-GW to theUE via tunneling protocols, such as the GTP (GPRS Tunneling protocol). The control plane definesthe management of UEs which includes radio bearer management. [1] The following figure showsthe two protocol stack with their acronyms expanded.
Figure 2: User plane protocol stack – Reproduced from “LTE - The UMTS Long Term Evolution” [1]
Figure 3: Control plane protocol stack - Reproduced from “LTE - The UMTS Long Term Evolution” [1]

PAGE 8
An IP packet is associated with an EPS bearer which has to cross multiple interfaces. The S5/S8interface between P-GW and S-GW; the S1-U interface between the S-GW and eNodeB, and theLTE-Uu interface between the eNodeB and UE. An IP packet is mapped to an S5/S8 bearer with aone-to-one mapping to an S1 bearer which can be identified by the GTP tunnel ID. Finally, theradio bearer traverses the packet through the LTE-Uu interface.
In the uplink direction, packet filtering is used using Traffic Flow Templates (UL-TFTs) whichclassifies the IP packet according to its IP header which includes the source and destinationaddresses (IP) and ports (e.g. TCP), and maps them to the appropriate headers based on theapplications’ QoS. A similar method (DL-TFT) is employed by the P-GW at the downlink direction[1].
In the physical layer, the downlink radio in the eNodeB uses Orthogonal Frequency DivisionMultiple Access (OFDMA) while the uplink radio provided by the UE uses Single-CarrierOrthogonal Frequency Division Multiple Access (SC-FDMA). The bandwidth used can be from 1.4MHz to 20 MHz with a bit rate of up to 90 Mbps for using the 20 MHz bandwidth. The MCS orModulation Coding Scheme is the modulation scheme used in the physical layer. The modulationcode spans from QPSK (quadrature amplitude phase shift keying) to 16-QAM (quadratureamplitude modulation) and up to 64-QAM modulation type [1].
3.2 LTE HANDOVER
There are two methods of handover based on protocol interface, they are the S1 handover and X2handover. The X2 handover is present if there is an X2 interface connection between two eNodeBs.For both cases, the steps for handover can be divided into three phases: the preparation phase,execution phase and completion phase [5].
3.2.1 X2 and S1 handover
In the preparation phase, measurement reports from the UE will trigger the source eNodeB toinitiate a handover procedure by sending a handover request from the source eNodeB to the targeteNodeB. The request is acknowledged by the target eNB and the execution phase begins with HO(handover command) sent to the UE by the source eNB. On the execution phase, link interruptionhappens and data packets are forwarded to the target eNB while simultaneously having the UEestablish its radio connection to the target eNB. Completion phase starts when the handoverconfirmation message is received by the target eNB [5]. The target eNB informs the MME that theUE has changed cells; the MME asks for a user plane update request from S-GW; the S-GWconfirms the new downlink path to the target eNB and halts the transmission packets to the sourceeNB; then the MME confirms a successful handover to the target eNB. A detailed handover diagramis shown on the next figure.

PAGE 9
Figure 4: Detailed Handover Phases and the A3 trigger mechanism for the handover - Reproducedfrom “Measurement and stochastic modeling of handover delay and interruption time of smartphone
real-time applications on LTE networks” [7]
The difference with the S1 handover with the X2 handover is that a source MME would initiate aRELOCATION REQUEST to the target MME while the target eNB also helps in identifying itself tothe target MME. The completion phase will include the forward relocation completion completedas the target eNodeB notifies the target MME of the handover completion [1], [7].
3.2.2 Handover decision
For an LTE intra-frequency handover, handover can be triggered using different events, one ofwhich is the A3 event wherein the RRSP or Reference Received Signal Power of the source eNB islower than that of the target eNB. In [2], the A3-offset is varied showing that the handover willtrigger when the RSRP + A3 offset power is lower on the source eNB, i.e. A3-offset is 2dB. Tominimize the Ping-Pong problem and to increase throughput (see [2]), we used an A3-offset of 2dBin our simulations. The time to trigger (TTT), is the time required for the event to trigger thehandover after the criteria is met.
Aside from the RSRP, the Reference Signal Received Quality metric can be used in determiningwhich eNodeB the UE would handoff too. RSRQ is a metric in determining the quality of the signalused by the UE for a particular eNodeB [1].

PAGE 10
4 Experiments
4.1 MODELER CAPABILITIES
Most of the information described in this section is from [8]. We recommend the reader to consultthe modeler documentation for the LTE model, for detailed description described in this model.
Modeler 18.5 has an LTE module which can be deployed rapidly using the Wireless NetworkDeployment Tool. The LTE module supports the different EPS bearer definitions with theassociated GBR (guaranteed bit rate) and Non-GBR applications. The model also supports GTPtunneling between the eNodeB and the EPC by padding an IP/UDP/GTP header on a typical IPpacket. Downlink and uplink traffic flow templates (TFTs) are supported and the mapping betweenTFT → EPS bearer based on the ToS available. In the LTE configuration node, bitrates of each GBRbearers can be defined as well as the scheduling mechanism supported by the specific bearer. Thescheduling mechanism supported are dynamic and semi-persistent scheduling. In semi-persistentscheduling, there is a periodic downlink radio frames allocated for small packet transmissionswhich can be used in VoIP traffic.
Channel dependent scheduling is enabled by default in the UE. That is, depending on the targetlink quality (channel quality), an appropriate modulation and coding scheme would be selected.The modulation and coding scheme is the “chipping” code used on the channel for orthogonalfrequency division modulation access (OFDMA).
Modeler has an eNodeB model, a UE model which can be a workstation or cellphone and an EPC orevolved packet core. The eNodeB model contains the access stratum protocols that will service theradio link between the UE and eNodeB. The EPC node contains the MME, P-GW and S-GW, inother words, it has the non-access stratum protocols for the “higher layer” of LTE.
The LTE model supports intra frequency handover on the S1 interface and X2 interface and UEreporting for RSRP parameter. The X2 handover happens if the X2 capability is enabled in eNodeBand UE. It supports 5 different trigger mechanisms for handover, but for this project, we choose theA3 mechanism, where at a certain lower offset of RSRP parameter, handover will be triggered. Themodel however considers the RSRQ value and the weighted values of the RSRP and RSRQparameters are considered as the selection criteria for the target eNodeB. The model also supportshandover failures or “incomplete handover”. One such failure is when the UE loses connection tothe serving eNodeB before it receives a handover command message. In this case, connection re-establishment procedure will be followed so that the UE would be connected to new eNodeB.
The parameters useful for our analysis includes the LTE handover delay and the throughput (EPSbearer throughput) in terms losses or delayed and retransmitted bits. The EPS bearer delay will beconsidered in tandem with EPS bearer throughput. The idea for measuring delayed andretransmitted bits came from [6]. Finally, the LTE handover delay mechanism is conveniently givenby the tool.

PAGE 11
4.1.1 Validation of handover
The following table summarizes our setup for the applications we used for the simulations.
Traffic Bearer Description
Voice 2 (Gold) PCM Quality Speech 64 kb/s (G.711). Semi-persistentscheduling enabled in Gold bearer [4], [5]
VideoConferencing
3 (Silver) Live streaming video, CBR traffic: packet arrival 20ms(50 packets /s) with a target bit rate of 312 kb/s; DSCP =AF41 [5]
HTTP 6 (Bronze) HTTP web TV; Best effort ToS(0); Radio link control isset for “acknowledge mode”
HTTP Background 6 (Bronze) HTTP heavy browsing with page arrival time 1s; Besteffort ToS(0); Radio link control is set for “acknowledgemode”
Table 1: Application Profiles with specifications
For Voice traffic, we used PCM Quality Speech as specified in [4] and the VoIP of choice in paper[5]. For the Video traffic, we chose live streaming video which is a constant bit rate of 312 kb/s withdifferentiated service code point AF41 which emphasizes throughput and low drop probability. Forthe HTTP traffic, we chose HTTP web TV just so we have a continuous traffic being sent to thedownlink of the LTE protocol stack. We’ve also enabled an ARQ protocol in the radio link control(RLC) layer of the LTE-Uu interface.
The following table summarizes the physical layer aspects considered in our simulations.
Physical layer parameters Value
Channel bandwidth 20MHz
Uplink antenna model Uplink SC-FDMA
Downlink antenna model Downlink OFDMA
Pathloss Free space
Scheduling Link adaptation and channeldependent scheduling
Table 2: Physical Layer Parameters
We chose a channel bandwidth of 20 MHz to maximize the throughput (up to 90 Mbps on thedownlink) that we can use on the radio layer. This ensures that our throughput is not limited byour bandwidth. We chose a pathloss of free-space to avoid physical layer aspects that can limit ourthroughput, but we have no choice but to use the uplink and downlink antenna model. Channeldependent scheduling is also enabled.
The following table summarizes the setup used for our simulations.

PAGE 12
Simulation Setup Values
Speed of the UE 30,60,120
Number of cells 3-cell, 7-cell, 19-cell
Background traffic Video, Voice, HTTP
Interfaces for handover S1, X2
Table 3: Attributes of Simulations
In order to verify that handover is happening, some statistics can be observed in modeler 18.5
There RSRP and RSRQ parameters provide the trigger for the handover. The following figuresshows RSRP and RSRQ measured as reported by the UE to the eNodeB.
Figure 5(a): RSRP value goes lower than -90dB our trigger point for RSRP, while Figure 5(b) shows thehandover trigger point when RSRQ goes below -5dB.
GTP packet forwarding is implemented when the X2 interface is enabled between 2 eNodeBs. Forour model, we enabled X2 capability in the eNodeB models and also added point to pointconnection between the eNodeBs. This simulates a fiber channel type connection between eNodeBso that the GTP packet will not be routed back to the EPC. This kind of X2 interface is known as a“fast X2” type. The figure below shows GTP packet being forwarded from eNodeB_1 → eNodeB_3during handover.

PAGE 13
Figure 6: eNodeB_1 to eNodeB_3 GTP packet forwarded
Channel dependent scheduling is confirmed by the changing modulation and coding schemeduring handover as shown below. The figure shows how the modulation coding scheme changesfor two different runs. For simulation run 1, the modulation and coding scheme (see blue line)degrades more slowly than the red line. Note that the coding scheme of 0-9 means the UE is usingQPSK, at 10-16 the UE is using 16-QAM, and the rest, the UE is using 64-QAM. This means thebitrate supported by the radio layer is lower for a longer period of time in the 1st simulation (blueline) compared to the other run (redline, run simulation 2).
Figure 7: Best Operational Wideband MCB Index
In some cases, we encountered an RRC connection and re-establishment failure. This is the casewhere there is a handover failure. To confirm this, one can check the connection and re-establishment attempt statistics.

PAGE 14
Figure 8: Connection and Re-establishment attempt statistic for a failed handover
The statistic EPS bearer traffic sent (bits/s) is the input to the entire LTE-Uu interface. In an idealcase, the EPS bearer traffic sent by the eNodeB should match the EPS bearer traffic received inbits/s at the UE. However during handover, it is expected that the EPS bearer traffic received woulddecrease signifying a loss. After the handover, there will bits would be retransmitted or delayed inorder to recover from the loss information during handover causing the EPS bearer traffic receivedvalue to be higher than the EPS bearer traffic sent.
Figure 9: EPS bearer traffic sent (blue line) by eNodeB_1 decreases to 0 as EPS bearer traffic sent byeNodeB_3 increases (red line) during the handover point. EPS bearer traffic received by the UE (green
line) drops to near 0 bits/s at the handover point

PAGE 15
4. 2 SIMULATION SCENARIOS AND RESULTS
4.2.1 Handover Delay Setup
To evaluate the performance in terms of handover delay, three different network topologies wereconsidered with different numbers of eNodeBs in each topologies. The first topologies contained 3eNodeBs creating 3 cells for 1 UE to move around. The purpose of this simple topology was to verifythe working conditions and parameters. Next we considered two standard topologies which havebeen utilized by many researchers in various papers, e.g. see paper [4]. We created topologies with7 eNodeBs and 19 eNodeBs creating 7 cell and 19 cell topologies respectively allowing to move 1 UEamong these cells. Below are the snapshots of topologies:
Figure 10(a): 3-cell Handover Delay Setup
Figure 10 (b): 7-cell Handover Delay Setup

PAGE 16
Figure 10 (c): 19-cell Handover Delay Setup
We have used three applications namely Voice, Video Conference, HTTP Web TV for evaluation ofHandover Delay with four different speeds 3, 30, 60, and 120 km/h. As we are dealing withapplications like Voice and Video Conferencing which happens between 2 UEs, we have alsoincluded another stationary UE in one the cells in out topology. For HTTP Web TV, HTTP server isconnected with the Evolved Packet Core (EPC) in order to communicate with UE. White lines inthe topology show the trajectory of the UE in the simulation.
There are two simulation scenarios considered for this experiment:
(1) For each of the three applications considered, 1o handovers are performed for each of thethree speeds (30, 60, and 120) considered over both S1 and X2 interfaces of handover on 3cell topology.
(2) Fixed 30 minutes of simulation is performed for Voice over LTE (VoLTE) with fourdifferent speeds (3, 30, 60, and 120) on all three topologies (3 cell, 7 cell, and 19 cell).
4.2.2 Handover Delay Data
The following graphs are based on the data obtained from the above mentioned scenarios:

PAGE 17
Figure 11: Handover Delay with 10 handovers for each scenario
The chart above shows the average value of 10 handovers for each application and for each speedover 3 cell topology. During the simulation we found some peaks in the handover delay which werequite larger than other values of same simulation. Overall, we see that the value of handover delayfor X2 interface is lower than that of S1 interface.
The following chart shows the data for the second scenario where we observed that the handoverdelay increases with increasing the number of cells connected to Evolved Packet Core (EPC). It isdue to the increased interferences from the neighboring cells that surround the cell wherehandover is taking place. For 3-cell topology the interference is less as it is only surrounded by oneother cell, while 7 cell and 19 cell shows much higher interference due to larger number ofneighboring cells. We also observed the similar result in this scenario in terms of interfaces that X2interface shows less handover delay than S1 interface for all cells with all different speedsconsidered.
Figure 12: Handover delay with fixed 30 minutes of time frame
0.01
94
0.01
73
0.02
31
0.02
29
0.01
68
0.01
94 0.02
69
0.01
9
0.02
27
0.01
92
0.01
81
0.01
7
0.02
32
0.01
91
0.02
29
0.01
7
0.01
65
0.01
6
1 2 0 6 0 3 0 1 2 0 6 0 3 0 1 2 0 6 0 3 0 1 2 0 6 0 3 0 1 2 0 6 0 3 0 1 2 0 6 0 3 0
S 1 X 2 S 1 X 2 S 1 X 2
V O I C E V I D E O H T T PW E B T V
HA
ND
OV
ER D
ELA
Y (S
EC)
SPEED (KM/H)
HANDOVER DELAY WITH 10HANDOVERS FOR EACH SCENARIO
00.20.40.60.8
11.21.4
120 60 30 3
120 60 30 3
120 60 30 3
120 60 30 3
120 60 30 3
120 60 30 3
3cell 7cell 19cell 3cell 7cell 19cell
S1 X2
Han
dove
r D
elay
(sec
)
Speed (km/h)
Handover Delay with 30 minutesTime Frame

PAGE 18
4.2.3 Throughput and Delay Setup
To evaluate throughput and delay, one UE will be considered as the moving UE between 2eNodeBs. There will be 1 UE for each eNodeB that will serve as the source of the background traffic.In the interest of time and to minimize the physical layer aspects that might affect the handover,we are only considering a single trajectory and single speed as shown in the next figure. The speedis 30 km/hr.
Figure 13: Handover setup with background traffic
For the throughput and delay measurements, the EPS bearer throughput statistic and EPS bearerdelay is considered. The eNodeB provides the EPS bearer sent statistic in bits/s, while the UEprovides and EPS bearer throughput received statistic in bits /s. There will be loses if there are EPSbearer sent > EPS bearer received. On the opposite case, one can assume that there have beenretransmissions or delayed bits received if EPS bearer sent < EPS bearer received. The followingformulae are considered in calculating the % in terms of losses or “delay and retransmitted” (DAR)bits.
If output > input, (EPS bearer received bits/s by the UE > EPS bearer sent bits /s by the eNodeB),then the extra bits received by the UE are either delayed or retransmitted bits,

PAGE 19
If input < output, (EPS bearer received in bits/s by the UE is less than the EPS bearer sent in bits/sby the eNodeB), then there are losses,
The subtraction to 1 will provide a negative value for the loss.
While it is tempting to look at other statistics such as MOS statistics for VoIP, or the number ofpages/objects received by the HTTP client, we settle on the traffic received in bytes/sec statisticswhich are used only to explain some exceptional behavior observed in EPS bearer throughput anddelay statistics.
We also considered the variability that happens in the model so it is not sufficient to just run onesimulation. We ran 10 simulations for each setup by varying the start time offset of the applicationfrom 40s t0 50s, in increments of 1 sec. This blew up our data to be post-processed, considering weare looking at 3 types of applications, 3 types of background traffic, 3 types of statistics and 10simulation runs! We also ensured that the simulations would guarantee a data point every 50ms,for a 9-minute simulation run time. This is our limitation considering our hard disk capacity for theLinux terminal. 19-cell simulation run with multiple sources of traffic is definitely out of the plan,although we tried.
4.2.4 Throughput and Delay Data
The following graph shows the breakdown of how many successful handovers occurred vs howmany failed. The failed handover is because of UE executing the “connection reestablishmentprocedure”. There are also simulation failures (“errors”) in some runs observed when thebackground is HTTP. For our analysis we will only consider the results obtained from successfulhandover data points.
02468
1012
S1 X2 S1 X2 S1 X2 S1 X2 S1 X2 S1 X2 S1 X2 S1 X2 S1 X2 S1 X2 S1 X2 S1 X2
None Voice Video HTTP None Voice Video HTTP None Voice Video HTTP
Voice Video HTTP
Cou
nt
( | Background 1| Background 2 | Background 3 ) / Application
Successful Handover Graph
No. of Successful handover No. of failed handover No. of simulation errors

PAGE 20
Figure 14: Graph of successful handovers
Note that even with just the same speed and trajectory, there are instances where handover failureoccurs.
4.2.4.1 DAR bits and bit loss
Handover happens within 340 – 340.25 ms 80% of the time. We refer to this time as the “handoverinterval” in our analysis section.
The following graphs shows the % “delayed-and-retransmitted” (DAR) bits and Losses for eachapplication given a background traffic. Again for every positive value, we can consider them asdelayed and retransmitted bits, while for every negative value, we can consider the graph as bitloss. Note that each data point in the graph is the average of 10 or less simulation runs (because ofprevious data filtering mentioned). Below are the graphs for Video traffic. The rest of the graphs areshown in Appendix B.
Figure 15(a): Video traffic with no background traffic
-100.00%-80.00%-60.00%-40.00%-20.00%
0.00%20.00%40.00%60.00%80.00%
100.00%
302.5 303 303.5 304 304.5 305 305.5DA
R bi
ts a
nd L
osse
s %
Time (sec)
Video with No Background Traffic
Video EPS bearer througput S1 interface
Video EPS bearer througput X2 interface
-100.00%-80.00%-60.00%-40.00%-20.00%
0.00%20.00%40.00%60.00%80.00%
100.00%
302.5 303 303.5 304 304.5 305 305.5DA
R bi
ts a
nd L
osse
s
Time (sec)
Video with Background Voice Traffic
Video EPS bearer througput S1 interface
Video EPS bearer througput X2 interface

PAGE 21
Figure 15(b): Video traffic with background voice traffic
Figure 15(c): Video traffic with background video traffic
Figure 15(d): Video traffic with background HTTP traffic
4.2.4.2 EPS bearer delay
The following graphs shows the EPS bearer delay for a given type of traffic with a given backgroundtraffic. The size of the dots in the graphs corresponds to the number of samples the data was takenfrom. The biggest circle means the data point is an average from 10 simulations while the smallest
-100.00%-80.00%-60.00%-40.00%-20.00%
0.00%20.00%40.00%60.00%80.00%
100.00%
302.5 303 303.5 304 304.5 305 305.5
DA
R bi
ts a
nd L
osse
s %
Time (sec)
Video with Background Video Traffic
Video EPS bearer througput S1 interface
Video EPS bearer througput X2 interface
-100.00%-80.00%-60.00%-40.00%-20.00%
0.00%20.00%40.00%60.00%80.00%
100.00%
302.5 303 303.5 304 304.5 305 305.5
DA
R bi
ts a
nd L
osse
s %
Time (sec)
Video with Background HTTP Traffic
Video EPS bearer througput S1 interface
Video EPS bearer througput X2 interface

PAGE 22
circles is to a minimum of data obtained from 1 simulation run, hence less significant in terms ofour analysis. Again, we are only showing the Video traffic – EPS bearer delay graphs here, the rest isin Appendix B.
Figure 16(a): EPS Bearer Delay for video traffic with no background traffic
Figure 16(b): EPS Bearer Delay for video traffic with video background traffic
00.005
0.010.0150.02
0.0250.03
0.0350.04
0.0450.05
302.5 303 303.5 304 304.5 305 305.5
EPS
Bear
er D
elay
(se
c)
Time (sec)
Video with No Background Traffic
Video EPS bearer delay S1 interface Video EPS bearer delay X2 interface
00.005
0.010.0150.02
0.0250.03
0.0350.04
0.0450.05
302.5 303 303.5 304 304.5 305 305.5
EPS
Bear
er D
elay
(se
c)
Time (sec)
Video with Background Video Traffic
Video EPS berer delay S1 interface Video EPS bearer delay X2 interface

PAGE 23
Figure 16(c): EPS Bearer Delay for video traffic with voice background traffic
Figure 16(d): EPS Bearer Delay for video traffic with http background traffic
4.2.4.3 Other Metrics
As a part of our analysis, we also graphed a selected Traffic received (bytes/s) statistics for someapplications. This is the traffic received by the UE’s application after all the encapsulation from theLTE protocol stack has been removed. The following selected traffic received graphs are shownbelow.
00.005
0.010.0150.02
0.0250.03
0.0350.04
0.045
302.5 303 303.5 304 304.5 305 305.5
EPS
Bear
er D
leay
(se
c)
Time (sec)
Video with Background Voice Traffic
Video EPS berer delay S1 interface Video EPS bearer delay X2 interface
00.005
0.010.0150.02
0.0250.03
0.0350.04
0.0450.05
302.5 303 303.5 304 304.5 305 305.5
EPS
Bear
er D
elay
(se
c)
Time (sec)
Video with Background HTTP Traffic
Video EPS berer delay S1 interface Video EPS bearer delay X2 interface

PAGE 24
Figure 17(a): Traffic received for video traffic with voice background traffic
Figure 17(b): Traffic received for voice traffic with HTTP background traffic
0
20000
40000
60000
80000
100000
120000
140000
302.5 303 303.5 304 304.5 305 305.5Traf
fic R
ecei
ved
(byt
es/s
ec)
Time (sec)
Video with Background Voice Traffic
Video traffic received S1 interface Video traffic received X2 interface
0
2000
4000
6000
8000
10000
12000
302.5 303 303.5 304 304.5 305 305.5
Traf
fic R
ecei
ved
(byt
es/s
)
Time (sec)
Voice with Background HTTP
Voice traffic received S1 interface Voice traffic receivedt X2 interface

PAGE 25
Figure 17(c): Traffic received for voice traffic with voice background traffic
5 Discussions and Results
5.1 HANDOVER DELAY RESULTS
The handover delay is higher when using S1 interface for handover procedure (transmitting thecontrol information via Evolved Packet Core) as compared to X2 interface. X2 interface shows lowerhandover delay due to the presence of direct link connecting two eNBs resulting in lesstransmission overhead.
As we go on increasing the number of cells in the topology, the interference from the neighboringcells increases on the handover procedure between the source and the target eNB, resulting inoverall higher handover delay. Also as farther the handover takes place from the center of the cell,higher is the handover delay.
5.2 THROUGPHPUT AND DELAY RESULTS
The voice throughput in X2 interface with the exception of case where there is a background HTTP,is strikingly similar near the handover interval 304 – 304.25 sec, and even for the whole 304 – 305sec interval. This is expected as the Voice has the highest level of QoS and has semi-persistentscheduling. The case where there is background HTTP we would argue is exceptional since there
0
2000
4000
6000
8000
10000
12000
302.5 303 303.5 304 304.5 305 305.5
Traf
fic r
ecei
ved
(byt
es/s
)
Time (sec)
Voice with Background Voice Traffic
Voice traffic received S1 interface Voice traffic receivedt X2 interface

PAGE 26
are only 3 available data points for that case, so one should be careful to draw any conclusions. Ifwe take a look at the actual traffic received in bytes/s for “Voice with background HTTP”, we cansee that the X2 interface has a higher traffic received in bytes/s during the handover interval, i.e.50% more than the S1 interface equivalent. This signifies that having the X2 interface is still betterthan just having the S1 interface.
The traffic that affected voice the most in the handover interval, is shown with S1 interface data,where the voice traffic has up to 80% loss in its EPS bearer throughput. There are only 4 data pointsincluded on this simulation however, but the general trend is still displayed where hugethroughput degradation are incurred during the handover interval as evidently shown in the “Voicewith Background Voice Traffic” – Traffic Received (bytes/s) graph.
When it comes to the EPS bearer delay, there is an obvious pattern that for a semi-persistentscheduled bearer, the decreasing quality of the channel contributes to a higher delay as bit ratedecreases. After the handover, the bearer delay is almost minimal, (i.e. less than 0.2 s), as the UEfinally established connection to the target eNodeB. Another peculiar data point is voice withbackground HTTP and voice with background voice on the S1 interface. We would argue that therearen’t enough data points to justify almost no bearer delay for the case where there is backgroundHTTP and that the bearer delay for the S1 interface is less than that of the x2 interface. Overall, interms of handover delay, there is no significant difference between handover on X2 and S1 interfaceand up to 500 ms after the handover interval, despite having the X2 interface buffer the data to thetarget eNodeB.
The video throughput in the X2 interface in the handover interval is within +20% and -20%regardless of any background traffic. Again this points to the consistency of the traffic when itcomes to having the X2 interface available during handover. The background traffic that affectedvideo the most is the video traffic in the handover interval for the S1 interface. There was a loss ofclose to 60% during that handover delay interval. This is a similar result with the voice traffic,where the voice is affected by another background voice traffic. Two peculiar data points howeveris at point 340.200 and 340.250 s of the voice with background voice traffic scenario at X2 interface.These data points shows lower performance compared to S1 interface case, however, looking at ourraw data, all the handover points happened in exactly 304s for the X2 interface case. This suggeststhat with the X2 interface, after the handover, there are actually no losses or retransmissionsdespite a good throughput of 15k-60k bytes/sec received by the UE (see Video with backgroundVoice traffic - Traffic received (bytes/s) statistic for X2 interface).
The video EPS bearer delay shows an increase in bearer delay as background traffic was added.Without a background traffic, or with minimal background traffic such as voice, the video EPSbearer delay with the x2 interface seam to stay within 0.015s during 304-304.750 s (which includesthe handover interval). The S1 interface shows higher bearer delays within 304-304.75 sec intervalcompared to X2 interface for background traffic None, Voice and Video. With HTTP backgroundtraffic however, the S1 interface seam to perform better for the Video EPS bearer delay. Our theoryfor this behavior is that HTTP traffic is bursty and higher loads in the background contributes toEPS bearer delay as both video and http are dynamically scheduled. This leads us to an observationthat scheduling and background load affects the bearer delay more despite the buffering capabilityof the X2 interface handover.
HTTP traffic stay well within +20% to -20% interval during the considered handover interval of304-304.25 s, regardless of the interface and the background traffic. Looking at our raw data, HTTP

PAGE 27
traffic is very bursty that the variance in activity is high on or 500 ms after the handover occurred.We also note that unlike the Voice and Video traffic, the HTTP traffic varies with each simulationrun despite the same exact conditions applied to it, hence it is hard to make conclusions with ourlimited 10-point data sample. The background traffic that affected HTTP the most however is HTTPtraffic as well. This solidifies our observation that the same type of traffic affect each other moreduring handover. In terms of the EPS bearer delay, there are higher delays observed during thehandover interval and 500ms later, when the background traffic is both HTTP and video, which areboth dynamically scheduled.
6 ConclusionThe handover delay increases with increasing the number of eNBs in the topology due to theinterference from the neighboring cell. Obviously for a given fixed time, the UE would experiencemore handover at faster speeds, thus degrading the performance of the application. Overall, wehave shown that performance during handover is better when the X2 interface is enabled in termsof the EPS bearer throughput and handover delay. Each type of traffic affects the same traffic themost during the handover interval of 340-340.250 s. However, the bearer delay is dependent moreon scheduling and the load of the background traffic than the interface that the handover is takenplace on. Initially we were expecting that buffering on the X2 interface would help in the delay,however, this is not the case.
6.1 FUTURE WORK
As an immediate improvement to our work, better aligning of the data points with the anchorpoint as the handover, would provide better results for analyzing general trend in the data.
The throughput captured is based on estimates that delay and retransmitted bits are counted asone statistic. It would be better to separate this two by identifying the packets that areretransmitted or delayed. Higher samples and better stochastic analysis can help in describing thedata obtained specially for bursty traffic like HTTP. We could also have added more backgroundtraffic or expand the cell count in order provide a more realistic evidence for the EPS bearerthroughput and delay results.

PAGE 28
7 References
[1] S. Sesia and I. Toufik, LTE - The UMTS Long Term Evolution, 2nd ed. West Sussex, UnitedKingdom: Wiley, 2011
[2] L. Zhang, T. Okamawari, T. Fujii, "Performance evaluation of TCP and UDP during LTEhandover," in Proc. 2012 IEEE Wireless Communications And Networking Conference, Shanghai,China, April 2012, pp. 1993-1997.
[3] A. Vizzarri, "Analysis of VoLTE end-to-end Quality of Service using OPNET," in Proc. 2014UKSim-AMSS 8th European Modelling Symposium, Pisa, Italy, Oct. 2014, pp. 452-457.
[4] H. S. Park and Y. S. Choi, "Taking Advantage of Multiple Handover Preparations to ImproveHandover Performance in LTE Networks," Future Generation Communication and Networking(FGCN), 2014 8th International Conference on, Haikou, 2014, pp. 9-12.
[5] S. Trabelsi, A. Belghith and F. Zarai, "Performance evaluation of a decoupled-level Qos-awaredownlink scheduling algorithm for LTE networks," in Proc. 2015 IEEE International Conference onData Science and Data Intensive Systems, Sydney, Australia, Dec. 2015, pp. 696-704
[6] F. Amirkhan, O. Arafat and M.A. Gregory, “Reduced packet loss vertical handover between LTEand mobile WiMAX,” in Proc. 2014 2014 International Conference on Electrical, Electronics andSystem Engineering, Kuala Lumpur, Malaysia, Dec. 2014, pp. 24-59
[7] D. Han, S. Shin, H. Cho, J. m. Chung, D. Ok and I. Hwang, "Measurement and stochasticmodeling of handover delay and interruption time of smartphone real-time applications on LTEnetworks," in IEEE Communications Magazine, vol. 53, no. 3, pp. 173-181, March 2015.
[8] Modeler Documentation Set, 18.5, Riverbed Technology, San Francisco, CA, 2015, Chapter 12.

PAGE 29
Appendix
A. MODELER SETTINGS
The following tables shows the modeler setting used during the simulation.
Application settings
Application Definitions
Name HTTP video
Description Web TV
ToS Best Effort
Name VoLTE / Voice Background
Description PCM Quality speech
Encoder scheme G.711
ToS Interactive Voice
Silence Length (s) 0.65
Talk spurt Length (s) 0.35
Name Video / Video Background
Description Video Conferencing
Frame Interarrival Time Information (s)
(Incoming/Outgoing stream)
0.020
Frame Size Information (bytes) 781
ToS AF41
Name HTTP Background
Description HTTP heavy browsing
Page interarrival Time (s) Exponential (1)
ToS Best Effort (0)
Table 4: Application Settings for Riverbed Modeler 18.5
Profile settings
Profile Configuration
Profile Name HTTP Profile / Voice Profile / Video Profile
Application
Name Http Video/ Video / VoLTE
Start Time Offset (s) Constant(40)

PAGE 30
Duration (s) End of Profile
Repeatability (default)
Operation mode Simultaneous
Start Time (s) Promoted
Duration End of Simulation
Profile Name HTTP Background Profile / Video BackgroundProfile / Voice Background Profile
Application
Name HTTP Background / Video Background / VoiceBackground
Start time Offset (s) None
Repeatability (default)
Start Time (s) Constant(0)
Duration End of Simulation
Table 5: Profile settings for Riverbed Modeler 18.5
LTE Configuration
EPS bearer definitions
Name Gold
QoS Class Identifier 1 (GBR)
Allocation Retention Priority 1
Scheduling mechanism Semi-persistent
Name Silver
QoS Class Identifier 4 (GBR)
Allocation Retention Priority 4
Scheduling mechanism dynamic
Name Silver
QoS Class Identifier 6 (Non-GBR)
Allocation Retention Priority 5
Scheduling Mechanism dynamic
Table 6: Configurations specific to LTE in Riverbed Modeler 18.5

PAGE 31
eNodeB
LTE
PHY
PHY Profile LTE 20MHz FDD
Pathloss Free space
Handover parameters
Measurement report triggers
Event A3 Enabled
Report interval 240ms
RSRP Offset (dB) 2
RSRP Hysteresis (dB) 1
RSRQ Offset (dB) 0
Handover triggers
RSRP threshold (dB) -90
RSRQ threshold (dB) -5
Semi-Persistent Scheduling Default
Scheduling Mode Link Adaptation and Channel Dependentscheduling
Uplink power control parameters
MCS compensation Enabled
X2 Capability Enabled / Disabled (for S1 handover)
Table 7: Configurations for eNBs in Riverbed Modeler 18.5
UE
Trajectory 3, 30, 60 or 120 km/hr for handover UE,
None for stationary UE or Backround UE
LTE
PHY
Multipath Channel Model (downlink) LTE OFDMA ITU Vehicular B
Multipath Channel Model (uplink) LTE SCFDMA ITU Vehicular B
Pathloss parameters
Pathloss Model Free space
EPS Bearer Configuration
Bearer Name Bronze/ Silver /Gold
TFT Packet filters

PAGE 32
Match Property ToS
Radio Bearer RLC configuration
Direction Uplink
Mode Unacknowledged / Acknowledged (for HTTP)
Direction Downlink
Mode Unacknowledged / Acknowledged (for HTTP)
Handover parameters (same as eNodeB above)
Application
Application: Destination preference HTTP
Application HTTP Video / Video / VoLTE / VoiceBackground / Video Background / HTTPBackground
Actual Name
Name Campus network.Wireless subnet.Mobile_node_0 / 1 / 2 / 3 or Node_0
Application supported profile Http profile / VoLTE Profile / Video Profile /Voice background / Video Background / HTTPBackground
Table 8: Configurations for UE in Riverbed Modeler 18.5
HTTP Server
Application
Application : Destination Preference
Application HTTP Video / HTTP Background
Symbolic name HTTP Server
Actual Name
Name Campus network.Wireless subnet.Mobile_node_0 / 2 / 3
Application supported profile Http profile / HTTP Background
Table 9: Specifications for HTTP applications in Riverbed Modeler 18.5

PAGE 33
B. GRAPHS FOR OTHER RESULTS
Other results for DAR bits and losses:
Figure 18(a): DAR bits and losses for voice traffic with no background traffic
Figure 18(b): DAR bits and losses for voice traffic with video background traffic
-100.00%-80.00%-60.00%-40.00%-20.00%
0.00%20.00%40.00%60.00%80.00%
100.00%
302.5 303 303.5 304 304.5 305 305.5
DA
R bi
ts a
nd L
osse
s %
Time (sec)
Voice with No Background Traffic
Voice EPS trhoughput S1 interface
Voice EPS bearer throughput X2 interface
-100.00%-80.00%-60.00%-40.00%-20.00%
0.00%20.00%40.00%60.00%80.00%
100.00%
302.5 303 303.5 304 304.5 305 305.5DA
R bi
ts a
nd L
osse
s %
Time (sec)
Voice with Background Video Traffic
Voice EPS bearer throughput S1 interface
Voice EPS bearer throughput X2 interface

PAGE 34
Figure 18(c): DAR bits and losses for voice traffic with voice background traffic
Figure 18(d): DAR bits and losses for voice traffic with HTTP background traffic
-100.00%-80.00%-60.00%-40.00%-20.00%
0.00%20.00%40.00%60.00%80.00%
100.00%
302.5 303 303.5 304 304.5 305 305.5
DA
R bi
ts a
nd L
osse
s %
Time (sec)
Voice with Background Voice Traffic
Voice EPS throughput S1 interface Voice EPS throughput X2 interface
-100.00%-80.00%-60.00%-40.00%-20.00%
0.00%20.00%40.00%60.00%80.00%
100.00%
302.5 303 303.5 304 304.5 305 305.5
DA
R bi
ts a
nd L
osse
s %
Time (sec)
Voice with Background HTTP Traffic
Voice EPS bearer throughput S1 interface
Voice EPS bearer throughput X2 interface

PAGE 35
Figure 19(a): DAR bits and losses for HTTP traffic with no background traffic
Figure 19(b): DAR bits and losses for HTTP traffic with video background traffic
-100.00%-80.00%-60.00%-40.00%-20.00%
0.00%20.00%40.00%60.00%80.00%
100.00%
302.5 303 303.5 304 304.5 305 305.5
DA
R bi
ts a
nd L
osse
s %
Time (sec)
HTTP with no Background Traffic
HTTP EPS bearer throughput S1 interface
HTTP EPS bearer throughput X2 interface
-100.00%-80.00%-60.00%-40.00%-20.00%
0.00%20.00%40.00%60.00%80.00%
100.00%
302.5 303 303.5 304 304.5 305 305.5
DA
R bi
ts a
nd L
osse
s %
Time (sec)
HTTP with Background Video Traffic
HTTP EPS bearer throughput S1 interface
HTTP EPS bearer throughput X2 interface

PAGE 36
Figure 19(c): DAR bits and losses for HTTP traffic with voice background traffic
Figure 19(d): DAR bits and losses for HTTP traffic with HTTP background traffic
-100.00%-80.00%-60.00%-40.00%-20.00%
0.00%20.00%40.00%60.00%80.00%
100.00%
302.5 303 303.5 304 304.5 305 305.5
DA
R bi
ts a
nd L
osse
s %
Time (sec)
HTTP with Background Voice Traffic
HTTP EPS throughput S1 interface HTTP EPS throughput X2 interface
-100.00%-80.00%-60.00%-40.00%-20.00%
0.00%20.00%40.00%60.00%80.00%
100.00%
302.5 303 303.5 304 304.5 305 305.5
DA
R bi
ts a
nd L
osse
s %
Time (sec)
HTTP with Background HTTP Traffic
HTTP EPS bearer throughput S1 interface
HTTP EPS throughput X2 interface

PAGE 37
Other results for EPS Bearer Delay:
Figure 20(a): EPS Bearer Delay for voice traffic with no background traffic
Figure 20(b): EPS Bearer Delay for voice traffic with video background traffic
-0.50
0.51
1.52
2.53
3.54
4.5
302.5 303 303.5 304 304.5 305 305.5
EPS
Bea
rer
Del
ay (
sec)
Time (sec)
Voice with No Background Traffic
Voice EPS bearer delay S1 interface Voice EPS bearer delay X2 interface
-0.5
0
0.5
1
1.5
2
2.5
302.5 303 303.5 304 304.5 305 305.5
EPS
Bear
er D
elay
(se
c)
Time (sec)
Voice with Background Video Traffic
Voice EPS bearer delay S1 interface Voice EPS bearer delay X2 interface

PAGE 38
Figure 20(c): EPS Bearer Delay for voice traffic with voice background traffic
Figure 20(d): EPS Bearer Delay for voice traffic with HTTP background traffic
-0.2
0
0.2
0.4
0.6
0.8
1
1.2
302.5 303 303.5 304 304.5 305 305.5
EPS
Bear
er D
elay
(se
c)
Time (sec)
Voice with Background Voice Traffic
Voice EPS bearer delay S1 interface Voice EPS bearer delay X2 interface
-0.20
0.20.40.60.8
11.21.41.6
302.5 303 303.5 304 304.5 305 305.5
EPS
Bear
er D
elay
(se
c)
Time (sec)
Voice with Background HTTP Traffic
Voice EPS bearer delay S1 interface Voice EPS bearer delay X2 interface

PAGE 39
Figure 21(a): EPS Bearer Delay for HTTP traffic with no background traffic
Figure 21(b): EPS Bearer Delay for HTTP traffic with video background traffic
00.010.020.030.040.050.060.070.08
302.5 303 303.5 304 304.5 305 305.5
EPS
Bear
er D
elay
(se
c)
Time (sec)
HTTP with no Background Traffic
HTTP EPS bearer delay- S1 interface HTTP EPS bearer delay X2 interface
-0.010
0.010.020.030.040.050.060.070.08
302.5 303 303.5 304 304.5 305 305.5
EPS
Bear
er D
elay
(se
c)
Time (sec)
HTTP with Background Video Traffic
HTTP EPS throughput - S1 interface HTTP EPS throughput X2 interface

PAGE 40
Figure 21(c): EPS Bearer Delay for HTTP traffic with voice background traffic
Figure 21(d): EPS Bearer Delay for HTTP traffic with HTTP background traffic
00.010.020.030.040.050.060.070.08
302.5 303 303.5 304 304.5 305 305.5
EPS
Bear
er D
elay
(se
c)
Time (sec)
HTTP with Background Voice Traffic
HTTP EPS bearer delay - S1 interface HTTP EPS bearer delay X2 interface
00.010.020.030.040.050.060.070.08
302.5 303 303.5 304 304.5 305 305.5
EPS
Bear
er D
elay
(se
c)
Time (sec)
HTTP with Background HTTP Traffic
HTTP EPS bearer delay - S1 interface HTTP EPS bearer delay X2 interface