Embed Size (px)
Citation preview

PERFORMANCE EVALUATION OF A PILOT-SCALE PULSE-JET BAGHOUSE FOR OPERATION WITH AIRPOL’S GAS SUSPENSION ABSORPTION PROCESS AT
TVA’S CENTER FOR EMISSIONS RESEARCH
SRI-ENV-93-900-7218.7 EPRI RP3083-10, TASK 5
Prepared for
Ralph F. Altman, Project Manager
Electric Power Research Institute 516 Franklin Building
Chattanooga, TN 37411
Prepared by
Randy Merritt
Southern Research Institute 2000 Ninth Avenue South
Birmingham, AL 35222
June 14,1994

.
Table of Contents
Executive Summary ................................................................................................. 1
Introduction.. ............................................................................................................ 1
Facilities ................................................................................................................... 2
CER Test Facility.. ...................................................................................... 2 GSA Process.. ............................................................................................ 2 Pulse-Jet Baghouse ................................................................................... 2
Test Plan ................................................................................................................. 4
Matrix of Variables.. .................................................................................... 4 Baghouse Configurations.. ......................................................................... 5 GSA Test Identifications ............................................................................. 5
Data Acquisition ....................................................................................................... 7
PJBR Operation History.. ......................................................................................... 7
. Baghouse Operating Periods.. .................................................................... 10
Evaluation Procedures I Results ............................... . .............................................. 10
Tubesheet Pressure Drop ............................................................................ 13 Pulse Cleaning.. ........................................................................................... 23 Temperature Profile ..................................................................................... 24 Particulate Mass Loadings I Collection Efficiency Measurements.. .............. 27 SO, Removal.. ............................................................................................. 32
Conclusions.. ........................................................................................................... 40
Acknowledgments.. .................................................................................................. 41
References .............................................................................................................. 42
Appendix A. Particulate Mass Measurements ....................................................... 43

Executive Summary
Performance evaluation of a pulse-jet baghouse operating with AirPol’s Gas Suspension Absorption (GSA) process was conducted at TVA‘s Center for Emissions Research (CER) facility. The baghouse filtered approximately 5000 acfm of flue gas and was operated in two different configurations: in parallel with the electrostatic precipitator (ESP) at an air-to-cloth of 4.0 acfm/ft2 and in series with the ESP at an air- to-cloth of 12.0 acfm/ft2.
The operation of the baghouse with the GSA process was very successful in both modes of operation. SO2 removal was 3 to 5% higher for the baghouse operating in parallel with the ESP than with the ESP alone. For the baghouse operating in series with the ESP, the SO2 removal was 0 to 2% higher than the ESP alone. The outlet emissions rate through the baghouse was very low for both configurations. Other baghouse performance parameters (tubesheet pressure drop, pulsing frequency, and collection efficiency) were within the preferred range of operation for pulse-jet baghouses.
Introduction
As part of the U.S. Department of Energy’s (DOE) Clean Coal Technology (CCT) program, AirPol built a 10 MWe Gas Suspension Absorption (GSA) demonstration plant at TVA’s CER. AirPol, Inc., located in Teterboro, NJ, is a U.S. subsidiary of the Danish company, FLS miljo a/s. The GSA process is a dry, lime-based flue gas desulfurization (FGD) system that was developed for removing acid gases from the flue gas generated by many industrial processes. The GSA process was expected to remove more than 90% of the sulfur dioxide (S02) from the flue gas, while achieving a relatively high utilization of reagent lime. The testing of the GSA demonstration unit was co-funded by an arrangement with AirPol, TVA, and the DOE. The testing at the CER is the first application of this technology in the U.S. and began in November 1992.
A pulse-jet baghouse system (1 MWe) was supplied by the Electric Power Research Institute (EPRI), as part of a program of evaluating the performance of pulse-jet baghouses on various process systems. EPRI owns four “transportable” 1 MWe pulse- jet baghouses that have been evaluated at nine installations since 1988.
Southern Research Institute (SRI) was sponsored by the EPRI to conducted an evaluation of the pulse-jet baghouse concurrent with an evaluation of the GSA process with an electrostatic precipitator (ESP). The parametric evaluation of the GSA process was conducted from December 1992 through September 1993.
Facilities
CER Test Facility
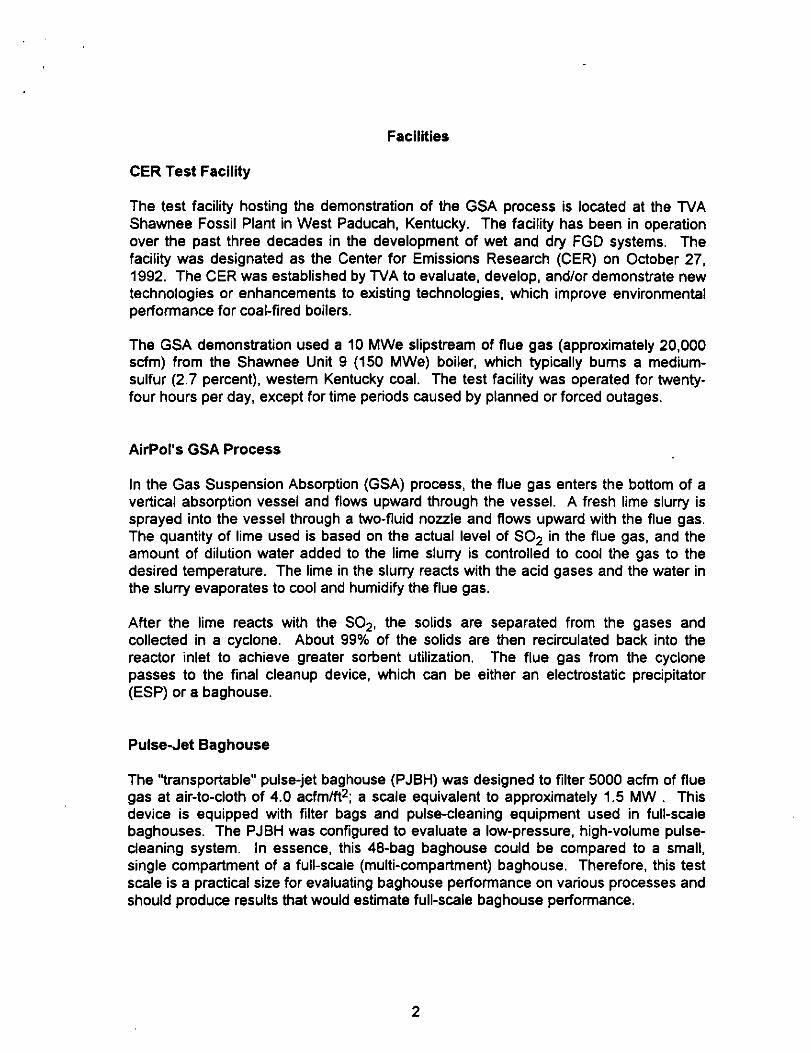
The test facility hosting the demonstration of the GSA process is located at the TVA Shawnee Fossil Plant in West Paducah, Kentucky. The facility has been in operation over the past three decades in the development of wet and dry FGD systems, The facility was designated as the Center for Emissions Research (CER) on October 27, 1992. The CER was established by TVA to evaluate, develop, and/or demonstrate new technologies or enhancements to existing technologies, which improve environmental performance for coal-fired boilers.
The GSA demonstration used a 10 MWe slipstream of flue gas (approximately 20,000 scfm) from the Shawnee Unit 9 (150 MWe) boiler, which typically bums a medium- sulfur (2.7 percent), western Kentucky coal. The test facility was operated for twenty- four hours per day, except for time periods caused by planned or forced outages.
AirPolk GSA Process
In the Gas Suspension Absorption (GSA) process, the flue gas enters the bottom of a vertical absorption vessel and flows upward through the vessel. A fresh lime slurry is sprayed into the vessel through a two-fluid nozzle and flows upward with the flue gas. The quantity of lime used is based on the actual level of SO2 in the flue gas, and the amount of dilution water added to the lime slurry is controlled to cool the gas to the desired temperature. The lime in the slurry reacts with the acid gases and the water in the slurry evaporates to cool and humidify the flue gas.
After the lime reacts with the SO,, the solids are separated from the gases and collected in a cyclone. About 99% of the solids are then recirculated back into the reactor inlet to achieve greater sorbent utilization. The flue gas from the cyclone passes to the final cleanup device, which can be either an electrostatic precipitator (ESP) or a baghouse.
Pulse-Jet Baghouse
The “transportable” pulse-jet baghouse (PJBH) was designed to filter 5000 acfm of flue gas at air-to-cloth of 4.0 acfm/ftz; a scale equivalent to approximately 1.5 MW This device is equipped with filter bags and pulse-cleaning equipment used in full-scale baghouses. The PJBH was configured to evaluate a low-pressure, high-volume pulse- cleaning system. In essence, this 48-bag baghouse could be compared to a small, single compartment of a full-scale (multi-compartment) baghouse. Therefore, this test scale is a practical size for evaluating baghouse performance on various processes and should produce results that would estimate full-scale baghouse performance.
2

Dirty flue gas enters the baghouse through the inlet plenum, which is located near the bottom of the filter bags. The bags are hung from the tubesheet and are attached to the tubesheet with a “snap-in” cuff. The bags are closed at the bottom and open at the top; therefore, the flue gas flows from the outside to the inside of the bags. The particulate matter is collected on the outside of the bags and the clean gas exits through the opening in the top of the bags. Clean flue gas exits the baghouse through the outlet plenum that is located just above the tubesheet.
The 48 bags are arranged in three concentric circles. The bags were fabricated from a homopolymer acrylic fabric. This fabric, specified as Dralon-T, has a temperature limit of 260 OF, and was selected due to the temperatures under evaluation with the GSA process. The bags are oval-shaped in cross section, 20 feet in length and 15.5 inches in circumference, and are supported by standard ICwire carbon steel cages. The cages were treated with a proprietary epoxy coating to prevent corrosion due to the expected low temperature operation.
The flow of flue gas through the PJBH is controlled by a damper that is located in the baghouse outlet duct upstream of a flow measurement orifice meter and the baghouse induced draft (ID) fan. An electronic flow controller monitored and maintained a constant pressure drop across the orifice meter. On-site calibrations were performed to determine the orifice pressure drop sufficient to yield approximately 5000 acfm (4.0 acfm/ftz).
Pulse cleaning is provided by a rotating cleaning manifold, equipped with three nozzles that are aligned with each circle of bags. The manifold is located above the bags in the clean gas outlet plenum and continuously rotates at 1 rpm. Pulse cleaning air is supplied to the manifold from a reservoir that is pressurized to approximately 7 to 9 psi by a dedicated positive displacement blower. The blower is energized prior to each cleaning pulse. The air is discharged from the reservoir into the manifold through a diaphragm valve, and then subsequently injected through the nozzles into the bags. Due to the circular bag arrangement and the rotating manifold, bag cleaning occurs on a somewhat random basis since a pulse nozzle was not always perfectly aligned with a bag. However, on a time-averaged basis, all the bags are cleaned equivalently.
Ash that is removed from the bags during pulse cleaning, or ash material that falls out without reaching the filter bags is collected in an ash hopper, located directly under the bags. The fly ash is continuously discharged through a rotary valve into an ash disposal line. Ash is conveyed through the disposal line by a continuously operating blower motor that discharges the ash to a waste silo.
Pulse cleaning can be performed either on a timed or pressure drop initiated I terminate method. Tubesheet pressure drop, flue gas flow rate, pulse cleaning rate, inlet and outlet temperatures, and various SO2 and O2 values through the system were the major parameters that were continuously monitored and recorded by a computer data acquisition system.
3

SRI wrote an operational manual of the pulse-jet baghouse specific to the CER installation to serve as a reference guide for the facility personnel. SRI conducted training classes to instruct the facility operators on the operation of the baghouse system.
Test Plan
TVA designed a test plan to evaluate the role of various parameters on the removal of sulfur dioxides in the flue gas. These major parameters were evaluated at two or three different levels. The test plan followed a half-factorial design with a full set of replicates, This selection procedure reduced the total number of tests required to evaluate the range of test variables. The replication of tests would possibly identify outlier results and improve the statistical significance of the evaluation. The half- factorial test matrix was essentially performed twice, although there were some alternate tests selected for the second half of the factorial testing. This test plan also allowed the pulse-jet baghouse to operate in a different configuration in each half of the test program.
During the test program, each test condition was typically maintained for a period of 2 to 3 days. At the beginning of each test, a lineout period allowed stable operation to be achieved. After the lineout period, a “test period” for typically one day was designated for which the test data were analyzed.
The first half of the factorial test program was conducted from February 1 through May 27, and the second half of the factorial test program was conducted from May 29 through September 30.
Matrix of Variables
During November and December 1992, a series of tests was conducted to define the practical operating limits of the various test parameters. These tests determined the ranges over which the variables would be evaluated. The major test parameters and the selected ranges are shown in the following table.
Test Parameter Range of Pawneten Calcium to Sulfur Ratio 1.0 1.3 Approach Temperature (“F) 8 18 28 Flue Gas Flow Rate (k”“‘ 44 7n
Fly c ’
\“,,“,
sh Loading (gr/acf) ;oar Chloride Level (%) ?ecycle Screw Speed (t-pm)
97
0.5 0.02 30
6”
2.0 0.12 45
Baghouse Configurations
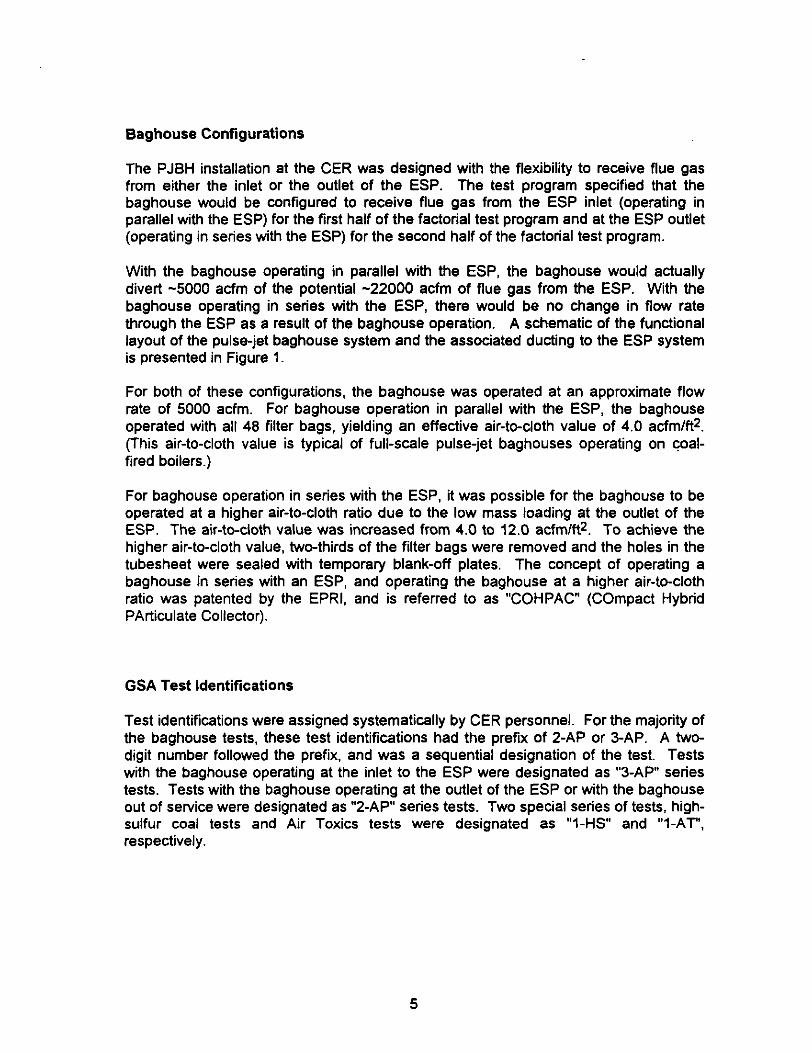
The PJBH installation at the CER was designed with the flexibility to receive flue gas from either the inlet or the outlet of the ESP. The test program specified that the baghouse would be configured to receive flue gas from the ESP inlet (operating in parallel with the ESP) for the first half of the factorial test program and at the ESP outlet (operating in series with the ESP) for the second half of the factorial test program.
With the baghouse operating in parallel with the ESP, the baghouse would actually divert -5000 acfm of the potential -22000 acfm of flue gas from the ESP. With the baghouse operating in series with the ESP, there would be no change in flow rate through the ESP as a result of the baghouse operation. A schematic of the functional layout of the pulse-jet baghouse system and the associated ducting to the ESP system is presented in Figure 1.
For both of these configurations, the baghouse was operated at an approximate flow rate of 5000 acfm. For baghouse operation in parallel with the ESP, the baghouse operated with all 48 filter bags, yielding an effective air-to-cloth value of 4.0 acfm/ftz. (This air-to-cloth value is typical of full-scale pulse-jet baghouses operating on coal- fired boilers.)
For baghouse operation in series with the ESP, it was possible for the baghouse to be operated at a higher air-to-cloth ratio due to the low mass loading at the outlet of the ESP. The air-to-cloth value was increased from 4.0 to 12.0 acfmlftz. To achieve the higher air-to-cloth value, two-thirds of the filter bags were removed and the holes in the tubesheet were sealed with temporary blank-off plates, The concept of operating a baghouse in series with an ESP, and operating the baghouse at a higher air-to-cloth ratio was patented by the EPRI, and is referred to as “COHPAC” (Compact Hybrid PArticulate Collector).
GSA Test Identifications
Test identifications were assigned systematically by CER personnel. For the majority of the baghouse tests, these test identifications had the prefix of 2-AP or 3-AP. A two- digit number followed the prefix, and was a sequential designation of the test. Tests with the baghouse operating at the inlet to the ESP were designated as “3~AP” series tests. Tests with the baghouse operating at the outlet of the ESP or with the baghouse out of service were designated as “2-AP” series tests. Two special series of tests, high- sulfur coal tests and Air Toxics tests were designated as “I-HS” and “I-AT”, respectively.
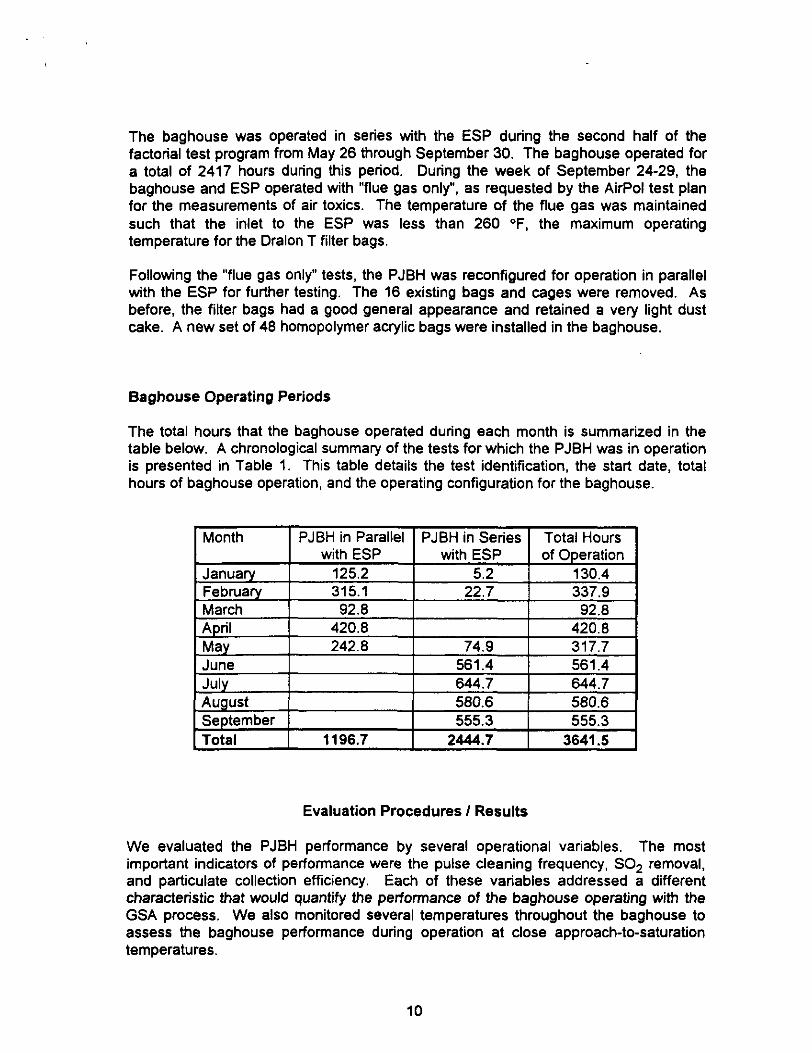
The baghouse was operated in series with the ESP during the second half of the factorial test program from May 26 through September 30. The baghouse operated for a total of 2417 hours during this period. During the week of September 24-29, the baghouse and ESP operated with “flue gas only”, as requested by the AirPol test plan for the measurements of air toxics. The temperature of the flue gas was maintained such that the inlet to the ESP was less than 260 OF, the maximum operating temperature for the Dralon T filter bags.
Following the “flue gas only” tests, the PJBH was reconfigured for operation in parallel with the ESP for further testing. The 16 existing bags and cages were removed. As before, the filter bags had a good general appearance and retained a very light dust cake. A new set of 48 homopolymer acrylic bags were installed in the baghouse.
Baghouse Operating Periods
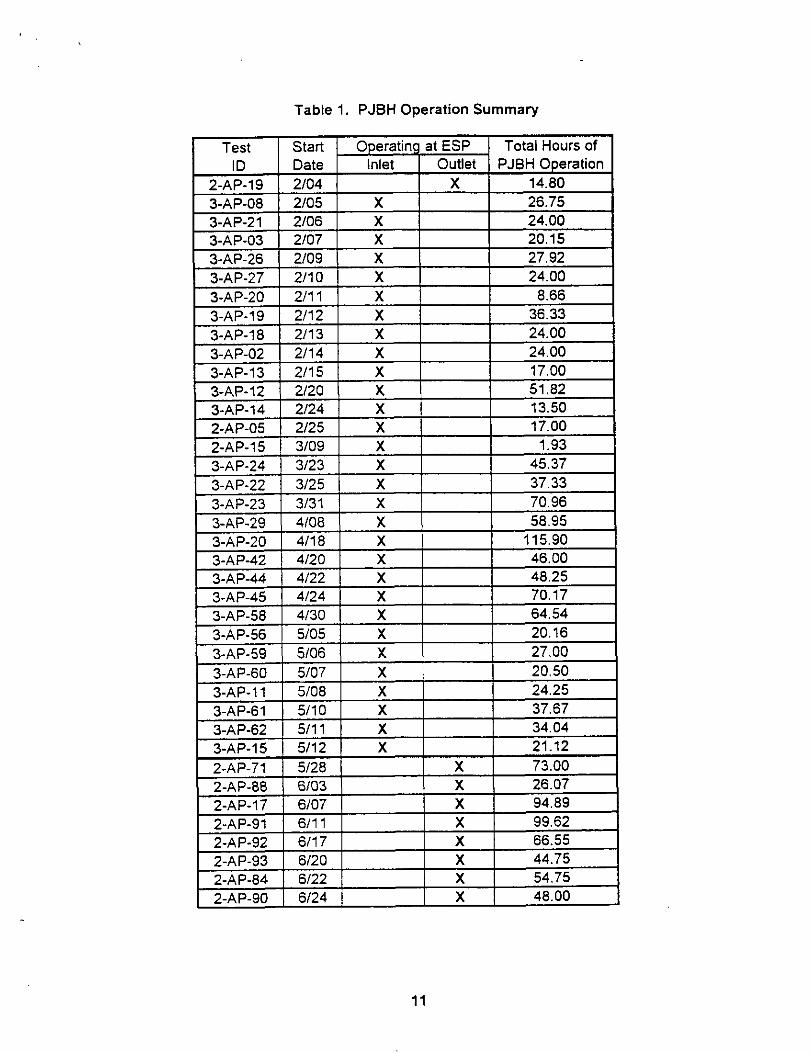
The total hours that the baghouse operated during each month is summarized in the table below. A chronological summary of the tests for which the PJBH was in operation is presented in Table 1. This table details the test identification, the start date, total hours of baghouse operation, and the operating configuration for the baghouse.
Evaluation Procedures I Results
We evaluated the PJBH performance by several operational variables. The most important indicators of performance were the pulse cleaning frequency, SO, removal, and particulate collection efficiency. Each of these variables addressed a different characteristic that would quantify the performance of the baghouse operating with the GSA process, We also monitored several temperatures throughout the baghouse to assess the baghouse performance during operation at close approach-to-saturation temperatures.
10
3-AP-5(
t 3-1
Table 1. PJBH Operation Summary

Table 1 (cont.) PJBH Operation Summary
I Test 1 Start t Ooeratina at ESP 1 T-r-\ Hours of [ Operation
L-,YT-O, 2. 1 L.JO
I I I ” I -,.JO 48.25
I ‘“‘a’ ID Date Inlet Outlet PJBH
-I .+%“.a, 6126 X 54.75 I .AP-94 6/29 X 73 I-
1-t 1-t 1-t
~8.75 I Y 1 52.75
I-HS-07 9105 Ii 46.75 is-08 9107 X 49.00 is-11 9109 X 45.50 is-12 9/l 1 X 31.75
-s .I”
I ,197 I I ” 40.00 2- 50 2-AP-6i 2-AP-?i 2-AP-az I-HS-05 l-HS-09
1-k k 1-t
1-t
12

We determined the average performance for each test condition for a specified test period based on the start and end times as designated by CER personnel. This test period excluded data obtained during the lineout period, during which the GSA and ESP systems were stabilizing.
We reviewed the graphical trends of each test variable during the test period to determine if there were obvious “upset” conditions that would warrant exclusion of data in determining average performance. There were situations, such as, loss of the slurry flow for a short time period, that would be evident from the SOz concentrations and the temperature profiles. Other conditions were more subtle, such as, problems with specific hardware that would produce excessive carryover of materials. These situations would influence the pulse cleaning frequency. The objective of the data review was to determine periods that the GSA / baghouse systems were not operating properly and exclude these data from analyses.
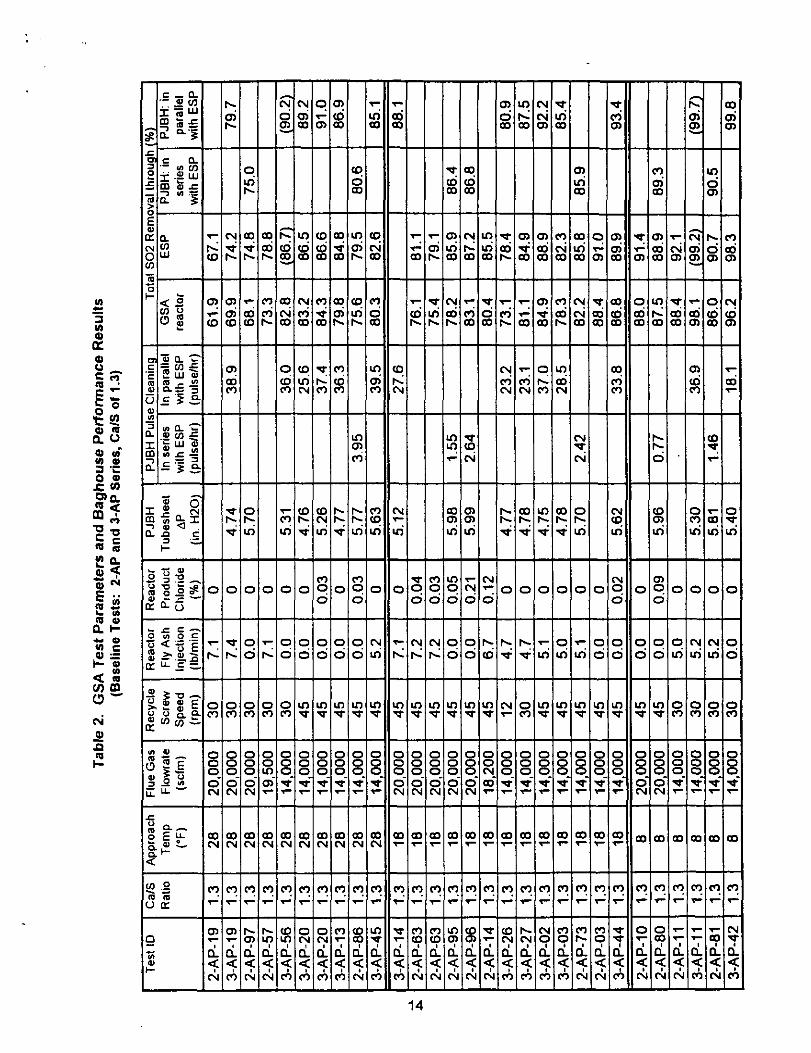
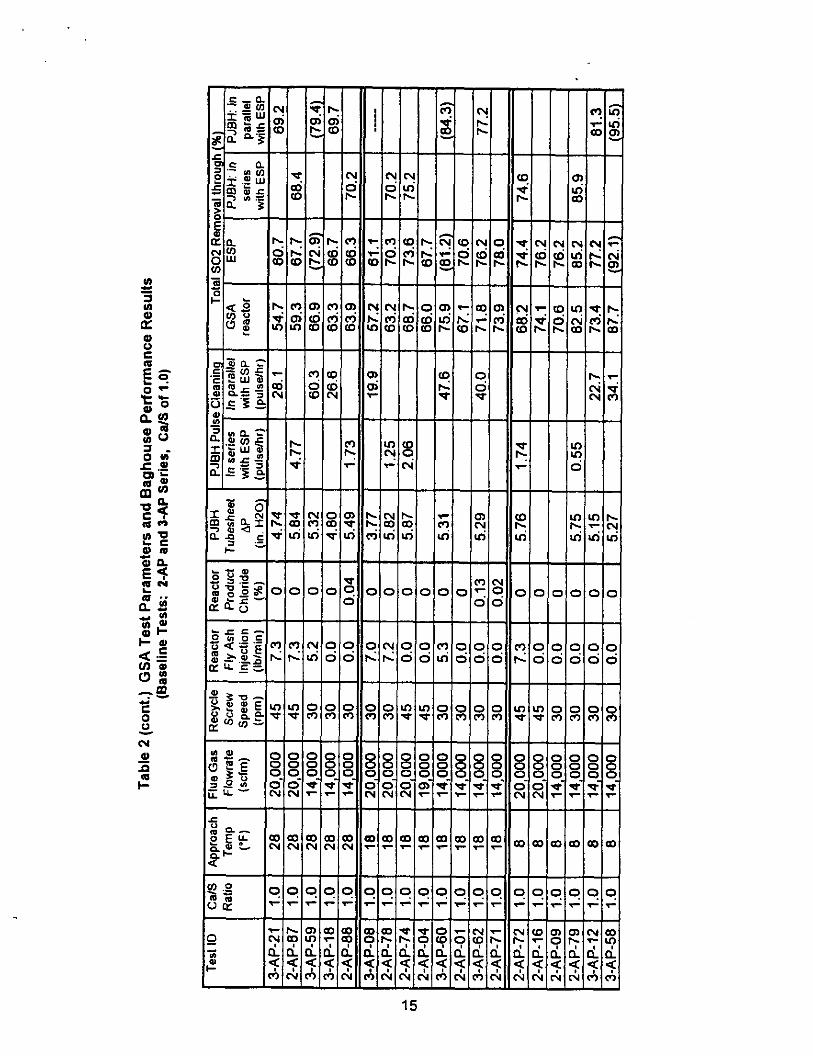
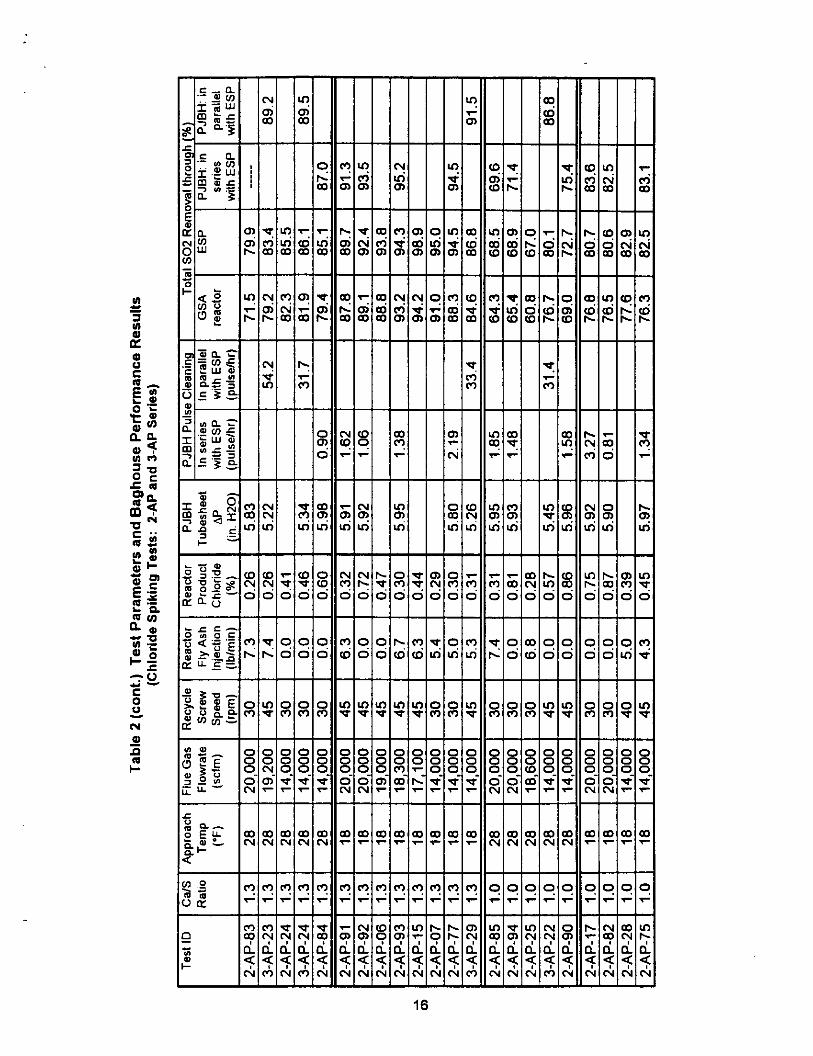
A tabular summary of the test parameters and baghouse performance data is presented in Table 2. This comprehensive summary is arranged by similar test conditions which allows the reader a means to visually compare data with respect to the major test parameters.
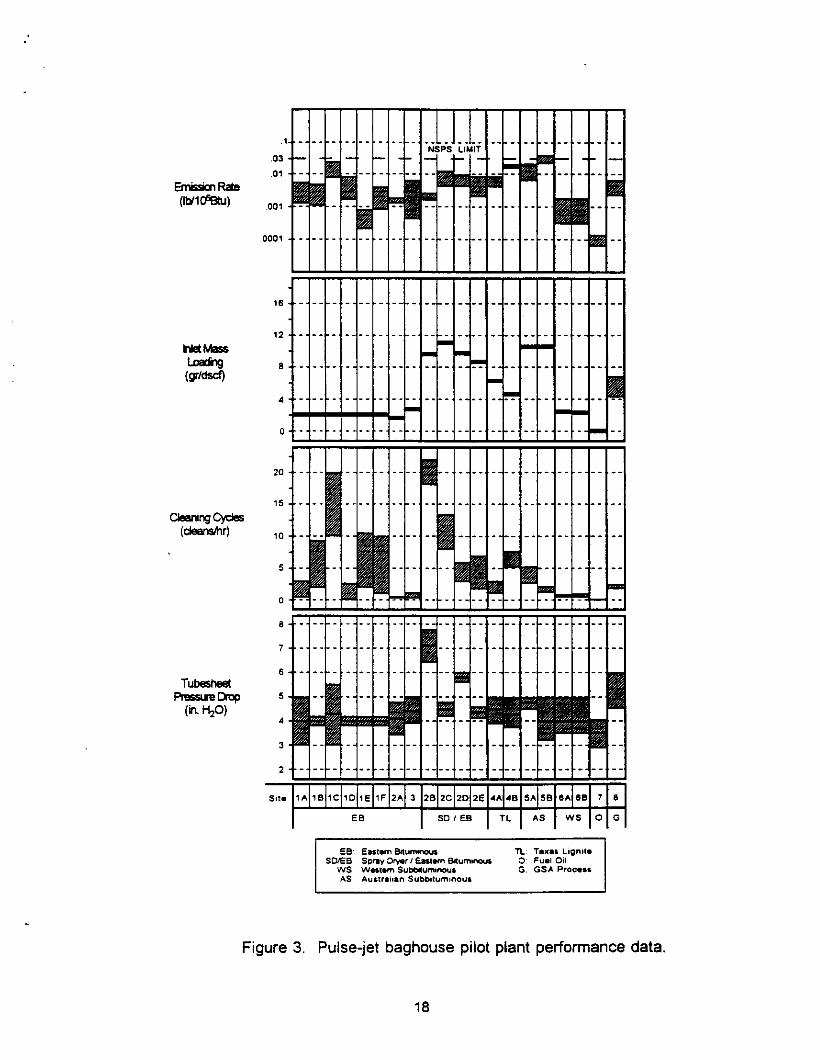
We compared the PJBH operation at the CER to an extensive database of pulse-jet baghouse eva1uations.l Figure 3 presents comparisons of tubesheet pressure drop, pulse cleaning frequency, inlet mass loadings, and emission rates and is referred to in each of the pertinent sections of the report.
We also compared pulse-jet baghouse operation in the COHPAC mode with the GSA process to three other COHPAC operations reported in recent studies by the EPRl.zv3 Although the demonstration of COHPAC at the CER is an application to a novel FGD process, comparison to these other processes provides a base of reference. A summary of these evaluations are presented in Table 3 and graphically in Figure 4.
Tubesheet Pressure Drop
The tubesheet pressure drop was a fixed parameter during the entire test program. The baghouse cleaning system was operated according to a AP-initiate and a AP- terminate mode for which the pressure drop across the fabric was maintained between two discrete pressure values. For example, during initial baghouse operation, pulse cleaning was initiated when the tubesheet pressure drop reached 5.0 in. H,O, and pulsing continued until the pressure drop was reduced to below 4.0 in. H,O.
When the filter bags were new and the PJBH was operating in parallel with the ESP, the tubesheet pressure drop was set between 4.5 and 5.0 in. H,O. We attempted to operate at these settings, but after a couple of months as the fabric became more “seasoned”, we increased these setpoint values to 5.0 and 6.0 in. H20.
13
Iij I I I I I I I I I I II I I I I II I I I I I I II III-
, 1 uI0.L‘ II I I I I I I I
L-l <= !! ! j j ! ! ! !
16

T j i I c T ;: iu - c - P
-7 !$ :; -
c e
-
-
-
s c E
u
cc T-
4
: i
17
:
EB: Entom Bnu- n: T...S Lipml. SMB *DR” DW, I EPum BicYnvlM 0: F”.l Oil
ws WIlrn S”tea”mwau, G. GSA P.m..‘ AS *Y‘ll.il.” S”bbll”m~no”s
Figure 3. Pulse-jet baghouse pilot plant performance data.
18

.
Table 3. Performance Summary of COHPAC Collectors
Locatioti~ Big Brown 1 Marshall 1 Comand Coal / Process L .ipite Cleaning Type’ I Pressure (psi) LP (8-12) Number of Filter Bags 2 Hours of Operation 3
l LP: Low pressure IP: Intermediate pressure
19

Emission Rate
(lb/l O%tu)
Inlet Mass Loading (grldscf)
Cleaning Cycles
(cleanslhr)
Tubesheet Pressure Drop
(in. H20)
Big Brown Marshall Comanche Shawnee
Figure 4. COHPAC Pulse-Jet Baghouse performance data.
20

For baghouse operation in series with the ESP, the tubesheet pressure drop was maintained between 5.0 and 6.0 in. H,O. Due to the increased face velocity through the fabric (12.0 acfm/ft2 instead of 4.0 acfm/ft2), we determined that the minimum tubesheet pressure drop was -4.5 in. H20. This minimum value may have increased slightly for long-term baghouse operation in this configuration.
For both PJBH configuration modes (with the PJBH operating in parallel and series with the ESP), the tubesheet pressure drop was maintained between approximately 4.5 and 6.0 in. H,O. This pressure drop range is considered to be a normal range of operation for pulse-jet baghouses. A summary of the average tubesheet pressure drop values for each test condition is shown in Table 2. Figure 5 presents the history of the average tubesheet pressure drop for each test over the duration of the baghouse operation at the CER.
Comparisons to Reverse-Gas Baghouse
Pulse-jet baghouses can operate at higher air-to-cloth ratios for similar tubesheet pressure drops, compared with conventional (reverse-gas) baghouses, due to the more energetic cleaning method. Historically, reverse-gas baghouses are operated at air-to- cloth ratios around 2.0 acfm/ft2, whereas pulse jet baghouses typically operate at twice this value.” Therefore, at a given tubesheet AP the “drag” for a pulse-jet baghouse is approximately half that of reverse-gas baghouses. (Drag is defined as pressure drop across the fabric divided by the flow rate through the fabric,) In other words, a pulse-jet baghouse would only have to be half the size of a reverse-gas baghouse to filter the same quantity of flue gas at the same tubesheet pressure drop.
Comparisons to other Pulse-Jet Baghouses
For the PJBH operation in parallel with the ESP at the CER (A/C of 4.0 acfm/f@), the baghouse fabric pressure drop was operated between approximately 4.5 and 6.0 in. H20. In reference to Figure 3, the operating tubesheet AP at the CER was near the high end of the range for pulse-jet baghouses. Considering the other relevant factors (low pulse cleaning rate and high inlet mass loading), a higher fabric pressure drop would be expected.
Compatison to other COHPAC Collectors
For the PJBH operation in series with the ESP at the CER (A/C of 12.0 acfm/ftz), the baghouse was operated between approximately 5.0 and 6.0 in. H,O. This was equivalent to the other COHPAC collectors as shown in Figure 4.
21

6.3
6.1
5.9
5.7
5.5
5.3
5.1
4.9
4.7
4.5 2
-!
1119
: a:
. . . . . . . :..;.;.;.;i* ._._. i _.......: . .._..... ._...._.; __...
n . I
9: . . . . . . . . . . . . . . . . ..I . . . . . . . . . j . . . . . . . . . . . . . . . . . . . ..__.
;..I y .._ ;..I, ..~...~.........................~........~........~.........~ 3 3/l/93 4/l/93 Yll93 WI93 711193 aw93 911193 loll/93
Date
Figure 5. Pulse-Jet Baghouse Tubesheet Pressure Drop History, February through October, 1993.
22

Pulse Cleaning
Since the air-to-cloth ratio was held constant and the tubesheet pressure drop was operated between two discrete values, the primary parameter that was used to evaluate the dynamic properties of the filter bags (development of the dustcake and the cleanability of the bag fabric) was the pulse cleaning rate.
A summary of pulse cleaning frequencies for the GSA tests are presented in Table 2. The data are presented in separate columns for the two baghouse operating configurations. A comparison to other pilot plant and full scale performance data for pulse-jet baghouses is shown in Figure 3 and comparison of the PJBH operating in the COHPAC mode is presented in Figure 4.
For PJBH operation in parallel with the ESP, the pulse cleaning frequency increased slightly as the bags became more “seasoned”, although for the majority of tests, the pulse rate was between -30 and 40 pulses per hour. For PJBH operation in series with the ESP, the pulse cleaning rate was between -1 and 5 pulses per hour due to the much lower mass loading at the PJBH inlet, despite the increase in air-to-cloth ratio.
In order to compare different pulse-jet baghouse installations, the way pulses are counted was standardized. The variable “cleaning cycles (cleanslhr)” shown in Figure 3 refers to the effective number of times that each bag was cleaned per hour, An assumption was made that each pulse port of the pulse manifold was cleaning one bag per pulsing period. At the CER, the pulse manifold has three pulse ports. Therefore, with 46 bags installed (for PJBH operation in parallel with the ESP), it would take 16 pulses/hour to equal 1 clean/hour. Therefore, 30 to 40 pulses/hour would be equivalent to 1.9 to 2.5 cleans/hour.
For both configurations of PJBH operation, there was not a strong relationship between pulse cleaning and any particular test parameter. Since the pulse cleaning rate was a truly dependent variable, it incorporated the effects of other independent parameters, There were many factors that could influence the pulsing rate (major test variables as well as baghouse operational factors). The interaction of these different parameters may have obscured the effect of any one parameter on the pulse cleaning rate.
There were relationships that were generally true; such as, the pulsing rates were higher for some of the tests with chloride spiking and typically lower pulsing rates for the tests at the Sdegree appmach-to-saturation temperature. Although there were indications of these trends, additional studies would have to be performed to determine the relationship between pulse cleaning and these various test parameters.
23

Temperature Profile
With the GSA process, system temperatures were controlled to yield temperatures at the reactor outlet at a specific approach-to-saturation temperature (8”, 18”, or 28” F). The actual approach temperature was dependent on various parameters, but was between 125 and 131 “F. Consequently, temperatures at the baghouse inlet ranged from 133 to 159 “F depending on operating conditions.
The baghouse computer system recorded temperatures at the PJBH inlet duct, outlet duct, outlet plenum, and the ash hopper. The temperature of the flue gas measured at the PJBH inlet was generally within 1 to 2 degrees of the gas temperature at the ESP inlet or outlet, depending on the source of the flue gas. The temperature at the ESP outlet was generally 5 “F higher than the ESP inlet due to the electrical input to the ESP plates and the reactions occurring in the ESP. A summary of the temperature history concerning the baghouse operation is presented in Table 4. This table is presented in a chronological order.
Temperature loss across the PJBH ranged from approximately 4 to 15 “F over the duration of the test program. The minimum temperature loss across the baghouse was 4 to 5 OF. therefore larger temperature losses indicated potential sources of inleakages. After the inleakage sources were identified and eliminated, the temperature loss would be reduced. Generally, the increase in the oxygen content from the PJBH inlet to outlet was 0.4 to 1 .O %.
During tests in which the GSA was operating at an 8 OF approach-to-saturation temperature, the temperature at the PJBH outlet was near or below the saturation temperature. The baghouse generally performed at a lower pulsing frequency at these conditions. During a particular test at an 8 “F approach-to-saturation temperature, an inspection found that the surface of the bag exterior exhibited signs of being close to saturation, although no tubesheet AP or bag pulsing problems were documented. There were a few problems with the conveyance of ash through the baghouse hopper at the low operating temperatures, although we think these problem could be successfully resolved with more effective hopper heaters and hopper vibrators.
The only other observation with respect to baghouse temperature was made when the bags were removed to prepare for the PJBH operation at the ESP outlet, At the top 12 to 18 inches of each bag (directly under the tubesheet). there were crusty, nodular formations which were approximately l/4- to l/2-inch in diameter. The nodules decreased in size and virtually disappeared at the bottom of the 12- to 18-inch section. The nodular formations were suspected to have been caused by the bags being exposed to the “cool” pulse air during cleaning. This phenomena has been documented at other pilot-scale pulse-jet installations for which the pulse air is injected at near ambient temperatures.
24

Table 4. PJBH Temperature Profile (PJBH Operating in Parallel with ESP)
(All data in “F)
25
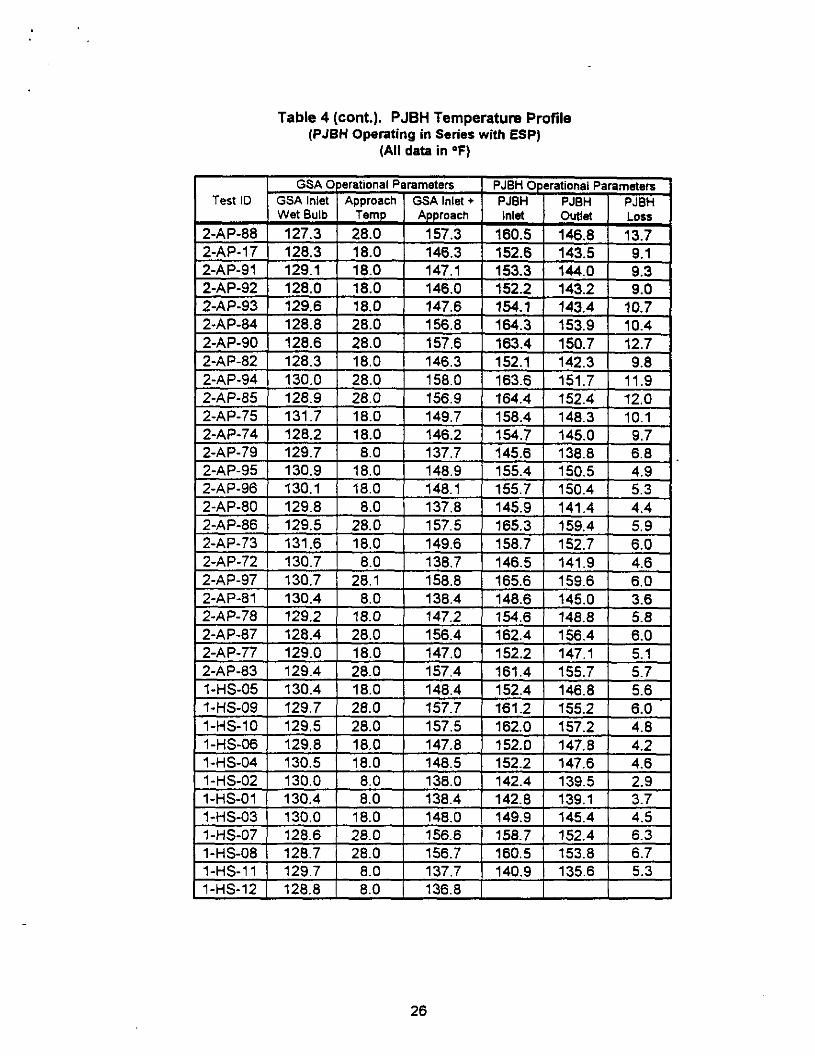
Table 4 (cont.). PJBH Temperature Profile (PJBH Operating in Series with ESP)
(All data in OF)
26
Particulate Mass Loadings I Collection Eficiency Measurements
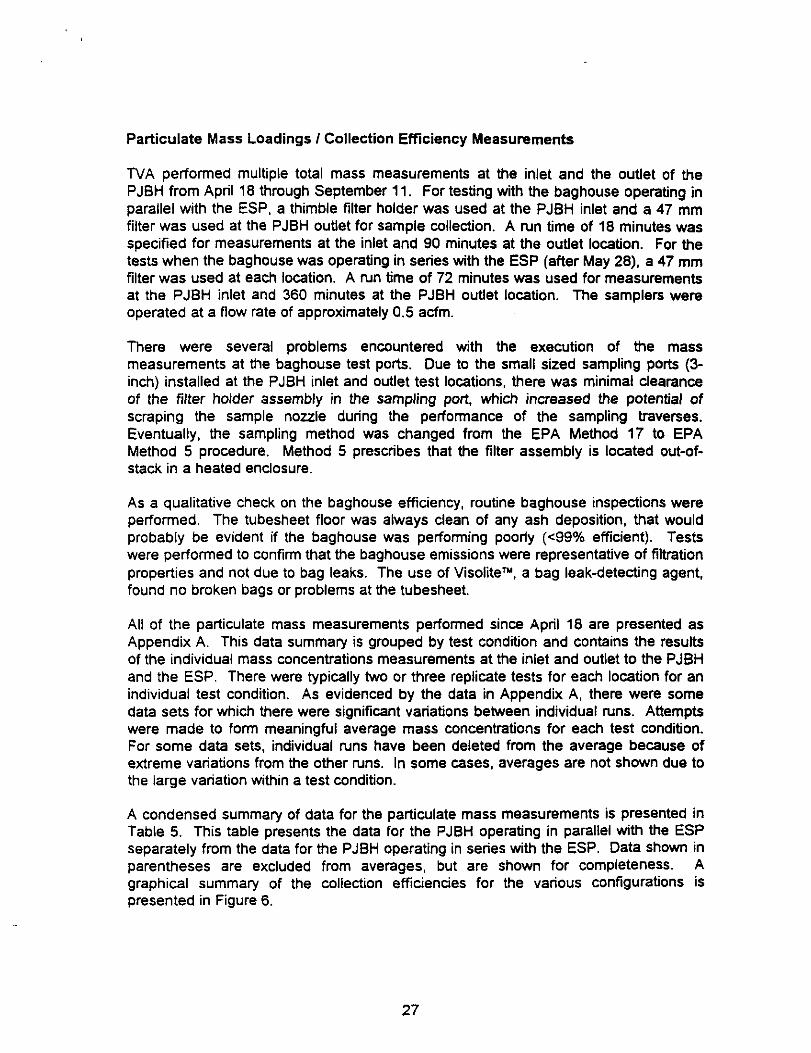
TVA performed multiple total mass measurements at the inlet and the outlet of the PJBH from April 18 through September 11. For testing with the baghouse operating in parallel with the ESP. a thimble filter holder was used at the PJBH inlet and a 47 mm filter was used at the PJBH outlet for sample collection. A run time of 18 minutes was specified for measurements at the inlet and SO minutes at the outlet location. For the tests when the baghouse was operating in series with the ESP (after May 28). a 47 mm filter was used at each location. A run time of 72 minutes was used for measurements at the PJBH inlet and 360 minutes at the PJBH outlet location. The samplers were operated at a flow rate of approximately 0.5 acfm.
There were several problems encountered with the execution of the mass measurements at the baghouse test ports. Due to the small sized sampling ports (3- inch) installed at the PJBH inlet and outlet test locations, there was minimal clearance of the filter holder assembly in the sampling port, which increased the potential of scraping the sample nozzle during the performance of the sampling traverses. Eventually, the sampling method was changed from the EPA Method 17 to EPA Method 5 procedure. Method 5 prescribes that the filter assembly is located out-of- stack in a heated enclosure.
As a qualitative check on the baghouse efficiency, routine baghouse inspections were performed. The tubesheet floor was always clean of any ash deposition, that would probably be evident if the baghouse was performing poorly (<SS% efficient). Tests were performed to confirm that the baghouse emissions were representative of filtration properties and not due to bag leaks. The use of Visolite”, a bag leak-detecting agent, found no broken bags or problems at the tubesheet.
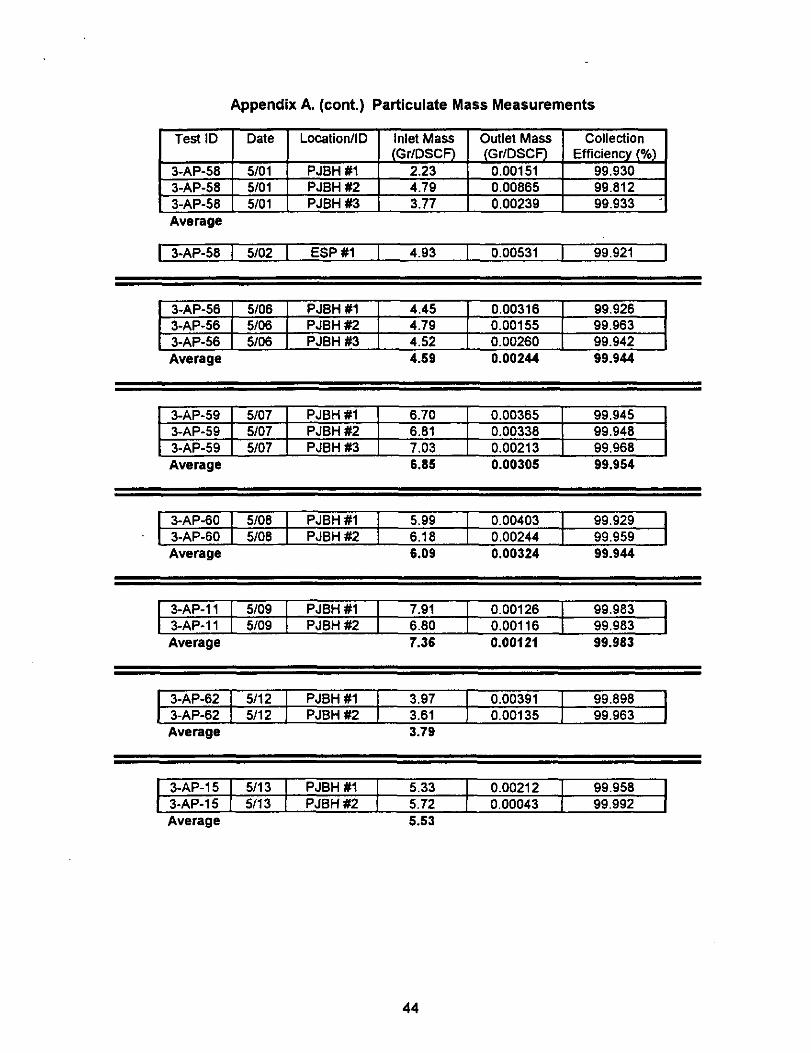
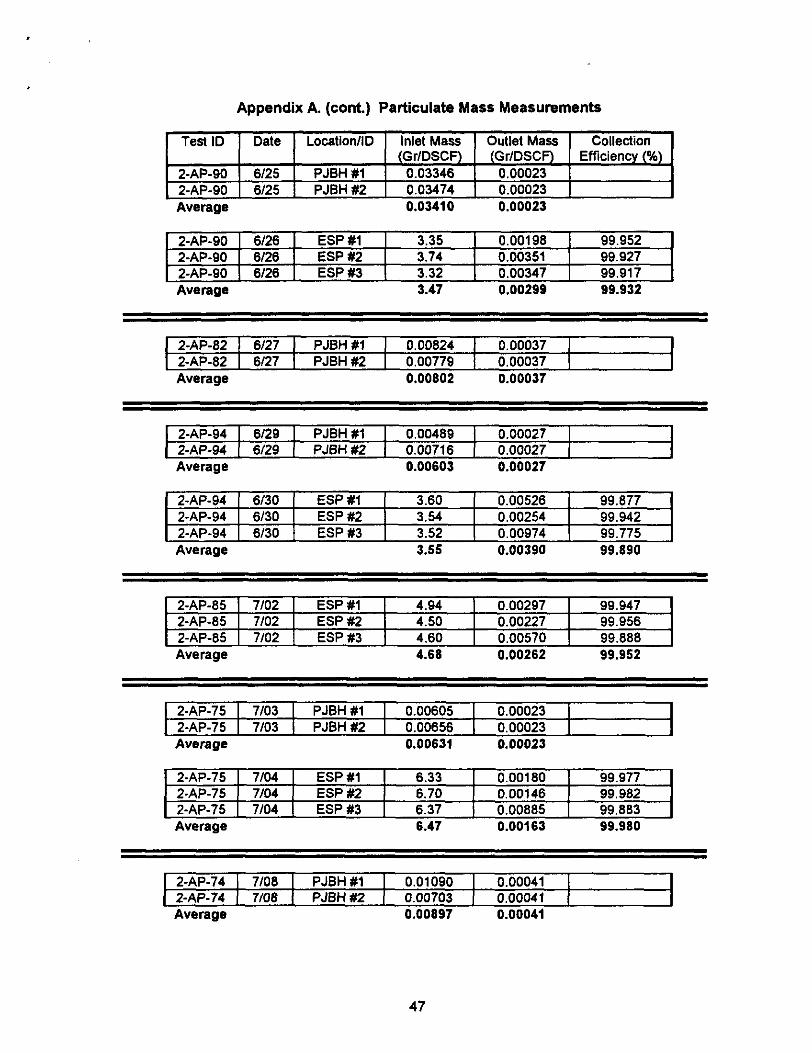
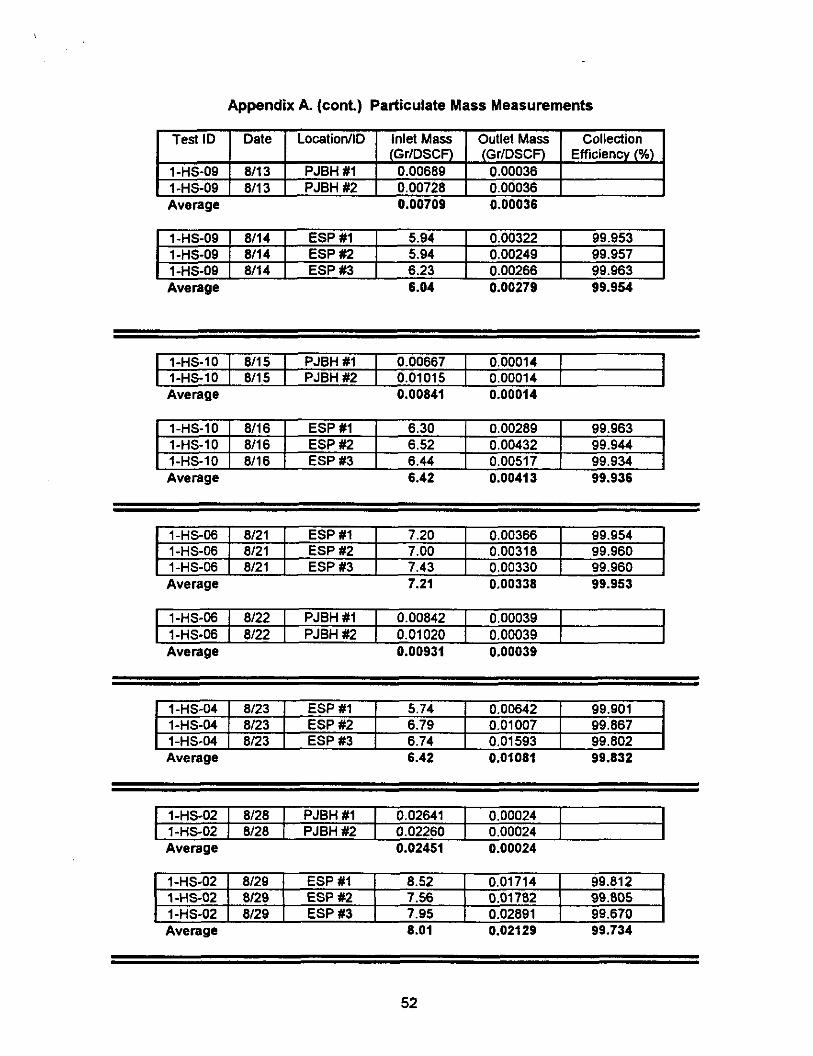
All of the particulate mass measurements performed since April 18 are presented as Appendix A. This data summary is grouped by test condition and contains the results of the individual mass concentrations measurements at the inlet and outlet to the PJBH and the ESP. There were typically two or three replicate tests for each location for an individual test condition. As evidenced by the data in Appendix A, there were some data sets for which there were significant variations between individual runs. Attempts were made to form meaningful average mass concentrations for each test condition. For some data sets, individual runs have been deleted from the average because of extreme variations from the other runs. In some cases, averages are not shown due to the large variation within a test condition.
A condensed summary of data for the particulate mass measurements is presented in Table 5. This table presents the data for the PJBH operating in parallel with the ESP separately from the data for the PJBH operating in series with the ESP. Data shown in parentheses are excluded from averages, but are shown for completeness. A graphical summary of the collection efficiencies for the various configurations is presented in Figure 6.
27
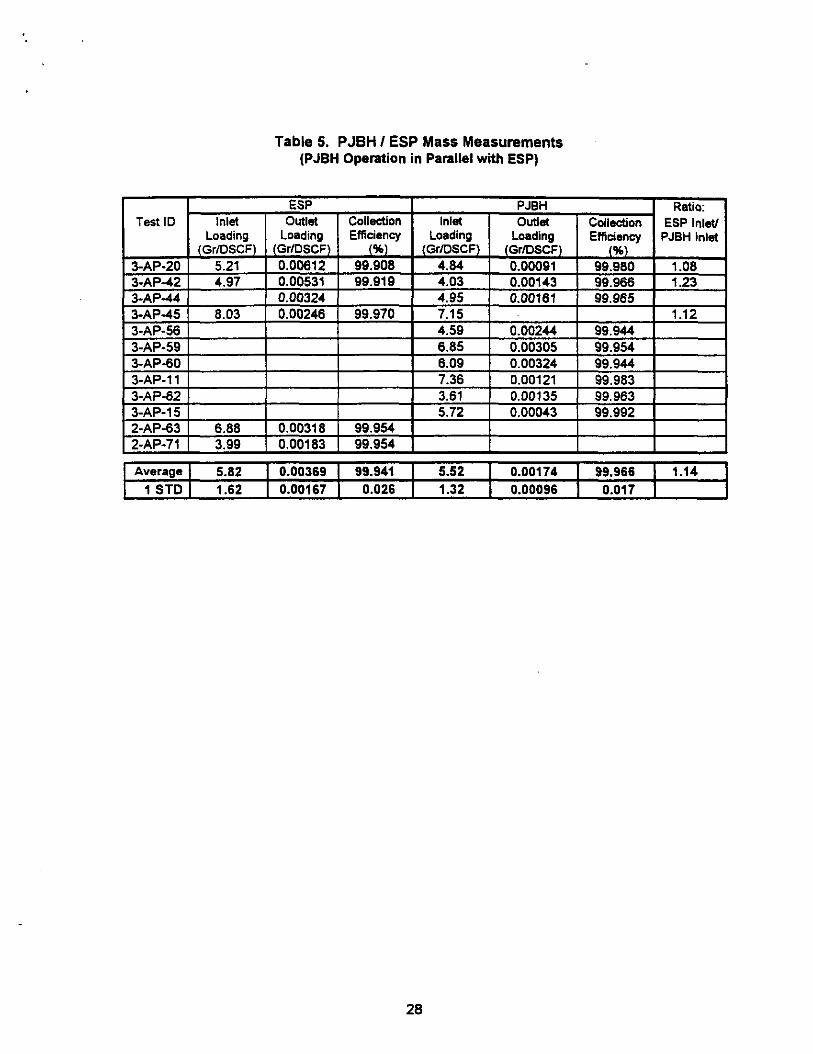
Table 5. PJBH I ESP Mass Measurements (PJBH Operation in Parallel with ESP)
Average 1 5.62 1 0.00369 1 99.941 1 5.52 ] 0.00174 1 99.966 1 1.14 1 STD 1 1.62 1 0.00167 1 0.026 1 1.32 1 0.00096 1 0.017 1
28
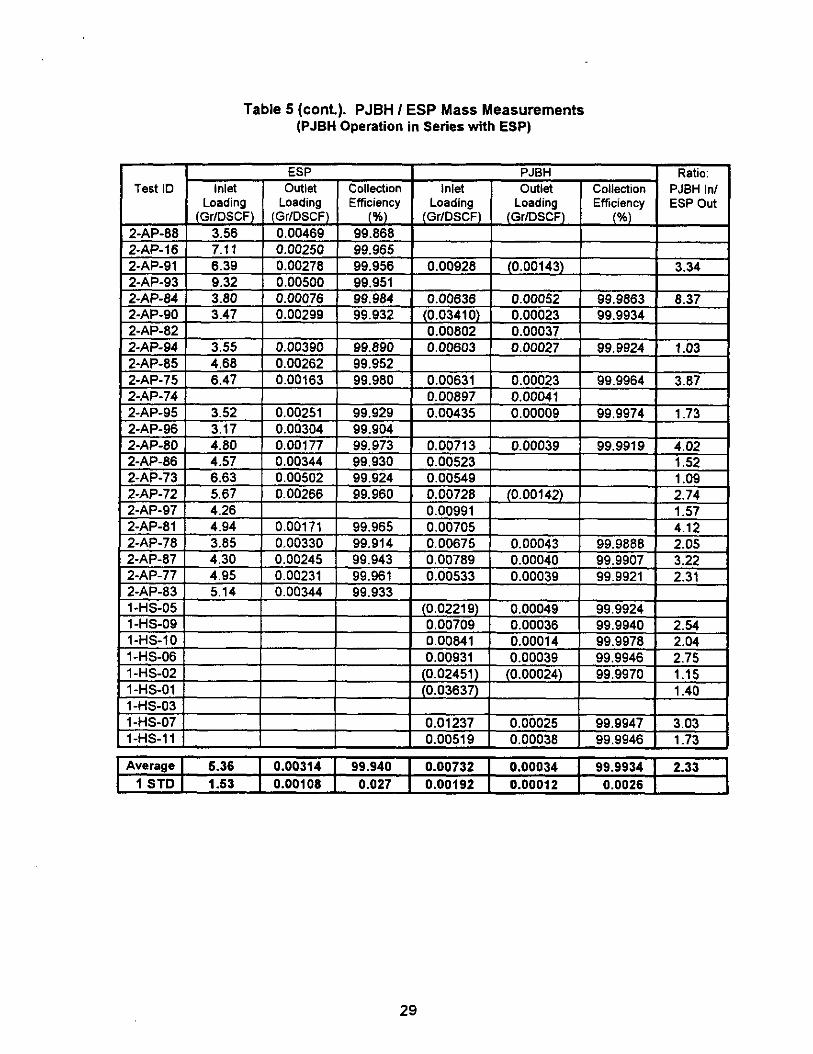
Table 5 (cont.). PJBH / ESP Mass Measurements (PJBH Operation in Series with ESP)
I I ESP PJBH Ratio: I Test ID I
! Inlet Outlet I Collection I Inlet I Outlet I Collection PJBH In/ I
Average I 5.36 1 0.00314 1 99.940 1 0.00732 1 0.00034 1 99.9934 1 2.33 1 STD 1 1.53 1 0.00106 1 0.027 1 0.00192 1 0.00012 1 0.0026 1 I
29

PJBH Operating in Parallel with the ESP
Both collection devices operated with a high particulate collection efficiency. The PJBH averaged marginally higher efficiency than the ESP (99.966% vs. 99.941%). The ESP collection should have been very efficient, since the ESP was operated at a relatively high specific collection area (SCA). Mass concentrations at the outlet of the PJBH are compared with other pulse-jet baghouses in Figure 3. The collection efficiency of the PJBH was in the range that is typical for pulse-jet baghouses.
An overview of all measurements for the PJBH operating in parallel with the ESP is shown in the following table. To account for the variations in the results, the data are presented as a range of one standard deviation (95% confidence limits).
These results suggest that the PJBH was sampling a representative flue gas stream from the ESP inlet duct, since the mass concentrations at the PJBH and ESP inlet ducts were similar (The ratio of the mass concentrations at the ESP inlet to the PJBH inlet showed a difference of 14% as shown in Table 5.)
There was no obvious relationship between the major test parameters and the mass loadings at the inlet to the baghouse due to the scatter in the data. More data would be require to adequately define these relationships.
PJBH Operating in Series with the ESP
For the PJBH operating in series with the ESP, the collection efficiency is calculated with the outlet of the PJBH compared to the inlet of the ESP, rather than the inlet of the PJBH. Therefore, the collection efficiency reported for the PJBH is for the combination of the ESP and PJBH. This average collection efficiency of the PJBH / ESP combination was 99.9934 %.
Average mass concentrations at the inlet to the PJBH ranged from 0.005 to 0.009 gr/DSCF. This level of emissions (representing the outlet of the ESP) was only a small fraction of what would be expected at a “poorly performing ESP” for which the COHPAC concept was intended. Therefore, for the test conditions evaluated at the CER. the baghouse operating as a COHPAC collector was not seriously challenged.
Average mass concentration at the outlet to the PJBH was 0.00034 gr/DSCF. This result was compared with other COHPAC collectors in Figure 4. Unfortunately, mass emission measurements were performed for only one of these evaluations.
31
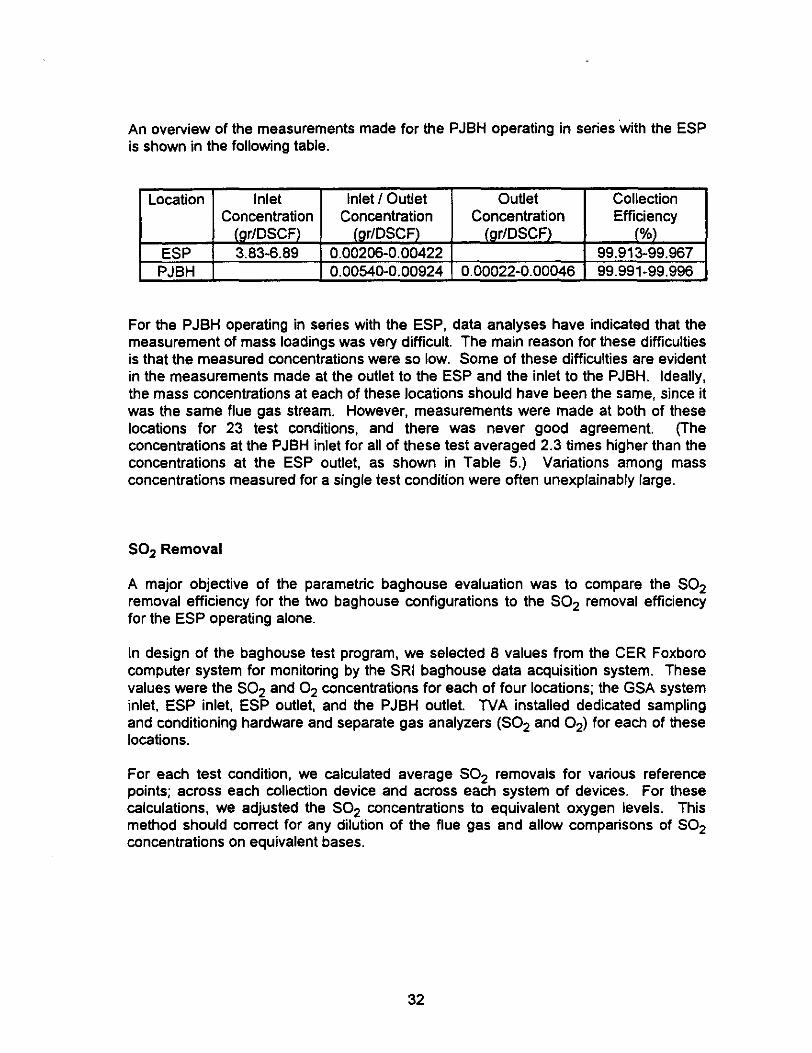
An overview of the measurements made for the PJBH operating in series with the ESP is shown in the following table.
Location Inlet Inlet I Outlet Outlet Collection Concentration Concentration Concentration Efficiency
(gr/DSCF) (gr/DSCF) (gr/DSCF) (% ESP 3.83-6.89 0.00206-0.00422 99.913-99.967
P.IRH 0 00540-0~00924 0~00022-0~00046 99~991-99~996
For the PJBH operating in series with the ESP, data analyses have indicated that the measurement of mass loadings was very difficult. The main reason for these difficulties is that the measured concentrations were so low. Some of these difficulties are evident in the measurements made at the outlet to the ESP and the inlet to the PJBH. Ideally, the mass concentrations at each of these locations should have been the same, since it was the same flue gas stream. However, measurements were made at both of these locations for 23 test conditions, and there was never good agreement. P concentrations at the PJBH inlet for all of these test averaged 2.3 times higher than the concentrations at the ESP outlet, as shown in Table 5.) Variations among mass concentrations measured for a single test condition were often unexplainably large.
SO, Removal
A major objective of the parametric baghouse evaluation was to compare the SO2 removal efficiency for the two baghouse configurations to the SO2 removal efficiency for the ESP operating alone.
In design of the baghouse test program, we selected 8 values from the CER Foxboro computer system for monitoring by the SRI baghouse data acquisition system. These values were the SO2 and 02 concentrations for each of four locations; the GSA system inlet, ESP inlet, ESP outlet, and the PJBH outlet. TVA installed dedicated sampling and conditioning hardware and separate gas analyzers (SO, and 02) for each of these locations.
For each test condition, we calculated average SO, removals for various reference points; across each collection device and across each system of devices. For these calculations, we adjusted the SO, concentrations to equivalent oxygen levels. This method should correct for any dilution of the flue gas and allow comparisons of SO, concentrations on equivalent bases.
32
CER personnel calculated SO, removals on a molar basis, which normalized the SO, concentration based on flue gas conditions (temperature, pressure, moisture, oxygen, etc.). Correction of the SO, concentrations to a wmmon oxygen basis (as performed by SRI) should yield SO2 removals that are equivalent to calculations on a molar basis. The equations that we used for the SO, removals calculations are shown in Table 6. These equations are analogous to the ones used by CER personnel for similar calculations.
There were small differences in the SO2 removals in the results reported by SRI and n/A. which is presumed to be due to the different methods used for calculation. The SO2 removal generally differed by less than 2% (on a total SO, removal basis) between the two calculated results. Since the two methods of calculation used different test parameters, the variations in these parameters could cause these differences in the SO2 removal results.
A summary of the SO2 removal efficiencies for the PJBH and ESP is presented in Table 2. SO2 removals are presented together with the test variables to facilitate comparisons of the results.
Figures 7A and 78 present a comparison of total SO2 removal for the three configurations of particulate collection devices. (The two figures are identical except that figure 7A shows data points for the baghouse operating in parallel with the ESP, and figure 78 shows data points for the baghouse operating in series with the ESP.) For reference purposes, total SO, removal through the PJBH in parallel with the ESP and in series with the ESP are plotted versus the SO, removal through the ESP. A reference line is shown for comparing the PJBH performance. As the data indicate, the SO2 removal for the two PJBH configurations produced results that were distinguishable from the SO, removal data for the ESP, and the PJBH operating in parallel with the ESP produced the highest SO, removal results.
Figures 7A and 78 shows that the removal through the PJBH operating in parallel with the ESP was consistently 3 to 5% higher on an absolute basis than through the ESP for like test conditions. The removal through the PJBH operating in series with the ESP exhibits a 0 to 2% absolute increase in SOz removal compared with removal through the ESP alone.
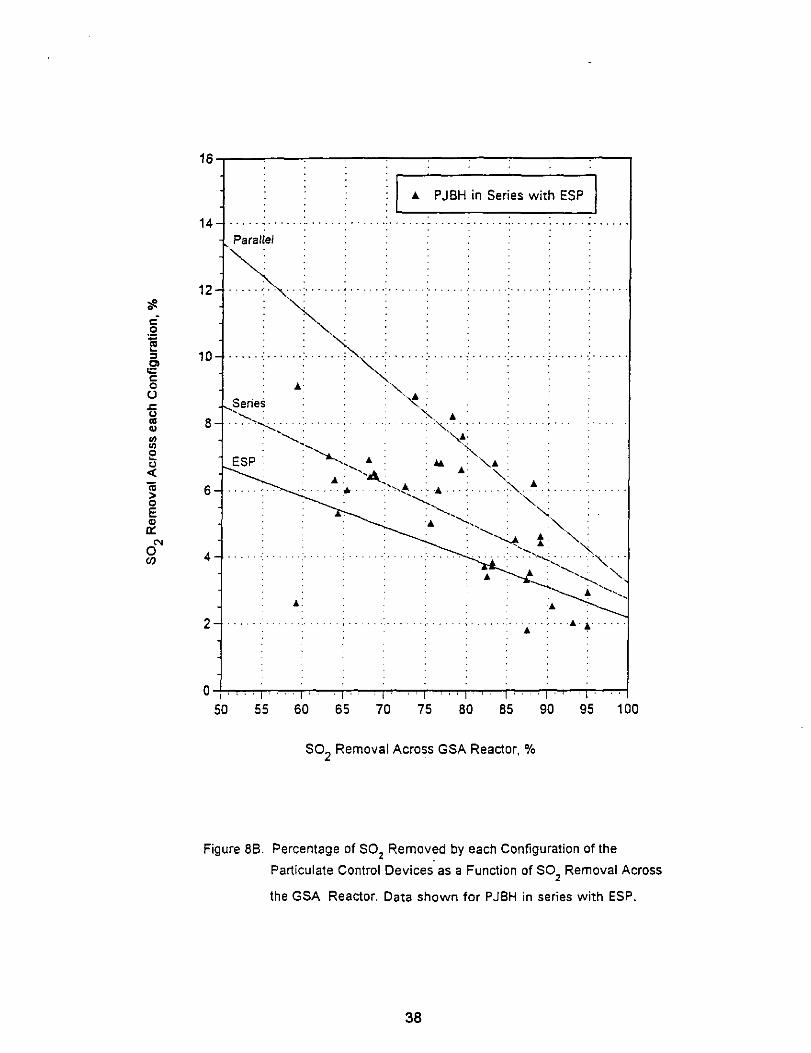
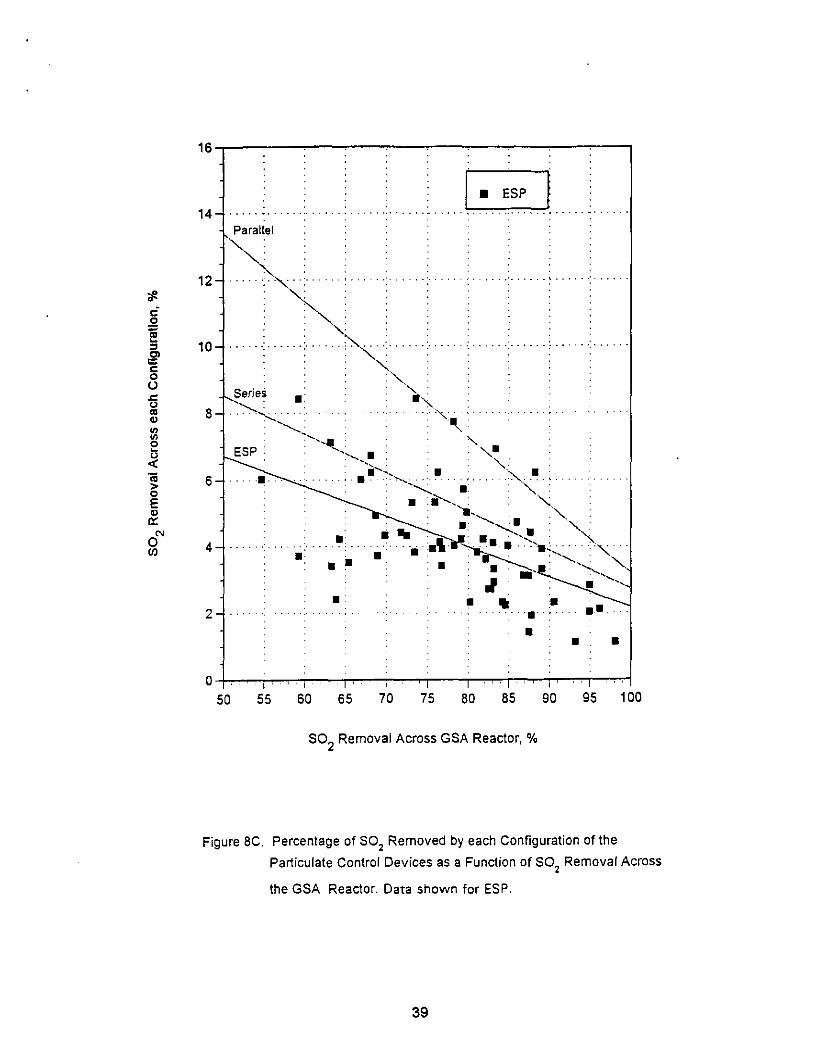
Another perspective is presented in Figures 8A, 8B, and 8C, which shows the incremental amount of SO2 removal through the particulate collection system versus the level of SO2 removal through the GSA reactor. (The three figures are identical except that figure 8A shows data points for the baghouse operating in parallel with the ESP, figure 8B shows data points for the baghouse operating in series with the ESP, and figure 8C shows data for the ESP.) As would be expected, the amount of SO2 removal through the particulate devices is a function of how much SO, remains at the exit of the GSA reactor. Higher SO2 concentrations at the exit of the GSA reactor were consistent with higher removals through the subsequent particulate collection devices. As shown in this figure, the pulse-jet baghouse operating in parallel with the ESP (baghouse operating alone) yielded the highest SO2 removal.
33

Table 6. SO2 Removal Equations
PJBH SO, Removal Efiiciency
AR, =
(S. -%I g,” b
s.
ESP SO, Removal Efficiency
AR, =
(S. -s..)g;I; d
S,
Total System SO, Removal Efficiency Through PJBH
(s, es
R,= '
) 20.9-h b' 20.9-A,
si
Total System SO, Removal Efficiency Through ESP
(s. .,.s
R,= '
)20.9-h " 20.9 -A,.
si
in which S, = SO, Concentration at System Inlet S, = SO, Concentration at ESP Inlet
S,. = SO, Concentration at ESP Outlet S,. = SO, Concentration at PJBH Outlet
A, = 0, Concentration at System Inlet
AC = 0, Concentration at ESP Inlet
A,. = 0, Concentration at ESP Outlet A,. = 0, Concentration at PJBH Outlet
AR, = SO, Removal Across PJBH AR, = SO, Removal Across ESP
R, = Total SO2 Removal Through ESP
R, = Total SO, Removal Through PJBH

100
95 ...
1
90 ".
a5 ..... i ....... ) ...... .I.
80
I : : 1
....... : ....... ; ... .-. .
60 60 65 70 75 80 85 90 95 100
Total SO2 Removal Through ESP, %
Figure 7A. Total System SO, Removal Through PJBH Versus ESP.
Data shown for PJBH in parallel with ESP.
35

100
1 95
90 1
-
A PJBH in Series wirh ESP I
. ..%_......................j......
;J i
a0 ......~ ......
75
ii
Paratiet,
85 1 ! _...__.; .._... j .._ j j ._.... >: j .._._.. i : A i’
; ;;-i YE E
/ A/~ i i t’
./ A ,/, 2’ ) A i
: ./ ;/ ,....... _...
y : * :
:, ~ 4’
/, .I
70
60 F,,,;,.,,;, ; .,,, ,,, 60 65 70 75 a0 a5 90 95
Total SO2 Removal Through ESP, %
1
Figure 78. Total System SO, Removal Through PJBH Versus ESP.
Data shown for PJBH in series with ESP.
36

16
i 14- '."“."'~"'."":""'.:"...':"...:."'.':'....':""':"'..
-, Par&l I
2- . . . . . . . . . ..~..."....~.'~..I."' .:......j......:......:,..'..~,"" .
0 /,,/,,,,,,,/,,/, , / ,,/,, / ., , 50 55 60 65 70 75 80 85 90 95 100
SO2 Removal Across GSA Reactor, %
Figure BA. Percentage of SO, Removed by each Configuration of the
Particulate Control Devices as a Function of SO, Removal Across
the GSA Reactor. Data shown for PJBH in parallel with ESP.
37
60 65 a0 a5
SO2 Removal Across GSA Reactor, %
Figure 8B. Percentage of SO, Removed by each Configuration of the
Particulate Control Devices’as a Function of SO, Removal Across
the GSA Reactor. Dara shown for PJBH in series with ESP.
30
‘“1 ; ! ; ; ; ; ; ; 7
_ ! ; pq
: ..:...
: / . i.. . . \
i !
\ : : \.\I : : ; : : ; : : : : 10 ‘.‘.. “.‘.““...
i ;Yxy;;. .!. I : .:
:, (.. .: .:_.. . ..I.
: \r~.. :
: : : : : : : :
:.: .I,
0 ,,,,,/,,~i,,,,,,, ,/,, ,, ,, ,,,1,/~8,,/8 ,,I,’
55 65 70 75 80 a5 50 60 90 95 100
SO2 Removal Across GSA Reactor, %
Figure 8C. Percentage of SO, Removed by each Configuration of the
Particulate Control Devices as a Function of SO, Removal Across
the GSA Reactor. Data shown for ESP.
39
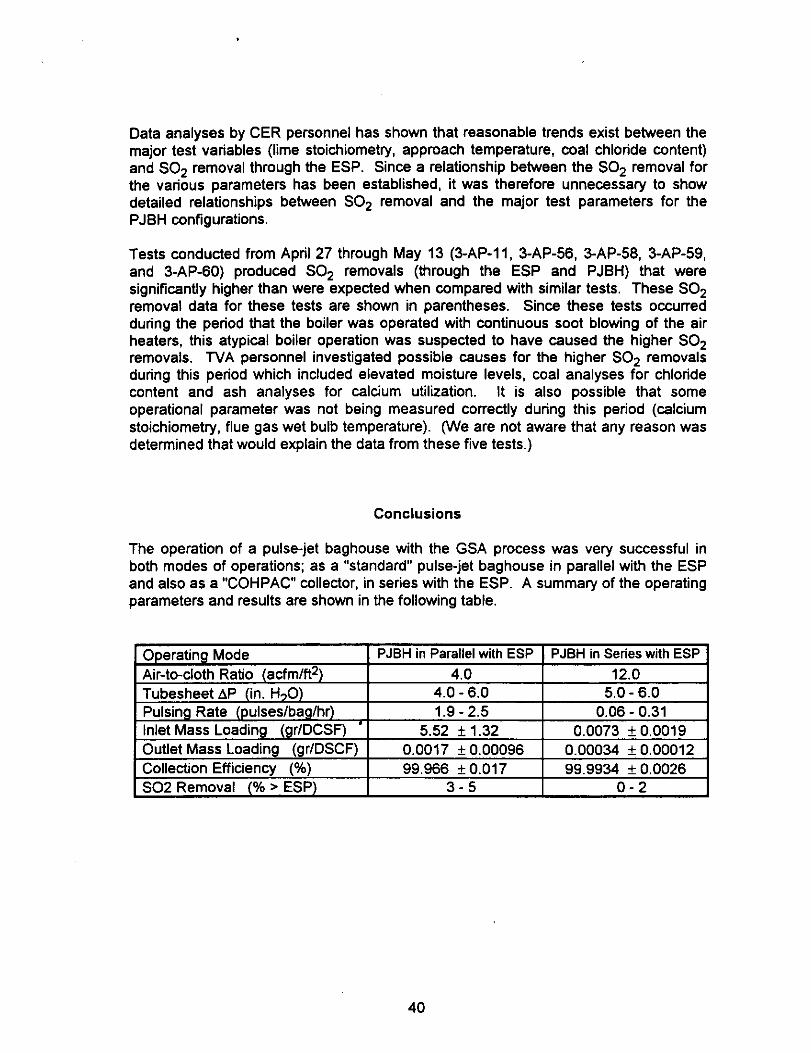
Data analyses by CER personnel has shown that reasonable trends exist between the major test variables (lime stoichiometry, approach temperature, coal chloride content) and SO2 removal through the ESP. Since a relationship between the SO, removal for the various parameters has been established, it was therefore unnecessary to show detailed relationships between SO2 removal and the major test parameters for the PJBH configurations.
Tests conducted from April 27 through May 13 (3-AP-11, 3-AP-56, 3-AP-58, 3-AP-59, and 3-AP-60) produced SO, removals (through the ESP and PJBH) that were significantly higher than were expected when compared with similar tests. These SO2 removal data for these tests are shown in parentheses. Since these tests occurred during the period that the boiler was operated with continuous soot blowing of the air heaters, this atypical boiler operation was suspected to have caused the higher SO* removals. TVA personnel investigated possible causes for the higher SO2 removals during this period which included elevated moisture levels, coal analyses for chloride content and ash analyses for calcium utilization. It is also possible that some operational parameter was not being measured correctly during this period (calcium stoichiometry, flue gas wet bulb temperature). (We are not aware that any reason was detenined that would explain the data from these five tests.)
Conclusions
The operation of a pulse-jet baghouse with the GSA process was very successful in both modes of operations; as a “standard” pulse-jet baghouse in parallel with the ESP and also as a “COHPAC” collector, in series with the ESP. A summary of the operating parameters and results are shown in the following table.
I PJBH in Parallel with ESP I PJEIH in Series with ESP 1 ) RzatirY larfm/ft2\ I An I ~~~~ 13 n I
, .“.._ ,--....I.. ,
t AP (in. H,O) Pulsing Rate (pulses/bag/l ‘hr) Inlet Mass Loadina (or/DC _~~ 3SF) ’ Outlet Mass Loading (gr/DSCF) Collection Effidency (%) SO2 Removal (% > ESP)
,.., a-.”
4.0 - 6.0 5.0 - 6.0 1.9 - 2.5 0.06 - 0.31
5.52 k 1.32 0.0073 * 0.0019 0.0017 f 0.00096 0.00034 + 0.00012 99.966 f 0.017 99.9934 + 0.0026
3-5 o-2
40
Operation in Parallel with the ESP:
The PJBH operated for 1197 hours in this configuration. The pulse cleaning rate was as low as any of the other pulse-jet baghouse in the EPRI database of pilot-scale and full-scale pulse-jet baghouse operation, although the inlet mass loading to the baghouse was reasonably high (4 to 7 gr/DSCF). This low pulsing rate is partially attributed to the good filtration properties of the sorbent I ash product being handled by the baghouse. The outlet emissions rate was very low, certainly below any existing regulations. SO, removal was 3 to 5% higher for the baghouse operating in parallel with the ESP than with the ESP alone. This configuration yielded the highest total SO2 removal for the GSA process.
Operation in Series with the ESP:
The PJBH operated for 2445 hours in this configuration. Although the baghouse operating in the COHPAC mode was not seriously challenged, due to the low inlet mass loading, the baghouse compared favorably with the other relevant COHPAC operating histories. The tubesheet pressure drop was within the acceptable range of operation for the high air-to-cloth value. The pulse cleaning rate was very low, practically an order of magnitude lower than the other comparable data from COHPAC units. SO2 removal was only slightly better, approximately 0 to 2%, than through the ESP alone.
Acknowledgments
We acknowledge the following people for their participation in the evaluation of the pulse-jet baghouse at the CER. Operation and on-site management of the test facility at the CER and evaluation of the GSA process was conducted by Mr. Ken Schuppert, Mr. Ed Puschaver and Mr. Michael Little. Refurbishment and installation of the baghouse at the CER was coordinated by Mr. Randy Summers, Mr. Lancie Melson, and Mr. Gene Hale of TVA’s National Center for Fertilizer Research located in Muscle Shoals, Alabama. Mr. Mike Battoe and his staff provided routine maintenance and repairs to the baghouse system. Mr. Larry Lepovitz, of the Radian Corporation, provided access to process data. Mr. Ray Wilson of SRI provided routine data manipulation from the on-site computer, and Mr. Don Johnson of SRI provided technical support. Project management was conducted by Mr. Tom Burnett and Dr. Jose DeGuzman of NA in Chattanooga. Tennessee. The pulse-jet baghouse evaluation was supported through EPRI research project RP3083-10 under the supervision of Dr. Ralph F. Altman and Dr. Ramsay L. Chang.
41

References
1. Bustard, C. Jean, Cushing, Kenneth M., Chang, Ramsay L. “The Potential of Pulse- Jet Baghouses for Utility Boilers. Part 2: Perfonance of Pulse-Jet Fabric Filter Pilot Plants,” Journal of the Air & Waste Management Associafion 42:Q (1992)
2. Hindicha, A. K., Brown, Ben, Chang, Ramsay L. “Commercial Demonstration of COHPAC,” In Proceedings of the Tenth Particulate Control Symposium, Electric Power Research Institute, Washington, D.C., April 1993
3. Sjostrom, S. M., Bustard, C. J., Slye, R. H., Thomas, Scott, Chang, Ramsay L. “Pilot-Scale Demonstrations of the Compact Hybrid Particulate Collector (COHPAC),” In Proceedings of the Tenth Particulate Control Symposium, Electric Power Research Institute. Washington, DC.. April 1993
4. Cushing, K. M., Merritt, R. L. “Design, Performance, Operation, and Maintenance of Fabric Filters in the Utility Industry,” EPRI GS-7287, April 1991
42
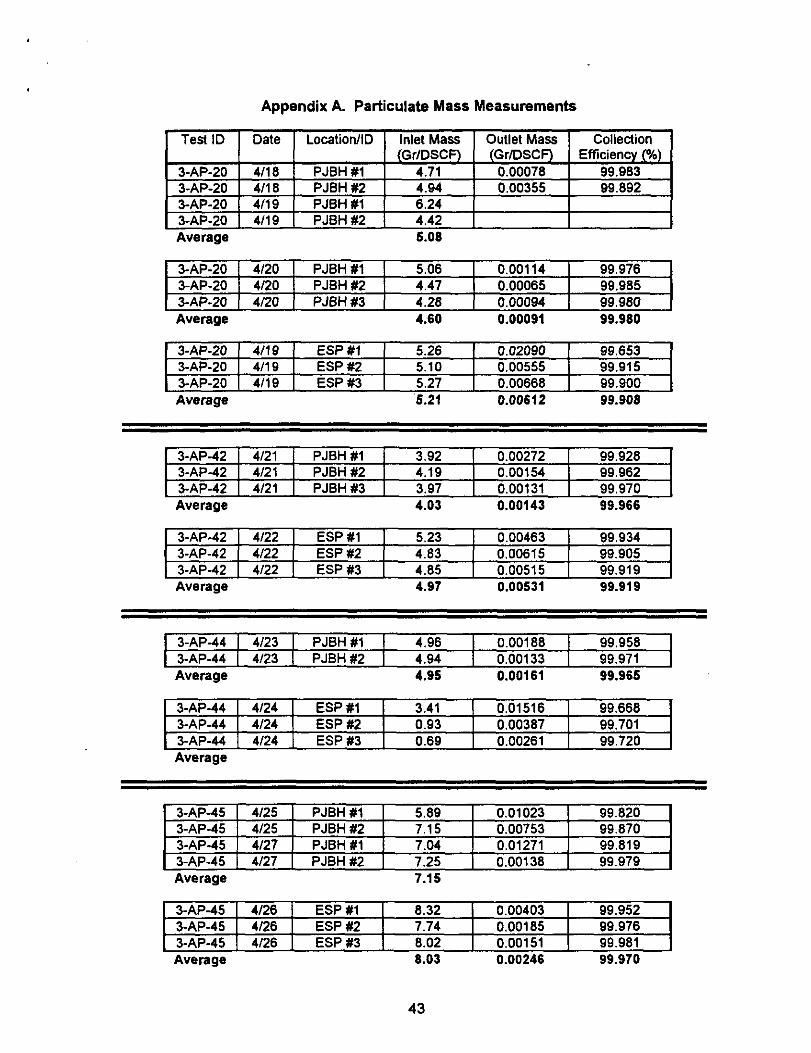
Appendix A. Particulate Mass Measurements
Test ID
3-AP-20 3-AP-20 3-AP-20 3-AP-20
Date
4/I 0 4/I 8 4/I 9 4/l 9
Location/ID Inlet Mass Outlet Mass Collection (Gr/DSCF) (Gr/DSCF) Efticiency (%)
PJBH #I 4.71 0.00076 99.983 PJBH #2 4.94 0.00355 99.892 PJBH #I 6.24 PJEH #2 4.42
Average 5.08
3-AP-20 1 4120 1 PJBH#l 1 5.06 I 0.00114 1 99.976 3-AP-20 / 4120 1 PJBH#2 ( 4.47 I 0.00065 I 99.985
c 3-AP-20 ( 4/20 1 PJEH#3 ( 4.26 1 0.00094 I 99.960 Average 4.60 0.00091 99.980
3-AP-20 1 409 1 ESP #I 1 5.26 I 0.02090 I 99.653 3-AP-20 1 4119 1 ESP #2 1 5.10 I 0.00555 / 99.915 3-AP-20 1 4119 1 ESP #3 1 5.27 I 0.00666 I 99.900 Average ‘5.21 0.00612 99.908
3-AP-42 1 4121 1 PJBH#l 1 3.92 1 0.00272 1 99.926 3-AP-42 1 4121 1 PJBH#2 ] 4.19 I 0.00154 1 99.962 3-AP-42 1 4121 1 PJBH#3 1 3.97 I 0.00131 I 99.970 I Average 4.03 0.00143 99.966
3-AP-42 1 4122 1 ESP#l 1 5.23 1 0.00463 1 99.934 3-AP-42 ( 4l22 ( ESP#2 1 4.03 1 0.00615 1 99.905 3-AP-42 1 4122 1 ESP#3 1 4.65 1 0.00515 1 99.919 Average 4.97 0.00531 99.919
3-AP-44 1 4123 1 PJBH #I 1 4.96 I 0.00166 I 99.958 3-AP-44 1 4123 I PJBH#2 1 4.94 I 0.00133 I 99.971 I Average 4.95 0.00161 99.966
3-AP-44 1 4124 1 ESP#l 1 3.41 ( 0.01516 1 99.668 3-AP-44 1 4124 ( ESP #2 1 0.93 1 0.00387 1 99.701 3-AP-44 1 4124 1 ESP#3 1 0.69 1 0.00261 I 99.720 I Average
3-AP-45 4125 PJBH #l 5.89 0.01023 99.820 3-AP-45 4125 PJBH #2 7.15 0.00753 99.870 3-AP-45 4127 PJBH #I 7.04 0.01271 99.619 3-AP-45 4127 PJBH #2 7.25 0.00130 99.979 Average 7.I5
3-AP-45 1 4126 1 ESP #I 1 a.32 I 0.00403 I 99.952 3-AP-45 1 4126 I ESP #2 I 7.74 I 0.00165 I 99.976 3-AP-45 1 4126 1 ESP#3 1 6.02 I 0.00151 I 99.981 Average 8.03 0.00246 99.970
43
Appendix A. (cont.) Particulate Mass Measurements
Test ID Date LocationlID inlet Mass Outlet Mass Collection (GrlDSCF) (GrlDSCF) Efficiency (%)
3-AP-56 5101 PJBH #l 2.23 0.00151 99.930 3-AP-56 SIOI PJEH #2 4.79 0.00865 99.812 3-AP-56 5101 PJBH #3 3.77 0.00239 99.933 - . Average
[ 3-AP-58 1 5102 I ESP#l I 4.93 I 0.00531 I 99.921 I
3-AP-56 1 5106 I PJBH#l 1 4.45 1 0.00316 1 99.926 3-AP-56 1 5106 I PJBH#2 1 4.79 I 0.00155 1 99.963
, 3-AP-56 1 5106 I PJBH #3 I 4.52 1 0.00260 1 99.942 Average 4.59 0.00244 99.944
3-AP-59 I 5107 I PJBH#l I 6.70 1 0.00365 1 99.945 3-AP-59 1 5107 1 PJBH#2 1 6.61 1 0.00336 ( 99.948 3-AP-59 1 5107 1 PJBH#3 1 7.03 1 0.00213 1 99.968 Average 6.65 0.00305 99.954
3-AP-60 1 5106 1 PJBH#l 1 5.99 I 0.00403 1 99.929 3-AP-60 1 5108 1 PJBH#2 1 6.16 1 0.00244 1 99.959 I Average 6.09 0.00324 99.944
3-AP-II 1 5109 1 PJEH #I 1 7.91 ) 0.00126 1 99.983 3-AP-II 1 5109 ] PJEH #2 1 6.80 1 0.00116 1 99.983 Average 7.36 0.00121 99.983
3-AP-62 / 5112 1 PJBH#l ( 3.97 I 0.00391 I 99.698 3-AP-62 1 5112 1 PJBH#2 1 3.61 1 0.00135 1 99.963 I Average 3.79
3-AP-15 1 5113 1 PJBH #l 1 5.33 I 0.00212 1 99.958
3-AP-I5 I 5113 1 PJBH#2 1 5.72 I 0.00043 1 99.992 I Average 5.53

Appendix A. (cont.) Particulate Mass Measurements
Test ID Date Location/ID Inlet Mass Outlet Mass Collection (GrIDSCF) (GrtDSCF) Efficiency (%)
2-AP-63 5120 ESP %I 7.63 0.00342 99.959 2-AP-63 5/20 ESP #I2 7.22 0.00276 09.970 2-AP-63 5/20 ESP %3 7.27 0.00151 09.976 Average 7.37 0.00266 99.969
2-AP-63 1 5121 1 ESP #I 1 7.26 1 0.00491 I 99.936 2-AP-63 1 5/21 1 ESPY2 1 6.35 I 0.00258 I 99.962 2-AP-63 1 5121 1 ESP13 1 6.19 1 0.00361 I 99.942 Average 6.60 0.00377 99.947
2-AP-63 ( 5125 ( ESP#l 1 6.40 1 0.00352 1 99.947 2-AP-63 1 5125 1 ESP#Z 1 6.46 1 0.00388 1 99.944 I Average 6.43 0.00369 99.946
2-AP-63 1 5127 1 ESP #I 1 6.98 1 0.01461 I 99.790 2-AP-63 1 5127 1 ESP#Z I 7.28 1 0.00845 ) 99.890 2-AP-63 1 5127 1 ESP #3 1 7.04 ( 0.00268 ( 99.960 Average 7.10
2-AP-71 ] 5130 1 ESP #I 1 4.10 1 0.01302 1 99.757 2-AP-71 1 5130 1 ESP#Z 1 4.07 I 0.00175 1 99.966 2-AP-71 1 5130 1 ESP#3 1 3.72 I 0.00151 I 99.968 Average 3.96 0.00163 99.967
2-AP-71 1 5131 1 ESP #I ) 3.96 1 0.00636 1 99.877 2-AP-71 1 5131 1 ESP#Z 1 3.86 1 0.00138 1 99.971 2-AP-71 1 5131 1 ESP#3 1 4.21 1 0.00265 1 99.951 Average 4.01 0.00202 99.961
2-AP-88 1 6103 1 ESPtl 1 3.72 I 0.00379 I 99.896 2-AP-88 ( 6/03 1 ESP#2 1 3.80 I 0.00405 1 99.893 Average 3.76 0.00392 99.896
2-AP-88 1 6104 1 ESP #l 1 3.47 1 0.00662 1 99.608 2-AP-60 1 6104 1 ESP #2 ( 3.26 I 0.01010 I 99.686 2-AP-88 ( 6/04 j ESP#3 1 3.30 1 0.00429 1 99.891 Aveage 3.36 0.00646 99.637
45

Appendix A. (cont.) Particulate Mass Measurements
1 Test ID I Date I Location/ID I Inlet Mass I Outlet Mass I Collection 1 (GrlDSCF) (GdDSCF) Efficiency (%L
2-AP-16 6/06 ESP #I 8.33 0.00396 99.952 2-AP-16 6106 ESP #2 7.17 0.00248 99.966 Average 7.76 0.00322 99.969
2-AP-16 1 6107 1 ESPfl I 6.21 1 0.00256 1 99.956 2-AP-16 1 6107 1 ESP#Z I 6.75 ( 0.00139 ( 99.979 2-AP-16 1 6107 1 ESP#3 1 6.41 I 0.00135 I 99.976 Average 6.46 0.00177 99.972
2-AP-91 1 6112 1 PJBH #I I 0.01110 1 0.00143 1 2-AP-91 1 6112 ( PJBH#Z 1 0.00745 1 0.00143 1 1 Average 0.00928 0.00143
2-AP-91 1 6113 1 ESP #I I 6.19 1 0.00265 1 99.967 2-AP-91 1 6113 1 ESP #2 I 6.12 1 0.00351 I 99.952 Average 6.16 0.00308 99.959
2-AP-91 1 6114 1 ESP #I I 6.37 1 0.00208 1 99.971 2-AP-91 1 6114 / ESP#Z 1 6.75 1 0.00223 1 99.971 2-AP-91 1 6114 1 ESP #3 1 6.74 1 0.00299 1 99.961 Average 6.62 0.00243 99.966
2-AP-91 1 6115 1 ESP #l 1 4.31 1 0.00258 1 99.947 2-AP-91 1 6115 1 ESP #2 1 6.53 ( 0.00306 1 99.958 2-AP-91 1 6115 1 ESP#3 1 4.69 1 0.00528 1 99.903 Average 0.00282
2-AP-93 1 6121 ( ESP%l 1 7.73 1 0.00455 1 99.952 2-AP-93 1 6121 1 ESP#Z I 9.41 1 0.00545 1 99.949 2-AP-93 ( 6121 1 ESP $3 1 9.22 1 0.00165 1 99.965 Average 9.32 0.00600 99.951
2-AP-84 1 6t23 1 PJBH#l I 0.00706 I 0.00052 1 2-AP-64 1 6123 1 PJBH#Z 1 0.00566 1 0.00052 1 Average 0.00636 0.00062
2-AP-84 1 6124 1 ESP #l 1 3.80 1 0.00066 1 99.985 2-AP-84 1 6124 1 ESP#Z 1 3.88 1 0.00084 1 99.982 2-AP-84 1 6/24 1 ESP #3 I 3.71 1 0.00384 1 99.916 Average 3.80 0.00076 99.984
46
Appendix A. (cont.) Particulate Mass Measurements
I Tesf ID ~1 fate I Location/ID I Inlet Ma& I Outlet Mass I Cdlectionl _-. .- --.. (GdDSCF) (GrlDSCFl Effdency (%)
2-AP-90 6125 PJBH WI 0.03346 0.00023 2-AP-90 6125 PJBH #2 0.03474 0.00023 Average 0.03410 0.00023
2-AP-90 1 6126 I ESPWI I 3.35 I 0.00198 I 99.952 2-AP-90 1 6126 ( ESP #2 1 3.74 I 0.00351 I 99.927 2-AP-90 1 6126 I ESP#3 1 3.32 I 0.00347 I 99.917 Average 3.47 0.00299 99.932
2-AP-82 1 6127 1 PJBH #I 1 0.00824 1 0.00037 1 2-AP-82 1 6127 I PJBH#Z 1 0.00779 1 0.00037 1 I Average 0.00802 0.00037
2-AP-94 I 6129 I PJBH#l I 0.00489 ( 0.00027 1 2-AP-94 1 6/29 I PJBH#Z 1 0.00716 ( 0.00027 1 Average 0.00603 0.00027
2-AP-94 1 6/30 1 ESP#l I 3.60 ( 0.00526 1 99.677 2-AP-94 1 6130 1 ESP#Z I 3.54 1 0.00254 1 99.942 2-AP-94 1 6130 1 ESP#3 1 3.52 ( 0.00974 1 99.775 Average 3.55 0.00390 99.890
2-AP-85 1 7102 1 ESP#l 1 4.94 I 0.00297 1 99.947 2-AP-85 1 7102 1 ESP#Z 1 4.50 1 0.00227 1 99.956 2-AP-85 1 7102 1 ESP#3 1 4.60 I 0.00570 1 99.888 Average 4.68 0.00262 99.962
2-AP-75 1 7103 1 PJBH #I 1 0.00605 1 0.00023 ( 2-AP-75 1 7103 1 PJBH#Z 1 0.00656 1 0.00023 1 I Average 0.00631 0.00023
2-AP-75 1 7104 1 ESP#l ( 6.33 1 0.00180 1 99.977 2-AP-75 1 7JO4 1 ESPAt2 1 6.70 1 0.00146 1 99.982 2-AP-75 1 7104 1 ESP #3 1 6.37 0.00885 99.683 1 1 Average 6.47 0.00163 99.980
2-AP-74 1 7108 1 PJBH#l I 0.01090 1 0.00041 I 2-AP-74 1 7108 1 PJBHM ( 0.00703 1 0.00041 1 I Average 0.00897 0.00041
47

Appendix A. (cont.) Particulate Mass Measurements
1 Test ID I Date I Location/ID I Inlet Mass I Outlet Mass I Collection 1 (Gr/DSCF) (Gr/DSCF) Efficiency (%)
2-AP-79 7/l 2 ESP #I 3.48 0.00114 99.973 2-AP-79 7/l 2 ESP #2 3.27 0.00011 99.997 2-AP-79 7/l 2 ESP #3 3.35 0.00035 99.989
2-AP-95 1 7114 1 PJBH#l 1 0.00399 1 0.00009 1 2-AP-95 1 7114 1 PJBH#Z 1 0.00470 1 0.00009 1 2-AP-95 1 7114 1 PJBH#3 1 0.00743 1 0.00009 1 Average 0.00435 0.00009
2-AP-95 1 7115 1 ESP #I I 3.58 1 0.00290 1 99.931 ZAP-95 1 7115 1 ESP #2 I 3.52 1 0.00128 1 99.969 2-AP-95 1 7115 1 ESP #3 1 3.47 1 0.00211 I 99.949 Average 3.52 0.00261 99.929
2-AP-96 1 7116 1 ESP#l 1 3.10 ( 0.00238 1 99.936 2-AP-96 1 7116 I ESP#Z I 3.20 1 0.00245 1 99.935 1 Average 3.15 0.00242 99.923
2-AP-96 1 7117 ( ESP#l 1 3.25 1 0.00376 1 99.899 2-AP-96 1 7117 1 ESP#Z 1 3.13 1 0.00376 1 99.899 2-AP-96 1 7117 1 ESP#3 I 4.68 ( 0.00344 I 99.941 Average 3.19 0.00365 99.886
2-AP-60 7118 PJBH#l 1 0.00876 1 0.00039 2-AP-60 708 PJBH#Z 1 0.00726 ( 0.00039 2-AP-80 7118 PJBH#3 1 0.00534 1 0.00039 Average 0.00713 0.00039
2-AP-60 ( 7119 ( ESP #l 1 4.72 ( 0.00068 1 99.988 2-AP-60 1 7119 1 ESP #2 1 5.40 1 0.00177 1 99.973 2-AP-60 1 7119 1 ESP #3 1 4.28 1 0.00025 1 99.995 Average 4.80
48

Appendix A. (cont.) Particulate Mass Measurements
1 Test ID 1 Date 1 Location/ID 1 Inlet Mass I Outlet Mass 1 Collection 1 jGr/DSCF)
n nnmrr 2-AP-86 7120 PJBH#l 1 V.UVP..- 2-AP-86 ?I20 PJBH#7 I ~~XYUXY 2-AP-86 7120 PJBH& , u.uu Average 0.00523
, -.--- __’ ’ ’ -“‘-M24
(GrlDSCF) Efticiency (%)
2-AP-66 [ 7120 ( ESP WI [ 1 0.00320 1 2-AP-66 1 7120 1 ESP#2 I I 0.00441 I 2-AP-66 1 7120 1 ESP#3 I 1 0.00346 1 Average 0.00369
2-AP-66 1 7121 1 ESP#l 1 4.60 1 0.00266 1 99.949 2-AP-66 1 7121 1 ESP #2 I 4.53 1 0.00174 1 99.970 2-AP-66 1 7121 1 ESP #3 1 4.37 1 0.00499 1 99.904 Average 4.57 0.00320 99.930
2-AP-73 1 7J22 1 PJBH#l 1 0.00407 1 I 2-AP-73 1 7122 1 PJEH#2 1 0.00669 1 2-AP-73 1 7122 1 PJBH#3 1 0.00571 1 I Average 0.00549
2-AP-73 1 7122 1 ESPfl 1 1 0.00413 1 2-AP-73 1 7122 1 ESP #2 1 1 0.00323 1 2-AP-73 1 7122 1 ESP#3 1 1 0.00256 1 Average 0.00331
2-AP-73 1 7123 1 ESP #I 1 6.02 1 0.00605 1 99.693 2-AP-73 1 7123 1 ESP#2 1 7.43 1 0.00277 1 99.969 2-AP-73 1 7123 1 ESP#3 1 6.45 1 0.00933 1 99.660 Average 6.63 0.00672 99.899
2-AP-72 1 7124 I PJBH#l 1 0.00753 1 0.00142 1 2-AP-72 1 7124 I PJBH#2 1 0.00703 ) 0.00142 1 Average 0.00728 0.00142
2-AP-72 1 7125 1 ESP #I 1 5.86 1 0.00306 1 99.955 2-AP-72 1 7125 ( ESP#2 ( 5.47 1 0.00225 1 99.964 I Average 5.67 0.00266 99.960
49

Appendix A. (cont.) Particulate Mass Measurements
1 Test ID 1 Date 1 Location/ID 1 Inlet Mass i Outlet Mass 1 Collection 1 Em=) 1 (GrlDSCF) 1 Efficiency (%) ,n-rn I I
(GdD 2-AP-97 7126 PJBH #I O.Ol”,. 2-AP-97 7126 PJBH #2 0.00674 2-AP-97 7126 PJBH #3 0.01220 Average 0.00991
I I 1 1 I I I 1
2AP-97 1 7126 1 ESP#l I 1 0.00799 1 2-AP-97 1 7126 1 ESP#2 I 1 0.00628 1 2-AP-97 1 7126 1 ESP#3 I 1 0.00468 1 Average 0.00632
2-AP-97 1 7127 1 ESP%l 1 4.29 1 0.01032 1 99.791 2-AP-97 1 7127 1 ESP #2 I 1.24 I 0.01593 I 98.911 2-AP-97 1 7127 ( ESP#3 1 4.23 1 0.01340 1 99.661 Average 4.26 0.01322 99.690
2-AP-81 ) 7126 ( PJBH#l 1 0.00807 ( I 2-AP-81 1 7128 1 PJBH #2 1 0.00602 1 3 Average 0.00705
2-AP-61 1 7128 1 ESP#l 1 1 0.01165 1 2-AP-81 1 7128 1 ESP #2 1 1 0.00327 1 i Average
2-AP-81 1 7129 1 E.SP#l I 4.92 1 0.00183 1 99.964 2-AP-81 1 7129 1 ESP#2 1 4.91 1 0.00209 1 99.958 2-AP-81 1 7129 1 ESP#3 1 4.98 j 0.00122 I 99.976 Average 4.94 0.00171 99.965
2-AP-76 1 7130 ( PJBH #I 1 0.00758 1 0.00043 1 2-AP-76 1 7130 ) PJBH#2 1 0.00592 1 0.00043 1 1 Average 0.00876 0.00043
2-AP-78 1 7131 1 ESP#l I 3.65 1 0.00282 j 99.936 2-AP-78 1 7131 1 ESP #2 1 3.76 1 0.00232 1 99.945 2-AP-78 1 7131 1 ESP#3 I 3.93 1 0.00608 1 99.816 Average 3.85 0.00441 99.886
2-AP-78 1 8101 1 ESP#l 1 4.66 ) 0.00240 1 99.954 2-AP-76 1 8101 1 ESP #2 1 4.90 1 0.00195 1 99.965 I Average 4.79 0.00218 99.955
50

Appendix A. (cont.) Particulate Mass Measurements
Teal ID Date Location/ID Inlet Mass Outlet Mass Collection (GrlDSCF) (GrlDSCF) Efficiency (%)
2-AP-87 8102 PJBH Cl 0.00750 0.00040 2-AP-87 6102 PJBH #2 0.00827 0.00040 Average 0.00789 0.00040
2-AP-87 1 8106 1 ESP#l 1 4.02 I 0.00221 I 99.954 2-AP-87 1 8106 1 ESP #2 1 4.28 1 0.00264 1 99.947 2AP-87 1 8lO6 I ESP93 I 4.59 1 0.00249 1 99,954 Average 4.30 0.00248 99.943
2-AP-77 1 6107 1 PJBH#l 1 0.00569 1 0.00039 1 2-AP-77 1 8107 1 PJBH#2 1 0.00476 1 0.00039 1 I Average 0.00533 0.00039
2-AP-77 1 8108 1 ESP #I I 4.95 1 0.02274 1 99.629 2-AP-77 1 8108 1 ESP#2 1 4.99 1 0.02525 1 99.575 2-AP-77 1 8108 1 ESP#3 1 4.91 1 0.00231 I 99.961 Average 4.95
2.AP-83 1 6109 1 ESP#l 1 5.21 1 0.00304 1 99.950 2-AP-83 1 8109 1 ESP#2 1 5.34 1 0.00262 1 99.958 2-AP-83 1 8lO9 1 ESP #3 1 5.48 [ 0.00356 1 99.942 Average 5.34 0.00307 99.943
2-AP-83 1 6llO 1 ESP #l 1 4.99 ( 0.00442 1 99.922 1
2-AP-83 1 8110 I ESP #2 1 5.08 ( 0.00365 1 99.940 2-AP-83 ( 6llO 1 ESP#3 1 4.72 I 0.00333 1 99.939 Average 4.93 0.00380 99.923
I-HS-05 1 8111 1 PJBHiYl 1 0.02545 1 0.00049 1 1-HS-05 1 8lll 1 PJBH #2 1 0.01893 1 0.00049 1 I Average 0.02219 0.00049
I-HS-05 ( 8112 1 ESP#l 1 6.69 1 0.00448 ( 99.942 I-HS-05 [ 8112 1 ESP#2 1 6.35 1 0.00651 I 99.909 l-H&OS 1 8112 I ESP#3 1 6.43 1 0.00298 / 99.959 1 Average 6.49 0.00466 99.928
51
Appendix A. (cont.) Particulate Mass Measurements
TeslID Date Location/ID inlet Mass Outlet Mass Collection (GrlDSCF) (GrlDSCF) Efficiency(%)
l-HS-09 8113 PJBH#l 0.00689 0.00036 1 -l-is-O9 8113 PJBH#2 0.00728 0.00036 Average 0.00709 0.00036
l-HS-09 I 8114 1 ESP#l 1 5.94 1 0.00322 1 99.953 I-HS-09 1 8114 1 ESP#2 1 5.94 1 0.00249 1 99.957 I-HS-OQ 1 8114 1 ESP#3 1 6.23 1 0.00266 1 99.963 Average 6.04 0.00279 99.954
1-HS-10 1 8115 1 PJBH#l 1 0.00667 1 0.00014 1 I-HS-10 1 8115 1 PJBH#2 1 0.01015 1 0.00014 1 Average 0.00841 0.00014
l-HS-IO 1 6116 1 ESP#l 1 6.30 ( 0.00289 1 99.963 l-HS-10 1 8116 1 ESP#2 1 6.52 1 0.00432 1 99.944 I-HS-10 1 8116 ) ESP#3 1 6.44 I 0.00517 I 99.934 Average 6.42 0.00413 99.936
1-HS-06 1 8121 1 ESP #l 1 7.20 1 0.00366 1 99.954 1-HS-06 1 8121 1 ESP#2 1 7.00 1 0.00316 1 99.960 I-HS-06 1 8121 1 ESP#3 1 7.43 I 0.00330 I 99.960 Average 7.21 0.00338 99.953
l-HS-06 1 8122 1 PJBH#l 1 0.00842 1 0.00039 1 I-HS-06 1 8122 1 PJBH#2 ( 0.01020 1 0.00039 1 I Average 0.00931 0.00039
I-HS-04 1 8123 1 ESP#l 1 5.74 1 0.00642 1 99.901 1-HS-04 1 6123 1 ESP#2 1 6.79 I 0.01007 I 99.867 l-HS-04 ( 8123 1 ESP#3 ] 6.74 1 0.01593 1 99.802 Average 6.42 0.01081 99.832
I-HS-02 1 8128 1 PJBH#l ) 0.02641 1 0.00024 1 l-HS-02 1 8128 1 PJBH#2 1 0.02260 1 0.00024 1 I Average 0.02451 0.00024
I-HS-02 1 6129 1 ESP#l 1 8.52 1 0.01714 I 99.812 I-HS-02 1 8129 ( ESP #2 1 7.56 1 0.01782 ) 99.805 I-HS-02 1 8129 1 ESP#3 1 7.95 1 0.02691 I 99.670 Average 8.01 0.02129 99.734
52

Appendix A. (cont.) Particulate Mass Measurements
Test ID Date Location/ID Inlet Mass Outlet Mass Collection (Gr/DSCF) (GrlDSCF) Efficiency(%)
I-HS-01 1 8131 1 PJBH#l 1 0.03637 1 I Average
I-HS-01 1 9102 1 ESPY1 I 6.10 1 0.02640 1 99.608 I-HS-01 1 Q/02 ( ESPW2 1 6.44 1 0.02283 ( 99.696 I-HS-01 1 9102 1 ESP#3 I 6.34 1 0.02894 ( 99.623 Average 6.29 0.02606 99.586
I-HS-03 1 9105 1 ESPY1 1 4.28 1 0.00452 1 99.911 I-HS-03 1 9105 1 ESP#2 1 4.76 1 0.00992 1 99.822 l-HS-03 ( 9105 ( ESPf3 ( 4.72 ( 0.00396 1 99.930 Average 4.59 0.00424 99.908
l-HS-07 ] 9106 1 PJBHWl 1 0.00925 1 0.00025 1 l-HS-07 1 9106 1 PJBH#2 I 0.01548 I 0.00025 1 Average 0.01237 0.00025
l-HS-07 1 9107 1 ESP#l 1 4.41 1 0.00288 1 99.941 I-HS-07 1 9107 ( ESP#2 1 4.93 I 0.00415 1 99.931 l-HS-07 1 9107 1 ESP#3 1 4.72 1 0.00522 1 99.911 Average 4.69 0.00408 99.928
l-HS-08 I 9109 1 ESP#l ( 5.68 1 0.01146 1 99.629 I-HS-08 1 9109 1 ESP#2 1 5.27 1 0.01217 1 99.804 I-HS-08 1 9109 1 ESP#3 1 5.38 ( 0.01180 1 99.817 Average 8.44 0.01182 99.817
I-US-II ( 9110 ( PJBH#l ( 0.00486 1 0.00036 ( I-HS-11 1 9110 1 PJBH#2 1 0.00552 1 0.00038 1 Average 0.00519 0.00038
I-HS-11 1 Q/II 1 ESPWI 1 1.20 1 0.00325 1 99.781 I-HS-11 ( 9111 1 ESP#2 1 7.56 1 0.00274 ( 99.967 I-HS-11 1 9111 1 ESP#3 1 6.47 I 0.00130 ( 99.983 Average 7.01 0.00300 99.957
53