Embed Size (px)
Citation preview
NAS Technical Report; NAS-06-017 September 2006
Performance Comparison of Cray X1 and Cray Opteron Cluster with Other Leading Platforms using HPCC and IMB Benchmarks*
* Published in proceedings of CUG 2006, Lugano, Switzerland, May 8-11, 2006.
Subhash Saini1, Rolf Rabenseifner3, Brian T. N. Gunney2, Thomas E. Spelce2, Alice Koniges2, Don Dossa2, Panagiotis Adamidis3, Robert Ciotti1,
Sunil R. Tiyyagura3, Matthias Müller4, and Rod Fatoohi5
1Advanced Supercomputing Division NASA Ames Research Center
Moffett Field, California 94035, USA {ssaini, ciotti}@nas.nasa.gov
2Lawrence Livermore National Laboratory
Livermore, California 94550, USA {gunney, koniges, dossa1}@llnl.gov
3High-Performance Computing-Center (HLRS) Allmandring 30, D-70550 Stuttgart, Germany
University of Stuttgart {adamidis, rabenseifner, sunil}@hlrs.de
4ZIH, TU Dresden. Zellescher Weg 12, D-01069 Dresden, Germany
5San Jose State University One Washington Square
San Jose, California 95192 [email protected]
Abstract
The HPC Challenge (HPCC) benchmark suite and the Intel MPI Benchmark (IMB) are used to compare and evaluate the combined performance of processor, memory subsystem and interconnect fabric of six leading supercomputers - SGI Altix BX2, Cray X1, Cray Opteron Cluster, Dell Xeon cluster, NEC SX-8, Cray XT3 and IBM Blue Gene/L. These six systems use also six different net-works (SGI NUMALINK4, Cray network, Myrinet, Infini-Band, NEC IXS and IBM Blue Gen/L Torus). The complete set of HPCC benchmarks are run on each of these systems. Additionally, we present Intel MPI Benchmarks (IMB) results to study the performance of 11 MPI communication functions on five of these systems. 1. Introduction: Performance of processor, memory subsystem and inter-connect is a critical factor in the overall performance of computing system and thus the applications running on it. The HPC Challenge (HPCC) benchmark suite is designed to give a picture of overall supercomputer performance including floating point compute power, memory subsys-
tem performance and global network issues [1,2]. In this paper, we use the HPCC suite as a first comparison of sys-tems. Additionally, the message-passing paradigm has become the de facto standard in programming high-end parallel computers. As a result, the performance of a ma-jority of applications depends on the performance of the MPI functions as implemented on these systems. Simple bandwidth and latency tests are two traditional metrics for assessing the performance of the interconnect fabric of the system. However, simple measures of these two are not adequate to predict the performance for real world applica-tions. For instance, traditional methods highlight the per-formance of network by latency using zero byte message sizes and peak bandwidth for a very large message sizes ranging from 1 MB to 4 MB for small systems (typically 32 to 64 processors.) Yet, real world applications tend to send messages ranging from 10 KB to 2 MB using not only point-to-point communication but often with a variety of communication patterns including collective and reduc-tion operations. The recently renamed Intel MPI Benchmarks (IMB, formerly the Pallas MPI Benchmarks) attempt to provide more information than simple tests by including a variety of MPI specific operations [3,4]. In this paper, we have used a subset of these IMB benchmarks that we consider important based on our application workload and report
NAS Technical Report; NAS-06-017 September 2006
the performance results for the five computing systems. Since the systems tested vary in age and cost, our goal is
not to characterize one as “better” than
other, but rather to identify strength and weakness of the underlying hardware and interconnect networks for par-ticular operations. To meet our goal of testing a variety of architectures, we analyze performance on five specific systems: SGI Altix BX2, Cray X1, Cray Opteron Cluster, Dell Xeon cluster, and NEC SX-8 [5, 12] based on own measurements, and additionally Blue/GeneL based on publicly available HPCC data. These systems use six different networks (SGI NUMALINK4, Cray network, Myrinet, InfiniBand, NEC IXS, and Blue/Gene Torus). The complete set of HPC benchmarks are run on each of these systems. Addition-ally, we present IMB 2.3 benchmark results to study the performance of 11 MPI communication functions for vari-ous message sizes. However, in this paper we present results only for the 1 MB message size as average size of the message is about 1 MB in many real world applica-tions. 2. High End Computing Platforms:
A technical description of the architecture of the comput-ing platforms follows. We describe processor details, con-figuration, and memory subsystem and interconnect. 2.1 SGI Altix BX2: The computational node of the SGI Altix BX2 system consists of eight Itanium 2 processors with a memory capacity of 16 GB, and four application specific integrated circuits (ASIC) called SHUB [5]. The processor is a 64-bit and runs at 1.6 GHz clock and can issue two MADD (multiply and add) per clock with a peak performance of 6.4 GFlop/s. The memory hierarchy of a BX2 consists of 128 floating-point registers and three-level-on-chip data caches: (a) 32 KB of L1; (b) 256 KB of L2 cache; (c) 9 MB of L3 cache. In the SGI 3700 BX2 system, eight Intel Itanium 2 proc-essors are grouped together in a brick, also called C–brick, which is connected by NUMALINK4 to another C-brick. Each pair of processors shares a peak bandwidth of 3.2 GB/s. Peak bandwidth between nodes is 800 MB/s in the BX system and 1.6 GB/s in the BX2 system. The density of C-brick used in the BX2 architecture is double the den-sity of C-brick used in the BX architecture. In addition, the peak bandwidth of BX2 is twice the bandwidth of BX ar-chitecture. The SGI BX2 Altix is a Cache Coherent – Non-Uniform Memory Access (CC-NUMA) system. The Altix system uses a NUMAFLEX technology whose key component is NUMALINK4 technology, an embedded interconnect technology that drastically reduces the time and resources required to run applications by managing large data sets in a single, system-wide, shared-memory space called global shared memory. The NUMAFLEX network is a fat-tree topology that enables the performance to scale by provid-
ing a linear increase in bisection bandwidth as the system increases in size. The NUMAFLEX architecture uses Block Transfer Engine to copy data from one physical memory range to another at high bandwidth, which oper-ates as cache-coherent direct memory access engine. Pres-ently, the NUMAFLEX architecture scales to 512 proces-sors in a cache-coherent fashion to make it a SSI system. The SSI system is unique in that it uses a single operating system to control all of its 512 processors, a single shared memory, and the input/output subsystem. Local cache-coherency is used to maintain the cache coherency between processors on the Front Side Bus (FSB). Global cache coherency protocol is implemented by SHUB chip and is a refinement of the protocol used in the DASH computing system developed at Stanford Uni-versity, which is directory based. The advantage of the directory- based cache–coherent protocol is that only the processors that are playing an active role in the usage of a given cache line need to be informed about the operation. This reduces the flow of information, while using about 3% of memory space for the directory of cache dependen-cies. Each Altix BX2 has globally shared memory. It is a single image system (SIS), which means that single mem-ory address space is visible to all the computing system resources. SIS is achieved through a memory interconnect like NUMALINK, XPMEM and Message Passing Toolkit (MPT). It is a Non-Uniform Memory Access Flexible (NUMAflex) system as scaling can be done in all the three dimensions, namely the number of processors, memory capacity and I/O capacity. This NUMAflex architecture supports up to 2048 Intel Itanium 2 processors and four TB of memory capacity. Table 1: Architecture parameters of SGI Altix BX2.
Characteristics SGI Altix BX2 Clock (GHz) 1.6 C-Bricks 64 IX-Bricks 4 Routers 128 Meta Routers 48 CPUs 512 L3 – cache (MB) 9 Memory (Tb) 1 R-Bricks 48
The combination of compute processors, memory, and R-brick constitute the interconnect fabric called NUMA-LINK. SHUB is a proprietary ASIC designed by SGI, fab-ricated by IBM, and handles the functionality, such as (a) global cache coherency protocol; (b) memory controller on
NAS Technical Report; NAS-06-017 September 2006
the local memory on the node; (c) interface to I/O subsys-tem; (d) Interface to the interconnection network with other nodes; (e) globally synchronized high-resolution clock. SGI Altix BX2 3700 uses NUMALINK4, a high-performance network with fat-tree network topology. In fat-tree network topology, the bisection bandwidth scales linearly with the number of processors. Table 1 summa-rizes the characteristics of SGI Altix BX2 system used in the present study [5].
2.2 Cray X1: Cray X1, located at NASA Ames Research Center, has 64 processors [1, 8]. Cray X1 uses best fea-tures of Cray’s parallel vector processor Cray SV1 such as vector caching and multi-streaming and its MPP’s features such as network and high scaling of Cray T3E. It uses proprietary CMOS block, one block each for scalar core and one for each vector pipe. Cray X1 has two types of proprietary processors, namely scalar processor and vector processor. Scalar processor has clock period of 400 MHz (400 Mflop/s, one flop each clock), and can issue 2-way out-of-order instructions. Vector unit has two vector exe-cution pipes each with a clock of 800 MHz. Its vector pipe can perform floating-point operations each clock and there its peak is 1.6 Gflop/s (800 MHz x 2 floating point opera-tions each clock). Peak for vector unit is 3.2 Gflop/s (1.6 Gflop/s x 2 vector pipes). Each node of Cray X1 has four multi-steaming processors (MSP) with a flat-shared mem-ory of 16 GB. Each MSP has four single-stream proces-sors (SSP) and in turn each has two vector pipeline units and one scalar processor. Four SSPs share 2 MB of data E-cache. If a code is not vectorized, it runs on the scalar processor whose speed is 1/8 of the vector processor (400 Mflop/s / 3200 Mflop/s = 1/8). Cray X1 at NASA has 4 nodes (1 node x 4 MSPs x 4 SSPs ) or 64 SSPs. One node (16 SSPs) is used for system purpose and reaming 3 nodes (48 SSPs) are available for computing. 16 memory con-trollers called MChips each of which is connected to local memory bank; called Mbank, control flat memory of 16 GB. These MChips are also used to connect up to four nodes (Four MSPs) and participate in remote address translation. A large system is built by modified torus, called 4D-Hypercube using specialized routing chips [5]. 2.3. Cray Opteron Cluster: A 64 node Cray Opteron cluster, sn7417 is located at NASA Ames Research Center [1, 8]. Each node has two AMD Opteron 2.0 GHz proces-sors. A processor can perform two floating-point opera-tions each clock with a peak performance of 4 Gflop/s. One node is used as the server node with 4 GB of memory. The remaining 63 nodes (126 processors) are used as compute nodes with 2 GB of memory each. 70 GB of disk space are available for I/O. Peak performance of the sys-tem is 504 Gflop/s. The processor uses 0.13 micron copper CMOS process technology. It uses 64-bit technology that is an extension of the x86 32-bit world. It enables simulta-neous 32- and 64 bit computing. It eliminates the 4 GB
memory addressing limit imposed by 32 bit. It has inte-grated memory controller i.e. memory controller is no longer in the Northbridge but instead is on the chip and it reduces the performance bottleneck which in turn in-creases the applications performance by reducing the memory latency. Processor can issue nine superscalar out-of-order instructions. It uses HyperTransport technology, which is a high-speed, high-performance point-to-point link for interconnecting integrated circuits on the mother-board. It also provides multi-processing with a "glue-less" chip to chip interconnect thereby enabling scalability. 64 nodes are interconnected via Myrinet network. Myrinet is a packet-communication and switching technology that is widely used to interconnect servers, or single-board com-puters. Myrinet uses cut-through routing and remote memory direct access (RDMA) to write to/read from the remote memory of other host adaptor cards, called Lanai cards. These cards interface with the PCI-X bus of the host they are attached with. Myrinet offers ready to use 3 8-256 port switches. The 8 and 16 port switches are full cross-bars. [10]
2.4. Dell Xeon Cluster: Linux cluster called Tungsten, located at NCSA, has 1280 nodes running Red Hat Linux 9.0 operating system interconnected with a high-speed InfiniBand (IB) fabric [3, 4]. Each node has two Intel Xeon 3.6 GHz processors with 800 MHz system bus, 12 KB of L1 I-cache, 16 KB of L1 data cache, and 1 MB L2 cache on die is an 8-way set associative. Core used in the processor is called Nocona EM64T [2]. Processor uses 90 nm manufacturing process technologies and is binary compatible with applications running on previous mem-bers of Intel’s IA-32 microprocessor family. It employs Intel’s NetBurst micro-architecture and the Hyper Thread-ing technology. Each node has 6 GB RAM and PCI-X IB card in a 133 MHz slot. Processor can perform one float-ing-point operations each clock with a peak performance of 7.2 Gflop/s. Total peak performance of the system is 9.2 Tflop/s (1280 nodes x 2 CPUs x 3.6 Gflop/s x 1 floating point each clock). The top half and bottom half of the clus-ter are on separate Gb Ethernet switches with a total of 60 GB trunk between. The IB is configured in groups of 18 nodes 1:1 with 3:1 blocking through the core IB switches. There are two versions of MPIs libraries are available. First is VMI2 – NCSA’s own MPI library [http://vmi.ncsa.uiuc.edu] and second one is Topspin MPI. Topspin MPI library is based on MVAPICH and scales only up to 1020 processes. If one desires to use more than 1020 processes one has to use VMI2 based MPI library. Xeon nodes are connected by network called InfiniBand. InfiniBand Architecture (IBA) is a revolutionary and state-of-the-art network technology that defines very high-speed networks for interconnecting compute nodes and I/O nodes [6]. It is an open industry standard for interconnect-
NAS Technical Report; NAS-06-017 September 2006
ing high-performance clusters of SMP (Cluster of IBM POWER 5 or cluster SGI Altix 3700/BX2 or cluster of NEC SX-8) and off-the-shelf processors, such as Intel Ita-nium 2 or Intel Xeon. Besides providing low latency and high bandwidth, IB has many unique features that make it significantly different from current network technologies, such as Quadrics [5,7] and Myrinet [6,7]. We found that MPI level peak bandwidths for Infiniband, Myrinet and Quadrics are 841 MB/s, 771 MB/s (using PCI-X), and 308 MB/s respectively. Minimum latencies for Infiniband, Myrinet and Quadrics are 6.8 us, 6.7 us, and 4.6 us respec-tively [8]. In addition, IA provides several features not provided by Myrinet and Quadrics including: • Remote DMA read and write operations • Five different transport services • Multicast support and support for virtual channels • Different service levels (priority) • Atomic operations In addition, IBA also proposes several other features, such as Quality of Service, fault tolerance, and reconfigu-ration to achieve reliability, availability and serviceability. MPI-2 is an extension of MPI-1 that provides one-sided communication (Get and Put) to access data from a remote processor without involving it, and this can provide over-lap between communication and computation to achieve high performance. Semantics of one-sided communication can be done using remote direct memory access (RDMA) in IBA. Research work in collective operations (all-to-all, broadcast, and reduction) is also in progress. 2.5. NEC SX-8: The processor used in the NEC SX-8 is a proprietary vector processor with a vector peak perform-ance of 16 Gflop/s and an absolute peak of 22 Gflop/s if one includes the additional divide & sqrt pipeline and the scalar units. It has 64 GB/s memory bandwidth per proces-sor and eight vector processors per node. Each node has 512 GB/s memory bandwidth. The entire system can have maximum of 512 nodes (4096 processors: 512 nodes x 8 processors). NEC SX-8 has internodes fully cross bar switch with 16 GB/s (bidirectional) interconnect. A 512-node system would have a peak performance of 65.54 Tflop/s. The vector processor uses 90 nm copper technol-ogy and has 800 I/O per CPUs chip. It uses optical cabling for the internodes connection. HLRS in Stuttgart in Ger-many has recently installed cluster of NEC SX-8 parallel vector computer with 72 nodes and 576 processors. The system consists of a scalar front-end system, and 72 NEC SX-8 nodes. The scalar front-end system is a 16-CPU Ita-nium 2 system, with a very large memory of 256 GB. Each processor of the front end has a large 6 MB L3 cache. The front-end system and the back-end systems share fast file systems. A total of 16 1-TB file systems are used for user homes. Another 16 1-TB file systems contain workspace, which can be used during runtime of jobs. Each file system can sustain 400-600 MB/s throughputs for large block I/O.
The back-end systems are 72 NEC SX-8 vector nodes, each having 8 processors of 16 Gflop/s peak (2 GHz). Each node has 128 GB, about 124 GB of which are usable for applications. The vector systems have a fast intercon-nect called IXS. The IXS is a 128 x 128 crossbar switch. Each individual link has a peak bi-directional bandwidth of 16 BG/s, which means that each node can send and re-ceive with 16 GB/s in each direction. However, it has to be mentioned that the 8 processors inside a node share the bandwidth .MPI latency is around five microseconds for small messages. Each NEC SX-8 processor can access the main memory with 64 GB/s. The system used in the pre-sent study is at High performance Computing center (HLRS), University of Stuttgart, Germany and it has cluster of 72 NEC SX-8 nodes and it uses front end that is a 16-way NEC TX-7 called “Asama.” The operating sys-tem used on the front-end of TX-7 is Red Hat AS 2.1, while NEC SX-8 uses SUPER-UX 15.1. The batch system is called NQS II [5]. 2.6 IBM Blue Gene/L: The Blue Gene project began in 1999 with a five-year timeframe to build a petaflop-class computer that would advance state-of-the-art computer design and software for extremely large-scale systems, as well as advance the state of-the-art scientific simulations required for DOE missions. In November 2001, IBM and DOE forged a partnership and began the research effort to produce a system design. In Nov. 2002, DOE/NNSA gave LLNL approval to proceed with the planned acquisition of BlueGene/L (BG/L) and the first chips were activated in June 2003. In November 2003, a 512-node prototype BG/L system was ranked 73 on the TOP500 list. In June 2004, a 4,096-node system was ranked fourth on the TOP500 list. In November 2004, BG/L was ranked first on the TOP500 list with sustained LINPACK performance of 70.72 Tflop/s running on just one quarter of the final con-figuration [5]. It was realized much earlier that power consumption issues and the large footprint area would limit the tradi-tional approach of large clusters of SMP. To overcome the ever-increasing power required by traditional SMP clus-ters, the embedded processor approach has the advantage of low power and high performance, and the system-on-a-chip IC technology allows dense packaging and less com-plexity. The processor used in BG/L is an IBM PowerPC 440 standard 32-bit processor with enhanced 64-bit float-ing point. The BG/L compute chip has two 700 MHz PPC 440 cores, each with its own dual 64-bit FPU, and was built using 0.13-micron-process technology. It is a two-way superscalar processor issuing two instructions per clock cycle and can perform four floating operations per cycle per processor. Peak performance of each processor is 2.8 Gflop/s (700 MHz * Flop/s * 2 cores) and 5.6 Gflop/s per node as a node of two processors. In fact, it can per-form five operations each clock cycle (4 floating point plus load/store). Peak performance of a fully configured
NAS Technical Report; NAS-06-017 September 2006
BG/L system with 65,536 nodes is 367 Tflop/s (2 Flop/s * 2 cores * 65,536 nodes * 2 processors * 700 MHz). The L1 cache of each PPC 440 is a 64-way set associa-tive, 32 Kbytes cache with a line size of 32 bytes, 4 ele-ments per cache line, i.e. two quad words per cache line, and uses a round-robin replacement policy. The L2 cache acts as a prefetch buffer of 64 L1 cache lines and is shared between the 2 PPC 440 cores. The compute chip has an on-board L3 cache of 4 MB eDRAM, organized as two banks of 8-way sets with simultaneous access to both banks. In addition to the processors and caches, the com-pute chip (11 mm * 11 mm) also contains a DDR memory controller and all of the interconnect logic. A dual-processor node consists of one compute chip and 9 DRAMS. A compute card has two compute chips with peak performance 11.2 Gflop/s and 1.0 GB of memory. A midplane (half cabinet) is only the size of a dishwasher, but it is packed with 1,024 embedded microprocessors housed in an innovative slanted cabinet for cooling and can perform a whopping 2.9 Tflop/s, ranking it as one of the world's fastest supercomputers. A cabinet contains 2 midplanes with a peak performance of 5.6 Tflop/s and memory capacity of 512 GB. BlueGene/L has five independent networks: (a) Three-dimensional Torus with dynamic routing is used for MPI point-to-point communication and provides 2.1 Gbyte/s of aggregate bandwidth per node. It is 64x32x32 for x-y-z connectivity for entire system at LLNL and uses virtual cut-through routing with multi-packet buffering on collision. (b) Global Tree is used for global operations and MPI collective operations. It runs at 350 Mbyte/s per node and supports a subset of MPI reduction operations in hardware.
(c) Global Interrupts and Barriers are used for low la-tency barriers and interrupts. This network can coordinate an MPI barrier call across 65,536 nodes in approximately 5 microseconds. (d) Gigabit Ethernet is used for the file I/O and host in-terface. There are an additional 1,024 I/O nodes using the same hardware, each of which is connected to 64 compute nodes through the global tree. The I/O nodes use a Gigabit Ethernet connection to communicate to the external file system. (e) Control Network is used for booting, job launch, monitoring and diagnostics. It has direct access to any node and access to shared SRAM and performance count-ers. Each job selects one of two modes to run at job launch. In communication co-processor mode, the second CPU on each node is dedicated to controlling the torus and tree networks. The other mode is referred to as virtual node mode and causes each processor in each node to run its own dedicated MPI task. The MPI library takes care to insure cache coherency between the 2 CPUs on each node. A full system has 64 cabinets with a peak performance 360 Tflop/s and memory capacity of 32 TB. The entire system uses only about 1.5 MW of power and has a foot-print area of 2500 square feet. At this time, one half of the final system has been installed at LLNL and has 32,768 processors. In Table 2, the system characteristics of these 6 systems is given. The computing systems we have studied have four types of networks namely, fat-tree, multi-stage cross-bar, 4-dimensional hypercube and torus.
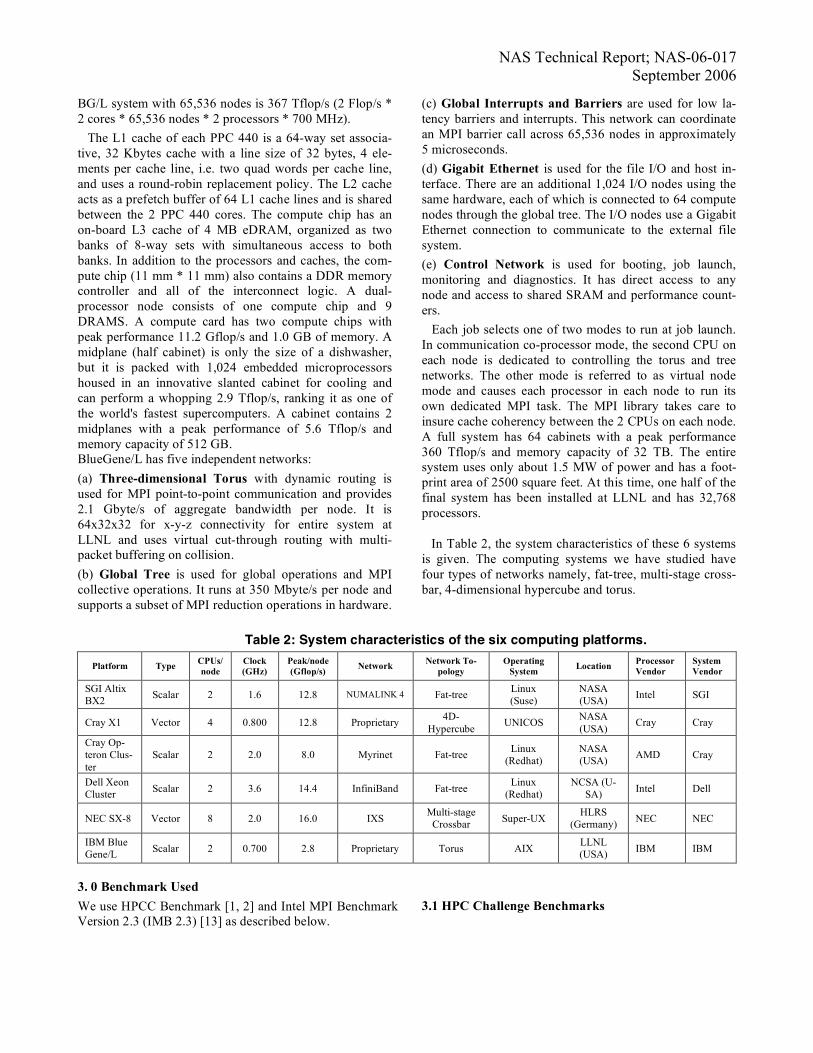
Table 2: System characteristics of the six computing platforms.
Platform Type CPUs/ node
Clock (GHz)
Peak/node (Gflop/s) Network Network To-
pology Operating
System Location Processor Vendor
System Vendor
SGI Altix BX2 Scalar 2 1.6 12.8 NUMALINK 4 Fat-tree Linux
(Suse) NASA (USA) Intel SGI
Cray X1 Vector 4 0.800 12.8 Proprietary 4D-Hypercube UNICOS NASA
(USA) Cray Cray
Cray Op-teron Clus-ter
Scalar 2 2.0 8.0 Myrinet Fat-tree Linux (Redhat)
NASA (USA) AMD Cray
Dell Xeon Cluster Scalar 2 3.6 14.4 InfiniBand Fat-tree Linux
(Redhat) NCSA (U-
SA) Intel Dell
NEC SX-8 Vector 8 2.0 16.0 IXS Multi-stage Crossbar Super-UX HLRS
(Germany) NEC NEC
IBM Blue Gene/L Scalar 2 0.700 2.8 Proprietary Torus AIX LLNL
(USA) IBM IBM
3. 0 Benchmark Used We use HPCC Benchmark [1, 2] and Intel MPI Benchmark Version 2.3 (IMB 2.3) [13] as described below.
3.1 HPC Challenge Benchmarks
NAS Technical Report; NAS-06-017 September 2006
We have used full HPC Challenge [1,2] Benchmarks on SGI Altix BX2, Cray X1, Cray Opteron Cluster, Dell Clus-ter and NEC SX-8. HPC Challenge benchmarks are multi-faceted and provide comprehensive insight into the per-formance of modern high-end computing systems. They are intended to test various attributes that can contribute sig-nificantly to understanding the performance of high-end computing systems. These benchmarks stress not only the processors, but also the memory subsystem and system in-terconnects. They provide a better understanding of an ap-plication’s performance on the computing systems and are better indicators of how high-end computing systems will perform across a wide spectrum of real-world applications.
G-HPL: The High Performance Linpack benchmark meas-ures the performance of solving a dense linear equation system. Linpack is the basis of the Top500 list. [20] G-PTRANS: Parallel-matrix transpose benchmark meas-ures the system performance [25]. It implements a paral-lel-matrix transpose given by A = A + B^T, where A and B are two matrices. This benchmark exercises the commu-nications of the computer heavily where pairs of proces-sors communicate with each other simultaneously. It measures the total communications capacity of the net-work. G-Random Access: This benchmark also measures the system performance. It measures the rate at which the computer can update pseudo-random locations of its memory. Performance is measured in terms of giga-updates per second (GUP/s) [26]. EP-Stream: An embarrassingly parallel STREAM benchmark is a synthetic benchmark program that meas-ures sustainable memory bandwidth (in GB/s) and the cor-responding computation rate for simple vector kernels [21]. All the computational nodes execute the benchmark at the same time, and the arithmetic average is reported. It measures the performance of a memory subsystem. G-FFTE: Global Fast Fourier Transform benchmark measures the system performance [24]. It performs FFTE across the entire computer by distributing the input vector in block fashion across all the nodes. It measures the float-ing-point rate of execution of double-precision, complex Discrete Fourier Transform (DFT). Performance is meas-ured in Gflop/s. EP-DGEMM: Embarrassingly parallel DGEMM meas-ures the floating-point rate of execution of double preci-sion real matrix-matrix multiplication performed by DGEMM subroutine from BLAS [22,23]. All the nodes simultaneously execute the benchmark at the same time. It reports only the average rate in Gflop/s. Random Ring Bandwidth: Randomly Ordered Ring bandwidth reports bandwidth achieved per CPU in the ring communication pattern. The communicating nodes are ordered randomly in the ring. The result (in GB/s per
CPU) is averaged over various random assignments of rings, i.e., various permutations of the sequence of all processors in the communicator [2,14]. Random Ring Latency: Randomly Ordered Ring Latency reports latency (in microseconds) in the ring communica-tion pattern. The communicating nodes are ordered ran-domly in the ring. The result is averaged over various ran-dom rings [2,14]. 3.2 Intel MPI Benchmarks IMB 2.3 is a successor of PALLAS PAM from Pallas GmbH 2.2 [9]. In September 2003, the HPC division of Pallas merged with Intel Corp. IMB 2.3 suite is very popu-lar among high performance computing community to measure the performance of important MPI functions. Benchmarks are written in ANSI C using message-passing paradigm comprising 10,000 lines of code. The IMB 2.0 version has three parts (a) IMB for MPI-1, (b) MPI-2 one sided communication, and (c) MPI-2 I/O. In standard mode, size of messages can be 0,1, 2, 4, 8, … 4194304 bytes. There are three classes of benchmarks, namely sin-gle transfer, parallel transfer and collective benchmarks. 3.2.1 Single Transfer Benchmarks (STB): STB bench-marks focus on a single message transferred between two processes. These are two benchmarks in this category namely Ping-Pong and Ping-Ping. a. Ping-Pong: In a Ping-Pong, a single message is sent between two processes. Process 1 sends a message of size “x” to process 2 and process 2 sends “x” back to process 1. b. Ping-Ping: Ping-Ping is same as Ping-Pong except that messages are obstructed by oncoming messages. 3.2.2 Parallel Transfer Benchmarks (PTB): PTB focus on patterns and activity at a certain process in concurrency with other processes. a. Sendrecv: The processes form a periodic communi-cation. Here each process sends a message to the right and received from the left in the chain. b. Exchange: Here process exchanges data with both left and right in the chain. This communication pattern is used in applications such unstructured adaptive mesh refine-ment computational fluid dynamics involving boundary exchanges. 3.2.3 Collective Benchmarks (CB): The CBs are collec-tive in the sense that all the processes take place collec-tively in the proper MPI convention. They test not only the message passing power of the computing system but also the algorithms used underneath, e.g., reductions bench-marks measure the message passing tests as well as effi-ciency of the algorithms used in implementing them. As the name implies, collective communications refers to those MPI functions involving the processors within a defined communicator group. Collective communications are mostly built around point-to-point communications.
NAS Technical Report; NAS-06-017 September 2006
Several features distinguish collective communications from point-to-point communications. a. A collective operation requires that all processes within the communicator group call the same collective commu-nication function with matching arguments. b. The size of data sent must exactly match the size of data received. In point-to-point communications, a sender buffer may be smaller than the receiver buffer. In collec-tive communications they must be the same. c. Except for explicit synchronization routines such as MPI_Barrier, MPI collective communication functions are not synchronizing functions. d. Collective communications exist in blocking mode only, i.e., a process will block until its role in the collec-tive communication is complete, no matter what the com-pletion status is of the other participating in the communi-cations. e. Collective operations do not use the tag field. They are matched according to the order they are executed. Collective communications are divided into three cate-gories according to function: synchronization, data move-ment, and global reduction operations 3.2.3.1 Barrier Synchronization: A barrier function MPI_Barrier is used to synchronize all processes. A process calling this function blocks until all the processes in the communicator group have called this function. Then they all proceed. Each process waits till all processes reach this point before proceeding further. 3.2.3.2 Data Movement: MPI provides several types of routines for handling collective data movement: a. Broadcast: Broadcast from one processor to all mem-bers of the communicator. The function MPI_Bcast broad-casts a message from process root to all other processes in the communicator group communicator including it. b. Gather: To collect data from all members in the group to one processor. When called by every process, each process sends the contents of its send buffer to the root process, which then receives those messages and stores them in its receive buffer according to the rank order of the sender. A variation of MPI_Gather called MPI_Allgather works the same way except that all the processes in the communicator receive the result, not only the root. MPI_Allgather can be thought of as an MPI_Gather operation followed by MPI_Bcast by the root to all processes. c. Scatter: To scatter data from one member to all mem-bers of the group. The function MPI_Scatter performs the reverse operation of the function MPI_Gather described above d. Variations of Gather and Scatter:
Allgather: It is a benchmark of MPI_ALLgather function. Here every process inputs A bytes and receives the gath-ered A*N bytes, where N is number of processes. Allgatherv: It has same functionality as MPI_ALLgather function, except that it uses MPI_ALLgatherv function. It measures the MPI overhead for more complex situations compared to MPI_ALLgather function. In fact, it is vector variant of MPI_ALLgather. Alltoall: It is a benchmark of MPI_Alltoall function. Here every process inputs A*N bytes and receives A*N bytes (A bytes for each process), where N is number of processes. It stresses the network of the system and is key to good per-formance of applications such as spectral methods, signal processing and climate modeling using Fast Fourier Trans-forms (FFT) typical. The function MPI_Alltoall works like MPI_Allgather, except that each process sends a distinct data to each of the receivers. This routine is very helpful for transposing a matrix that is distributed among several processors. This is useful when transposing a distributed matrix.
3.2.3.4 Global Reduction: The MPI global reduction functions perform a global reduce operation across all members of the communicator group. The result can be the sum, maximum, etc. (depending on the operation se-lected) across all processor contributions. The MPI stan-dards define set of predefined operations that can be used and also provide tools for programmers to define their own reduce operations. Global reductions are important for vector vector norms and time step sizes in time-dependent simulations. Reduce: Each processor provides A numbers. The global result, stored at the root processor is also A numbers. The number A[i] is the results of all the A[i] from the N proc-essors. Allreduce: MPI_Allreduce is similar to MPI_Reduce ex-cept that all members of the communicator group receive the reduced result. It is combinations of reduce and broad-cast and the final result is available on all the processes. It is equivalent to calling MPI_Reduce followed by MPI_Bcast by the root to all members. Reduce_scatter: The outcome of this operation is the same as an MPI Reduce operation followed by an MPI Scatter.
4.0 Results
In this section we first present results of HPC Challenge and IMB benchmarks for five supercomputers (without Blue/Gene). In the last section we compare Blue/Gene with other systems based on the publicly available HPCC database.
4.1 HPC Challenge Benchmarks:
NAS Technical Report; NAS-06-017 September 2006
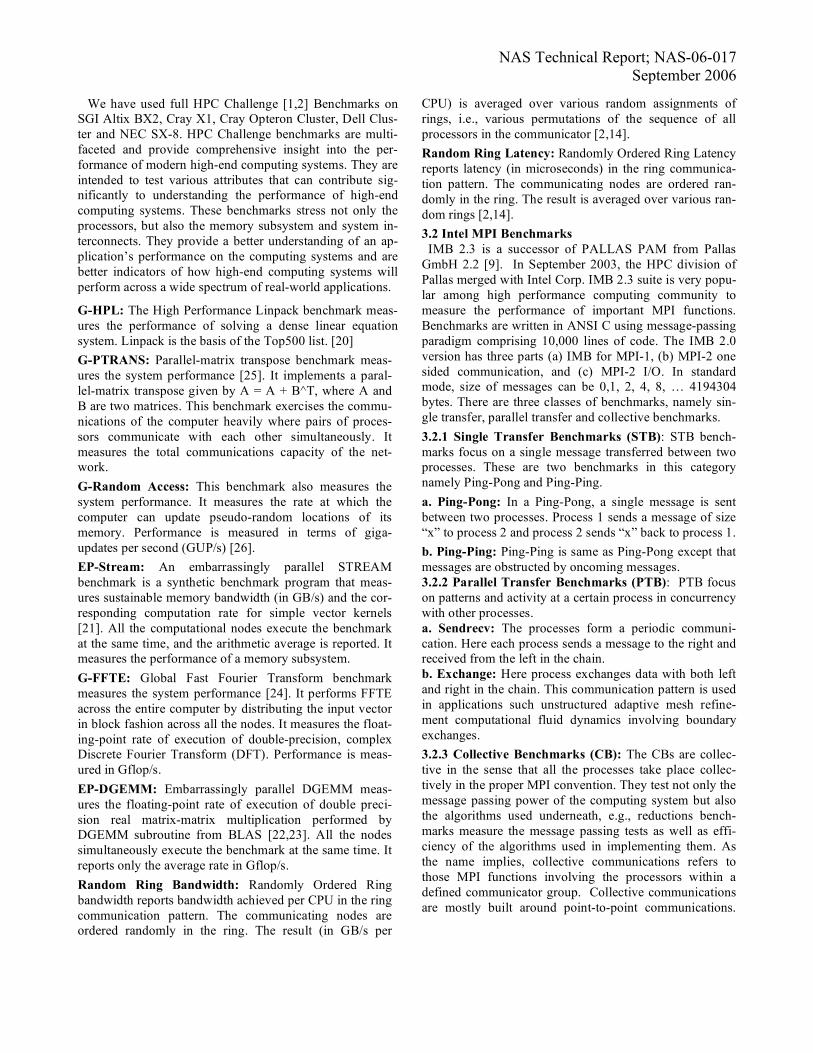
4.1.1 Balance of Communication to Computation: For multi-purpose HPC systems, the balance of proces-sor speed, along with memory, communication, and I/O bandwidth is important. In this section, we analyze the ratio of inter-node communication bandwidth to the com-putational speed. To characterize the communication bandwidth between SMP nodes, we use the random ring bandwidth, because for a large number of SMP nodes, most MPI processes will communicate with MPI processes on other SMP nodes. This means, with 8 or more SMP nodes, the random ring bandwidth reports the available inter-node communication bandwidth per MPI process. Although the balance is calculated based on MPI proc-esses, its value should be in principle independent of the programming model, i.e., whether each SMP node is used with several single-threaded MPI processes, or some (or even one process) multi-threaded MPI processes, as long as the number of MPI processes on each SMP node is large enough that they altogether are able to saturate the inter-node network [5]. Fig.1 shows the scaling of the ac-cumulated random ring performance with the computa-tional speed. To compare measurements with different numbers of CPUs and on different architectures, all data is presented based on the computational performance ex-pressed by the Linpack HPL value. The HPCC random ring bandwidth was multiplied by the number of MPI processes. The computational speed is benchmarked with HPL.
0.1
1
10
100
1000
0.001 0.01 0.1 1 10
Linpack (HPL) TFlop/s
Accu
mu
late
d R
an
dR
ing
Ban
dw
idth
GB
yte
/s
NEC SX8 32-
576 cpus
Cray Opteron
4-64 cpus
SGI Altix
Numalink3
64-440 cpus
SGI Altix
Numalink4
64-2024 cpus
Figure 1: Accumulated Random Ring Bandwidth versus HPL performance.
10
100
1000
0.001 0.01 0.1 1 10
Linpack(HPL) TFlop/s
Accu
mu
late
d R
an
do
m R
ing
Ban
dw
idth
/
Lin
pack H
PL
(G
Byte
/s / T
Flo
ps/s
) NEC SX8 32-
576 cpus
Cray Opteron
4-64 cpus
SGI Altix
Numalink3
64-440 cpus
SGI Altix
Numalink4
64-2024 cpus
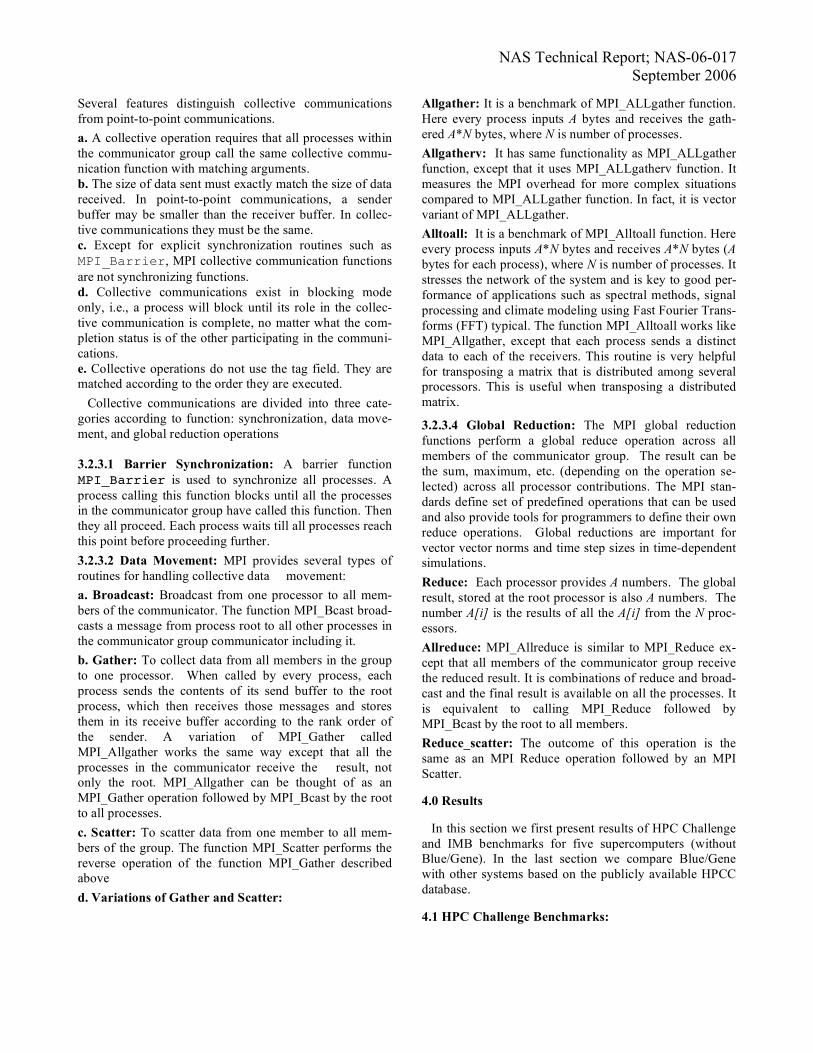
Figure 2: Accumulated Random Ring Bandwidth ratio versus HPL performance. The diagram in Fig. 1 shows absolute communication bandwidth, whereas the diagram in Fig. 2 plots the ratio of communication to computation speed. Better scaling with the size of the system is expressed by less decreasing of the ratio plotted in Fig. 2. A strong decrease can be ob-served in the case of Cray Opteron, especially between 32 CPUs and 64 CPUs. NEC SX-8 system scales well which can be noted by only a slight inclination of the curve. In case of SGI Altix, it is worth noting the difference in the ratio between Numalink3 and Numalink4 interconnects within the same box (512 CPUs). Though the theoretical peak bandwidth between Numalink3 and Numalink4 has only doubled, Random Ring performance improves by a factor of 4 for runs up to 256 processors. A steep decrease in the B/KFlop value for SGI Altix with Numalink4 is observed above 512 CPUS runs (203.12 B/KFlop for 506 CPUs to 23.18 B/KFlop for 2024 CPUs). This can also be noticed from the cross over of the ratio curves between Altix and the NEC SX-8. Whereas with Numalink3 it is 93.81 (440 CPUs) when run within the same box. For the NEC SX-8, B/Kflop is 59.64 (576 CPUs), which is consis-tent between 128 and 576 CPUs runs. For the Cray Op-teron it is 24.41 (64 CPUs).
0.001
0.01
0.1
1
10
100
0.001 0.01 0.1 1 10
Linpack(HPL) TFlop/s
Accu
mu
late
d E
P S
tream
Co
py T
Byte
/s
NEC SX8 32-
576 cpus
Cray Opteron
4-64 cpus
SGI Altix
Numalink3
64-440 cpus
SGI Altix
Numalink4
64-2024 cpus
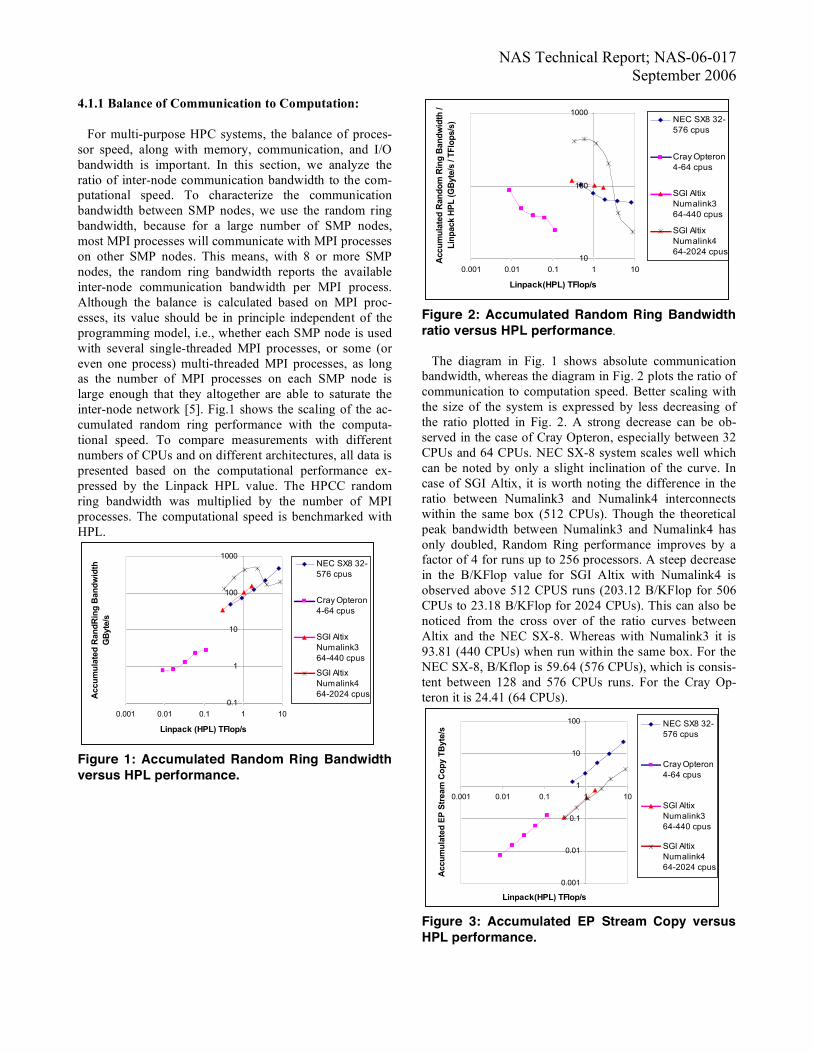
Figure 3: Accumulated EP Stream Copy versus HPL performance.
NAS Technical Report; NAS-06-017 September 2006
0.1
1
10
0.001 0.01 0.1 1 10
Linpack(HPL) TFlop/s
Accu
mu
late
d E
P S
tream
Co
py / L
inp
ack
HP
L (
TB
yte
/s / T
Flo
p/s
)
NEC SX8 32-
576 cpus
Cray Opteron
4-64 cpus
SGI Altix
Numalink3
64-440 cpus
SGI Altix
Numalink4
64-2024 cpus
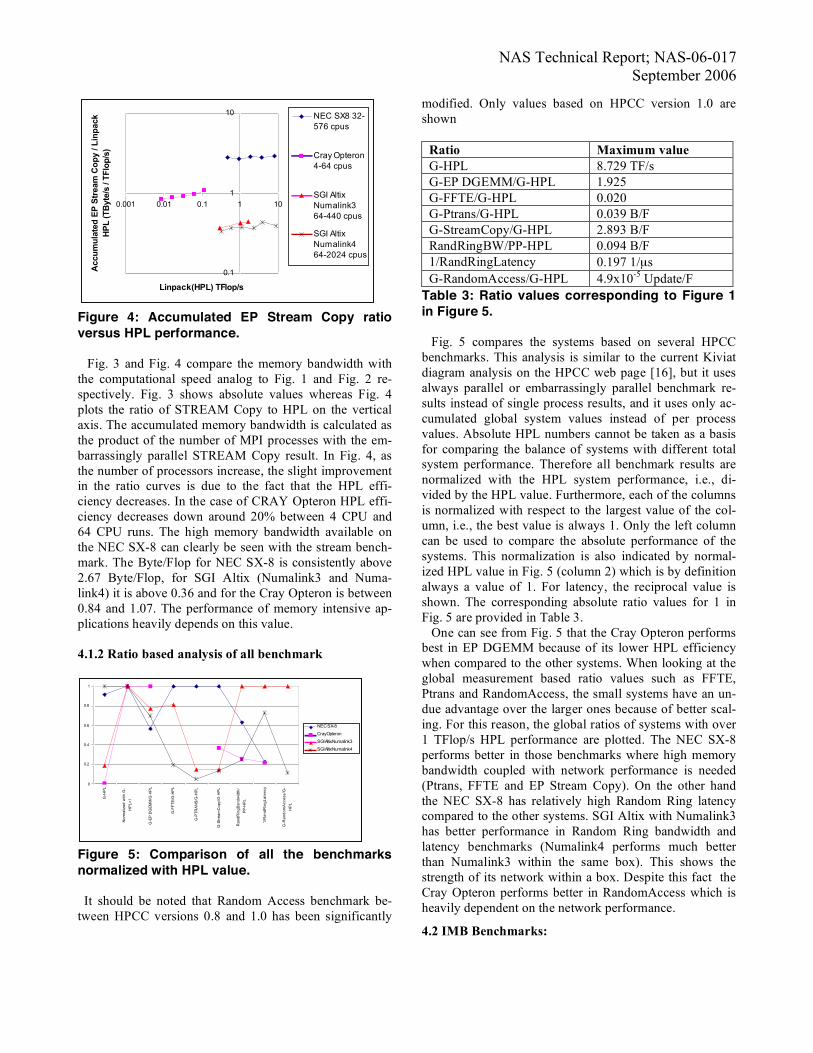
Figure 4: Accumulated EP Stream Copy ratio versus HPL performance. Fig. 3 and Fig. 4 compare the memory bandwidth with the computational speed analog to Fig. 1 and Fig. 2 re-spectively. Fig. 3 shows absolute values whereas Fig. 4 plots the ratio of STREAM Copy to HPL on the vertical axis. The accumulated memory bandwidth is calculated as the product of the number of MPI processes with the em-barrassingly parallel STREAM Copy result. In Fig. 4, as the number of processors increase, the slight improvement in the ratio curves is due to the fact that the HPL effi-ciency decreases. In the case of CRAY Opteron HPL effi-ciency decreases down around 20% between 4 CPU and 64 CPU runs. The high memory bandwidth available on the NEC SX-8 can clearly be seen with the stream bench-mark. The Byte/Flop for NEC SX-8 is consistently above 2.67 Byte/Flop, for SGI Altix (Numalink3 and Numa-link4) it is above 0.36 and for the Cray Opteron is between 0.84 and 1.07. The performance of memory intensive ap-plications heavily depends on this value. 4.1.2 Ratio based analysis of all benchmark
0
0.2
0.4
0.6
0.8
1
G-H
PL
No
rma
lize
d w
ith
G-
HP
L=
1
G-E
P D
GE
MM
/G-H
PL
G-F
FT
E/G
-HP
L
G-P
TR
AN
S/G
-HP
L
G-S
tre
am
Co
py/G
-HP
L
Ra
nd
Rin
gB
an
dw
idth
/
PP
-HP
L
1/R
an
dR
ing
La
ten
cy
G-R
an
do
mA
cce
ss/G
-
HP
L
NEC SX-8
Cray Opteron
SGI Altix Numalink3
SGI Altix Numalink4
Figure 5: Comparison of all the benchmarks normalized with HPL value. It should be noted that Random Access benchmark be-tween HPCC versions 0.8 and 1.0 has been significantly
modified. Only values based on HPCC version 1.0 are shown
Ratio Maximum value G-HPL 8.729 TF/s G-EP DGEMM/G-HPL 1.925 G-FFTE/G-HPL 0.020 G-Ptrans/G-HPL 0.039 B/F G-StreamCopy/G-HPL 2.893 B/F RandRingBW/PP-HPL 0.094 B/F 1/RandRingLatency 0.197 1/µs G-RandomAccess/G-HPL 4.9x10⁻⁵ Update/F
Table 3: Ratio values corresponding to Figure 1 in Figure 5. Fig. 5 compares the systems based on several HPCC benchmarks. This analysis is similar to the current Kiviat diagram analysis on the HPCC web page [16], but it uses always parallel or embarrassingly parallel benchmark re-sults instead of single process results, and it uses only ac-cumulated global system values instead of per process values. Absolute HPL numbers cannot be taken as a basis for comparing the balance of systems with different total system performance. Therefore all benchmark results are normalized with the HPL system performance, i.e., di-vided by the HPL value. Furthermore, each of the columns is normalized with respect to the largest value of the col-umn, i.e., the best value is always 1. Only the left column can be used to compare the absolute performance of the systems. This normalization is also indicated by normal-ized HPL value in Fig. 5 (column 2) which is by definition always a value of 1. For latency, the reciprocal value is shown. The corresponding absolute ratio values for 1 in Fig. 5 are provided in Table 3. One can see from Fig. 5 that the Cray Opteron performs best in EP DGEMM because of its lower HPL efficiency when compared to the other systems. When looking at the global measurement based ratio values such as FFTE, Ptrans and RandomAccess, the small systems have an un-due advantage over the larger ones because of better scal-ing. For this reason, the global ratios of systems with over 1 TFlop/s HPL performance are plotted. The NEC SX-8 performs better in those benchmarks where high memory bandwidth coupled with network performance is needed (Ptrans, FFTE and EP Stream Copy). On the other hand the NEC SX-8 has relatively high Random Ring latency compared to the other systems. SGI Altix with Numalink3 has better performance in Random Ring bandwidth and latency benchmarks (Numalink4 performs much better than Numalink3 within the same box). This shows the strength of its network within a box. Despite this fact the Cray Opteron performs better in RandomAccess which is heavily dependent on the network performance.
4.2 IMB Benchmarks:
NAS Technical Report; NAS-06-017 September 2006
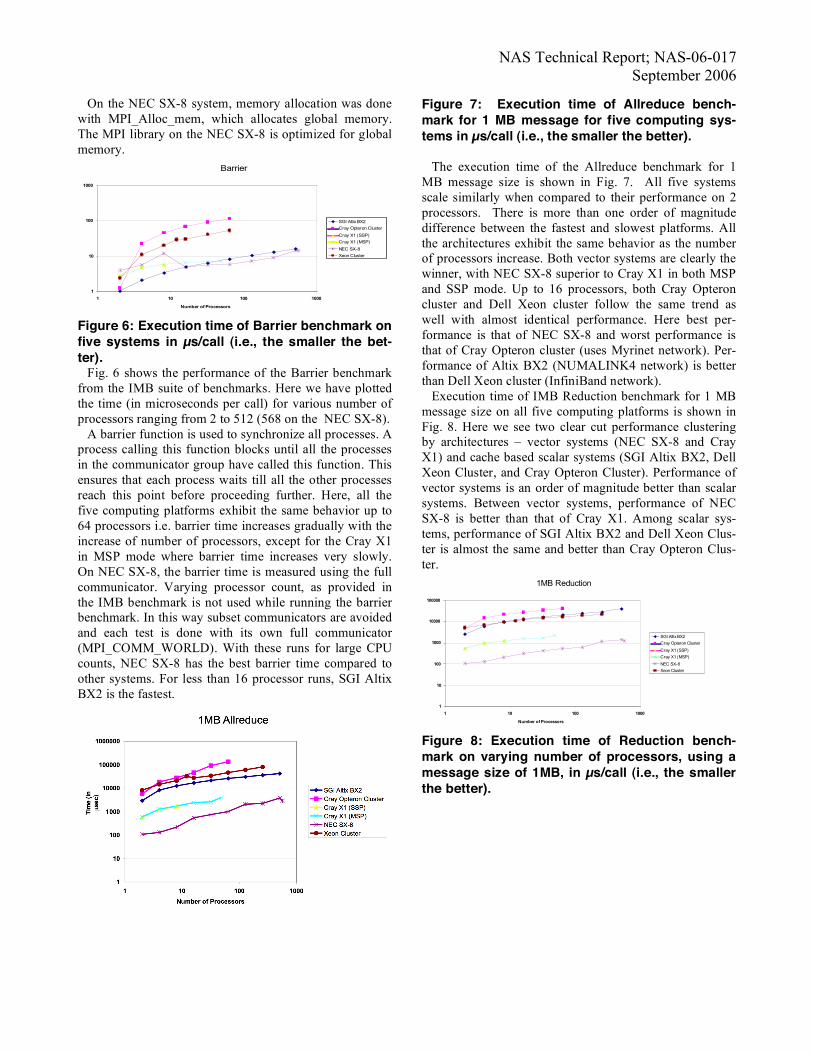
On the NEC SX-8 system, memory allocation was done with MPI_Alloc_mem, which allocates global memory. The MPI library on the NEC SX-8 is optimized for global memory.
Barrier
1
10
100
1000
1 10 100 1000
Number of Processors
SGI Altix BX2
Cray Opteron Cluster
Cray X1 (SSP)
Cray X1 (MSP)
NEC SX-8
Xeon Cluster
Figure 6: Execution time of Barrier benchmark on five systems in µs/call (i.e., the smaller the bet-ter). Fig. 6 shows the performance of the Barrier benchmark from the IMB suite of benchmarks. Here we have plotted the time (in microseconds per call) for various number of processors ranging from 2 to 512 (568 on the NEC SX-8). A barrier function is used to synchronize all processes. A process calling this function blocks until all the processes in the communicator group have called this function. This ensures that each process waits till all the other processes reach this point before proceeding further. Here, all the five computing platforms exhibit the same behavior up to 64 processors i.e. barrier time increases gradually with the increase of number of processors, except for the Cray X1 in MSP mode where barrier time increases very slowly. On NEC SX-8, the barrier time is measured using the full communicator. Varying processor count, as provided in the IMB benchmark is not used while running the barrier benchmark. In this way subset communicators are avoided and each test is done with its own full communicator (MPI_COMM_WORLD). With these runs for large CPU counts, NEC SX-8 has the best barrier time compared to other systems. For less than 16 processor runs, SGI Altix BX2 is the fastest.
Figure 7: Execution time of Allreduce bench-mark for 1 MB message for five computing sys-tems in µs/call (i.e., the smaller the better). The execution time of the Allreduce benchmark for 1 MB message size is shown in Fig. 7. All five systems scale similarly when compared to their performance on 2 processors. There is more than one order of magnitude difference between the fastest and slowest platforms. All the architectures exhibit the same behavior as the number of processors increase. Both vector systems are clearly the winner, with NEC SX-8 superior to Cray X1 in both MSP and SSP mode. Up to 16 processors, both Cray Opteron cluster and Dell Xeon cluster follow the same trend as well with almost identical performance. Here best per-formance is that of NEC SX-8 and worst performance is that of Cray Opteron cluster (uses Myrinet network). Per-formance of Altix BX2 (NUMALINK4 network) is better than Dell Xeon cluster (InfiniBand network). Execution time of IMB Reduction benchmark for 1 MB message size on all five computing platforms is shown in Fig. 8. Here we see two clear cut performance clustering by architectures – vector systems (NEC SX-8 and Cray X1) and cache based scalar systems (SGI Altix BX2, Dell Xeon Cluster, and Cray Opteron Cluster). Performance of vector systems is an order of magnitude better than scalar systems. Between vector systems, performance of NEC SX-8 is better than that of Cray X1. Among scalar sys-tems, performance of SGI Altix BX2 and Dell Xeon Clus-ter is almost the same and better than Cray Opteron Clus-ter.
1MB Reduction
1
10
100
1000
10000
100000
1 10 100 1000
Number of Processors
SGI Altix BX2
Cray Opteron Cluster
Cray X1 (SSP)
Cray X1 (MSP)
NEC SX-8
Xeon Cluster
Figure 8: Execution time of Reduction bench-mark on varying number of processors, using a message size of 1MB, in µs/call (i.e., the smaller the better).
NAS Technical Report; NAS-06-017 September 2006
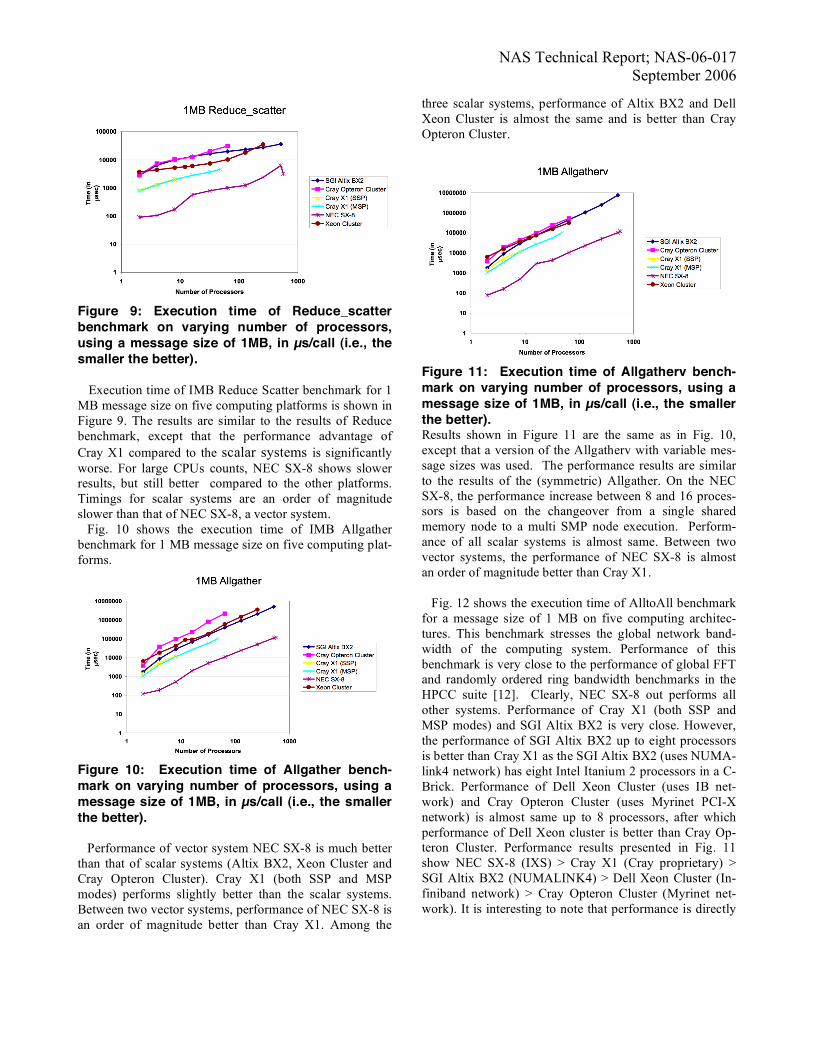
Figure 9: Execution time of Reduce_scatter benchmark on varying number of processors, using a message size of 1MB, in µs/call (i.e., the smaller the better). Execution time of IMB Reduce Scatter benchmark for 1 MB message size on five computing platforms is shown in Figure 9. The results are similar to the results of Reduce benchmark, except that the performance advantage of Cray X1 compared to the scalar systems is significantly worse. For large CPUs counts, NEC SX-8 shows slower results, but still better compared to the other platforms. Timings for scalar systems are an order of magnitude slower than that of NEC SX-8, a vector system. Fig. 10 shows the execution time of IMB Allgather benchmark for 1 MB message size on five computing plat-forms.
Figure 10: Execution time of Allgather bench-mark on varying number of processors, using a message size of 1MB, in µs/call (i.e., the smaller the better). Performance of vector system NEC SX-8 is much better than that of scalar systems (Altix BX2, Xeon Cluster and Cray Opteron Cluster). Cray X1 (both SSP and MSP modes) performs slightly better than the scalar systems. Between two vector systems, performance of NEC SX-8 is an order of magnitude better than Cray X1. Among the
three scalar systems, performance of Altix BX2 and Dell Xeon Cluster is almost the same and is better than Cray Opteron Cluster.
Figure 11: Execution time of Allgatherv bench-mark on varying number of processors, using a message size of 1MB, in µs/call (i.e., the smaller the better). Results shown in Figure 11 are the same as in Fig. 10, except that a version of the Allgatherv with variable mes-sage sizes was used. The performance results are similar to the results of the (symmetric) Allgather. On the NEC SX-8, the performance increase between 8 and 16 proces-sors is based on the changeover from a single shared memory node to a multi SMP node execution. Perform-ance of all scalar systems is almost same. Between two vector systems, the performance of NEC SX-8 is almost an order of magnitude better than Cray X1. Fig. 12 shows the execution time of AlltoAll benchmark for a message size of 1 MB on five computing architec-tures. This benchmark stresses the global network band-width of the computing system. Performance of this benchmark is very close to the performance of global FFT and randomly ordered ring bandwidth benchmarks in the HPCC suite [12]. Clearly, NEC SX-8 out performs all other systems. Performance of Cray X1 (both SSP and MSP modes) and SGI Altix BX2 is very close. However, the performance of SGI Altix BX2 up to eight processors is better than Cray X1 as the SGI Altix BX2 (uses NUMA-link4 network) has eight Intel Itanium 2 processors in a C-Brick. Performance of Dell Xeon Cluster (uses IB net-work) and Cray Opteron Cluster (uses Myrinet PCI-X network) is almost same up to 8 processors, after which performance of Dell Xeon cluster is better than Cray Op-teron Cluster. Performance results presented in Fig. 11 show NEC SX-8 (IXS) > Cray X1 (Cray proprietary) > SGI Altix BX2 (NUMALINK4) > Dell Xeon Cluster (In-finiband network) > Cray Opteron Cluster (Myrinet net-work). It is interesting to note that performance is directly
NAS Technical Report; NAS-06-017 September 2006
proportional to the randomly ordered ring bandwidth, which is related with the cost of the global network.
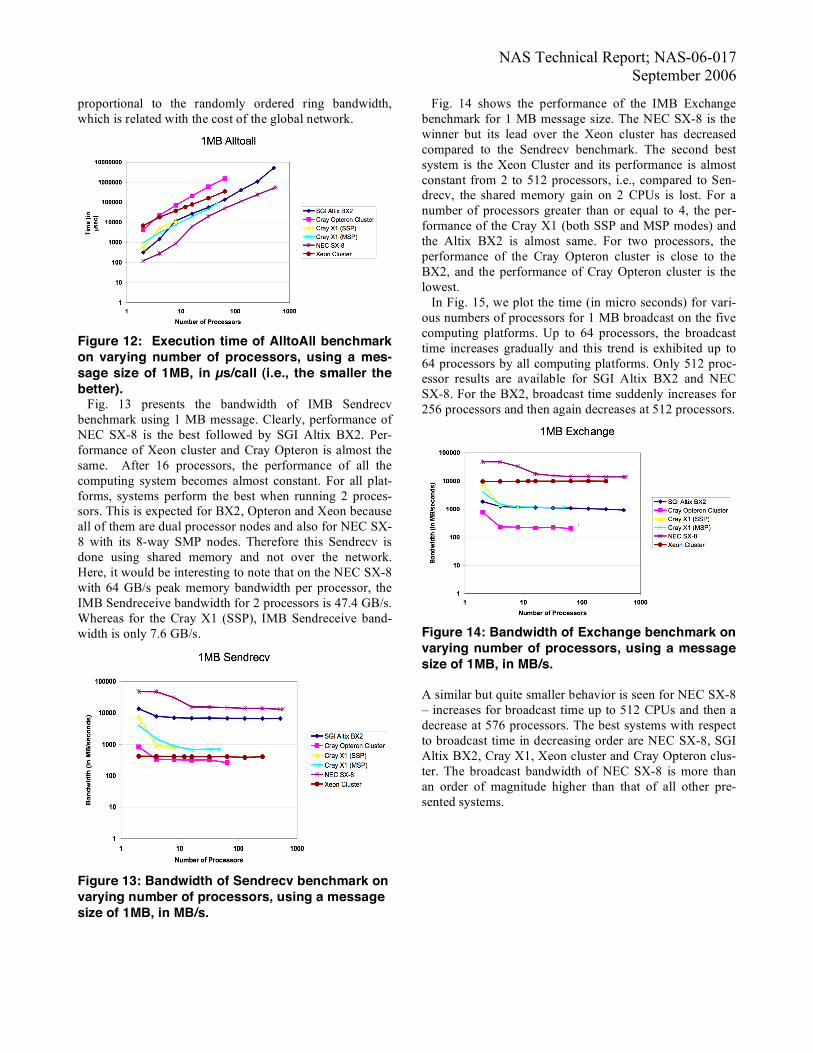
Figure 12: Execution time of AlltoAll benchmark on varying number of processors, using a mes-sage size of 1MB, in µs/call (i.e., the smaller the better). Fig. 13 presents the bandwidth of IMB Sendrecv benchmark using 1 MB message. Clearly, performance of NEC SX-8 is the best followed by SGI Altix BX2. Per-formance of Xeon cluster and Cray Opteron is almost the same. After 16 processors, the performance of all the computing system becomes almost constant. For all plat-forms, systems perform the best when running 2 proces-sors. This is expected for BX2, Opteron and Xeon because all of them are dual processor nodes and also for NEC SX-8 with its 8-way SMP nodes. Therefore this Sendrecv is done using shared memory and not over the network. Here, it would be interesting to note that on the NEC SX-8 with 64 GB/s peak memory bandwidth per processor, the IMB Sendreceive bandwidth for 2 processors is 47.4 GB/s. Whereas for the Cray X1 (SSP), IMB Sendreceive band-width is only 7.6 GB/s.
Figure 13: Bandwidth of Sendrecv benchmark on varying number of processors, using a message size of 1MB, in MB/s.
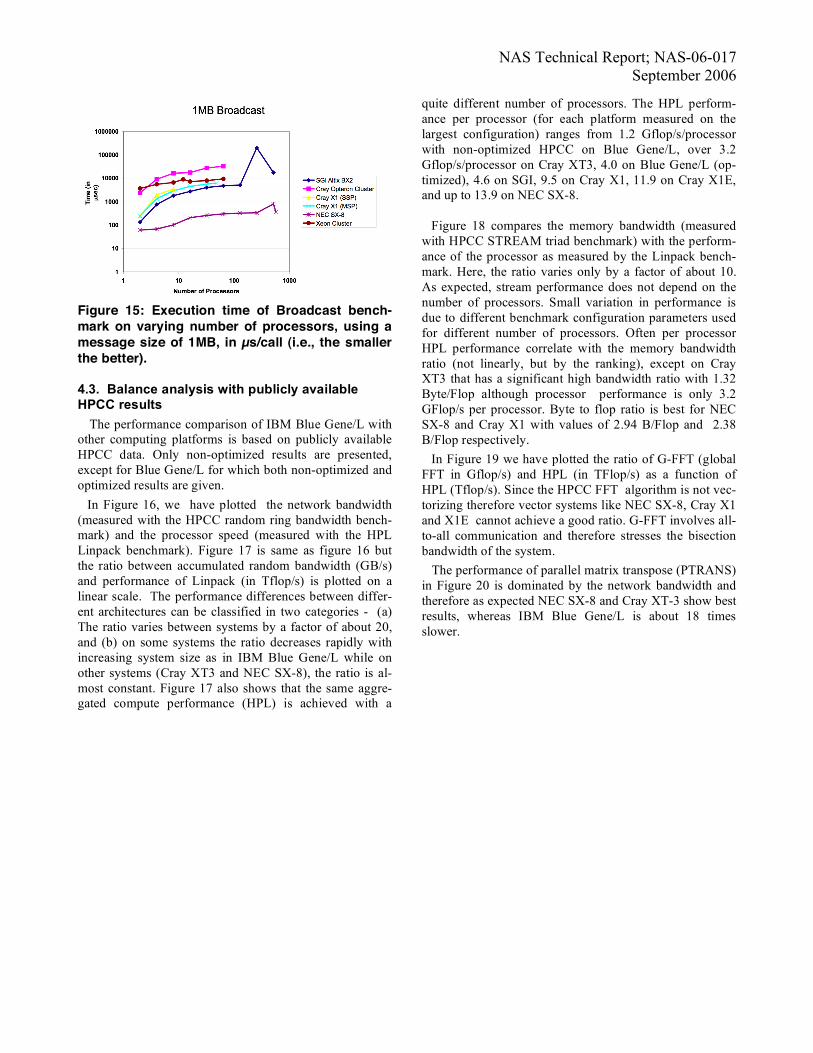
Fig. 14 shows the performance of the IMB Exchange benchmark for 1 MB message size. The NEC SX-8 is the winner but its lead over the Xeon cluster has decreased compared to the Sendrecv benchmark. The second best system is the Xeon Cluster and its performance is almost constant from 2 to 512 processors, i.e., compared to Sen-drecv, the shared memory gain on 2 CPUs is lost. For a number of processors greater than or equal to 4, the per-formance of the Cray X1 (both SSP and MSP modes) and the Altix BX2 is almost same. For two processors, the performance of the Cray Opteron cluster is close to the BX2, and the performance of Cray Opteron cluster is the lowest. In Fig. 15, we plot the time (in micro seconds) for vari-ous numbers of processors for 1 MB broadcast on the five computing platforms. Up to 64 processors, the broadcast time increases gradually and this trend is exhibited up to 64 processors by all computing platforms. Only 512 proc-essor results are available for SGI Altix BX2 and NEC SX-8. For the BX2, broadcast time suddenly increases for 256 processors and then again decreases at 512 processors.
Figure 14: Bandwidth of Exchange benchmark on varying number of processors, using a message size of 1MB, in MB/s. A similar but quite smaller behavior is seen for NEC SX-8 – increases for broadcast time up to 512 CPUs and then a decrease at 576 processors. The best systems with respect to broadcast time in decreasing order are NEC SX-8, SGI Altix BX2, Cray X1, Xeon cluster and Cray Opteron clus-ter. The broadcast bandwidth of NEC SX-8 is more than an order of magnitude higher than that of all other pre-sented systems.
NAS Technical Report; NAS-06-017 September 2006
Figure 15: Execution time of Broadcast bench-mark on varying number of processors, using a message size of 1MB, in µs/call (i.e., the smaller the better).
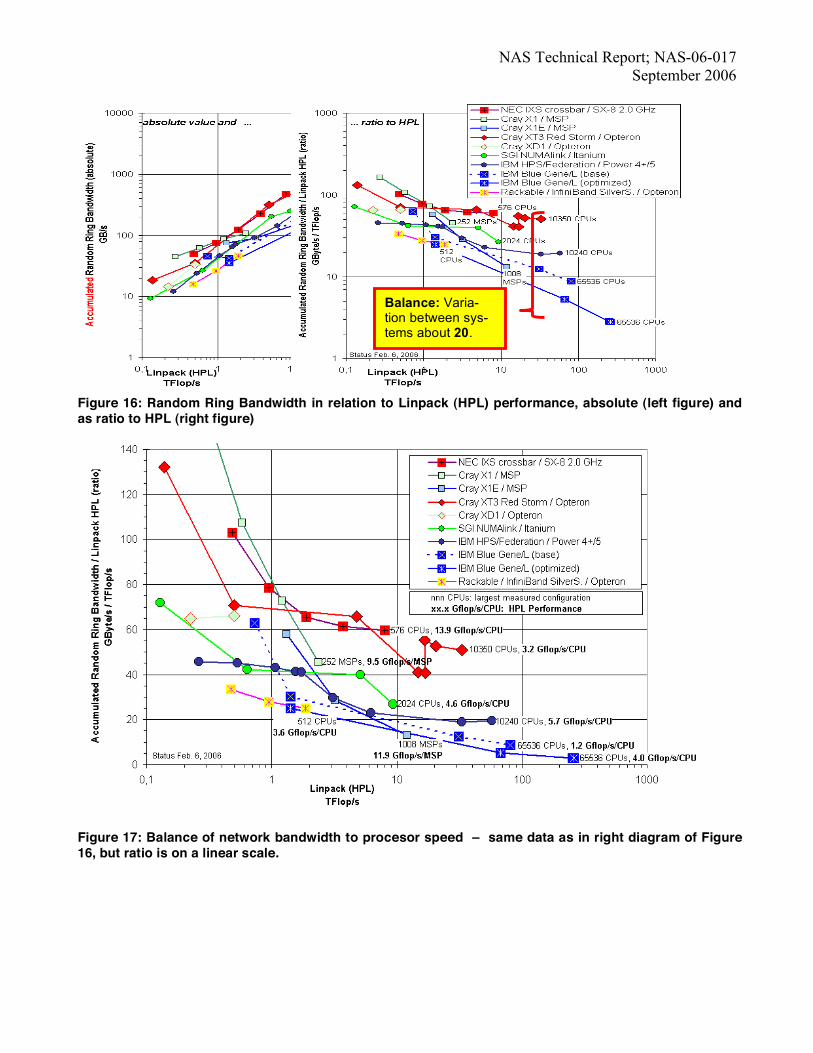
4.3. Balance analysis with publicly available HPCC results The performance comparison of IBM Blue Gene/L with other computing platforms is based on publicly available HPCC data. Only non-optimized results are presented, except for Blue Gene/L for which both non-optimized and optimized results are given. In Figure 16, we have plotted the network bandwidth (measured with the HPCC random ring bandwidth bench-mark) and the processor speed (measured with the HPL Linpack benchmark). Figure 17 is same as figure 16 but the ratio between accumulated random bandwidth (GB/s) and performance of Linpack (in Tflop/s) is plotted on a linear scale. The performance differences between differ-ent architectures can be classified in two categories - (a) The ratio varies between systems by a factor of about 20, and (b) on some systems the ratio decreases rapidly with increasing system size as in IBM Blue Gene/L while on other systems (Cray XT3 and NEC SX-8), the ratio is al-most constant. Figure 17 also shows that the same aggre-gated compute performance (HPL) is achieved with a
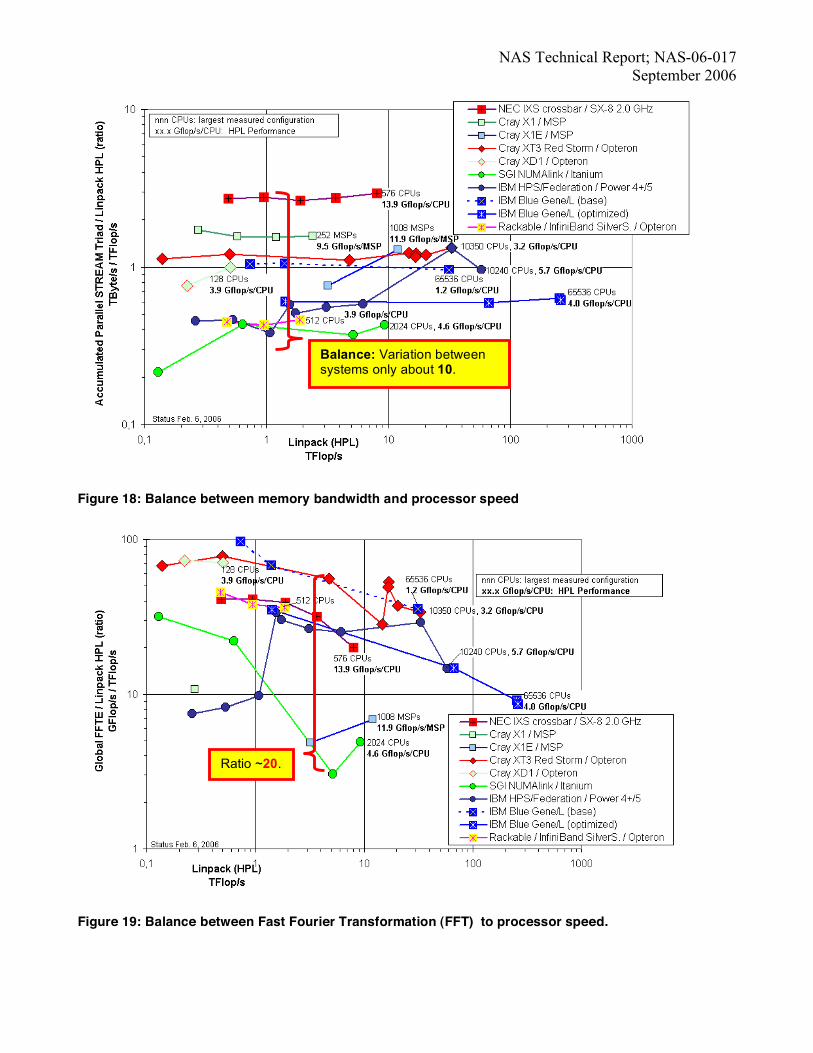
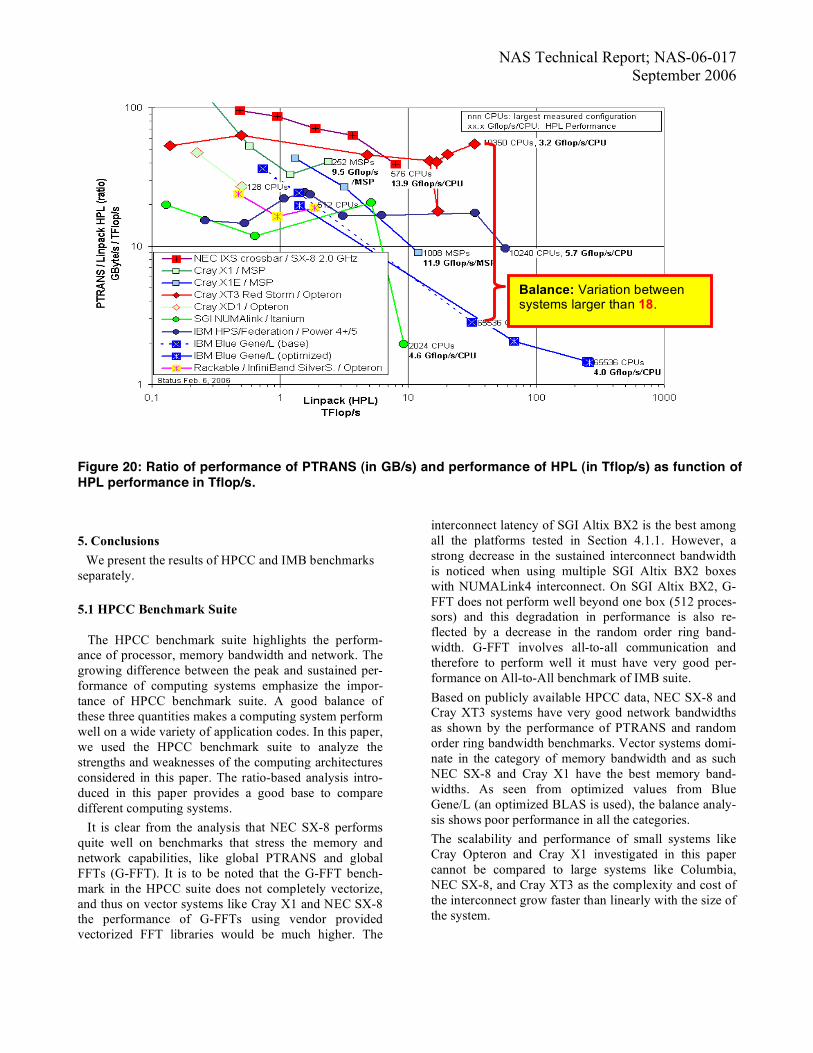
quite different number of processors. The HPL perform-ance per processor (for each platform measured on the largest configuration) ranges from 1.2 Gflop/s/processor with non-optimized HPCC on Blue Gene/L, over 3.2 Gflop/s/processor on Cray XT3, 4.0 on Blue Gene/L (op-timized), 4.6 on SGI, 9.5 on Cray X1, 11.9 on Cray X1E, and up to 13.9 on NEC SX-8. Figure 18 compares the memory bandwidth (measured with HPCC STREAM triad benchmark) with the perform-ance of the processor as measured by the Linpack bench-mark. Here, the ratio varies only by a factor of about 10. As expected, stream performance does not depend on the number of processors. Small variation in performance is due to different benchmark configuration parameters used for different number of processors. Often per processor HPL performance correlate with the memory bandwidth ratio (not linearly, but by the ranking), except on Cray XT3 that has a significant high bandwidth ratio with 1.32 Byte/Flop although processor performance is only 3.2 GFlop/s per processor. Byte to flop ratio is best for NEC SX-8 and Cray X1 with values of 2.94 B/Flop and 2.38 B/Flop respectively. In Figure 19 we have plotted the ratio of G-FFT (global FFT in Gflop/s) and HPL (in TFlop/s) as a function of HPL (Tflop/s). Since the HPCC FFT algorithm is not vec-torizing therefore vector systems like NEC SX-8, Cray X1 and X1E cannot achieve a good ratio. G-FFT involves all-to-all communication and therefore stresses the bisection bandwidth of the system. The performance of parallel matrix transpose (PTRANS) in Figure 20 is dominated by the network bandwidth and therefore as expected NEC SX-8 and Cray XT-3 show best results, whereas IBM Blue Gene/L is about 18 times slower.
NAS Technical Report; NAS-06-017 September 2006
Figure 16: Random Ring Bandwidth in relation to Linpack (HPL) performance, absolute (left figure) and as ratio to HPL (right figure)
Figure 17: Balance of network bandwidth to procesor speed – same data as in right diagram of Figure 16, but ratio is on a linear scale.
Balance: Varia-tion between sys-tems about 20.
NAS Technical Report; NAS-06-017 September 2006
Figure 18: Balance between memory bandwidth and processor speed
Figure 19: Balance between Fast Fourier Transformation (FFT) to processor speed.
Balance: Variation between systems only about 10.
Ratio ~20.
NAS Technical Report; NAS-06-017 September 2006
Figure 20: Ratio of performance of PTRANS (in GB/s) and performance of HPL (in Tflop/s) as function of HPL performance in Tflop/s.
5. Conclusions We present the results of HPCC and IMB benchmarks separately. 5.1 HPCC Benchmark Suite The HPCC benchmark suite highlights the perform-ance of processor, memory bandwidth and network. The growing difference between the peak and sustained per-formance of computing systems emphasize the impor-tance of HPCC benchmark suite. A good balance of these three quantities makes a computing system perform well on a wide variety of application codes. In this paper, we used the HPCC benchmark suite to analyze the strengths and weaknesses of the computing architectures considered in this paper. The ratio-based analysis intro-duced in this paper provides a good base to compare different computing systems. It is clear from the analysis that NEC SX-8 performs quite well on benchmarks that stress the memory and network capabilities, like global PTRANS and global FFTs (G-FFT). It is to be noted that the G-FFT bench-mark in the HPCC suite does not completely vectorize, and thus on vector systems like Cray X1 and NEC SX-8 the performance of G-FFTs using vendor provided vectorized FFT libraries would be much higher. The
interconnect latency of SGI Altix BX2 is the best among all the platforms tested in Section 4.1.1. However, a strong decrease in the sustained interconnect bandwidth is noticed when using multiple SGI Altix BX2 boxes with NUMALink4 interconnect. On SGI Altix BX2, G-FFT does not perform well beyond one box (512 proces-sors) and this degradation in performance is also re-flected by a decrease in the random order ring band-width. G-FFT involves all-to-all communication and therefore to perform well it must have very good per-formance on All-to-All benchmark of IMB suite. Based on publicly available HPCC data, NEC SX-8 and Cray XT3 systems have very good network bandwidths as shown by the performance of PTRANS and random order ring bandwidth benchmarks. Vector systems domi-nate in the category of memory bandwidth and as such NEC SX-8 and Cray X1 have the best memory band-widths. As seen from optimized values from Blue Gene/L (an optimized BLAS is used), the balance analy-sis shows poor performance in all the categories. The scalability and performance of small systems like Cray Opteron and Cray X1 investigated in this paper cannot be compared to large systems like Columbia, NEC SX-8, and Cray XT3 as the complexity and cost of the interconnect grow faster than linearly with the size of the system.
Balance: Variation between systems larger than 18.
NAS Technical Report; NAS-06-017 September 2006
5.2 IMB Benchmark Suite:
Performance of both the vector systems (NEC SX-8 and Cray X1) is consistently better than all the scalar systems (SGI Altix BX2, Cray Opteron Cluster and Dell Xeon Cluster). Between two vector systems, performance of NEC SX-8 is consistently better than Cray X1. Among scalar systems, the performance of SGI Altix BX2 is better than both Dell Xeon Cluster and Cray Opteron Cluster. We find that the performance of IXS (NEC SX-8) > Cray X1 network > SGI Altix BX2 (NUMAlink4) > Dell Xeon Cluster (Infiniband) > Cray Opteron Cluster (Myrinet). In the future we plan to use IMB benchmark suite to study the performance as a function of varying message sizes starting from 1 byte to 4 MB for all 11 benchmarks on the same five computing systems. We also plan to include three more architectures – IBM Blue Gene, Cray XT3 and a cluster of IBM POWER5. References 1. Luszczek, P., Dongarra, J., Koester, D., Rabenseifner,
R., Lucas, B., Kepner, J., McCalpin, J., Bailey, D., Takahashi, D. "Introduction to the HPC Challenge Benchmark Suite," March, 2005. http://icl.cs.utk.edu/hpcc/pubs.
2. Rabenseifner, Rolf, Tiyyagura, Sunil, and Mueller, Matthias, Network Bandwidth Measurements and Ra-tio Analysis with the HPC Challenge Benchmark Suite (HPCC), EuroPVM/MPI’05, 2005.
3. http://www.intel.com/cd/software/products/asmo-na/eng/cluster/mpi/219847.htm
4. Karl Solchenbach, Benchmarking the Balance of Parallel Computers, SPEC Workshop on Benchmarking Parallel and High-Performance Computing Systems, Wuppertal, Germany, Sept. 13, 1999. 5. Saini, S., Full Day Tutorial M04, Hot Chips and Hot Interconnect for High End Computing Systems, IEEE Supercomputing 2004, Nov. 8, 2004, Pittsburgh.
6. http://www.ncsa.uiuc.edu/UserInfo/Resources/Hardware/XeonCluster/
7. Infiniband Trade Association, Infiniband Architec-ture Specifications, Release 1.0 October 24, 2000.
8. http://www.intel.com/technology/infiniband/
9. Quadrics, Quadrics Ltd. http://www.quadrics.com.
10. Myricom. Myricom Inc. http://www.myri.com.
11. J. Liu et al., Performance Comparaison of MPI Implementations over Infiniband Myrinet and Quadrics, http://www.sc-conference.org/sc2003/
paperpdfs/pap310.pdf, SC 2003, Phoenix, Arizona, Nov. 2003.
12. Koniges, A., M. Seager, D. Eder, R. Rabenseifner, M. Resch, Application Supercomputing on Scalable Architectures, IEEE Supercomputing 2004, Nov. 8. 2004, Pittsburgh.
13. Intel MPI Benchmarks: Users Guide and Methodol-ogy Description, Intel GmbH, Germany, 2004.
14. Rabenseifner, R. and Koniges, A. E., The Parallel Communication and I/O Bandwidth Benchmarks: b_eff and b_eff_io. Proc. of 43rd Cray User Group Conference, Indian Wells, California, USA, May 2001.
15. Worley, P., et al., Comparative Analysis of Interproc-ess Communication on the X1, XD1, and XT3, Proc. Cray User Group Conference, USA, 2005.
16. HPC Challenge Benchmark, http://icl.cs.utk.edu/hpcc/
17. Rolf Rabenseifner: Hybrid Parallel Programming on HPC Platforms. In proceedings of the Fifth Euro-pean Workshop on OpenMP, EWOMP '03, Aachen, Germany, Sept. 22-26, 2003, pp 185-194.
18. Rolf Rabenseifner and Gerhard Wellein: Comparison of Parallel Programming Models on Clusters of SMP Nodes. In Modelling, Simulation and Optimization of Complex Processes (Proceedings of the International Conference on High Performance Scientific Comput-ing, March 10-14, 2003, Hanoi, Vietnam) Bock, H.G.; Kostina, E.; Phu, H.X.; Rannacher, R. (Eds.), pp 409-426, Springer, 2004.
19. Panel on HPC Challenge Benchmarks: An Expanded View of High End Computers. SC2004 November 12, 2004. (http://www.netlib.org/utk/people/JackDongarra/SLIDES/hpcc-sc2004-panel.htm).
20. Jack J. Dongarra, Piotr Luszczek, and Antoine Pe-titet: The LINPACK benchmark: Past, present, and future. Concurrency and Computation: Practice and Experience,15:1-18, 2003..
21. John McCalpin. STREAM: Sustainable Memory Bandwidth in High Performance Computing. (http://www.cs.virginia.edu/stream/).
22. Jack J. Dongarra , Jeremy Du Croz , Sven Hammar-ling , Iain S. Du: A set of level 3 basic linear algebra subprograms. ACM Transactions on Mathematical Software (TOMS), 16(1):1-17, March 1990.
23. Jack J. Dongarra , Jeremy Du Croz , Sven Hammar-ling , Iain S. Du: Algorithm 679; a set of level 3 basic linear algebra subprograms: model implementation
NAS Technical Report; NAS-06-017 September 2006
and test programs. ACM Transactions on Mathemati-cal Software (TOMS), 16(1):18-28, March 1990.
24. Daisuke Takahashi, Yasumasa Kanada: High-Performance Radix-2, 3 and 5 Parallel 1-D Complex FFT Algorithms for Distributed-Memory Parallel Computers. Journal of Supercomputing, 15(2):207-228, Feb. 2000.
25. Parallel Kernels and Benchmarks (PARKBENCH) (http://www.netlib.org/parkbench/)
26. David Koester, Bob Lucas: Random Access Rules – GUPS (Giga Updates Per Second). http://icl.cs.utk.edu/projectfiles/hpcc/RandomAccess.