Embed Size (px)
Citation preview

Group/Presentation TitleAgilent Restricted
Month ##, 200X
Performance Characterizations and Comparisons of HPLC
Column Options for Ultra High-Speed and High-
Resolution HPLC Separations.
Maureen Joseph, William Barber, William Long, and Brian Bidlingmeyer
Pittcon 2008

Group/Presentation TitleAgilent Restricted
Month ##, 200X
What Are the Column Options for High Speed and High Resolution Analysis?Columns with different particle sizes – 5, 3.5, 2-2.5, <2um• The current dominant approach is to select columns with smaller
particle sizes to maintain resolution in a shorter column - we will focus on this approach
• Benefit of this approach is that separations can be matched on different particle sizes for flexibility in a lab or organizations
• Another benefit is that many selectivity choices are available to optimize methods
Monoliths – will be considered here
Superficially porous particles – new area and more study is needed for comparison on use with small molecules

Group/Presentation TitleAgilent Restricted
Month ##, 200X
Introduction1. Why Choose Smaller Particles?
1. High speed separations with good resolution2. High resolution separations
2. Performance Characterizations1. Van Deemter plots – a variety of different types of plots are compared
to take into account porosity of the materials packed in the column2. Performance vs. Theoretical – takes into account LC impact on the
column/separation3. Resolution vs. Analysis Time4. Practical use characterizations – pressure, reproducibility, results
across different particle sizes3. Is the smallest particle size the best? Efficiency vs.
Analysis Time

Group/Presentation TitleAgilent Restricted
Month ##, 200X
1. Why Choose Smaller Particle Sizes? - Efficiency and Resolution in Shorter Columns
Rs = N4
k'k'+1
(α-1)
000990P2.PPT
Plates Selectivity Retention
Column Length = N
Particle Size = N
LN ∝
dpTo Maintain Rs:
e.g.: L/2 dp/2
••
This is the basic premise from which we operate.

Group/Presentation TitleAgilent Restricted
Month ##, 200X
Sub 2-Micron Columns Provide the Efficiency of Longer Columns for More Productivity
2,500
6,500
12,000
17,000
24,000
32,500
ResolvingPower
N(1.8 µm)
N.A.
N.A.
4,200
6000
8,500
12,500
Resolving Power
N(5 µm)
552,10015
1264,20030
2107,00050
320 10,50075
42014,000100
58021,000150
Typical Pressure
Bar (1.8 µm)
Resolving Power
N(3.5 µm)
ColumnLength(mm)
AnalysisTime
PeakVolume
-90%
-80%
-67%
-50%
-33%
Analysis Time*
SolventUsage
* Reduction in analysis time compared to 150 mm column• pressure determined with 60:40 MeOH/water, 1ml/min, 4.6mm ID

Group/Presentation TitleAgilent Restricted
Month ##, 200X
High Speed Separations with Good Resolution
RRHT SB-C18 4.6 x 50mm, 1.8 um
min0.5 1 1.5 2 2.5
Column: 4.6 x 50mm, 1.8um Mobile Phase: A= 0.1% Formic Acid, B=ACN + 0.1%Formic Acid (95:5) Flow rate: 1.5 mL/min Inj. Vol: 2 ul Sample: Xanthines: 1. 1-methylxanthine, 2. 1,3-dimethyluric acid, 3. 3,7-dimethylxanthine, 4. 1,7-dimethylxanthine
1
23
4
The short 4.6 x 50mm, 1.8um column allows complete resolution ofmultiple analytes in a minimum amount of time.

Group/Presentation TitleAgilent Restricted
Month ##, 200X
Time Savings, Scalability and Improvement in Sensitivity with Sub 2-um ParticlesColumns: Eclipse Plus C18, as described below. Mobile Phase: A: water, B: MeOH, (15:85)Temperature: 25°C Flow: 1 mL/min. Detection: 310, 4 nm, 0.5 s response time, semi-micro flow cell, Sample: Sunscreens
4.6 x 50 mm, 1.8 µmP=208 bar
4.6 x 150 mm, 5 µmP=82 bar
1. 2-hydroxy-4-methoxybenzophenone
2. Padimate-O3. 2-ethylhexyl trans-4-
methoxycinnamate4. 2-ethylhexyl salicylate
23
5um Rs3,2= 6.41
8 10 12
1.8 um Rs3,2= 6.51
min2 4 6
mAU
0
50
100
150
This blow-up of a chromatogram shows the added sensitivity achieved with a 1.8um column.The chromatograms are on the same scale and we are looking at the same 2 peaks in each.
Rs same, scalability demonstrated
Time savings, improved productivity with sub 2um

Group/Presentation TitleAgilent Restricted
Month ##, 200X
Increasing Resolution by Using Long RRHT, 1.8um Columns
min2 4 6 8 10 12 14 16 18
mAU
-202468
1012
]Rs 2.23
RRHT SB-C18 2.1 x 50mm 1.8 umF=0.4mL/min
min2 4 6 8 10 12 14 16 18
mAU
-202468
1012
RRHT SB-C18 2.1 x 150mm, 1.8 umF=0.4 mL/min
]Rs 3.24 ]Rs 6.12
Sample: Dexamethasone & ImpuritiesIncreasing Column Length Increases
ResolutionParticle Size Held ConstantWith Good Resolution, Choice is
Analysis Time

Group/Presentation TitleAgilent Restricted
Month ##, 200X
High Resolution – Separate More Peaks with 1.8um
min13 14 15 16 17 18
mAU
50
100
150
200
250
300
350
17.13
6
15.41
1
15.96
7
15.15
9
15.55
515.06
5
Agilent 1100 Series400 bar
Agilent 1200 Series600 bar
min13 14 15 16 17 18
50
100
150
200
250
15.32
415.16
4 16.74
615.47
215
.790
mAU 15.07
914
.937
14.78
7
Column: ZORBAX SB-C18, 2.1x150 mm 1.8 µm
Column: ZORBAX SB-C18, 2.1 x 150mm, 5 µm
1.8 µm
5 µm
Improved Resolution
Agilent Application Note: Analysis of a complex natural product extract from ginseng – Part IPublication Number 5989-4506EN
Mobile phases: A = H2O + 0.1% TFA B = ACN + 0.1% TFA
Gradient: 10% to 95% ACN in 40min, hold for 1min
Flow: 0.4 mL/minInj. volume: 3 μL, partial loop fillingDAD: 220 nm (20 Hz)
2µl flowcell

Group/Presentation TitleAgilent Restricted
Month ##, 200X
Performance Characterizations
1. Van Deemter plots2. Performance vs. Theoretical – takes into account LC effects3. Resolution vs. Analysis Time4. Practical use characterizations – pressure, efficiency,
reproducibility, results across different particle sizes

Group/Presentation TitleAgilent Restricted
Month ##, 200X
Van Deemter Curve 1: HETP vs. Volumetric Flow Rate
0.0000
0.0005
0.0010
0.0015
0.0020
0.0025
0.0030
0.0 0.5 1.0 1.5 2.0 2.5 3.0 3.5 4.0 4.5 5.0
Column: ZORBAX Eclipse XDB-C18 Dimensions: 4.6 x 50/30mmEluent: 85:15 ACN:WaterFlow Rates: 0.05 – 5.0 mL/minTemp: 20°CSample: 1.0μL Octanophenone in Eluent
Volumetric Flow Rate (mL/min)
HETP
(cm
/pla
te)
5.0μm3.5μm1.8μm
Smaller particle sizes should have flatter curves, minima shift out slightlySmaller particles have more rapid mass transfer
H = A + B/u + CuMass transfer
term

Group/Presentation TitleAgilent Restricted
Month ##, 200X
Van Deemter Plot 1: HETP vs. Volumetric Flow RateSmall Particle Columns including Monolith
0.0000
0.0005
0.0010
0.0015
0.0020
0.0025
0.0030
0.0 0.5 1.0 1.5 2.0 2.5 3.0 3.5 4.0 4.5 5.0
Dimensions: 4.6 x 50/30/20mmEluent: 85:15 ACN:WaterFlow Rates: 0.05 – 5.0 mL/minTemp: 20°CSample: 1.0μL Octanophenone in Eluent
Volumetric Flow Rate (mL/min)
HET
P (c
m/p
late
)
ZORBAX 5.0μmZORBAX 3.5μmVendor A 2.5μmVendor B 2.0μmZORBAX 1.8μmMonolith
H = A + B/u + Cu
Considering more particle choices, 1.8um generates the best resultsMonolith appears similar to 2-2.5 um particles

Group/Presentation TitleAgilent Restricted
Month ##, 200X
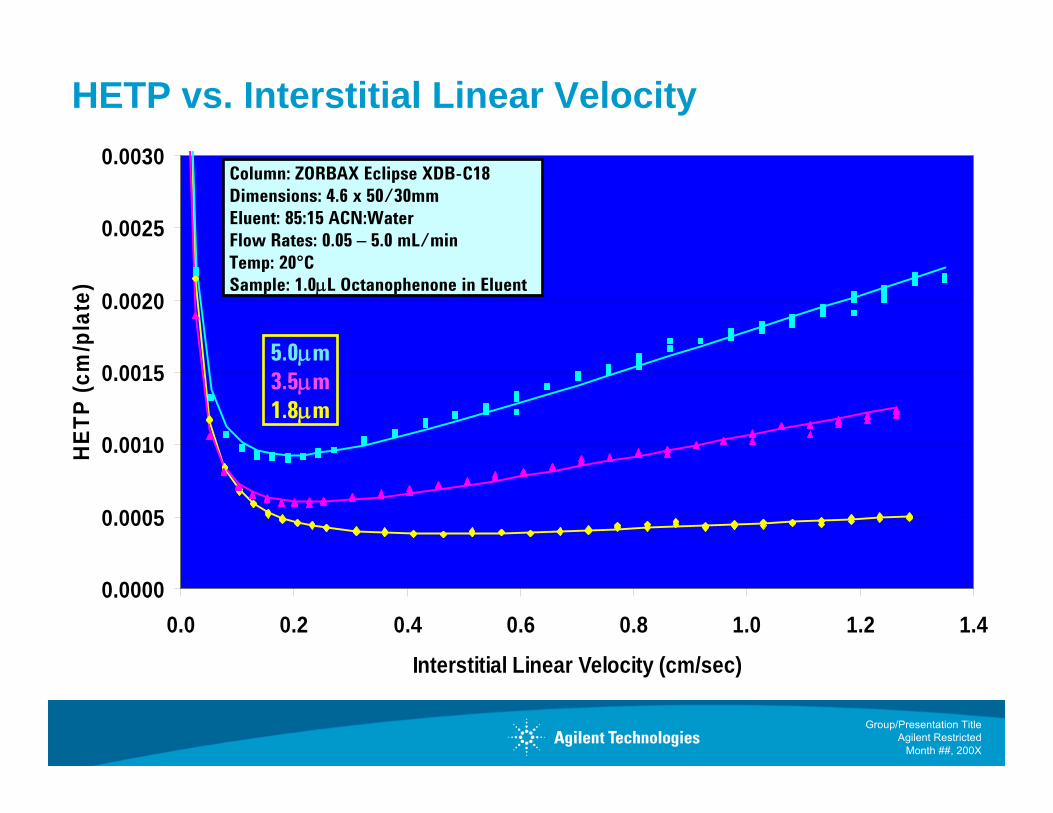
1. HETP vs. Interstitial Linear Velocity (ue)• Shows relative efficiency differences as a function of dp
• Must be used to compare monolith columns to porous particle columns
2. Dimensionless Parameters• Reduced Plate Height (h) vs. Reduced Linear Velocity (υ)• Van Deemter Coefficients:• Knox Equation Coefficients:
– A or A υ 0.33 is a measure of packing quality– B/υ is the result of longitudinal (axial) diffusion in both moving and stationary
zones– Cυ is the contribution from slow mass transfer within the entire stationary
zone.– H = L/N h = H/dp υ = uedp/Dm ue = F/(πr2εe) εe = Ve/Vg
Application – Independent Measures of Relative Column Performance
h = A + B/υ + C•υh = A υ 0.33 + B/υ + C•υ

Group/Presentation TitleAgilent Restricted
Month ##, 200X
Van Deemter Plot 2: HETP vs. Linear VelocitySmall Particle Columns including Monolith
0.0000
0.0005
0.0010
0.0015
0.0020
0.0025
0.0030
0.0 0.2 0.4 0.6 0.8 1.0 1.2 1.4
HETP
(cm
/pla
te)
Interstitial Linear Velocity (ue)
Dimensions: 4.6 x 50/30/20mmEluent: 85:15 ACN:WaterFlow Rates: 0.05 – 5.0 mL/minTemp: 20°CSample: 1.0μL Octanophenone in Eluent
ZORBAX 5.0μmZORBAX 3.5μmVendor A 2.5μmVendor B 2.0μmZORBAX 1.8μmMonolith

Group/Presentation TitleAgilent Restricted
Month ##, 200X
Van Deemter Curve 3: Dimensionless Plots of a Neutral Analyte on 3 particle sizes, same column
0.0000
2.0000
4.0000
6.0000
8.0000
10.0000
12.0000
0.0 5.0 10.0 15.0Reduced Interstitial Linear Velocity
Redu
ced
Plat
e He
ight
5.0 um3.5 um1.8 um
Eclipse XDB-C18, 4.6x50mm65:35 ACCN:Water40 degCAnalyte is Hexanophenone
Looking for all curves to overlay and reduced plate height to be about 2This indicates a well packed column independent of particle size

Group/Presentation TitleAgilent Restricted
Month ##, 200X
2. Actual Performance vs. Theoretical2.1 x150mm SB-C18 RRHT - 5µm vs. 1.8µm
min2 4 6 8
mAU
0
200
400
600
800
1000
1200
1400
1600
Pressure at start: 51bar, 5µmRs(4,5) = 3.14Peak Width 5σ (9) = 0.107
Pressure at start: 394bar, 1.8µmRs(4,5) = 5.07Peak Width 5σ (9) = 0.074
Resolution gains are close to theoretical – results can be achieved!
1.8um vs. 5um+ 60% Resolution (Theory: 67%)+ 160% Efficiency (Theory: 177%)

Group/Presentation TitleAgilent Restricted
Month ##, 200X
3. Choose column length and particle size for Rs and Time – Note Pressure choices
P= 474 bar
P= 160 bar
P= 180 bar
2.1 x 100, 1.8 µmMax Rs
2.1 x 100, 3.5 µmLose Rs over 5um
3.0 x 250, 5 µm
α7,6 = 1.03α6,5 = 1.03α5,4 = 1.04
α7,6 = 1.03α6,5 = 1.03α5,4 = 1.04
α7,6 = 1.03α6,5 = 1.04α5,4 = 1.04
Rs7,6 = 2.72Rs6,5 = 2.89Rs5,4 = 3.04
Rs7,6 = 1.74Rs6,5 = 1.98Rs5,4 = 2.14
Rs7,6 = 1.95Rs6,5 = 2.66Rs5,4 = 2.60
Flow 0.42 ml/minMobile Phase A = Water; B = AcetonitrileGradient: Time (Min) % B
0.00 406 1009.5 10010 40Stop Time = 12
Flow 0.86 ml/minMobile Phase A = Water; B = AcetonitrileGradient: Time (Min) % B
0.00 4015 10023.75 10025 40Stop Time = 30
Flow 0.42 ml/minMobile Phase A = Water; B = AcetonitrileGradient: Time (Min) % B
0.00 406 1009.5 10010 45Stop Time = 12
min2.5 5 7.5 10 12.5 15 17.5 20
mAU
0255075
100125150
min2.5 5 7.5 10 12.5 15 17.5 20
mAU
0255075
100125150
min2.5 5 7.5 10 12.5 15 17.5 20
mAU
0255075
100125150
Sample: 16 PAH’s

Group/Presentation TitleAgilent Restricted
Month ##, 200X
3. Smaller Particle Sizes and Shorter Columns Maintain Resolution but Reduce Analysis Time
RRHT Eclipse Plus Phenyl-Hexyl4.6 x 50 mm, 1.8um
RRHT Eclipse Plus Phenyl-Hexyl4.6 x 100 mm, 3.5um
Eclipse Plus Phenyl-Hexyl4.6 x 150 mm, 5um
Mobile Phase 40 % ACN 60 % 25 mM Sodium Phosphate Buffer pH= 2.4 Flow Rate= 1.5 ml/min UV 210 nm 2µl Elution order for Eclipse Plus Phenyl Hexyl: (1) Piroxicam, (2) Sulindac,(3) Tolmetin, (4) Naproxen, (5) Ibuprofen, (6) Diclofenac, (7) Celebrex (equal portions of approximately 1 mg/ml solutions
2µl injection
4µl injection
6µl injection
min2.5 5 7.5 10 12.5 15 17.5 20
mAU
0
50
100
150
200
min2.5 5 7.5 10 12.5 15 17.5 20
mAU
0
50
100
150
200
min2.5 5 7.5 10 12.5 15 17.5 20
mAU
0
50
100
150
200

Group/Presentation TitleAgilent Restricted
Month ##, 200X
3. Smaller Particle Sizes and Shorter Columns Maintain Resolution but Reduce Analysis Time
RRHT Eclipse Plus Phenyl-Hexyl4.6 x 50 mm, 1.8um
RRHT Eclipse Plus Phenyl-Hexyl4.6 x 100 mm, 3.5um
Mobile Phase 40 % ACN 60 % 25 mM Sodium Phosphate Buffer pH= 2.4 Flow Rate= 1.5 ml/min UV 210 nm 2µl Elution order for Eclipse Plus Phenyl Hexyl: (1) Piroxicam, (2) Sulindac,(3) Tolmetin, (4) Naproxen, (5) Ibuprofen, (6) Diclofenac, (7) Celebrex (equal portions of approximately 1 mg/ml solutions
2µl injection
4µl injection
7.5
mAU
0
50
100
150
200
mAU
min2.5 5 7.5 10 12.5 15
0
50
100
150
200
Equivalent Resolution faster separation, shorter column

Group/Presentation TitleAgilent Restricted
Month ##, 200X
4. Longer RRHT Columns Improve Efficiency and RsPressure Increases with Length
Sample: 1. Anandamide (AEA) 2. Palmitoylethanolamide (PEA) 3. 2-arachinoylglycerol (2-AG) 4. 1(3)-arachidonylglycerol5. Oleoylethanolamide (OEA)
Rs5,4 = 0
Rs5,4 = Baseline
Rs5,4= 1.38
Rs5,4= 1.61
4.6 x 50 mm 1.8um
4.6 x 100 mm 1.8um
4.6 x 150 mm 1.8um
Mobile phase: (69:31) ACN: waterFlow 1.5 mL (/min.Temp: 30 CDetector: Single Quad ESI positive mode scan
1800000
min2 4400000
1200000
2 4 6 8200000
1600000
min2 4 6 8 10
400000
3
12
4
5
3
1 25
186bar
413bar
326bar

Group/Presentation TitleAgilent Restricted
Month ##, 200X
4. Comparison of 1.8um and 2.5 um Columns
36 % MeCN 64% Water w/ 0.7 ml/L phosphoric acid2 µl injection 220 nm Flow :0.5 mL/min RRHT, 0.45 mL/min. (Luna)
1 2- Hydroxy-2-(4-Isobutylphenyl) proprionic acid2 2-(3-Isobutylphenyl) proprionic acid3 Ibuprofen4 2-(4-n-butylphenyl) proprionic acid5 Isobutyl acetophenone
All at 0.125 mg/ml
min1 2 3 4 5 6 7 8
mAU
0
20
40
60
80
min1 2 3 4 5 6 7 8
mAU
0
20
40
60
80
ZORBAX RRHT Eclipse Plus C18 2.1 x 30 mm, 1.8 µm
Competitive 2.0 x 30 mm, 2.5 µm
231 bar
160 bar
N: 4500TF: 1.04Rs4,3: 1.62
N: 3800TF: 1.12Rs4,3: 1.47
RRHT, 1.8um has at least 18% more efficiency than 2.5umThat means greater than baseline resolution can be achieved when needed.
Group/Presentation TitleAgilent Restricted
Month ##, 200X
Is the Smallest Particle Size the Best?
Kinetic plots – comparison of 1.8, 3.5, 5um and monoliths
Very high efficiency separations with small particle size
Comparison of particle sizes – as a function of analysis time
Bonded phase is always worth considering

Group/Presentation TitleAgilent Restricted
Month ##, 200X
What is a Kinetic Plot – What can it show?
Convert Van Deemter Plots to those based on t0 vs. N in order to characterize column packing materials over a range of N values, practically you can compare the performance of differentlength columns and compare the analysis time needed to achieve a certain level of efficiency• Free kinetic plots apply no column length constraints• Constrained kinetic plots, i.e. constrained by column length, pressure can
help choose an optimum column based on real choices
Can look at practical constraints on column length and particle size to choose an optimum configuration for the needed efficiency or analysis time

Group/Presentation TitleAgilent Restricted
Month ##, 200X
Kinetic Plot for Comparison of Different Particle Sizes, based on umax Desmet et. al. Anal. Chem. 2006, 78, 2150-2162
Columns in plot:: Black 5um XTerra and 5um ZORBAX, Blue 3.5um XTerra and 3.5um ZORBAX, Red, 1.7um Acquity and 1.8um ZORBAX, Green - Monolith
Smallest, sub 2um, particles generate greater efficiency in short columns at high velocities than other particle sizes, larger particle sizes in longer columns can generate more efficiency
Short lengths Long lengths

Group/Presentation TitleAgilent Restricted
Month ##, 200X
Is the Smallest Particle Size the Best? It Depends
Kinetic plots show that smallest particle size is best for fast separations – under 15 – 40 minutes
For a mid time frame – 40 – 60 minutes, a 3.5um particle size can be a better choice for maximizing efficiency if you are willing to increase analysis time (1.8um can still be a good choice for high efficiency)
For a long time frame – 1 hour or more a larger, 5um particle size can generate the most efficiency

Group/Presentation TitleAgilent Restricted
Month ##, 200X
4 Eclipse Plus C18, 3.5um in Series for Maximum Efficiency – Cost is Analysis Time
70:30 MeCN :Water1.2 ml/min 254 nm 6 mm flowcell40 C 1 Uracil2 Phenol3 4-Cl Nitrobenzene4 Napthalene
In 50:50 MeCN: Water20µl injection4 columns in series (total 1000mm)4.6 x 250 mm, 3.5µm EclipsePlusC18
min5 10 15 20 25
mAU
0
20
40
60
80
100
120
140
7.15
47.
375
9.81
410
.071
17.0
33
24.6
30
N=142940K’=1.96
N=150523K’=1.05
N=151822K’= 0.21
513 Bar
High pressure LC can be used for very high efficiency separations with multiple columns in series.

Group/Presentation TitleAgilent Restricted
Month ##, 200X
Different Particle Sizes May Be an Appropriate Choice for a Separation
min2 4 6 8 10 12 14 16
min2 4 6 8 10 12 14 16
min2 4 6 8 10 12 14 16
4.6 x 250 mm, 3.5 µmP=221 bar
4.6 x 50 mm, 1.8 µmP=164 bar
4.6 x 150 mm, 1.8 µmP=418 bar
20.0112.014.0112.5
2012460
17.510.53.560
00012.5
250 mm150 mm50 mm% B
Rs= 5.6
Rs= 4.9
Rs= 4.3
Rs= 3.6
Rs= 2.5Rs= 1.6
Room Temp 70ºCPressures:4.6 x 250mm, 3.5um 399 bar 221 bar4.6 x 150mm, 1.8um 418 bar

Group/Presentation TitleAgilent Restricted
Month ##, 200X
Separate More Peaks with 1.8um – Analysis Time Under 20 min.
min13 14 15 16 17 18
mAU
50
100
150
200
250
300
350
17.13
6
15.41
1
15.96
7
15.15
9
15.55
515.06
5
Agilent 1100 Series400 bar
Agilent 1200 Series600 bar
min13 14 15 16 17 18
50
100
150
200
250
15.32
415.16
4 16.74
615.47
215
.790
mAU 15.07
914
.937
14.78
7
Column: ZORBAX SB-C18, 2.1x150 mm 1.8 µm
Column: ZORBAX SB-C18, 2.1 x 150mm, 5 µm
1.8 µm
5 µm
Improved Resolution
Agilent Application Note: Analysis of a complex natural product extract from ginseng – Part IPublication Number 5989-4506EN
Mobile phases: A = H2O + 0.1% TFA B = ACN + 0.1% TFA
Gradient: 10% to 95% ACN in 40min, hold for 1min
Flow: 0.4 mL/minInj. volume: 3 μL, partial loop fillingDAD: 220 nm (20 Hz)
2µl flowcell

Group/Presentation TitleAgilent Restricted
Month ##, 200X
An Optimum Bonded Phase Can Always Be the Best Choice
1. Oxybenzone2. Internal Std.3. Octylmethoxycinnamate
Rapid Resolution Eclipse Plus C8, 4.6 x 50mm, 3.5 um
Conditions:Mobile Phase.: Water: Acetonitrile (30:70)Flow Rate: 2.0 mL/min. Detection: UV 230nm Temperature: 30 °CSample: Lip balm extract in ACN(melted at 100°C ACN , cooled and 0.45 um filtered)
2.2 min.
RRHT Eclipse Plus C18, 4.6 x 50mm, 1.8 um
N: 6600Pw: 0.037 min.TF: 0.99
N: 6300Pw: 0.061 min.TF: 0.98
N: 5000Pw: 0.019 min.TF: 1.09
N: 8800Pw: 0.014 min.TF: 1.20
N: 11600Pw: 0.047 min.TF: 1.06
N: 11800Pw: 0.093 min.TF: 1.02
247 bar
88 barmin0 1 2 3 4
min0 1 2 3 4
)
Less retention can save significant time – the C8 is a good choice here.The RRHT column is delivering the efficiency and resolution expected, but the C8 bonded phase may be the best choice.
Group/Presentation TitleAgilent Restricted
Month ##, 200X
Conclusions
Small particle sizes, sub 2-micron, deliver the highest efficiency for fast separations – those basically less than 30 minutes long
It is possible to achieve close to theoretical performance with an optimized LC.
Larger particle sizes can generate very high efficiency separations, but the highest efficiency will always require moreanalysis time.
An optimum bonded phase for the separation can be equally important.
Group/Presentation TitleAgilent Restricted
Month ##, 200X
HETP vs. Interstitial Linear Velocity
0.0000
0.0005
0.0010
0.0015
0.0020
0.0025
0.0030
0.0 0.2 0.4 0.6 0.8 1.0 1.2 1.4
Interstitial Linear Velocity (cm/sec)
HET
P (c
m/p
late
)
Column: ZORBAX Eclipse XDB-C18 Dimensions: 4.6 x 50/30mmEluent: 85:15 ACN:WaterFlow Rates: 0.05 – 5.0 mL/minTemp: 20°CSample: 1.0μL Octanophenone in Eluent
5.0μm3.5μm1.8μm

Group/Presentation TitleAgilent Restricted
Month ##, 200X
Free Kinetic Plot Desmet et. al. Anal. Chem. 2006, 78, 2150-2162
Columns in plot: Black 5um XTerra and 5um ZORBAX, Blue 3.5um XTerraand 3.5um ZORBAX, Red,1.7um Acquity and 1.8um ZORBAX, Green - Monolith
In the free kinetic plot the monolith and 5um particles appear to offer the optimum efficiency.

Group/Presentation TitleAgilent Restricted
Month ##, 200X
Constrained Kinetic Plot
Achieve more gain in analysis time with sub 2um


![Welcome [unisonfgpartners.com.au]unisonfgpartners.com.au/pdf/FINDEX-FMGMT.pdf4.0 1.0 1.0 1.0 1.0 1.0 1.0 50.0 43.5 34.5 25.5 12.5 5.5 9.0 9.0 8.0 7.0 5.0 2.0 5.0 5.0 5.0 5.0 5.0 14.0](https://img.dokumen.tips/doc/110x75/5f9881d4934d305cce543099/welcome-40-10-10-10-10-10-10-500-435-345-255-125-55-90-90-80.jpg)