Embed Size (px)
Citation preview

PERFORMANCE-BASED SEISMIC DESIGN AND
ASSESSMENT OF CONCRETE BRIDGE PIERS
REINFORCED WITH SHAPE MEMORY ALLOY REBAR
by
Abu Hena MD Muntasir Billah
A THESIS SUBMITTED IN PARTIAL FULFILLMENT OF
THE REQUIREMENTS FOR THE DEGREE OF
DOCTOR OF PHILOSOPHY
in
THE COLLEGE OF GRADUATE STUDIES
(Civil Engineering)
THE UNIVERSITY OF BRITISH COLUMBIA
(Okanagan)
August 2015
© Abu Hena MD Muntasir Billah, 2015

ABSTRACT
Recent advancements in numerical analysis and computational power have pushed the current
bridge design specifications towards a more descriptive performance-based seismic design
(PBSD) approach as compared to the conventional force-based method. One major attributes
of this PBSD is to keep bridges operational and reduce the repair cost by limiting the global
and local deformations of a bridge to acceptable levels under design loads. Shape memory
alloy (SMA), with its distinct superelasticity, shape memory effect and hysteretic damping, is
a promising material for the application in bridge piers to attain the objectives of PBSD. The
objective of this research is to develop a performance-based seismic design guideline for
concrete bridge pier reinforced with different types of SMAs. With the aim of providing a
comprehensive design guideline, this study started with the experimental investigation of bond
behavior of smooth and sand coated SMA rebar in concrete using pushout specimens. The test
results were explored to evaluate the influence of concrete strength, bar diameter, embedment
length, and surface condition. In addition, a plastic hinge length expression for SMA-RC
bridge pier was developed which can be used for calculating the flexural displacement capacity
and design of SMA-RC bridge pier. Using Incremental Dynamic Analysis (IDA), this study
developed quantitative damage states corresponding to different performance levels (cracking,
yielding, and strength degradation) and specific probabilistic distributions for RC bridge piers
reinforced with different types of SMAs. Based on an extensive numerical study, the author
proposed residual drift based damage states for SMA-RC pier. Based on the proposed damage
states, a sequential procedure for the performance-based design of SMA-RC bridge pier is
developed using a combination of residual and maximum drift. Finally, in order to elucidate
the potential benefit and applicability of the proposed guideline, fragility curves and seismic
hazard curves for different SMA-RC bridge piers are developed considering maximum and
residual drift as engineering demand parameters. It is found that the SMA-RC bridge piers
designed following the proposed design guideline have very low probability of damage
resulting in a lower annual loss which will provide significant financial benefit in the long run.
ii
PREFACE
• A version of chapter 2 has been submitted in Engineering Structures, Elsevier. Billah,
A.H.M.M. and Alam, M.S. 2015. Application of Shape Memory Alloy in Bridges:
Research, Application and Opportunities, Engineering Structures. I wrote the manuscript
which was further edited by Dr. Alam.
A version of chapter 2 has been published in World Research & Innovation Convention on
Engineering & Technology 2014. Alam. M.S. and Billah, A.H.M.M. 2014. Utilizing Shape
Memory Alloys (SMAs) for safer and sustainable civil infrastructures. In World Research
& Innovation Convention on Engineering & Technology 2014, Putrajaya, Malaysia, 25-26
November 2014.
• A version of chapter 3 has been published in Structure and Infrastructure Engineering,
Taylor and Francis. Billah, A.H.M.M. and Alam, M.S. 2014. Seismic Fragility Assessment
of Highway Bridges: A State-of-The-Art Review. In Press: Structure and Infrastructure
Engineering. DOI:10.1080/15732479.2014.912243. I wrote the manuscript which was
further edited by Dr. Alam.
• A version of chapter 4 has been submitted in Structures, Elsevier. Billah, A.H.M.M. and
Alam, M.S. 2015. Bond behavior of plain and modified Shape Memory Alloy rebar in
concrete. Submitted in: Structures, Manuscript ID D-15-00078.R1. I conducted
experimental investigation and wrote the manuscript which was further edited by Dr. Alam.
• A version of chapter 5 has been submitted in Engineering Structures, Elsevier. Billah,
A.H.M.M. and Alam, M.S. 2015. Plastic hinge length of Shape Memory Alloy reinforced
concrete column. Submitted in: Engineering Structures, Manuscript ID ENGSTRUCT-D-
15-00849 S-2015-048. I conducted the numerical analysis and wrote the manuscript which
was further edited by Dr. Alam.
• A version of chapter 6 has been submitted in Journal of Structural Engineering, ASCE.
Billah, A.H.M.M. and Alam, M.S. 2014. Performance based seismic design of concrete
bridge pier reinforced with Shape Memory Alloy- Part 1: Development of Performance-
Based Damage States. Submitted in: ASCE Journal of Structural Engineering, Manuscript
ID: STENG-4011. I conducted the numerical analysis and wrote the manuscript which was
further edited by Dr. Alam.
iii

• A version of chapter 7 has been submitted in Journal of Structural Engineering, ASCE.
Billah, A.H.M.M. and Alam, M.S. 2014. Performance based seismic design of concrete
bridge pier reinforced with Shape Memory Alloy- Part 2: Methodology and Application.
Submitted in: ASCE Journal of Structural Engineering, Manuscript ID: STENG-4012. I
conducted the numerical analysis and wrote the manuscript which was further edited by Dr.
Alam.
A version of chapter 7 has been accepted in Structures Congress 2015 Conference. Billah,
A.H.M.M. and Alam, M.S. 2015. Damping-Ductility relationship for performance based
seismic design of shape memory alloy reinforced concrete bridge pier. in ASCE Structures
Congress, 2015, Portland, Oregon. I conducted the numerical analysis and wrote the
manuscript which was further edited by Dr. Alam.
• A version of chapter 8 has been submitted in Journal of Structural Engineering, ASCE.
Billah, A.H.M.M. and Alam, M.S. 2015. Probabilistic seismic risk assessment of concrete
bridge piers reinforced with different types of shape memory alloys. Submitted in: ASCE
Journal of Structural Engineering, Manuscript ID: STENG-4249. I conducted the
numerical analysis and wrote the manuscript which was further edited by Dr. Alam.
• A version of chapter 8 has been accepted in 11 Canadian Conference on Earthquake
Engineering. Billah A.H.M.M. and Alam, M.S. 2015.Seismic performance evaluation of a
highway bridge reinforced with different types of shape memory alloy rebar. In 11 CCEE,
Victoria, BC, Canada, July 21-24, 2015. I conducted the numerical analysis and wrote the
manuscript which was further edited by Dr. Alam.
iv

TABLE OF CONTENTS
ABSTRACT……. ............................................................................................................... ii
PREFACE……… .............................................................................................................. iii
TABLE OF CONTENTS ....................................................................................................v
LIST OF TABLES ............................................................................................................ xi
LIST OF FIGURES......................................................................................................... xiii
LIST OF SYMBOLS AND ABBREVIATIONS .......................................................... xviii
ACKNOWLEDGEMENTS .............................................................................................. xx
DEDICATION ..................................................................................................................xxi
Chapter 1. INTRODUCTION AND THESIS ORGANIZATION ..............................1
1.1 General ...................................................................................................................1
1.2 Objectives of the Study ...........................................................................................3
1.3 Scope and Significance of Research ........................................................................3
1.3.1 Bond behaviour of SMA rebar with concrete ............................................................ 3
1.3.2 Plastic hinge length expression for SMA-RC bridge pier ........................................... 4
1.3.3 Performance-based damage states for SMA-RC bridge pier ...................................... 4
1.3.4 Performance-based design of SMA-RC bridge pier ................................................... 4
1.3.5 Probabilistic seismic risk assessment of SMA-RC bridge pier ................................... 5
1.4 Outline of the Thesis ...............................................................................................5
Chapter 2. APPLICATION OF SHAPE MEMORY ALLOY IN BRIDGES:
RESEARCH, APPLICATION AND OPPORTUNITIES .................................................9
2.1 General ...................................................................................................................9
2.2 Shape Memory Alloy ............................................................................................ 11
2.3 Shape Memory Alloy in Bridges ........................................................................... 13
2.3.1 Application in bridge pier ....................................................................................... 16
v

2.3.2 Seismic isolation of bridges .................................................................................... 18
2.3.3 Dampers in bridges ................................................................................................. 20
2.3.4 Prestressing in bridge girders .................................................................................. 21
2.3.5 Retrofitting of bridge girders .................................................................................. 22
2.3.6 Application in bridge expansion joints .................................................................... 22
2.3.7 Restrainer in bridges ............................................................................................... 23
2.4 Comparison of SMA based and Conventional Bridge Component Performance .... 24
2.5 Promising SMAs for Application in Bridges.......................................................... 25
2.6 Future of Smart Bridges ........................................................................................ 28
2.7 Summary ............................................................................................................... 30
Chapter 3. SEISMIC FRAGILITY ASSESSMENT OF HIGHWAY BRIDGES:
A STATE-OF-THE-ART REVIEW ................................................................................. 31
3.1 General ................................................................................................................. 31
3.2 Seismic Fragility Analysis ..................................................................................... 32
3.3 Methods for Fragility Curve Development ............................................................ 35
3.3.1 Expert based/judgmental fragility curves ................................................................ 36
3.3.2 Empirical fragility curves ....................................................................................... 38
3.3.3 Experimental fragility curves .................................................................................. 39
3.3.4 Analytical fragility curves ....................................................................................... 40
3.3.5 Hybrid Fragility curves ........................................................................................... 45
3.4 Intensity Measure and Demand Parameter for Fragility Analysis ........................... 46
3.5 Regional Fragility analysis .................................................................................... 49
3.6 Condition Specific Fragility Assessment ............................................................... 50
3.6.1 Fragility analysis for retrofitted bridge .................................................................... 50
3.6.2 Fragility analysis considering aging effect .............................................................. 52
3.6.3 Fragility analysis considering SSI and liquefaction ................................................. 54
vi
3.6.4 Fragility analysis of isolated bridges ....................................................................... 55
3.6.5 Fragility analysis of irregular, curved and skewed bridges ....................................... 56
3.6.6 Fragility analysis considering effect of scouring ...................................................... 57
3.7 Effect of Ground Motion on Fragility Analysis ...................................................... 58
3.8 Possible Future Development ................................................................................ 58
3.9 Summary ............................................................................................................... 62
Chapter 4. BOND BEHAVIOR OF SMOOTH AND SAND-COATED SHAPE
MEMORY ALLOY (SMA) REBAR IN CONCRETE .................................................... 63
4.1 General ................................................................................................................. 63
4.2 Experimental Program ........................................................................................... 64
4.2.1 Variables ................................................................................................................ 64
4.2.2 Materials ................................................................................................................ 65
4.3 Specimen Preparation and Testing ......................................................................... 66
4.4 Experimental Results ............................................................................................. 68
4.4.1 Failure modes ......................................................................................................... 68
4.4.2 Load-slip relationship and bond strength ................................................................. 70
4.4.3 Influencing factor analysis ...................................................................................... 71
4.5 Empirical Relationship for Bond Strength of SMA Rebar ...................................... 78
4.6 Comparison with Bond Behavior of Sand Coated FRP Bars .................................. 78
4.7 Summary ............................................................................................................... 81
Chapter 5. PLASTIC HINGE LENGTH OF SHAPE MEMORY ALLOY (SMA)
REINFORCED CONCRETE BRIDGE PIER ................................................................. 82
5.1 General ................................................................................................................. 82
5.2 Design and Geometry of Bridge Pier ..................................................................... 83
5.3 Analytical Modeling .............................................................................................. 85
5.4 Model Validation .................................................................................................. 86
vii
5.5 Analytical Approach for Predicting Plastic Hinge Length ...................................... 87
5.5.1 Effect of axial load ................................................................................................. 88
5.5.2 Effect of aspect ratio ............................................................................................... 89
5.5.3 Effect of SMA properties ........................................................................................ 90
5.5.4 Effect of longitudinal reinforcement ratio................................................................ 91
5.5.5 Effect of transverse reinforcement .......................................................................... 92
5.5.6 Effect of concrete strength ...................................................................................... 93
5.6 Plastic Hinge Length Expression for SMA-RC Bridge Pier ................................... 94
5.7 Validation of the Proposed Equation ..................................................................... 95
5.8 Summary ............................................................................................................... 97
Chapter 6. PERFORMANCE-BASED SEISMIC DESIGN OF SHAPE
MEMORY ALLOY REINFORCED CONCRETE BRIDGE PIER:
DEVELOPMENT OF PERFORMANCE-BASED DAMAGE STATES ........................ 98
6.1 General ................................................................................................................. 98
6.2 Design and Geometry of Bridge Piers .................................................................... 99
6.3 Analytical Modeling of Bridge Piers ................................................................... 102
6.4 IDA- Based Approach for Developing Performance-Based Damage States ......... 104
6.4.1 Selection of ground motions ................................................................................. 104
6.4.2 Performance-based damage states criterion ........................................................... 107
6.4.3 Probabilistic distribution of drift based damage states ........................................... 109
6.4.4 Maximum drift based damage states ..................................................................... 113
6.4.5 Residual drift based damage states for SMA-RC bridge piers ................................ 115
6.5 Prediction of Residual Drift ................................................................................. 118
6.6 Summary ............................................................................................................. 120
Chapter 7. PERFORMANCE-BASED SEISMIC DESIGN OF SHAPE
MEMORY ALLOY (SMA) REINFORCED CONCRETE BRIDGE PIER:
METHODOLOGY AND DESIGN EXAMPLE ............................................................. 121
viii

7.1 General ............................................................................................................... 121
7.2 Performance-Based Design of SMA Reinforced Bridge Pier ............................... 122
7.2.1 Step 1: Define seismic hazard ............................................................................... 122
7.2.2 Step-2: Define target residual drift ........................................................................ 123
7.2.3 Step-3: Calculate maximum drift based on target residual drift .............................. 123
7.2.4 Step-4: Select initial parameters ............................................................................ 125
7.2.5 Step-5: Calculate expected ductility demand ......................................................... 125
7.2.6 Step-6: Determine equivalent hysteretic damping .................................................. 126
7.2.7 Step 7: Determine effective time period (Teff) ........................................................ 128
7.2.8 Step 8: Determine effective stiffness (Keff) ............................................................ 130
7.2.9 Step 9: Compute design base shear (Vbase) and design moment (Md) ...................... 130
7.2.10 Step 10: Design the bridge pier ............................................................................. 130
7.3 Illustrative example ............................................................................................. 131
7.4 Bridge Pier Performance Evaluation .................................................................... 135
7.5 Summary ............................................................................................................. 138
Chapter 8. PROBABILISTIC SEISMIC RISK ASSESSMENT OF CONCRETE
BRIDGE PIERS REINFORCED WITH DIFFERENT TYPES OF SHAPE
MEMORY ALLOYS....................................................................................................... 139
8.1 General ............................................................................................................... 139
8.2 Probabilistic Seismic Performance Assessment ................................................... 142
8.3 Design of SMA-RC Bridge Piers ......................................................................... 144
8.4 Finite Element Modeling of Bridge Piers ............................................................. 145
8.5 Seismic Hazard and Selection of Ground Motions ............................................... 146
8.6 Fragility Analysis of Different SMA-RC Bridge Piers ......................................... 149
8.6.1 Probabilistic seismic demand model ..................................................................... 150
8.6.2 Characterization of damage states ......................................................................... 152
ix

8.6.3 Fragility Curves .................................................................................................... 154
8.7 Seismic Demand Hazard of Different SMA-RC Bridge Piers .............................. 157
8.8 Summary ............................................................................................................. 159
Chapter 9. SUMMARY, CONCLUSIONS AND FUTURE WORKS..................... 160
9.1 Summary ............................................................................................................. 160
9.2 Core Contributions .............................................................................................. 161
9.3 Conclusions ......................................................................................................... 162
9.3.1 Bond behavior of smooth and sand coated SMA rebar in concrete......................... 162
9.3.2 Plastic hinge length of SMA-RC bridge pier ......................................................... 162
9.3.3 Performance-based seismic design of Shape Memory Alloy reinforced concrete
bridge pier………. ................................................................................................ 163
9.3.4 Probabilistic seismic risk assessment of SMA-RC bridge piers.............................. 165
9.4 Recommendation for Future works ...................................................................... 167
REFERENCES ................................................................................................................ 169
APPENDICES. ................................................................................................................ 198
Appendix A ................................................................................................................... 198
Appendix B ................................................................................................................... 207
Goodness-of-fit test............................................................................................................... 207
Appendix C ................................................................................................................... 212
Curve fitting ......................................................................................................................... 212
x
LIST OF TABLES
Table 2.1. Summary of SMA application in bridge engineering .......................................... 15
Table 2.2. Performance comparison of SMA-based and conventional bridge components ... 25
Table 2.3. Potential SMAs for application in bridge engineering ......................................... 27
Table 2.4. Summary of SMA properties for bridge engineering application and their
effects ............................................................................................................... 29
Table 3.1.Comparison of different methods for development of fragility curves .................. 36
Table 3.2. Comparison of empirical fragility curve parameters ........................................... 39
Table 3.3. Summary of threshold values of different demand parameters ............................ 48
Table 3.4. Key features of modern bridge fragility curve development efforts ..................... 61
Table 4.1. Pushout test specimens ....................................................................................... 65
Table 4.2. Comparison of Bond Strength Sand Coated SMA bars with Sand Coated FRP
Bars .................................................................................................................. 81
Table 5.1. Details of variable parameters ............................................................................ 84
Table 5.2. Details of SMA-RC bridge piers ......................................................................... 85
Table 5.3. Properties of different types of SMA .................................................................. 91
Table 5.4. Comparison of experimental and measured plastic hinge length ......................... 95
Table 5.5. Comparison of measured and calculated ultimate drift ........................................ 97
Table 6.1. Properties of different types of SMA ................................................................ 101
Table 6.2. Material properties for SMA-RC bridge pier .................................................... 102
Table 6.3. Selected earthquake ground motion records ...................................................... 106
Table 6.4. Proposed damage state framework.................................................................... 108
Table 6.5. Damage states of different SMA-RC bridge pier and their associated
distribution ...................................................................................................... 111
Table 6.6. Residual drift damage states of SMA-RC bridge pier........................................ 117
Table 7.1. ATC55/FEMA440 earthquake ground motions* (Miranda, 2003) .................... 127
Table 7.2. Material Properties ........................................................................................... 132
Table 8.1. Selected earthquake ground motion records ...................................................... 149
Table 8.2. PSDMs for different EDPs ............................................................................... 152
xi

Table 8.3. Limit state capacity of SMA-RC bridge pier in terms of maximum and
residual drift .................................................................................................... 153
Table 8.4. Comparison of median PGA (g) ....................................................................... 157
Table 8.5. Annual rate and probability of collapse (DS-4) in terms of maximum drift ....... 159
Table 8.6. Annual rate and probability of DS-2 in terms of residual drift ........................... 159
Table A.0.1. Summary of seismic fragility assessment studies of bridges .......................... 198
Table A.0.2. Summary of regional fragility analysis of highway bridges ........................... 203
Table B.0.1. Results of K-S goodness-of-fit tests for spalling drift limit………………… 208
Table B.0.2. Results of K-S goodness-of-fit tests for yielding drift limit………………….209
Table B.0.3. Results of K-S goodness-of-fit tests for crushing drift limit………………….210
Table C.0.1. List of equations tested……………………………………………………….211
xii

LIST OF FIGURES
Figure 1.1. Outline of the thesis ............................................................................................6
Figure 2.1. Flag shaped hysteresis of Shape memory alloy.................................................. 10
Figure 2.2. Comparison of elastic modulus and recovery strain of different SMAs .............. 12
Figure 2.3. Comparison among different commonly used construction material and
different types of SMAs (adapted from Ma and Karaman 2010) ........................ 13
Figure 2.4. Application of SMA in bridge engineering (a) active confinement of bridge
pier, (b) Post- tensioning in segmental bridge pier, (c) Yielding device in
segmental bridge pier, (d) Reinforcement in the plastic hinge region, (e)
Restrainer, (f) Isolation bearing, (g) Post-tesioned bridge girder, (h) Expansion
joint and (i) Damper in stay cables. ................................................................... 14
Figure 2.5. Statistics of application of SMA in bridge engineering ...................................... 15
Figure 2.6. Comparison of hysteretic response of different SMAs ....................................... 26
Figure 3.1. Statistics of publications on seismic fragility analysis of bridges since 1990 ..... 34
Figure 3.2. Various applications of seismic fragility curves ................................................ 34
Figure 3.3. Methodology for developing seismic fragility curves ........................................ 35
Figure 3.4. Typical survey technique for developing expert based fragility curve ................ 37
Figure 3.5. Comparison of empirical fragility curves developed by Shinozuka et al. (2001)
[S] and Yamazaki et al. (2000) [Y] using damage data from Kobe earthquake ... 39
Figure 3.6. Probabilistic Representation of Capacity and Demand Spectra (Mander and ..... 41
Figure 3.7. Schematic Representation of the NLTHA procedure used to develop fragility
curves................................................................................................................ 42
Figure 3.8. Comparison of empirical fragility curves for MSC Concrete bridges for
different regions ................................................................................................ 50
Figure 3.9. (a) Fragility curves for as-built and retrofitted bridge (b) Fragility curves for
retrofitted bridge bent using different retrofitting techniques (Billah et al. 2013)
.......................................................................................................................... 51
Figure 3.10. Effect of (a) aging (Ghosh and Padgett, 2010), (b) soil liquefaction (Aygun
et al. 2011), (c) isolation (Zhang and Huo 2009), (d) horizontal curve
xiii

(AmiriHormozaki et al. 2013), (e) skew angle (Sullivan and Nielson 2010) and
(f) scour depth (Prasad and Banarjee 2013) on fragility curves ....................... 53
Figure 3.11. Proposed methodology for developing hybrid fragility curves ......................... 59
Figure 4.1. Bond failure of concrete section having smooth SMA rebar (adapted from
Youssef et al. 2008)........................................................................................... 64
Figure 4.2. Specimens after casting ..................................................................................... 66
Figure 4.3. Sand coating of SMA rebar (a) bonded length, (b) epoxy application, (c) sand
coating and (d) sand coated rebars ..................................................................... 67
Figure 4.4. Test setup for bond behavior SMA rebar with concrete ..................................... 68
Figure 4.5. Specimens (smooth) (a) before testing, (b) after testing and (c) inside view ...... 69
Figure 4.6. Failure pattern of sand coated bars (a) radial cracking, (b) crack propagation in
concrete and (c) inside view .............................................................................. 70
Figure 4.7. Load-slip curves for pushout test of smooth SMA rebar .................................... 71
Figure 4.8. Effect of concrete compressive strength on average (a) maximum and (b)
residual bond strength of smooth SMA bar ........................................................ 72
Figure 4.9. Effect of bar diameter on average (a) maximum and (b) residual bond strength
of smooth SMA bar ........................................................................................... 74
Figure 4.10. Effect of embedment length on average (a) maximum and (b) residual bond
strength of smooth SMA bar.............................................................................. 75
Figure 4.11. Effect of concrete cover to bar diameter ratio on average (a) maximum and
(b) residual bond strength of smooth SMA bar .................................................. 76
Figure 4.12. Effect of sand coating on bond strength of SMA rebar (a) bond stress-slip
curve, (b) effect of bar diameter and (c) effect of embedment length ................. 77
Figure 4.13. Comparison between experimental and predicted values of τmax/√fc’ .............. 79
Figure 5.1. Geometry of SMA-RC bridge pier (a) Cross section, (b) Elevation and (c)
Finite element modeling .................................................................................... 83
Figure 5.2. (a) Comparison of predicted and measured strain on SMA rebar (Nakashoji
and Saiidi 2014) and (b) Comparison of predicted and measured curvature
(O’Brien et al. 2007) ......................................................................................... 86
Figure 5.3. Effect of axial load on (a) curvature profile and (b) longitudinal rebar strain
profile ............................................................................................................... 89
xiv

Figure 5.4. Effect of aspect ratio on (a) curvature profile and (b) longitudinal rebar strain
profile ............................................................................................................... 90
Figure 5.5. Effect of fy-SMA on (a) curvature profile and (b) longitudinal rebar strain
profile ............................................................................................................... 91
Figure 5.6. Effect of longitudinal reinforcement ratio on (a) curvature profile and (b)
longitudinal rebar strain profile ......................................................................... 92
Figure 5.7. Effect of transverse reinforcement ratio on (a) curvature profile and (b)
longitudinal rebar strain profile ......................................................................... 93
Figure 5.8. Effect of concrete compressive strength on (a) curvature profile and (b)
longitudinal rebar strain profile ......................................................................... 94
Figure 5.9. Comparison of measured and predicted plastic hinge lengths ............................ 96
Figure 6.1. Cross section and elevation of SMA reinforced concrete bridge pier ............... 100
Figure 6.2. (a) Moment curvature relationship of RC sections with different types of
SMAs and (b) Static pushover curves for bridge piers reinforced with different
types of SMAs ................................................................................................ 102
Figure 6.3. Comparison of experimental and numerical results (a) SMA-RC (SMA-1)
bridge pier (b) SMA-RC (SMA-4) beam ......................................................... 103
Figure 6.4. Flowchart for the development of performance based damage states for
SMA-RC bridge pier ....................................................................................... 105
Figure 6.5. Design and mean response spectrum of 10 records used for IDA analysis
matching the three different CHBDC spectrum (2%, 5%, and 10% in 50 years)
........................................................................................................................ 107
Figure 6.6. Dynamic pushover response and different damage states with distribution for
SMA-RC-1 for (a) 2% in 50 years (b) 5% in 50 years and (c) 10% in 50 years
probability of exceedance ............................................................................. 111
Figure 6.7. Dynamic pushover response and different damage states with distribution for
SMA-RC-2 for (a) 2% in 50 years (b) 5% in 50 years and (c) 10% in 50 years
probability of exceedance ............................................................................. 112
Figure 6.8. Dynamic pushover response and different damage states with distribution for
SMA-RC-3 for (a) 2% in 50 years (b) 5% in 50 years and (c) 10% in 50 years
probability of exceedance ............................................................................. 112
xv

Figure 6.9. Dynamic pushover response and different damage states with distribution
for SMA-RC-4 for (a) 2% in 50 years (b) 5% in 50 years and (c) 10% in 50
years probability of exceedance ....................................................................... 112
Figure 6.10. Dynamic pushover response and different damage states with distribution
for SMA-RC-5 for (a) 2% in 50years (b) 5% in 50 years and (c) 10% in 50
years probability of exceedance ....................................................................... 113
Figure 6.11. Fragility curves in terms of residual drift at (a) 10% in 50 years (b) 5% in
50 years and (c) 2% in 50 years probability of exceedance .............................. 117
Figure 6.12. Comparison of residual drift prediction with experimental results
(a) O’Brien et al. (2007) and (b) Youssef et al. (2008) .................................. 119
Figure 7.1. Flow diagram of PBSD of SMA-RC bridge pier ............................................. 124
Figure 7.2. Damping-Ductility relation for SMA-RC bridge pier (a) SMA-1, (b) SMA-2,
(c) SMA-3, (d) SMA-4 and (e) SMA-5 ............................................................ 128
Figure 7.3. Comparison of Damping-Ductility curve ........................................................ 129
Figure 7.4. Design Acceleration Response Spectrum ........................................................ 131
Figure 7.5. Determination of effective period from reduced displacement spectrum .......... 133
Figure 7.6. (a) Moment-Shear force interaction diagram and (b) Moment-Axial Load
interaction diagram.......................................................................................... 135
Figure 7.7. Displacement spectra of ten earthquake records matched with target response
spectrum ......................................................................................................... 136
Figure 7.8. (a) Maximum and (b) residual drift value obtained from time history analysis
of the designed pier (Red line showing the target maximum and
residual drift)................................................................................................... 137
Figure 8.1. Flowchart of the methodology for seismic risk assessment of SMA-RC bridge
piers ................................................................................................................ 141
Figure 8.2. (a) Cross section, (b) elevation and (c) finite element model of SMA-RC
bridge pier ....................................................................................................... 145
Figure 8.3. Seismic hazard curve for site soil class C in Vancouver (a) Peak ground
acceleration and (b) spectral acceleration......................................................... 147
xvi
Figure 8.4. (a) Comparison of UHS, CMS-Crustal, CMS-Interface, and CMS-Inslab at
T1 = 0.7 s, (b-d) comparison of response spectra of the selected records with
the target spectra for individual earthquake types ............................................ 148
Figure 8.5. Comparison of the PSDMs for (a) SMA-RC-1, (b) SMA-RC-2,
(c) SMA-RC-3, (d) SMA-RC-4 and (e) SMA-RC-5 considering maximum
drift as EDP..................................................................................................... 151
Figure 8.6. Comparison of the PSDMs for (a) SMA-RC-1, (b) SMA-RC-2,
(c) SMA-RC-3, (d) SMA-RC-4 and (e) SMA-RC-5 considering residual drift
as EDP ............................................................................................................ 151
Figure 8.7. Fragility curves for the five SMA-RC bridge piers for: (a) slight, (b) moderate,
(c) extensive and (d) collapse damage state considering maximum drift .......... 154
Figure 8.8. Fragility curves for the five SMA-RC bridge piers for: (a) slight, (b) moderate,
(c) extensive and (d) collapse damage state considering residual drift .............. 156
Figure 8.9. Hazard curves for five SMA-RC bridge piers (a) maximum drift and
(b) residual drift .............................................................................................. 158
xvii

LIST OF SYMBOLS AND ABBREVIATIONS
Af Austenite finish temperature of SMA
c Concrete cover db Bar diameter E Elastic modulus of SMA Fy-SMA Yield strength of SMA Fy Yield force fc
' Concrete compressive strength fP1 Austenite to martensite finishing stress of SMA fT1 Martensite to austenite starting stress of SMA fT2 Martensite to austenite finishing stress of SMA kr Surface roughness factor H Height of pier Keff Effective stiffness LP Plastic hinge length L/d Aspect ratio L Length/Height of bridge pier d Diameter of pier ld Embedment length Me Effective mass of the pier M f
Martensite finish temperature of SMA M
s Martensite start temperature of SMA
M d Design moment
Pmax Maximum load Pres Residual load Rξ Damping modification factor Sc Median of capacity τmax Maximum average bond strength τres Residual average bond strength Teff Effective time period Vbase Design base shear α Sand size coefficient βc Logarithmic standard deviation of capacity βEDP|IM Logarithmic standard deviation of demand εs Superelastic strain in SMA εr Recovery strain of SMA εSMA Strain in SMA wires εsm Steel strain at maximum tensile stress Δy Yield displacement ΔyT Target yield displacement Δmax Maximum displacement λEDP Mean annual frequency of exceedance μd Displacement ductility demand ξ0 Nominal viscous damping ξeq Equivalent viscous damping ρl Longitudinal reinforcement ratio ρs Transverse reinforcement ratio φy Yield curvature φu Ultimate curvature
xviii

AAE Average Absolute Error ACI American Concrete Institute AI Arias Intensity CFRP Carbon Fiber-Reinforced Polymer CMS Conditional Mean Spectrum CSA Canadian Standard Association CSM Capacity Spectrum Method DDBD Direct Displacement Based Design DS Damage State EDP Engineering Demand Parameter ECC Engineered Cementitious Composite IDA Incremental Dynamic Analysis IM Intensity Measure LS Limit State MCE Maximum Considered Earthquake MD Maximum Drift MMI Modified Mercalli Intensity NLTHA Non Linear Time History Analysis PBSD Performance-Based Seismic Design PBEE Performance-Based Earthquake Engineering PDF Probability Density Function PGA Peak Ground Acceleration PGD Peak Ground Displacement PGV Peak Ground Velocity PSDA Probabilistic Seismic Demand Analysis PSDM Probabilistic Seismic Demand Model PSHA Probabilistic Seismic Hazard Analysis RC Reinforced Concrete RD Residual Drift Sa Spectral Acceleration Sd Spectral Displacement SMA Shape Memory Alloy SSI Soil Structure Interaction UHS Uniform Hazard Spectra
xix

ACKNOWLEDGEMENTS
I convey my profound gratitude to the almighty Allah for allowing me to bring this effort
to fruition. I express my sincere gratitude to my advisor, Dr. M. Shahria Alam for providing
me with an opportunity to work with him at The University of British Columbia, Okanagan. I
couldn’t have asked for a better mentor and guide for my Doctoral program and I really
appreciate all the support, guidance, and motivation that he has provided me through my
academic career. He has been instrumental with knowledge, support, and mentoring that made
my graduate experience at UBC so impeccably productive and rewarding, and made a great
contribution to the success of this research.
I would like to thank my doctoral dissertation committee members, Dr. Abbas Milani
and Dr. Ahmad Rteil for always supporting my research work and providing me with great
feedback from time to time, helping me improve the quality of my work immensely. Graduate
school and experimental research facility at UBC’s Okanagan campus has provided an
excellent educational experience, and I would like to acknowledge the support I have received
for pursuing a graduate degree at this Institution from Natural Sciences and Engineering
Research Council of Canada (NSERC) and my industry sponsor Bourcet Engineering Ltd.
I feel privileged to get the opportunity to work with such an excellent group of graduate
students in the research group especially Anant, Shahidul, Kader, and Rafiqul who helped me
during my experimental works, offered technical knowledge, and friendship. I would also like
to acknowledge Dr. Nouroz Islam for his generous help in setting up the data acquisition
system. I offer my enduring gratitude to the assistance of Ryan Mandu, UBC Structures
Laboratory Technician, for assistance with the test setup.
I am truly grateful for the unconditional support of my family, without which I would
likely not be here today. My parents have offered endless support, confidence in me, wise
advice, and love. I am especially indebted to my wife, Sumaiya, for being with me and
supporting me through the past years. Her support, encouragement, and enduring love have
meant the world to me throughout this process and always.
xx

DEDICATION
This disserTaTion is dedicaTed To The
memory of my beloved faTher.
his words of inspiraTion and
encouragemenT in pursuiT of
excellence, sTill linger on.
xxi

CHAPTER 1. INTRODUCTION AND THESIS ORGANIZATION
1.1 General
In recent years, the seismic design guidelines have been focusing on performance-based
design in order to predict and better manage the post-earthquake functionality and condition
of structures. Recent developments in performance-based seismic design and assessment
approaches have emphasized the importance of properly assessing and limiting the residual
(permanent) deformations that are typically sustained by a structure after a seismic event
(Pettinga et al. 2006). If reinforced concrete (RC) structures are designed in such a way that
they are capable of withstanding large displacement with adequate energy dissipation capacity
during a seismic event which will not only eliminate the problem of permanent deformation,
but also make the structures safer against earthquakes. Thus, it will substantially scale down
the repair and maintenance cost of structures. Superelastic Shape Memory Alloy (SMA)
possesses the distinct ability to experience large deformation and retrieve its original shape
upon load removal along with high resistance to corrosion (Alam et al. 2009). This is a distinct
property that makes SMA a smart material and a strong contender for reinforcement in RC
structures particularly at critical locations (plastic hinge region), which is prone to more
damage during an earthquake.
Very often the seismic design of structures is carried out considering a simple
configuration which allows simplified analysis and design procedure. Within this simplified
procedure critical response parameters are identified and checked against design guidelines. In
contrast to buildings, the seismic response of highway bridges is controlled by the nonlinear
behavior of bridge piers. Bridge piers are one of the most vulnerable elements in a bridge
whose failure can have catastrophic consequences. Therefore, ensuring an acceptable
performance of bridge piers during a seismic event with adequate energy dissipation, ductility
and resistance to residual drift is of paramount importance. However, conventional design
approaches are focused on the strength and serviceability requirements and do not consider the
performance objectives. On the other hand, performance-based seismic design (PBSD) aims
to adopt a wider range of design scope that results in more predictable seismic performance
over the full range of earthquake demand (Marsh and Stringer 2013). Destructive earthquakes
1

of Northridge (1994) and Kobe (1995) enhanced interest in PBSD as an alternative to the
conventional approaches prescribed by the majority of the codes (AASHTO 2012, CSA-S6-
10). The evolution of PBSD has established the option for relating post-earthquake structural
performance with engineering demand parameters that allows the owner to determine the
potential functionality of a bridge following a major earthquake.
Bridge infrastructure represents a significant portion of the transportation network of any
country. Keeping bridges safe and operational is a major challenge. Conventional structural
systems are prone to excessive residual deformation under seismic loading and their
performance cannot be fully characterized without paying due attention to residual
deformation. During a seismic event, bridge piers are subjected to large lateral deformations
while supporting gravity loads from superstructure, and can experience severe damage in
plastic hinge regions. Identifying the plastic hinge length and a proper design and detailing of
the plastic hinge region is critical for ensuring adequate flexural deformation capacity and
limiting the residual drift in a bridge pier.
Considering the importance of a bridge, it is necessary to minimize the loss of bridge
functions as much as possible during earthquakes by reducing or controlling the residual drift
in bridge piers (Billah and Alam 2014c) . Conventional seismic design of bridge piers allows
yielding of the longitudinal rebar in the plastic hinge region in combination with cracking and
crushing of the concrete during a seismic event, which results in severe damage and large
permanent deformations in bridge piers. One promising solution as evident from previous
research is the application of high performance innovative materials such as shape memory
alloy in the plastic hinge region of bridge pier.
While the previous studies proved the potential of using shape memory alloys in bridge
piers, before large scale industrial implementation it is required to develop a comprehensive
design guideline and perform a complete performance-based evaluation of this novel structural
system in light of performance-based earthquake engineering (PBEE). To this end, it is
necessary to investigate the ability of such novel structural system in reducing the failure
probability as well as the annual rate of exceeding some structural demand parameters given
an earthquake scenario.
2

1.2 Objectives of the Study
The overall goal of this research is to introduce a performance-based design procedure
for design of concrete bridge piers using SMA as longitudinal reinforcement in the plastic
hinge region, and assess the accuracy and reliability of the method in lights of performance-
based earthquake engineering (PBEE). The specific objectives of the current research include:
1. Experimentally investigate the bond behaviour of SMA rebar with concrete.
2. Develop an expression for the plastic hinge length of SMA reinforced concrete (RC)
bridge pier.
3. Develop performance-based damage states for SMA-RC bridge piers considering
different SMAs and different earthquake hazard levels.
4. Propose a performance-based seismic design guideline for SMA-RC bridge piers.
5. Probabilistic seismic performance and risk assessment of SMA-RC bridge piers.
1.3 Scope and Significance of Research
This research addresses a very important issue that affects the seismic performance of
bridge structures. This study will introduce the application of SMA as reinforcement in
designing bridge piers following a performance-based approach which has emerged as a
promising alternative to the traditional design techniques. This study provides a first step by
investigating the influence of SMA as reinforcement in bridge piers in design issues, as well
as its failure probability through the development and comparison of fragility curves. The
significance of this research is highlighted below:
1.3.1 Bond behaviour of SMA rebar with concrete
Adequate bond strength between concrete and reinforcing bars has been identified as a
cardinal parameter to the satisfactory performance of RC structures (ACI 408R-03). Over
the past few years researchers have proposed and developed SMA reinforced concrete
structures for improved seismic resistance. But no study has been undertaken to evaluate
the bond behaviour of SMA rebars with concrete. In order to increase the practical
application of SMA rebars in concrete structures, it is required to identify the bond stress-
slip behaviour with concrete. Identification of the bond properties of SMA bars in concrete
will allow for safe, reliable, and efficient use of SMA.
3

1.3.2 Plastic hinge length expression for SMA-RC bridge pier
Compared to conventional bridge pier, behaviour of SMA-RC bridge pier is significantly
different and governed by the distinct superelastic and thermo-mechanical properties of
SMA. Estimating the plastic hinge length is a major step in predicting the load-drift
response of a bridge pier. As very limited test results are available on SMA-RC bridge
piers, this study developed an analytical expression for estimating the plastic hinge length
of SMA-RC bridge pier using the results of comprehensive nonlinear finite element
analyses. In order to limit the use of SMA rebar only in the plastic hinge region (i.e. to
confine damages within the region that will eventually recover), the proposed equation
will help determine the amount of SMA reinforcement to be used in the SMA-RC bridge
pier.
1.3.3 Performance-based damage states for SMA-RC bridge pier
As a prerequisite to the implementation of performance-based design for SMA-RC bridge
pier, the performance objectives and their corresponding limit state criteria need to be
properly defined. To implement such procedures, it is necessary to define damage in terms
of engineering performance criteria. In this study, various performance-based damage
states corresponding to different performance levels (cracking, yielding, and strength
degradation) were developed for SMA-RC bridge piers reinforced with different types of
SMAs under various earthquake hazard levels. The developed damage states and the
proposed residual drift prediction equation will help designers choose the right SMA from
various types while designing SMA-RC bridge piers under certain seismic hazard
condition.
1.3.4 Performance-based design of SMA-RC bridge pier
There exists no proper design guideline for designing bridge pier using SMA. Hence, this
study aims at developing a performance-based seismic design guideline for SMA-RC
bridge pier considering residual drift as the key performance indicator. This study
develops step by step procedure, with useful flow charts and graphs, for designing SMA-
RC bridge pier along with a design example.
4
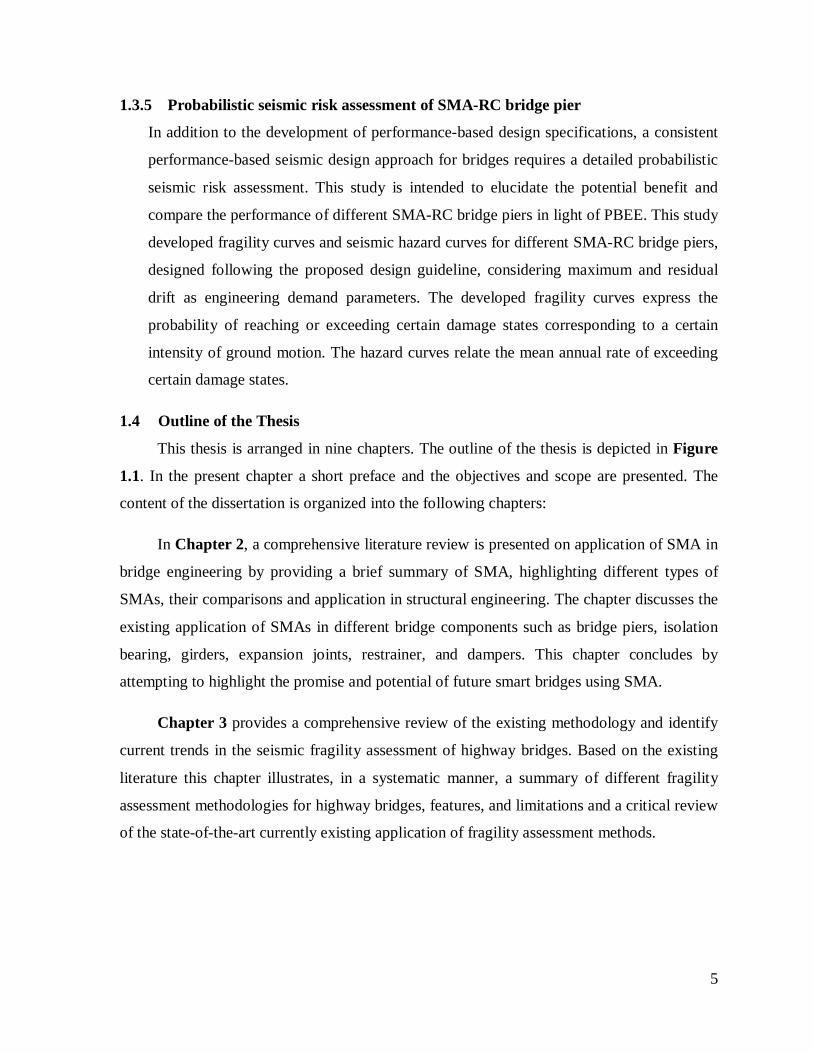
1.3.5 Probabilistic seismic risk assessment of SMA-RC bridge pier
In addition to the development of performance-based design specifications, a consistent
performance-based seismic design approach for bridges requires a detailed probabilistic
seismic risk assessment. This study is intended to elucidate the potential benefit and
compare the performance of different SMA-RC bridge piers in light of PBEE. This study
developed fragility curves and seismic hazard curves for different SMA-RC bridge piers,
designed following the proposed design guideline, considering maximum and residual
drift as engineering demand parameters. The developed fragility curves express the
probability of reaching or exceeding certain damage states corresponding to a certain
intensity of ground motion. The hazard curves relate the mean annual rate of exceeding
certain damage states.
1.4 Outline of the Thesis
This thesis is arranged in nine chapters. The outline of the thesis is depicted in Figure
1.1. In the present chapter a short preface and the objectives and scope are presented. The
content of the dissertation is organized into the following chapters:
In Chapter 2, a comprehensive literature review is presented on application of SMA in
bridge engineering by providing a brief summary of SMA, highlighting different types of
SMAs, their comparisons and application in structural engineering. The chapter discusses the
existing application of SMAs in different bridge components such as bridge piers, isolation
bearing, girders, expansion joints, restrainer, and dampers. This chapter concludes by
attempting to highlight the promise and potential of future smart bridges using SMA.
Chapter 3 provides a comprehensive review of the existing methodology and identify
current trends in the seismic fragility assessment of highway bridges. Based on the existing
literature this chapter illustrates, in a systematic manner, a summary of different fragility
assessment methodologies for highway bridges, features, and limitations and a critical review
of the state-of-the-art currently existing application of fragility assessment methods.
5

Figure 1.1. Outline of the thesis
Performance-Based Seismic Design and Assessment of Concrete Bridge Pier Reinforced with Shape Memory
Alloy Rebar
Title
Introduction Chapter-1
Probabilistic seismic risk assessment of concrete bridge piers reinforced with different types of shape memory
alloys
Chapter-8
Summary, Conclusions, and Future Works Chapter-9
Application of Shape Memory Alloy in Bridges: Research, Application and Opportunities
Chapter-2
Seismic Fragility Assessment of Highway Bridges: A State-of-The-Art Review
Chapter-3
Plastic Hinge Length of Shape Memory Alloy Reinforced
Concrete Bridge Pier
Chapter-5
Performance-based seismic design of Shape Memory Alloy reinforced
concrete bridge pier: Development of Performance-Based Damage States
Chapter-6 Performance-based seismic design of Shape Memory Alloy (SMA) reinforced concrete bridge pier:
Methodology and Design Example
Chapter-7
Bond Behavior of Smooth and Sand-Coated Shape Memory Alloy Rebar
in Concrete
Chapter-4
Rev
iew
Cor
e C
ontri
butio
n
App
licat
ion
6

Before going to the development of design guidelines, it is critical to have an appropriate
understanding of the behaviour of SMA rebar with concrete. Chapter 4, as the first step,
intends to experimentally investigate the bond behaviour of SMA rebars embedded in concrete.
The objective of this experimental investigation is to study the bond behaviour of SMA rebar
where the variables include SMA bar diameter, concrete strength, bonded length, concrete
cover, and surface condition. Based on the experimental results, empirical equation for
predicting the average maximum bond strength of SMA rebar has been developed.
Chapter 5 develops a plastic hinge length expression for SMA-RC bridge pier using an
analytical method. Using a well-calibrated finite element model, this chapter develops a plastic
hinge length expression for SMA-RC bridge pier by investigating the distribution of curvature
and strain in the longitudinal rebar (both steel and SMA rebar) along the height of the pier.
Considering different parameters such as the level of axial load, aspect ratio, concrete strength,
SMA properties and ratio of longitudinal and transverse reinforcement, a parametric study is
conducted to derive a plastic hinge length expression for SMA-RC bridge pier. Finally, the
proposed equation is used to estimate the drift capacity of SMA-RC bridge pier and compared
with test results.
Using an incremental dynamic analysis (IDA) based analytical approach (Vamvatsikos
and Cornell 2002), Chapter 6 develops performance-based damage states (based on drift
limits) for SMA-RC bridge piers reinforced with five different SMAs considering different
earthquake hazard levels. This chapter also develops residual drift based damages states for
the SMA-RC bridge piers and propose an analytical expression that can be used for predicting
the residual drift in SMA reinforced concrete elements. This chapter provides a technical basis
for the development of performance-based seismic design and evaluation methodologies for
the SMA-RC bridge piers.
Using the performance-based damage states and associated performance levels
developed in previous chapter, this chapter (Chapter 7) develops a performance-based seismic
design (PBSD) guideline for SMA-RC bridge pier considering residual drift as the key
performance indicator. This chapter also develops the damping-ductility relationship for SMA-
RC bridge piers in support of the proposed PBSD methodology.
7

In order to assess the reliability of the proposed design methodology, Chapter 8
evaluates the probabilistic seismic risk of concrete bridge piers reinforced with different types
of SMA rebars designed following the proposed guideline and using the developed bond-slip
relation and plastic hinge length equation. Considering maximum drift and residual drift as
demand parameters, fragility curves are developed for five different SMA-RC bridge piers
considering different probable earthquake hazard scenarios. Finally, seismic hazard curves,
which compare the mean annual rate of exceedance of different damage states of the different
bridge piers, are generated.
Finally, Chapter 9 presents the summary and conclusions attained from this research
study. Few specific recommendations for future research have also been suggested.
8

CHAPTER 2. APPLICATION OF SHAPE MEMORY ALLOY IN BRIDGES: RESEARCH, APPLICATION AND
OPPORTUNITIES
2.1 General
The advancement in material science along with the technology has pushed us towards
adaptive and intelligent structures and created a growing interest among researchers and
structural engineers to introduce smart materials in civil engineering applications. Shape
memory alloy (SMA), a smart material with distinct thermomechanical properties and flag
shaped hysteresis, has received much attention from researchers as a potential candidate for
use in structural engineering applications. The first application of SMA in structural
engineering can be traced back to 1991, when Graesser and Cozzarelli (1991) first introduced
SMA as a new material for seismic isolation device. Since then, application of SMA has
significantly expanded and researchers conducted extensive investigations exploring different
structural applications and developing innovative devices making use of the distinctive
characteristics of this smart material. According to a recent research report (McWilliams 2015)
the global market for smart materials has an annual growth rate of 12.8% for the period from
2011 to 2016. Although a significant portion of this market is occupied by automotive and
actuator industry, the market contribution of structural application is predicted to rise from
5.8% in 2010 to 8.5% in 2016.
Shape memory effect (SME), superelasticity (SE) and damping capacity, are three of the
many distinct properties of SMAs that make them suitable for structural engineering
applications. Moreover, the flag shaped hysteresis of SMA (Figure 2.1) allows reinforced
concrete and steel members as well as other structural components equipped with SMA to
regain its original shape upon load removal while encountering negligible or no residual drift.
With the advancement of design methods, most of the design codes around the world are
approaching towards a performance-based design. Moreover, there is a consensus among the
researchers and earthquake engineering community that structural performance cannot be fully
characterized without paying attention to residual deformation. Because of its distinctive
characteristics, SMA can undergo excessive deformations and can revert to their parent shape
through heat application or by removing the load (Alam et al. 2008a). Evidences from past
9

seismic events demonstrate that bridges undergoing large deformation are susceptible to large
residual deformation thereby rendering the bridges to be unusable and requiring major
rehabilitation or replacement. In order to maintain structural integrity and functionality of a
bridge after an earthquake, it is necessary that the bridge components avoid excessive residual
deformation or permanent damage (Kawashima et al. 1998). In an attempt to improve the
seismic performance of bridges during extreme events, researchers came up with the idea of
mitigating damages by using SMA in different bridge components. In order to take the
advantage of the intrinsic properties of SMAs, researchers have investigated their application
in bridge piers as reinforcement (using SE) (Saiidi et al. 2009), as supplementary materials in
dampers and isolators (using damping and SE) (Dezfuli and Alam 2013), and as reinforcement
and prestressing tendons in bridge girders (using SME) (Soroushian et al. 2001). Moreover,
researchers are now focusing on practical applications and developing design guidelines for
developing structural systems using SMA.
Figure 2.1. Flag shaped hysteresis of Shape memory alloy
A good number of studies reported in the literature on the application of SMAs in civil
infrastructure are available (Saadat et al. 2002; Dong et al. 2002; DesRoches and Smith 2004;
Janke et al. 2005; Wilson and Wesolowsky 2005; Song et al. 2006; Alam et al. 2007, Ozbulut
et al. 2011a, Cladera et al. 2014) which mostly highlight the application on building structures
and their vibration control. Dong et al. (2011) presented the first overview of existing
application of SMA in bridges. However, this study only focused on summarizing the existing
applications without providing any insight into the potential of different types of SMAs in
-500-400-300-200-100
0100200300400500
-0.1 -0.05 0 0.05 0.1
Stre
ss (M
Pa)
Strain
10

bridge engineering applications and future of smart bridges. Moreover, a significant amount of
research works were conducted over the last 5 years and many new SMAs have been developed
that are suitable and promising for bridge engineering applications. This chapter is aimed at
providing a comprehensive review of the existing application of different types of SMAs in
bridge engineering, and identifies the current and future trends of smart bridges using SMA.
2.2 Shape Memory Alloy
Smart materials like Shape Memory Alloys (SMAs) have demonstrated a wide range of
engineering applications namely, biomedical, robotics, aerospace, civil, and mechanical
engineering. Two distinct properties such as the shape memory effect (SME, ability to recover
plastic strain upon heating) and superelasticity (SE, ability to recover plastic strain upon load
removal) make SMA a strong contender against conventional metals and alloys for application
in various sectors. Several compositions of SMAs have been developed to date such as Ni-Ti,
Cu-Zn, Cu-Zn-Al, Cu-Al-Ni, Fe-Mn, Mn-Cu, Fe-Pd, and Ti-Ni-Cu etc. Numerous applications
of SMAs in civil engineering field have been documented (Ocel et al. 2004, Saiidi and Wang
2006, Lindt and Potts 2008, Alam et al. 2009, Araki et al. 2010, Billah and Alam 2012, Dezfuli
and Alam 2013). Most of the applications have been focusing on the use of Ni-Ti alloy while
very few focused on the application of other alloys such as Cu-based SMAs (Araki et al. 2010,
Shrestha et al. 2013), and Fe- based SMAs (Dezfuli and Alam, 2013, Czaderski et al. 2014).
Although Ni-Ti SMA shows large recoverable strain, good superelasticity and exceptionally
good resistance to corrosion, high cost of Ni-Ti SMA and machinability restrict its large scale
applications.
In an attempt to reduce the cost of SMA, researchers have come up with various Fe-
based and Cu-based low cost SMAs such as Fe-Mn-Si, Fe-Ni-Co-Ti, Fe-Ni-Nb, Cu-AL-Mn,
etc. Iron (Fe) based SMAs show good workability, machinability, weldability, and wide
transformation hysteresis as compared to Ni-Ti SMA. Although several compositions of Fe-
based SMAs have been developed, large scale application is still limited due to the poor shape
recovery limit and associated costly ‘training’ treatment. Recently Tanaka et al. (2010)
developed a ferrous polycrystalline SMA (Fe-Ni-Co-Al-Ta-B) which has a very high
superelastic strain range of over 13% at room temperature. This SMA has approximately 20
times higher SE than Fe-Ni-Co-Ti alloy and almost double that of conventional Ni-Ti alloy.
11
This Fe-based SMA has higher ductility, greater strength, and also energy dissipation capacity
several times higher than that of commercially available Ni-Ti SMA. More recently, Omori et
al. (2011) developed another Fe-based SMA (Fe-Mn-Al-Ni) which has superelasticity similar
to the conventional Ni-Ti SMA but with much lower Austenite finish temperature, which
allows this SMA to operate in superelastic range even at very low temperature. In order to
improve the machinability and reduce the cost, a Cu- based SMA (Cu-Mn-Al) has been
developed (Araki et al. 2010) which has comparable superelasticity to that of NiTi SMAs.
Moreover, these Cu–Al–Mn SMAs have comparatively lower strain rate effects than Ni–Ti
SMAs (Araki et al 2012) and also been reported to provide recentering and crack recovery
capabilities (Shrestha et al. 2013).
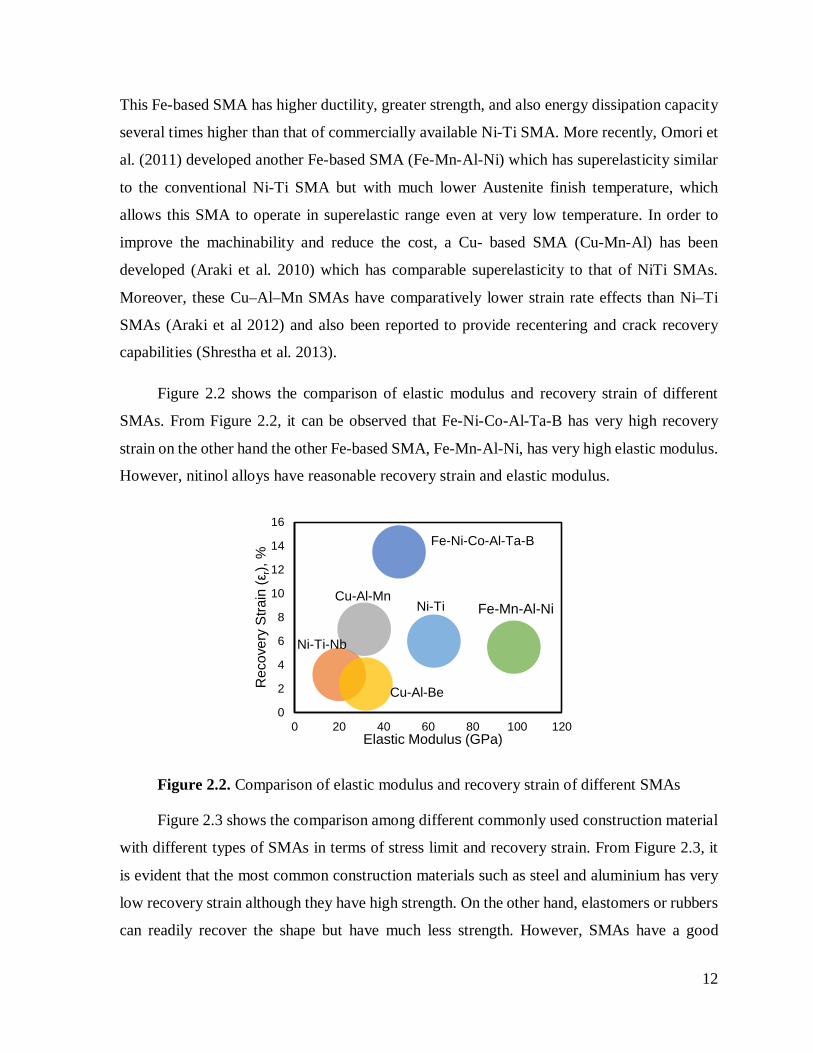
Figure 2.2 shows the comparison of elastic modulus and recovery strain of different
SMAs. From Figure 2.2, it can be observed that Fe-Ni-Co-Al-Ta-B has very high recovery
strain on the other hand the other Fe-based SMA, Fe-Mn-Al-Ni, has very high elastic modulus.
However, nitinol alloys have reasonable recovery strain and elastic modulus.
Figure 2.2. Comparison of elastic modulus and recovery strain of different SMAs
Figure 2.3 shows the comparison among different commonly used construction material
with different types of SMAs in terms of stress limit and recovery strain. From Figure 2.3, it
is evident that the most common construction materials such as steel and aluminium has very
low recovery strain although they have high strength. On the other hand, elastomers or rubbers
can readily recover the shape but have much less strength. However, SMAs have a good
Ni-Ti
Ni-Ti-Nb
Cu-Al-Mn
Cu-Al-Be
Fe-Ni-Co-Al-Ta-B
Fe-Mn-Al-Ni
0
2
4
6
8
10
12
14
16
0 20 40 60 80 100 120
Rec
over
y S
train
(εr),
%
Elastic Modulus (GPa)
12

combination of strength and recoverability and the Fe-based SMA, Fe-Ni-Co-Al-Ta-B
possesses relatively very high strength and high recoverability.
Figure 2.3. Comparison among different commonly used construction material and different
types of SMAs (adapted from Ma and Karaman 2010)
2.3 Shape Memory Alloy in Bridges
Bridge infrastructure represents a significant portion of the transportation network of any
country. If a bridge is to maintain its structural integrity and functionality after an earthquake,
severe damage to its structural components must be avoided during an earthquake.
Development and implementation of innovative structural systems and materials in bridge
construction can improve their performance under seismic loads and ensure post-earthquake
functionality. In order to mitigate the residual/permanent displacement of bridge piers,
researchers have suggested innovative structural systems such as Shape Memory Alloy (SMA)
reinforced concrete (RC) bridge columns and bridge decks with prestressed SMA wires. In
addition, development of different types of composite materials, isolation devices, and
supplemental damping devices incorporating SMA are becoming alternative options for
improving the performance of bridges during an extreme natural hazard like earthquake,
tsunami, etc. Over the last two decades, SMA has received significant attention from structural
engineers and researchers which is reflected through increasing number of research conducted
on SMA equipped structural members and elements. Among different applications of SMAs,
a significant portion of research and application is focused on bridge engineering. A number
of different applications of SMAs in bridge have been investigated to improve the structural
1
10
100
1000
10000
0.1 1 10 100 1000
Stre
ss L
imit
(MP
a)
Recoverable strain (%)
ElastomersWood
Steel
Aluminiumalloys
Fe-Ni-Co-Al-Ta-BNi-Ti
Cu-Al-Mn
Fe-Mn-Al-Ni
13

performance, a synopsis of which is given in the following sections. Figure 2.4 shows the
different applications of SMAs in bridge engineering. A major portion of SMA application is
focused on bridge piers such as active confinement (Figure 2.4a), prestressing strands (Figure
2.4b), yielding device (Figure 2.4c) and longitudinal reinforcement (Figure 2.4d). Other bridge
components which have attracted much attention are the isolation bearing and restrainer. Few
applications of SMA in expansion joints, dampers in stay cables, posttensioning tendon in
girders have been reported.
Figure 2.4. Application of SMA in bridge engineering (a) active confinement of bridge pier,
(b) Post- tensioning in segmental bridge pier, (c) Yielding device in segmental bridge pier,
(d) Reinforcement in the plastic hinge region, (e) Restrainer, (f) Isolation bearing, (g) Post-
tesioned bridge girder, (h) Expansion joint and (i) Damper in stay cables.
A summary of the statistics of application of SMAs in bridge engineering research found
in existing literature is depicted in Figure 2.5. From Figure 2.5 it is evident that, most of the
research to date, on the application of SMAs in different bridge components, is focused on
developing smart isolation bearings (37%) followed by bridge pier (25%) and dampers (19%).
Although seems promising, very little research has been conducted on application of SMAs in
bridge girders (4%) and expansion joints (3%). Table 2.1 summarizes the application of SMAs
SMA restrainer
SMA
Stra
nd
SMA
Yiel
ding
dev
ice
SMA
Reb
arSMA Tendon
SMA damper
SMA
wire
con
finem
ent
SMA spring in exapnsion joint
(a) (b) (c) (d) (e)
(f)
(g) (h) (i)
SMA Wire
14

in bridge engineering in different forms (bars, cables, wires) along with the property used in
those applications.
Figure 2.5. Statistics of application of SMA in bridge engineering
Table 2.1. Summary of SMA application in bridge engineering
Alloy Application Type Size (mm)
Propoerty Used
Study Method*
Reference
Ni-Ti Bridge Pier Bar 12.7 Superelasticity E+N Saiidi and Wang 2006, Saiidi et al. 2009, Cruz
Noguez and Saiidi 2012, 2013
Ni-Ti Bridge Pier Bar 25.4 Superelasticity A Roh and Reinhorne 2010
Ni-Ti Bridge Pier Wire 3 Shape memory E+N Shin and Andrawes 2011
Ni-Ti Bridge Pier Bar 20.6 Superelasticity N Billah and Alam 2014c Cu-Al-Mn Bridge Pier Bar 25 Superelasticity N Gencturk and Hosseini
2014 Ni-Ti Isolation
device Bar 150 Superelasticity N+A Wilde et al. 2000
Cu-Al-Be Isolation device
Bar 3.5 Superelasticity E Casciati et al. (2007)
Ni-Ti Isolation device
Wire 10 Superelasticty+ Damping
E+N Choi et al. 2005
Ni-Ti Isolation device
Wire 2 Superelasticity N Dolce et al. (2007)
Ni-Ti Isolation device
Wire 1.5 Superelasticty+ Energy
Dissipation
N+A Ozbulut and Hurlebaus (2010, 2011b)
Cu-Al-Be, Ni-Ti
Isolation device
Wire 2.76 Superelasticty+ Damping
N Bhuiyan and Alam (2013)
Fe-Ni-Co-Al-Ta-B
Isolation device
Wire 2.5 Superelasticity N Dezfuli and Alam (2013)
Bridge Pier25%
Isolation Bearing
37%
Restrainer12%
Damper19%
Expansion Joint3%
Bridge Girder
4%
15
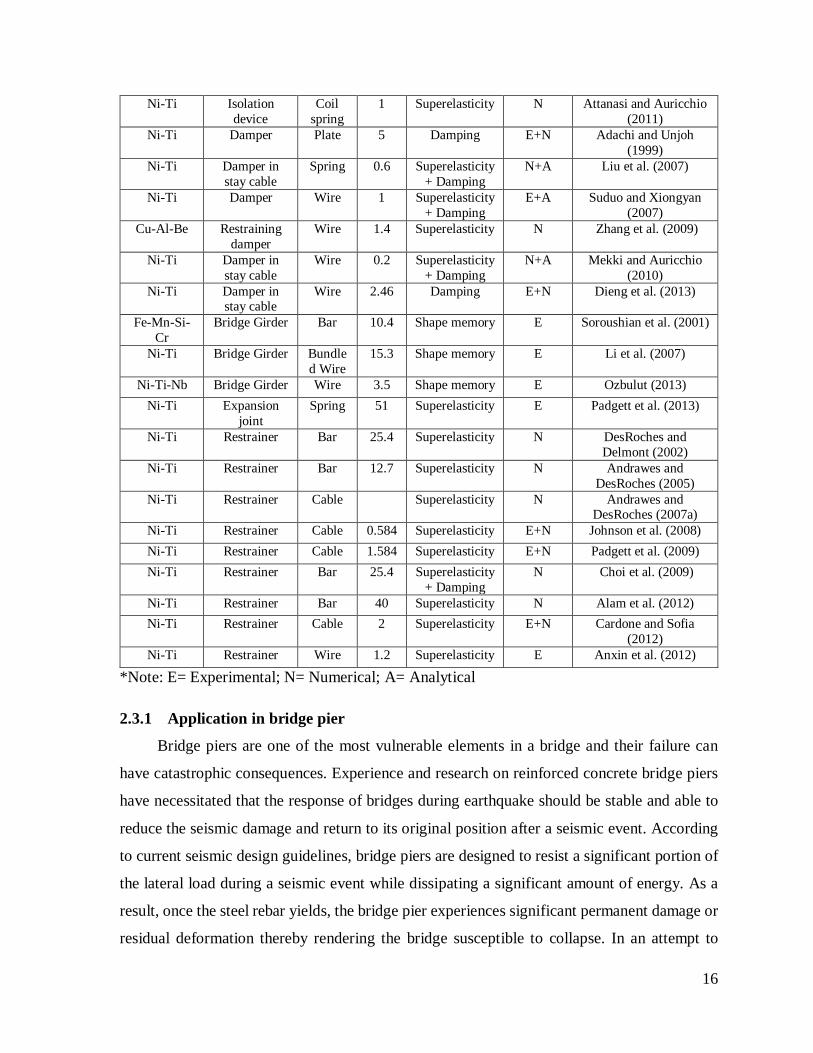
Ni-Ti Isolation device
Coil spring
1 Superelasticity N Attanasi and Auricchio (2011)
Ni-Ti Damper Plate 5 Damping E+N Adachi and Unjoh (1999)
Ni-Ti Damper in stay cable
Spring 0.6 Superelasticity + Damping
N+A Liu et al. (2007)
Ni-Ti Damper Wire 1 Superelasticity + Damping
E+A Suduo and Xiongyan (2007)
Cu-Al-Be Restraining damper
Wire 1.4 Superelasticity N Zhang et al. (2009)
Ni-Ti Damper in stay cable
Wire 0.2 Superelasticity + Damping
N+A Mekki and Auricchio (2010)
Ni-Ti Damper in stay cable
Wire 2.46 Damping E+N Dieng et al. (2013)
Fe-Mn-Si-Cr
Bridge Girder Bar 10.4 Shape memory E Soroushian et al. (2001)
Ni-Ti Bridge Girder Bundled Wire
15.3 Shape memory E Li et al. (2007)
Ni-Ti-Nb Bridge Girder Wire 3.5 Shape memory E Ozbulut (2013) Ni-Ti Expansion
joint Spring 51 Superelasticity E Padgett et al. (2013)
Ni-Ti Restrainer Bar 25.4 Superelasticity N DesRoches and Delmont (2002)
Ni-Ti Restrainer Bar 12.7 Superelasticity N Andrawes and DesRoches (2005)
Ni-Ti Restrainer Cable Superelasticity N Andrawes and DesRoches (2007a)
Ni-Ti Restrainer Cable 0.584 Superelasticity E+N Johnson et al. (2008) Ni-Ti Restrainer Cable 1.584 Superelasticity E+N Padgett et al. (2009) Ni-Ti Restrainer Bar 25.4 Superelasticity
+ Damping N Choi et al. (2009)
Ni-Ti Restrainer Bar 40 Superelasticity N Alam et al. (2012) Ni-Ti Restrainer Cable 2 Superelasticity E+N Cardone and Sofia
(2012) Ni-Ti Restrainer Wire 1.2 Superelasticity E Anxin et al. (2012)
*Note: E= Experimental; N= Numerical; A= Analytical
2.3.1 Application in bridge pier
Bridge piers are one of the most vulnerable elements in a bridge and their failure can
have catastrophic consequences. Experience and research on reinforced concrete bridge piers
have necessitated that the response of bridges during earthquake should be stable and able to
reduce the seismic damage and return to its original position after a seismic event. According
to current seismic design guidelines, bridge piers are designed to resist a significant portion of
the lateral load during a seismic event while dissipating a significant amount of energy. As a
result, once the steel rebar yields, the bridge pier experiences significant permanent damage or
residual deformation thereby rendering the bridge susceptible to collapse. In an attempt to
16

reduce the damage of bridge pier and limit the residual deformation, researchers came up with
the idea of using SMA in the plastic hinge region of the bridge pier which is subjected to
significant nonlinear deformation under ground motion (Saiidi and Wang 2006).
The feasibility of application of SMA in bridge pier was first investigated by Saiidi and
Wang (2006). They incorporated Ni-Ti SMA bars in the plastic hinge region of RC piers and
conducted shake table tests on quarter scale RC bridge piers. They found that SMA reinforced
piers encountered very negligible residual deformation (0.2%) which is important for keeping
the bridge pier functional following an earthquake. Later, Saiidi et al. (2009) investigated the
performance of bridge pier incorporating SMA and engineered cementitious composite (ECC)
in the plastic hinge region. They tested the bridge piers under reverse cyclic loading and
concluded that incorporation of SMA and ECC reduced the residual deformation by 83% as
compared to conventional bridge pier and increased the drift capacity significantly. Andrawes
et al. (2010) and Shin and Andrawes (2011) experimentally investigated the feasibility of using
SMA spirals for seismic retrofitting of bridge piers. They concluded that this active
confinement technique is more effective and reliable as compared to conventional passive
confinement techniques. Shin and Andrawes (2011) concluded that retrofitting using SMA
spirals can be cost effective as compared to conventional FRP or steel jackets as it requires
small amount of SMA and limited labor as well as the damaged bridge can be restored within
a short period of time. Roh and Reinhorne (2010) incorporated SE SMA bar at the base
segment of precast segmental bridge pier to improve the energy dissipation capacity and self
centering capacity of unbounded post-tensioned segmental columns. They developed new
modeling techniques of SMA bar comprising of four springs and analyzed segmental bridge
piers with SMA rebar under quasi-static cyclic loading. They found that the inclusion of SMA
bar provides good recentering, high ductility and stable energy dissipation. Cruz Noguez and
Saiidi (2012, 2013) conducted shake table tests on a four span bridge system with conventional
and advanced details. The bridge had three column bents each consisting of two bridge piers
and each bent had a different unconventional detailing in the plastic hinge region. One of the
bents had a combination of SMA and ECC in the plastic hinge region while the other two had
elastomeric bearing pads and posttensiong tendons. Their results showed that, bridge piers with
SMA-ECC exhibited higher ductility and experienced minimal damage. They found that the
rotational deformations were higher for bridge pier detailed with SMA-ECC as compared to
17

conventional RC pier. However, the residual deformation was significantly reduced which
allowed the bridge to remain serviceable after the maximum design earthquake. Billah and
Alam (2014c) investigated the seismic vulnerability of bridge pier reinforced with SMA in the
plastic hinge region and compared with conventional RC pier. They found that conventional
bridge pier is less vulnerable when ductility is considered as the demand parameter. On the
contrary, when the residual drift is considered as the demand parameter, the SMA-RC pier
possesses significantly less vulnerability as compared to conventional bridge pier. Moreover,
SMA-RC pier was reported to improve the performance in terms of different performance
criteria (yielding, concrete spalling, and crushing). Gencturk and Hosseini (2014) utilized Cu-
based SMA in the plastic hinge region of concrete bridge pier and analyzed under the combined
action of shear, flexure and axial loading. They concluded that the application of Cu-Al-Mn
SMA eliminates the residual deformation significantly but results in a significant reduction in
the energy dissipation capacity.
2.3.2 Seismic isolation of bridges
Base isolation systems have been proven as one of the most effective and attractive
techniques for seismic response control of bridges. Over the past years, a wide variety of
seismic isolation devices have been developed (Ozbulut and Hurlebaus 2010, 2011b, Attanasi
and Auricchio 2011, Dezfuli and Alam 2013, Bhuiyan and Alam 2012) and researchers are
continuously working on the development of novel isolation devices to overcome the
shortcomings of the existing ones. The following section describes different application of
SMAs in developing smart isolation bearings.
2.3.2.1 SMA bar based devices
The first application of SMA in bridge isolation bearing can be traced back to 1996 when
Bondonet and Filiatrault (1996) analytically investigated the feasibility of using SMA in a
bridge bearing. They found that incorporation of SMA in the bearing reduced the deck
acceleration by 90% as well as significantly reduced the bearing residual deformation. Wilde
et al. (2000) proposed a laminated rubber bearing with SMA bar and compared its performance
with conventional lead core rubber bearing. They concluded that SMA based isolation device
reduced the vulnerability of bridge and dissipated more energy as compared to the conventional
system. Using a combination of three inclined SMA bars with two disks, Casciati et al. (2007)
18
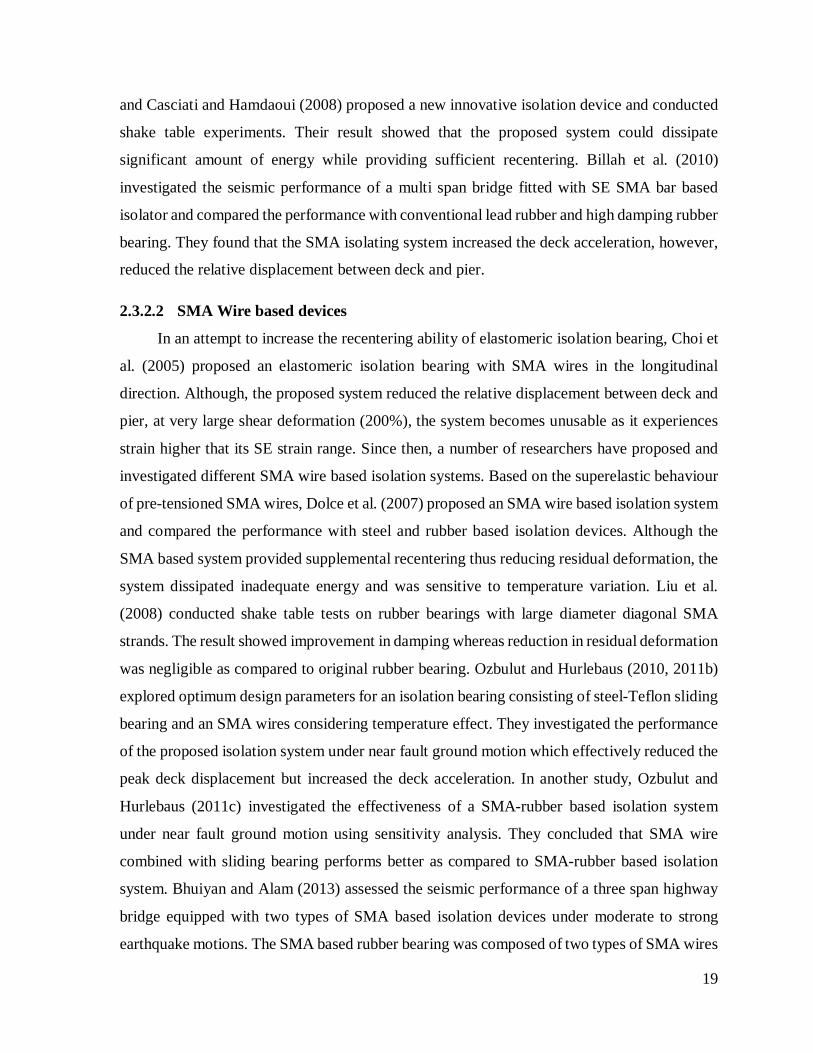
and Casciati and Hamdaoui (2008) proposed a new innovative isolation device and conducted
shake table experiments. Their result showed that the proposed system could dissipate
significant amount of energy while providing sufficient recentering. Billah et al. (2010)
investigated the seismic performance of a multi span bridge fitted with SE SMA bar based
isolator and compared the performance with conventional lead rubber and high damping rubber
bearing. They found that the SMA isolating system increased the deck acceleration, however,
reduced the relative displacement between deck and pier.
2.3.2.2 SMA Wire based devices
In an attempt to increase the recentering ability of elastomeric isolation bearing, Choi et
al. (2005) proposed an elastomeric isolation bearing with SMA wires in the longitudinal
direction. Although, the proposed system reduced the relative displacement between deck and
pier, at very large shear deformation (200%), the system becomes unusable as it experiences
strain higher that its SE strain range. Since then, a number of researchers have proposed and
investigated different SMA wire based isolation systems. Based on the superelastic behaviour
of pre-tensioned SMA wires, Dolce et al. (2007) proposed an SMA wire based isolation system
and compared the performance with steel and rubber based isolation devices. Although the
SMA based system provided supplemental recentering thus reducing residual deformation, the
system dissipated inadequate energy and was sensitive to temperature variation. Liu et al.
(2008) conducted shake table tests on rubber bearings with large diameter diagonal SMA
strands. The result showed improvement in damping whereas reduction in residual deformation
was negligible as compared to original rubber bearing. Ozbulut and Hurlebaus (2010, 2011b)
explored optimum design parameters for an isolation bearing consisting of steel-Teflon sliding
bearing and an SMA wires considering temperature effect. They investigated the performance
of the proposed isolation system under near fault ground motion which effectively reduced the
peak deck displacement but increased the deck acceleration. In another study, Ozbulut and
Hurlebaus (2011c) investigated the effectiveness of a SMA-rubber based isolation system
under near fault ground motion using sensitivity analysis. They concluded that SMA wire
combined with sliding bearing performs better as compared to SMA-rubber based isolation
system. Bhuiyan and Alam (2013) assessed the seismic performance of a three span highway
bridge equipped with two types of SMA based isolation devices under moderate to strong
earthquake motions. The SMA based rubber bearing was composed of two types of SMA wires
19

(Ni-Ti and Cu-Al-Be) in natural rubber bearing and the other one was high damping rubber
bearing. They concluded that SMA based bearing was effective in controlling residual
deformation and pier displacement under moderate ground motions but under strong ground
motion their effectiveness reduced significantly. Dezfuli and Alam (2013) proposed a diagonal
configuration of SMA wire based isolation device incorporating FeNiCoAlTaB-SMA, with
13.5% superelastic strain and a very low austenite finish temperature (-620C). They concluded
that the proposed system performed effectively under varying temperature condition with
sufficient energy dissipation capacity. Recently, Dezfuli and Alam (2014) proposed a
performance-based design and assessment methodology for high damping rubber bearing
incorporating SMA wires. They presented a design methodology and example for determining
the pre-strain and cross section of wires in the SMA wire-based rubber bearings.
2.3.2.3 SMA Spring based devices
Masuda et al. (2004) proposed a constitutive equation for an SMA spring based base
isolation device using finite element analysis. Attanasi and Auricchio (2011) proposed an SMA
spring based isolation device consisting of eight SMA springs in combination with a flat sliding
bearing. They presented a design example which satisfied all the design requirements. They
concluded that the proposed spring based isolation device performed better than the other SMA
based isolation devices.
2.3.3 Dampers in bridges
The superelasticity and damping property of SMA along with excellent corrosion
resistance have attracted researchers to develop and investigate SMA-based damping devices
for vibration control of multi span bridges and cable stayed bridges. Adachi and Unjoh (1999)
developed a NiTi SMA based damping device for seismic response control of bridges and
conducted shake table tests. Test results showed that the SMA damping device is efficient in
shape memory phase and can significantly improve the seismic performance of a bridge
through enhanced damping. Liu et al. (2007) conducted an experimental investigation on
combined stay cable/SMA damper system under sinusoidal excitations. They found that the
SMA damper could effectively supress the vibration in first few dominant modes and the
efficiency of the damper is dependent on the damper stiffness, its energy dissipation capability,
the yielding deflection and the location. Xu and Zhuo (2007) developed a novel SMA based
20

adjustable fluid damper for vibration control in cable stayed bridges. They proposed a design
procedure for selecting the adjustable fluid dampers for vibration mitigation in stay cables.
In an attempt to reduce the cable vibration and increase damping, Casciati et al. (2008)
investigated several combinations of steel cable-SMA wire systems. They observed a decrease
in vibration amplitude and increase in damping coefficient by up to 124% when a combination
of steel cable-SMA wire is used as opposed to steel cable. Sharabash and Andrawes (2009)
conducted an analytical investigation on the effectiveness of an SMA damper to control the
deck displacement and shear and bending moment demand on towers of a cable stayed bridge.
They found that application of SMA damper reduced the maximum bridge displacement,
towers base shear, and towers base moment by up to 65%, 65%, and 69%, respectively
compared to that of the bridge without SMA damper. Zhang et al. (2009) developed a
superelastic Cu-Al-Be SMA wire based passive control device considering wide temperature
range from -800C to 1200C. The proposed control device significantly reduced the overall
bridge deformation and bearing deformation when subjected to strong ground motions. Mekki
and Auricchio (2010) proposed and investigated the performance of a passive control device
for stay cable in cable stayed bridges by utilizing the superelasticity and damping property of
SMA. They concluded that the proposed device could effectively dampen the high free
vibration of stay cables as compared to conventional tuned mass dampers. Dieng et al. (2013)
experimentally investigated the efficiency of Ni-Ti SMA damper in reducing the vibration of
cables in cable stayed bridges. Experimental result proved the efficacy of SMA dampers in
reducing the oscillation periods and their amplitudes.
2.3.4 Prestressing in bridge girders
Although a significant amount of research has been conducted on the application of SMA
in bridge piers, isolation bearings, active and passive dampers, very few research works have
been conducted on SMA’s application in bridge girders. Maji and Negret (1998) pioneered the
concept of smart prestressing using SE SMA in bridge girders. They used SMA strand-wires
as prestressing tendons which showed good bonding strength with concrete. They concluded
that this smart prestressing can actively accommodate additional loading and overcome
prestress loss over time. Li et al. (2007) experimentally investigated the application of bundled
SMA wire in smart bridge girders. They concluded that using the shape memory property of
21

SMA bundle, the load bearing capacity of bridge girders can be improved by applying current.
Ozbulut (2013) experimentally investigated the feasibility of using shape memory alloys for
developing self-post-tensioned concrete bridge girders. They aimed at eliminating the jacking
force by developing self-stressing capacity using the shape memory effect of SMAs developed
from the heat of hydration of grout.
2.3.5 Retrofitting of bridge girders
Using the shape memory effect of SMA, Soroushian et al. (2001) investigated the
feasibility of using iron based martensite SMA rebar for rehabilitation of shear deficient bridge
girders. They developed a design methodology and verified through experimental tests
simulating the real bridge scenario. They applied this rehabilitation method on U.S. Route 31
bridge in Michigan using posttensioned SMA rod which reduced the crack width in girders by
40%.
2.3.6 Application in bridge expansion joints
Bridge expansion joints are one of the vulnerable components in highway bridges when
subjected to moderate to severe ground motion. Although different design guidelines are
limiting or eliminating the application of expansion joints in bridges, however, application of
smart modular expansion joints can enhance the overall bridge seismic response. In order to
eliminate the limitations of current expansion joints and make the use of SMA’s distinct
thermomechanical properties, Padgett et al. (2013) developed and tested an SMA based smart
expansion joint. They tested different configurations of SMA enhanced modular expansion
joints including rings, single stacked bevels, double stacked bevels, triple stacked bevels, round
bar S shapes, dollar signs, flat plate s shapes, solid section springs, hollow section springs, and
omega shape SMAs. They found that a solid section of SMA spring met all the design and
performance objectives. Based on the experimental results, analytical model of the smart
expansion joint was developed and validated against test results. They also assessed the
comparative vulnerability of conventional and the SMART expansion joints which revealed
superior seismic response of the SMART expansion joint. Finally, a comparative life cycle
analysis revealed that the developed SMART bridge expansion joint offers a cost effective
solution to supplement large capacity joints typically adopted in critical lifeline bridges.
22

2.3.7 Restrainer in bridges
Deck unseating resulting from the excessive longitudinal deformation at in-span hinges
or supports has been identified as a common bridge damage scenario during recent earthquakes
(1994 Northridge, 1999 Chi Chi, 2010 Chile, and 2011 Christchurch earthquake). Since early
1970, steel restrainers have been used as an effective means of reducing pounding or deck
unseating. However, the poor performance of steel restrainers during the 1994 Northridge and
the 1995 Kobe earthquake triggered the need for more efficient restrainers for improved
seismic performance (DesRoches and Delemont 2002). In an attempt to reduce the seismic
vulnerability of bridges, DesRoches and Delemont (2002) numerically investigated the
performance of SMA restrainer bars. Using 25.4 mm SMA bar as restrainer at the intermediate
hinges and abutments, they evaluated the seismic performance of bridge under near fault
motions. Comparison of SMA restrainer with conventional steel restrainer cable revealed the
superior performance of SMA restrainer in limiting relative hinge displacements at the
abutment and deck movement. After that, Andrawes and DesRoches (2005) investigated the
performance of 12.7 mm SMA restrainer in preventing the unseating and limiting the relative
hinge deformation of multiple frame RC box girder bridge. They concluded that SMA
restrainers outperformed conventional steel cable restrainer without increasing the ductility
demand in the bridge. Subsequently, Andrawes and DesRoches (2007a) compared the
effectiveness of SMA restrainer as a retrofit measure with conventional steel restrainers,
metallic dampers, and viscoelastic dampers. They concluded that the effectiveness of retrofit
measure is dependent on the bridge geometry and ground motions characteristics. They found
that SMA restrainer was effective in limiting residual joint opening as well as restricting
unseating. In another study, Andrawes and DesRoches (2007b) investigated the effect of
varying temperature on the performance of SMA restrainer in bridges. They found that the
effect of temperature is more pronounced near the austenite finish and the effectiveness of
SMA restrainer increases at higher ambient temperatures. Johnson et al. (2008) conducted
large scale shake table test to investigate the performance of in-span hinges equipped with
SMA restrainers and steel cable restrainer. Although, both SMA and steel restrainer
experienced similar forces, SMA restrainer experienced limited residual strain while showing
little strength and stiffness degradation. Padgett et al. (2009) developed an SMA restrainer
cable, connected at the deck-abutment interface of a RC slab bridge and conducted shake table
23

tests. Test results revealed the efficacy of SMA cables which reduced the unseating potential
through reduction in the as-built openings by 47% and 32% for low-level and high-level
loading, respectively. Choi et al. (2009) experimentally investigated the bending behavior of
large diameter SMA bars under various loading speed to determine its feasibility to use as
restrainer in bridges to overcome the shortcomings of SMA cable restrainers. They conducted
a numerical study on a three span bridge in a moderate seismic zone using SMA bending bar
as restrainer. They concluded that the bar restrainer was effective in reducing the hinge opening
and the pounding force on abutments. Anxin et al. (2012) conducted shake table tests on SMA
wire restrainers connected in the form of deck-deck and deck-pile connections. Their result
showed that, SMA restrainers installed in the form of deck-pile connections can significantly
decrease the displacement responses of the isolators in the highway bridge. Alam et al. (2012)
investigated the seismic fragility of isolated bridge equipped with SMA restrainer under strong
ground motions. Two types of isolation bearings, namely, high damping rubber bearings and
lead rubber bearings were used in combination with SMA restrainer. They concluded that when
the bridge is isolated using lead rubber bearing, inclusion of SMA restrainer increases the
failure probability. Cardone and Sofia (2012) conducted shake table tests to evaluate the
effectiveness of SMA-based cable restrainers in controlling the displacement response of
simply supported deck bridges. Test results revealed that, inclusion of SMA restrainer provides
additional protection to the isolation bearings.
2.4 Comparison of SMA based and Conventional Bridge Component Performance
Discussions in the previous sections showed that significant amount of research has been
conducted to improve the performance of different bridge components using different forms
and types of SMAs. This section is intended to provide a brief summary of the comparative
performance of different SMA-based and conventional bridge components. Table 2.2 shows
the performance comparison of different conventional and SMA-based smart bridge
components. In Table 2.2 the performance of SMA-based and conventional bridge components
are compared in terms of residual drift and energy dissipation. From Table 2.2 it can be
concluded that SMA as reinforcement in bridge pier significantly reduces the residual
deformation irrespective of the type (Ni-Ti or Cu-based) and form (bar and wire) used. When
SMA wires are used in isolation bearing, except Cu-Al-Be SMA, other SMAs have shown
24

improvement in isolation bearing performance in terms of reducing pier displacement, residual
deformation and viscous damping.
Table 2.2. Performance comparison of SMA-based and conventional bridge components
Bridge Component
Alloy Type Performance indicator
SMA-based component
Conventional Reference
Pier Ni-Ti Rebar Residual Drift (%) 0.36 2.66 Saiidi et al. 2009 Cu-Al-Mn Rebar Residual Drift (%) 0.39 2.78 Shrestha et al. 2015 Ni-Ti Wire Displacement
ductility 8 2.8 Shin and Andrawes
2011 Hysteretic energy (kJ)
16.1 75.9 Shin and Andrews 2011
Isolation Bearing
Ni-Ti Wire Pier displacement (mm)
55.8 98.3 Bhuiyan and Alam 2013
Cu-Al-Be Wire Pier displacement (mm)
129 98.3 Bhuiyan and Alam 2013
FeNiCoAlTaB Wire Residual deformation (mm)
10.2 5.4 Dezfuli and Alam 2013
Viscous damping (%)
7.5 9.2 Dezfuli and Alam 2013
Restrainer Ni-Ti Cable Maximum displacement (mm)
32 61 Jhonson et al. 2008
Energy dissipation (kN-mm)
263 112 Jhonson et al. 2008
Ni-Ti Cable Residual joint opening (mm)
43 87 Andrawes and DesRoches 2007
Ni-Ti Bar Relative deck and abutment displacement (mm)
63.8 84.6 DesRoches and Delemont 2002
Dampers Ni-Ti Cable Deck displacement (mm)
54 200 Sharabash and Andrawes 2009
Tower base shear (MN)
10.29 30.59
Ni-Ti Cable Damping ratio (%) 1.08 0.41 Liu et al. 2007 Expansion Joint
Ni-Ti Spring Column displacement (inch)
0.17 2.17 Padgett et al. 2013
2.5 Promising SMAs for Application in Bridges
To date several compositions of SMAs have been developed and their application in
different fields of civil engineering have been investigated. There are several compositions of
SMA that have strong potentials for application in bridge engineering, especially in seismic
prone areas and in areas where the temperature changes form extreme hot to extreme cold.
Again, some of those SMAs have been developed as wires or thin sheets, but not as rebars.
Figure 2.6 shows the hysteretic response of three different SMAs that have potential for civil
25

engineering application. From Figure 2.6 it can be observed that, the Ni-Ti alloy (Alam et al.
2008a) has lower maximum strain (~6%) but very high strength (> 500MPa) and fatter
hysteresis loop. On the other hand, the Cu-Al-Mn alloy (Varela et al. 2014) has maximum
strain of 8% but much less strength (< 400 MPa) and thin hysteresis loop.
Table 2.3 provides a summary of six SMAs that have very good potential for application
in bridge engineering. In Table 2.3 compositions of Ni-based, Cu-based and Fe-based SMAs
are provided along with their properties desirable for different bridge engineering applications.
All the alloys presented in that table has austenite finish temperature (Af) less than -100C which
indicates that all of them can be used in cold regions where temperature varies over a wide
range.
Figure 2.6. Comparison of hysteretic response of different SMAs
The Ni-Ti alloy (Alam et al. 2008a) possess reasonable elastic modulus, yield strength
comparable to conventional steel, good recovery strain of 6% and Af on the negative side. Ni-
Ti SMAs with similar composition and mechanical properties have been used by several
researchers as reinforcement in bridge piers (Saiidi and Wang 2006, Billah and Alam 2014c)
and as restrainers which (Andrawes and DesRoches 2005, Padgett et al. 2009) performed very
well under extreme earthquake events. One drawback of this alloy is that it may not be used in
cold regions where the temperature goes beyond -100C unless manufactured with lower Af.
The second alloy, Ni-Ti-Nb can be used as spirals for retrofitting of bridge piers, tendons
for prestressing of bridge girders as well as for isolation bearing with SMA wires. This alloy
0
100
200
300
400
500
600
700
0 5 10 15 20
Stre
ss (M
Pa)
Strain (%)
26

can be used as self-heating posttensioning tendons in bridge girders using the heat of hydration
of concrete and external heat application.
The Cu-based SMAs (Cu-Al-Mn and Cu-Al-Be) have very low Af which is good for cold
weather application but have lower elastic modulus and yield strength as compared to Ni-based
SMAs. However, these SMAs have much low cost as compared to Ni-based SMAs. The Cu-
Al-Mn SMA has very high recovery strain (7%) which holds promise for application in bridge
girders as prestreesing tendons as well as in post-tensioned segmental bridge pier construction.
Although the Cu-Al-Be has very low recovery strain (3.2%) it is appropriate for damping
application in the austenite phase.
Table 2.3. Potential SMAs for application in bridge engineering
Alloy Composition E (Gpa) Fy-SMA (MPa)
εmax (%) εr (%) Af (0C) Reference
Ni-Ti 50.02-49.98 62.5 401 6.8 6 -10 Alam et al. 2008a Ni-Ti-Nb 47.45-37.86-14.69 20 250 7 3.2 -22 Park et al. 2010 Cu-Al-Mn 71.9-16.6-9.3 31.2 210 8 7 -39 Araki et al. 2010 Cu-Al-Be 87.68-11.7-0.62 32 230 3 2.4 -65 Zhang et al. 2010
Fe-Ni-Co-Al-Ta-B
59.05-28-17-11.5-2.5-0.05
46.9 750 15 13.5 -62 Tanaka et al. 2010
Fe-Mn-Al-Ni 43.5-34-15-7.5 98.4 320 6.1 5.5 <-50 Omori et al. 2011
E= elastic modulus, Fy-SMA= austenite to martensite starting stress, εmax= maximum strain, εr= recovery strain, Af= austenite finish temperature
Recently Tanaka et al. (2010) developed a ferrous polycrystalline SMA (Fe-Ni-Co-Al-
Ta-B) which has a very high superelastic strain range of over 13% at room temperature. This
SMA has approximately 20 times higher SE than other Fe-based alloys and almost double that
of conventional Ni-Ti alloy. This Fe based SMA has extremely high ductility, greater strength,
and energy damping capacity several times higher than commercially available Ni-Ti SMA.
All these criteria make this an outstanding candidate for all types of bridge engineering
applications especially in seismic regions. More recently Omori et al. (2011) developed
another Fe based SMA (Fe-Mn-Al-Ni) which has superelasticity similar to the conventional
Ni-Ti SMA but with temperature insensitive superelasticity. This temperature insensitive
property is very important for cold region engineering especially in North America and Europe
where the temperature varies over a wide range. The Fe based SMA have low temperature
sensitivity which will allow good bonding and compatibility with cement based matrix. This
27

SMA is also another strong contender for various applications in bridge engineering as
discussed in this study. Moreover, this alloy is composed of commonly available low cost
metals with good workability and corrosion resistance. On the other hand, this alloy does not
require any thermo-mechanical treatment or ‘training’ to improve its SME like other Fe based
SMA which will substantially reduce the production cost (Omori et al. 2011). Moreover,
application of this alloy in construction will reduce the difficulties of forming and machining
associated with commercial Nitinol alloys. Table 2.4 summarizes the properties of SMA
applicable for different bridge engineering applications and their advantages.
2.6 Future of Smart Bridges
The rapidly increasing interest in SMAs, both in research and commercial applications,
indicate the increasing potential of smart infrastructures. The application of this smart material
in bridge engineering is expected to develop in the following three levels: (a) development of
low cost SMAs with improved machinability and properties suitable for civil engineering
application, (b) development of hybrid structures combining the functional properties of SMAs
with the structural properties of other materials, and (c) development of novel ideas and design
guidelines for civil engineering applications.
The potential of developing smart bridges using different shape memory alloy based
components have been investigated by researchers over the last 15 years. Li et al. (2007)
proposed a conceptual smart RC bridge using bundled SMA in the bridge girder. Their concept
was to use the shape recovery property of SMA when subjected to excessive loading. Alam et
al. (2008b) proposed another SMA-based smart simply supported bridge system where
different bridge components such as the bridge deck, girders, and piers are reinforced with
SMA rebars, the bridge is equipped with SMA-based isolators, dampers, and fiber optic
sensors. They concluded that the proposed smart configuration will allow continuous
monitoring, permit excessive vehicle loading beyond design level on the bridge, and possess
improved energy dissipation and recentering ability during extreme seismic event. However,
all the ideas are still in conceptual phase but not have been implemented in real applications
due to the high cost of SMA. However, researchers are continuously exploring various
combinations of SMA and came up with various low cost Fe-based and Cu-based SMAs with
excellent properties which hold great promise and enormous potential for large scale
28

application in bridge engineering ensuring enhanced safety. Improved seismic performance of
bridge piers with SMA as reinforcement attracted Washington Department of Transportation
and they decided to use SMA in one of the piers of the three span SR-99 bridge in Seattle, WA
(Kosowatz 2014). Moreover, researchers are working towards development of design
guidelines for SMA based bridges. For example, Dezfuli and Alam (2014) developed
performance-based design guidelines for FRP-based high damping rubber bearing
incorporating SMA wire.
Table 2.4. Summary of SMA properties for bridge engineering application and their effects
SMA Properties
Consequences Practical Application in Bridges
Shape memory effect
Material can be used as post tensioning or prestressing tendons, providing force during shape recovery
Active confinement of bridge piers, Prestressing of bridge decks and girders, Post-tensioning of segmental bridge piers, Post-tensioning of bridge pier-cap beam joint, Isolation Bearing.
Superelasticity Elastic recovery of strain and material can be stressed to provide large, recoverable deformations at relatively constant stress levels
Reinforcement in bridge piers and bridge beam-column joints, Connection between footing and first segment of segmental bridge pier, Short fibers in bridge girders, Bridge restrainer, Isolation Bearing.
Hysteresis Allows for significant energy dissipation without permanent deformation under cyclic loading
Reinforcement in bridge piers and bridge beam-column joints, Connection between footing and first segment of segmental pier, Active confinement of bridge piers.
Recovery Strain
Little or no permanent deformation Reinforcement in bridge piers, girdrs, and bridge beam-column joints, Connection between footing and first segment of segmental bridge pier, Active confinement of bridge piers, Bridge restrainer, Isolation Bearing.
Damping Allows to work as a passive system which dissipates energy during every cycle of the oscillating system without requiring external control.
Structural cables in stay cable bridges, suspension bridges, and prestressed concrete bridges, Isolation bearings.
Fatigue Allows the material to undergo several thousands of cycles
Structural cables, Dampers, Isolation Bearings
Corrosion Resistance
Allows application in harsh environment
Reinforcement in bridge piers, Active confinement of bridge piers, dampers and structural cables in aggressive marine environment.
29

2.7 Summary
Shape memory alloys (SMAs) are special materials with distinct thermomechanical
properties that allow them to ‘memorize’ or retain their original shape when subjected to load
or temperature. In recent years, SMAs have drawn significant attention and interests among
researchers and structural engineers for diverse civil engineering applications. Superelasticity,
shape memory effect and hysteretic damping, are the three major attributes of SMAs that make
them ideally suited for bridge engineering applications. The increasing interest on SMAs in
bridge engineering research indicates the emerging potential of SMA in construction industry.
This chapter provided a review of existing applications of SMAs in bridge engineering,
summarized the research results on different SMA based components, categorized the
applications in different bridge component domain, and highlighted the sectors of potential
development and future application opportunities.
30

CHAPTER 3. SEISMIC FRAGILITY ASSESSMENT OF HIGHWAY BRIDGES: A STATE-OF-THE-ART REVIEW
3.1 General
Earthquake induced damages in recent years have exposed bridges as one of the most
susceptible components of the transportation system. Failure of bridges during an earthquake
(for example severe damages or collapse during the 1994 Northridge, the 1995 Kobe
earthquake and the 2011 Christchurch earthquake) can severely disrupt continuous transport
facilities, emergency and evacuation routes. To mitigate potential economic losses and loss of
lives during a seismic event, performance evaluation of existing bridges, and strengthening of
the critical components is crucial for the stakeholders. Development of fragility curves provide
a probabilistic assessment of the seismic risk to highway bridges which is critical in pre-
earthquake planning and post-earthquake response of transportation systems.
A vast majority of the highway bridges around the world were not designed according to
any seismic design criteria and thus do not meet the seismic detailing requirement imposed by
current guidelines (CHBDC 2010, CALTRANS 2013, Eurocode 2005). These factors lead to
the reconsideration of three important issues such as (i) the seismic performance of those non-
seismically designed bridges, (ii) potential economic losses, and (iii) selection of risk
mitigation and performance improvement techniques, i.e. retrofitting or rehabilitation. The
ramification and diversity in bridge design and construction practices all over the world do not
allow adopting a single methodology that can be applicable for the seismic vulnerability
assessment of highway bridges. Uncertainties arising from myriad of bridge components,
material characteristics, and regional seismicity along with the need for better predicting the
seismic performance of bridges have resulted in the development of different vulnerability
assessment methodologies for highway bridges. Although these different methodologies were
targeted for specific purposes and adopted particular mathematical framework, the overall
objective was to assess the seismic vulnerability of highway bridges to ensure the safety and
security of bridge infrastructure and its management against seismic loading.
The objective of this chapter is to provide a comprehensive review of the existing
methodologies and identify current trends in the seismic fragility assessment of highway
31

bridges. Based on the existing literature this study illustrates, in a systematic manner, a
summary of different fragility assessment methodologies for highway bridges, features, and
limitations and a critical review of the state-of-the-art currently existing application of fragility
assessment methods. This study also provides general information about the different aspects
of fragility assessment and how different researchers have developed this tool as a means of
better-informed decision making. This is a comprehensive but not necessarily an exhaustive
study. To the best of the authors’ knowledge no such study has been conducted so far that
summarizes the state-of-the-art fragility assessment of highway bridges.
3.2 Seismic Fragility Analysis
The inception of lifeline earthquake engineering in the early 1970’s have influenced
numerous researchers (ATC, 1985, 1991; King et al., 1997; Shinozuka et al., 1997; Veneziano
et al., 2002; Werner et al., 1997) to develop and propose a wide variety of seismic risk
assessment methodologies for highway transportation systems. With the advancement of the
performance based earthquake engineering, the site specific deterministic design criteria are
transitioning towards probabilistic design criteria as a means of describing the performance at
different levels of seismic input intensity (Mackie and Stojadinovic, 2005). Fragility curves
describe the conditional probability, i.e. the likelihood of a structure being damaged beyond a
specific damage level for a given ground motion intensity. Therefore, current seismic
performance assessment methodologies are tending toward fragility curves as a means of
describing the fragility of structures, such as highway bridges, under uncertain input. The
fragility or conditional probability can be expressed as:
Fragility= P[LS|IM=y] (3.1)
where, LS is the limit state or damage state of the structure or structural component, IM is the
ground motion intensity measure, and y is the realized condition of the ground motion intensity
measure.
The development of fragility curves for seismic risk assessment can be traced back to
1975 when Whitman et al. (1975) formalized the seismic risk assessment procedure.
Subsequently the Applied Technology Council (ATC) and the Federal Emergency
Management Agency (FEMA) contributed significantly towards the development of fragility
functions and vulnerability assessment procedures. The concept of continuous fragility
function was first put forward by ATC 25 report (ATC 1991) by introducing continuous
32

damage functions. Using a regression analysis of the different damage probability matrices,
the damage functions or the fragility curves were generated. Later in 1997, FEMA introduced
a risk assessment software package, Hazard United States (HAZUS 1997), which is based on
the geographical information system (GIS), by involving a panel of experts. Over the years
HAZUS has undergone significant development and the most recent version HAZUS-MH 2.1
(HAZUS 2012) is capable of assessing potential risk and losses from earthquakes, floods, and
hurricanes. Over the last two decades fragility curve has emerged as an efficient tool for critical
decision making for structure and infrastructure safety. Figure 3.1 shows the statistics of
research publications related to the seismic fragility assessment of bridges in the last few
decades. The number of relevant publications were obtained from different refereed journals.
This figure shows an increasing trend of publications which indicates the growing interest of
researchers in this field. A total of 350 documents including journal papers, conference
proceedings, and dissertations have been published since 1990 where journal publications
constitute a significant portion (51%). A large increase in the number of publications took
place in 2006-2007 when the number increased by almost 400% from the period of 2004-2005.
During the period of 2010-2011 the number of publication was 102 and in 2012-2013 it is 90
where more are expected to come out in the coming months. This increasing growth of
publication confirms that there is a widespread interest among the research community and
industry to investigate the seismic fragility of existing bridges all over the world. Fragility
curves can be used for decision making in both the pre-and post-earthquake disaster
management, to make informed decisions on the allocation of resources for retrofit, design,
and the improved redundancy of a highway network (Mackie and Stojadinovic 2005). Figure
3.2 illustrates different applications of fragility curves for bridges.
33

Figure 3.1. Statistics of publications on seismic fragility analysis of bridges since 1990
Figure 3.2. Various applications of seismic fragility curves
0
10
20
30
40
50
60
70
No.
of P
ublic
atio
ns
JournalConferenceDissertation
Seismic fragility of highway bridges
Bridge damage-
functionality relation ship
Repair and replacement
cost estimation
Assessment of potential
consequences and risk
Risk mitigation
effort
Emergency / disaster response
planning
Emergency route selection
Retrofit selection
Retrofit prioritization
Direct economic loss
Loss of bridge functionality
Informed decision makingand
Increased safety of highway bridges
34

3.3 Methods for Fragility Curve Development
Over the last two decades, fragility curves have transitioned from empirical to analytical
methods. Different methods and approaches have been developed by different researchers for
developing fragility curves such as judgemental, field observations, advance analysis using
analytical models, as well as hybrid methods. Different researchers have developed and
employed different methodologies for assessing the seismic fragility of bridges, a brief outline
of which is given in the following sections. Figure 3.3 shows the methodology that is
commonly used in generating different types of fragility curves and Table 3.1 shows the
comparative assessment of different methodology.
Figure 3.3. Methodology for developing seismic fragility curves
Methodology for Fragility Curve Development
Development of system/bridge fragility curve
Expert based Experimental Analytical Hybrid
Selection of expert panel
Preparation of questionnaire
Survey and Compilation of
results
Formation of damage
probability matrix
Development of component fragility
curve
Expe
rimen
tal
Selection of Ground Motion Suite
Bridge inventory and classification
of bridge
Identification of material
properties and structural
configuration (variables)
Real Synthetic
Generating synthetic ground motion
Collecting real ground motion from different
sources
Scaling of ground motion
Selection of appropriate IM
Nonlinear analytical modeling of
representative bridges
Functional and physical definition of different
damage states
Identification of appropriate EDP
Capacity Determinationof Bridge Components
Determination of component damage
states
Nonlinear time history/ Incremental
dynamic analysis
Calculation of component demand
Development of component PSDM
Shake table experiment of
bridge or bridge components
Relationship between observed
damage and IM
Hybrid Simulation/ combination of
statistical data and NLTHA results
Combination of mean IM from hybrid test and
dispersion from literature
Anal
ytic
al
Hyb
rid
Empirical
Selection of bridge type
Obtain actual bridge damage
data
Classify according to
observed damage
Formation of damage matrix
Selection of damage
distribution function
Selection of appropriate distribution
function
35

A brief summary of different studies on seismic fragility assessment of bridges are
provided in Table A.0.1 in Appendix A. This table shows the features of different studies such
as the demand parameters, intensity measures, uncertain parameters, methodology, and
different components considered in different studies.
Table 3.1.Comparison of different methods for development of fragility curves
Method Advantages Disadvantages Expert Based / Judgmental
-Simple method. -All factors can be incorporated.
-Extremely subjective. -Depends of panel expertise. -Often biased and lack of reliability.
Empirical -Represent a realistic picture. -Shows the actual vulnerability.
-Lack of adequate data. -Region and structure specific. -Discrepancy in damage observation.
Experimental -Provides actual damage condition. -Lack of adequate data. -Subjective definition of damage states. -Weak correlation between geometry and structural properties.
Analytical -Increased reliability. -Consideration of all types of uncertainty. -Less biased.
-Computational cost. -Time consuming. -Selection of analysis technique. -Definition of damage states. -Selection of probability distribution function.
Hybrid -Combination of experimental and analytical observation. -Involves damage data from post-earthquake survey. -Reduced computational effort.
-Requirement of multiple data sources. -Extrapolation of damage data. -Large dispersion in the demand model.
3.3.1 Expert based/judgmental fragility curves
One of the oldest and simplest methods of deriving fragility functions is expert based or
judgemental fragility curves. In this method, an expert panel with expertise in the field of
earthquake engineering are questioned concerning the various components of a typical
highway bridge and asked to make estimates of the probable damage distribution when
subjected to earthquakes of different intensities (Rossetto and Elnashai, 2003). A survey is
conducted among the specialists using a set of questionnaires. Based on the expert opinion,
probability distribution functions are updated to represent a particular damage level at various
levels of ground motion intensity. Since the experts provide their opinion of exceeding each
damage state, it is possible to develop fragility curves for each damage state over a wide range
36

of ground motion intensity. One of the practical examples of the judgemental fragility curve is
reported in the ATC-13 (ATC 1985) report. This report documented the damage matrices and
associated risk of typical California infrastructure based on opinion from a panel of 42 experts.
However, only 4 of the 42 experts were experienced with highway bridges and their seismic
performance. Based on their responses, a damage probability matrix based on Modified-
Mercalli Intensity (MMI) value was developed and included in the ATC-13 report.
Figure 3.4 shows a typical survey technique that can be used to obtain an expert opinion.
From the figure it can be observed that based on their expertise and observation from previous
earthquake, the experts will select the options. Based on the response from the expert panel a
damage matrix comprising of intensity measure and damage scenario can be developed. Using
the damage matrix and a suitable distribution function, fragility curves can be generated. Since
the expert opinion is the only source of developing this type of fragility curves, this method
largely depends on the questionnaire used, experience of the panel, as well as the number of
experts consulted (Nielson 2005). Very often these judgements are biased and involve number
of uncertainties which are not quantified explicitly in the vulnerability functions. Moreover,
these are often developed for certain structural types, typical configurations, detailing, and
materials. All these factors render the reliability of judgmental fragility curves questionable.
Figure 3.4. Typical survey technique for developing expert based fragility curve
37

3.3.2 Empirical fragility curves
Empirical fragility curves are developed using damage distributions from the post-
earthquake field observations or reconnaissance reports. Using the large amount of
reconnaissance data from the 1994 Northridge and the 1995 Kobe earthquakes, Basöz and
Kiremidjian (1997) and Yamazaki et al. (1999), respectively, developed the concept of
empirical fragility curves. Based on the post-earthquake damage data and observations, several
other researchers (Der Kiureghian, 2002; Shinozuka et al., 2000, 2001; Elnashai et al., 2004)
developed empirical fragility curves using different approaches. Using a damage frequency
matrix developed from Northridge earthquake damage data, Basoz and Kiremidjian (1997)
performed a logistic regression analysis to develop empirical fragility curves. Using the
damage data from Kobe earthquake, Shinozuka et al. (2001) applied the Maximum Likelihood
Method to estimate the parameters of a lognormal probability distribution describing the
fragility curves while Der Kiureghian (2002) adopted a Bayesian approach in order to develop
fragility curves. Although empirical fragility curves represent a more realistic picture, they
lack generality and are usually associated with a large degree of uncertainty. Inconsistency of
different damage state definitions and discrepancy in observation between different inspection
teams add up the uncertainty in the developed curves and significantly reduce the usefulness
and reliability of the empirical vulnerability curves. Yamazaki et al. (2000) and Shinozuka et
al. (2001) developed empirical fragility curves using damage data from 1995 Kobe earthquake.
Although they used the damage data from same earthquake for the Hanshin Expressway, their
fragility curves were significantly different from each other as illustrated in Figure 3.5.
Table 3.2 shows the comparison of the two parameter, median, λ and log normal standard
deviation, ξ used for deriving the fragility curves. These differences in the fragility curves can
be attributed to the number of damaged bridges considered, their structural configurations, and
definition of damage states. These errors are difficult to avoid using damage statistics and lead
to a large data scatter even in cases where a single event and limited survey area are considered
(Rossetto and Elnashai, 2003). All these limitations restrict the application of empirical
fragility curves.
38
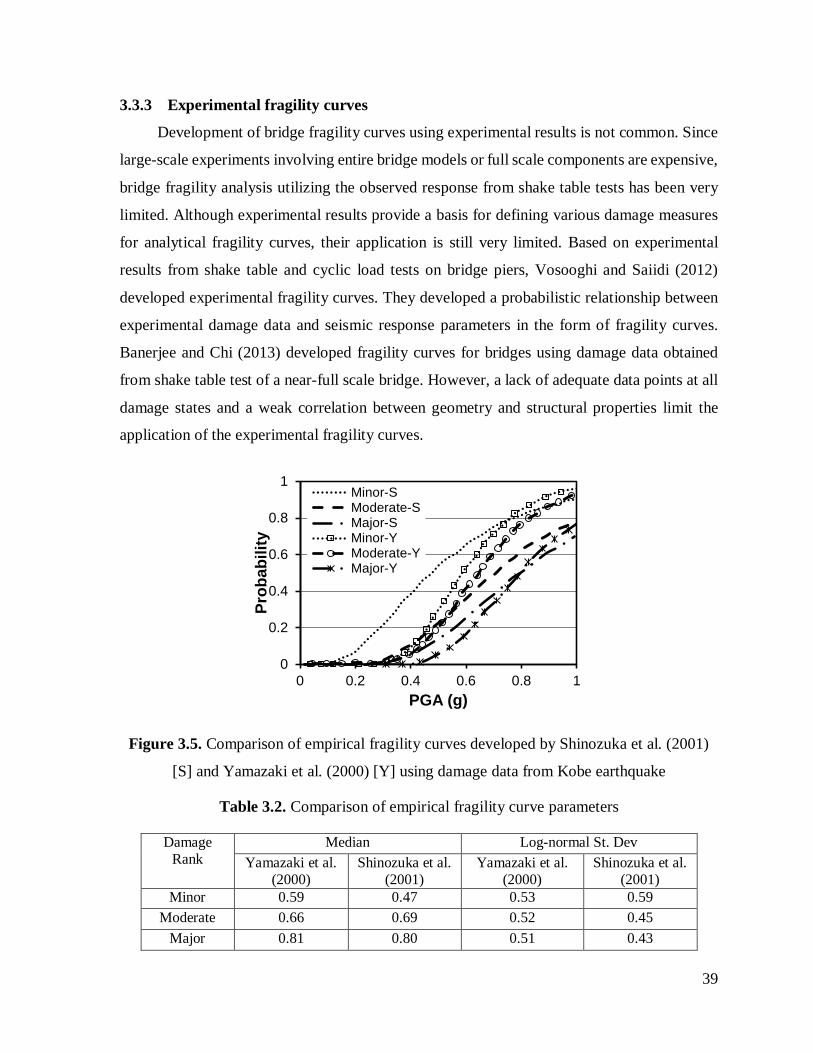
3.3.3 Experimental fragility curves
Development of bridge fragility curves using experimental results is not common. Since
large-scale experiments involving entire bridge models or full scale components are expensive,
bridge fragility analysis utilizing the observed response from shake table tests has been very
limited. Although experimental results provide a basis for defining various damage measures
for analytical fragility curves, their application is still very limited. Based on experimental
results from shake table and cyclic load tests on bridge piers, Vosooghi and Saiidi (2012)
developed experimental fragility curves. They developed a probabilistic relationship between
experimental damage data and seismic response parameters in the form of fragility curves.
Banerjee and Chi (2013) developed fragility curves for bridges using damage data obtained
from shake table test of a near-full scale bridge. However, a lack of adequate data points at all
damage states and a weak correlation between geometry and structural properties limit the
application of the experimental fragility curves.
Figure 3.5. Comparison of empirical fragility curves developed by Shinozuka et al. (2001)
[S] and Yamazaki et al. (2000) [Y] using damage data from Kobe earthquake
Table 3.2. Comparison of empirical fragility curve parameters
Damage Rank
Median Log-normal St. Dev Yamazaki et al.
(2000) Shinozuka et al.
(2001) Yamazaki et al.
(2000) Shinozuka et al.
(2001) Minor 0.59 0.47 0.53 0.59
Moderate 0.66 0.69 0.52 0.45 Major 0.81 0.80 0.51 0.43
0
0.2
0.4
0.6
0.8
1
0 0.2 0.4 0.6 0.8 1
Prob
abili
ty
PGA (g)
Minor-SModerate-SMajor-SMinor-YModerate-YMajor-Y
39
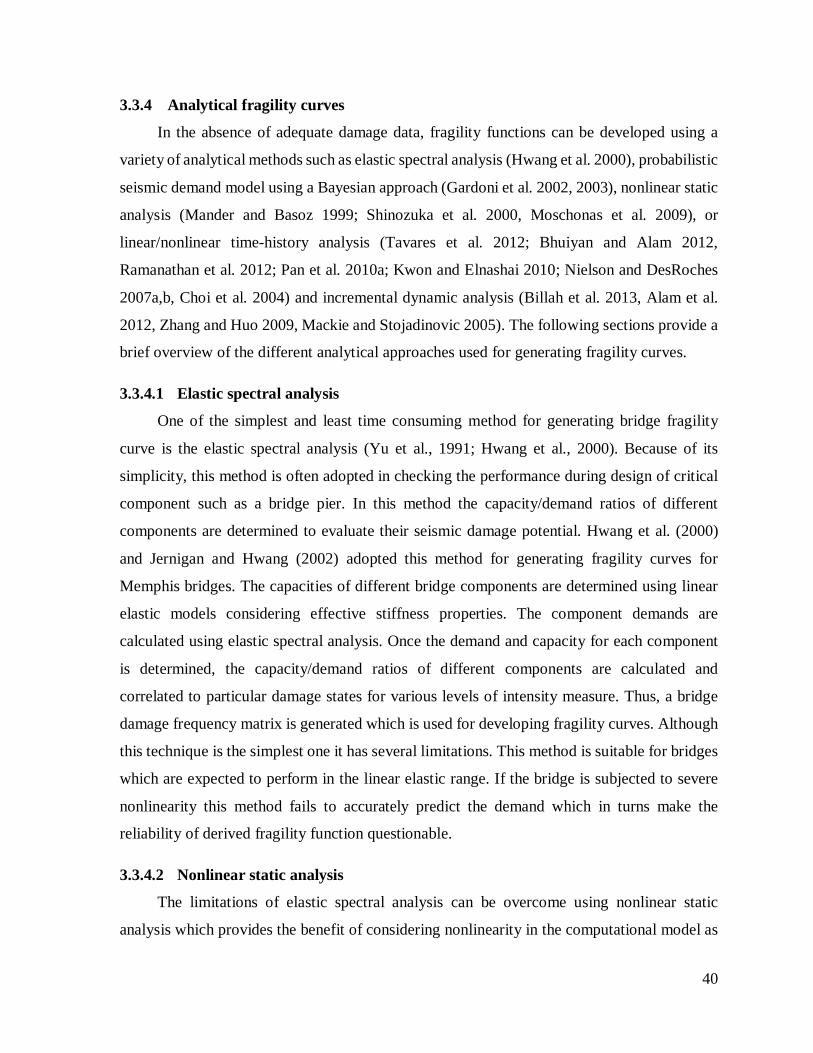
3.3.4 Analytical fragility curves
In the absence of adequate damage data, fragility functions can be developed using a
variety of analytical methods such as elastic spectral analysis (Hwang et al. 2000), probabilistic
seismic demand model using a Bayesian approach (Gardoni et al. 2002, 2003), nonlinear static
analysis (Mander and Basoz 1999; Shinozuka et al. 2000, Moschonas et al. 2009), or
linear/nonlinear time-history analysis (Tavares et al. 2012; Bhuiyan and Alam 2012,
Ramanathan et al. 2012; Pan et al. 2010a; Kwon and Elnashai 2010; Nielson and DesRoches
2007a,b, Choi et al. 2004) and incremental dynamic analysis (Billah et al. 2013, Alam et al.
2012, Zhang and Huo 2009, Mackie and Stojadinovic 2005). The following sections provide a
brief overview of the different analytical approaches used for generating fragility curves.
3.3.4.1 Elastic spectral analysis
One of the simplest and least time consuming method for generating bridge fragility
curve is the elastic spectral analysis (Yu et al., 1991; Hwang et al., 2000). Because of its
simplicity, this method is often adopted in checking the performance during design of critical
component such as a bridge pier. In this method the capacity/demand ratios of different
components are determined to evaluate their seismic damage potential. Hwang et al. (2000)
and Jernigan and Hwang (2002) adopted this method for generating fragility curves for
Memphis bridges. The capacities of different bridge components are determined using linear
elastic models considering effective stiffness properties. The component demands are
calculated using elastic spectral analysis. Once the demand and capacity for each component
is determined, the capacity/demand ratios of different components are calculated and
correlated to particular damage states for various levels of intensity measure. Thus, a bridge
damage frequency matrix is generated which is used for developing fragility curves. Although
this technique is the simplest one it has several limitations. This method is suitable for bridges
which are expected to perform in the linear elastic range. If the bridge is subjected to severe
nonlinearity this method fails to accurately predict the demand which in turns make the
reliability of derived fragility function questionable.
3.3.4.2 Nonlinear static analysis
The limitations of elastic spectral analysis can be overcome using nonlinear static
analysis which provides the benefit of considering nonlinearity in the computational model as
40
well as requires less time. Several researchers (Dutta and Mander, 1998; Mander and Basoz,
1999; Mander, 1999; Shinozuka et al., 2000; Banerjee and Shinozuka, 2007) have adopted this
method for generating fragility curves for bridges. In this method the capacity is calculated
using nonlinear static pushover analysis and demand is estimated from a scaled down response
spectrum. Placing the capacity and demand spectra in the same plot, the maximum response of
the structure under the specified seismic ground motion is determined by locating the
intersection of the two curves (in deterministic analysis). Whenever, uncertainty in capacity
and demand is considered, it is represented by plotting the distributions over the capacity and
demand curves. Using the intersection of capacity and demand distribution (Figure 3.6),
probability of failure can be estimated for a particular intensity level. Using increasing level of
intensity measure and various damage states, fragility curves for the bridges can be generated.
Apart from its advantages, this method has few limitations. This method was developed based
on the recommendations from ATC 40 (ATC 1996) which was developed for buildings.
Moreover, this method lacks in defining the bridge structure types and estimation of effective
hysteretic damping, which plays a crucial role in seismic performance evaluation.
Figure 3.6. Probabilistic Representation of Capacity and Demand Spectra (Mander and
Basoz, 1999).
Demand Spectrum
Capacity Spectrum
Spectral Displacement
Spe
ctra
l Acc
eler
atio
n
41

3.3.4.3 Nonlinear time history analysis
In spite of being one of the most computationally expensive methods, nonlinear time
history analysis (NLTHA) is the most reliable method for generating fragility curves
(Shinozuka et al. 2000). This method has been used by many researchers (Billah and Alam
2013, Tavares et al. 2012; Ramanathan et al. 2012; Pan et al. 2010a; Kwon and Elnashai 2010;
Nielson and DesRoches 2007a, b, Padgett 2007, Choi et al. 2004, Karim and Yamazaki, 2003)
for generating fragility curves which have been proven to provide a reliable estimate of the
seismic vulnerability of bridges. This method allows the consideration of geometric
nonlinearity and material inelasticity to predict the large displacement behaviour and the
collapse load of bridges accurately under dynamic loading. Although the actual application of
the analyses may vary, all applications follow the basic approach outlined in Figure 3.7.
Figure 3.7. Schematic Representation of the NLTHA procedure used to develop fragility
curves
The reliability and accuracy of fragility curves derived in this method largely depends
on the ground motion suits used for dynamic analyses. As a first step, it is necessary to select
a suitable bin of ground motions that closely represents the seismicity of the bridge location
and captures the associated uncertainties (e.g. epicentral distance, magnitude). However, still
there is debate among researchers on how many ground motions should be selected for
generating reliable fragility curves. Once the ground motions are selected, sample bridge
Define component limit
states
Develop PSDMDevelop Fragility Curves
ln (D
I)
ln (IM)
Ground Motion Suite FEM Model Estimate Component
Responses
42

geometries are created considering variability in geometric, structural, and material properties.
Using suitable probability distributions for different random variables statistically significant
yet nominally identical 3D/2D analytical bridge models are developed. After that these bridge
models are randomly paired with different ground motions and NLTHA is performed for each
ground motion-bridge sample. Maximum component demands those are considered critical for
bridge vulnerability are recorded from each sample. Using the peak component response and
appropriate intensity measure (IM), a probabilistic seismic demand model (PSDM) can be
generated using regression analysis or maximum likelihood method. The capacity limit states
of different components can be defined based on expert opinion, experimental investigation or
analytical approach. Convolving the capacity model with PSDM, fragility curves for the
bridges can be developed for different damage states. This method also suffers from several
drawbacks such as the priori assumption about the probabilistic distribution of seismic demand
and required number of ground motions which makes it computationally expensive.
3.3.4.4 Incremental dynamic analysis
In order to reduce the requirement of large number of ground motions for fragility
assessment using NLTHA, researchers have come up with the idea of using Incremental
dynamic analysis (IDA). IDA is a special type of NLTHA where ground motions are
incrementally scaled and series of analyses is performed at different intensity levels. Intensity
levels are selected to cover the entire range of structural response, from elastic behaviour
through yielding to dynamic instability (or until a limit state ‘‘failure’’ occurs). This technique
was developed by Luco and Cornell (1998) and has been described in detail in Vamvatsikos
and Cornell (2002) and Yun et al. (2002). Several researchers (Billah et al. 2013, Bhuiyan and
Alam 2012, Zhang and Huo 2009, Mackie and Stojadinovic 2005) have preferred this
technique over NLTHA for generating fragility curves. However, this incremental scaling of
large set of ground motions may lead to instances wherein the computational demand is several
times higher than NLTHA. Although this method demands significant computational effort,
no prior assumptions are required in terms of probabilistic distribution of seismic demand for
the derivation of fragility functions (Zhang and Huo, 2009).
This method is similar to NLTHA approach; however, peak component responses need
to be calculated at each scaling factor. Using results from IDA, fragility curves can be
43

generated either by deriving the occurrence ratio at each damage state at each ground motion
level or by estimating the probability density function of the IM for ground motions in which
the damage state thresholds are exceeded (Bhuiyan and Alam 2012). Typically this method is
mostly used for collapse fragility assessment of structures. Like other methods, this method
has few drawbacks. Selection of ground motions, number of required ground motions, scaling
of ground motions, all these can lead to the over or under estimation of the vulnerability of the
structures (Baker 2013).
3.3.4.5 Fragility assessment using Bayesian approach
Several researchers (Singhal and Kiremidjian 1996, Der Kiureghian 2002, Gardoni et al.
2002, 2003, Koutsourelakis 2010) have adopted Bayesian technique for developing reliable
fragility curves by the convolution of demand and capacity models. Using Park and Ang (1985)
damage index, Singhal and Kiremidjian (1996) developed fragility curves using Bayesian
analysis of observed damage data for subclasses of structural systems. While Der Kiureghian
(2002) used the maximum likelihood method in conjunction with the Bayesian approach,
Koutsourelakis (2010) used Markov Chain-Monte Carlo techniques along with the Bayesian
approach to develop multi-dimensional fragility surfaces as a function of multiple ground
motion characteristics. Using a Bayesian approach Gardoni et al. (2002) updated traditional
deterministic predictions of capacity and demand models and introduced reliability for
generating fragility curves for RC bridges. This study developed fragility curves for typical
one and two column bent reinforced concrete highway bridges in California. Later, Zhong et
al. (2008) developed PSDM using Bayesian approach for RC bridges with two column bents
considering uncertainty and models errors. Using a Bayesian updating approach based on the
virtual experiment demand data, Huang et al. (2010) proposed a new PSDM approach for
generating fragility curves for single column RC bridge bent. In this study different types of
uncertainties, model errors, variation in soil and ground motion characteristics were
considered. Bayesian updating technique allows the formulation of confidence bounds which
express the epistemic uncertainty around the median fragility curves. This is one of the
fundamental advantages of Bayesian technique.
44
3.3.5 Hybrid Fragility curves
Different methods of generating fragility curves have their advantages and
disadvantages. In order to compensate for the drawbacks of other methods such as the
inadequate damage data from real earthquakes, subjectivity of judgemental data, and
uncertainties and modelling deficiencies associated with analytical procedures, researchers
have come up with the idea of hybrid fragility curves. The hybrid approach attempts to reduce
the computational effort of analytical modelling and compensates for the subjective bias of
expert judgment method (Kappos et al. 2006). Kappos et al. (1995) first coined the term hybrid
method for vulnerability assessment of buildings in Thessaloniki. Later on Kappos and his co-
workers (Kappos et al. 1998, 2006, Kappos and Panagopoulos 2010) developed and employed
the hybrid fragility curves for vulnerability assessment of reinforced concrete and unreinforced
masonry buildings in Greece. This method incorporates available damage data that resembles
the area and structural typology under consideration and combines with analytical damage
statistics obtained using nonlinear analysis of typical structures (Kappos et al. 2006).
Hybrid methods also incorporate results from large-scale experimental tests that can
reasonably mimic real structural response. More recently, Network for Earthquake
Engineering Simulation (NEES) developed a hybrid method for fragility curve generation
based on hybrid simulation results along with the calibrated analytical response (Lin et al.
2012). They develop an analytical model of 2D frame in ZEUS-NL and tested a small scale
column in hybrid testing facility. Using the mean PGA from the hybrid tests and dispersions
from the references, they developed hybrid fragility curves assuming lognormal distribution.
Although hybrid fragility curves provide another option for developing reliable fragility curves
yet it suffers from few drawbacks such as extrapolation of damage data and relationship
between earthquake intensity and level of structural damage (Kappos 1997). Moreover, this
method involves large aleatory and epistemic uncertainty which results in significant
dispersion in the probabilistic model. Although this method of generating fragility curves have
received much attention from the researchers, applications are still limited for buildings.
Recently Frankie (2013) developed hybrid fragility curves for a curved four span bridge using
hybrid simulation and nonlinear time history analyses. Limit states for the bridge pier were
developed using experimental results obtained from the pier response under combined axial,
45

flexural, shear, and torsional loading. Combining these experimental results with analytical
structural response, fragility curves for different damage states were developed.
3.4 Intensity Measure and Demand Parameter for Fragility Analysis
Fragility curves express the probability of the seismic demand placed on the structure
exceeding a predefined performance state under a chosen intensity measure (IM) representative
of the seismic loading. Selection of an appropriate Intensity Measure (IM) is an important step
in developing fragility relationship. Selection of an appropriate IM for fragility assessment has
been a topic of debate among researchers for a long time. In ATC-13 (ATC 1985) Modified
Mercalli Scale was used as the IM whereas FEMA P695 (FEMA 2008) preferred spectral
acceleration at the first-mode period, Sa(T1) (or simply Sa) as the IM. Luco and Cornell (2007)
suggested three criteria for selecting an appropriate IM, i.e. efficiency, sufficiency, and hazard
computability. One of the most commonly used IM is the spectral acceleration at the first-mode
period, Sa(T1) (or simply Sa). Several alternatives of IM include PGA, Peak Ground Velocity
(PGV), Arias Intensity (AI) etc. as proposed and developed by numerous researchers for
instance, Giovenale (2003) and Mackie and Stojadinovic (2007). In an attempt to identify an
optimal IM, Mackie and Stojadinovic (2005) investigated the use of 65 IMs classified into three
classes. An optimal IM was defined as being practical, effective, efficient, sufficient, and
robust. Their study suggested that Sa and spectral displacement (Sd) at the fundamental period
are the ideal IMs as they were found to reduce uncertainty in the demand models. On the other
hand, the peak ground acceleration (PGA) was identified as the optimum IM by Padgett and
DesRoches (2008) to describe the severity of the earthquake ground motion. They
recommended PGA as the efficient, practical, and most sufficient IM for seismic hazard
computation. Since, a large PGA always does not indicate severe structural damage, other
intensity measures such as peak ground velocity (PGV) (Avsar et al. 2011), peak ground
displacement (PGD), time duration of strong motion (Td), spectrum intensity (SI) and spectral
characteristics can also be considered. Several researchers (Bazzurro and Cornell 2002, Shome
and Cornell 1999, Baker and Cornell 2005) have proposed different vector valued intensity
measures for probabilistic seismic demand model. Shafieezadeh et al. (2012) proposed a
fractional order intensity measure for PSDM of highway bridges. The proposed fractional order
IM considered a single degree of freedom (SDF) system with fractional damping and fractional
response and combined the peak ground response and spectral accelerations at 0.2 and 1.0 s,
46

respectively. They concluded that proposed fractional order IM showed superior performance
over the traditional IMs. However, this intensity measure, at present, is inappropriate for risk
analysis due to lack of regional hazard curves for such fractional order intensity measures.
The probability of entering a particular damage state under a ground motion IM is
expressed through fragility curves. Damage states (DS) for bridges should reflect a certain
functional level and each damage state should indicate a particular level of bridge performance.
Different forms of engineering demand parameters (EDPs) are used to measure the DS of the
bridge components. Park and Ang (1985) developed a damage index based on energy
dissipation capacity and ductility demand of the structure while Hwang et al. (2000) used the
capacity/demand ratio of the bridge columns as EDP to develop fragility curves. HAZUS
(FEMA 2003) defined four damage states which are widely used in the seismic vulnerability
assessment of engineering structures, namely slight, moderate, extensive, and collapse
damages. Based on the drift limits of bridge pier, Dutta and Mander (1998) recommended five
different damage states. Mackie and Stojadinovic (2005) classified the EDPs as local (material
strain), intermediate (maximum moment), and global (drift ratio) demand parameter. Different
researchers have used different demand parameters for fragility assessment of highway
bridges, for instance, column curvature ductility (Nielson and DesRoches 2007a, Padgett and
DesRoches 2008), displacement ductility (Zhang and Huo 2009, Bhuiyan and Alam 2012,
Billah et al. 2013), drift ratio (Shinozuka et al. 2002, Tavares et al. 2012), residual drift (Billah
and Alam 2014c, Billah and Alam 2012, Mackie and Stojadinovic 2004, Lee and Billington
2011), shear strain in isolation bearing (Zhang and Huo 2009, Bhuiyan and Alam 2012),
bearing displacement (Zhang and Huo 2009, Ramanathan et al. 2012, Billah and Alam 2013),
abutment deformation (Padgett and DesRoches 2008, Ramanathan et al. 2012, Tavares et al.
2012, Billah and Alam 2013), etc. Table 3.3 shows a summary of different demand parameters
and the threshold values used by different researchers for fragility assessment of different
components of bridges.
47

Table 3.3. Summary of threshold values of different demand parameters
Threshold
Value
Component Demand Parameter Slight Moderate Extensive Collapse Reference
Column
Curvature Ductility
1.29 2.1 3.52 5.24 Nielson 2005 1 1.58 3.22 4.18 Ramanathan et al. 2012 1 5.11 7.5 9 Ramanathan et al. 2012 4.89 9.15 12.46 13.08 Ramanathan et al. 2010 1.44 2.7 6.92 4.18 Ramanathan et al. 2010 1 2 4 7 Choi et al. 2004 1 2.73 4.54 6.5 Jara et al. 2013
Displacement Ductility
1 1.2 1.76 4.76 Alam et al. 2012, Hwang et al. 2000
1 2 4 7 Alipour et al. 2013
2.25 2.9 4.6 5 Banerjee and Prasad, 2013
1 1.22 1.78 4.8 Billah and Alam 2014c
Drift
5 7 11 30 Tavares et al.2012 0.7 1.5 2.5 5 Akbari 2012 1.45 2.6 4.3 6.9 Li et al. 2012 0.7 1.5 2.5 5 Kim and Shinozuka 2004
Rotational Ductility 3.14 3.14-5.9 5.9-9.42 >9.42 Banerjee and Chi, 2013
1.58 3.33 6.24 9.16 Banerjee and Shinozuka, 2011
Residual Drift (%) 0.25 0.25-0.75 0.75-1 >1 Billah and Alam 2014c
Elastomeric Bearing
Shear Strain (%) 100 150 200 250 Alam et al. 2012; Zhang and Huo 2009; Hwang et al. 2001
Drift Ratio 0.007 0.015 0.025 0.05 Yi et al. 2007
Displacement (mm)
0 50 100 150 Choi et al. 2004
28.9 104.2 136.1 186.6 Ramanathan et al. 2010, Nielson 2005
30 100 150 255 Ramanathan et al. 2012 30 60 150 300 Tavares et al. 2012
Fixed Bearing Displacement (mm)
6 20 40 186.6 Ramanathan et al. 2010, Nielson 2005
6 20 40 255 Ramanathan et al. 2012
Abutment
Displacement (mm)
7 15 30 60 Tavares et al. 2012, Billah and Alam 2013
9.8 37.9 77.2 N/A Ramanathan et al. 2010, Nielson 2005
Pile Foundation Displacement (mm) 28 42 86 115 Aygun et al. 2011
48
3.5 Regional Fragility analysis
Different researchers in different parts of the world have developed fragility curves of
highway bridges for a particular region. Since the seismic hazard, construction practices,
bridge type, etc., varies from region to region, researchers have focused on developing regional
fragility curves. There are a number of different regional fragility assessments that have been
conducted so far in different parts of the world, a synopsis of which is provided in Table A.0.2
in Appendix A. Extensive study on seismic fragility assessment of highway bridges in different
parts of USA have been conducted by different researchers. Using the National Bridge
Inventory (NBI), Pan et al. (2010a, 2010b) conducted extensive parametric study to evaluate
the seismic response parameters for different bridge components of multi-span simply
supported steel highway bridges in New York State. Choi et al. (2004), Nielson and DesRoches
(2007a, 2007b), Padgett and DesRoches (2008), developed fragility curves for as-built and
retrofitted bridges in central and southern United States (CSUS). Ramanathan et al. (2010a,
2012) developed fragility curves for seismically and non-seismically designed bridges in
CSUS. While in western US typically for California, Mackie and Stojadinovic (2005)
developed fragility curves for highway overpass bridges and Ramanathan (2012) developed
fragility curves for typical California bridge classes along with their evolution over three
significant design eras. While in Canada, Tavares et al. (2012) and Billah and Alam (2013)
developed seismic fragility curves for highway bridges in eastern and western Canada,
respectively. Significant amount of research work has also been carried out in several
earthquake prone countries such as, Japan (Akiyama et al. 2013, 2011, Karim and Yamazaki
2007, Tanaka et al. 2000), Italy (Felice et al. 2004, Cardone et al. 2007), Turkey (Avsar et al.
2011), Greece (Moschonas et al. 2009) and Taiwan (Liao and Loh 2004, Sung et al. 2013).
Different regions have different design guidelines, bridge types, construction method,
seismicity, and soil conditions. Again different researchers considered different structural
systems and adopted different modelling and analysis techniques for developing fragility
curves. So it is very difficult to compare the fragility curves developed for different regions.
However, in this study a comparison of fragility curves developed for different regions
particularly for a specific type of bridge (MSC Concrete) was conducted. A comparison of the
fragility curves at extensive damage states for MSC concrete bridges are shown in Figure 3.8.
49

It is beyond the scope of this study to compare and comment on the vulnerability of same types
of bridges located in different parts of the world.
Figure 3.8. Comparison of empirical fragility curves for MSC Concrete bridges for different
regions
3.6 Condition Specific Fragility Assessment
3.6.1 Fragility analysis for retrofitted bridge
Most of the studies regarding development of bridge fragility curves are focused on as-
built bridges. Fragility curves can also be used as an assessment tool for retrofitted bridges and
selecting an optimal retrofit strategy from a group of available retrofit measures. Shinozuka et
al. (2002) developed fragility curves for typical southern California bridge piers retrofitted
with steel jacket. Using nonlinear dynamic analysis, fragility curves were developed as a
function of PGA. They compared the vulnerability of as built and retrofitted bridges. They
proposed an “enhancement curve” which can be applied over empirical fragility curve to
develop retrofitted bridge fragility curve. Padgett and DesRoches (2008) developed an
analytical methodology for developing fragility curves of retrofitted bridges. They evaluated
the impact of retrofitting one component on the response of other key components of the
bridge. Considering a typical bridge class in CSUS retrofitted with five different alternatives
along with different types of uncertainties, fragility curves were generated. Using three-
dimensional nonlinear analysis, Padgett and DesRoches (2009) developed fragility curves for
four common classes of multi-span bridges in CSUS and five retrofit methods. They concluded
that the effectiveness of retrofit measure in reducing system vulnerability is a function of
0
0.2
0.4
0.6
0.8
1
0 0.2 0.4 0.6 0.8 1
P [E
xten
sive
I PG
A]
PGA (g)
TaiwanGreeceCSUSEastern CanadaWestern Canada
50

bridge type and damage state under consideration. Agrawal et al. (2012) developed fragility
curves for retrofitted multi-span continuous steel bridges in New York. Effectiveness of
various retrofit measures, such as elastomeric bearing, lead rubber bearing, carbon fiber
jacketing, and viscous damper, in reducing the vulnerability of bridges were evaluated and
compared with the performance of as built bridges. They concluded that a combination of
elastomeric bearing and viscous damper provide an optimal retrofit effect for typical multi-
span continuous steel bridges in New York. Billah et al. (2013) developed analytical fragility
curves for retrofitted multi-column bridge bent under near fault and far field ground motion.
They evaluated the effectiveness of different retrofitting techniques (e.g. steel jacket, concrete
jacket, CFRP jacket, ECC jacket) and compared their vulnerability under near fault and far
field ground motions. They concluded that both ECC and CFRP jacket were effective in
reducing the vulnerability under near fault and far field ground motions. Based on the
performance of different bridge components using fragility analysis, Stefanidou and Kappos
(2013) proposed a methodology for selecting optimal retrofit strategy for bridges. The main
aspect of this methodology is the development of correlation between component limit state
threshold values and global limit states. Figure 3.9a shows fragility curves for as built and
retrofitted bridges and Figure 3.9b shows the comparative effectiveness of different retrofitting
techniques in reducing the seismic vulnerability.
Figure 3.9. (a) Fragility curves for as-built and retrofitted bridge (b) Fragility curves for
retrofitted bridge bent using different retrofitting techniques (Billah et al. 2013)
0
0.2
0.4
0.6
0.8
1
0 0.5 1 1.5 2
P[M
oder
ateI
PGA]
PGA (g)
As Built
Retrofitted
(a)
0
0.2
0.4
0.6
0.8
1
0 0.5 1 1.5 2
P[M
oder
ateI
PGA]
PGA (g)
ConcreteECCCFRPSteel
(b)
51

3.6.2 Fragility analysis considering aging effect
Aging and deterioration significantly affects the seismic performance of bridges. The
detrimental effect of aging and deterioration on the seismic vulnerability of highway bridges
has been overlooked by engineering community for a long time. Although there has been a
number of studies focusing on the aging and deterioration of bridges, very few studies have
incorporated these effects on the fragility curve generation (Choe et al. 2009, Gardoni and
Rosowsky 2011, Zhong et al. 2012, Ghosh and Padgett 2012). The impact of aging and
deterioration on bridge fragility is heavily influenced by the exposure condition: whether
marine exposure, atmospheric exposure or de-icing salt exposure etc (Ghosh and Padgett
2012). Different researchers have investigated the effect of deterioration on seismic fragility
considering different exposure conditions. Choe et al. (2009) investigated the potential
reduction in capacity and increase in fragility due to aging and deterioration of a typical single-
bent bridge in California considering a marine splash zone. They extended the existing
probabilistic seismic demand model for pristine bridges with a probabilistic model for time-
dependent chloride-induced corrosion to include the effect of aging on seismic fragility
assessment. This study highlighted the significance of considering the effects of aging on
seismic fragility and identifying the crucial material and corrosion parameters that most
significantly affect the bridge reliability. Simon et al. (2010) developed fragility curves for
deteriorated concrete bridges, located in a marine splash zone, designed according to current
guidelines to investigate the chloride exposure level and extent of corrosion on the
vulnerability of bridges. They showed that spalling of cover concrete and reduction in
reinforcement area affect the seismic vulnerability of bridges. Sung and Su (2011) developed
time dependent fragility curves for deteriorated RC bridges. Using pushover analysis they
investigated the decayed capacity of deteriorated bridges and developed fragility curves with
respect to some representative damage levels. Using the time dependent fragility curve, they
developed S-surface diagram to illustrate the relationship between cost, intensity measure and
service time. Ghosh and Padgett (2010) investigated the effect of multi-component
deterioration on the seismic vulnerability of aging bridges. Figure 3.10a shows the effect of
aging on the seismic fragility of bridges. Considering the variations in structural properties,
ground motion and corrosion parameters they developed time dependent fragility curves for
multi span continuous steel girder bridge. The analyses showed that most of the components
52

(columns, fixed bearing, expansion bearing) experience increased vulnerability due to aging
while there is a decrease in the vulnerability of few components (abutment longitudinal and
transverse response). They concluded that an aging bridge might experience a shift of 32% in
the median value of complete damage fragility near the end of its service life.
Figure 3.10. Effect of (a) aging (Ghosh and Padgett, 2010), (b) soil liquefaction (Aygun et
al. 2011), (c) isolation (Zhang and Huo 2009), (d) horizontal curve (AmiriHormozaki et al.
2013), (e) skew angle (Sullivan and Nielson 2010) and (f) scour depth (Prasad and Banarjee
2013) on fragility curves
Ghosh and Padgett (2012) explored the effect of different exposure conditions, such as
de-icing salt exposure and splash zone and atmospheric zone exposure in marine environment,
on the vulnerability of typical multi-span concrete bridges in CSUS. They concluded that
consideration of different exposure conditions lead to a significant variation in the vulnerability
of aging bridges. Recently, Dong et al. (2013) developed time-variant fragility curves for
seismically vulnerable bridges considering multiple hazard scenario. They considered the
effects of flood induced scour and effects of corrosion on reinforcement bars and concrete
cover spalling in generating the fragility curves. Choine et al. (2013) investigated the effect of
chloride induced corrosion of the reinforcement, caused by the application of de-icing salts, on
the seismic vulnerability of a three span integral concrete bridge. This study found that
0
0.2
0.4
0.6
0.8
1
0 0.2 0.4 0.6 0.8 1
P [M
oder
ateI
PG
A]
PGA (g)
Pristine25 Years50 Years75 Years100 Years
(a)0
0.2
0.4
0.6
0.8
1
0 0.2 0.4 0.6 0.8 1P
[Clla
pseI
PG
A]
PGA (g)
Coulmn w/oliquefactionColumn w/liquefaction
(b)0
0.2
0.4
0.6
0.8
1
0 0.3 0.6 0.9 1.2 1.5
P[D
amag
eIP
GA]
PGA (g)
Extensive (Isolated)Extensive (Un-isolated)Collapse (Un-isolated)Collapse (Isolated)
(c)
0
0.2
0.4
0.6
0.8
1
0 0.5 1 1.5 2
P[C
olla
pseI
PG
A]
PGA (g)
0 deg15 deg30 deg45 deg(e)
0
0.2
0.4
0.6
0.8
1
0 0.2 0.4 0.6 0.8 1
P[C
olla
pseI
PG
A]
PGA (g)
0m0.6m1.5m3m6m
(f)0
0.2
0.4
0.6
0.8
1
0 0.5 1 1.5 2
P[C
olla
pseI
Sa1
]
Sa1 (g)
Straight30 deg Curve60 deg Curve90 deg Curve
(d)
53

corrosion and aging significantly affect the seismic vulnerability of bridge piers while other
components’ vulnerability are less sensitive to aging and deterioration.
3.6.3 Fragility analysis considering SSI and liquefaction
Lack of homogeneity in the underlying soil can result in wide variety of strength
parameters which can significantly affect the seismic response of bridges (Brandenbarg et al.
2011). Due to their complex structural configuration compared to buildings, bridges experience
more severe soil-structure interaction (SSI) effects during earthquakes (Chaudhury et al. 2001).
Several researchers (Boulanger et al. 1999, Zhang et al. 2008; Elgamal et al. 2008) have
investigated the effect of SSI modeling techniques and liquefaction on seismic response of
bridge components. Kashighandi et al. (2008) investigated the seismic fragility of older-
vintage California bridges to liquefaction and lateral spreading. Kwon and Elnashai (2010)
developed fragility curves for a highway overcrossing bridge in USA considering soil structure
interaction (SSI) using four different modeling techniques to represent the behavior of
abutment and foundation. They concluded that the selection of efficient SSI modeling
technique significantly affects the reliability of vulnerability assessment. Aygun et al. (2011)
developed a computationally efficient coupled bridge-soil-foundation (CBSF) analyses and
fragility curves for typical multi-span continuous steel bridges typical of the central and eastern
US (CEUS) considering earthquake-induced soil liquefaction. They reported that the
vulnerability of columns depends on the type of soil overlying the liquefiable sands, while the
fragility of rocker bearings, piles, embankment soil, and the probability of unseating increases
with liquefaction. Figure 3.10b shows the effect of considering liquefaction on the
vulnerability of bridge columns. The figure illustrates the fact that liquefaction significantly
increases the seismic vulnerability. Brandenbarg et al. (2011) developed demand fragility
surfaces for bridges in liquefied and laterally spreading ground. Using a beam on a nonlinear
Winkler foundation approach, the SSI effects at the bridge abutment components were
modeled while the soil-structure elements included p-y springs for lateral interaction, t-z
springs for axial interaction, and q-z springs for pile tip bearing. They concluded that
consideration of liquefaction and lateral spreading significantly affects the fragility function.
Padgett et al. (2013) investigated the sensitivity of seismic fragility of different bridge
components for variation in structural and liquefiable soil modeling parameters. They
54

concluded that the undrained shear strength of soil, structural damping ratio, soil shear
modulus, gap between deck and abutment, ultimate capacity of soil and fixed and expansion
bearing coefficients of friction significantly affects the seismic fragility of bridges. Ni et al.
(2013) proposed a direct displacement based assessment approach for fragility assessment of
multi-span continuous concrete bridges considering nonlinear dynamic soil–structure
interaction effects. The proposed method was found to be fast and reliable which can be used
for screening of large sample of bridges.
3.6.4 Fragility analysis of isolated bridges
Seismic isolation of highway bridges has been proven to be an efficient technique to
reduce the seismic hazards for designing new bridges or improving the performance of existing
bridges. Several researchers have investigated the effect of isolation on the seismic
vulnerability of existing bridges. Karim and Yamazaki (2007) developed a simplified approach
to generate fragility curves of isolated bridges. Using 30 nonlinear models of isolated bridges
using different structural parameter, this study illustrated the contribution of isolators on
reducing damage probability of bridge columns. They found that the damage probability of
isolated systems tends to be higher for a higher level of pier height compared to non-isolated
systems. Using a performance based evaluation approach, Zhang and Huo (2009) investigated
the effectiveness and optimum design parameters of isolation devices using fragility analysis.
Using PSDA and IDA they developed fragility functions for isolated bridges and determined
the optimum combinations of mechanical parameters of isolation devices as a function of
structural properties and damage states. Figure 3.10c shows the effect of isolation on the
seismic fragility of bridges. From this figure it is evident that isolation significantly reduces
the bridge vulnerability. Alam et al. (2012) investigated the seismic vulnerability of a three-
span continuous highway bridge, restrained by shape memory alloy (SMA) bars and isolated
with laminated rubber bearings. They concluded that the failure probability of the bridge
system is dominated by the bridge piers over the isolation bearings and inclusion of SMA
restrainers in the bridge system exhibits high probability of failure, especially, when the system
is isolated with lead rubber bearings. Using capacity/demand approach, Jara et al. (2013)
proposed a methodology for generating fragility curves for isolated irregular bridges. They
proposed a simplified approach to obtain fragility curves based on non-linear static analyses.
55

3.6.5 Fragility analysis of irregular, curved and skewed bridges
Bridges with unequal column height are often found in highway bridges crossing a basin
or valley and behave in an undesirable way during a seismic event. In an irregular bridge with
different column heights, the deformation demand in individual piers is usually different while
the shortest pier being subjected to maximum demand (Tehrani and Mitchell 2012).
Considering 18 different bridge configurations based on the column height, Akbari (2010)
generated fragility curves for irregular bridges. He concluded that at high intensity earthquake,
the short piers of the irregular bridge experience extensive damage while the long piers remain
elastic. Horizontally curved steel bridges have become very popular and more than one third
of steel bridges constructed in US are curved (Davidson et al. 2002). Since the seismic response
of horizontally curved bridges is different from the straight bridges, several researchers have
investigated the seismic fragility of horizontally curved steel girder bridges (Mohseni, 2011;
Linzell, 2012, AmiriHormozaki et al. 2013). AmiriHormozaki et al. (2013) identified torsion
index as a significant parameter for fragility assessment of curved steel girder bridges. This
study showed that the vulnerability of curved bridges is under predicted by the HAZUS
fragility curves as compared to the analytically derived fragility curves. Figure 3.10d shows
the effect of curvature on the fragility of bridges. From this figure it is evident that horizontal
curvature significantly affects the vulnerability of bridges.
Skewed bridged are often encountered in the design of highway bridges and mostly
found in multi-level interchanges which show a complicated dynamic behavior as compared
to straight bridges (Samman et al. 2007). Several researchers (Pottatheere and Renault 2008,
Sullivan and Nielson 2010, Moschonas and Kappos 2011, Huo and Zhang 2013, Zakeri et al.
2013) have investigated the impact of skewness on seismic vulnerability of highway bridges.
The effect of skewness on the seismic vulnerability of bridges is depicted in Figure 3.10e.
Pottatheere and Renault (2008) reported that for a skewed reinforced concrete bridge,
elastomeric bearing and columns are the most vulnerable component and for the same
intensity, the damage probability increases with increased skew angle. Huo and Zhang (2013)
reported that the influence of pounding can be devastating in skewed bridges while at large
skew angle (600) this affect is reduced. They suggested not to incorporate pounding and
skewness simultaneously in the design of highway bridges since pounding can increase the
56
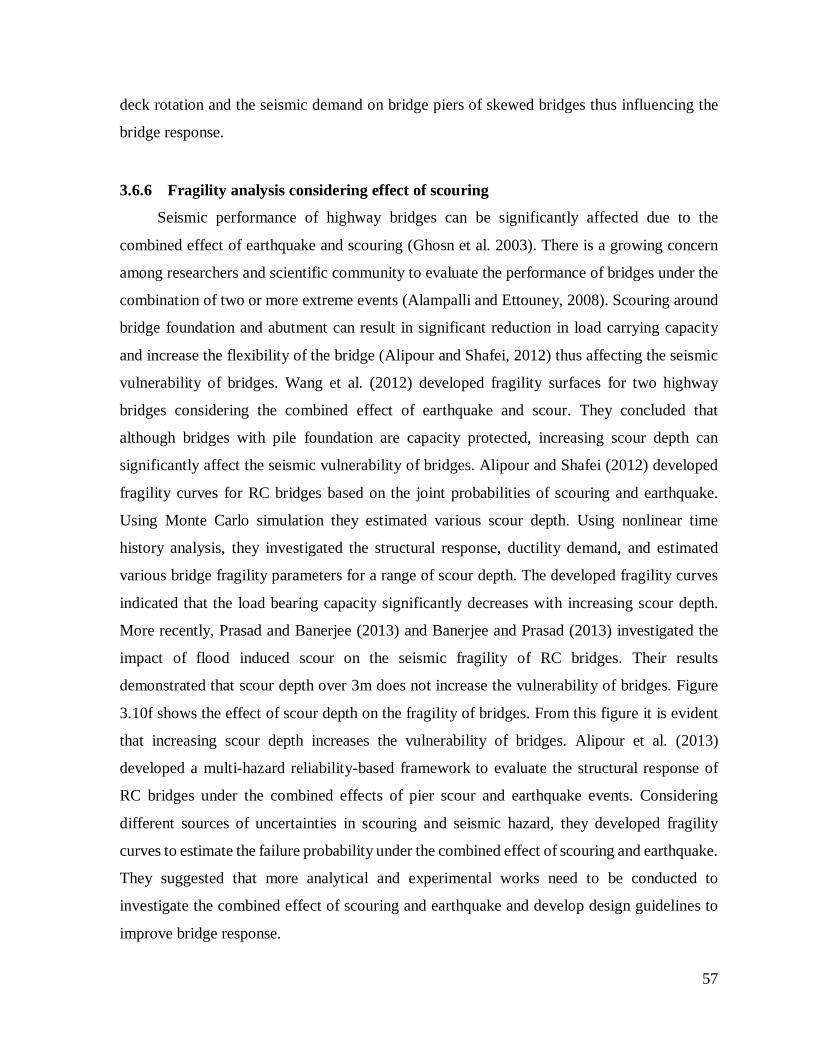
deck rotation and the seismic demand on bridge piers of skewed bridges thus influencing the
bridge response.
3.6.6 Fragility analysis considering effect of scouring
Seismic performance of highway bridges can be significantly affected due to the
combined effect of earthquake and scouring (Ghosn et al. 2003). There is a growing concern
among researchers and scientific community to evaluate the performance of bridges under the
combination of two or more extreme events (Alampalli and Ettouney, 2008). Scouring around
bridge foundation and abutment can result in significant reduction in load carrying capacity
and increase the flexibility of the bridge (Alipour and Shafei, 2012) thus affecting the seismic
vulnerability of bridges. Wang et al. (2012) developed fragility surfaces for two highway
bridges considering the combined effect of earthquake and scour. They concluded that
although bridges with pile foundation are capacity protected, increasing scour depth can
significantly affect the seismic vulnerability of bridges. Alipour and Shafei (2012) developed
fragility curves for RC bridges based on the joint probabilities of scouring and earthquake.
Using Monte Carlo simulation they estimated various scour depth. Using nonlinear time
history analysis, they investigated the structural response, ductility demand, and estimated
various bridge fragility parameters for a range of scour depth. The developed fragility curves
indicated that the load bearing capacity significantly decreases with increasing scour depth.
More recently, Prasad and Banerjee (2013) and Banerjee and Prasad (2013) investigated the
impact of flood induced scour on the seismic fragility of RC bridges. Their results
demonstrated that scour depth over 3m does not increase the vulnerability of bridges. Figure
3.10f shows the effect of scour depth on the fragility of bridges. From this figure it is evident
that increasing scour depth increases the vulnerability of bridges. Alipour et al. (2013)
developed a multi-hazard reliability-based framework to evaluate the structural response of
RC bridges under the combined effects of pier scour and earthquake events. Considering
different sources of uncertainties in scouring and seismic hazard, they developed fragility
curves to estimate the failure probability under the combined effect of scouring and earthquake.
They suggested that more analytical and experimental works need to be conducted to
investigate the combined effect of scouring and earthquake and develop design guidelines to
improve bridge response.
57

3.7 Effect of Ground Motion on Fragility Analysis
Selection of ground motion plays an important role in generating fragility curves for
highway bridges. The effect of ground motion suites, directionality, angle of incidence, and
spatial variation on fragility assessment have been investigated by several researchers (Kim
and Feng 2003, Ramanathan et al. 2010b, Banerjee and Shinozuka 2011, Nielson and Pang
2011, Torbol and Shinozuka 2012, Elhowary et al. 2013). Kim and Feng (2003) concluded that
ground motions with spatial variation induces increased fragility for long span bridges. They
suggested incorporating the effect of ground motion spatial variation for the seismic design of
long span bridges. The seismic fragility of a nine span continuous box girder bridge under
spatially variable ground motion was investigated by Elhowary et al. (2013). They concluded
that the bridge response in transverse direction is more sensitive to the spatial variability of
ground motion. Their result illustrated that bridges in soft soils are more vulnerable to spatially
variable ground motions. Banerjee and Shinozuka (2011) investigated the effect of ground
motion directionality on the fragility characteristics of highway bridges. Their results showed
that ground motion directionality play an important role in estimating the fragility
characteristics. Considering seismic incidence angle as an important parameter, Torbol and
Shinozuka (2012a, 2012b) developed fragility curves for highway bridges. They illustrated
that the vulnerability of a highway bridge may be underestimated if the angle of seismic
incidence is not considered. They concluded that, this effect gets aggravated in case of skewed
and curved bridges. Nielson and Pang (2011) investigated the effect of ground motion suite
size on fragility of highway bridges. They suggested using a suite of 80 or more ground
motions in order to keep variation in median and dispersion estimates reasonable. They
concluded that less number of ground motions can be used if more selective procedure is
adopted to assemble the ground motion suite. The effect of fault distance on fragility estimate
was investigated by Billah et al. (2013). Using suites of near fault and far field ground motion,
they investigated the seismic fragility of retrofitted bridge bents. Their study showed that, near
fault ground motion imposes high ductility demand thereby increases the vulnerability of
bridge bents.
3.8 Possible Future Development
Although there exist a wide variety of methodologies for fragility curve development,
still there is scope for significant improvement in fragility curve development methodology.
58

Key features of the different studies described above are summarized in Table 3.4 in order to
illustrate the gradual development of fragility curve methodology. The table reveals that,
despite advances in analytical models and risk assessment methods, there still remain scopes
to improve the existing fragility curve development methodology. An improved hybrid model
for fragility curve development is proposed in this study which involves empirical,
experimental, and analytical method. A flow chart showing the proposed methodology is
illustrated in Figure 3.11.
Figure 3.11. Proposed methodology for developing hybrid fragility curves
Hybrid Fragility Curves
Develop damage statistics
Estimate damage at different
intensities
Empirical Method Experimental Method Analytical Method
Statistical quantification
of demand and capacity
Develop damage-
intensity matrix
Hybrid Simulation/Damage
data from experimental investigation
Bayesian updating of
capacity and demand model
Dynamic analysis of appropriately calibrated model
Estimation of different
component demand
Modification factor to allow for
material and geometric uncertainty
Development of fragility curves
59
This method is more suited for regional fragility assessment. Using post-earthquake
reconnaissance data empirical fragility curves are developed which lack generality and are
usually associated with a large degree of uncertainty. Moreover, the damage observed are
structure specific and cannot be extended to other similar bridges having different geometry
and material properties. This limitation can be overcome by combining empirical damage
states with experimental observation. From the observed damage, a damage matrix can be
developed which will relate the different component damage with intensity measure. An
interesting technique can be the use of hybrid simulation using appropriately calibrated model
of the damaged bridges. This procedure will enable the updating of the damage states of
different bridge components and improvements in accuracy in defining the limit states with
data available from experiments and simulations. Moreover, if the hybrid simulation facility is
not available, experimental results available in the literature that resembles the configuration
of different components of bridges can be used to develop the limit states. One of the major
elements in developing fragility relationship is the development of demand and capacity
models. Using experimental results an accurate demand and capacity models can be developed.
Using statistical quantification the uncertainty associated with the demand and capacity models
can be estimated. A Bayesian updating technique can be employed to take into account the
changes in material and geometric properties. Once the demand and capacity models are
established, using calibrated analytical models, the response of the full bridge can be evaluated
using dynamic time history analysis over a wide range of ground motion. In addition
development of some modification factor will allow to consider for the changes in material
and geometric properties. These appropriately calibrated modification factors can be used to
generate the fragility functions for a typical class of bridges in the whole inventory. These
modification factors can be generated using different statistical learning techniques available
in literature. Although this section provides a brief description of possible future development
of a novel fragility curve development technique, further study along with detailed examples
are required to check the adequacy of the proposed method.
60

Table 3.4. Key features of modern bridge fragility curve development efforts
Author Bridge Type Ground Motion Method Component/
System Feature
Mander 1998 Different Spectrum CSM System Introduction of new generation bridge fragility curve
Yamazaki et al. 2000
Expressway in Japan Kobe Empirical System Empirical fragility
curve Shinozuka et al. 2000
4-span straight bridge Synthetic NLTHA+C
SM Component Comparison of NLTHA and CSM
Hwang et al. 2001
4-span straight bridge Synthetic NLTHA Component Damage state
definition Karim and Yamazaki 2003
4-span straight bridge
Strong Motion
NLTHA and SPO Component Simplified
Gardoni et al. 2003
Multi-Span straight bridge N/A
Bayesian Updating +SPO
System Probabilistic capacity and demand model
Mackie and Stojadinovic, 2003
Multi-Span straight bridge
Strong Motion IDA System Optimal PSDM
Nielson, 2005 SSC/MSSS/MSSC/MSCC/MSCS/SSS
Synthetic NLTHA Component +System
Component level approach
Padgett, 2007 SSC/MSSS/MSSC/MSCC/MSCS/SSS
Synthetic NLTHA Component +System
Retrofitted and as built bridges
Kwon and Elnashai 2010
Multi-Span steel girder bridge
Synthetic+ Strong motion
NLTHA Component +System
SSI modeling technique
Aygun et al. 2011
Multi-Span continuous steel bridge
Synthetic NLTHA Component +System Soil Liquefaction
Ramanathan et al. 2012
MSSC+MSSS+MSCC+ MSCS
Synthetic NLTHA Component +System
Seismic and non-seismic detailing
Vosooghi and Saiidi 2012 Bridge pier Shake
Table Experimental Component
Probabilistic performance based design
Billah et al. 2013 Multi-column bent
Strong Motion IDA Component Near fault and far
field motion
Banarjee and Prasad 2013
5-span straight concrete bridge
Synthetic NLTHA Component Flood induced scour
Amirhormozaki et al. 2013
Horizontally curved steel girder bridge
Strong Motion NLTHA Component
+System Curved girder bridge
61

3.9 Summary
This chapter presented a detailed review of the state-of-the-art methodologies for the
development of fragility curves of highway bridges. This study provides an insight into the
current practice and applications relating to the seismic fragility assessment of highway
bridges. Because of its versatile application, fragility curve has evolved as an integral part of
seismic risk assessment methodology. It allows the decision makers and stake holders in risk
mitigation and management by translating the seismic demand into a probabilistic performance
matrix. Since its inception, fragility curves have evolved from simplest to complex approaches.
This study summarized the evolution of different mechanical approaches developed for
fragility curve generation and their applications in different parts of the world along with their
features and limitations. This study also presented the fragility curve methodologies for
different bridge components and effect of considering different scenarios such as, retrofitting,
isolation, soil-structure interaction, on the bridge fragility curves.
Seismic fragility assessment of highway bridges involve a large amount of complexity
and uncertainty. It is likely that no such methodology is available to fully and accurately
consider all these complexity and uncertainties. Each methodology has its own advantages and
disadvantages. Individual methodologies were developed based on different assumptions
which emphasize on certain aspect of the problem and minimize or even ignore others.
Fragility curves generated following any particular method should be interpreted very carefully
and should not be considered as definitive. Although fragility analysis has emerged as a
promising tool for seismic performance assessment of highway bridges, as of today it has not
been included in any design codes or guidelines as a method for determining the seismic
performance of bridges at different hazard levels. More research in this area needs to be
conducted in developing methodologies for fragility analysis which can be incorporated in the
seismic design of highway bridges.
62

CHAPTER 4. BOND BEHAVIOR OF SMOOTH AND SAND-COATED SHAPE MEMORY ALLOY (SMA) REBAR IN CONCRETE
4.1 General
Conventional steel reinforcement possess lugs or surface deformation which transfer the
bond forces by mechanical interlock and friction. However, SMA rebars are usually produced
in round shapes with smooth surface without any lugs. Moreover, most of the commercially
available SMA rebars are made of Ni-Ti alloy which is extremely hard and difficult to machine
using conventional equipment (Alam et al. 2007). On the other hand, threading of large
diameter SMA rebars reduces the strength significantly (Alam et al. 2007). Although the
surface of SMA rebar is similar to the plain steel reinforcement found in historical structures,
mechanical behaviour of SMA bars, however, significantly differs from that of the plain steel
reinforcing bars. Extensive experimental studies have been carried out by several researchers
on the bond behaviour of plain steel reinforcement (Wu et al. 2014, Verderame et al. 2009,
Feldman and Bartlett 2005, 2007). However, no study has been undertaken so far to evaluate
the bond behaviour of SMA rebars with concrete. This justifies the need to conduct an
experimental investigation of the bond behaviour of SMA rebars embedded in concrete.
Several researchers have investigated and showed the efficacy of SMA as reinforcement
in concrete structures. However, for large scale application in construction industry, different
structural aspects of SMA rebars should be investigated to ensure their reliable application.
The interfacial bond behaviour between SMA rebar and concrete is a governing factor in
controlling the deformation of SMA-RC structures. SMA rebar is currently available with
smooth surfaces. While using this smooth rebar as internal reinforcement in critical regions
(e.g. plastic hinge region of a beam), a large major crack will be formed under loading. This
crack will be flexural bond crack and the concrete section might experience shear failure at
this location since no aggregate interlocking is available for resisting shear. Figure 4.1 shows
such condition, where SMA was used in the plastic hinge region of a beam-column joint and a
large major crack was observed due to the use of smooth surfaced SMA rebar. However, for
deformed or properly bonded bar, many small cracks will be formed and distributed over the
whole plastic hinge length and can help resist more loading. In order to overcome the
drawbacks of smooth SMA rebar, the surface of the smooth SMA bar was roughened using
63

sand coating. Two different granulometries were used to evaluate the effect of surface
roughness on the bond behavior of SMA rebar by means of providing improved interlocking
in addition to mechanical adhesion. The objective of this experimental investigation is to study
the bond behavior of SMA rebar where the variables include SMA bar diameter, concrete
strength, bonded length, concrete cover, and surface condition. Based on the experimental
results, empirical equation for predicting the average maximum bond strength of SMA rebar
has been developed. This research has practical significance since the outcome of the study
will provide an understanding of the bond behavior of SMA rebar and will provide a basis for
the development length prediction of SMA reinforced concrete members.
Figure 4.1. Bond failure of concrete section having smooth SMA rebar (adapted from
Youssef et al. 2008)
4.2 Experimental Program
The experimental program conducted in this study involved a series of 56 pushout test
specimens (concrete cylinders) with different parameters (Table 4.1). In this study, pushout
test was selected since it was simple to conduct and overcome the drawbacks associated with
pullout test as described in Feldman and Bartlett (2005).
4.2.1 Variables
A review of literature on bond behaviour of reinforcement with concrete dictated that
five different parameters need to be investigated to evaluate the bond behaviour of SMA rebar
with concrete (Verderame et al. 2009, Feldman and Bartlett 2005, 2007, Wambeke and Shield
2006, Hossain and Lachemi 2008, Hossain et al. 2014). The parameters include: concrete
compressive strength (35, 40, 50, and 60 MPa); embedment length (3db, 5db, 7db, 9db), bar
diameter, db, (20 mm and 32 mm), concrete cover (34 mm, 40mm, 59mm and 65mm) and
64

surface condition (smooth, sand coated). These parameters were selected based on materials
availability, available testing facilities, and practical applications.
Table 4.1. Pushout test specimens
Bar Size
Bar Finish ld, mm Concrete
cover, mm Compressive
Strength, MPa Sample No.,
n
20 mm
Smooth
60 40 35 2 100 40 35 2 140 65 35 2 180 65 35 2 60 40 50 2
100 40 50 2 140 65 50 2 180 65 50 2 60 40 40 2 60 40 60 2
Sand-300
60 40 50 2 100 40 50 2 140 40 50 2
Sand-600
60 40 50 2 100 40 50 2 140 40 50 2
32 mm
Smooth
96 34 35 2 160 34 35 2 224 59 35 2 280 59 35 2 96 34 50 2
160 34 50 2 224 59 50 2 280 59 50 2
Sand-300
96 34 50 2 160 34 50 2
Sand-600
96 34 50 2 160 34 50 2
Total= 56
4.2.2 Materials
In this study, Ni-Ti SMA rebar (nitinol) has been used as reinforcement to investigate
the bond behaviour. The austenite finish temperature, Af, which defines the transformation
from martensite to austenite phase, ranges from -150C to -100C. All the Ni-Ti bars used in this
65

study were 450 mm long. The yield strength of the SMA rebar was 401 MPa at a strain of
0.75% and the elastic modulus was 62.5 GPa. This values were provided by the SMA
manufacturer. Four different concrete mixes were considered for evaluating the effect of
concrete compressive strength on the bond-behaviour of SMA rebar. Similar type of cement,
fine aggregate and coarse aggregate were used for different concrete mixes, while the
proportions were varied accordingly to get the desired compressive strength.
4.3 Specimen Preparation and Testing
Cylindrical concrete specimens with dimensions of 100 mm×200 mm and 150 mm × 300
mm (D×L) with SMA rebar at the center were used in this study. Figure 4.2 shows the picture
of few specimens after casting. The as-received bars were smooth and later the surface
condition was modified using sand of two different granulometries. Two different sizes of
sand, 300 µm and 600 µm were used to modify the rebar surface and investigate the effect of
surface modification on the bond behavior. G/Flex epoxy (west systems) was used as the
adhesive to apply sand coating on the rebar. Using sandpaper, the rebars were cleaned to
remove any dirt on the surface and the required embedment length was marked before applying
the epoxy (Figure 4.3a). A paint brush was used for applying the epoxy coating on the surface
of each rebar (Figure 4.3b), and subsequently, the epoxy coated rebars were rolled over the
sand for sand coating (Figure 4.3c). The total thickness of the epoxy and sand were between
1.5 mm-2 mm. Then the rebars were cured for 48 hours for proper bonding (Figure 4.3d). The
embedment length of sand coated rebars is also shown in Figure 4.3d.
Figure 4.2. Specimens after casting
66

Figure 4.3. Sand coating of SMA rebar (a) bonded length, (b) epoxy application, (c) sand
coating and (d) sand coated rebars
For the pushout test, the concrete cylinder with the SMA bar at its center was placed on
a metal frame with a circular plate at the top having a 35 mm hole at the center. Figure 4.4
shows the test setup for the pushout test. The rebar was positioned in the cylinder in such a
way that 50 mm of the rebar popped out beyond the top surface of the cylinder (loaded end), a
certain length of the bar was embedded in concrete (i.e. the embedment length in Figure 4.4),
and the remaining portion protruded from the bottom of the cylinder (free end) to allow
connection of the displacement sensors (string potentiometer). The embedment length was
varied as shown in Table 4.1. In order to avoid stress concentration, a length of 25 mm at both
the top and the bottom of the specimens was wrapped with plastics (i.e. the bond breaker in
Figure 4.4). A flat metal plate was placed on top of the SMA bar in order to apply the load
evenly on the bar. The test was conducted using Instron testing machine and the projecting bar
was pushed down by the actuator, and using a string potentiometer attached to the bottom of
the protruding rebar, the slip of the rebar was measured at the free end. An electronic load cell
equipped with the testing machine measured the load. Both the load and the rebar slip were
recorded through the data acquisition system. The load was applied at a rate of 1-1.5 kN/sec.
The test was conducted until a slippage of 30 mm was recorded.
67

Figure 4.4. Test setup for bond behavior SMA rebar with concrete
4.4 Experimental Results
4.4.1 Failure modes
The pushout test specimens with smooth SMA bars failed at the concrete-rebar interface
without developing any splitting crack. In smooth SMA rebar there was no surface
deformation. Therefore, the bond force was transferred only by adhesion between the concrete
and SMA rebar before any slip occurred. When the adhesion was lost, the bond mechanism
developed due to the friction between the rebar and the small particles that broke free from the
concrete upon slip, and the plain rebar simply slipped through the concrete. Figure 4.5 shows
the condition of the pushout specimens with plain rebar before and after testing. From Figure
4.5a it can be seen that initially the rebar was protruded 50 mm from the top which finally got
reduced to 20 mm at the end of the test (Figure 4.5b) without any sign of splitting cracks. A
closer look inside the cylinder (Figure 4.5c) shows that there was no significant bond between
the smooth SMA rebar and concrete as shown by the smooth surface of the concrete.
68

Figure 4.5. Specimens (smooth) (a) before testing, (b) after testing and (c) inside view
On the other hand, for all the sand coated SMA rebars, failure took place at the interface
between the SMA bar and the surrounding concrete (Figure 4.6). Splitting cracks developed
on the concrete bearing surface which extended along the perimeter and continued down the
length of the specimens for all the cylinders with 20 mm sand coated SMA rebars. In the case
of 32 mm bars coated with 600 µm sand, it showed similar crack pattern while the 32 mm bars
coated with 300 µm sand only experienced minor radial cracks developed on the concrete
bearing surface. However, the radial cracks did not extend to the specimen perimeter for
cylinders with 32 mm SMA rebars coated with 300 µm sand.
69

Figure 4.6. Failure pattern of sand coated bars (a) radial cracking, (b) crack propagation in
concrete and (c) inside view
4.4.2 Load-slip relationship and bond strength
After processing the data obtained from the pushout tests, the load-slip relationship for
each test was obtained. Typical load-slip behavior of smooth SMA rebar is shown in Figure
4.7 for a 100 × 200 mm specimen having a 20 mm diameter bar, 60 mm embedment length,
and 40 mm concrete cover. The load-slip curve consists of four parts: (I) elastic stage, (II)
ascending branch up to peak load, (III) linearly descending branch, and (IV) residual branch.
Figure 4.7 also shows the four stages in the load-slip curve. The elastic stage is defined when
there is almost no slip with the increase in load and the adhesion bond mechanism plays the
major role in transferring the load between SMA and concrete. When the adhesion bond starts
to break, the ascending branch starts and continues upto the maximum load, Pmax at little slip.
In the descending stage, the peak load starts to drop suddenly with significant increase in slip
value. As slip increases, the wedging action of small particles provide the sole bond
mechanism. At the residual stage, the load dropped asymptotically to a limiting residual load
Pres and the slip values increased quite quickly.
70

Figure 4.7. Load-slip curves for pushout test of smooth SMA rebar
In this study, the bond strength (τ) of an SMA bar embedded in concrete is assumed to
be distributed uniformly over the embedment length (Ld). At any stage of loading, the
maximum average bond strength can be calculated using equation 4.1:
db LdPπ
τ maxmax = (4.1)
where, Pmax is the maximum load obtained from the load slip relation, db is the bar diameter,
and Ld is the embedment length. In this study, the bond behavior of SMA rebar is investigated
in terms of maximum and residual bond strength. The average maximum bond strength (τmax)
can be calculated using equation 4.1 and the residual bond strength (τres) is calculated using
equation 4.2:
db
resres Ld
Pπ
τ = (4.2)
where, Pres is the residual load obtained from load slip curve.
4.4.3 Influencing factor analysis
The impact of different variables considered in this study was investigated individually
to find their effect on the bond strength variability. The following sections discuss the effect
of various parameters on bond strength of SMA rebar in concrete.
0
5
10
15
20
25
30
35
0 2 4 6 8 10
Load
(kN
)
Slip (mm)
Pmax = 32.38 kN slip = 0.48mm
Pres = 6.25 kN slip = 10 mm
(I)
(II)
(III)
(IV)
71

4.4.3.1 Effect of concrete strength
For investigating the effect of concrete compressive strength, four different concrete
strengths were considered. Keeping the embedment length and concrete cover constant at 60
mm and 40 mm, respectively, a total of eight specimens were tested to evaluate the influence
of concrete strength on bond behavior of smooth SMA rebar with concrete. Figure 4.8 shows
the effect of concrete strength on the maximum and the residual bond strength. Separate
regression analyses revealed that both maximum and residual bond strength are functions of
the square root of the concrete compressive strength. This is coherent with the findings of other
researchers (Wu et al. 2014, Feldman and Bartlett 2005) on plain rebar and as per the current
North American standards (CSA A23.3-14, ACI 318-11).
Figure 4.8. Effect of concrete compressive strength on average (a) maximum and (b)
residual bond strength of smooth SMA bar
From Figure 4.8 it can be observed that, both maximum and residual bond strength
increase with an increase in concrete compressive strength and this increase is proportional to
the square root of compressive strength. A regression analysis of the test results for which the
maximum average bond strength of smooth SMA rebar were measured, yielded the following
equation (4.3).
225.4 /max −= cfτ (4.3)
0
2
4
6
8
10
12
14
0 2 4 6 8 10
Max
. Bon
d St
ress
, τm
(MPa
)
√fc' (MPa1/2)
35 MPa40 MPa50 MPa60 MPa
(a)
0
0.5
1
1.5
2
2.5
3
0 2 4 6 8 10
Res
. Bon
d St
ress
, τr(M
Pa)
√fc' (MPa1/2)
35 MPa40 MPa50 MPa60 MPa
(b)
72

where, τmax is maximum average bond strength in MPa. This equation can predict the bond
strength very well for concrete with compressive strength of up to 40 MPa, but at a higher
strength there is a variation of approximately +/- 1.5 MPa
4.4.3.2 Effect of bar diameter
Figure 4.9 compares the average maximum and residual bond strength of 20 mm and 32
mm smooth SMA rebars. From Figure 4.9a it is evident that, as the bar diameter increases the
average maximum bond strength decreases. However, no significant influence of bar diameter
was observed in the case of average residual bond strength. Since, the results presented in
Figure 4.9 had different concrete strengths, the bond strength is normalized by the square root
of the concrete compressive strength. In general, the average maximum bond strength of 20
mm bar was 30%-45% higher than that of 32 mm bar. From the test results, it was observed
that the effect of bar diameter was more pronounced for concrete with lower strength (35 and
40 MPa) as compared to high strength concrete (50 and 60 MPa). For low strength concrete,
the bond strength increased as high as 45% for 20 mm bar as compared to 32 mm bar. In
contrast, the bond strength of 32 mm bar decreased by 30% for high strength concrete. This
can be attributed to the fact that larger diameter bars require longer embedment length for
developing adequate bond strength. Moreover, the Poisson effect with increasing diameter
would reduce the adhesion thereby reduces the bond strength.
Using the test results, a relationship between bond strength of smooth SMA bar and its
bar diameter can be expressed as:
bc
df
025.025.1/
max −=τ (4.4)
where, db is the bar diameter. Comparison with experimental result showed that equation 4.4
relates very well for smaller diameter as compared to the large diameter. For 20 mm rebar the
average absolute error was 3.2% while that for 32 mm rebar was 6.5%.
73

Figure 4.9. Effect of bar diameter on average (a) maximum and (b) residual bond strength of
smooth SMA bar
4.4.3.3 Effect of embedment length
Four different embedment lengths (3 db, 5 db, 7 db, 9 db) were considered to evaluate their
influence on bond strength of smooth SMA rebar. Figure 4.10 shows the effect of embedment
length on the average maximum and residual bond strength of SMA rebar. From Figure 4.10
it is evident that the average maximum and residual bond strength increases as the embedment
length decreases. Similar behavior has also been reported in literature for steel (Feldman and
Bartlett 2005) and FRP rebar (Sayed et al. 2011). The increase in average maximum bond
strength is more pronounced in small diameter bars as compared to the large diameter ones.
For instance, the average maximum bond strength of the 3db specimens are almost 40% higher
as compared to 7db specimens of 20 mm smooth SMA bars. On the other hand, for the 32 mm
bars the same increased by only 27%. This can be attributed to the fact that as the embedment
length increases, the surface area over which the SMA bar is bonded to the concrete increases.
This increased surface area results in a reduced average bond stress between the bar and the
surrounding concrete and also reduces the average stress transferred into the surrounding
concrete. Moreover, a reduction in the bar diameter due to Poisson’s effect, which leads to a
reduction in friction along the embedment length results in a reduced bond strength. A
regression analysis of the test results yielded the following quadratic relationship between the
normalized bond strength (τmax/√fc/) of smooth SMA rebar and its embedment length:
0
0.2
0.4
0.6
0.8
1
1.2
0 10 20 30 40
τ max
/√fc
'(MPa
1/2 )
Bar diameter (mm)
(a)
0
0.05
0.1
0.15
0.2
0.25
0.3
0 10 20 30 40
τ res
/√fc
'(MPa
1/2 )
Bar diameter (mm)
(b)
74

05.1005.010 25/
max +−= −dd
c
llf
τ (4.5)
This quadratic relationship is in contrast with the behavior of deformed rebar where there is a
liner relation between bond strength and embedment length.
Figure 4.10. Effect of embedment length on average (a) maximum and (b) residual bond
strength of smooth SMA bar
4.4.3.4 Effect of concrete cover
The test results were used to determine the effect of concrete cover on the bond behaviour
of smooth SMA bars. The effect of cover concrete was investigated in terms of cover to bar
diameter ratio (c/db). Figure 4.11 shows the variation in average maximum and residual bond
strength of smooth SMA bar with changing cover to bar diameter ratios. From Figure 4.11 it
is observed that c/db has noticeable impact on maximum bond strength, however, residual bond
strength was independent of c/db. The influence of c/db is higher for smaller diameter bars as
compared to large diameter ones. From Figure 4.11a it can observed that, for 20 mm bars, as
the c/db increases from 2 to 3.25 (1.625 times) the average maximum bond strength increases
by 14%. On the other hand, for 32 mm bars, as the c/db increases from 1.06 to 1.84 (1.74 times)
the average maximum bond strength increases by 6.5%. A regression analysis of the test results
yielded the following quadratic relationship between the normalized bond strength (τmax/√fc/)
of smooth SMA bar and its cover to bar diameter ratio (c/db):
00.10.20.30.40.50.60.70.80.9
0 100 200 300
τ max
/√fc
'(MPa
1/2 )
Embedment length, ld(mm)
60 mm 96 mm100 mm 140 mm160 mm 180 mm225 mm
(a)
0
0.05
0.1
0.15
0.2
0.25
0.3
0.35
0 100 200 300τ re
s/√
fc'(M
Pa1/
2 )Embedment length, ld(mm)
60 mm 96 mm100 mm 140 mm160 mm 180 mm225 mm
(b)
75

82.020.009.02
/max +−
=
bbc dc
dc
fτ (4.6)
Figure 4.11. Effect of concrete cover to bar diameter ratio on average (a) maximum and (b)
residual bond strength of smooth SMA bar
4.4.3.5 Effect of surface modification
Previous research on smooth steel and FRP rebars have shown that surface modification
of the plain rebars can improve the bond strength significantly (Feldman and Bartlett 2005,
Arias et al. 2012). However, several researchers have concluded that rebar surface does not
appear to affect the bond strength of FRP rebars in concrete (Mosley et al. 2008, Wambeke
and Shield 2006). The smooth SMA rebars used in this study were modified using two different
types of sand in order to improve the bond behavior. Due to the importance of rebar surface on
the bond behavior, it is worth investigating the variation in bond behavior with different surface
finish. Figure 4.12 shows bond strength- slip curves for specimens having different surface
finishes with 20 mm bars, ld of 60 mm and 40 mm cover. Observation from Figure 4.12a
revealed that, sand coating significantly improves the bond behavior of smooth rebar. The
maximum average bond strength of 600µm sand coated rebar was 45% and 37% higher than
the smooth and 300µm sand coated rebar, respectively. The average residual bond strength of
600µm sand coated rebar was 29% and 35% higher than the smooth and 300µm sand coated
rebar, respectively. Interestingly, average residual bond strength of 300µm sand coated rebar
was 6% lower than that of smooth rebar.
0.4
0.5
0.6
0.7
0.8
0.9
1
1.1
1.2
0 20 40 60 80
τ max/√fc'(M
Pa1/
2 )
Concrete cover (mm)
34 mm
40 mm
59 mm
65 mm
(a)
00.050.1
0.150.2
0.250.3
0.350.4
0.45
0 20 40 60 80
τ res/√fc'(M
Pa1/
2 )
Concrete cover (mm)
34 mm
40 mm
59 mm
65 mm
(b)
76

Figure 4.12b and c show the influence of rebar diameter and embedment length on the bond
strength behavior of SMA rebars with different surface finishes. Similar trend was observed
for all the bars irrespective of bar finish; the bond strength decreases as the bar diameter and
embedment length increases. From Figure 4.12b it can be observed that, the 32 mm sand coated
bars produced higher maximum average bond strength as compared to smooth 32 mm bars.
Similar conclusion can be drawn on the effect of embedment length. Figure 4.12c shows that
the 600 µm sand coated bars with different embedment lengths produces higher bond strength
as compared to those of smooth rebars and 300 µm sand coated bars. It can be concluded that
the friction and interlocking produced by the roughened surface creates a more effective
mechanism and improves the bond of smooth SMA rebar significantly.
Figure 4.12. Effect of sand coating on bond strength of SMA rebar (a) bond stress-slip curve,
(b) effect of bar diameter and (c) effect of embedment length
0
2
4
6
8
10
12
0 2 4 6 8 10
Bon
d St
ress
, τ(M
Pa)
Slip (mm)
As- receivedSand-300Sand-600
(a)
0
2
4
6
8
10
12
As-Received Sand-300 Sand-600
Bon
d St
ress
, τ(M
Pa)
Rebar Finish
20 mm 32 mm(b)
0
2
4
6
8
10
12
As-Received Sand-300 Sand-600
Bon
d St
ress
, τ(M
Pa)
Rebar Finish
3db 5 db 7db(c)
77

4.5 Empirical Relationship for Bond Strength of SMA Rebar
The analysis results presented and discussed on previous sections revealed the influence
of different factors and surface condition on the bond strength of SMA rebar with concrete.
Regression analysis of all the specimens, considering all influential parameters, yields the
following equation.
/max 015.00025.0004.09.0 c
bdbr f
dcldk
+−−=τ (4.7)
Where, τmax is the average maximum bond strength in MPa, db is the bar diameter in mm,
ld is the embedment length in mm, c is the concrete cover in mm, fc/ is the concrete compressive
strength in MPa, and kr is the surface roughness factor which is 1 for smooth rebar. In the case
of sand coated rebar, kr can be calculated using equation 4.8.
5.692.117.0 2 +−= ααrk (4.8)
where, α is the sand size coefficient and calculated as, α= 2/sand size in mm.
The proposed equation 4.7 can be used to estimate the bond strength of SMA rebar in
concrete considering both smooth and sand coated surface. To verify the accuracy of the
proposed equation, comparison was made with experimental results. Figure 4.13 shows the
comparison of normalized bond strength obtained from the test results and the proposed
equation. Figure 4.13 shows that the proposed equation predicted the bond strength very well
where the correlation coefficient is 0.916.
4.6 Comparison with Bond Behavior of Sand Coated FRP Bars
For comparative analysis, the bond strength of sand coated FRP bars provided by
different design codes are compared with sand coated SMA rebars tested in this study. The
average bond strength determined from experimental results and using equation 4.7 are
compared with the bond strength calculated as per CSA S806-12 (CSA 2012) and CSA S6-10
(CSA 2010). ACI 440.1R-06 (ACI 2006) was not considered since the ACI equation warrants
the development length to be at least 19db and the equation was developed based on concrete
strength between 28 MPa and 45 MPa. Since in this study, the sand coated SMA rebars were
78

tested with 50 MPa concrete and embedment length of 3db - 7db, the ACI equation may not be
accurate to predict the bond strength of sand coated SMA rebar.
Figure 4.13. Comparison between experimental and predicted values of τmax/√fc’
Canadian Standards Association CSA S806-12 (CSA 2012) provides the following
equation (eqn. 4.9) for calculating the development length of FRP Bars.
b
c
F
csd A
f
fd
kkkkkl
/
543215.1= (4.9)
Using equation 4.9, the following equation was derived to calculate the bond strength
of FRP rebars:
b
ccs
dkkkkkfd
πτ
54321
/
max 5.1= (4.10)
Where, dcs= smallest of the distance from the closest concrete surface to the center of the
bar being developed or two-thirds the center to center spacing of the bars being developed
(mm), fc/ = compressive strength of concrete (MPa); k1 = bar location factor (1.3 for horizontal
reinforcement placed so that more than 300 mm (11.81 inch) of fresh concrete is cast below
the bar; 1.0 for all other cases); k2= concrete density factor (1.3 for structural low-density
0
0.2
0.4
0.6
0.8
1
1.2
1.4
0 0.2 0.4 0.6 0.8 1 1.2 1.4
Pred
icte
d (τ
max
/√fc
')
Experimental (τmax/√fc')
79
concrete; 1.2 for structural semi-low-density concrete; 1.0 for normal density concrete); k3 =
bar size factor (0.8 for Ab< 300 mm2); 1.0 for Ab > 300 mm2); Ab is the cross-sectional area of
an individual bar in mm2; k4 = bar fibre factor (1.0 for CFRP and GFRP; 1.25 for AFRP); k5 =
bar surface profile factor (1.0 for surface roughened or sand coated or braided surfaces; 1.05
for spiral pattern surfaces or ribbed surfaces; 1.8 for indented surfaces).
According to the Canadian Highway Bridge Design Code CSA S6-10 (CSA 2010), the
expression for the bond strength of FRP rebar is calculated as:
crb
s
frptrcs
fdkkE
Ekd
πτ
61max 45.0
+
= ; (4.11)
snfA
k ytrtr 5.10= ; b
s
frptrcs d
EE
kd 5.2≤
+ (4.11)
Where, Atr = area of transverse reinforcement normal to the plane of splitting through the
bars (mm²); fy = yield strength of transverse reinforcement (MPa); s = center to center spacing
of the transverse reinforcement (mm); n = number of bars being developed along the plane of
splitting; EFRP = modulus of elasticity of FRP bar (MPa); Es = modulus of elasticity of steel
(MPa); k6 is bar surface factor, fcr is the flexural strength of concrete in MPa (0.4√f’c for normal
density concrete, 0.34√f’c for semi-low density concrete, 0.30√f’c for low-density concrete).
Table 4.2 shows the comparison of sand coated SMA rebars obtained from pushout tests
and prediction equation with those obtained from the two design codes. Table 4.2 shows that
the embedment length and concrete cover have no influence on the bond strength according to
CSA S806-12 (CSA 2012) and CSA S6-10 (CSA 2010). Since no transverse reinforcement
were provided in pushout specimens, the confinement effect provided by lateral reinforcement
index, ktr, in CSA S6-10 (CSA 2010) can be neglected. From Table 4.2 it can be observed that
the bond strength obtained using CSA S6-10 (CSA 2010) have a closer match with the
experimental and predicted bond strength of sand coated SMA bars. On the contrary, the bond
strength calculated using CSA S806-12 (CSA 2012) varies by a large margin. From the results
presented in Table 4.2, it can be concluded that with few modifications, the CSA S6-10 (CSA
80

2010) equation for bond strength prediction of sand coated FRP rebar can be used for the bond
strength prediction of sand coated SMA rebar. However, the proposed bond strength equation
is not suggested to be used for sand coated FRP rebar since design of FRP reinforced concrete
members would require certain other considerations.
Table 4.2. Comparison of Bond Strength Sand Coated SMA bars and FRP Bars
Rebar Type Experiment Prediction CSA S6-10 CSA S806-12 MPa MPa MPa MPa
20-300-3db 6.12 6.24 6.25 4.89 20-300-5db 5.28 5.35 6.25 4.89 20-300-7db 4.54 4.45 6.25 4.89 20-600-3db 9.82 9.80 6.25 4.89 20-600-5db 8.36 8.40 6.25 4.89 20-600-7db 7.11 7.00 6.25 4.89 32-300-3db 5.04 4.88 3.91 3.06 32-300-5db 3.37 3.46 3.91 3.06 32-600-3db 7.61 7.67 3.91 3.06 32-600-5db 5.48 5.43 3.91 3.06
Sample designation: bar dia-sand size-embedment length Concrete cover= 40 mm and Concrete strength = 50MPa
4.7 Summary
The distinct superelastic properties and flag shape hysteresis of Shape Memory Alloys
(SMAs) make them an ideal candidate for the design and development of various structural
components in civil infrastructure. Due to the fact that SMA reinforcement has significantly
different properties than conventional steel, structures reinforced with SMA will behave
differently. The design equations used for steel reinforced concrete structures are not
applicable while using SMA as reinforcement in concrete. This chapter investigated the bond
behavior of SMA rebars in concrete using 56 pushout specimens. The test results are explored
to evaluate the influence of concrete strength, bar diameter, embedment length, and surface
condition. Surface modification using sand coating notably improved the bond strength of
SMA rebar. Finally, empirical equation based on statistical analyses is presented to predict the
maximum average bond strength. The proposed equation appear to be reasonable for
calculating the average bond strength of SMA reinforcing bars in concrete.
81

CHAPTER 5. PLASTIC HINGE LENGTH OF SHAPE MEMORY ALLOY (SMA) REINFORCED CONCRETE BRIDGE PIER
5.1 General
Shape memory alloys (SMAs) have been emerging as an alternative to conventional steel
reinforcement in concrete structures due to its distinct shape recovery and superelastic
properties. Considering the importance of bridge pier, it is necessary to predict the
displacement capacity of bridge piers during earthquakes. Past researches have shown that
SMA could significantly improve the seismic performance of bridge piers through recentering
thereby significantly reducing the permanent damage. Previous researchers mostly used the
Paulay and Priestely (1992) equation for calculating the plastic hinge length in SMA-RC bridge
pier and reported that this equation provides a reasonable estimate of the plastic hinge of SMA-
RC pier. However, for seismic design of SMA-RC pier, it is necessary to identify the plastic
hinge length of the pier which can be used for calculating the flexural displacement capacity.
Most of the previous studies on plastic hinge length focused on beams and columns
(Mattock 1964; Corley 1966; Priestley and Park 1987; Paulay and Priestley 1992; Bae and
Bayrak 2008) where only a few studies were conducted for bridge piers (Hines et al. 2004,
Alemdar 2010). A review of existing plastic hinge equations showed that the plastic hinge
length of a bridge pier depends on many factors such as mechanical properties of longitudinal
and transverse reinforcement, concrete strength, level of axial load, aspect ratio, reinforcement
ratio, and level of confinement. Since the mechanical properties of SMA and its behavior under
lateral load are significantly different from conventional RC piers, it warrants a specific plastic
hinge expression for SMA-RC bridge pier. Although researchers have investigated the seismic
performance of bridge piers considering different types of SMA (Saiidi et al. 2009, Gencturk
and Hosseini 2014, Billah and Alam, 2014b), only one study (Nakashoji and Saiidi 2014) has
been conducted so far to estimate the plastic hinge length in SMA reinforced concrete (RC)
bridge pier. However, their proposed equation does not consider the effect of different
parameters and could estimate the plastic hinge length with 11.6% error.
Using a well-calibrated finite element model, this chapter developed a plastic hinge
length expression for SMA-RC bridge pier by investigating the distribution of curvature and
82

strain in the longitudinal rebar (both steel and SMA rebar) along the height of the pier. This
study adopted an analytical method to develop a plastic hinge length expression for SMA-RC
bridge pier due to the absence of adequate experimental results and limitations in conducting
experiments due to high cost of SMA. Considering different parameters such as the level of
axial load, aspect ratio, concrete strength, SMA properties and the ratio of the longitudinal and
transverse reinforcement, a parametric study was conducted to derive a plastic hinge length
expression for SMA-RC bridge pier. Finally, the proposed equation was used to estimate the
drift capacity of SMA-RC bridge pier and compared with test results.
5.2 Design and Geometry of Bridge Pier
This section briefly describes the design and configurations of different SMA-RC bridge
piers used in this study. Since SMA is a costly material it is only used in the bottom plastic
hinge region of the bridge pier. The bridge pier is assumed to be located in Vancouver, BC and
was seismically designed following the Canadian Highway Bridge Design Code (CSA-S6-10).
Figure 5.1 shows the cross section of the column. The diameter of all the columns was fixed
to be 1.524 m. Several parameters govern the design and the behavior of the bridge piers. These
parameters also affect the spread of plasticity along the length of the pier.
Figure 5.1. Geometry of SMA-RC bridge pier (a) Cross section, (b) Elevation and (c) Finite
element modeling
(a)(b) (c)
83

The primary variables of the parametric study were selected as the aspect ratio (L/d) of
the column, axial load ratio (P/f’cAg), longitudinal reinforcement ratio (ρl), transverse
reinforcement ratio (ρs), yield strength of SMA rebar (Fy-SMA) and concrete compressive
strength (fc’). These parameters were selected based on existing literature on plastic hinge
length of reinforced concrete elements (Paulay and Priestley 1992, Hines et al. 2004, Bae and
Bayrak 2008, Alemdar 2010, Bohl and Adebar 2011, Kazaz 2013). Table 5.1 shows the list of
considered parameters and their associated values. For each parameter three different values
were considered. Table 5.2 shows the summary of the SMA-RC pier specimens analyzed in
this study. A total of 18 piers were designed. In order to investigate the effect of different
parameters on the plastic hinge length of SMA-RC pier, one parameter at a time was varied
and others were kept constant. In this study, the interaction effect was not considered as it was
found that interaction between parameters do not have any significant impact. Apart from the
investigated parameter, the plastic hinge length of the piers was also varied and three different
plastic hinge lengths were considered: 0.5 LP/d, 0.75 LP/d and 1 LP/d. These three lengths were
selected as previous studies on SMA-RC bridge piers (O’Brien et al. 2007, Nakashoji and
Saiidi 2014) showed that the plastic hinge length varies from 0.5 LP/d to 1.1 LP/d. The diameter
and number of longitudinal reinforcement of different bridge piers were varied for different
reinforcement percentages and 15.875 mm (#5) spirals were used at different spacing as lateral
reinforcement. In this study, in order to ensure flexure dominated behavior and avoid shear
failure, three different aspect ratios (3, 5, 7) were considered.
Table 5.1. Details of variable parameters
Parameters Values Axial Load (%) 5 10 20 ρl (%) 1 2 3 Aspect Ratio (L/d) 3 5 7 fc
' (MPa) 35 50 60 ρs (%) 0.8 1 1.2 Fy-SMA (MPa) 210 450 750
84

Table 5.2. Details of SMA-RC bridge piers
Variable Pier P/fc’Ag H (m) fc' (MPa) ρl (%) fy-SMA (MPa) Lp (m) ρs (%)
Axial Load
P1-1 0.05 7.62 35 1 401 0.762 1.2 P1-2 0.1 7.62 35 1 401 1.143 1.2 P1-3 0.2 7.62 35 1 401 1.524 1.2
Aspect Ratio
P2-1 0.05 4.572 35 1 401 0.762 1.2 P2-2 0.05 7.62 35 1 401 1.143 1.2 P2-3 0.05 10.668 35 1 401 1.524 1.2
SMA fy P3-1 0.05 7.62 35 1 210 0.762 1.2 P3-2 0.05 7.62 35 1 401 1.143 1.2 P3-3 0.05 7.62 35 1 750 1.524 1.2
ρl (%) P4-1 0.05 7.62 35 1 401 0.762 1.2 P4-2 0.05 7.62 35 2 401 1.143 1.2 P4-3 0.05 7.62 35 3 401 1.524 1.2
fc'
P5-1 0.05 7.62 35 1 401 0.762 1.2 P5-2 0.05 7.62 50 1 401 1.143 1.2 P5-3 0.05 7.62 60 1 401 1.524 1.2
ρs (%) P6-1 0.05 7.62 35 1 401 0.762 0.8 P6-2 0.05 7.62 35 1 401 1.143 1 P6-3 0.05 7.62 35 1 401 1.524 1.2
5.3 Analytical Modeling
One of the main objectives of this study was to develop a fibre-based numerical model
capable of predicting the nonlinear behavior in terms of strain and curvature distribution of
SMA-RC bridge piers. The modeling and nonlinear analyses of SMA-RC bridge piers were
conducted using fibre element based nonlinear analysis program SeismoStruct (Seismosoft,
2014). Using force based inelastic beam-column element, the circular bridge piers were
modeled. The Mander et al. (1988) concrete constitutive model was used to describe the
confined and unconfined concrete and the steel reinforcement was represented using the
Menegotto–Pinto (1973) steel model. The superelastic SMA was modeled following the
constitutive relation developed by Auricchio and Sacco (1997). Mechanical couplers were used
to connect SMA with steel rebars (Alam et al. 2010) which is represented by introducing a zero
length rotational spring at the bottom of the column section (Figure 5.1c). The stress-slip
relationship of the bars inside the coupler and the details of the splicing can be found elsewhere
(Billah and Alam 2012a).
85

5.4 Model Validation
The accuracy of the adopted finite element modeling program in predicting the seismic
response of bridge structures has been demonstrated by several researchers through
comparisons with experimental results (Alam et al. 2009; Billah and Alam, 2014a). However,
in order to investigate the accuracy of the modeling technique in predicting the strain and
curvature distribution, comparisons were made with experimental results of SMA-RC bridge
piers. Nakashoji and Saiidi (2014) conducted experimental investigation on SMA-RC bridge
piers and extensive measurements of rebar strains were made along the height of the pier.
Specimen SR-99 LSE was a square column having a 457 mm square cross section and a height
of 1575 mm. The plastic hinge length (457 mm) of the specimen was reinforced with 16-
12.7mm diameter Ni-Ti SMA rebar and the remaining portion was reinforced with 16-16mm
steel rebar. The vertical strains measured over a 508 mm gauge length from the base of
Specimen SR-99 LSE are shown in Figure 5.2a at two drift levels: 1% and 2% for strain gauges
2, 8, 18, 28, and 38. The predicted SMA rebar strains at 1% and 2% drift are also shown in
Figure 5.2a. Observation from Figure 5.2a shows that, there is good agreement between the
measured and predicted strains. From Figure 5.2a it is evident that the analytical model was
also able to predict the nonlinear strain profile observed from the experiment. This comparison
shows that the local response of SMA-RC bridge pier can be determined satisfactorily with the
adopted nonlinear finite-element modeling technique.
Figure 5.2. (a) Comparison of predicted and measured strain on SMA rebar (Nakashoji and
Saiidi 2014) and (b) Comparison of predicted and measured curvature (O’Brien et al. 2007)
0
5
10
15
20
25
0 4000 8000 12000
Hei
ght (
inch
)
Strain (µ)
1% drift (experiment)2% drift (experiment)1% drift (predicted)2% drift (predicted)
(a)
0
2
4
6
8
10
12
14
16
0 0.002 0.004 0.006
Hei
ght (
inch
)
Curvature (rad/inch)
1.5 % drift (experiment)3% drift (experiment)1.5% drift (predicted)3% drift (predicted)
(b)
86

Since this study used both rebar strain and curvature profile to predict the plastic hinge
length of SMA-RC bridge pier, the ability of the adopted modeling technique in accurately
predicting the curvature distribution was also investigated. O’Brien et al. (2007) investigated
the performance of a 1/5-scale circular SMA-RC bridge pier having a diameter of 254 mm and
the height of the column was 1143 mm. The column was reinforced with 15.9 mm diameter
Ni-Ti SMA in the plastic hinge region. They tested the column under reverse cyclic loading
and measured the curvature distribution over a 355.6 mm gauge length from the base of
Specimen RNC. Figure 5.2b shows the comparison of the measured and predicted curvature at
two different drift levels: 1.5% and 3% over the height of the specimen. From Figure 5.2b it
can be observed that, the profile of the curvature distribution predicted along the length of the
pier not only matches closely to the measured response, but also mimics the trend in the
curvature profile along the section.
5.5 Analytical Approach for Predicting Plastic Hinge Length
Accurate estimation of plastic hinge lengths in RC bridge piers using analytical approach
can be complicated. Typically plastic hinge lengths are calculated using experimental results.
However, several researchers (Bae and Bayrak 2008, Kazaz 2013) have derived plastic hinge
lengths of RC elements using analytical approach based on strain and curvature. This study
adopted an analytical approach for deriving an expression for plastic hinge length of SMA-RC
pier as there is lack of adequate test results. In this study, two different methods, the
longitudinal rebar compressive strain profile and the curvature profile along the height of the
pier, were used to calculate the plastic hinge length of SMA-RC bridge pier. During an
earthquake, bridge piers are subjected to lateral displacements while supporting gravity loads
and plastic hinges usually form at the maximum moment region. This inelastic portion causes
a significant increase in inelastic curvature near the base of the bridge pier and forms the plastic
hinge zone. As the curvature increases, the compression side of the member experiences
increased strain and subsequently reaches a critical value when the concrete cover spalls off.
After that the longitudinal bars on the compression side experience yielding and subsequently
core concrete starts to crush. Under increasing compressive strain damage starts to accumulate
and forms plastic hinges. The compressive strain in the longitudinal rebar is equal to the
compressive strain in the outer core concrete fibre. Therefore, a rebar compressive strain
profile along the height should give a clear indication on the formation of the plastic hinge. In
87

this study, the SMA-RC bridge piers were analyzed under reverse cyclic loading and the
compressive strain profiles in the longitudinal rebar were plotted. By tracking the onset of the
yielding of longitudinal rebar in compression, the most damaged area i.e. the plastic hinge was
identified.
This study also used the curvature profile along the height of the pier to determine the
plastic hinge length. After analyzing the bridge pier under reverse cyclic loading, the curvature
profile of the piers were plotted to identify the zone where inelastic curvatures are localized.
By tracking the yield curvature in the curvature profile, the plastic hinge was identified. The
following section describes the effect of the different parameters on the plastic hinge length of
SMA-RC bridge pier.
5.5.1 Effect of axial load
Several researchers (Bae and Bayrak 2008, Légeron and Paultre 2000) have considered
axial load level an important parameter for plastic hinge estimation of RC columns. However,
researchers have reported contradictory conclusions regarding the effect of axial load. Mendis
(2001) and Park et al. (1982) reported that the level of axial load does not have any influence
on plastic hinge lengths. However, Tanaka and Park (1990) and Légeron and Paultre (2000)
found that as the axial load increases the plastic hinge length increase. Except Berry et al.
(2008), most of the researchers considered very high levels of axial load which are unusual for
bridge piers and most of them were for columns in a frame structure. In this study, three
different axial load levels were considered to study the effect of axial load on the plastic hinge
length. The range of axial loads (5%, 10% and 20%) was selected based on design codes or
common practices. Keeping the other parameters constant, the piers were analyzed under
reverse cyclic loading. Figure 5.3 shows the variation of rebar compressive strain and
curvature profile along the height of the pier. From Figure 5.3a it is evident that the curvature
profiles are not influenced by the axial load on the plastic hinge length. However, the
compressive strain profile, as shown in Figure 5.3b, clearly depicts the effect of increasing
axial load on the compressive strain in the longitudinal reinforcement. It is evident from Figure
5.3b that with the increase in axial load, the plastic hinge length increases. The strain profile
in the significantly damaged zone drastically changes with the axial load as identified in the
plastic hinge region. Yield strain of longitudinal rebar was used to determine the plastic hinge
88

length. For different level of axial load the plastic hinge length varied between 0.78d to 1.18d
where d is the diameter of the pier.
Figure 5.3. Effect of axial load on (a) curvature profile and (b) longitudinal rebar strain
profile
5.5.2 Effect of aspect ratio
Previous researchers (Mattock 1967; Corley 1966; Priestley and Park 1987; Mendis
2001) identified that the plastic hinge length of a RC member is influenced by the aspect ratio
(L/d). However, the widely used plastic hinge length equation proposed by Paulay and Priestley
(1992) does not account for the effect of the aspect ratio. In order to investigate the influence
of the aspect ratio on the plastic hinge length, circular SMA-RC piers with varying aspect ratios
(3, 5, and 7) were considered keeping other parameters constant. The results of the analyses
are summarized in Figure 5.4. As can be observed in the curvature profile (Figure 5.4a), plastic
hinge length is independent of the aspect ratio of the pier. However, the plastic hinge length
increases with the increasing aspect ratios as evident from the strain profile (Figure 5.4b). As
the aspect ratio increased from 3 to 7, the plastic hinge lengths were found to increase from
0.82d to 1.25d. Bae and Bayrak (2008) and Alemdar (2010) also reported that lp increases with
the increasing L/d for a given axial load level. Bae and Bayrak (2008) found that the effect of
change in aspect ratio is less pronounced in columns with small aspect ratio (2<L/d<3) as
compared to columns having larger aspect ratio. They also concluded that the change in plastic
hinge length with increasing aspect ratio are insignificant for columns under low axial load.
0123456789
0 0.02 0.04 0.06 0.08 0.1
Dis
tanc
e fr
om b
ase
(m)
Curvature (1/m)
0.2 Po0.1 Po0.05 Po
(a)
0123456789
0 0.005 0.01 0.015 0.02 0.025 0.03
Dis
tanc
e fr
om b
ase
(m)
Longitudinal rebar strain (εs)
0.2 Po0.1 Po0.05 Po
εy-sma=0.0064
(b)
89

However, in this study it was found that the aspect ratio contributes to the plastic hinge zone
in SMA-RC bridge pier.
Figure 5.4. Effect of aspect ratio on (a) curvature profile and (b) longitudinal rebar strain
profile
5.5.3 Effect of SMA properties
Since SMA possesses significantly different mechanical properties than conventional
steel, it might affect the plastic hinge formation in the SMA reinforced bridge pier. In addition,
several compositions of SMAs have been developed which have potential for application in
bridge pier such as Ni-Ti, Fe-based and Cu-based. Most of the applications have been focusing
on the use of Ni-Ti alloy while very few focused on the application of the alloys such as Cu-
based SMAs (Shrestha et al. 2015, Araki et al. 2010), and Fe- based SMAs (Dezfuli and Alam
2013). This study employed three different types of SMA’s having different composition, yield
strength, and superelastic strain to investigate the effect of SMA properties on the plastic hinge
length. In this study, one nickel–titanium, one Cu-based, and one Fe- based shape memory
alloys have been selected for the use in bridge piers. The selected SMAs along with their
mechanical properties such as the elastic modulus (E), austenite to martensite starting stress
(fy); austenite to martensite finishing stress (fP1); martensite to austenite starting stress (fT1);
martensite to austenite finishing stress (fT2); superelastic strain (εs) are listed in Table 5.3. As
the three different types of SMAs were used, the bridge piers were designed in such a way that
they have comparable moment capacities. Figure 5.5 shows the effect of different types of
SMA on the curvature and rebar compressive strain profile. From Figure 5.5a it can be
0
2
4
6
8
10
12
0 0.005 0.01 0.015 0.02 0.025 0.03
Dis
tanc
e fr
om b
ase
(m)
Longitudinal rebar strain (εs)
AR-3
AR-5
AR-7
εy-sma=0.0064
(b)
0
2
4
6
8
10
12
0 0.02 0.04 0.06 0.08 0.1
Dis
tanc
e fr
om b
ase
(m)
Curvature (1/m)
AR-3AR-5AR-7
(a)
90

observed that the different types of SMA affects the curvature profile thereby affecting the
plastic hinge length. Figure 5.5b depicts that as the yield strength of SMA rebar increases the
plastic hinge length increases. As the yield strength of SMA increased from 210 MPa to 750
MPa, the plastic hinge length increases from 0.8d to 1.06d. Previous researchers (Berry et al.
2008, Alemdar 2010) also concluded that the plastic hinge length of concrete bridge pier
increases as the yield strength of the reinforcement increases.
Table 5.3. Properties of different types of SMA
Alloy εs (%)
E (GPa)
fy (MPa)
fp1 (MPa)
fT1 (MPa)
fT2 (MPa) fy/E Reference
NiTi45 6 62.5 401.0 510 370 130 0.0065 Alam et al. (2008a)
FeNCATB 13.5 46.9 750 1200 300 200 0.0159 Tanaka et al. (2010)
CuAlMn 9 28 210.0 275.0 200 150 0.0075 Shrestha et al. (2013)
fy (austenite to martensite starting stress); fP1(austenite to martensite finishing stress); fT1(martensite to austenite starting stress); fT2(martensite to austenite finishing stress), εs (superelastic plateau strain length); and E (modulus of elasticity).
Figure 5.5. Effect of fy-SMA on (a) curvature profile and (b) longitudinal rebar strain profile
5.5.4 Effect of longitudinal reinforcement ratio
The effect of longitudinal reinforcement ratio (ρl) on the plastic hinge length has been
ignored by many researchers. However, several researchers investigated the effect of ρl on the
plastic hinge length and reported contradictory conclusions. Mattock (1964) concluded that, as
the net tension reinforcement increases, the plastic hinge length decreases. On the contrary,
0123456789
0 0.02 0.04 0.06 0.08 0.1
Dis
tanc
e fr
om b
ase
(m)
Curvature (1/m)
SMA-210SMA-450SMA-750
(a)
0123456789
0 0.005 0.01 0.015 0.02 0.025 0.03
Dis
tanc
e fr
om b
ase
(m)
Longitudinal rebar strain (εs)
SMA-210
SMA-450
SMA-750
(b)
91
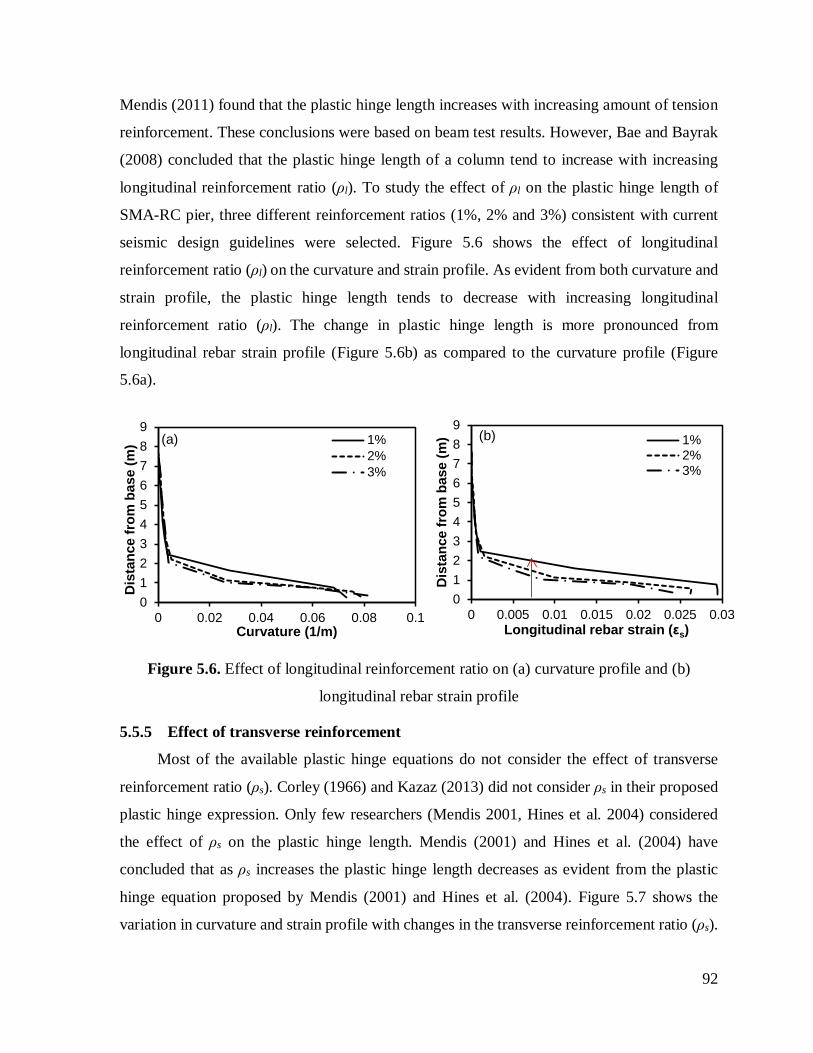
Mendis (2011) found that the plastic hinge length increases with increasing amount of tension
reinforcement. These conclusions were based on beam test results. However, Bae and Bayrak
(2008) concluded that the plastic hinge length of a column tend to increase with increasing
longitudinal reinforcement ratio (ρl). To study the effect of ρl on the plastic hinge length of
SMA-RC pier, three different reinforcement ratios (1%, 2% and 3%) consistent with current
seismic design guidelines were selected. Figure 5.6 shows the effect of longitudinal
reinforcement ratio (ρl) on the curvature and strain profile. As evident from both curvature and
strain profile, the plastic hinge length tends to decrease with increasing longitudinal
reinforcement ratio (ρl). The change in plastic hinge length is more pronounced from
longitudinal rebar strain profile (Figure 5.6b) as compared to the curvature profile (Figure
5.6a).
Figure 5.6. Effect of longitudinal reinforcement ratio on (a) curvature profile and (b)
longitudinal rebar strain profile
5.5.5 Effect of transverse reinforcement
Most of the available plastic hinge equations do not consider the effect of transverse
reinforcement ratio (ρs). Corley (1966) and Kazaz (2013) did not consider ρs in their proposed
plastic hinge expression. Only few researchers (Mendis 2001, Hines et al. 2004) considered
the effect of ρs on the plastic hinge length. Mendis (2001) and Hines et al. (2004) have
concluded that as ρs increases the plastic hinge length decreases as evident from the plastic
hinge equation proposed by Mendis (2001) and Hines et al. (2004). Figure 5.7 shows the
variation in curvature and strain profile with changes in the transverse reinforcement ratio (ρs).
0123456789
0 0.02 0.04 0.06 0.08 0.1
Dis
tanc
e fr
om b
ase
(m)
Curvature (1/m)
1%2%3%
(a)
0123456789
0 0.005 0.01 0.015 0.02 0.025 0.03
Dis
tanc
e fr
om b
ase
(m)
Longitudinal rebar strain (εs)
1%2%3%
(b)
92

The change in plastic hinge length is more pronounced from strain profile as compared to the
curvature profile. From the curvature profile (Figure 5.7a) the plastic hinge length varied from
0.84d to 0.88d. However, from longitudinal rebar strain profile (Figure 5.7b) the plastic hinge
length varied from 0.76d to 1.02d. This can be attributed to the fact that as the amount of
transverse reinforcement increases, the core concrete experiences less damage thereby reduce
the plastic hinge length.
Figure 5.7. Effect of transverse reinforcement ratio on (a) curvature profile and (b)
longitudinal rebar strain profile
5.5.6 Effect of concrete strength
Several researchers considered the effect of concrete strength on the plastic hinge length
of RC members. However, only the plastic hinge expression proposed by Berry et al. (2008)
and Alemdar (2010) consider the effect of concrete strength. They found that the plastic hinge
length decreases as the concrete compressive strength increases as evident from their plastic
hinge equations. This study also considered three different concrete strength (35, 50 and 60
MPa) to investigate the variation in plastic hinge length of SMA-RC pier with varying concrete
strength. Figure 5.8 shows the changes in curvature and strain profile as the compressive
strength varied from 35 to 60 MPa. The curvature profile depicts that (Figure 5.8a) the change
in plastic hinge length is independent of concrete strength as the plastic hinge length varied
between 0.75d to 0.78d. On the other hand, the strain profile shows that as the concrete strength
increased from 35 to 60 MPa, the plastic hinge length decreased from 1.08d to 0.68d.
0123456789
0 0.02 0.04 0.06 0.08 0.1
Dis
tanc
e fr
om b
ase
(m)
Curvature (1/m)
0.8%1%1.2%
0123456789
0 0.005 0.01 0.015 0.02 0.025 0.03
Dis
tanc
e fr
om b
ase
(m)
Longitudinal rebar strain (εs)
0.8%1%1.2%
(b)
93

Figure 5.8. Effect of concrete compressive strength on (a) curvature profile and (b)
longitudinal rebar strain profile
5.6 Plastic Hinge Length Expression for SMA-RC Bridge Pier
The results presented in the previous sections showed that the compressive strain profile
of the longitudinal rebar facilitates a clearer observation of the plastic hinge length as compared
to the curvature profile. As a result, this study utilized the compressive strain profile of the
longitudinal rebar to develop the plastic hinge length expression for SMA-RC bridge pier. The
discussions presented in preceding sections showed that several factors influence the length of
the plastic hinge in SMA-RC pier such as, the level of axial load, the aspect ratio, the yield
strength of SMA rebar, the concrete compressive strength, the longitudinal and transverse
reinforcement ratio. Considering the effect of different parameters, a new expression for
calculating the plastic hinge length of SMA-RC pier was derived by regression analysis. In this
study, multivariate linear regression was used as it allows simultaneous testing and modeling
of multiple independent variables. Using the multivariate regression analysis technique the
following linear expression (equation 5.1) was derived for estimating the plastic hinge length
of SMA-RC pier:
( ) ( ) ( ) ( )sclSMAygc
P ffdL
AfP
dL
ρρ 24.0019.016.00002.008.025.005.1 // −−−+
+
+= − (5.1)
From the proposed equation it can be observed that the plastic hinge length of SMA-RC
pier is mostly influenced by the level of axial load, longitudinal and transverse reinforcement
ratio and less sensitive to the aspect ratio. Although, the regression coefficients associated with
0123456789
0 0.005 0.01 0.015 0.02 0.025 0.03
Dis
tanc
e fr
om b
ase
(m)
Longitudinal rebar strain (εs)
35 MPa50 MPa60 MPa
(b)
0123456789
0 0.02 0.04 0.06 0.08 0.1
Dis
ytnc
e fr
om b
ase
(m)
Curvature (1/m)
35 MPa50 MPa60 MPa
(a)
94

the yield strength of SMA and concrete compressive strength look insignificant, a small change
in fy-SMA or fc/ will result in a significant change in the plastic hinge length.
5.7 Validation of the Proposed Equation
To verify the accuracy of the analytically derived expression for plastic hinge length of
SMA-RC bridge pier, comparisons were made with plastic hinge length measured from
experimental investigations. Since very limited number of test results are available on SMA-
RC bridge pier which measured the plastic hinge length, a database composed of four SMA-
RC pier test results was compiled. Table 5.4 shows the comparison of the measured and
calculated plastic hinge length which illustrates that the use of proposed equation results in
good estimates of plastic hinge length for all test specimens. From Table 5.4 it can be observed
that the maximum variation was observed in Specimen SR99-LSE (Nakashoji and Saiidi 2014)
which was 7.84%. This can be attributed to the fact that all other piers had circular section
while SR99-LSE was a square column. Moreover, the proposed equation was derived based
on the analyses on circular columns. Best match was observed for Specimen RNE (O’Brien et
al. 2007) where the measured and predicted value differed by only 0.87%.
Table 5.4. Comparison of experimental and measured plastic hinge length
Specimens
Parameter RNC
O'Brien et al.(2007)
RNE O'Brien et al.(2007)
SR-99-LSE Nakashoji and Saiidi
(2014)
SMAC-1 Saiidi and
Wang (2006)
Axial load ratio (P/fc
’Ag) 0.1 0.1 0.0864 0.25
Aspect Ratio (L/d) 4.5 4.5 3.44 4.5 Fy-SMA (MPa) 413.7 413.7 352 379.2
ρl 0.02 0.02 0.01 0.026 fc' (MPa) 31.03 35.8 49.6 43.8
ρs 0.024 0.024 0.015 0.0068 Lp/d (measured) 0.98 0.84 0.44 0.75 Lp /d (calculated) 0.92 0.83 0.47 0.71
Lp (measured) (mm) 249.9 212.3 199 229 Lp (calculated) (mm) 233.48 210.46 214.61 216.66
Error (%) 6.57 0.87 -7.84 5.39
95

Figure 5.9 compares the Lp/d values measured from experimental results with those
predicted using equation 5.1. Statistical parameters (mean, standard deviation and COV)
displaying the degree of correlation between the measured and predicted values is also shown
in the same figure. From Figure 5.9 it is evident that the proposed equation provides a
reasonable estimate of the plastic hinge length of SMA-RC bridge pier. From this figure it can
be observed that the standard deviation of the predicted plastic hinge length from the measured
plastic hinge length is only 0.059. Moreover, the coefficient of variation is only 6% which
shows the efficacy of the proposed equation in predicting the experimentally measure plastic
hinge length. The proposed plastic hinge equation was also used to calculate the maximum
drift of a SMA-RC bridge pier (RNE) tested by O’Brien et al. (2007). Using the plastic hinge
length and the yield and ultimate curvature, the ultimate drift of a cantilever bridge pier can be
calculated using the following equation:
( ) ( )ppyuyu LLLL 5.031 2 −−+=∆ φφφ (5.2)
Figure 5.9. Comparison of measured and predicted plastic hinge lengths
In order to predict the accuracy of the proposed plastic hinge expression in predicting
the ultimate drift capacity of SMA-RC bridge pier, comparisons were made with experimental
results and other plastic hinge expression available in literature. Table 5.5 shows a comparison
of the measured ultimate drift value and ultimate drift calculated with different plastic hinge
equations. From Table 5.5, it is evident that the proposed plastic hinge equation provides a
reasonable estimate of the drift capacity of SMA-RC pier. The proposed Lp equation could
0
0.2
0.4
0.6
0.8
1
0 0.2 0.4 0.6 0.8 1
Lp/d
(Pre
dict
ed)
Lp/d (Experiment)
y/x: µ=0.98σ= 0.059COV= 6%
96

predict the ultimate drift of the specimen RNE with only 5.09% error, which was the second
most accurate among all the compared equations. The plastic hinge equation proposed by
Nakashoji and Saiidi (2014) predicted the drift capacity with higher accuracy where the
difference was only 3.20%. The plastic hinge equation proposed by Paulay and Priestley (1992)
also predicted the ultimate drift with only 10.4% error. The other equations differed by a large
margin where the largest difference was 30.5% as predicted by the equation proposed by
Alemdar (2010).
Table 5.5. Comparison of measured and calculated ultimate drift
Reference Lp (mm) Ultimate displacement (mm)
% difference
RNC, O'Brien et al. (2007)- Test Data
- 137.4 -
Paulay and Priestley (1992) 207.10 123.05 10.44 Alemdar (2010) 141.45 95.70 30.50
Nakashoji and Saiidi (2014) 232.20 133.02 3.20 Berry et al. (2008) 151.51 100.01 29.25
Mander (1983) 182.60 113.06 17.71 Proposed Equation 233.48 133.52 5.09
5.8 Summary
It is often assumed that the maximum seismic damage in a bridge pier will concentrate
in the regions subjected to maximum inelastic curvature known as its plastic hinge length.
Predicting the plastic hinge length accurately is an important part of seismic design of bridge
piers. This chapter focused on deriving an analytical expression for the plastic hinge length of
shape memory alloy (SMA) reinforced concrete (RC) bridge pier based on the results from
well calibrated nonlinear finite element models. A parametric study was performed to
investigate the effect of different parameters on the plastic hinge length, including axial load
ratio, aspect ratio, concrete strength, SMA properties, longitudinal and transverse
reinforcement ratio. Multivariate regression analysis was performed to develop an expression
to estimate the plastic hinge length in SMA-RC bridge pier and compared with existing plastic
hinge length equations. The proposed equation was verified against test results which showed
reasonable accuracy.
97

CHAPTER 6. PERFORMANCE-BASED SEISMIC DESIGN OF SHAPE MEMORY ALLOY REINFORCED CONCRETE BRIDGE
PIER: DEVELOPMENT OF PERFORMANCE-BASED DAMAGE STATES
6.1 General
Numerous experimental and numerical studies proved the efficiency of SMA reinforced
structures in seismic regions. However, there exists no proper design guideline for utilizing
SMA in highway bridges. Moreover, most of the design guidelines are moving forward to
performance-based design. AASHTO has already developed performance-based design
guidelines for bridges referred as AASHTO SGS (AASHTO 2011). Moreover, the recent
edition of Canadian highway bridge design code (CSA-S6-14) has also adapted performance-
based design and defined some performance levels and performance criteria for different types
of bridges. To successfully apply the performance-based design concept to SMA reinforced
concrete (SMA-RC) bridge pier, the performance objectives and their associated limit state
criteria must be clearly defined first. Most of the current researches on SMA-RC bridge piers
are focused on the seismic performance assessment and comparison with regular RC bridge
pier (Billah and Alam 2014c, Cruz and Saiidi 2012, Saiidi et al. 2009). Although there exists
a good number of studies on the performance-based damage states for steel RC bridge piers
(Lehman et al. 2004, Hose et al. 2000), no study so far has focused on the performance-based
damage states for SMA-RC piers. This is mainly due to limited number of experimental studies
performed on SMA-RC piers where high cost of SMAs was the main restraining factor. Since
the behavior of SMA-RC piers are significantly different from their steel counterpart, using
those damage states for SMA-RC piers might lead to faulty design. Moreover, the mechanical
properties of SMAs vary widely where several compositions of SMAs have been developed
and used by different researchers in civil engineering applications (Alam et al. 2007). Hence,
this chapter aims at developing performance-based damage states for SMA-RC bridge piers
considering five different SMAs with three different earthquake hazard levels. The ultimate
goal of this study is to provide a technical basis for the development of performance-based
seismic design and evaluation methodologies for the SMA-RC bridge piers.
98

Using an incremental dynamic analysis (IDA) based analytical approach (Vamvatsikos
and Cornell 2002), performance-based damage states (based on drift limits) have been
developed for five different SMA-RC bridge piers and validated against experimental data.
Application of such technique may palliate the burden of gathering a large amount of test data
and cost of experiments, which were used in the past to develop different damage sates for RC
bridge piers. Past studies have demonstrated that it is necessary to consider the residual drifts
to fully characterize the performance of a structural system after a seismic excitation and the
potential damage that the system can experience (Christopoulos et al. 2003; Erochko et al.
2011). Since SMA has the ability to reduce the residual drift significantly after unloading, the
residual drift of different SMA-RC bridge piers under varying intensity of earthquake need to
be investigated. This study also developed residual drift based damages states for the SMA-
RC bridge pier and proposed an analytical expression that can be used for predicting the
residual drift in SMA reinforced concrete elements.
6.2 Design and Geometry of Bridge Piers
This section briefly describes the design and configurations of different SMA-RC bridge
piers used in this study. Since SMA is a costly material, it is only used in the bottom plastic
hinge region of the bridge piers. Five different SMAs are used in this study to develop the
performance-based damage states for SMA-RC bridge piers. The bridge pier is assumed to be
located in Vancouver, BC and was seismically designed following Canadian Highway Bridge
Design Code (CSA-S6-10). Figure 6.1 shows the cross section and elevation of the bridge
pier. The diameter of all the columns was fixed to be 1.83 m; the columns were reinforced with
48 longitudinal reinforcement of different diameter bars for different SMAs and 16 mm-
diameter steel spirals at 76 mm pitch. The height of the pier is 9.14m with an aspect ratio of 5
which ensured the flexure dominated behavior. A constant mass of 85 ton was applied at the
top which represents the weight of the superstructure. Different diameter bars were used for
different SMAs since different SMAs have different elastic modulus and yield strength.
Although SMA does not have a yielding process, “yield” is being used to refer to the initiation
of phase transformation of SMA and the yield strain was calculated by defining the austenite
to martensite starting stress (fy) by the elastic modulus (E). Five different SMA rebars as shown
in
99

Table 6.1 are used to design the different bridge piers. The bridge piers are designated as
SMA-RC-1 (reinforced with SMA-1), SMA-RC-2 (reinforced with SMA-2), and so on. SMA-
RC-1 and SMA-RC-2 is reinforced with 48-28M SMA-1 and SMA-2 bars, SMA-RC-3 is
reinforced with 48-20M SMA-3 bars, SMA-RC-4 is reinforced with 48-35M SMA-4 bars, and
SMA-RC-5 is reinforced with 48-32M SMA-5 bars, respectively. The sizes of the rebars were
selected in such a way that the axial forces developed in the rebar are almost similar. The
bridge piers are designed in such a way that they have comparable moment capacities. Figure
6.2a shows the moment-curvature response of different SMA-RC sections. From this figure it
is evident that all the sections have similar initial stiffness and comparable moment capacity.
Since SMA-5 has higher elastic modulus SMA-RC-5 showed higher initial stiffness which is
1.78, 1.72, 2.21, and 3.87 times higher than that of SMA-RC-1, SMA-RC-2, SMA-RC-3, and
SMA-RC-4, respectively. Moment-curvature response of all the sections revealed that this
design process led to comparable moment capacities for the five different SMA reinforced
bridge piers. The elastic periods of the SMA-RC-1, SMA-RC-2, SMA-RC-3, SMA-RC-4, and
SMA-RC-5 were calculated as 0.513 sec, 0.513sec, 0.514, 0.515, and 0.511 sec, respectively
which were close and expected to attract similar earthquake forces. Figure 6.2b shows the
pushover response curves for the five different SMA-RC bridge piers. From this figure it can
be observed that all the bridge piers have similar stiffness and load carrying capacity.
Figure 6.1. Cross section and elevation of SMA reinforced concrete bridge pier
100

Table 6.1. Properties of different types of SMA
Alloy εs (%)
E (GPa)
fy
(MPa) fp1
(MPa) fT1
(MPa) fT2
(MPa) fy/E Ref
SMA-1 NiTi45 6 62.5 401.0 510 370 130 0.0065 Alam et al. 2008a
SMA-2 NiTi45 8 68 435.0 535.0 335 170 0.0063 Ghassemieh et al. 2012
SMA-3 FeNCATB 13.5 46.9 750 1200 300 200 0.0159 Tanaka et al. 2010
SMA-4 CuAlMn 9 28 210.0 275.0 200 150 0.0075 Shrestha et al. 2013
SMA-5 FeMnAlNi 6.13 98.4 320.00 442.5 210.8 122 0.0033 Omori et al. 2011
fy (austenite to martensite starting stress); fP1(austenite to martensite finishing stress); fT1(martensite to austenite
starting stress); fT2(martensite to austenite finishing stress) , εs (superelastic plateau strain length); and E (modulus
of elasticity).
The material properties of concrete and steel rebar used in the bridge piers are
summarized in Table 6.2. In the SMA-RC bridge piers, SMA was used as longitudinal
reinforcement only at the plastic hinge region. In the remaining part, steel rebars were used as
reinforcement. The plastic hinge length, Lp was calculated according to the Paulay and
Priestley (1992) equation:
Lp = 0.08 L+ 0.022dbfy (6.1)
where, L is the length of the member in mm, db represents the bar diameter in mm and fy
is the yield strength of the rebar in MPa. Previously, Alam et al. (2008a), O’Brien et al. (2007)
showed that the Paulay and Priestley (1992) equation can reasonably estimate the plastic hinge
length of SMA reinforced concrete element. Moreover, Saiidi and Wang (2006), Saiidi et al.
(2009) and Cruz and Saiidi (2012) also used the Paulay and Priestley (1992) equation to
calculate the plastic hinge length for their experimental studies where SMA rebars were placed
in the bottom plastic hinge region of bridge piers. Therefore, the Paulay and Priestley (1992)
expression for plastic hinge length calculation in SMA-RC elements can be considered
reasonably accurate.
101

Figure 6.2. (a) Moment curvature relationship of RC sections with different types of SMAs
and (b) Static pushover curves for bridge piers reinforced with different types of SMAs
Table 6.2. Material properties for SMA-RC bridge pier
Material Property Concrete Compressive Strength (MPa) 42.4
Corresponding strain 0.0029 Tensile strength (MPa) 3.5 Elastic modulus (GPa) 23.1
Steel Elastic modulus (GPa) 200 Yield stress (MPa) 475 Ultimate stress (MPa) 692 Ultimate strain 0.14 Plateau strain 0.016
6.3 Analytical Modeling of Bridge Piers
In this study, a fiber element based nonlinear analysis program SeismoStruct
(Seismosoft, 2014) has been employed to develop performance-based damage states for SMA-
RC bridge piers. Incremental dynamic analyses (IDA) have been performed to determine the
various damage states of the bridge piers. The program has the ability to determine the large
displacement behaviour and the collapse load of framed structures accurately under either
static or dynamic loading, while taking into account both geometric nonlinearities and material
inelasticity (Pinho et al. 2007). The bridge piers were modelled with 3D inelastic beam–column
0
400
800
1200
1600
2000
0 0.2 0.4 0.6 0.8 1 1.2
Bas
e S
hear
(kN
)
Displacement (m)
SMA-1 SMA-2SMA-3 SMA-4SMA-5
02000400060008000
1000012000140001600018000
0 0.02 0.04 0.06
Mom
ent (
kN-m
)
Curvature (1/m)
SMA-1SMA-2SMA-3SMA-4SMA-5
102
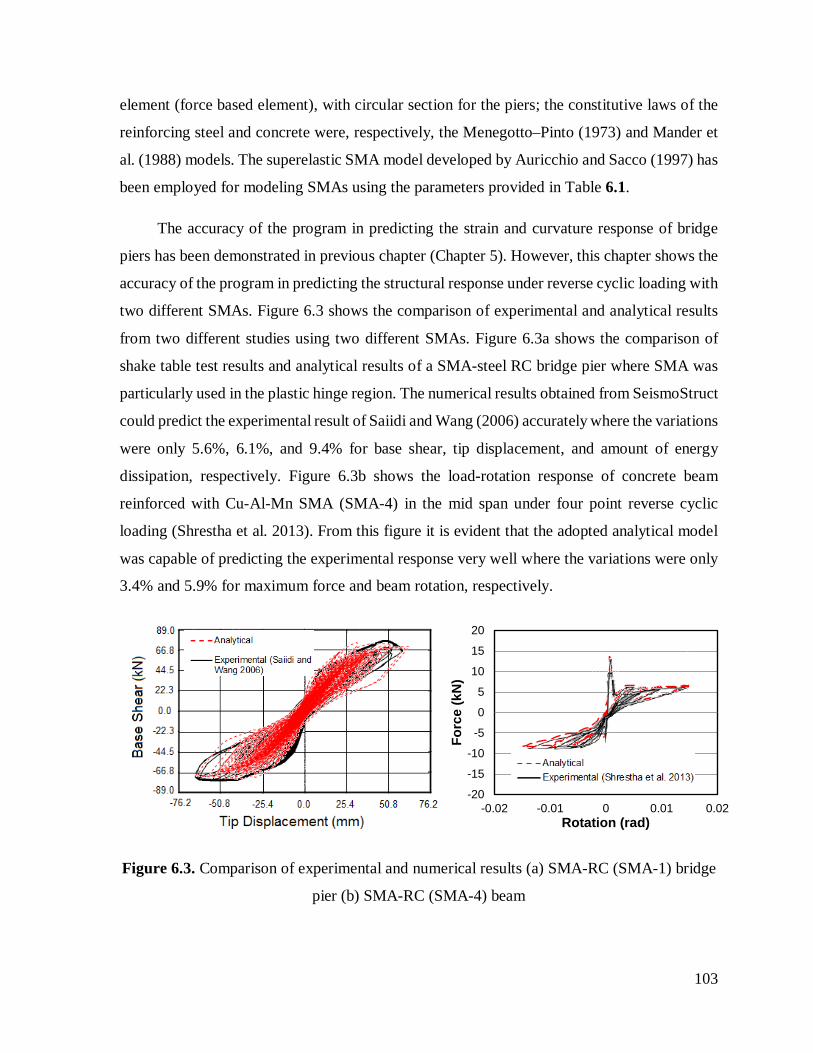
element (force based element), with circular section for the piers; the constitutive laws of the
reinforcing steel and concrete were, respectively, the Menegotto–Pinto (1973) and Mander et
al. (1988) models. The superelastic SMA model developed by Auricchio and Sacco (1997) has
been employed for modeling SMAs using the parameters provided in Table 6.1.
The accuracy of the program in predicting the strain and curvature response of bridge
piers has been demonstrated in previous chapter (Chapter 5). However, this chapter shows the
accuracy of the program in predicting the structural response under reverse cyclic loading with
two different SMAs. Figure 6.3 shows the comparison of experimental and analytical results
from two different studies using two different SMAs. Figure 6.3a shows the comparison of
shake table test results and analytical results of a SMA-steel RC bridge pier where SMA was
particularly used in the plastic hinge region. The numerical results obtained from SeismoStruct
could predict the experimental result of Saiidi and Wang (2006) accurately where the variations
were only 5.6%, 6.1%, and 9.4% for base shear, tip displacement, and amount of energy
dissipation, respectively. Figure 6.3b shows the load-rotation response of concrete beam
reinforced with Cu-Al-Mn SMA (SMA-4) in the mid span under four point reverse cyclic
loading (Shrestha et al. 2013). From this figure it is evident that the adopted analytical model
was capable of predicting the experimental response very well where the variations were only
3.4% and 5.9% for maximum force and beam rotation, respectively.
Figure 6.3. Comparison of experimental and numerical results (a) SMA-RC (SMA-1) bridge
pier (b) SMA-RC (SMA-4) beam
-20
-15
-10
-5
0
5
10
15
20
-0.02 -0.01 0 0.01 0.02
Forc
e (k
N)
Rotation (rad)
103

6.4 IDA- Based Approach for Developing Performance-Based Damage States
For successful implementation of the performance-based design concept in SMA-RC
bridge pier, the performance objectives and their corresponding damage state criteria need to
be clearly defined. Extensive experimental investigations on bridge piers performed in the past
were utilized to develop the damage states for reinforced concrete bridge piers (Berry and
Eberhard, 2003; Hose et al. 2000). Due to the fact that very limited experimental results are
available for SMA reinforced bridge pier, an IDA-based approach, as illustrated in Figure 6.4,
was developed in this study to generate the necessary data used to develop performance-based
damage states for bridge pier reinforced with different types of SMAs.
Incremental dynamic analysis (IDA) (Vamvatsikos and Cornell, 2002) was employed to
determine the performance limit states of different bridge piers using an ensemble of ten
selected ground motions. IDA is a useful method for more detailed seismic performance
predictions of structures subjected to different seismic excitation levels. In IDA, the finite
element model is subjected to numerous inelastic time history analyses using one or a set of
ground motion record(s), each scaled (up and/or down) to study different seismic intensity
levels while tracking the response of the structure (e.g., displacements, accelerations, etc.).
This procedure of scaling and time history analysis is repeated until dynamic instability in the
form of large drifts occurs, indicating structural collapse.
6.4.1 Selection of ground motions
The incremental dynamic analyses were carried out using the 10 selected ground motions
as shown in Table 6.3. These ground motion records were obtained from the PEER (2011)
ground motion database. These accelerograms were chosen such that they represent the seismic
characteristics of the site of the structure. The ratio between the peak ground acceleration
(PGA) and peak ground velocity (PGV) is an indicator of the frequency content of seismic
motion. The characteristic seismic motions for the western part of Canada have a PGA/PGV
ratio around 1.0 (Naumoski et al. 1988). The selected ensemble of earthquake records is
presented in Table 6.3 where the PGA/PGV ratio varies between 0.8 and 1.3.
104

Figure 6.4. Flowchart for the development of performance based damage states for SMA-
RC bridge pier
105

Table 6.3. Selected earthquake ground motion records
No Event Year Record Station M*1 R*2 (km)
PGA (g)
PGA/PGV
1 Imperial Valley 1979 El Centro Array#11 6.5 21.9 0.36 0.8 2 Imperial Valley 1979 Chihuahua 6.5 28.7 0.254 0.84 3 Kobe 1995 Takatori 6.9 4.3 0.56 0.9 4 Kobe 1995 JMA 6.9 3.4 0.77 1.02 5 Loma Prieta 1989 Holister South & Pine 6.9 28.8 0.371 0.97 6 Loma Prieta 1989 16 LGPC 6.9 16.9 0.605 1.19 7 Nothridge 1994 Rinaldi 6.7 7.5 0.87 0.93 8 Nothridge 1979 Olive View 6.7 6.4 0.721 0.95 9 Superstition Hill 1987 Wildlife liquefaction array 6.7 24.4 0.134 1.0 10 Superstition Hill 1987 Wildlife liquefaction array 6.7 24.4 0.132 1.03
1Moment Magnitudes, 2Closest Distances to Fault Rupture Source: PEER Strong Motion Database, http://peer.berkeley.edu/svbin
These 10 ground motion records were obtained from the PEER strong motion database.
The recent edition of Canadian Highway Bridge Design Code (CSA-S6-14) requires that
highway bridges should meet target performance levels under seismic ground motions with
different return periods. In this study, three different levels of seismic ground motions were
considered according to CHBDC 2014 (CSA-S6-14). These records correspond to three
different hazard levels with a 2%, 5%, and 10% probability of exceedance in 50 years. The
respective return periods are 2475 years, 975 years, and 475 years. For each hazard level 10
ground motions shown in Table 6.3 were used. The selected ground motions were scaled to
specific hazard levels using SeismoMatch (Seismosoft 2013). This software is able to adjust
any ground motion accelerograms to match a specific design response spectrum using wavelet
algorithm proposed by Abrahamson (1992) and Hancock et al. (2006). Matching was done
with in the period range of interest which was 0.05 sec to 4 sec as suggested by Baker et al.
(2011). The mean spectra and the target spectra corresponding to different hazard levels are
shown in Figure 6.5.
106

Figure 6.5. Design and mean response spectrum of 10 records used for IDA analysis
matching the three different CHBDC spectrum (2%, 5%, and 10% in 50 years)
6.4.2 Performance-based damage states criterion
Performance-based seismic design largely relies on the identification and selection of
proper limit/damage states. Often damage states are defined in terms of drift or displacement.
Damages are usually defined as discrete observable damage states (e.g., rebar yielding,
concrete spalling, longitudinal bar buckling, bar fracture) (Marsh and Stringer 2013).
In this study, four quantitative performance limit states were defined for the SMA-RC
bridge piers based on the performance levels and damage states proposed by Hose et al. (2000).
Table 6.4 shows the four performance limit states and their associated functional level
definition adopted in this study. The performance limit states considered here are, the drift
(%) at the onset of hairline cracks, longitudinal rebar yielding, cover concrete spalling, and
crushing of core concrete. In this study, a strain based damage detection approach was used
for defining the drift levels at different damage states. The yielding of SMA rebar was
monitored by defining the yield strain of SMA bar and tracking the occurrence of first yield in
SMA rebar. The spalling strain was assumed to be 0.004 as suggested by Priestley et al. (1996).
Paulay and Priestley (1992) found that the crushing strain of confined concrete ranges between
0.015 and 0.05. In this study, the crushing strain of confined concrete for different SMA-RC
bridge piers was calculated using the Paulay and Priestley (1992) equation:
00.10.20.30.40.50.60.70.80.9
1
0 1 2 3 4
Spec
tral
Acc
eler
atio
n (g
)
Time (sec)
2%/50 Year (Target)5%/50 Year (Target)10%/50Year (Target)2%/50 Year (Mean)5%/50 Year (Mean)10%/50 Year (Mean)
107

//4.1004.0 csmyhscu ff ερε += (6.1)
where, εcu is the ultimate compression strain, εsm is the steel strain at maximum tensile
stress, fc’ is the concrete compressive strength in MPa, fyh is the yield strength of transverse
steel in MPa, and ρs is the volumetric ratio of confining steel.
Table 6.4. Proposed damage state framework
Damage Parameter
Damage State
Functional Level
Description
Cracking DS-1 Immediate Onset of hairline cracks Yielding DS-2 Limited Theoretical first yield of longitudinal
rebar Spalling DS-3 Service disruption Onset of concrete spalling
Core Crushing DS-4 Life safety Crushing of core concrete
Most of the damage states available in literature are discrete in nature and quantifies the
damage deterministically (Marsh and Stringer 2013). Practically, the drift level corresponding
to certain damage is not a discrete deterministic quantity and each damage level is associated
with a distribution of values. The drift limits defined at different damage states should clearly
indicate whether it represents the lower bound, median, or some intermediate value for the
onset of damage. In order to develop a comprehensive performance-based damage states, in
this study, the probabilistic distribution of each damage state is also identified and the median
of the distribution is defined as the drift limit corresponding to each damage state.
In order to determine the limit state drift values for different performance levels, the drift
limits corresponding to the strain values were determined using IDA for different hazard levels
for the five different SMA-RC bridge piers. The drift limits at various performance levels were
identified using the dynamic pushover curves obtained from IDA. Dynamic pushover curves
represent the relation between maximum drift and corresponding base shear obtained from
IDA while being subjected to an earthquake record (Elnashai and Luigi 2008). These curves
represent the structural capacity under specific earthquake loading. Dynamic pushover curves,
obtained from IDA, take into account progressive structural stiffness degradation, change of
modal characteristics, and period elongation of the structure for increasing values of external
action which is not achievable through static pushover analysis. Inelastic characteristics such
108
as strength degradation and energy dissipation largely affect the seismic performance of
structures which are also required for developing performance-based damage states for
performance-based design. The drift levels for different performance levels obtained from IDA
were used to find a suitable distribution for each damage state that describes the statistical
distribution of the developed damage state. Statistical analyses were carried out to find the
most suitable probability density function (PDF) to represent the data related to each damage
state. Using statistical tools and analysis, suitable distribution for each damage state were
determined using goodness-of-fit tests. The following section discusses the development of
performance-based damage states for five different SMA reinforced bridge piers.
6.4.3 Probabilistic distribution of drift based damage states
Using the results obtained from IDA, the probabilistic distribution of each damage state
corresponding to different hazard levels are determined to represent the statistical variability
of damage states at different hazard levels. The probabilistic distribution of each damage state
i.e. yielding, spalling, and crushing, is superimposed on the dynamic pushover curves obtained
from IDA which are shown in Figures 6.6-6.10. The expected (median) drift level at a
particular damage state is represented by the vertical solid line. From Figures 6.6-6.10 it can
be observed that the uncertainty of each damage state is unique, as indicated by the dispersion
or width of the distribution. The median drift level of each damage state is defined as the
limiting drift value for each performance level. The drift levels corresponding to different
damage states for different hazard levels are shown in Table 6.5. Table 6.5 also shows the
probabilistic distribution of each damage state. From IDA, measurements of drift levels
corresponding to each damage state were obtained and statistically processed to find out the
most suitable distribution. The suitability of the selected distributions for representing each
damage state was evaluated using Kolmogorov-Smirnov (K-S) goodness-of-fit test. Details of
the K-S goodness-of-fit test and the results are presented in Appendix-B. The following
conclusions are derived from the distribution of different damage states:
• Irrespective of the type of SMAs and earthquake hazard level, cracking occurs at a
drift of 0.28% and it can be represented better with a uniform distribution. Since the
cracking strain of concrete depends only on the tensile strength of concrete, small
variation in concrete cracking drift was observed. Uniform distribution is a preferable
109

one when all of the outcomes have an equal probability of occurring. Since the
cracking drift of all the SMA-RC bridge piers ranged between 0.28% to 0.30% and
have equal probability of occurrence, the cracking drift is assumed to follow a uniform
probability distribution. Results of the K-S goodness-of-fit test also confirmed the
suitability of uniform distribution for representing the distribution of crushing drift.
This drift value of 0.28% can be identified as damage state-1(DS-1).
• From the statistical analysis it was found that the log-normal distribution better
represents the uncertainty in drift limits for DS-2 (yielding). Usually the variation in
metal strength, such as yield strength of steel is better represented by a log-normal
distribution (Ellingwood, 1977, Ghobarah et al. 1998). Similar distribution for yield
drift limits for SMA-RC bridge piers was obtained which is largely dependent on the
yield strength of SMA.
• Normal distribution was found to be the best fit for representing the variability in drift
limits corresponding to DS-3 (spalling) based on K-S goodness-of-fit test. Normal
distribution is better suited for representing the spalling drift since all the SMA-RC
bridge piers showed a strong tendency towards the central value of spalling drift as
well as the positive and negative deviations from this central value are equally likely.
The selected distribution seems reasonable since concrete strength can be better
represented by a normal distribution (Ellingwood, 1977; Mirza et al., 1979).
• K-S goodness-of-fit test was performed to identify the most suitable distribution for
defining the variation of DS-4 (crushing). The K-S goodness-of-fit test indicated that
the gamma distribution, which usually indicates an extreme event, provides best fit to
the data and was the most suitable for representing the crushing drift.
110

Table 6.5. Damage states of different SMA-RC bridge pier and their associated distribution
SMA-RC-1 SMA-RC-2 SMA-RC-3 SMA-RC-4 SMA-RC-5
Distribution Damage Parameter
Damage State
Drift (%) Drift (%) Drift (%) Drift (%) Drift (%) Probability of Exceedance
Probability of Exceedance
Probability of Exceedance
Probability of Exceedance
Probability of Exceedance
2% 50
5% 50
10% 50
2% 50
5% 50
10% 50
2% 50
5% 50
10% 50
2% 50
5% 50
10% 50
2% 50
5% 50
10% 50
Cracking DS-1 0.28 0.28 0.28 0.30 0.28 0.28 0.28 0.28 0.28 0.28 0.28 0.28 0.28 0.28 0.28 Uniform Yielding DS-2 1.68 1.76 1.86 1.66 1.72 1.80 2.28 2.42 2.58 1.74 1.83 1.95 1.10 1.16 1.21 Lognormal Spalling DS-3 2.66 2.79 2.88 2.69 2.77 2.87 1.64 1.72 1.80 2.52 2.61 2.68 1.97 2.02 2.10 Normal Crushing DS-4 5.05 5.68 5.94 5.51 5.91 6.05 7.65 7.81 7.94 5.56 5.63 5.72 4.73 4.79 4.84 Gamma
Figure 6.6. Dynamic pushover response and different damage states with distribution for SMA-RC-1 for (a) 2% in 50 years (b) 5% in
50 years and (c) 10% in 50 years probability of exceedance
0
500
1000
1500
2000
2500
3000
0 2 4 6 8 10
Bas
e Sh
ear (
kN)
Drift (%)
Spal
ling
Yiel
ding
Cru
shin
g
(a)
0
500
1000
1500
2000
2500
3000
0 2 4 6 8 10
Bas
e S
hear
(kN
)
Drift (%)
Spal
ling
Yiel
ding
Cru
shin
g
(b)
0
500
1000
1500
2000
2500
3000
0 2 4 6 8 10
Bas
e S
hear
(kN
)
Drift (%)
Spal
ling
Yiel
ding
Cru
shin
g
(c)
111
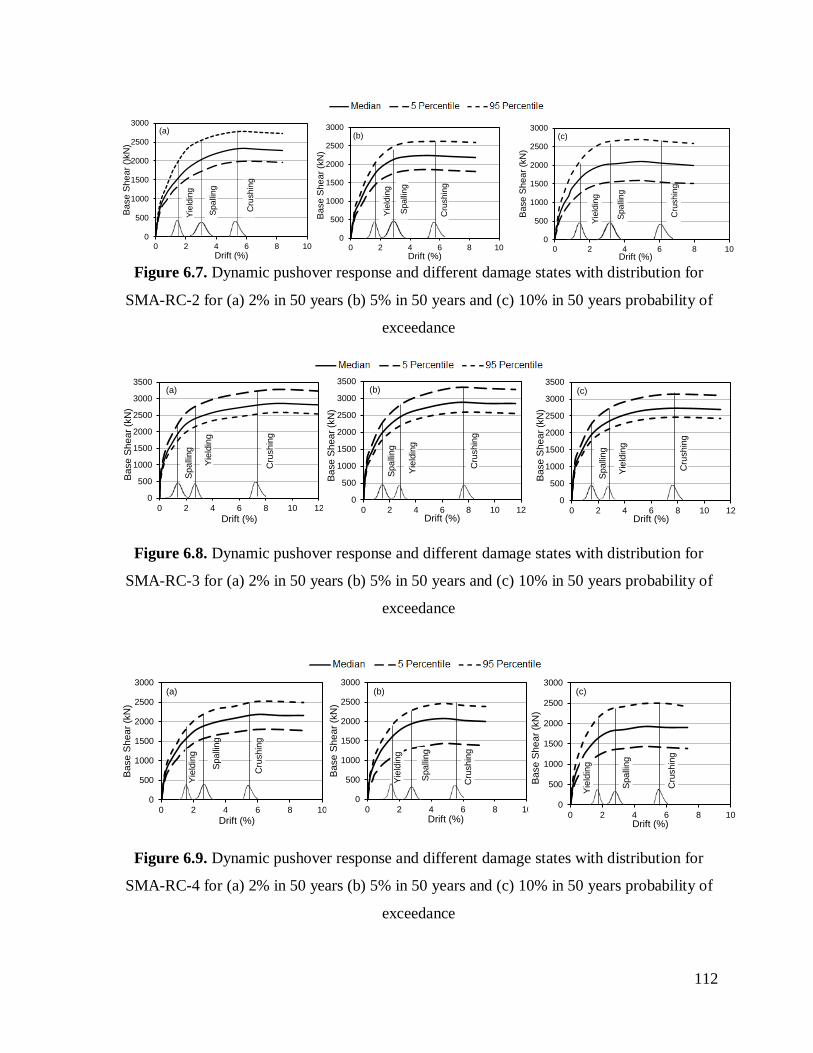
Figure 6.7. Dynamic pushover response and different damage states with distribution for
SMA-RC-2 for (a) 2% in 50 years (b) 5% in 50 years and (c) 10% in 50 years probability of
exceedance
Figure 6.8. Dynamic pushover response and different damage states with distribution for
SMA-RC-3 for (a) 2% in 50 years (b) 5% in 50 years and (c) 10% in 50 years probability of
exceedance
Figure 6.9. Dynamic pushover response and different damage states with distribution for
SMA-RC-4 for (a) 2% in 50 years (b) 5% in 50 years and (c) 10% in 50 years probability of
exceedance
0
500
1000
1500
2000
2500
3000
0 2 4 6 8 10
Bas
e S
hear
()kN
)
Drift (%)
Spal
ling
Yiel
ding
Cru
shin
g
(a)
0
500
1000
1500
2000
2500
3000
0 2 4 6 8 10
Bas
e S
hear
(kN
)
Drift (%)
Spal
ling
Yiel
ding
Cru
shin
g
(b)
0
500
1000
1500
2000
2500
3000
0 2 4 6 8 10
Bas
e S
hear
(kN
)
Drift (%)
Spal
ling
Yiel
ding
Cru
shin
g
(c)
0
500
1000
1500
2000
2500
3000
3500
0 2 4 6 8 10 12
Bas
e S
hear
(kN
)
Drift (%)
Spal
ling
Yiel
ding
Cru
shin
g
(a)
0
500
1000
1500
2000
2500
3000
3500
0 2 4 6 8 10 12
Bas
e S
hear
(kN
)
Drift (%)
Spal
ling
Yiel
ding
Cru
shin
g
(b)
0
500
1000
1500
2000
2500
3000
3500
0 2 4 6 8 10 12
Bas
e S
hear
(kN
)
Drift (%)
Spal
ling
Yiel
ding
Cru
shin
g
(c)
0
500
1000
1500
2000
2500
3000
0 2 4 6 8 10
Bas
e S
hear
(kN
)
Drift (%)
Spal
ling
Yiel
ding
Cru
shin
g
(a)
0
500
1000
1500
2000
2500
3000
0 2 4 6 8 10
Bas
e S
hear
(kN
)
Drift (%)
Spal
ling
Yiel
ding
Cru
shin
g
(b)
0
500
1000
1500
2000
2500
3000
0 2 4 6 8 10
Bas
e S
hear
(kN
)
Drift (%)
Spal
ling
Yiel
ding
Cru
shin
g
(c)
112

Figure 6.10. Dynamic pushover response and different damage states with distribution for
SMA-RC-5 for (a) 2% in 50years (b) 5% in 50 years and (c) 10% in 50 years probability of
exceedance
6.4.4 Maximum drift based damage states
Figures 6.6-6.10 show the dynamic pushover curves for SMA-RC-1 through SMA-RC-
5 under different levels of earthquakes, respectively. The dynamic pushover curves derived
from 10 earthquakes (for each bridge pier) were statistically processed to obtain the median, 5
percentile, and 95 percentile capacity curves. Comparisons of Figures 6.6-6.10 reveal that:
• SMA-RC-3 (Figure 6.8) has higher deformation and strength capacity as compared to
the other SMA-RC bridge piers.
• For seismic hazard level of 2% in 50 years, the median capacity of SMA-RC-3 was
2743kN which was 16%, 15%, 20%, and 17% higher than that of SMA-RC-1, SMA-
RC-2, SMA-RC-4, and SMA-RC-5, respectively.
• Maximum base shear demand is also significantly influenced by the earthquake hazard
level. For example, the median maximum base shear of SMA-RC-1, for 2% in 50 years
is 2305 kN which is 5% and 7% higher than that of 5% and 10% in 50 years records,
respectively.
Evaluation of the results presented in Table 6.5 provides a valuable insight on the damage
states developed for different SMA-RC bridge piers. The damage states are defined for
different hazard levels. From Table 6.5 it can be observed that:
• Damage state-2 or yielding occurs at a drift level below 2% except for SMA-RC-3. At
DS-2, there is significant variation in drift limits for different SMA-RC bridge piers.
0
500
1000
1500
2000
2500
3000
0 2 4 6 8 10
Bas
e S
hear
(kN
)
Drift(%)
Spal
ling
Yiel
ding
Cru
shin
g
(a)
0
500
1000
1500
2000
2500
3000
0 2 4 6 8 10
Bas
e S
hear
(kN
)
Drift (%)
Spal
ling
Yiel
ding Cru
shin
g
(c)
0
500
1000
1500
2000
2500
3000
0 2 4 6 8 10
Bas
e S
hear
(kN
)
Drift (%)
Spal
ling
Yiel
ding
Cru
shin
g
(b)
113

For SMA-RC-1 and SMA-RC-2, the drift limit is quite similar irrespective of the
earthquake hazard levels which ranges between 1.68% to 1.86% and 1.66% to 1.80%,
respectively. Since SMA-RC-1 and SMA-RC-2 are reinforced with Ni-Ti SMAs
(different compositions) with similar mechanical properties, they tend to have similar
drift limits at DS-2.
• Before yielding, SMA-RC-3 sustained higher drift compared to other SMA-RC piers.
At DS-2, under 2% in 50 years hazard level, the drift limit for SMA-RC-3 was 2.28%
which was significantly higher than the drift limits obtained for other SMA-RC bridge
piers. This is expected since SMA-3 has higher yield strength and post yield stiffness
as compared to the other SMAs considered in this study.
• Although SMA-4 has low elastic modulus, its yield strength is very high which
eventually increased the yield strain and resulted in higher drift values. At DS-2, the
drift limits for SMA-RC-4 were 3.4%, 3.8%, and 4.6% higher than that of SMA-RC-1
for 2%, 5%, and 10% in 50 years probability of exceedance, respectively.
• Exceptional performance was observed for SMA-RC-5 which yielded at a very low
drift level (1.1%-1.2%) as compared to the other SMA-RC piers. This is due to SMA-
5’s very low yield strength to elastic modulus ratio (0.0033), which reduced the drift
capacity of SMA-RC-5.
• Although, both SMA-3 and SMA-5 are Fe-based, due to the variation in their yield
strength and elastic modulus, the drift limits for SMA-RC-3 at DS-2 were 52% higher
than that of SMA-RC-5 irrespective of the hazard level.
• From Table 6.5, it can be observed that except for SMA-RC-3, yielding occurred in all
the bridge piers before the initiation of cover spalling. The delayed rebar yielding of
SMA-RC-3 can be attributed to its higher yield strength and very high superelastic
strain. A similar observation of the SMA-RC column has been reported by Saiidi and
Wang (2006) where spalling of cover concrete took place before the initiation of SMA
yielding.
• DS-3, is considered at the onset of cover concrete spalling. All the piers experienced
yielding before spalling where the only exception was SMA-RC-3. For SMA-RC-1,
DS-3 occurred at a drift level of 2.66%, 2.79%, and 2.88% for 2%, 5%, and 10% in 50
years hazard level, respectively. This is expected since a hazard level with lower
114
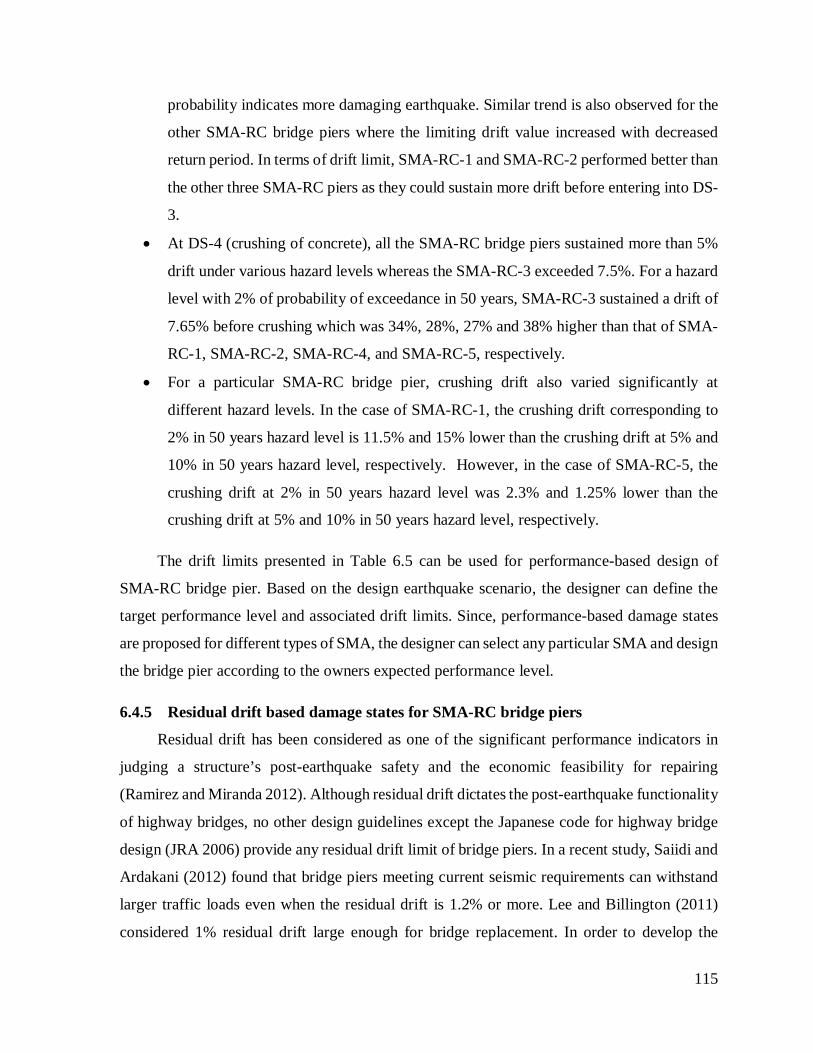
probability indicates more damaging earthquake. Similar trend is also observed for the
other SMA-RC bridge piers where the limiting drift value increased with decreased
return period. In terms of drift limit, SMA-RC-1 and SMA-RC-2 performed better than
the other three SMA-RC piers as they could sustain more drift before entering into DS-
3.
• At DS-4 (crushing of concrete), all the SMA-RC bridge piers sustained more than 5%
drift under various hazard levels whereas the SMA-RC-3 exceeded 7.5%. For a hazard
level with 2% of probability of exceedance in 50 years, SMA-RC-3 sustained a drift of
7.65% before crushing which was 34%, 28%, 27% and 38% higher than that of SMA-
RC-1, SMA-RC-2, SMA-RC-4, and SMA-RC-5, respectively.
• For a particular SMA-RC bridge pier, crushing drift also varied significantly at
different hazard levels. In the case of SMA-RC-1, the crushing drift corresponding to
2% in 50 years hazard level is 11.5% and 15% lower than the crushing drift at 5% and
10% in 50 years hazard level, respectively. However, in the case of SMA-RC-5, the
crushing drift at 2% in 50 years hazard level was 2.3% and 1.25% lower than the
crushing drift at 5% and 10% in 50 years hazard level, respectively.
The drift limits presented in Table 6.5 can be used for performance-based design of
SMA-RC bridge pier. Based on the design earthquake scenario, the designer can define the
target performance level and associated drift limits. Since, performance-based damage states
are proposed for different types of SMA, the designer can select any particular SMA and design
the bridge pier according to the owners expected performance level.
6.4.5 Residual drift based damage states for SMA-RC bridge piers
Residual drift has been considered as one of the significant performance indicators in
judging a structure’s post-earthquake safety and the economic feasibility for repairing
(Ramirez and Miranda 2012). Although residual drift dictates the post-earthquake functionality
of highway bridges, no other design guidelines except the Japanese code for highway bridge
design (JRA 2006) provide any residual drift limit of bridge piers. In a recent study, Saiidi and
Ardakani (2012) found that bridge piers meeting current seismic requirements can withstand
larger traffic loads even when the residual drift is 1.2% or more. Lee and Billington (2011)
considered 1% residual drift large enough for bridge replacement. In order to develop the
115

damage states (DS) for SMA-RC bridge pier a probabilistic approach has been adopted in this
study. Based on the existing literature (O’Brien et al. 2007, Billah and Alam 2014c), four
different damage states have been identified and a range of limiting residual drifts were
considered. It was assumed that a residual drift below 0.25% would meet the serviceability
requirement (DS-1) while a residual drift larger than 1% would be characterized as a collapse
damage state (DS-4). The intermediate damage states DS-2 and DS-3 are assumed to take place
at a residual drift larger than 0.5% and 0.75%, respectively. DS-1 requires that no structural
realignment is necessary and the bridge is fully operational. DS-2 consists of minor structural
repairing and requires the bridge to be operational without requiring bridge closure. A pier
experiencing DS-3 will require major repair and may require bridge closure but should be
usable for restricted emergency traffic after inspection. DS-4 corresponds to the case when the
residual drift is sufficiently large that the structure is in danger of collapse from earthquake
aftershocks.
Once the damage sates have been identified, fragility curves for residual drifts were
developed using the IDA results for three different seismic hazard levels. In this study, fragility
functions were developed using Equation 6.2 which take the form of lognormal cumulative
distribution functions having a median value of θ and logarithmic standard deviation or
dispersion of β.
=
βθφ /ln()( RDRDF (6.2)
where, F(RD) represents the conditional probability that the bridge pier will be damaged
to a given DS as a function of the residual drift (RD); F denotes the standard normal cumulative
distribution function; and θ and β are the median value of the probability distribution and the
logarithmic standard deviation corresponding to the DS, respectively.
Figure 6.11 shows the fragility curves for SMA-RC bridge piers for different damage
states at three different hazard levels. Here, the fragility curves are plotted irrespective of the
SMA types to generalize the associated damage states. Using these fragility curves, the residual
drift based damage states for SMA-RC bridge pier have been developed. From the fragility
curves corresponding to each damage state, the RD value with a 50% probability of occurrence
116

indicates the limiting value for the corresponding damage state. For example, in Figure 6.11a
(10% in 50 years), the 50% probability of occurrence of DS-2 corresponds to a RD of 0.48%
while the limiting RD values for DS-2 for 5% in 50 years and 2% in 50 years hazard level
correspond to 0.55% and 0.62%, respectively. It can be observed that the limiting RD value
for DS-2 was assumed to be 0.5% and the values obtained from the median probability of
exceedance are quite close. Similarly, the limiting RD values with a 50% probability of
occurrence at different damage states and hazard levels were developed as outlined in Table
6.6.
Figure 6.11. Fragility curves in terms of residual drift at (a) 10% in 50 years (b) 5% in 50
years and (c) 2% in 50 years probability of exceedance
Table 6.6. Residual drift damage states of SMA-RC bridge pier
Damage State
Functional Level
Description Residual Drift, RΔ (%) Probability of Exceedance
10% in 50 5% in 50 2 % in 50 Slight
(DS=1) Fully
Operational No structural realignment is
necessary 0.24 0.28 0.33
Moderate (DS=2)
Operational Minor structural repairing is necessary
0.48 0.55 0.62
Extensive (DS=3)
Life safety Major structural realignment is required to restore safety margin
for lateral stability
0.73 0.82 0.87
Collapse (DS=4)
Collapse Residual drift is sufficiently large that the structure is in danger of
collapse from earthquake aftershocks
1.04 1.16 1.22
00.10.20.30.40.50.60.70.80.9
1
0 0.5 1 1.5 2
P (D
S I R
D)
Residual Drift (%)
(a)
00.10.20.30.40.50.60.70.80.9
1
0 0.5 1 1.5 2
P (D
S I R
D)
Residual Drift (%)
(b)
00.10.20.30.40.50.60.70.80.9
1
0 0.5 1 1.5 2
P (D
S I R
D)
Residual Drift (%)
(c)
117

From Table 6.6 it can be observed that as the ground motion return period decreases
(probability of occurrence increases) the limiting residual drift corresponding to different DS
decreases. For example, at DS-4, the limiting drift value for an earthquake with 2475 years
return period is 1.22% which is 6.5% and 13.1% higher than an earthquake with 975 and 475
years return period, respectively. Observation from Table 6.6 indicates that, as the damage
level increases (DS-1 to DS-4) the difference in limiting RD values at different hazard levels
decreases. For instance, at DS-2, the limiting RD value corresponding to 2475 years return
period is 11% and 22.5% higher than that of 975 and 475 years return period, respectively.
However, this difference goes down to 6.5% and 13.1% for DS-4.
6.5 Prediction of Residual Drift
For performance-based design, prediction of residual drift as a function of the target or
maximum drift would be very useful. Previous research has shown that residual drift
predictions using non-linear analysis are highly variable and subjected to different modeling
features (ATC-58). Recently ATC-58 (2012) recommended some general equations for
predicting residual drift using peak transient drift and yield drift. ATC-58 (2012) suggested
that, prediction of residual drift requires advanced non-linear simulation with careful attention
to cyclic hysteretic response of the models and numerical accuracy of the solution. In this
study, the residual drift responses were obtained using IDA which is one of the most advanced
non-linear analysis techniques and the models were validated with experimental results. From
the residual drift responses of the SMA-RC bridge piers it was found that, the residual drift in
SMA-RC bridge pier is a function of maximum drift and superelastic strain of the SMA used.
Using the residual drift response obtained from different SMA-RC bridge piers under a wide
range of ground motions, a non-linear regression analysis was conducted to investigate the
effect of maximum drift and superelastic strain on the residual drift response. Using a non-
linear regression analysis the following equation is developed for predicting residual drift of
SMA-RC bridge pier:
+
−
=
s
ss MDMDRDε
εε 1100100
5.0 2 (6.3)
Where, RD= residual drift (%), εs= superelastic strain, MD= maximum drift (%).
118

In order to investigate the accuracy of the proposed residual drift prediction equation,
comparison was carried out with experimental results. Figure 6.12 shows the comparison of
residual drifts obtained from experimental investigation and prediction equation. Figure 6.12a
shows the comparison between the predicted responses and experimental results of O’Brien et
al. (2007) where the SMA-RC bridge pier was tested under reverse cyclic loading. The bridge
pier was constructed using Ni-Ti SMA in the plastic hinge region and the superelastic strain of
SMA rebar was 6%. Maximum drift values and the corresponding residual drifts were obtained
from experimental results. Using the maximum drift value and the superelastic strain of the
SMA rebar, the residual drifts were predicted. Figure 6.12a shows that the proposed equation
predicted the residual drift very well with an average absolute error (AAE) of 4.65% and
average standard deviation of 0.03. Figure 6.12b shows the comparison of residual drift
prediction with experimental results of Youssef et al. (2008) where Ni-Ti SMA with
superelastic strain of 6% was used as reinforcement in the beam column joint. From Figure
6.12b it is evident that the proposed equation is capable of predicting the residual drift with
reasonable accuracy with an AAE of 2.06% and average standard deviation of 0.015.
Figure 6.12. Comparison of residual drift prediction with experimental results (a) O’Brien et
al. (2007) and (b) Youssef et al. (2008)
0
0.5
1
1.5
2
2.5
3
0 0.5 1 1.5 2 2.5 3
Pre
dict
ed R
D(%
)
Experimental RD(%)
(a)
0
0.1
0.2
0.3
0.4
0.5
0 0.1 0.2 0.3 0.4 0.5
Pre
dict
ed R
D(%
)
Experimental RD(%)
(b)
119

6.6 Summary
Performance-based seismic design aims to dictate the structural performance in a
predetermined fashion given the possible seismic hazard scenarios the structure is likely to
experience. Identifying and assessing the probable performance is an integral part of
performance-based design. Before implementation, accurate and practical definition of
different performance levels and the corresponding limit states must be defined properly. This
chapter aimed to develop performance-based damage states for shape memory alloy (SMA)
reinforced concrete bridge piers considering different types of SMAs and seismic hazard
scenarios. Using Incremental Dynamic Analysis (IDA), this chapter developed quantitative
damage states corresponding to different performance levels (cracking, yielding, spalling and
crushing) and specific probabilistic distributions for RC bridge piers reinforced with different
types of SMAs. Based on extensive numerical study, this study also proposed residual drift
based damage states for SMA-RC pier. Finally, an analytical expression is proposed to estimate
the residual drift of SMA reinforced concrete elements as a function of the expected maximum
drift and superelastic strain of SMA. Comparison with experimental results revealed that the
proposed equation could very well predict the residual drift obtained from the experimental
results.
120
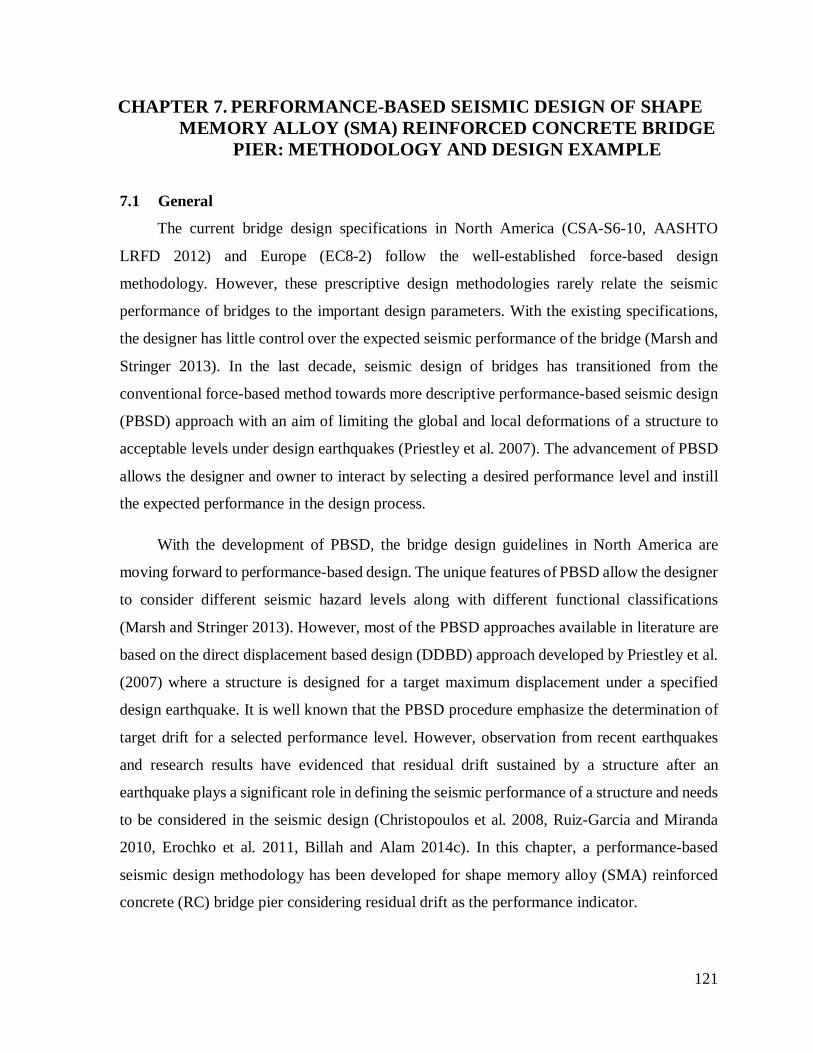
CHAPTER 7. PERFORMANCE-BASED SEISMIC DESIGN OF SHAPE MEMORY ALLOY (SMA) REINFORCED CONCRETE BRIDGE
PIER: METHODOLOGY AND DESIGN EXAMPLE
7.1 General
The current bridge design specifications in North America (CSA-S6-10, AASHTO
LRFD 2012) and Europe (EC8-2) follow the well-established force-based design
methodology. However, these prescriptive design methodologies rarely relate the seismic
performance of bridges to the important design parameters. With the existing specifications,
the designer has little control over the expected seismic performance of the bridge (Marsh and
Stringer 2013). In the last decade, seismic design of bridges has transitioned from the
conventional force-based method towards more descriptive performance-based seismic design
(PBSD) approach with an aim of limiting the global and local deformations of a structure to
acceptable levels under design earthquakes (Priestley et al. 2007). The advancement of PBSD
allows the designer and owner to interact by selecting a desired performance level and instill
the expected performance in the design process.
With the development of PBSD, the bridge design guidelines in North America are
moving forward to performance-based design. The unique features of PBSD allow the designer
to consider different seismic hazard levels along with different functional classifications
(Marsh and Stringer 2013). However, most of the PBSD approaches available in literature are
based on the direct displacement based design (DDBD) approach developed by Priestley et al.
(2007) where a structure is designed for a target maximum displacement under a specified
design earthquake. It is well known that the PBSD procedure emphasize the determination of
target drift for a selected performance level. However, observation from recent earthquakes
and research results have evidenced that residual drift sustained by a structure after an
earthquake plays a significant role in defining the seismic performance of a structure and needs
to be considered in the seismic design (Christopoulos et al. 2008, Ruiz-Garcia and Miranda
2010, Erochko et al. 2011, Billah and Alam 2014c). In this chapter, a performance-based
seismic design methodology has been developed for shape memory alloy (SMA) reinforced
concrete (RC) bridge pier considering residual drift as the performance indicator.
121

The response of SMA-RC bridge pier is significantly different from conventional piers
due its inherent recentering ability. Moreover, equivalent viscous damping is an essential
parameter that affects the behavior of a structural system under seismic excitations (Dawood
and Elgawady 2013). Previous researchers (DesRoches et al. 2004, Roh et al. 2012) have
shown that the hysteretic damping of SMA rebar is different from conventional steel rebar.
This study also developed the damping-ductility relationship for SMA-RC bridge piers in
support of the proposed PBSD of SMA-RC pier. Details of the different types of SMAs and
the material characteristics can be found in previous chapter (Chapter 6). This chapter shows
a step by step procedure, with useful flow charts and graphs, for designing SMA-RC bridge
pier along with a design example. The ability of the designed bridge pier (in the trial
application), to meet the performance objectives, has been evaluated by performing nonlinear
dynamic time history analyses using ten ground motions.
The following section introduces the proposed methodology and step by step description.
The subsequent sections provide a detailed design example and seismic performance
evaluation of the SMA-RC pier.
7.2 Performance-Based Design of SMA Reinforced Bridge Pier
The performance-based design of SMA-RC bridge pier is developed following a
displacement-based approach. Unlike other displacement-based approach, the required design
base shear is calculated corresponding to a target residual drift and target performance level
corresponding to a selected seismic hazard. The procedure adopted in this study follows the
procedure developed by Kowalsky et al. (1995) and Priestley et al. (2007), but is specifically
tailored to SMA- RC bridge pier using the damping-ductility relationship developed in this
study. The design steps adopted in this study are outlined in a simple flowchart in Figure 7.1.
7.2.1 Step 1: Define seismic hazard
Performance-based seismic design (PBSD) explicitly evaluates the probable structural
performance given the potential hazard it is likely to experience (FEMA 445, 2006). Since the
seismic hazard level changes in different parts of a country, a site specific seismic hazard level
must be defined as the starting point of PBSD. The seismic hazard level, which is usually
expressed as a probability of exceedance in certain number of years or return period, can play
a significant role in PBSD. For example, the CALTRANS Seismic Design Criteria (Caltrans
122

2010a) specifies a maximum hazard level of 5% in 50-years seismic event (975-years return
period) while the Japan Road Association (JRA 2006) defines two levels of seismic hazard,
Type-I and Type-II. In Eurocode 8, Part 2-Seismic Design of Bridges (EC8-2, 2008), usually
a single-level seismic hazard level is considered which corresponds to a 475-years return
period or a ground motion with 10% probability of exceedance in 50 years. However, both
AASHTO LRFD Bridge Design Specifications (AASHTO 2012) and AASHTO Guide
Specifications for Seismic Bridge Design (AASHTO 2011) suggest a single seismic hazard
level which corresponds to 7% probability of exceedance in 75 years (i.e., 1000 years return
period). Previous Canadian Highway Bridge Design Code (CSA-S6-10) specified the hazard
level with a 10% probability of exceedance in 50 years while the recent edition of CHBDC
(CSA-S6-14) requires that bridges should not collapse when subjected to earthquakes with 2%
probability of exceedance in 50 years. The recent CHBDC 2014 (CSA-S6-14) defines
acceptable levels of performance corresponding to different hazard levels. In this study, the
seismic hazard levels proposed in CHBDC 2014 (CSA-S6-14) are considered.
7.2.2 Step-2: Define target residual drift
The second step involves defining the target residual drift based on the selected target
performance level and seismic hazard level. In order to ensure an acceptable post-earthquake
functionality of the bridge pier, the residual drift for the specified earthquake hazard level must
not exceed the target residual drift of the pier, which can be established based on the existing
literature or experimental study. As a part of this study, concrete bridge piers reinforced with
five different types of SMAs were extensively analyzed under an ensemble of ground motion
to establish different performance levels corresponding to different seismic hazard levels.
Details of the procedure and residual drifts limits can be found in the previous chapter (Chapter
6).
7.2.3 Step-3: Calculate maximum drift based on target residual drift
Step 3 in the flowchart for PBSD of SMA-RC bridge pier focuses on the calculation of
maximum drift based on the residual drift. In Chapter 6 Equation 7.1 was proposed from which
the maximum drift can be calculated for a given residual drift.
s
ss MDMDRDε
εε 1100100
5.0 2 +
×−
×= (7.1)
123
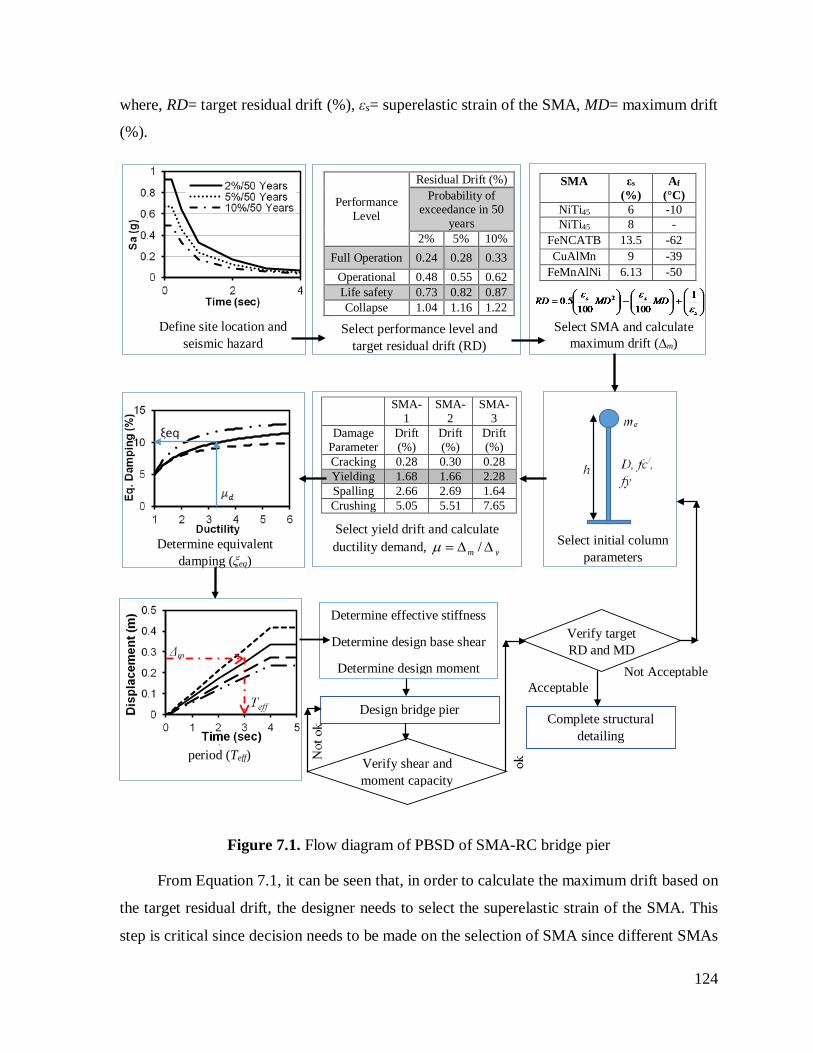
where, RD= target residual drift (%), εs= superelastic strain of the SMA, MD= maximum drift
(%).
Figure 7.1. Flow diagram of PBSD of SMA-RC bridge pier
From Equation 7.1, it can be seen that, in order to calculate the maximum drift based on
the target residual drift, the designer needs to select the superelastic strain of the SMA. This
step is critical since decision needs to be made on the selection of SMA since different SMAs
SMA εs (%)
Af (°C)
NiTi45 6 -10 NiTi45 8 -
FeNCATB 13.5 -62 CuAlMn 9 -39
FeMnAlNi 6.13 -50
Performance Level
Residual Drift (%) Probability of
exceedance in 50 years
2% 5% 10% Full Operation 0.24 0.28 0.33
Operational 0.48 0.55 0.62 Life safety 0.73 0.82 0.87 Collapse 1.04 1.16 1.22
SMA-
1 SMA-
2 SMA-
3 Damage
Parameter Drift (%)
Drift (%)
Drift (%)
Cracking 0.28 0.30 0.28 Yielding 1.68 1.66 2.28 Spalling 2.66 2.69 1.64 Crushing 5.05 5.51 7.65
Define site location and seismic hazard
Select performance level and target residual drift (RD)
Select SMA and calculate maximum drift (∆m)
Select initial column parameters
Determine equivalent damping (ξeq)
Determine equivalent time period (Teff)
Determine effective stiffness
Determine design base shear
Determine design moment
Verify target RD and MD
Acceptable
Complete structural detailing
Not Acceptable
Design bridge pier
Verify shear and moment capacity
Select yield drift and calculate ductility demand, ym ∆∆= /µ
124

have different range of superelastic strain. Moreover, the performance of the bridge pier is also
correlated to maximum drift since this drift value is well correlated to the structural damage of
the bridge pier as well as it is a kinematic value directly available from the analysis and/or
design process. To ensure satisfactory behavior in a major earthquake, the maximum drift
expected to occur in the SMA-RC pier should not exceed the superelsatic strain limit of the
SMA.
7.2.4 Step-4: Select initial parameters
Choose initial design parameters: height (H) and diameter (D) of the column, mass of
the superstructure (M), material properties of the SMA, concrete, and steel reinforcement.
7.2.5 Step-5: Calculate expected ductility demand
This step involves selection of the target yield drift based on the selected seismic hazard
level for calculating the expected ductility demand. Priestley et al. (2007) proposed equations
for calculating the yield curvature and yield displacement of circular RC pier for calculating
the expected ductility demand. Priestley et al. (2007) concluded that the yield curvature φy can
be calculated using Equation 7.2.
Dy
y
εφ 25.2= (7.2)
Where, εy is the yield strain of the flexural reinforcement and D is the diameter of the section.
The yield displacement ∆y can be calculated using Equation 7.3, where α is equal to 1/3 for a
cantilever column.
2Hyy αφ=∆ (7.3)
Since these equations were developed for regular steel-RC bridge piers, application of
these equations for SMA-RC bridge piers is questionable. Moreover, the ductility demand
calculated using these equations does not correlate with the selected seismic hazard level.
Chapter 6 developed yield drift limits for different SMA-RC bridge pier that correspond to
different seismic hazard levels. Based on the seismic hazard level, the target yield drift (∆𝑦𝑦𝑇𝑇)
can be selected, which can be used for calculating the expected ductility demand (𝜇𝜇𝑑𝑑) using
the following equation:
125

yt
md ∆
∆=µ (7.4)
7.2.6 Step-6: Determine equivalent hysteretic damping
Establishing damping-ductility relationship is an important step for the performance-
based design of SMA-RC bridge pier. The unique response of such a bridge pier under seismic
loading warrants a completely different damping-ductility relationship which is unlikely to
match with traditional steel reinforced bridge pier or post-tensioned bridge pier. The hysteretic
response of SMA-RC pier is expected to be similar to flag shaped hysteresis. Several
researchers have proposed equations for calculation the equivalent damping of flag shaped
hysteresis. For example, Priestely et al. (2007) and Dwairi et al. (2007) proposed Equations
7.5 and 7.6, respectively for flag shaped hysteresis:
Priestley Equation for flag shape:
−+=
µπµξ 1186.005.0eq (7.5)
Dwairi Equation for flag shape:
−+=
µπµξ 1305eq (7.6)
However, no researchers have investigated the damping-ductility relationship for SMA-
RC bridge pier. Hence, this study established the damping-ductility relationship for concrete
bridge piers reinforced with SMA rebar in its plastic hinge region. The damping-ductility
relationship was generated using large number of real ground motions following the method
described by Dwairi et al. (2007). In order to develop the damping-ductility relationship
comprehensively, five different bridge piers reinforced with five different types of SMAs were
selected as described in previous chapter (Chapter 6). A total of 100 ATC55/FEMA440 ground
motions (Miranda, 2003) were used for each bridge pier (Table 7.1).
Using the results obtained from each nonlinear time history analysis (NLTHA), the
ductility demand and corresponding damping value was obtained which provided a single point
in the damping-ductility curve. For each SMA-RC pier a series of 100 damping-ductility points
were obtained which are shown as dots in Figure 7.2a-e. For each set of points, nonlinear
regression analyses were carried out to establish the damping-ductility curves for the SMA-
RC piers (shown as solid lines in Figure 7.2a-e). A set of new damping-ductility equations, in
126

accordance with the previous expressions developed by other researchers (Priestely et al. 2007,
Dwairi et al. 2007), were developed in order to best approximate the damping-ductility
relationship. Equation 7.7 represents the general form of the proposed equivalent viscous
damping equation based on ductility for the SMA-RC bridge pier:
−+= beq
aµπ
ξξ 110
(7.7)
In this equation a and b are the two regression coefficients and µ is the ductility demand.
The equivalent damping (ξeq) is the sum of two contributions: the nominal viscous damping
ratio, ξ0, normally taken as 5% for all types of structures, and the hysteretic damping, which
depends on the dissipative capacity of a structure (Priestley et al. 2007). In order to obtain a
generic damping-ductility relationship for SMA-RC bridge pier, all the examined bridge piers
were considered together and the following expression was developed for the SMA-RC bridge
pier:
−+= 56.0
11325µπ
ξeq (7.8)
Table 7.1. ATC55/FEMA440 earthquake ground motions* (Miranda, 2003)
Date Earthquake Name Magnitude (Mw) 02/09/1971 San Fernando 6.5 10/15/1979 Imperial Valley 6.8 04/24/1984 Morgan Hill 6.1 07/08/1986 Palm Springs 6.0 10/01/1987 Whittier 6.1 10/17/1989 Loma Prieta 7.1 03/13/1992 Erzican, Turkey 6.9 06/28/1992 Landers 7.5 01/17/1994 Northridge 6.8 01/16/1995 Kobe 6.9 11/12/1999 Duzce, Turkey 7.8 08/17/1999 Kocaeli, Turkey 7.8 *Source: PEER ground motion database
127

The coefficient of determination or R2 value obtained from this expression was higher
than 85%. However, the developed relationship is limited to SMA-RC piers having a flexure
mode of failure and affected by the adopted ground motions. For the expected ductility demand
(calculated in step-5), based on the target drift, the equivalent viscous damping for SMA-RC
pier for the selected seismic hazard level can then be determined using the proposed equation.
Figure 7.2. Damping-Ductility relation for SMA-RC bridge pier (a) SMA-1, (b) SMA-2, (c)
SMA-3, (d) SMA-4 and (e) SMA-5
Figure 7.3 shows the equivalent viscous damping and ductility curve developed in this
study along with the curves proposed by Priestely et al. (2007) and Dwairi et al. (2007) for flag
shaped hysteresis. From this figure it can be observed that, the proposed relationship is in well
accordance with the existing literature. Previous researchers (DesRoches et al. 2004, Roh et
al. 2012) have shown the hysteretic damping of large diameter of superelastic SMA bars ranges
between 2%-7% under dynamic loading. Similar observation was also found in this study.
7.2.7 Step 7: Determine effective time period (Teff)
Knowing the maximum displacement (Δm) for the equivalent SDOF of the bridge pier
and the equivalent viscous damping (ξeq), the effective time period (Teff) of the pier can be
obtained using the displacement response spectrum of the site under consideration at the
selected hazard level. The acceleration response spectrum at the selected hazard level can be
02468
10121416
1 2 3 4 5 6
Equi
vale
nt D
ampi
ng (%
)
Ductility
(a)
02468
10121416
1 2 3 4 5 6
Equi
vale
nt D
ampi
ng (%
)
Ductility
(b)
02468
10121416
1 2 3 4 5 6
Equi
vale
nt D
ampi
ng (%
)
Ductility
(c)
02468
10121416
1 2 3 4 5 6
Equi
vale
nt D
ampi
ng (%
)
Ductility
(d)
02468
10121416
1 2 3 4 5 6
Equi
vale
nt D
ampi
ng (%
)
Ductility
(e)
128

transformed into the corresponding displacement response spectrum using the following
relationship.
2
2
4πeffa
d
gTSS = (7.9)
where, Sd is the spectral displacement, Sa is the spectral acceleration, g is the acceleration
due to gravity and Teff is the effective time period. Spectral accelerations in the design codes
typically represent equivalent viscous damping equal to 5% of critical damping. In order to
convert the 5% damped response spectrum to the target damping value obtained in previous
step (step-6), a modification factor (Rξ) needs to be determined using the following equation
adopted in Eurocode-8 (EC8-2, 2008).
5.0
05.010.0
+
=ξξR (7.10)
Using this modification factor the modified displacement spectrum can be calculated using the
following equation:
ξξ RSS dd ×= %5,, (7.11)
Figure 7.3. Comparison of Damping-Ductility curve
0
2
4
6
8
10
12
14
1 2 3 4 5 6
Equi
vale
nt D
ampi
ng (%
)
Ductility
Priestley-flag shapedDwairi and Kowalsky-flag shapedSMA-RC pier
129

7.2.8 Step 8: Determine effective stiffness (Keff)
The effective stiffness (Keff) based on the effective period (Teff) is calculated as:
2
24
eff
eeff T
MK π= (7.12)
Where Me is the effective mass of the pier.
7.2.9 Step 9: Compute design base shear (Vbase) and design moment (Md)
Using the relationship between effective stiffness and design displacement, the design
base shear can be calculated using the following equation:
meffbase KV ∆= (7.13)
Determine the design moment using the following relation:
(7.14)
7.2.10 Step 10: Design the bridge pier
7.2.10.1 Design longitudinal reinforcement
The required longitudinal reinforcement can be calculated based on the design moment
and axial load ratio using moment curvature analysis or using design requirement of relevant
bridge design codes (i.e. AASHTO, CHBDC). The longitudinal steel ratios should be between
0.7% and 4% to comply with the common design practice.
7.2.10.1.1 Design transverse reinforcement
In order to satisfy the confinement and shear strength requirements, the transverse
reinforcement needs to be designed properly. Confinement requirements can be obtained from
the required displacement ductility as described by Kowalsky et al. (1995) or using design
requirement of relevant bridge design codes (i.e. AASHTO, CHBDC).
7.2.10.1.2 Check shear strength requirement
The shear strength of the column must be checked to ensure that the shear capacity is
greater than the shear demand calculated in step-9. The shear capacity of the pier can be
LVM based ×=
130

checked using modified compression field theory (Vecchio and Collins, 1986) or modified
UCSD shear model (Kowalsky and Priestley, 2000). If the shear strength does not satisfy the
requirement, the transverse reinforcement ratio should be revised.
7.3 Illustrative example
The following example is presented to demonstrate the performance-based design
procedure for SMA-RC bridge pier.
The bridge pier is assumed to be located at Vancouver, BC with site soil class-C (stiff
soil). The corresponding design spectrum is selected according to CHBDC-2014 (CSA S6-14)
which corresponds to 2% probability of exceedance in 50 years with a return period of 2475
years (Figure 7.4).
Figure 7.4. Design Acceleration Response Spectrum
The considered bridge is a lifeline bridge and according to CHBDC-2014 (CSA-S6-14)
performance requirement, the bridge should be operational with limited service at the selected
seismic hazard level. For the considered damage level, a target residual drift of 0.6% is selected
to meet the performance objective. To restrict the residual drift within the target level, a Nitinol
shape memory alloy with 6% superelastic strain is selected.
The maximum drift based on the target residual drift and selected SMA is calculated
using Equation 7.1:
00.10.20.30.40.50.60.70.80.9
1
0 1 2 3 4
Spec
tral
Acc
eler
atio
n (g
)
Time (sec)
Design ResponseSpectrum
131

s
ss MDMDRDε
εε 1100100
5.0 2 +
×−
×=
or, 61
1006
10065.06.0 2 +
×−
×= MDMD
Solving this quadratic equation we get, maximum drift, MD= 4.92%
Maximum displacement, Δm= 0.0492 × 5= 0.246 m
Initial column parameters:
Height of the pier = 5m
Lumped mass at the top of pier = 500,000 kg
Selected material properties of concrete, steel, and SMA are provided in Table 7.2.
Table 7.2. Material Properties
Material Property Concrete Compressive Strength (MPa) 42.4
Elastic modulus (GPa) 23.1 Steel Elastic modulus (GPa) 200
Yield stress (MPa) 400 Ultimate stress (MPa) 672
SMA Modulus of Elasticity (GPa) 58.8 Austenite-to-martensite starting stress (MPa) 401 Austenite-to-martensite finishing stress (MPa) 510 Martensite-to-austenite starting stress (MPa) 370 Martensite-to-austenite finishing stress (MPa) 130 Superelastic strain (%) 6.0
For the considered hazard level, the yield drift is selected as 1.68% as developed in the
previous chapter (Chapter 6).
Yield displacement, ΔyT = 0.0168 × 5= 0.084 m
Ductility demand, μd = 93.2084.0246.0
==∆∆
T
m
y
132
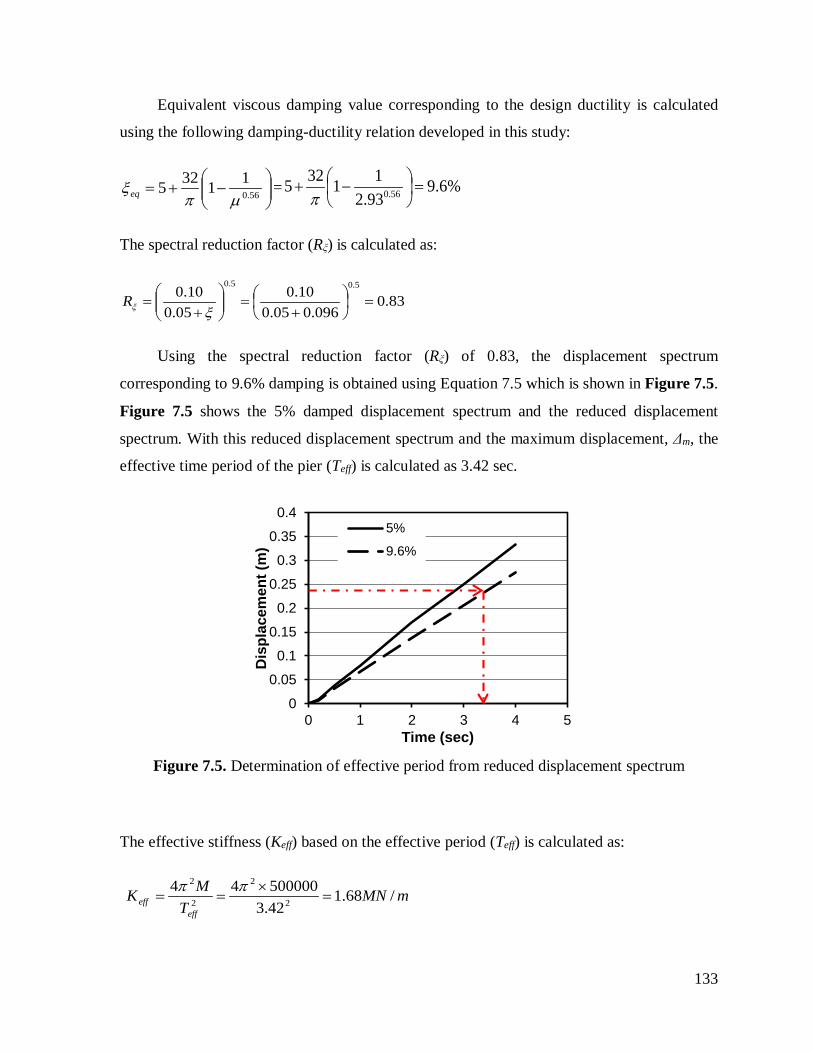
Equivalent viscous damping value corresponding to the design ductility is calculated
using the following damping-ductility relation developed in this study:
−+= 56.0
11325µπ
ξeq = %6.993.211325 56.0 =
−+
π
The spectral reduction factor (Rξ) is calculated as:
83.0096.005.0
10.005.0
10.0 5.05.0
=
+=
+
=ξξR
Using the spectral reduction factor (Rξ) of 0.83, the displacement spectrum
corresponding to 9.6% damping is obtained using Equation 7.5 which is shown in Figure 7.5.
Figure 7.5 shows the 5% damped displacement spectrum and the reduced displacement
spectrum. With this reduced displacement spectrum and the maximum displacement, Δm, the
effective time period of the pier (Teff) is calculated as 3.42 sec.
Figure 7.5. Determination of effective period from reduced displacement spectrum
The effective stiffness (Keff) based on the effective period (Teff) is calculated as:
mMNT
MKeff
eff /68.142.350000044
2
2
2
2
=×
==ππ
0
0.05
0.1
0.15
0.2
0.25
0.3
0.35
0.4
0 1 2 3 4 5
Dis
plac
emen
t (m
)
Time (sec)
5%
9.6%
133

The design base shear is calculated as:
kNKV meffbase 3.413246.01068.1 6 =××=∆=
The design moment is calculated as:
mkNLVM based −=×=×= 5.206653.413
Finally, for the design moment of 2066.5 kN-m, the column section is designed
according to CHBDC 2014 (CSA-S6-14) considering a column diameter of 1 m. For the design
moment a longitudinal steel ratio of 1.73% is obtained which is provided using 28-25M SMA
rebar (24.9 mm diameter) in the plastic hinge region and 28-25M steel (diameter 25.2 mm)
rebar in the remaining portion. The shear reinforcement was design following CHBDC 2014
(CSA-S6-14) seismic design requirements which yielded 15M spirals at 50mm pitch providing
a spiral reinforcement ratio of 1.49%.
The shear capacity of the column is checked using modified compression field theory
(Vecchio, and Collins,1986) which predicts the experimentally determined shear failure within
1% error (Bentz et al. 2006). The shear resistance of the pier is found to be 2264 kN which is
much higher than the applied shear force. Figure 7.6a shows the moment-shear force
interaction diagram of the designed pier. From Figure 7.6a, it is evident that the maximum
moment and shear force are within the safe region. Wang et al. (2008) recommended that the
shear capacity of the pier should be greater than 1.6 times the base shear corresponding to the
design moment which has also been satisfied.
0
400
800
1200
1600
2000
0 1000 2000 3000
Shea
r (kN
)
Moment (kN-m)
(a)
-5000
0
5000
10000
15000
20000
25000
0 1000 2000 3000 4000 5000
Axia
l Loa
d (k
N)
Moment (kN-m)
(b)
134

Figure 7.6. (a) Moment-Shear force interaction diagram and (b) Moment-Axial Load
interaction diagram
The axial load versus moment interaction diagram of the designed pier is developed as
shown in Figure 7.6b. From the interaction diagram, it is observed that, the applied maximum
axial load and moment are within the safe boundary.
7.4 Bridge Pier Performance Evaluation
In order to validate the proposed design approach, the performance of the designed
bridge pier is evaluated using NLTHA with ten earthquake records. The bridge pier was
modeled in Seismostruct (Seismosoft 2014), a fiber based finite element software. The bridge
piers were modelled through a 3D inelastic beam–column element (force based element), with
a circular section for the piers; the constitutive laws of the reinforcing steel and of the concrete
were, respectively, the Menegotto–Pinto (1973) and Mander et al. (1988) models. The
superelastic SMA model developed by Auricchio and Sacco (1997) has been employed for
modeling SMA. The objective of this evaluation is to compare the performance objectives
(residual drifts and maximum drifts) with the predicted performance under the ensemble of
selected ground motions. The selected ground motions were first scaled to match the
displacement response spectrum of the location of the bridge pier (Figure 7.7). The results of
the analyses in terms of maximum and residual drifts are presented in Figure 7.8a and b,
respectively. These figures show the maximum and residual drift response obtained from each
nonlinear time history analysis and also the target maximum and residual drift (horizontal line)
used in the design.
135

Figure 7.7. Displacement spectra of ten earthquake records matched with target response
spectrum
0
5
10
15
20
25
30
35
40
0 1 2 3 4
Spec
tral
Dis
plac
emen
t (cm
)
Time (sec)
Target SpectraChiChiFruiliHollisterImperial ValleyKobeKocaeliLandersLoma PrietaNorthridgeTrinidad
136

Figure 7.8. (a) Maximum and (b) residual drift value obtained from time history analysis of
the designed pier (Red line showing the target maximum and residual drift)
From these figures it is evident that the bridge pier sustained maximum and residual
drifts within 15% of the target maximum and residual drift. It was found out from the analysis
that among ten earthquake records, two exceeded the target residual drift of 0.6% and
maximum drift of 4.92%. The remaining eight are below the design level residual drift and
targeted maximum drift. These discrepancies can be attributed to the linearization of the
displacement spectrum adopted during the design and the scaling of ground motions. However,
the average response in terms of both residual and maximum drifts was very close to the
0
1
2
3
4
5
6
Max
imum
Drif
t (%
)
(a)
0
0.1
0.2
0.3
0.4
0.5
0.6
0.7
Res
idua
l Drif
t (%
)
(b)
137

targeted drift levels. Previous researchers (Kowalsky et al. 1995, Priestley et al. 2007, Haque
and Alam 2013) also observed similar differences when NLTHA carried out on structures
designed following displacement-based approach. Priestley et al. (2007) suggested that the
differences in the target drift and obtained drift from NLTHA is acceptable if the mean of the
peak drifts remains close to the design drift.
7.5 Summary
In this chapter, a performance-based seismic design method is presented for shape
memory alloy (SMA) reinforced concrete (RC) bridge pier. The proposed design method is
developed based on the existing displacement-based procedure where the expected
performance is quantified by linking material strains and deformations to damage states and to
the probable post-earthquake functionality of a bridge. Based on the performance-based
damage states developed in chapter 6, this chapter presents the sequential procedure for the
performance-based design of SMA-RC bridge pier using a combination of residual and
maximum drift. Here, guidelines are provided to determine the target residual drift, which is
correlated to the target drift/ductility. From the effective damping-ductility relationship
developed in this study for the SMA-RC bridge pier, the time period of the structure is
calculated based on target ductility. The proposed design framework is used for designing a
trial SMA-RC bridge pier. The SMA-RC pier designed using the presented procedure was
subjected to nonlinear time history analyses using a suite of selected earthquake records. The
nonlinear analyses showed that the designed pier behave according to design expectations and
provided very promising results in terms of the effectiveness and applicability of the proposed
design method.
138

CHAPTER 8. PROBABILISTIC SEISMIC RISK ASSESSMENT OF CONCRETE BRIDGE PIERS REINFORCED WITH
DIFFERENT TYPES OF SHAPE MEMORY ALLOYS
8.1 General
Current seismic design guidelines, followed in North America (CHBDC 2014, AASHTO
LRFD 2012) and Europe (EC8-2), allow bridges other than life line bridges to undergo large
inelastic deformation while maintaining the load carrying capacity without being completely
collapsed during a design level earthquake. However, past experiences (Kobe 1995, Northridge
1994) have shown that bridges undergoing large lateral drift are prone to large residual
deformation which renders the bridges to be unusable and require major rehabilitation or
replacement. In order to maintain the structural integrity and functionality of a bridge after an
earthquake, it is necessary that the bridge components avoid excessive residual deformation or
permanent damage (Kawashima et al. 1998). Bridge pier is one of the most critical components
of a bridge since the overall seismic response of a bridge is largely dependent on the response
of the piers. The extent of residual or permanent deformation sustained by the bridge piers
prescribes the likelihood of allowing traffic over the bridge and dictates the amount of repair
works and expected loss. Evidences from recent earthquakes and field reports demonstrated
the importance of considering residual deformation as an indicator for defining the overall
seismic performance of a structure.
Over the last few years, researchers have experimentally and numerically investigated
the potential application of shape memory alloys in bridge piers and found promising results
(Saiidi et al. 2009, Billah and Alam 2014c, Cruz and Saiidi 2012). However, all the previous
studies were focused on the application of Ni-Ti SMA. However, Chapter 6 and 7 of this
research developed performance-based damage states and a performance-based seismic design
guideline for bridge piers reinforced with different types of superelastic SMAs in the plastic
hinge region. While the previous chapters proved the potential of using this smart material in
bridge piers and proposed some design guidelines, adoption of these guidelines and successful
implementation require a complete performance-based evaluation of this structural system in
light of performance-based earthquake engineering (PBEE). To this end, it is necessary to
investigate the ability of such novel structural system in reducing the failure probability as well
139

as the annual rate of exceeding some structural demand parameters given an earthquake
scenario.
The objective of this chapter is to perform fragility based probabilistic seismic risk
assessment of concrete bridge piers reinforced with different types of SMA rebar in the plastic
hinge region. Figure 8.1 illustrates the methodology adopted in this study. First, the bridge
piers are designed following the performance-based design guideline developed in Chapter 7.
Later, a detailed description of the finite element model is provided to elucidate the details of
bridge pier models. Instead of using code-specified design level earthquakes, this study
considered three different earthquake scenarios which resembles the regional seismicity of
Vancouver, British Columbia (BC), where the bridge is located. The performance and hazard
assessment is conducted by considering shallow crustal, mega-thrust interface, and deep in-
slab earthquake events (Atkinson and Goda 2011). Next, incremental dynamic analysis (IDA)
(Vamvastikos and Cornell 2002) are conducted on each SMA-RC bridge pier model using 30
selected ground motions scaled to the conditional mean spectra of crustal, in-slab and interface
earthquakes. The performance parameters of interest, which are maximum and residual drift
in this study, are recorded for each motion. Next, the seismic performances of five different
SMA-RC bridge piers are evaluated and compared using fragility curves. The fragility curves
are developed using the Probabilistic Seismic Demand Model (PSDM). Finally, a probabilistic
risk assessment is conducted to evaluate the mean annual frequency of exceeding different
damage levels in terms of the selected demand parameters.
140

Figure 8.1. Flowchart of the methodology for seismic risk assessment of SMA-RC bridge
piers
-1
-0.5
0
0.5
1
0 20 40 60
Acce
lera
tion
(g)
Time (sec)
-0.1
-0.05
0
0.05
0.1
0 10 20 30 40
Dis
plac
emen
t (m
)
Time (sec)
Maximum deformation
Residual deformation
Spec
tral A
ccel
erat
ion
Vibration Period (s)
UHSCMS-CrustalCMS-InslabCMS-Interface Sp
ectra
l Acc
eler
atio
n
Vibration Period (s)
P [D
SIPG
A]
PGA (g)
y = 1.03x + 0.36R² = 0.80
LN (I
M)
LN (EDP)
Annu
al ra
te o
f ex
ceed
ance
EDP
DS-
4D
S-3DS-
2D
S-1
141

8.2 Probabilistic Seismic Performance Assessment
A commonly used method for probabilistic seismic performance assessment is the
Pacific Earthquake Engineering Research (PEER) Centre PBEE methodology (Cornell and
Krawlinkler 2000) which attempts to address structural performance in terms of life safety,
capital losses and functional losses (Aslani 2005). This PBEE methodology is composed of
hazard analysis, structural analysis, damage analysis, and loss analysis. However, most of the
applications of PBEE have been focused on buildings and few of them focused on bridge
structures (Lee and Billington 2011). Moreover, no study has been conducted to date for
probabilistic seismic performance assessment of SMA reinforced bridge piers. This chapter is
intended to elucidate the potential benefit and compare the performance of different SMA-RC
bridge piers in light of PBEE. This study conducted three steps of PBEE involving hazard,
structural and damage analyses. However, the loss analysis was not performed because of
limited information regarding the cost of different types of SMAs considered in this study.
This research developed fragility curves and seismic hazard curves for different SMA-RC
bridge piers considering maximum and residual drift as engineering demand parameters. The
developed fragility curves express the probability of reaching or exceeding certain damage
states corresponding to a certain intensity of ground motion. The hazard curves relate the mean
annual rate of exceeding certain damage states.
Instead of proposing a new methodology for the fragility assessment, this chapter offers
critical insight on the performance-based evaluation of SMA-RC bridge piers using fragility
curves. In this assessment different types of SMAs and uncertainties in the seismic hazard of
the site are considered. Details of different methods of fragility curve development can be
found in (Billah and Alam 2014b). In this study, the fragility curves are developed using a
probabilistic seismic demand model (PSDM) and limit state model. The PSDM which relates
the median demand to the intensity measure (IM) is developed using the results obtained from
IDA and the power law function (Cornell et al. 2002). The PSDM provides a logarithmic
correlation between median demand and the selected IM:
EDP = a (IM)b (8.1)
In the log transformed space, Equation 8.1 can be expressed as
142
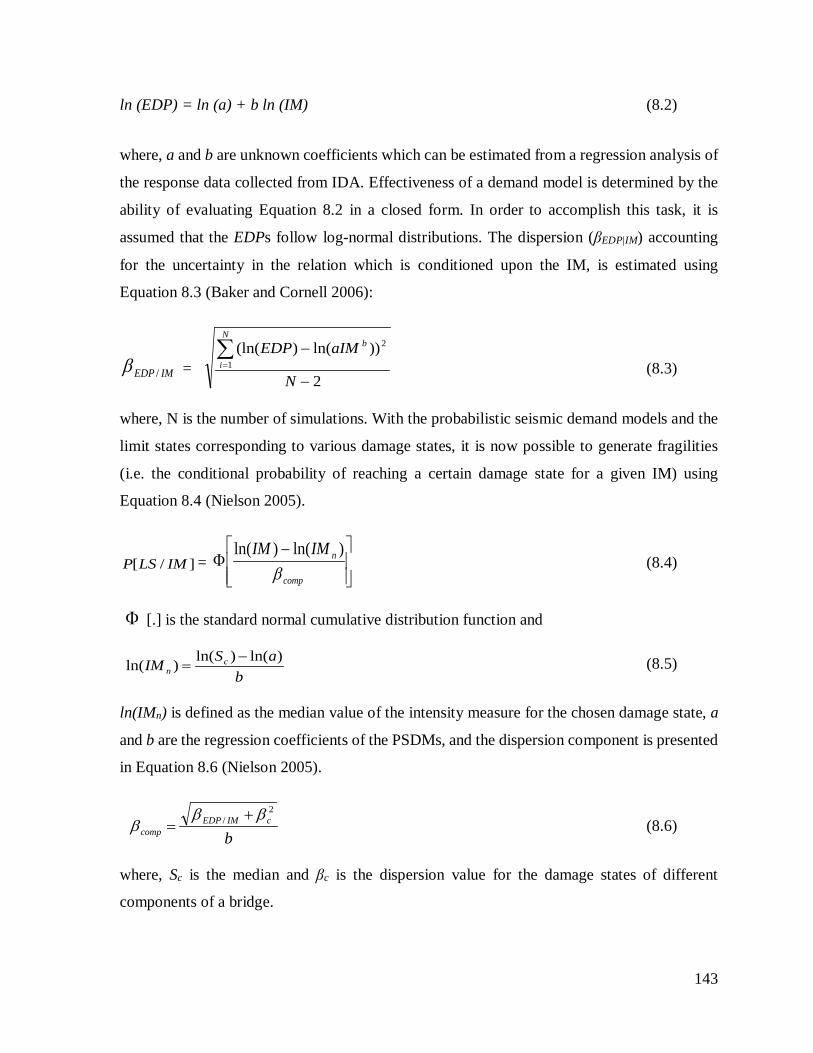
ln (EDP) = ln (a) + b ln (IM) (8.2)
where, a and b are unknown coefficients which can be estimated from a regression analysis of
the response data collected from IDA. Effectiveness of a demand model is determined by the
ability of evaluating Equation 8.2 in a closed form. In order to accomplish this task, it is
assumed that the EDPs follow log-normal distributions. The dispersion (βEDP|IM) accounting
for the uncertainty in the relation which is conditioned upon the IM, is estimated using
Equation 8.3 (Baker and Cornell 2006):
IMEDP /β =2
))ln()(ln(1
2
−
−∑=
N
aIMEDPN
i
b
(8.3)
where, N is the number of simulations. With the probabilistic seismic demand models and the
limit states corresponding to various damage states, it is now possible to generate fragilities
(i.e. the conditional probability of reaching a certain damage state for a given IM) using
Equation 8.4 (Nielson 2005).
]/[ IMLSP =
−Φ
comp
nIMIMβ
)ln()ln( (8.4)
Φ [.] is the standard normal cumulative distribution function and
b
aSIM cn
)ln()ln()ln( −= (8.5)
ln(IMn) is defined as the median value of the intensity measure for the chosen damage state, a
and b are the regression coefficients of the PSDMs, and the dispersion component is presented
in Equation 8.6 (Nielson 2005).
b
cIMEDPcomp
2/ ββ
β+
= (8.6)
where, Sc is the median and βc is the dispersion value for the damage states of different
components of a bridge.
143

By combining the seismic responses obtained from IDA, in terms of maximum and
residual drift, with the seismic hazard curve, it is possible to calculate the annual rate of
exceeding various levels of demand for each EDP monitored. Using the uniform seismic
hazard curve for the site under consideration, and maximum and residual drift responses
obtained from IDA, the maximum and residual drift hazard of the SMA-RC piers are calculated
based on the convolution integral (Equation 8.7) presented by Deierlein et al. (2003)
( ) ( ) ( )IMdvIMedpEDPPedpEDP ∫ >=λ (8.7)
In this equation, IM denotes the intensity measure of the ground motion, EDP refers to the
engineering demand parameter (maximum and residual drift), λEDP(edp) represents the mean
annual frequency of exceeding a predefined engineering demand parameter, edp.
8.3 Design of SMA-RC Bridge Piers
In this study five concrete bridge piers reinforced with five different SMAs are designed
following the performance-based design guidelines proposed in previous chapter (Chapter 7).
The bridge piers are assumed to be located at Vancouver, BC with the site soil class-C (stiff
soil). The corresponding design spectrum is selected, with a 2% probability of exceedance in
50 years that corresponds to a return period of 2475 years, according to the CHBDC-2014
(CSA S6-14). The bridge is considered to be a lifeline bridge according to the bridge
classification described in CHBDC-2014 (CSA S6-14). For the selected seismic hazard level
(2% in 50 years), the bridge should be operational (repairable damage) with limited service to
meet the performance requirements. Since this design method starts with selecting a target
residual drift, to meet the performance objectives and develop a comparable design of five
different SMA-RC bridge piers, a target residual drift of 0.6% is selected. The height and
diameter of all the bridge piers are assumed to be 5m and 1m, respectively. Five different
SMAs having different combinations of alloys and mechanical properties are selected which
are shown in Table 6.1. The material properties of concrete and steel reinforcement are listed
in Table 6.2. The final design yielded all the bridge piers to be reinforced with 28 longitudinal
SMA rebars of different diameter in the plastic hinge region and the remaining portion was
reinforced with 28-25M steel (diameter 25.2 mm) rebar. To meet the current seismic design
requirements, shear reinforcement was provided using 15 mm spirals at 50 mm pitch. The
144

bridge piers are specified as SMA-RC-1 (reinforced with SMA-1), SMA-RC-2 (reinforced
with SMA-2), and so on. SMA-RC-1 and SMA-RC-2 are reinforced with 28-25 mm SMA-1
and SMA-2 bars, respectively. SMA-RC-3 is reinforced with 28-22.5 mm SMA-3 bars whereas
SMA-RC-4 is reinforced with 28-35mm SMA-4 bars, and SMA-RC-5 is reinforced with 28-
30 mm SMA-5 bars. Figure 8.2 shows the cross section and elevation of the bridge pier. In this
study, the plastic hinge length of the SMA-RC bridge piers are calculated using the plastic
hinge expression (Equation 8.8) developed in Chapter 5.
( ) ( ) ( ) ( )sclSMAygc
P ffdL
AfP
dL
ρρ 24.0019.016.00002.008.025.005.1 // −−−+
+
+= − (8.8)
Where, Lp is the plastic hinge length, d is the diameter of the pier, L/d is the aspect
ratio, P/fc’Ag is the axial load ration, ρl =longitudinal reinforcement ratio, ρs = transverse
reinforcement ratio, fy-SMA = yield strength of SMA rebar and fc’= concrete compressive
strength. This equation showed reasonable accuracy in predicting the plastic hinge length
measured from experimental investigations.
Figure 8.2. (a) Cross section, (b) elevation and (c) finite element model of SMA-RC bridge
pier
8.4 Finite Element Modeling of Bridge Piers
In this study, the bridge piers are modeled using a fiber based finite element program
Seismostruct (Seismosoft 2014) to explicitly model the concrete, SMA and reinforcing steel
materials. This program is able to accurately predict the large displacement and collapse
behavior of frame structures under static and dynamic loading considering both geometric
(a) (b) (c)
145

nonlinearity (P-Δ effect) and material inelasticity (Pinho et al. 2007). The fiber sections of
confined and unconfined concrete are simulated using the Mander et al. (1988) concrete
constitutive model. The longitudinal reinforcement is modeled using the Menegotto–Pinto
(1973) steel model with Filippou (1983) hardening rules. The superelastic SMA is modeled
based on the constitutive relation developed by Auricchio and Sacco (1997). Mechanical
couplers are used to connect SMA with steel rebars (Alam et al. 2010) which is represented by
introducing a zero-length rotational spring at the bottom of the column section (Figure 8.2c).
The stress-slip relationship of bars inside the coupler and the details of the splicing can be
found in (Billah and Alam 2012). This study employed another zero-length inelastic spring to
simulate the bond-slip behavior of SMA rebar in concrete. The bond slip spring was modeled
based on the experimental bond strength-slip relation developed in Chapter 4. Using the
modified Takeda hysteresis curve, described by Otani (1974) which follows the unloading
rules proposed by Emori and Schonobrich (1978), the bond-slip spring was modeled.
8.5 Seismic Hazard and Selection of Ground Motions
For the considered location of the bridge pier, seismic hazard is calculated using the
probabilistic seismic hazard analysis (PSHA). Current Geological Survey of Canada model
(NRC 2010), as described in Atkinson and Goda (2011), is used for assessing the seismic
hazard of Vancouver. In this study, the hazard curves are obtained considering both peak
ground acceleration (PGA) and spectral acceleration at the first mode period (Sa,T1) as intensity
measures (IMs). Here, both PGA and Sa,T1 are selected for the seismic hazard curves as these
two IMs are commonly available for the site under consideration. Based on the eigenvalue
analysis, the fundamental periods of all the bridge piers are found to be around 0.7 sec. Figure
8.3 illustrates the seismic hazard curves for the location of bridge pier.
For probabilistic seismic performance assessment, selection of appropriate ground
motions which are representatives of the seismic hazard of the site under consideration is very
important. In this study, the ground motion records are selected for seismic fragility and hazard
assessment of SMA-RC bridge piers located in site soil class-C (VS30 = 550 m/s), in Vancouver,
BC, Canada. For the seismicity in Vancouver, consideration of shallow crustal, subcrustal, and
mega-thrust Cascadia subduction events are important since they have very different event and
ground motion characteristics due to different source and path effects (Goda and Atinson
146
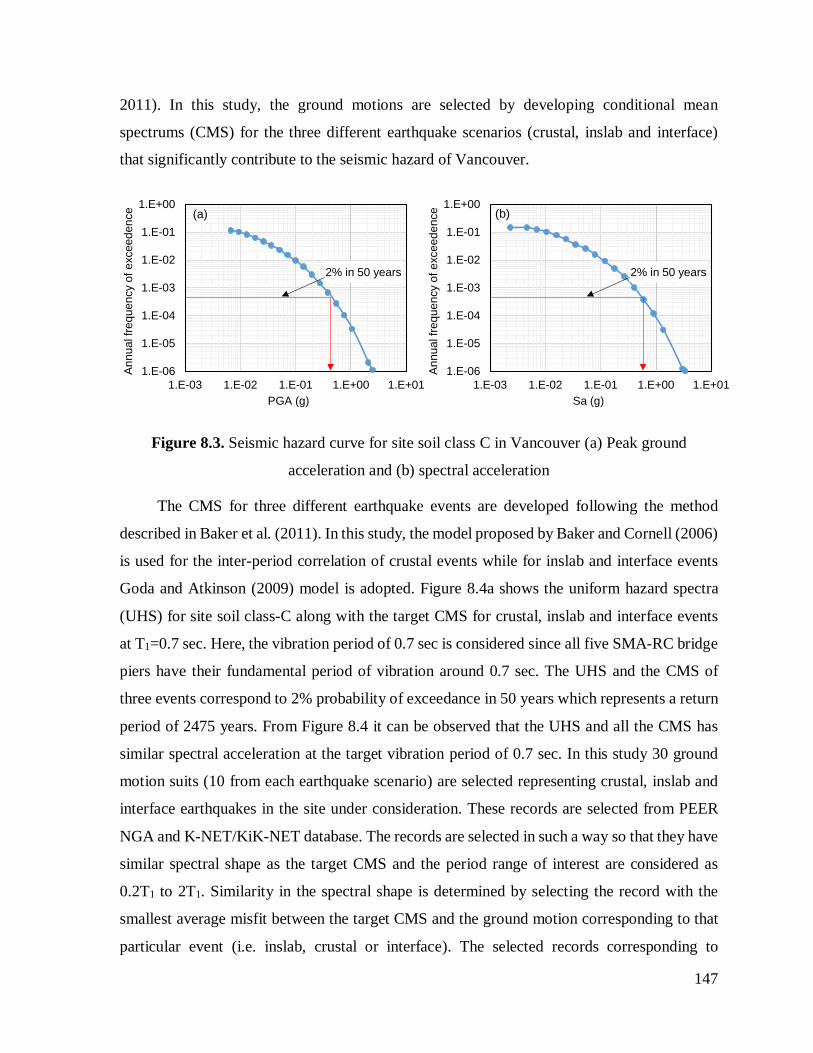
2011). In this study, the ground motions are selected by developing conditional mean
spectrums (CMS) for the three different earthquake scenarios (crustal, inslab and interface)
that significantly contribute to the seismic hazard of Vancouver.
Figure 8.3. Seismic hazard curve for site soil class C in Vancouver (a) Peak ground
acceleration and (b) spectral acceleration
The CMS for three different earthquake events are developed following the method
described in Baker et al. (2011). In this study, the model proposed by Baker and Cornell (2006)
is used for the inter-period correlation of crustal events while for inslab and interface events
Goda and Atkinson (2009) model is adopted. Figure 8.4a shows the uniform hazard spectra
(UHS) for site soil class-C along with the target CMS for crustal, inslab and interface events
at T1=0.7 sec. Here, the vibration period of 0.7 sec is considered since all five SMA-RC bridge
piers have their fundamental period of vibration around 0.7 sec. The UHS and the CMS of
three events correspond to 2% probability of exceedance in 50 years which represents a return
period of 2475 years. From Figure 8.4 it can be observed that the UHS and all the CMS has
similar spectral acceleration at the target vibration period of 0.7 sec. In this study 30 ground
motion suits (10 from each earthquake scenario) are selected representing crustal, inslab and
interface earthquakes in the site under consideration. These records are selected from PEER
NGA and K-NET/KiK-NET database. The records are selected in such a way so that they have
similar spectral shape as the target CMS and the period range of interest are considered as
0.2T1 to 2T1. Similarity in the spectral shape is determined by selecting the record with the
smallest average misfit between the target CMS and the ground motion corresponding to that
particular event (i.e. inslab, crustal or interface). The selected records corresponding to
1.E-06
1.E-05
1.E-04
1.E-03
1.E-02
1.E-01
1.E+00
1.E-03 1.E-02 1.E-01 1.E+00 1.E+01
Ann
ual f
requ
ency
of e
xcee
denc
e
PGA (g)
2% in 50 years
(a)
1.E-06
1.E-05
1.E-04
1.E-03
1.E-02
1.E-01
1.E+00
1.E-03 1.E-02 1.E-01 1.E+00 1.E+01
Ann
ual f
requ
ency
of e
xcee
denc
e
Sa (g)
2% in 50 years
(b)
147

different earthquake types along with the target CMS and UHS are shown in Figure 8.4b-d.
The records selected for performance assessment of the SMA-RC bridge piers are listed in
Table 8.1.
Figure 8.4. (a) Comparison of UHS, CMS-Crustal, CMS-Interface, and CMS-Inslab at T1 =
0.7 s, (b-d) comparison of response spectra of the selected records with the target spectra for
individual earthquake types
0.05
0.5
5
0.05 0.5 5
Spe
ctra
l Acc
eler
atio
n (g
)
Vibration Period (s)
UHSCMS-CrustalCMS-InslabCMS-Interface
1 20.1 0.2
1
2
0.1
(a)
0.05
0.5
5
0.05 0.5 5
Spec
tral A
ccel
erat
ion
(g)
Vibration Period (s)210.1 0.2
1
2
0.1
(b)
0.05
0.5
5
0.05 0.5 5
Spec
tral A
ccel
erat
ion
(g)
Vibration Period (s)0.1
0.1
0.2 1 2
2
1
(c)
0.05
0.5
5
0.05 0.5 5
Spec
tral A
ccel
erat
ion
(g)
Vibration Period (s)0.1
0.1
0.2 1 2
2
1
(d)
148

Table 8.1. Selected earthquake ground motion records
No Eq. Name Record ID
Event ID Type Mw
Epi. Dis
(km)
PGA (g)
PGV (cm/s) Source
1 Northridge 953 127 Crustal 6.69 17.15 0.46 54 PEER 2 Duzce, Turkey 1602 138 Crustal 7.14 12.04 0.72 59 PEER 3 Hector mine 1787 158 Crustal 7.16 11.66 0.31 34 PEER 4 Imperial Valley 169 50 Crustal 6.53 22.03 0.28 28 PEER 5 Kocaeli,Turkey 1158 136 Crustal 7.51 15.37 0.3 54 PEER 6 Landers 900 125 Crustal 7.28 23.62 0.21 38 PEER 7 Loma Prieta 752 118 Crustal 6.93 15.23 0.48 34 PEER 8 Manjil, Iran 1633 144 Crustal 7.37 12.56 0.52 47 PEER 9 Chi Chi, Taiwan 1485 137 Crustal 7.62 26 0.47 39 PEER 10 Kobe, Japan 1106 129 Crustal 6.9 0.96 0.71 78 PEER 11
Tohuku, Japan
27538 368 Inslab 6.8 111.88 0.85 23 K-KIK 12 27451 368 Inslab 6.8 114.01 0.48 16 K-KIK 13 27454 368 Inslab 6.8 112.09 0.48 12 K-KIK 14 9813 184 Inslab 7 117.21 0.75 19 K-KIK 15 9837 184 Inslab 7 52.16 0.72 15 K-KIK 16 9831 184 Inslab 7 79.59 0.58 20 K-KIK 17 20480 294 Inslab 6 52.26 0.15 13 K-KIK 18 19650 285 Inslab 6.2 79.79 0.14 10 K-KIK 19 Tokachi-oki,
Japan 6306 148 Inslab 6.8 58.31 0.41 33 K-KIK
20 6267 141 Inslab 6.8 46.89 0.39 25 K-KIK 21
Tokachi-oki, Japan
19085 276 Interface 7 76.98 0.66 24.60 K-KIK 22 19004 276 Interface 7 93.02 0.34 20.18 K-KIK 23 11026 194 Interface 7.9 119.95 0.56 36.6 K-KIK 24 11025 194 Interface 7.9 62.65 0.38 60.15 K-KIK 25 21598 301 Interface 7.1 97.14 0.38 13.28 K-KIK 26
Tohuku, Japan
169 - Interface 9 83.70 1.75 7.090 K-KIK 27 175 - Interface 9 71 0.96 44.43 K-KIK 28 237 - Interface 9 69.14 0.90 56.84 K-KIK 29 323 - Interface 9 62.49 0.67 27.09 K-KIK 30 168 - Interface 9 66.35 0.62 28.47 K-KIK
8.6 Fragility Analysis of Different SMA-RC Bridge Piers
This section describes the development of PSDMs, characterization of damage states,
and fragility curve generation for different SMA-RC bridge piers considering two different
demand parameters. The developed PSDMs and fragility curves are used to examine the impact
of different SMA properties on the seismic demand and to estimate the relative vulnerability
of different SMA-RC bridge piers.
149

8.6.1 Probabilistic seismic demand model
Selection of an appropriate intensity measure (IM) and an effective engineering demand
parameter (EDP) is one of the most challenging tasks for probabilistic seismic performance
and vulnerability assessment of structures as it dictates the reliability of the vulnerability
assessment. An appropriate EDP selection is a function of the structural system and desired
performance objectives (Zhang and Zirakian 2015). In this study, maximum drift (MD) of the
bridge pier, which represents different performance-based limit states, is considered as one of
the EDPs. A review of recent literature (Lee and Billington 2011, Billah and Alam 2014c)
revealed that residual drift (RD) should be considered as an EDP to fully characterize the
seismic performance of structures in light of the performance-based earthquake engineering.
Accordingly, this study considered residual drift as the second EDP for the comparative
seismic vulnerability assessment of different SMA-RC bridge piers. Selection and definition
of an appropriate IM has been a debatable issue among the researchers. Some researchers
suggested acceleration based IMs such as PGA (Padgett and DesRoches 2008) or spectral
acceleration at the first mode (Sa-T1) (Mackie and Stojadinovic 2005) while other suggest
velocity based IMs (e.g. peak ground velocity, PGV, and spectrum intensity, SI) (Bradley et
al. 2009). Because of the efficiency, practicality, sufficiency, and hazard computability of
PGA, many researchers (Padgett and DesRoches 2008, Billah et al. 2013) have suggested PGA
as the optimal intensity measure for fragility assessment of bridges and bridge piers.
Accordingly, for the purpose of this study, PGA is selected as the optimal IM.
Incremental Dynamic Analyses (IDAs) are performed using the selected 30 earthquake
records for the five different SMA-RC bridge piers. The maximum drift and the residual drift
monitored from IDA are incorporated into a PSDM which establishes a linear regression of
demand (EDP)–intensity measure (IM) pairs in the log-transformed space. This linear
regression model is used to determine the slope, intercept, and dispersion of the EDP-IM
relationship. Figure 8.5 shows the PSDMs of different SMA-RC piers in terms of maximum
drift. Each figure also depicts the corresponding linear regression equation and R2 value. From
Figure 8.5, it is evident that all the PSDMs have a R2 value higher that 0.7 which indicates a
strong correlation between the considered EDP and IM (MD-PGA). Similarly, the PSDMs for
different SMA-RC bridge piers in terms of residual drift is shown in Figure 8.6. The R2 values
shown in these figures also reveal a strong correlation between this EDP-IM pair (RD-PGA).
150
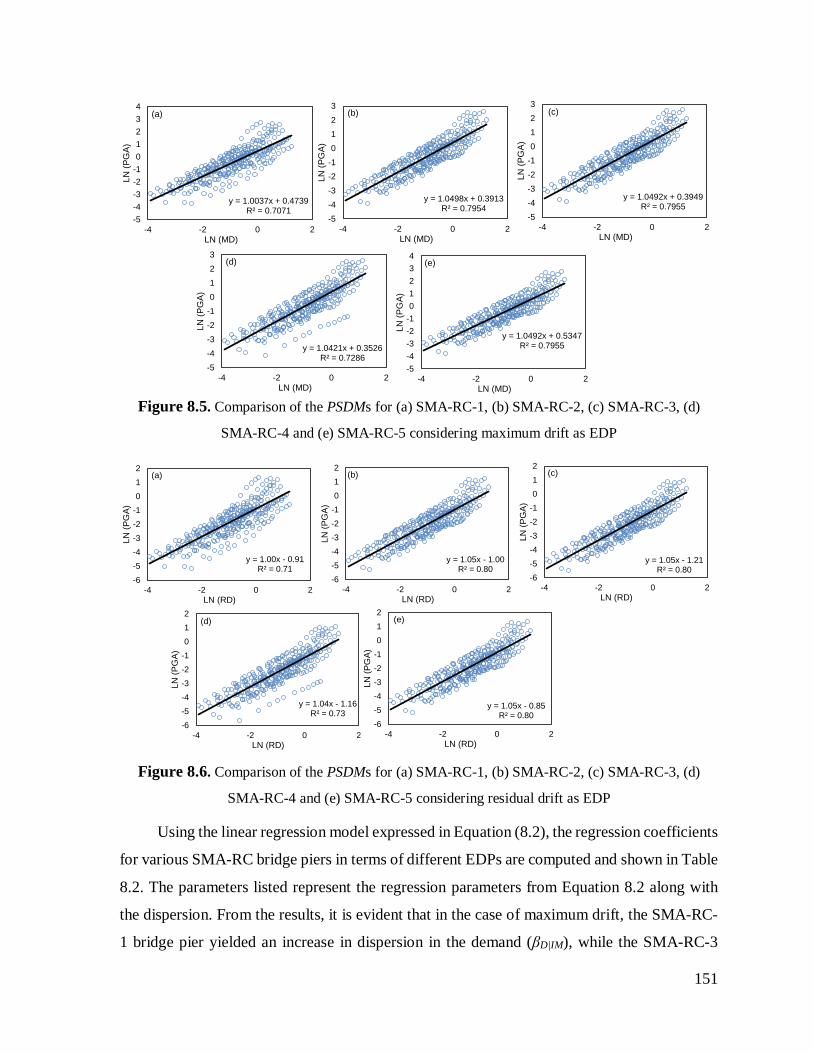
Figure 8.5. Comparison of the PSDMs for (a) SMA-RC-1, (b) SMA-RC-2, (c) SMA-RC-3, (d)
SMA-RC-4 and (e) SMA-RC-5 considering maximum drift as EDP
Figure 8.6. Comparison of the PSDMs for (a) SMA-RC-1, (b) SMA-RC-2, (c) SMA-RC-3, (d)
SMA-RC-4 and (e) SMA-RC-5 considering residual drift as EDP
Using the linear regression model expressed in Equation (8.2), the regression coefficients
for various SMA-RC bridge piers in terms of different EDPs are computed and shown in Table
8.2. The parameters listed represent the regression parameters from Equation 8.2 along with
the dispersion. From the results, it is evident that in the case of maximum drift, the SMA-RC-
1 bridge pier yielded an increase in dispersion in the demand (βD|IM), while the SMA-RC-3
y = 1.0037x + 0.4739R² = 0.7071
-5-4-3-2-101234
-4 -2 0 2
LN (P
GA)
LN (MD)
(a)
y = 1.0498x + 0.3913R² = 0.7954
-5-4-3-2-10123
-4 -2 0 2
LN (P
GA)
LN (MD)
(b)
y = 1.0492x + 0.3949R² = 0.7955
-5-4-3-2-10123
-4 -2 0 2
LN (P
GA)
LN (MD)
(c)
y = 1.0421x + 0.3526R² = 0.7286
-5-4-3-2-10123
-4 -2 0 2
LN (P
GA)
LN (MD)
(d)
y = 1.0492x + 0.5347R² = 0.7955
-5-4-3-2-101234
-4 -2 0 2
LN (P
GA)
LN (MD)
(e)
y = 1.00x - 0.91R² = 0.71
-6-5-4-3-2-1012
-4 -2 0 2
LN (P
GA)
LN (RD)
(a)
y = 1.05x - 1.00R² = 0.80
-6-5-4-3-2-1012
-4 -2 0 2
LN (P
GA)
LN (RD)
(b)
y = 1.05x - 1.21R² = 0.80
-6-5-4-3-2-1012
-4 -2 0 2
LN (P
GA)
LN (RD)
(c)
y = 1.04x - 1.16R² = 0.73
-6-5-4-3-2-1012
-4 -2 0 2
LN (P
GA)
LN (RD)
(d)
y = 1.05x - 0.85R² = 0.80
-6-5-4-3-2-1012
-4 -2 0 2
LN (P
GA)
LN (RD)
(e)
151
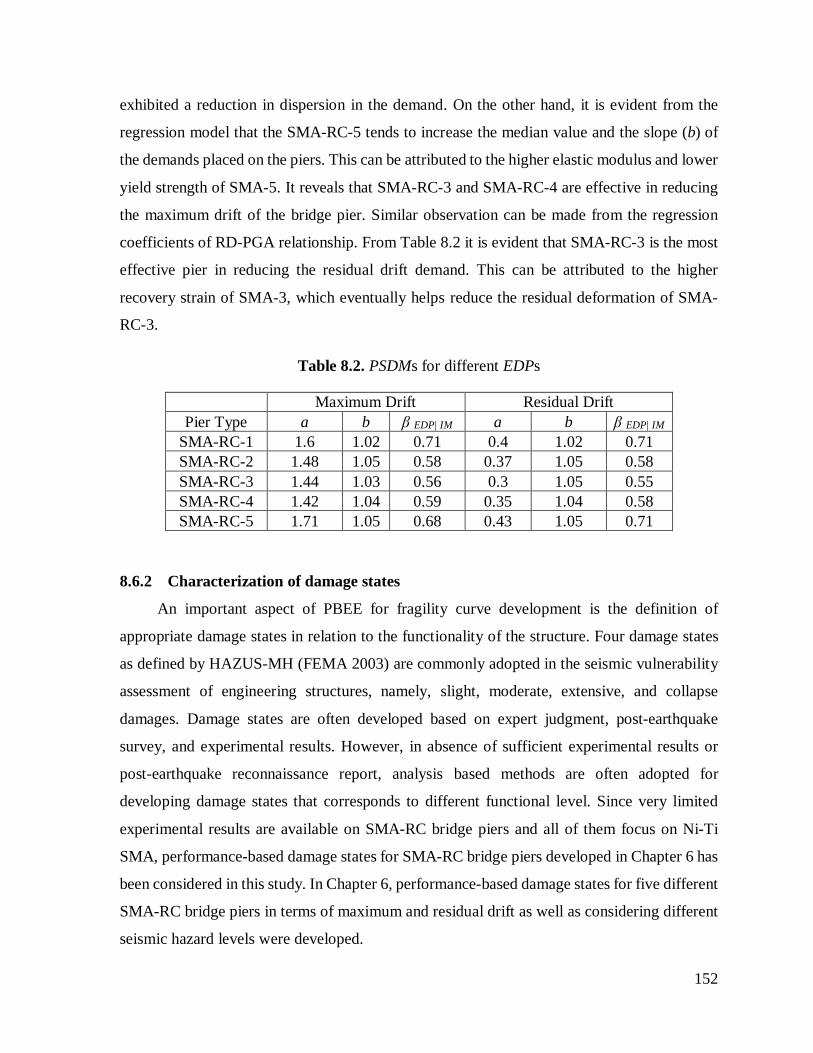
exhibited a reduction in dispersion in the demand. On the other hand, it is evident from the
regression model that the SMA-RC-5 tends to increase the median value and the slope (b) of
the demands placed on the piers. This can be attributed to the higher elastic modulus and lower
yield strength of SMA-5. It reveals that SMA-RC-3 and SMA-RC-4 are effective in reducing
the maximum drift of the bridge pier. Similar observation can be made from the regression
coefficients of RD-PGA relationship. From Table 8.2 it is evident that SMA-RC-3 is the most
effective pier in reducing the residual drift demand. This can be attributed to the higher
recovery strain of SMA-3, which eventually helps reduce the residual deformation of SMA-
RC-3.
Table 8.2. PSDMs for different EDPs
Maximum Drift Residual Drift Pier Type a b β EDP| IM a b β EDP| IM
SMA-RC-1 1.6 1.02 0.71 0.4 1.02 0.71 SMA-RC-2 1.48 1.05 0.58 0.37 1.05 0.58 SMA-RC-3 1.44 1.03 0.56 0.3 1.05 0.55 SMA-RC-4 1.42 1.04 0.59 0.35 1.04 0.58 SMA-RC-5 1.71 1.05 0.68 0.43 1.05 0.71
8.6.2 Characterization of damage states
An important aspect of PBEE for fragility curve development is the definition of
appropriate damage states in relation to the functionality of the structure. Four damage states
as defined by HAZUS-MH (FEMA 2003) are commonly adopted in the seismic vulnerability
assessment of engineering structures, namely, slight, moderate, extensive, and collapse
damages. Damage states are often developed based on expert judgment, post-earthquake
survey, and experimental results. However, in absence of sufficient experimental results or
post-earthquake reconnaissance report, analysis based methods are often adopted for
developing damage states that corresponds to different functional level. Since very limited
experimental results are available on SMA-RC bridge piers and all of them focus on Ni-Ti
SMA, performance-based damage states for SMA-RC bridge piers developed in Chapter 6 has
been considered in this study. In Chapter 6, performance-based damage states for five different
SMA-RC bridge piers in terms of maximum and residual drift as well as considering different
seismic hazard levels were developed.
152

As indicated by the closed form of fragility function in Equation 8.4, a reliable capacity
limit state model is required for developing dependable fragility curves. For the selected
demand parameters, each limit state model is assumed to follow a two-parameter lognormal
distribution (median SC and dispersion βC). Table 8.3 lists parameter values used to define the
limit state models on the basis of the maximum drift (%) and residual drift (%). The component
limit states developed in Chapter 6 has been used in this chapter. Since the previous chapter
(Chapter 6) only provides the median values (SC), a prescriptive approach described by Nielson
(2005) is followed to define dispersions of limit state models (βC). The dispersion values are
calculated using the following equation provided by Nielson (2005).
( )21ln COVc +=β (8.9)
In this equation the COV values for different limit states are calculated based on the
probabilistic distribution of different limit states described in Chapter 6. The COV values were
found to be 0.21, 0.26, 0.45 and 0.52 for DS-1, DS-2, DS-3 and DS-4, respectively. These
values yielded in similar dispersion values (βC) as described by other researchers (Nielson
2005).
Table 8.3. Limit state capacity of SMA-RC bridge pier in terms of maximum and residual
drift
Damage
state
Maximum Drift SMA-RC-
1 SMA-RC-
2 SMA-RC-
3 SMA-RC-
4 SMA-RC-
5 Sc βc Sc βc Sc βc Sc βc Sc βc
DS-1 0.28 0.21 0.30 0.21 0.28 0.21 0.28 0.21 0.28 0.21 DS-2 1.68 0.26 1.66 0.26 2.28 0.26 1.74 0.26 1.10 0.26 DS-3 2.66 0.43 2.69 0.43 1.64 0.43 2.52 0.43 1.97 0.43 DS-4 5.05 0.50 5.51 0.50 7.65 0.50 5.56 0.50 4.73 0.50
Residual Drift Sc βc Sc βc Sc βc Sc βc Sc βc
DS-1 0.33 0.21 0.33 0.21 0.33 0.21 0.33 0.21 0.33 0.21
DS-2 0.62 0.26 0.62 0.26 0.62 0.26 0.62 0.26 0.62 0.26
DS-3 0.87 0.43 0.87 0.43 0.87 0.43 0.87 0.43 0.87 0.43
DS-4 1.22 0.50 1.22 0.50 1.22 0.50 1.22 0.50 1.22 0.50
153

8.6.3 Fragility Curves
Using the linear PSDMs developed in previous section and limit state models presented
in Table 8.3, fragility curves are developed for different SMA-RC bridge piers for each EDP
using the closed form of fragility function shown in Equation 8.4. Fragility curves for the two
different EDPs are shown in Figure 8.7 and Figure 8.8. The relative vulnerability of different
SMA-RC bridge piers are compared in terms of reducing their probability of entering into
different damage states. Fragility curves for different SMA-RC piers considering different
EDPs are also compared by evaluating the relative change in the median value of the fragility
curves.
Figure 8.7. Fragility curves for the five SMA-RC bridge piers for: (a) slight, (b) moderate,
(c) extensive and (d) collapse damage state considering maximum drift
0
0.2
0.4
0.6
0.8
1
0 0.5 1 1.5 2
P [Y
ield
ing
I PG
A]
PGA (g)
(b)
0
0.2
0.4
0.6
0.8
1
0 0.5 1 1.5 2
P [S
pallin
g I P
GA]
PGA (g)
(c)
0
0.2
0.4
0.6
0.8
1
0 0.5 1 1.5 2
P [C
rush
ingI
PG
A]
PGA (g)
(d)
0
0.2
0.4
0.6
0.8
1
0 0.5 1 1.5 2
P [C
rack
ing
I PG
A]
PGA (g)
(a)
154

The evaluation of the fragility curves offered a valuable insight on the performance of
different SMAs in reducing the probability of damage considering the maximum drift. Figure
8.7 presents the fragility curves of the five bridge piers considering maximum drift as the EDP.
From Figure 8.7a it is evident that all the piers have similar probability of cracking damage
irrespective of the intensity level. However, the effect of different SMAs is more pronounced
in the other damage states. As depicted in Figure 8.7b, SMA-RC-5 is more likely to experience
yielding at a lower intensity while SMA-RC-3 showed much better performance as it showed
only 47% probability of yielding even at a PGA of 2g. This can be attributed to the very high
yield strength of SMA-3 as compared to other SMAs. However, an interesting behavior is
observed in spalling damage state where SMA-RC-3 has the highest probability of damage and
SMA-RC-2 has the lowest. This can be attributed to the capacity limit states of spalling damage
state considered in this study where SMA-RC-3 has the lowest drift limit before entering the
spalling damage state. In general, all the SMA-RC piers show better performance at collapse/
crushing damage state as evident from the probability of collapse at maximum considered
earthquake (MCE) level, which usually corresponds to 2% probability of exceedance in 50
years (PGA 0.46g), which is only 0.5%, 0.1%, 0.08%, 0.3%, and 0.8% for SMA-RC-1, SMA-
RC-2, SMA-RC-3, SMA-RC-4, and SMA-RC-5, respectively.
Plots of the fragility curves for the bridge piers for residual drift as the EDP are shown
in Figure 8.8, and illustrate the relative vulnerability of the five bridge piers over a range of
earthquake intensities and damage states. Unlike maximum drift fragility curves, there are
marked differences in fragilities of different bridge piers in terms of residual drift at all damage
states. Irrespective of damage states, the SMA-RC-3 showed lower probability of exceeding
certain damage level. This can be attributed to the higher recovery strain of SMA-3 which
reduced the residual drift in the bridge pier by bringing back the pier close to its original
position at the end of ground motion. Moreover, none of the bridge piers showed 50%
probability of exceeding DS-2, for which the bridge piers are designed, even at a PGA of 1g.
It also indicates that the bridge piers are performing according to the design performance
objective. As evident form Figure 8.8, the probability of collapse (DS-4) at maximum
considered earthquake (MCE) level is only 1.5%, 0.45%, 0.2%, 0.68%, and 1.4% for SMA-
RC-1, SMA-RC-2, SMA-RC-3, SMA-RC-4, and SMA-RC-5, respectively.
155

Figure 8.8. Fragility curves for the five SMA-RC bridge piers for: (a) slight, (b) moderate,
(c) extensive and (d) collapse damage state considering residual drift
The different SMA-RC bridge piers are also compared in terms of the relative change in
the median value of the fragility curves which indicates the PGA associated with a 50%
probability of reaching a certain limit state. Table 8.4 compares the median PGA for different
damage states of five different SMA-RC piers in terms of both EDPs. The median PGA in
terms of maximum drift for different bridge piers at DS-1 ranges from 0.03g to 0.05g.
However, at higher damage states, i.e. at DS-2 and DS-3, the median PGA varies over a wide
range from 0.45g-2.16g and 1.21g-3.05g for DS-2 and DS-3, respectively. On the other hand,
at DS-4, only SMA-RC-5 has a median PGA lower than 3g, while the other four SMA-RC
piers have median PGA around 3.5g and SMA-RC-3 has as high as 3.98g. This can be
0
0.2
0.4
0.6
0.8
1
0 0.5 1 1.5 2
P [D
S-1
I PG
A]
PGA (g)
(a)
0
0.2
0.4
0.6
0.8
1
0 0.5 1 1.5 2
P [D
S-2
I PG
A]
PGA (g)
(b)
0
0.2
0.4
0.6
0.8
1
0 0.5 1 1.5 2
P [D
S-3
I PG
A]
PGA (g)
(c)
0
0.2
0.4
0.6
0.8
1
0 0.5 1 1.5 2
P [D
S-4I
PG
A]
PGA (g)
(d)
156

attributed to the fact that except SMA-RC-5 all other SMA-RC piers have collapse drift limit
(DS-4) over 5% whereas the same for SMA-RC-5 is 4.73%. However, in terms of residual drift
no such big difference is observed at any damage state for different SMA-RC piers.
Table 8.4. Comparison of median PGA (g)
EDP Maximum Drift Residual Drift Damage State Damage State
Pier Type DS-1 DS-2 DS-3 DS-4 DS-1 DS-2 DS-3 DS-4 SMA-RC-1 0.031 1.113 2.880 3.502 0.357 1.440 3.486 - SMA-RC-2 0.053 1.236 3.045 3.562 0.6 1.595 3.482 - SMA-RC-3 0.056 2.16 1.208 3.980 0.882 2.310 3.781 - SMA-RC-4 0.047 1.470 3.040 3.48 0.662 1.822 3.610 - SMA-RC-5 0.037 0.456 1.325 2.88 0.456 1.234 2.695 2.88
8.7 Seismic Demand Hazard of Different SMA-RC Bridge Piers
In order to fully implement the performance-based earthquake engineering (PBEE)
methodology for SMA-RC bridge pier, it is necessary to conduct the probabilistic seismic
demand analysis (PSDA) in terms of annual rate of exceeding some structural demand
parameter such as maximum drift or residual drift. In this study, the annual rate of exceeding
various levels of demand for the five considered SMA-RC piers are estimated by aggregating
the EDP|IM relationship obtained from seismic response analysis with the seismic hazard
curve. Using the convolution integral presented in Equation 8.7, the demand hazard curves for
five different SMA-RC bridge piers are developed in terms of maximum and residual drift.
Figure 8.9 a and b show the maximum drift and residual drift hazard curves for five
SMA-RC bridge piers, respectively. The residual drift hazard curves depict the annual
probability of exceeding different damage states for different SMA-RC piers (shown with
vertical dashed lines). It should be noted that, the same type of results for different damage
states are not presented for the maximum drift since different maximum drift limits were
considered for different SMA-RC piers. The probability of collapse (probability of exceeding
DS-4) of each bridge pier in terms of maximum drift are summarized in Table 8.5. Here, DS-
4 is selected to compare the probability of collapse of different SMA-RC piers. Results show
that all the bridge piers have very low probability of collapse while the SMA-RC-3 has the
lowest probability of 1.27%. Among the five different SMA-RC piers, SMA-RC-5 has the
157

highest probability of collapse which is 31%, 1%, 33% and 23% higher that that of SMA-RC-
1, SMA-RC-2, SMA-RC-3 and SMA-RC-4, respectively. This is due to SMA-5’s very low
yield strength to elastic modulus ratio (0.0033), which reduced the drift capacity of SMA-RC-
5. The probability of exceeding DS-2 in terms of residual drfit are presented in Table 8.6.
Here, the probability of residual drift exceeding DS-2 is presented since all the bridge piers
were designed considering a target residual drift of 0.6% which is the limitng value of DS-2.
A comparison of the five bridge piers in terms of exceeding DS-2 reveals that SMA-RC-3 has
the lowest probablity of exceeding DS-2 in 100 years which is only 2.84%. On the other hand,
SMA-RC-5 resulted in highest annual rate of exceeding DS-2 which is 6.53%. A closer look
into the annual rate of excceding DS-2 for different SMA-RC bridge pier shows that the annual
rate of exceedance is influenced by the superelastic strain of the SMA rebar.
Figure 8.9. Hazard curves for five SMA-RC bridge piers (a) maximum drift and (b) residual
drift
Estimating the loss-hazard relationship is another integral part of PBEE which can be
considered as the ultimate measure of seismic performance for decision making. However, the
commercial availability of the Cu-based and Fe-based SMAs are very limited and adequate
information on their costing is not available. As a result, the comparative seismic loss
estimation of different SMA-RC bridge piers was not conducted in this study.
1.E-04
1.E-03
1.E-02
1.E-01
1.E+00
0 2 4 6 8 10
Annu
al ra
te o
f exc
eeda
nce
Maximum Drift (%)
SMA-RC-1SMA-RC-2SMA-RC-3SMA-RC-4SMA-RC-5
(a)
1.E-04
1.E-03
1.E-02
1.E-01
1.E+00
0 0.5 1 1.5 2 2.5
Annu
al ra
te o
f exc
eeda
nce
Residual Drift (%)
SMA-RC-1SMA-RC-2SMA-RC-3SMA-RC-4SMA-RC-5
DS-
4
DS-
3DS-
2
DS-
1
(b)
158

Table 8.5. Annual rate and probability of collapse (DS-4) in terms of maximum drift
SMA-RC-1 SMA-RC-2 SMA-RC-3 SMA-RC-4 SMA-RC-5 Annual rate of DS-4 1.31E-04 1.88E-04 1.27E-04 1.46E-04 1.90E-04
Prob. Of DS-4 in 100 years 1.31% 1.88% 1.27% 1.46% 1.90%
Table 8.6. Annual rate and probability of DS-2 in terms of residual drift
SMA-RC-1 SMA-RC-2 SMA-RC-3 SMA-RC-4 SMA-RC-5 Annual rate of DS-2 5.35E-04 3.98E-04 2.84E-04 3.39E-04 6.53E-04
Prob. Of DS-2 in 100 years 5.35% 3.98% 2.84% 3.39% 6.53%
8.8 Summary
Shape memory alloy (SMA) has emerged as an alternative to conventional steel
reinforcement for improving the seismic performance of bridges during an extreme earthquake.
This chapter presents the probabilistic seismic risk assessment of concrete bridge piers
reinforced with different types of SMA (e.g. Ni-Ti, Cu-Al-Mn, and Fe-based) rebars. To
achieve this objective, the bridge piers are designed following a performance-based approach.
Ground motions with different probable earthquake hazard scenarios at the site of the bridge
piers are considered. Probabilistic seismic demand models are generated using the response
parameters obtained from incremental dynamic analysis. Considering maximum drift and
residual drift as demand parameters, fragility curves are developed for five different SMA-RC
bridge piers. Finally, seismic hazard curves are generated in order to compare the mean annual
rate of exceedance of different damage states of different bridge piers. It is observed that all
the bridge piers perform according to the design objective, and the performance of SMA-RC
piers is significantly affected by the type of SMA used. The results show that all the SMA-RC
piers have very low probability of collapse at maximum considered earthquake level. It is
found that the bridge pier reinforced with FeNCATB-SMA (SMA-3) performed better as
compared to the other SMA-RC piers.
159

CHAPTER 9. SUMMARY, CONCLUSIONS AND FUTURE WORKS
9.1 Summary
This thesis presented a comprehensive summary of the existing applications of shape
memory alloys in bridge engineering along with the future of smart bridges using SMA. This
study provides an insight into the current applications of SMA in the bridge engineering field.
This thesis also presented a review of the different methodologies developed for seismic
fragility assessment of highway bridges along with their features, limitations, and applications.
This study presented a review of available methodologies and identifies opportunities for
future development. This study mainly focused on the key features of different methods and
applications rather than penetrating down to a critique of the associated analysis procedure or
mathematical framework.
This research was aimed at developing a performance-based seismic design guideline for
concrete bridge piers reinforced with different types of superelastic shape memory alloy rebar.
As a first step, this research experimentally investigated the bond behavior of SMA rebar with
concrete. This study also experimented ways to improve the bond behavior of smooth SMA
rebar using different types of sand coating. Finally, empirical equation based on statistical
analyses is presented to predict the maximum average bond strength. The proposed equation
appear to be reasonable for calculating the average bond strength of SMA reinforcing bars in
concrete. As a next step, this research developed an analytical expression for plastic hinge
length of SMA-RC bridge piers using well calibrated finite element models. A parametric
study was performed to investigate the effect of different parameters on the plastic hinge
length, including axial load ratio, aspect ratio, concrete strength, SMA properties, longitudinal
and transverse reinforcement ratio. Multivariate regression analysis was performed to develop
an expression to estimate the plastic hinge length in SMA-RC bridge pier and compared with
existing plastic hinge length equations. The proposed equation was verified against test results
which showed reasonable accuracy.
In the next step, this research developed performance-based damage states for shape
memory alloy (SMA) reinforced concrete bridge piers considering different types of SMAs
and seismic hazard scenarios. Based on extensive numerical study, this study also proposed
160

maximum and residual drift based damage states for SMA-RC pier. Finally, an analytical
expression is proposed to estimate the residual drift of SMA reinforced concrete elements as a
function of the expected maximum drift and superelastic strain of SMA. Comparison with
experimental results revealed that the proposed equation could very well predict the residual
drift obtained from the experimental results. Based on the developed performance-based
damage states, a sequential procedure for the performance-based design of SMA-RC bridge
pier is presented. This study also developed damping-ductility relationship for different SMA-
RC bridge piers. Using the proposed design framework a trial SMA-RC bridge pier was
designed and analyzed using a suite of selected earthquake records. The nonlinear analyses
showed that the designed pier behave according to design expectations and provided very
promising results in terms of the effectiveness and applicability of the proposed design method.
Finally, a comprehensive probabilistic seismic risk of assessment of different SMA-RC
bridge piers was conducted with the aim of evaluating the performance of the SMA-RC bridge
piers in light of performance-based earthquake engineering. Considering maximum drift and
residual drift as demand parameters, fragility curves were developed for five different SMA-
RC bridge piers. Finally, seismic hazard curves were generated in order to compare the mean
annual rate of exceedance of different damage states of different bridge piers. It was found that
all the bridge piers performed according to the design objective. The results showed that all
the SMA-RC piers have very low probability of collapse at maximum considered earthquake
level.
9.2 Core Contributions
The outcomes of this research work is expected to initiate practical application of shape
memory alloys in bridge engineering especially in bridge piers in seismically active regions.
The core contributions of this study are:
• Development of plastic hinge length expression for SMA-RC bridge piers.
• Prediction of residual drift of SMA-RC elements using maximum drift and superelastic
strain of SMA.
• Development of a performance-based seismic design guideline for SMA-RC bridge
pier.
• Bond behavior of smooth and sand coated SMA rebar in concrete.
161

9.3 Conclusions
9.3.1 Bond behavior of smooth and sand coated SMA rebar in concrete
This study investigated the bond behaviour of smooth and sand coated shape memory
alloy bars in concrete. Experimental investigations were carried out using pushout tests to
investigate the influence of concrete strength, bar diameter, concrete cover, embedment length,
and surface condition on the bond strength of SMA rebar. The results from 56 pushout tests
lead to the following conclusions:
• The stress-slip curve of SMA rebar can be divided/idealized into four stages: elastic
stage, ascending stage, linearly descending stage and residual stage.
• The surface roughness of SMA rebar significantly affects the failure pattern as well
as the bond strength. Concrete with smooth SMA rebars resulted in simple pushout
failure whereas sand coated rebars resulted in splitting failure.
• The bond strength of both smooth and sand coated SMA rebar is significantly
influenced by the concrete strength, bar diameter and embedment length but is
independent of concrete cover.
• The application of sand coating increased the bond strength between concrete and
SMA rebar by developing friction and interlocking forces in addition to the adhesion
mechanism. The coarser the sand size, the more is the improvement in bond strength.
• A new bond stress prediction equation is proposed for SMA rebar based on the
experimental study for different strengths of concrete, bar diameters, surface
condition and embedment length. The proposed equation is in good agreement with
the experimental results.
9.3.2 Plastic hinge length of SMA-RC bridge pier
This study proposed a new expression for estimating the plastic hinge length in SMA-
RC bridge pier. The finite element model was validated with different experimental results to
ensure the accuracy of the adopted modeling technique. A parametric study was conducted to
evaluate the effect of different factors on the plastic hinge length of an SMA-RC bridge pier.
A multivariate regression analysis was performed to develop the proposed plastic hinge
expression. The proposed equation was verified against test results of SMA-RC piers to check
its accuracy. The accuracy of the proposed equation in predicting the drift capacity of SMA-
162

RC pier was validated against test result and compared with other plastic hinge expressions.
Based on the analysis results, the following conclusions are drawn:
• The effect of different parameters are more pronounced when plastic hinge length is
estimated in terms of longitudinal rebar strain profile as opposed to the curvature
profile.
• Compressive strain profile of longitudinal rebar provides a better estimate of plastic
hinge length as compared to the curvature profile of SMA-RC bridge pier.
• Plastic hinge length of SMA-RC pier increases as the axial load, aspect ratio and the
yield strength of SMA rebar increases. On the contrary, plastic hinge length decreases
with an increase in concrete compressive strength and the ratio of longitudinal and
transverse reinforcement.
• The proposed equation showed reasonable accuracy in predicting the plastic hinge
length measured from experimental investigations. The proposed equation predicted
the experimental plastic hinge lengths with a COV of only 6%.
• The ultimate drift capacity of SMA-RC bridge pier can be predicted with reasonable
accuracy using the proposed plastic hinge length equation as compared to other
existing expressions.
9.3.3 Performance-based seismic design of Shape Memory Alloy reinforced concrete
bridge pier
In order to develop a performance-based design guideline for SMA-RC bridge pier,
structural performance objectives and their corresponding limit state criteria must be clearly
defined. Due to the significant differences in the behavior of SMA reinforced bridge piers as
compared to conventional piers, damage states for typical bridge piers may not be applicable
for SMA-RC bridge piers. In this study, a set of performance-based damage states for bridge
piers reinforced with five different types of SMAs were developed in terms of both maximum
and residual drift. Using an IDA-based approach, this study proposed performance-based drift
levels for different damage states considering three different hazard levels. To predict the
residual deformation of SMA-RC bridge pier, a relationship between maximum drift, residual
drift, and superelastic strain of SMA was developed. The prediction equation was validated
163

against experimental observations from SMA reinforced concrete members. Based on the
results of this study, the following major conclusions can be drawn:
• The progression of damage was similar for all the RC bridge piers reinforced with
different SMAs (except for SMA-RC-3): concrete cracking, longitudinal
reinforcement yielding, cover spalling, and core crushing. For all SMA-RC bridge
piers cracking occurred at the same level of drift (due to same cross-section) while
the drift at other performance levels varied based on the mechanical properties of
SMA used.
• Different performance-based drift limits, i.e. cracking, spalling, yielding, and
crushing of SMA-RC bridge pier strongly follow uniform, normal, log-normal, and
gamma distribution, respectively. These distributions can be used for selecting the
target drift levels for performance-based design of SMA-RC pier.
• Except for DS-1(cracking), other three damage states are significantly influenced by
the type of SMA used. For DS-2 (yielding), the limiting maximum drift varies from
1.18% (SMA-5) to 2.28% (SMA-3) and for DS-3 (spalling), the limiting maximum
drift varies from 1.64% (SMA-3) to 2.69% (SMA-2) for hazard level corresponding
to 2475 years return period.
• In terms of maximum drift, consideration of different hazard levels does not have any
significant impact on DS-1 and DS-2. On the other hand, different hazard levels have
substantial impacts on DS-3 and DS-4.
• The proposed residual drift limit states tend to decrease with increased probability of
occurrence (decreased return period). The damage states developed in terms of
residual drift correlate well with damage observed from experimental studies.
• Residual drift can be expressed as a function of maximum drift and the superelastic
strain of SMA rebar.
• Based on the residual drift responses of all the SMA-RC piers under different levels
of ground motions, a prediction equation was developed to predict the residual drift
response of an SMA-RC bridge pier. The proposed equation can correlate very well
with experimental observations.
164

• The proposed equation can be used for predicting the residual drift of SMA-RC bridge
pier when designing the pier for a target residual drift. Based on the maximum drift
and residual drift the designer would be able to select an SMA with the required
superelastic strain, thereby ensuring the safety of bridges under extreme earthquake
event.
Based on the developed performance-based damage states, this study proposed a new
residual drift based design method for shape memory alloy reinforced concrete bridge pier.
The approach outlined in this study is a comprehensive approach for performance-based design
of SMA-RC bridge pier. This study developed necessary design equations and graphs for
PBSD of SMA-RC bridge pier. The proposed method provides the owner to select expected
performance of the bridge pier and allows the designer/engineer to select multiple hazard and
performance expectation combinations. Following the DDBD guidelines of Priestley et al.
(2007) this study developed a new design method and damping-ductility relation of SMA-RC
bridge pier which is a key step for performance-based design. In contrast to the conventional
DDBD approach, the proposed procedure anticipates a target residual drift based on the
expected performance during design earthquake, calculates the maximum drift demand and
ensures that those drift demands (maximum and residual) remain below acceptable limits for
the design level earthquakes. The performance of the bridge pier was validated using NLTHA,
and the maximum and residual drifts at the design level earthquakes were found to satisfy the
performance expectations. The design procedure developed in this study is expected to meet
engineers’ requirements for a robust and easy to apply performance-based design methodology
for SMA reinforced bridge piers in seismic regions.
9.3.4 Probabilistic seismic risk assessment of SMA-RC bridge piers
This study conducted a probabilistic performance-based risk assessment of five SMA-
RC bridge piers when subjected to three different earthquake scenarios (crustal, inslab and
interface) that significantly contribute to the seismic hazard of Vancouver. The piers were
designed following a performance-based design guidelines developed in this research. In order
to ensure a comprehensive seismic performance and risk assessment, this study developed
maximum and residual drift hazard curves and fragility curves for different SMA-RC bridge
piers. The influence of application of different SMAs and their properties in the seismic hazard
165

curve was also investigated. Based on the results obtained from the risk assessment, the
following conclusions are drawn:
• The EDPs considered in this study, i.e., maximum drift and residual drift, are shown
to be well correlated with the intensity measure (PGA) considered in this study which
provided a basis for a reliable probabilistic seismic risk assessment.
• Mechanical properties of different shape memory alloys, specifically the recovery
strain, significantly affects the seismic fragility and risk of SMA reinforced concrete
bridge piers in terms of both residual and maximum drift.
• In general, all the SMA-RC bridge piers met the design objectives in terms of residual
drift. Although, the bridge piers were designed following the design spectra
corresponding to 2% in 50 years probability of exceedance, the bridge piers performed
satisfactorily under the considered three different earthquake scenarios (crustal, inslab
and interface).
• All the SMA-RC bridge piers, in general, are quite effective in controlling the seismic
response and reducing the vulnerability which is exhibited by the low probability (less
than 1%) of collapse in terms of maximum drift at the maximum considered
earthquake level.
• In terms of residual drift, SMA-RC-3 outperformed all other SMA-RC bridge piers at
all damage states and significantly reduced the overall vulnerability of the bridge pier.
This can be attributed to the higher superelastic strain and low residual strain of SMA-
3.
• Comparing maximum and residual drift hazard curves for different SMA-RC piers
revealed that in both cases SMA-RC-5 has the highest probability of exceeding DS-4
and DS-2 as it was evident from the mean annual rate of exceedance which is 1.90 ×
10-4 and 6.53 × 10⁻⁴, for maximum and residual drift, respectively.
• From the hazard analysis of different SMA-RC bridge piers, it is expected that the
SMA-RC bridge piers will incur a lower annual loss and will provide significant
financial benefit in the long run since these SMA-RC piers showed very low
probability of damage. However, a detailed loss estimation needs to be carried out
before highlighting the potential financial benefit of SMA-RC piers.
166

9.4 Recommendation for Future works
The present study only considered pushout tests for investigating the bond behavior of
SMA rebar in concrete. Further study need to be conducted considering SMA reinforced beams
with and without lateral reinforcement. Further study needs to be carried out considering
different types of SMA rebar to develop a more comprehensive bond-slip relationship for SMA
rebar in concrete.
In this research, the performance-based design for SMA-RC bridge piers has been
demonstrated which is limited to flexure dominated columns. However, further studies need
to be conducted combining different factors that influence the bridge seismic performance, in
particular for the shear critical bridge piers. Moreover, the design procedure for the bridge as
a system including soil structure interaction needs to be developed. However, since the
application of SMA in real life application remains a challenge, development of low cost SMAs
along with simplified design procedure will pave the way towards widespread application of
SMA in practical applications. Further experimental investigations of SMA-RC bridge piers,
designed following the proposed guideline, under unidirectional and bidirectional seismic
loading are required to provide a solid, reliable, and valid conclusion regarding the
applicability of the proposed guideline. Since the behavior of SMA is also temperature
dependent, future studies should also focus on the effect of temperature changes on the seismic
response of SMA-RC piers.
The present research assessed the seismic risk of SMA-RC bridge piers without
considering material and geometric uncertainties and soil foundation interaction. Incorporating
such effects and considering a bridge as a system will shed light on additional issues and are
likely to change the dynamics of the response of the entire bridge structure. In future, it will be
of great interest to investigate the response of whole bridge by considering different SMAs.
Moreover, performing further study considering the construction, repair, and maintenance cost
of SMA-reinforced bridge, as well as comparing the smart bridge with a conventional bridge
along with the development of a loss-hazard relationship will shed more light on the potential
economic benefit of this smart bridge system.
To date, researchers have identified many potential applications of SMA in bridge
engineering which are mainly focused on using SMA as a supplementary reinforcement or
167

materials in different bridge components but less on the design perspective. Researchers have
shown that SMA can be effectively used in not only for developing smart bridges but also for
generating a resilient and damage tolerant highway infrastructure system. Although research
in SMA related material science has advanced a lot, its application in structural engineering is
still limited because of the high cost of SMA and lack of adequate knowledge and interest
among the practitioners. In particular, for bridge engineering application, SMA based devices
and reinforcement can reduce the overall life cycle cost of the bridge. However, research on
smart bridges must concentrate on ensuring that these ‘smart’ devices or reinforcements are
compatible with the current industry practice and adequate guidelines are available for
practitioners. According to the author, following actions need to be taken to increase the
application of SMA in structural as well as in bridge engineering sector:
• An integrated effort by the material scientists and structural engineers to ensure a
considerable progress in application of SMAs in bridge engineering.
• Development of an efficient and comprehensive database of SMA properties for
knowledge sharing that can be used for designing SMA based structural components.
• More concerted effort is required to develop low cost SMAs with excellent
superelastcity, high elastic modulus and superior fatigue performance.
• Research should be carried out to find ways for modifying the smooth surface of SMA
rebars which affects the bond behavior with concrete.
• Development of new compositions of SMAs and hybridization of SMA with other
smart materials.
• Development of more refined, robust and easy to use computational model of SMA
for analysis and design process.
168

REFERENCES
Abrahamson, N.A. (1992). Non-stationary spectral matching. Seismological Research Letters,
63(1):30.
ACI Committee 408. (2003). Bond and development of straight reinforcing bars in tension
(ACI 408R-03). American Concrete Institute, Farmington Hills, Mich.
ACI Committee 318. (2011). Building code requirements for structural concrete (ACI 308-11).
American Concrete Institute, Farmington Hills, Mich., 503 pp.
ACI Committee 440. (2006). Guide for the design and construction of structural concrete
reinforced with FRP bars (ACI 440.1R-06). American Concrete Institute, Farmington
Hills, Mich.
Adachi, Y. and Unjoh, S. (1999). Development of shape memory alloy damper for intelligent
bridge systems. Proc. SPIE Int. Soc. Opt. Eng., 3671, 31–42.
Agrawal, A.K., Ghosn, M., Alampalli, S. and Pan, Y. (2012). Seismic fragility of retrofitted
multi-span continuous steel bridges in New York. ASCE Journal of Bridge Engineering,
17(4): 562-575.
Akbari, R. (2012) Seismic fragility analysis of reinforced concrete continuous span bridges
with irregular configuration, Structure and Infrastructure Engineering: Maintenance,
Management, Life-Cycle Design and Performance, 8(9):873-889.
Akiyama, M., Frangopol, D.M. and Mizuno, K., (2013). Performance analysis of Tohoku-
Shinkansen viaducts affected by the 2011 Great East Japan earthquake. Structure and
Infrastructure Engineering. DOI:10.1080/15732479.2013.806559.
Alam, M.S., Youssef. M.A. and Nehdi, M. (2007). Utilizing shape memory alloys to enhance
the performance and safety of civil infrastructure: A review. Can. J. Civ. Eng., 34(9),
1075–1086.
Alam, M.S., Youssef. M.A. and Nehdi, M. (2008a). Analytical prediction of the seismic
behaviour of superelastic shape memory alloy reinforced concrete elements. Engr.
Struct., 30(12): 3399-3411.
Alam, M.S., Youssef. M.A. and Nehdi, M. (2008b). Shape memory alloy-based smart RC
bridges: overview of state-of-the-art. Smart Structures and Systems, 4(4): 3-25.
169

Alam, M.S., Youssef. M.A. and Nehdi, M. (2009). Seismic performance of concrete frame
structures reinforced with superelastic shape memory alloys. Smart Struct. and Syst.,
5(5): 565-585.
Alam, M.S., Youssef, M.A., and Nehdi, M. (2010). Exploratory investigation on mechanical
anchors for connecting SMA bars to steel or FRP bars. Mater Struct, 43: 91-107.
Alam, M.S., Bhuiyan, A.R., and Billah, A.H.M.M. (2012). Seismic fragility assessment of
SMA- bar restrained multi-span continuous highway bridge isolated with laminated
rubber bearing in medium to strong seismic risk zones. Bull. Earthq. Engr., 10(6): 1885-
1909.
Alampalli, S. and Ettouney, M. (2008). Multihazard applications in bridge management,
Transportation Research Circular, Number E-C128, Transportation Research Board,
Washington, DC.
Alemdar, J.F. (2010). Plastic hinging behavior of reinforced concrete bridge columns, PhD
Dissertation, The University of Kansas, Kansas.
Alipour, A. and Shafei, B. (2012). Performance assessment of highway bridges under
earthquake and scour effects, In: Proceedings of the 15th world conference on
earthquake engineering, 2012; Lisbon, Portugal, 10 pages.
Alipour, A., Shafei, B., and Shinozuka, M. (2013). Reliability‐based calibration of load factors
for LRF Design of reinforced concrete bridges under multiple extreme events: scour and
earthquake, ASCE Journal of Bridge Engineering, 18(5):362-371.
American Association of State Highway and Transportation Officials (AASHTO). (2011)
AASHTO Guide Specifications for LRFD Seismic Bridge Design, 2nd ed., AASHTO,
Washington, D.C.
American Association of State Highway and Transportation Officials (AASHTO), (2012).
AASHTO LRFD Bridge Design Specifications, 6th ed., AASHTO, Washington, D.C.
AmiriHormozaki, E., Pekcan G., and Itani, A. (2013). Analytical Fragility Curves for
Horizontally Curved Steel Girder Highway Bridges, Center for Civil Engineering
Earthquake Research, Report No. CCEER-13-03, University of Nevada, Reno.
Andrawes, B., Shin, M. and Wierschem, N. (2010). Active confinement of reinforced concrete
bridge columns using shape memory alloys. J. Bridge Eng. ASCE, 15:81–89.
170

Andrawes, B. and DesRoches, R. (2005). Unseating prevention for multiple frame bridges
using superelastic devices. Smart Mater. Struct. 14(3): S60–S67.
Andrawes, B. and DesRoches, R. (2007a). Comparison between shape memory alloy seismic
restrainers and other bridge retrofit devices. J. Bridge Eng. ASCE, 12(6): 700–709.
Andrawes, B. and DesRoches, R. (2007b). Effect of ambient temperature on the hinge
openings in bridges with shape memory alloy seismic restrainers. Eng. Struct. 29: 2294–
301.
Anxin, G., Qingjie, Z. and Hui, L. (2012). Experimental study of a highway bridge with shape
memory alloy restrainers focusing on the mitigation of unseating and pounding. Earthq
Eng & Eng Vib. 11: 195-204.
Araki, Y., Endo, T., Omori, T., Sutou, Y., Koetaka, Y., Kainuma, R. and Ishida, K. (2010).
Potential of superelastic Cu–Al–Mn alloy bars for seismic applications. Earthq. Eng.
Struct. Dyn., 40:107–15.
Araki, Y., Maekawa, N., Omori, T., Sutou, Y., Kainuma, R. and Ishida, K. (2012). Rate-
dependent response of superelastic Cu–Al–Mn alloy rods to tensile cyclic loads. Smart
Mater. Struct. 21 032002.
Arias, J. P. M., Vazquez, A., and Escobar, M. (2012). Use of Sand coating to improve bonding
between GFRP bars and concrete. J. Compos. Mater., 46(18): 2271–2278.
Aslani H. (2005). Probabilistic earthquake loss estimation and loss disaggregation in
buildings. Ph.D. Thesis, John A. Blume Earthquake Engineering Centre, Dept. of Civil
and Environmental Engineering Stanford University, Stanford, CA, 2005. p. 382.
Attanasi, G. and Auricchio, F. (2011). Innovative superelastic isolation device. J. Earthq. Eng.
15: 72–89.
ATC (1981). Seismic Design Guidelines for Highway Bridges, Report No. ATC-6, Applied
Technology Council, Redwood City, CA.
ATC (1985). Earthquake damage evaluation data for California, Report No. ATC-13, Applied
Technology Council, Redwood City, CA.
ATC (1991). Seismic Vulnerability and Impact of Disruption of Lifelines in the Coterminous
United States, Report No. ATC-25, Applied Technology Council, Redwood City, CA.
ATC (1996). Seismic Evaluation and Retrofit of Concrete Buildings, Report No. ATC-40,
Applied Technology Council, Redwood City, CA.
171

ATC-58. (2012). Seismic Performance Assessment of Buildings, Volume 1 – Methodology,
Applied Technology Council, 201 Redwood Shores Parkway, Redwood City, California.
Atkinson, G. M., and Goda, K. (2011). Effects of seismicity models and new ground-motion
prediction equations on seismic hazard assessment for four Canadian cities. Bulletin of the
Seismological Society of America, 101: 176–189.
Auricchio, F. and Sacco, E. (1997). Superelastic shape-memory-alloy beam model. J
Intelligent Materl Syst Struct, 8(6):489–501.
Avsar, O., Yakut, A. and Caner, A. (2011). Analytical fragility curves for ordinary highway
bridges in Turkey, Earthquake Spectra, 27(4): 971-996.
Aygün, B., Dueñas-Osorio, L., Padgett, J.E. and DesRoches, R. (2011). Efficient longitudinal
seismic fragility assessment of a multi-span continuous steel bridge on liquefiable soils,
ASCE Journal of Bridge Engineering, 16(1): 93-107.
Bae, S. and Bayrak. O. (2008). Plastic hinge length of reinforced concrete columns. ACI
Structural Journal, 105(3): 290-300.
Baker, J. W. (2013). Trade-offs in ground motion selection techniques for collapse assessment
of structures. Vienna Congress on Recent Advances in Earthquake Engineering and
Structural Dynamics 2013 (VEESD 2013), Vienna, Austria, 10p.
Baker, J. W., Lin, T., Shahi, S. K., and Jayaram, N. (2011). New ground motion selection
procedures and selected motions for the PEER transportation research program. PEER
Technical Report 2011/03, PEER Center, UC Berkeley.
Baker, J. W. (2011). The conditional mean spectrum: a tool for ground motion selection. ASCE
Journal of Structural Engineering, 137: 322–331.
Baker, J.W., Cornell, C.A. (2006). Vector-valued ground motion intensity measures for
probabilistic seismic demand analysis. Pacific Earthquake Engineering Research report
2006/08, PEER Center, University of California Berkeley.
Baker, J.W. and Cornell, C.A. (2005). A vector‐valued ground motion intensity measure
consisting of spectral acceleration and epsilon. Earthquake Engineering and Structural
Dynamics; 34(10):1193–1217.
Bamonte, P. F., and Gambarova, P. G. (2007). High-bond bars in NSC and HPC: Study on size
effect and on the local bond stress-slip law. ASCE J. Struct. Eng., 133(2):225-234.
172

Banerjee, S. and Prasad, G.G. (2013). Seismic risk assessment of reinforced concrete bridges
in flood-prone regions, Structure and Infrastructure Engineering: Maintenance,
Management, Life-Cycle Design and Performance, 9(9): 952-968.
Banerjee, S. and Chi, C. (2013). State-dependent fragility curves of bridges based on vibration
measurements, Probabilistic Engineering Mechanics, 33:116–125.
Banerjee S. and Shinozuka M. (2007). Nonlinear static procedure for seismic vulnerability
assessment of bridges, Computer-Aided Civil and Infrastructure Engineering, 22: 293-
305.
Banerjee S. and Shinozuka, M. (2011). Effect of Ground Motion Directionality on Fragility
Characteristics of a Highway Bridge, Advances in Civil Engineering, Article ID 536171,
12 pages, doi:10.1155/2011/536171.
Basoz, N., Kiremidjian, A. S. (1997). Evaluation of bridge damage data from the Loma Prieta
and Northridge CA earthquakes, Report No. MCEER-98-0004, MCEER, University at
Buffalo, The State University of New York, Buffalo, NY.
Bayrak, O., and Sheikh, S.A. (2001). Plastic hinge analysis. ASCE Journal of Structural
Engineering, 127(9):1092-1100.
Bazzurro, P. and Cornell, A.C. (2002). Vector‐values probabilistic seismic hazard analysis
(VP‐SHA). Proceedings of the 7th U.S. National Conference on Earthquake
Engineering, Boston, MA.
Bentz, E.C., Vecchio, F.J., and Collins, M.P. (2006). Simplified modified compression field
theory for calculating shear strength of reinforced concrete elements. ACI Structural
Journal, 103(4): 614–624.
Berry, M. P., Eberhard, M. O. (2003). Performance models for flexural damage inreinforced
concrete columns, Report No. 2003/18, Pacific Earthquake Engineering Research
Center, University of California, Berkeley, CA.
Berry, M., Lehman D. E., and Lowes L. N. (2008). Lumped-plasticity models for performance
simulation of bridge columns. ACI Structural Journal, 105(3): 270-279.
Billah, A.H.M.M. and Alam, M.S. (2014a). Seismic performance evaluation of multi-column
bridge bent retrofitted with different alternatives. Eng Struct, 62-63:105-117.
173

Billah, A.H.M.M., and Alam, M.S. (2014b). Seismic Fragility Assessment of Highway
Bridges: A State-of-The-Art Review. in Press: Structure and Infrastructure Engineering.
DOI:10.1080/15732479.2014.912243.
Billah, A.H.M.M. and Alam, M.S. (2014c). Seismic fragility assessment of concrete bridge
pier reinforced with superelastic Shape Memory Alloy. Earthquake Spectra, DOI:
http://dx.doi.org/10.1193/112512EQS337M
Billah, A.H.M.M., Alam, M.S. and Bhuiyan, A.R. (2013). Fragility analysis of retrofitted
multi-column bridge bent subjected to near fault and far field ground motion. ASCE
Journal of Bridge Engineering, 18(10), 992-1004.
Billah, A.H.M.M. and Alam, M.S. (2013). Seismic vulnerability assessment of a typical multi-
span continuous concrete highway bridge in British Columbia. Accepted in Canadian
Journal of Civil Engineering, Manuscript ID:CJCE-2013-0049R2.
Billah, A.H.M.M., Alam, M.S. and Bhuiyan, A.R. (2010). Seismic Performance of a multi-
span bridge fitted with Superelastic SMA based isolator IABSE-JSCE Joint Conference
on Advances in Bridge Engineering-II, August 8-10, 2010, Dhaka, Bangladesh.
Billah, A.H.M.M. and Alam, M.S. (2012a). Seismic performance of concrete columns
reinforced with hybrid shape memory alloy (SMA) and fiber reinforced polymer (FRP)
bars. Construction and Building Materials, 28 (1): 730–742.
Billah, A.H.M.M. and Alam, M.S. (2012b). Seismic fragility assessment of concrete bridge
pier reinforced with Shape Memory Alloy considering residual displacement, in SPIE
Conference on Active and Passive Smart Structures and Integrated Systems VI, 11-15
March 2012, San Diego, California, USA. pp. 83411F:1-13.
Bhuiyan, A.R. and Alam, M.S. (2012). Seismic vulnerability assessment of a multi-span
continuous highway bridge fitted with shape memory alloy bar and laminated rubber
bearing. Earthquake Spectra, 28(4): 1379-1404.
Bhuiyan, A.R. and Alam, M.S. (2013). Seismic performance assessment of highway bridges
equipped with superelastic shape memory alloy-based laminated rubber isolation bearing.
Eng. Struct. 49:396–407.
Bohl, A., and Adebar, P. (2011). Plastic hinge lengths in high-rise concrete shear walls. ACI
Struct. J., 108(2): 148–157.
174

Bondonet, G. and Filiatrault, A. (1996) Shape memory alloy for theseismic isolation of bridges.
Proc., 11th World Conf. on Earthquake Eng., Elsevier, New York, 1443–1452.
Boulanger, R. W., Curras, C. J., Kutter, L., Wilson, D. W., and Abghari, A. (1999). Seismic
soil-pile structure interaction experiments and analyses. Journal of Geotechnical and
Geo-environmental Engineering, ASCE, 125(9), 750-759.
Bradley BA, Dhakal RP, Cubrinovski M, MacRae GA, Lee DS. (2009). Seismic loss
estimation for efficient decision making. Bull NZ Soc Earthquake Eng., 42(2):96–110.
Brandenberg, S.J., Zhang, J., Kashighandi, P., Huo, Y. and Zhao, M. 2011. Demand fragility
surfaces for bridges in liquefied and laterally spreading ground, PEER Report 2011/01.
PEER Center, University of California, Berkeley, CA.
CALTRANS (2013). Seismic design criteria, Version 1.7, California Department of
Transportation, Sacramento, CA.
Canadian Standards Association. (2014). CSA Standard A23.3-14, Design of concrete
structures. Canadian Standards Association, Rexdale, Ontario, Canada, 295 pp.
Canadian Standards Association. (2010). CAN/CSA-S6-10—Canadian highway bridge design
code. Canadian Standards Association, Rexdale, Ontario, Canada, .752 pp.
Canadian Standards Association. (2014). CAN/CSA-S6-14—Canadian highway bridge design
code. Canadian Standards Association, Rexdale, Ontario, Canada, .894 pp.
Canadian Standards Association. (2012). CAN/CSA-S806-12— Design and construction of
building components with fibre reinforced polymers. Canadian Standards Association,
Rexdale, Ontario, Canada.
Cardone, D., Perrone, G. and Dolce, M. (2007) A numerical procedure for the assessment of
highway bridges in seismic area. ECCOMAS Thematic Conference on Computational
Methods in Structural Dynamics and Earthquake Engineering, M. Papadrakakis, D.C.
Charmpis, N.D. Lagaros, Y. Tsompanakis (eds.), Rethymno, Crete, Greece, 13–16 June
2007, 12 pages.
Cardone, D. and Sofia, S. (2012). Numerical and experimental studies on the seismic retrofit
of simply supported bridges using superelastic restrainers. Advanced Materials Research,
446-449, 3291-3294.
Casarotti, C. and Pinho, R. (2006). Seismic response of continuous span bridges through fibre-
based finite element analysis. Earthq. Engr. and Engr. Vib., 5(1):119–131.
175

Casciati, F., Faravelli, L. and Hamdaoui, K. (2007). Performance of a base isolator with shape
memory alloy bars. Earthq Eng Eng Vib, 6(4):401-8.
Casciati, F. and Hamdaoui, K. (2008). Modelling the uncertainty in the response of a base
isolator. Probab Eng Mech; 23(4):427-37.
Casciati, F., Faravelli, L. and Fuggini, C. (2008). Cable vibration mitigation by added SMA
wires. Acta Mech., 195(1):141–155.
Chang, K.C. (2000). Seismic performance of highway bridges, Earthq. Engrg. and Engrg.
Seism., 2(1):55-77.
Chaudhary, M., Abe, M. and Fujino, Y. (2001). Identification of soil-structure interaction
effect in based isolated bridges from earthquake records. Soil Dyn. and Earthq.Engr.,
21: 713-725.
Choe, D., Gardoni, P., Rosowsky, D., and Haukaas, T. (2009). Seismic fragility estimates for
reinforced concrete bridges subject to corrosion. Struct. Safety, 31(4): 275–283.
Choi, E., DesRoches, R. and Nielson, B.G. (2004). Seismic fragility of typical bridges in
moderate seismic zones. Engineering Structures, 26: 187-199.
Choi, E., Nam, T.H. and Cho, B.S. (2005). A new concept of isolation bearings for highway
steel bridges using shape memory alloys. Can. J. Civ. Eng., 32(5), 957–967.
Choi, E., Lee, D.H. and Choei, N.Y. (2009). Shape memory alloy bending bars as seismic
restrainers for bridges in seismic areas. International Journal of Steel Structures 9(4): 261-
273
Choine, M.N., O’Connor, A. and Padgett, J.E. (2013). A seismic reliability assessment of
reinforced concrete integral bridges subject to corrosion, Key Engineering Materials,
Vol. 569-570, pp. 366-373.
Christopoulos, C., Pampanin, S. and Priestley, M.J.N. (2003). Performance-based seismic
response of frame structures including residual deformations – Part I: single-degree-of-
freedom systems. J. Earthq. Eng., 7(1): 97–118.
Cladera, A., Oller, E. and Ribas, C. (2014). Pilot Experiences in the Application of Shape
Memory Alloys in Structural Concrete. ASCE J. Mat. Civil Engr. 04014084:1-10.
Conover WJ (1971) Practical nonparametric statistics. New York: John Wiley & Sons. Pages
97–104.
176

Corley, W.G. (1966). Rotational capacity of reinforced concrete beams. ASCE J. Struct. Eng.,
92(ST5):121-146.
Cornell CA, Krawinkler H. (2000). Progress and challenges in seismic performance
assessment. PEER Cent News; 3(2):1–3.
Cornell, A.C., Jalayer, F., Hamburger, R.O. (2002). Probabilistic basis for 2000 SAC federal
emergency management agency steel moment frame guidelines. J. Struct. Eng., 128, 526–
532.
Cruz, N.C. and Saiidi, M.S. (2012). Shake-table studies of a four-span bridge model with
advanced materials J. Struct. Eng., ASCE, 138(2): 183–192.
Cruz, N.C. and Saiidi, M.S. (2013). Performance of Innovative Materials in a 4-Span Bridge
Model subjected to Seismic Excitation J. Struct. Eng., ASCE, 139(1)
Czaderski, C., Shahverdi, M., Brönnimann, R., Leinenbach, C. and Motavalli, M. (2014).
Feasibility of iron-based shape memory alloy strips for prestressed strengthening of
concrete structures. Construction and Building Materials, 56: 94-105.
D’Agostino, R.B. and Stephens, M.A. (1986). Goodness-of-fit techniques, New York, Marcel
Dekker.
Davidson, J.S., Abdalla., R.S., Madhavan. M. (2002). Design and construction of modern
curved bridges, Report No. FHWA/CA/OR. University Transportation Center for
Alabama, The University of Alabama.
Dawood, H and ElGawady, M. (2013). Performance-based seismic design of unbonded precast
post-tensioned concrete filled GFRP tube piers. Composites: Part B, 44 (2013): 357–
367.
De Felice G, Giannini R (2010) An efficient approach for seismic fragility assessment with
application to old reinforced concrete bridges. J Earthq Eng 14(2):231–251
Der Kiureghian, A. (2002). Bayesian methods for seismic fragility assessment of lifeline
components, Acceptable Risk Processes: Lifelines and Natural Hazards, Monograph No.
21, A. D. Kiureghian ed., Technical Council for Lifeline Earthquake Engineering, ASCE,
Reston, VA.
DesRoches, R. and Smith, B. (2004) Shape memory alloys in seismic resistant design and
retrofit: A critical review of their potential and limitations. J. Earthquake Eng., 8(3): 415–
429.
177

DesRoches, R. McCormick, J., and Delemont, M. A. (2004). Cyclical properties of superelastic
shape memory alloys. ASCE Journal of Structural Engineering, 130(1): 38-46.
DesRoches, R. and Delemont, M. (2002). Seismic retrofit of simply supported bridges using
shape memory alloys. Eng. Struct., 24(3): 325–332.
DesRoches, R., and Delemont, M. (2001). Design and analysis of innovative dampers for
seismically isolated bridges in the United States. Proceedings of the 7th International
Seminar on Seismic Isolation, Energy Dissipation, and Active Control, Assissi, Italy,
November, 2001.
Dezfuli, F.H. and Alam, M.S. (2013). Shape memory alloy wire-based smart natural rubber
bearing. Smart Mater. Struct 22: 045013 (17pp).
Dezfuli, F.H. and Alam, M.S. (2014). Performance-based assessment and design of FRP-based
high damping rubber bearing incorporated with shape memory alloy wires. Eng Struct. 61,
166–183
Dieng, L., Helbert, G., Chirani, S.A., Lecompte, T. and Pilvin, P. (2013). Use of Shape
Memory Alloys damper device to mitigate vibration amplitudes of bridge cables. Engr.
Struct. 56: 1547–1556.
Deierlein, G.G., Krawinkler, H. and Cornell, C.A. (2003). A framework for performance-based
earthquake engineering. Pacific Conference on Earthquake Engineering. Christchurch,
New Zealand.
Dolce, M., Cardone, D. and Palermo, G. (2007). Seismic isolation of bridges using isolation
systems based on flat sliding bearings. Bull. Earthquake Eng., 5(4): 491–509.
Dong, J.H., Xue, S.D. and Zhou, Q. (2002). Application research of shape memory alloy in
structural vibration control. World Earthquake Eng. 18(3): 123–129.
Dong, J., Cai, C.S, and Okeil, A.M. (2011). Overview of potential and existing applications of
shape memory alloys in bridges. ASCE J Bridge Engr. 16(2): 305-315.
Dong, Y., Frangopol, D.M. and Saydam, D. (2013). Time-variant sustainability assessment of
seismically vulnerable bridges subjected to multiple hazards, Earthquake Engng Struct.
Dyn. ; 42:1451–1467.
Dukes, J., Padgett, J.E. and DesRoches, R. (2013). Updating the Seismic Design Process of
Bridges Using Bridge Specific Fragility Analysis, in 7th National Seismic Conf. on
Bridges and Highways, May 20-22, 2013, in Oakland, California, 12 pages.
178

Dutta, A. and Mander, J.B. (1998). Seismic fragility analysis of highway bridges, INCEDE-
MCEER Center-to-Center Workshop on Earthquake Engineering Frontiers in
Transportation Systems, 311-25, Tokyo, Japan, pp. 311-325.
Dwairi, H.M., Kowalsky, M. J. and Nau, J.M. (2007). Equivalent damping in support of direct
displacement-based design. Journal of Earthquake Engineering, 11:4, 512-530.
Earthquake Canada, 2011. Seismic zones in western Canada, Natural Resources Canada,
http://www.earthquakescanada.nrcan.gc.ca/zones/westcan-eng.php.
EC8-2, (2008). Eurocode 8: Design of Structures for Earthquake Resistance—Part 2. Seismic
Design of Bridges, European Committee for Standardization, Brussels, Belgium.
Elgamal, A., Yan, L., Yang, Z., and Conte, J. P. (2008). Three-dimensional seismic response
of Humboldt bay bridge-foundation-ground system, Journal of Structural Engineering,
ASCE, 134(7):1165-1176.
Elhowary, H.A., Ramadan, O. and Mehanny, S.S.F. (2013). Effect of spatially variable ground
motions on the seismic fragility of box girder continuous bridges, COMPDYN 2013,
4thECCOMAS Thematic Conference on Computational Methods in Structural
Dynamics and Earthquake Engineering, M. Papadrakakis, N.D.Lagaros, V. Plevris
(eds.), Kos Island, Greece, 12–14 June 2013, 17 pages.
Elnashai, A., Borzi, B., Vlachos, S. (2004). Deformation-based vulnerability functions for RC
bridges, Structural Engineering and Mechanics, 17(2): 215-244.
Elnashai, A.S. and Luigi, D.S. (2008). Fundamentals of earthquake engineering. New York:
Wiley.
Ellingwood, B. (1977). Statistical analysis of rc beam column interaction. J. Struct. Eng.,
ASCE, 103:1377-1388.
Emorsi, K. and Schnobrich, W.C. (1978). Analysis of reinforced concrete frame-wall
structures for strong motion earthquakes. Structural Research Series No. 434, 1978.
University of Illinois at Urbana-Champaign.
Erochko, J., Christopoulos, C., Tremblay, R. and Choi, H. (2011). Residual drift response of
SMRFs and BRB frames in steel buildings designed according to ASCE 7-05. J. Struct.
Eng., ASCE, 137(5): 589-599
179

Eurocode 8, CEN. (2005). Design of structures for earthquake resistance, part2: Bridges, EN
1998-2-2005, Comite Europeen de Normalization, Brussels, Belgium.
Federal Emergency Management Agency (FEMA), FEMA 445—Next-Generation
Performance-Based Seismic Design Guidelines, FEMA, Washington, D.C., 2006.
Feldman, L. R., and Bartlett, F. M. (2005). Bond Strength Variability in Pullout Specimens
with Plain Reinforcement. ACI Struct. J., 102(6): 860-867.
Feldman, L. R., and Bartlett, F. M. (2007). Bond Stresses Along Plain Steel Reinforcing Bars
in Pullout Specimens. ACI Struct. J., 104(6):685-692.
FEMA P695, Federal Emergency Management Agency (ATC-63). (2009). Applied
Technology Council (ATC), Redwood City, California.
Filippou F.C., Popov E.P., Bertero V.V. (1983). Effects of bond deterioration on hysteretic
behaviour of reinforced concrete joints. Report EERC 83-19, Earthquake Engineering
Research Center, University of California, Berkeley.
Frankie, T. (2013). Impact of complex system behaviour on seismic assessment of RC bridges,
PhD Dissertation, University of Illinois at Urbana-Champaign, Urbana, Illinois.Gardoni,
P., Der Kiureghian, A., Mosalam, K. M. (2002). Probabilistic capacity models and
fragility estimates for reinforced concrete columns based on experimental observations,
Journal of Engineering Mechanics, 128(10): 1024-1038.
Gardoni, P., Mosalam, K.M. and Der Kiureghian, A. 2003. Probabilistic seismic demand
models and fragility estimates for RC bridges. J. Earthquake Eng., 7(1): 79–106.
Gardoni, P and Rosowsky, D. (2011). Seismic fragility increment functions for deteriorating
reinforced concrete bridges, Structure and Infrastructure Engineering: Maintenance,
Management, Life-Cycle Design and Performance, 7(11): 869-879.Giovenale, P.,
Ciampoli, M., Jalayer, F. (2003). Comparison of Ground Motion Intensity Measures
using the Incremental Dynamic Analysis. Proc. Applications of Statistics and Probability
in Civil Engineering , Der Kiureghian, Madanat & Pestana (eds), Millpress, Rotterdam,
pp.1483-1491.
Gencturk, B. and Hosseini, S.F. (2014). Use of Cu-based superelastic alloys for innovative
design of reinforced concrete columns. In proceedings of Tenth U.S. National Conference
on Earthquake Engineering, Frontiers of Earthquake Engineering, July 21-25, 2014,
Anchorage, Alaska.
180

Ghassemieh, M., Mostafazadeh, M. and Sadeh, M.S. (2012). Seismic control of concrete shear
wall using shape memory alloys. Journal of Intelligent Material Systems and Structures,
23:535-545.
Ghobarah, A., Aly, N. M. and El-Attar, M. (1998). Seismic reliability assessment of existing
reinforced concrete buildings. J. Earthq. Eng., 2(4):569-592.
Ghosh, J. and Padgett, J.E. (2010). Aging consideration in the development of time-dependent
seismic fragility curve. ASCE Journal of Structural Engineering; 136(12):1497–1511.
Ghosh, J., and Padgett, J. E. (2012). Impact of Multiple Component Deterioration and
Exposure Conditions on Seismic Vulnerability of Concrete Bridges. Earthquakes and
Structures, 3(5), 649–673.
Ghosn, M., Moses, F., and Wang, J. (2003). Highway bridge design for extreme events,
National Cooperative Highway Research Program, NCHRP Report 489, Transportation
Research Board, National Academy Press, Washington D.C.
Goda, K., and Atkinson, G. M. (2009). Probabilistic characterization of spatially-correlated
response spectra for earthquakes in Japan. Bulletin of the Seismological Society of
America, 99, 3003–3020.
Goda, K., and Atkinson, G. M. (2011). Seismic performance of wood-frame houses in south-
western British Columbia. Earthquake Engineering and Structural Dynamics, 40, 903–
924.
Graesser, E.J. and Cozzarelli, F.A. (1991). Shape-memory alloys as new materials for aseismic
isolation. ASCE J. of Engr. Mech. 117 11: 2590-2608.
Hancock, J., Watson-Lamprey, J. Abrahamson, N.A., Bommer, J.J., Markatis, A., McCoy, E.,
and Mendis, R. (2006). An improved method of matching response spectra of recorded
earthquake ground motion using wavelets. J. Earthq. Eng., 10: 67–89.
Haque, A.B.M.R. and Alam, M.S. (2013) Direct displacement based design of industrial rack
clad buildings. Earthquake Spectra. 29(4): 1311-1334.
HAZUS (1997). Technical Manual, Federal Emergency Management Agency, Washington
DC.
181

HAZUS-MH (2011). Multi-Hazard Loss Estimation Methodology: Earthquake Model
HAZUS-MH MR5 Technical Manual, Federal Emergency Management Agency,
Washington DC.
HAZUS-MH 2.1 (2012). Multi-Hazard Loss Estimation Methodology: Earthquake Model
HAZUS-MH 2.1 Technical Manual, Federal Emergency Management Agency,
Washington DC.
Hao, Q., Wang, Y., He, Z., and Ou, J. (2009). Bond strength of glass fibre reinforced polymer
ribbed rebars in normal strength concrete. Construction and Building Materials, 23(2):
865-871.
Hewes, J. T., and Priestley, M. J. N. (2002). Seismic design and performance of precast
concrete segmental bridge columns. Report No. SSRP–2001/25, Department of Structural
Engineering, University of California, San Diego.
Hines, E., Restrepo, J. I., and Seible, F. (2004). Force-displacement characterization of well-
confined bridge piers. ACI Structural Journal, 101(4): 537-548.
Hose, Y., Silva, P. and Seible, F. (2000). Development of a performance evaluation database
for concrete bridge components and systems under simulated seismic loads. Earthquake
Spectra; 16(2): 413-442.
Hossain, K.M.A., and Lachemi, M. (2008). Bond behaviour of self-consolidating concrete with
mineral and chemical admixtures. ASCE J. Mater Civil Eng, 20(9): 608-616.
Hossain, K.M.A., Ametrano, D., and Lachemi, M. (2014). Bond Strength of standard and high-
modulus GFRP bars in high-strength concrete. ASCE J. Mater Civil Eng, 26(3): 449-456.
Huo, Y. and Zhang, J. (2013). Effects of pounding and skewness on seismic responses of
typical multi-span highway bridges using the fragility function method, ASCE Journal
of Bridge Engineering, 18 (6): 499-515.
Huang, Q., Gardoni, P. and Hurlebaus, S. (2010). Probabilistic seismic demand models and
fragility estimates for reinforced concrete highway bridges with one single-column bent.
Journal of Engineering Mechanics, 136(11):1340-1353.
Hwang, H., Jernigan, J.B. and Lin, Y.W. 2000. Evaluation of seismic damage to Memphis
bridges and highway systems. ASCE J. of Bridge Engr., 5: 322-30.
Japan Road Association, (2006). Specifications for Highway Bridges. Japan Road Association:
Japan.
182

Janke, L., Czaderski, C., Motavalli, M. and Ruth, J. (2005). Applications of shape memory
alloys in civil engineering structures—Overview, limits and new ideas. Mater. Struct.
38(279): 578–592.
Jara, J. M., Galvn, A., Jara, M. and Olmos, B. (2013). Procedure for determining the seismic
vulnerability of an irregular isolated bridge, Structure and Infrastructure Engineering:
Maintenance, Management, Life-Cycle Design and Performance, 9(6): 516-528.
Jernigan, J.B. and Hwang, H. (2002) Development of bridge fragility curves, 7th US National
Conference on Earthquake Engineering, EERI, Boston.
Johnson, R., Padgett, J.E., Maragakis, M.E., DesRoches, R. and Saiidi, M.S. (2008). Large
scale testing of nitinol shape memory alloy devices for retrofitting of bridges. Smart
Materials and Structures; 17(3):10.
Kappos, A.J. and Panagopoulos, G. (2010) Fragility curves for reinforced concrete buildings
in Greece, Structure and Infrastructure Engineering: Maintenance, Management, Life-
Cycle Design and Performance, 6(1-2):39-53,
Kappos, A.J., Panagopoulos, G., Panagiotopoulos, Ch., and Penelis, Gr. (2006). A hybrid
method for the vulnerability assessment of R/C and URM buildings. Bulletin of
Earthquake Engineering, 4 (4): 391–413.
Kappos, A.J., Stylianidis, K.C., and Pitilakis, K., 1998. Development of seismic risk scenarios
based on a hybrid method of vulnerability assessment. Natural Hazards, 17 (2): 177–
192.
Kappos, A.J. (1997). Discussion of paper: Damage scenarios simulation for seismic risk
assessment in urban zones. Earthquake Spectra, 13 (3): 549–551.
Kappos, A., Pitilakis, K., Stylianidis, K., Morfidis, K. and Asimakopoulos, D. (1995). Cost-
benefit analysis for the seismic rehabilitation of buildings in Thessaloniki, based on a
hybrid method of vulnerability assessment. 3rd Intern. Conf. on Seismic Zonation, Nice,
France, Oct. 1995, Vol. I, 406-413.
Karim, K.R. and Yamazaki, F. (2007). Effect of isolation on fragility curves of highway
bridges based on simplified approach. Soil Dyn Earthquake Eng.,7:414-426.
Karim K.R. and Yamazaki F. (2003). A simplified method of constructing fragility curves for
highway bridges, Earthquake Engineering and Structural Dynamics, 32:1603-1626.
183

Kashighandi, P., Brandenberg, S. J., Zhang, J., Huo, Y., and Zhao, M. (2008). Fragility of old-
vintage continuous California bridges to liquefaction and lateral spreading. Proc., 14th
World Conf. on Earthquake Engineering, October 2008, Beijing, China, 8pages.
Kazaz, I. (2013). Analytical study on plastic hinge length of structural walls. ASCE J. Struct.
Eng., 139(11):.1938-1950.
Kawashima, K., MacRae, G., Hoshikuma, J. and Nagaya, K. (1998). Residual displacement
response spectrum. ASCE J. Struct. Engr. 124(5): 523-530.
Kibboua, A., Naili, M., Benouar, D. and Kehila, F. (2011). Analytical fragility curves for
typical Algerian reinforced concrete bridge piers. Structural Engineering and
Mechanics, 39(3): 411-425.
Kim, S.H. and Feng, M.Q. (2003). Fragility analysis of bridges under ground motion with
spatial variation, International Journal of Non-Linear Mechanics, 38:705-721.
Kim S-H, Shinozuka M (2004) Development of fragility curves of bridges retrofitted by
column jacketing. Probab Eng Mech 19(1–2):105–112
King, S. A., Kiremidjian, A. S., Basoz, N., Law, K., Vucetic, M., Doroudian, M., Olson, R. A.,
Eidinger, J. M., Goettel, K. A., and Horner, G. (1997). Methodologies for Evaluating the
Socio-Economic Consequences of Large Earthquakes. Earthq. Spectra, 13(4), 565–584.
Kosowatz, J. (2014). Elastic connections may aid bridge design. ASME, available online:
https://www.asme.org/engineering-topics/articles/construction-and-building/elastic-
connections-may-aid-bridge-design
Koutsourelakis, P. S. (2010). Assessing structural vulnerability against earthquakes using
multi-dimensional fragility surfaces: A Bayesian framework, Probabilistic Engineering
Mechanics, 25: 49-60.
Kowalsky, M.J., Priestley, M.J.N. and MacRae, G.A. (1995). Displacement-based design of
RC bridge columns in seismic regions. Earthq Eng Struct Dyn 24(12):1623–1643.
Kowalsky, M.J. and Priestley, M.J.N. (2000). Improved analytical model for shear strength of
circular reinforced concrete columns in seismic regions. ACI Structural Journal, 97(3).
Kwon, O.S. and Elnashai, A.S. (2010). Fragility analysis of a highway over-crossing bridge
with consideration of soil–structure interactions, Structure and Infrastructure
Engineering: Maintenance, Management, Life-Cycle Design and Performance, 6(1-2):
159-178.
184

Kwan, W., and Billington, S. (2003). Unbonded posttensioned concrete bridge piers I:
Monotonic and cyclic analyses. ASCE J. Bridge Eng., 8(2): 92–101.
Lau, D.T., Waller, C.L., Vishnukanthan, K. and Sivathayalan, S. (2012). Fragility relationship
for probabilistic performance based seismic risk assessment of bridge inventories. In
Proc. of 3rd International Structural Specialty Conference, CSCE-2012, Edmonton,
Alberta, Canada, 10pages.
Lee, S.M., Kim, T.J., and Kang, S.L. (2007). Development of fragility curves for bridges in
Korea. KSCE Journal of Civil Engineering, 11(3):165-174.
Lee, W.K. and Billington, S.K. (2011). Performance-based earthquake engineering assessment
of a self-centering, post-tensioned concrete bridge system. Earthq. Engr. Struct. Dyn;
40:887–902.
Légeron, F. and Paultre, P. (2000). Behavior of High-strength concrete columns under cyclic
flexure and constant axial load. ACI Structural Journal, 97(4): 591-601.
Lehman, D., Moehle, J., Mahin, S., Calderone, A. and Henry, L. (2004). Experimental
evaluation of the seismic performance of reinforced concrete bridge columns. J. Struct.
Eng., ASCE, 130 (6): 869-879.
Li J, Spencer BF, Elnashai AS (2012) Bayesian updating of fragility functions using hybrid
simulation. ASCE J Struct Eng 139(7):1160–1171.
Li, L., Li, Q. and Zhang, F. (2007). Behavior of smart concrete beams with embedded shape
memory alloy bundles. J. Intell. Mater. Syst. and Struct. 18(10), 1003–1014.
Liao, W. and Loh, C.H. (2004) Preliminary study on the fragility curves for highway bridges
in Taiwan, Journal of the Chinese Institute of Engineers, 27:3, 367-375.
Lindt, J.W. and Potts, A. (2008). Shake table testing of a superelastic shape memory alloy
response modification device in a wood shear wall. J. Struct. Eng., ASCE 134 (8): 1343-
1352.
Lin Lin, S., Li, J., Elnashai, A.S. and Spencer, Jr., B.F. (2012). NEES integrated seismic risk
assessment framework (NISRAF). Soil Dyn. and Earthq. Engineering, 42:219–228.
Linzell, D.G. and Nadakuditi, V.P. (2011). Parameters influencing seismic response of
horizontally curved, steel, I-girder bridges, Steel and Composite Structures, 11(1): 21-
38.Luco, N. and Cornell, C.A. (1998). Effects of random connection fractures on the
demands and reliability for a three-story pre-Northridge (SMRP) structure. Proc. of the
185

6th U.S. National Conf. on Earthq. Eng., Earthquake Engineering Research Institute,
Oakland, California.
Liu, H., Wang, X. and Liu, J. (2008). The shaking table test of an SMA strands-composite
bearing. Earthq. Eng. Eng. Vib. 28: 152–6.
Liu, M., Li, H., Song, G. and Ou, J. (2007) Investigation of vibration mitigation of stay cables
incorporated with superelastic shape memory alloy dampers. Smart Mater. Struct. 16(6):
2202–2213.
Luco, N., Cornell, A. C. (2007). Structure-specific scalar intensity measures for near source
and ordinary earthquake ground motions, Earthquake Spectra, 23(2):357-392.
Ma, J. and Karaman, I. (2010). Expanding the repertoire of shape memory alloys. Science;
327:1468–9.
Mackie K, Stojadinovic B. (2001). Probabilistic seismic demand model for California highway
bridges. ASCE Journal of Bridge Engineering; 6:468–480.
Mackie, K., and Stojadinovic, B. (2005). Fragility Basis for California Highway Overpass
Bridge Seismic Decision Making, PEER Report 2005/02, Pacific Earthquake
Engineering Research Center, University of California, Berkeley, CA.
Mackie, K.R., and Stojadinovic, B. (2007). Performance-based seismic bridge design for
damage and loss limits States. Earthquake Engineering and Structural Dynamics, 36,
1953-71.
Mander, J.B. and Basöz, N. 1999. Seismic fragility curves theory for highway bridges. 5th US
conference on lifeline earthquake engineering, ASCE, 1999, 31-40.
Mander J.B. (1999). Fragility curve development for assessing the seismic vulnerability of
highway bridges. Technical Report, MCEER Highway Project/FHWA.
Mander, J.B., Priestley, M.J.N. and Park, R. (1988). Theoretical stress–strain model for
confined concrete. J. Struct. Eng., ASCE, 114(8):1804–26.
Mander J. B. (1983). Seismic design of bridge piers. PhD Thesis, University of Canterbury,
Christ Church, New Zealand.
Marsh, L. K. and Stringer, S.J. (2013). Performance-based seismic bridge design, A Synthesis
of highway practice, NCHRP Synthesis-440, TRB, Washington, D.C.
186

Masuda, A., Sone, A., Kamata, S. and Yamashita, Y. (2004). Finite element analysis of shape
memory alloy springs designed for base isolation devices. Proceedings of SPIE Vol. 5383,
SPIE, Bellingham, WA.
Mattock, A.H. (1964). Rotational capacity of hinging regions in reinforced concrete beams.
Proceedings International Symposium on the Flexural Mechanics of Reinforced Concrete,
ACI SP-12, Miami, 143-181.
McCarthy, E., Wright, T., Padgett, J., DesRoches, R., and Bradford, P. (2012). Mitigating
seismic bridge damage through shape memory alloy enhanced modular bridge expansion
joints. Structures Congress, 2012: 708-717.
McWilliams, A. (2015). Smart materials and their applications: technologies and global
markets. BCC Research Advanced Materials Report; 2015.
Mekki, O.B. and Auricchio, F. (2010). Performance evaluation of shape-memory-alloy
superelastic behavior to control a stay cable in cable-stayed bridges. Int. J. Non- Linear
Mech. 46(2): 470-477.
Menegotto, M. and Pinto, P.E. (1973). Method of analysis for cyclically loaded R.C. plane
frames including changes in geometry and non-elastic behaviour of elements under
combined normal force and bending. Symposium on the resistance and ultimate
deformability of structures acted on by well-defined repeated loads, International
Association for Bridge and Structural Engineering, Zurich, Switzerland, 1973; 15-22.
Mendis, P. (2001). Plastic hinge lengths of normal and high-strength concrete in flexure.
Advances in Structural Engineering, 4(4):189-195.
Miranda, E. and Ruiz-García, J. (2003). Evaluation of approximate methods to estimate
maximum inelastic displacement demands. Earthquake Engineering and Structural
Dynamics 31: 539–560.
Mirza, S.A. Hatzinikolas, M. and MacGregor, J.G. (1979). Statistical descriptions of strength
of concrete. J. Struct. Eng., ASCE, 105(ST6):1021-1036.
Mood. M.A., Graybill, F.A. and Boes, D.C. (1974). Introduction to the theory of statistics (3rd
edition). McGraw-Hill, New York.
Mohseni, M., Norton, T.R. (2011). Seismic damage assessment of curved bridges using
fragility analysis, ICASP-11, Zurich, Switzerland, Aug. 1-4, 2011.Moschonas, I.F.,
Kappos, A.J., Panetsos, P., Papadopoulos, V., Makarios, T., and Thanopoulos, P. (2009)
187

Seismic fragility curves for Greek bridges: methodology and case studies. Bulletin of
Earthquake Engineering, 7, 439-468.
Moschonas, I.F. and Kappos, A.J. (2011). Generalized fragility curves for bearing-supported
Skew bridges, for arbitrary angle of incidence of the Seismic action, in COMPDYN
2011, III ECCOMAS Thematic Conference on Computational Methods in Structural
Dynamics and Earthquake Engineering, M. Papadrakakis, M. Fragiadakis, V. Plevris
(eds.), Corfu, Greece, 25–28 May 2011, 23 pages.
Mosley, C. P., Tureyen, A. K., & Frosch, R. J. (2008). Bond strength of nonmetallic reinforcing
bars. ACI Structural Journal, 105(5): 634-642.
Nakashoji, B., and Saiidi, M. S. (2014). Seismic performance of square nickel-titanium
reinforced ECC columns with headed couplers. CCEER, Department of Civil Engineering,
University of Nevada, Reno, Nevada, Report No. CCEER-14-05.
Naumoski, N., Tso, W.K. and Heidebrecht, A.C. (1988). A selection of representative strong
motion earthquake records having different A/V ratios, EERG Report 88-01, Dept. of
Civil Engr., McMaster University, Hamilton, ON Canada.
Ni, P., Petrini, L. and Paolucci, R. (2013) Direct displacement-based assessment with nonlinear
soil–structure interaction for multi-span reinforced concrete bridges, Structure and
Infrastructure Engineering: Maintenance, Management, Life-Cycle Design and
Performance, DOI: 10.1080/15732479.2013.802813, 17 pages.
Nielson, B.G. and Pang, W. (2011) Effect of Ground Motion Suite Size on Uncertainty
Estimation in Seismic Bridge Fragility Modeling. Structures Congress 2011: pp. 23-34.
Nielson, B.G. and DesRoches, R. (2007a) Seismic fragility curves for typical highway bridge
classes in the Central and South-eastern United States. Earthquake Spectra, 23:615–633.
Nielson, B.G. and DesRoches, R. (2007b) Seismic fragility methodology for highway bridges
using a component level approach. Earthq Eng Struct Dyn., 36: 823–839.
Nielson, B.G. 2005. Analytical fragility curves for highway bridges in moderate seismic zones.
Ph.D. Dissertation, Georgia Institute of Technology, Atlanta, GA.
O'Brien, M., Saiidi, M.S. and Zadeh, M.S. (2007). A study of concrete bridge columns using
innovative materials subjected to cyclic loading. CCEER, Department of Civil
Engineering, University of Nevada, Reno, Nevada, . Report No. CCEER-07-01.
188
Ocel, J., DesRoches, R., Leon, R.T., Hess, W.G., Krumme, R., Hayes, J.R. and Sweeney, S.
(2004). Steel beam-column connections using shape memory alloys. J. Struct. Eng.,
ASCE, 130(5): 732-740.
Omori, T., Ando, K., Okano, M., Xu, X., Tanaka, Y., Ohnuma, I., Kainuma, R. and Ishida, K.
(2011). Superelastic effect in polycrystalline ferrous alloys. Science, 333, 68-71.
Otani, S. (1974). A computer program for inelastic response of R/C frames to earthquakes.
Civil Engineering Studies, Report UILU-Eng-74-2029, UIUC, USA.
Ozbulut, O.E. (2013). Feasibility of using shape memory alloys to develop self post-tensioned
concrete bridge girders. Report No: UVA-2013-01, University of Virginia, Center for
Transportation Studies.
Ozbulut, O.E. and Hurlebaus, S. (2010). Evaluation of the performance of a sliding-type base
isolation system with a NiTi shape memory alloy device considering temperature effects.
Eng Struct., 32(1):238-49.
Ozbulut, O.E., Hurlebaus, S. and Desroches, R. (2011a). Seismic response control using shape
memory alloys: A review. J. Intell. Mater. Syst. Struct., 22(14): 1531–1549.
Ozbulut, O.E. and Hurlebaus, S. (2011b). Seismic assessment of bridge structures isolated by
a shape memory alloy/rubber-based isolation system. Smart Mater. Struct. 20, 015003
(12pp)
Ozbulut, O.E. and Hurlebaus, S. (2011c). Optimal design of superelastic-friction base isolators
for seismic protection of highway bridges against near-field earthquakes. Earthq Engng
Struct. Dyn. 40:273–291.
Padgett, J.E., Marsh, W. and DesRoches, R. (2013). Shape memory alloy enhanced SMART
expansion joints. Final Report for Highway IDEA Project 147, IDEA Programs,
Transportation Research Board, Washington, DC.
Padgett, J.E., DesRoches, R. and Ehlinger, R. (2009). Experimental response modification of
a four-span bridge retrofit with shape memory alloys. Struct. Control Health Monit.,
17:694–708
Padgett, J.E., Ghosh, J. and Dueñas-Osorio, L. (2013) Effects of liquefiable soil and bridge
modelling parameters on the seismic reliability of critical structural components,
Structure and Infrastructure Engineering: Maintenance, Management, Life-Cycle
Design and Performance, 9(1): 59-77.
189

Padgett, J.E. and DesRoches, R. (2009). Retrofitted Bridge Fragility Analysis for Typical
Classes of Multispan Bridges. Earthquake Spectra, 25(1):117–141,
Padgett, J.E. and DesRoches, R. (2008). Methodology for the development of analytical
fragility curves for retrofitted bridges. Earthq Eng Struct Dyn, 37: 157-74.
Padgett, J.E., Nielson, B.G., and DesRoches, R. (2008). Selection of optimal intensity
measures in probabilistic seismic demand models of highway bridge portfolios.
Earthquake Engineering and Structural Dynamics, 37, 711-725.
Padgett, J. E. (2007). Seismic vulnerability assessment of retrofitted bridges using probabilistic
methods, Ph.D. Dissertation, Georgia Institute of Technology, Atlanta, GA.
Pan, Y., Agrawal, A. K., and Ghosn, M. (2007). Seismic fragility of continuous steel highway
bridges in New York State. J. Bridge Eng., 12(6), 689–699.
Pan, Y., Agrawal, A. K., Ghosn, M., and Alampalli, S. (2010a). Seismic fragility of multi-span
simply supported steel highway bridges in New York State. I: Bridge modeling,
parametric analysis, and retrofit design.” J. Bridge Eng., 15(5), 448–461.
Pan, Y., Agrawal, A. K., Ghosn, M., and Alampalli, S. (2010b). “Seismic fragility of multi-
span simply supported steel highway bridges in New York State. I: Fragility analysis,
fragility curves, and fragility surfaces.” J. Bridge Eng., 15(5), 462–472.
Park, Y.J., and Ang, A.H.S. (1985). Mechanistic seismic damage model for reinforced
concrete. ASCE Journal of Structural Engineering, 111(4), 722–39.
Park, R., Priestley, M.J.N. and Gill, W.D. (1982). Ductility of square- confined concrete
columns. ASCE J. Struct. Eng., 108(ST4): 929-950.
Paulay, T. and Priestley, M.N.J. (1992). Seismic design of reinforced concrete and masonry
buildings. New York: John Willey & Sons, Inc.
PEER (2011). New Ground Motion Selection Procedures and Selected Motions for the PEER
Transportation Research Program (PEER Report 2011/03), Pacific Earthquake
Engineering Research Center, University of California, Berkeley, California.
Pettinga, D., Pampanin, S., Christopoulos, C., Priestley, N. (2006). Accounting for residual
deformations and simple approaches to their mitigation. In: First European conference
on earthquake engineering and seismology, Geneva, Switzerland, 3-8 September 2006.
190

Pinho, R., Casarotti, C., and Antoniou, S. (2007). A Comparison of single-run pushover
analysis techniques for seismic assessment of bridges. Earthq. Engr. Struct. Dyn. 36:
1347–1362.
Pottatheere, P. and Renault, P. (2008). Seismic vulnerability assessment of skew bridges, 14th
World Conference on Earthquake Engineering October 2008, Beijing, China. 12 pages.
Prasad, G.G. and Banerjee, S. (2013). The Impact of Flood-Induced Scour on Seismic Fragility
Characteristics of Bridges, Journal of Earthquake Engineering, 17(6):803-828.
Priestley, M. J. N., and Park, R. (1987). Strength and ductility of concrete bridge columns
under seismic loading. ACI Structural Journal, 84(1): 61-76.
Priestley, M.J.N., Seible, F., and Calvi, G.M. (1996). Seismic design and retrofit of bridges.
Wiley, New York.
Priestley, M. J. N., Calvi, G. M., and Kowalski, M. J. (2007). Displacement-based seismic
design of structures. IUSS press, Pavia.
Ramanathan, K., DesRoches, R., Padgett, J. E. (2010). Analytical fragility curves for multispan
continuous steel girder bridges in moderate seismic zones, Transportation Research
Record: Journal of the Transportation Research Board, 2202: 173-182.
Ramanathan, K., Wright, T., DesRoches, R., Padgett, J. E. (2010b). “Effect of Ground Motion
Suites on the Seismic Fragility of a Three-Span Continuous Steel Girder Bridge,”
Proceedings of the 9th U.S. National and 10th Canadian Conference on Earthquake
Engineering, Toronto, Ontario, Canada.
Ramanathan, K., DesRoches, R. and Padgett, J.E. 2012. A comparison of pre- and post-seismic
design considerations in moderate seismic zones through the fragility assessment of
multi-span bridge classes. Engineering Structures, 45: 559-573.
Ramanathan, K. (2012). Next generation seismic fragility curves for California bridges
incorporating the evolution in seismic design philosophy, Ph.D. Dissertation, Georgia
Institute of Technology, Atlanta, GA.
Ramirez, C.M. and Miranda, E. (2012). Significance of residual drifts in building earthquake
loss estimation. Earthq. Eng Struct Dyn., 41: 1477-1493.
Reza, S.M., Alam, M.S., Tesfamariam, S. (2014). “Lateral load resistance of bridge piers under
flexure and shear using factorial analysis”, Engineering Structures, 59: 821-835.
191

Roh, H., Lee, J.S. and Reinhorn, A.M. (2010). Hysteretic behavior of precast segmental bridge
piers with superelastic shape memory alloy bars. Engineering Structures 32: 3394-3403.
Rossetto, T. and Elnashai, A.S.(2003). Derivation of vulnerability functions for European type
RC structures based on observational data, Engineering Structures, 25(10):1241-1263.
RPOA 2008 – Règles Parasismiques Applicables au Domaine des Ouvrages d’Art. Document
Technique Règlementaire, Ministère des Travaux Publics, Alger, Algeria.
Ruiz-García, J. and Miranda, E. (2010). Probabilistic estimation of residual drift demands for
seismic assessment of multi-story framed buildings. Engineering Structures 32:11-20.
Saadat, S., Salichs, J., Noori, M., Hou, Z., Davoodi, H., Baron, I., Suzuki, Y. and Masuda, A.
(2002). An overview of vibration and seismic applications of NiTi shape memory alloy.
Smart Mater. Struct. 11(2): 218–229.
Saiidi, M.S. and Wang, H. (2006). Exploratory study of seismic response of concrete columns
with shape memory alloys reinforcement. ACI Struct. J. 103(3): 435-42.
Saiidi, M.S., O’Brien, M. and Zadeh, M.S. (2009). Cyclic response of concrete bridge columns
using superelastic nitinol and bendable concrete. ACI Struct J. 106(1): 69-77.
Saiidi, M.S. and Ardakani, S.M.S. (2012). An analytical study of residual displacements in RC
bridge columns subjected to near-fault earthquakes. Bridge Structures, 8: 35–45.
Sakai, J., and Mahin, S.A. (2004). Analytical investigations of new methods for reducing
residual displacements of reinforced concrete bridge columns. PEER-2004/02, Pacific
Earthq. Engrg. Res. Center, Univ. of California at Berkeley, California.
Samaan, M., Kennedy, J.B. and Sennah, K.M. (2007). Dynamic analysis of curved continuous
multiple-box girder bridges. ASCE J. of Bridge Engineering, 12: 184-193.
Sayed, A.F., Foret, G. and Le Roy R. (2011). Bond between carbon fibre-reinforced polymer
(CFRP) bars and ultra-high performance fibre reinforced concrete (UHPFRC):
Experimental study., Construction and Building Materials, 25: 479-485.
SeismoSoft. (2014). SeismoStruct - A computer program for static and dynamic nonlinear
analysis of framed structures, V 7 [online], available from URL: www.seismosoft.com.
SeismoSoft, (2013). SeismoMatch - A computer program for adjusting ground motion data, V
2.1 [online], available from URL: www.seismosoft.com.
192

Shafieezadeh, A., Ramanathan, K., Padgett, J.E. and DesRoches, R. (2012). Fractional order
intensity measures for probabilistic seismic demand modeling applied to highway
bridges, Earthquake Engng Struct. Dyn.; 41:391–409
Sharabash, A.M. and Andrawes, B. (2009). Application of shape memory alloy dampers in the
seismic control of cable-stayed bridges. Eng. Struct. 31(2): 607–616.
Shin, M. and Andrawes, B. (2011). Emergency repair of severely damaged reinforced concrete
columns using active confinement with shape memory alloys. Smart Mater. Struct. 20
(9pp)
Shinozuka, M., Chang, S., Eguchi, R. T., Abrams, D. P., Hwang, H., and Rose, A. (1997).
Advances in Earthquake Loss Estimation and Application to Memphis, Tennessee.
Earthquake Spectra, 13(4), 739–758.
Shinozuka, M., Feng, M. Q., Kim, H.-K., Kim, S.-H. (2000). Nonlinear static procedure for
fragility curve development, Journal of Engineering Mechanics, 126(12):1287-1296.
Shinozuka, M., Feng, M. Q., Kim, H., Uzawa, T. Ueda, T. (2001). Statistical analysis of
fragility curves, Report No. MCEER-03-0002, MCEER, University at Buffalo, The State
University of New York, Buffalo, NY.
Shrestha, K.C., Araki, Y., Takuya Nagae, T., Koetaka, Y., Suzuki, Y., Omori, T., Sutou, Y.,
Kainuma, R. and Ishida, K. (2013). Feasibility of Cu–Al–Mn superelastic alloy bars as
reinforcement elements in concrete beams. Smart Mater. Struct. 22:025025 (12pp).
Shrestha, K.C., Saiidi, M.S. and Cruz, C.A. (2015). Advanced materials for control of post-
earthqauke damage in bridges. Smart Materials and Structures, 24 (2015): 025035 (16pp).
Shome, N. and Cornell, A.C. (1999). Probabilistic seismic demand analysis of nonlinear
structures. reliability of marine structures, Program Report No. RMS‐35, Department of
Civil and Environmental Engineering Stanford University, California.
Simon J, Bracci J, Gardoni P. Seismic response and fragility of deteriorated reinforced concrete
bridges. ASCE Journal of Structural Engineering; 136(10):1273–1281.
Singhal, A., Kiremidjian, A. S. (1996). Bayesian updating of fragilities with application to RC
frames, Journal of Structural Engineering, 124(8): 922-929.
Snedecor, W.G. and Cochran, W.G. (1989). Statistical methods, 8th edition, Iowa State
University press.
193

Soroushian, P., Ostowari, K., Nossoni, A. and Chowdhury, H. (2001). Repair and
strengthening of concrete structures through application of corrective posttensioning
forces with shape memory alloys. Transportation Research Record 1770, Transportation
Research Board, Washington, DC, 20–26.
Song, G., Ma, N., and Li, H.N. (2006). Applications of shape memory alloys in civil structures.
Eng. Struct. 28(9): 1266–1274.
Stefanidou, S.P. and Kappos, A.J. (2013). Optimum selection of retrofit measures for R/C
Bridges using fragility curves. 4th ECCOMAS Thematic Conference on Computational
Methods in Structural Dynamics and Earthquake Engineering M. Papadrakakis, V.
Papadopoulos, V. Plevris (eds.) Kos Island, Greece, 12–14 June 2013, 18 pages.
Sullivan, I. and Nielson, B.G. (2010). Sensitivity analysis of seismic fragility curves for
skewed multi-span simply supported steel girder bridges, 19th Analysis & Computation
Specialty Conference, Structures Congress 2010: pp. 226-237.
Sung, Y.C. and Su, C.K. (2011) Time-dependent seismic fragility curves on optimal
retrofitting of neutralised reinforced concrete bridges, Structure and Infrastructure
Engineering: Maintenance, Management, Life-Cycle Design and Performance, 7:10,
797-805.
Sung, Y.C., Hsu, C.C., Hung. H.H. and Chang, Y.J. (2013) Seismic risk assessment system of
existing bridges in Taiwan, Structure and Infrastructure Engineering: Maintenance,
Management, Life-Cycle Design and Performance, 9(9): 903-917.
Tanaka, S., Kameda, H., Nojima, N. and Ohnishi, S. (2000) Evaluation of seismic fragility for
highway transportation systems. In: Proceedings of the 12th world conference on
earthquake engineering, 2000; Auckland, NewZealand, 6 pages.
Tanaka, Y., Himuro, Y., Kainuma, R., Sutou, Y., Omori, T. and Ishida, K. (2010). Ferrous
polycrystalline shape-memory alloy showing huge superelasticity. Science, 327:1488-
1490.
Tanaka, H. and Park, R. (1990). Effect of lateral confining reinforcement on the ductile
behavior of reinforced concrete columns, Research Report 90-2, Department of Civil
Engineering, University of Canterbury, Christchurch, New Zealand, June, 458 pp.
Tavares, D.H., Padgett, J.E. and Paultre, P. 2012. Fragility curves of typical as-built highway
bridges in eastern Canada. Engineering Structures, 40: 107–118.
194

Tehrani, P. and Mitchell, D. (2012) Effects of column and superstructure stiffness on the
seismic response of bridges in the transverse direction, Can. J. Civ. Engg., 39:1-13.
Torbol, M. and Shinozuka, M. (2012a). Effect of the angle of seismic incidence on the fragility
curves of bridges, Earthq Eng Struct Dyn, 41(14): 2111-2124.
Torbol, M. and Shinozuka, M. (2012b). The directionality effect in the seismic risk assessment
of highway networks, Structure and Infrastructure Engineering: Maintenance,
Management, Life-Cycle Design and Performance,
DOI:10.1080/15732479.2012.716069, 14 pages.
Vamvatsikos, D. and Cornell, A. C. (2002). Incremental dynamic analysis. Earthquake
Engineering & Structural Dynamics, 31, 491–514.
Varela, S., Saiidi, M.S. and Gautam, M. (2014). Sustainable Highway Bridges with Novel
Materials and Deconstructible Components NSF Report, Department of Civil &
Environmental Engineering University of Nevada, Reno.
Vecchio, F.J., and Collins, M.P. (1986). The modified compression-filed theory for reinforced
concrete elements subjected to shear. ACI Structural Journal, 83(2): 219–231.
Verderame, G. M., Ricci, P., Carlo, G. D., and Manfredi, G. (2009). Cyclic Bond Behaviour
of Plain Bars. Part I: Experimental Investigation. Constr. Build. Mater., 23(12): 3499-
3511.
Veneziano, D., Sussman, J. M., Gupta, U., and Kunnumkal, S. M. (2002). Earthquake loss
under limited transportation capacity: assessment, sensitivity and remediation. 7th US
National Conference on Earthquake Engineering, Boston, Mass. EERI.
Vosooghi, A. and Saiidi, M.S. 2012. Experimental fragility curves for seismic response of
reinforced concrete bridge columns. ACI Structural Journal, 109 (6): 825-834.
Wambeke, B. W., and Shield, C. K. (2006). Development length of glass fibre-reinforced
polymer bars in concrete. ACI Structural Journal, 103(1):11-17.
Wang, Z., Song, W. and Li, T. (2012). Combined fragility surface analysis of earthquake and
scour hazards for bridge, In: Proceedings of the 15th world conference on earthquake
engineering, 2012; Lisbon, Portugal, 10 pages.
Wang, D.S., Ai, Q.H., Li, H.N., Si, B.J., and Sun, Z.G. (2008). Displacement based seismic
design of rc bridge piers: method and experimental evaluation. The 14th World
Conference on Earthquake Engineering, Beijing, China, 2008, 10pp.
195
Werner, S. D., Taylor, C., and Moore, J. (1997). Loss estimation due to seismic risks to
highway systems. Earthquake Spectra, 13(4), 585–604.
Whitman, R.V., Biggs, J. M., Brennan, J.E., Cornell, A.C., de Neufville, R.L., Vanmarcke,
E.H. (1975). Seismic design decision analysis. Journal of Structural Division, ASCE;
101: 1067-1084.
Wilde, K., Gardoni, P. and Fujino, Y. (2000). Base isolation system with shape memory alloy
device for elevated highway bridges. Eng. Struct. 22(3): 222–229.
Wilson, J.C. and Wesolowsky, M.B. (2005). Shape memory alloys for seismic response
modification: A state-of-the-art review. Earthquake Spectra, 21(2): 569–601.
Wu, Z., Zhang, X., Zheng, J., Hu, Y., and Li, Q. (2014). Bond behavior of plain round bars
embedded in concrete subjected to biaxial lateral tensile-compressive stresses. ASCE J.
Struct. Eng., 140(4): 1-11.
Xu, Y.L. and Zhou, H.J. (2007). Damping cable vibration for a cable stayed bridge using
adjustable fluid dampers. J. Sound Vib., 306(1): 349–360.
Yamazaki, F., Hamada, T., Motoyama, H., Yamauchi, H. (1999). Earthquake damage
assessment of expressway bridges in Japan, Technical Council on Lifeline Earthquake
Engineering Monograph, 16: 361-370.
Yamazaki, F., Motomura, H. and Hamada, T. (2000). Damage assessment of expressway
networks in japan based on seismic monitoring, in 12th World Conf. on Earthquake
Engineering, Auckland, New Zealand, Paper no: 0551, 8 pages.
Yi J-H, Kim S-H, Kushiyama S. PDF interpolation technique for seismic fragility analysis of
bridges. Eng Struct 2007; 29:1312-22.
Youssef, M.A., Alam, M.S. and Nehdi, M. (2008). Experimental investigation on the seismic
behavior of beam-column joints reinforced with superelastic Shape Memory Alloys. J
Earthq Eng., 12(7):1205-1222.
Yu. O., Allen, D. L., and Drnevich, V. P. (1991). Seismic vulnerability assessment of bridges
on earthquake priority routes in Western Kentucky, 3rd US National Conference on
Lifeline Earthquake Engineering, Los Angeles, CA.
Zakeri, B., Padgett, J., and Amiri, G. (2013). Fragility Assessment for Seismically Retrofitted
Skewed Reinforced Concrete Box Girder Bridges. J. Perform. Constr. Facil.,
10.1061/(ASCE)CF.1943-5509.0000502.
196

Zhang, Y., Hu, H. and Zhu, S. (2009). Seismic performance of benchmark base-isolated
bridges with superelastic Cu–Al–Be restraining damping device. Struct. Control Health
Monit. 16 668–85.
Zhang, Y., Conte, J. P., Yang, Z., Elgamal, A., Bielak, J., and Acero, G. (2008). Two-
Dimensional Nonlinear Earthquake Response Analysis of a Bridge-Foundation-Ground
System. Earthquake Spectra, 24(2): 343-386.
Zhang, J. and Huo, Y. (2009). Evaluating effectiveness and optimum design of isolation
devices for highway bridges using the fragility function method. Engineering Structures,
31, 1648-1660.
Zhong, J., Gardoni, P., Rosowsky, D., and Haukaas, T. (2008). Probabilistic seismic demand
models and fragility estimates for reinforced concrete bridges with two-column bents. J.
Eng. Mech., 134(6): 495–504.
Zhong, J., Gardoni, P and Rosowsky, D. (2012). Seismic fragility estimates for corroding
reinforced concrete bridges, Structure and Infrastructure Engineering: Maintenance,
Management, Life-Cycle Design and Performance, 8(1): 55-69.
197

APPENDICES
Appendix A
Table A.0.1. Summary of seismic fragility assessment studies of bridges
Authors Component Demand Parameter Intensity Measure Uncertain parameters Method
Agrawal, A.K., Ghosn, M., Alampalli, S. and Pan, Y. (2012)
Column, bearing Curvature ductility, bearing displacement PGA fc', fy, W, ΔT, μB Analytical
Akbari, R. (2012) Column Curvature, Drift, Displacement ductility PGA -* Analytical
Alam, M.S., Bhuiyan, A.R., and Billah, A.H.M.M. (2012)
Column, Bearing Displacement ductility, Shear strain PGA -* Analytical
AmiriHormozaki, E., Pekcan G., and Itani, A. (2013)
Column, Bearing, Abutment
Curvature ductility, Bearing deformation, Abutment deformation
PGA, Sa fc', fy, μB, Ki, ξ, G, θ, Ka Analytical
Alipour, A., Shafei, B., and Shinozuka, M. (2013)
Column Displacement ductility PGA Ys Analytical
Avsar, O., Yakut, A. and Caner, A. (2011).
Column, Cap beam, Deck
column and cap beam curvature, shear in both principal axes, and deck displacement
PGA, PGV, ASI Ls, H, θ Analytical
Aygün, B., Dueñas-Osorio, L., Padgett, J.E. and DesRoches, R. (2011).
Column, Abutment, Bearing, Pile, Deck
Column curvature, Bearing deformation, Abutment displacement, Deck unseating, Pile cap displacement
PGA fc', fy, μB, Ki, ξ, G, Sg, Su, Φ, p-y spring Analytical
Banarjee, S. and Prasad, G.G. (2013) Column Displacement ductility PGA Ys, Flood return period Analytical
198

Banerjee, S. and Chi, C. (2013). Column Rotational Ductility PGA -*
Experimental and Analytical
Banerjee S. and Shinozuka M. (2007). Column Drift ratio, Displacement
ductility demand PGA -* Analytical
Banerjee S. and Shinozuka, M. (2011). Column Rotational Ductility PGA α Analytical
Berry, M. P., Eberhard, M. O. (2003). Column Cover spalling, Bar buckling Pr, ρ, fc',fy,
L/D Experimental
Billah, A.H.M.M., Alam, M.S. and Bhuiyan, A.R. (2013).
Column Displacement ductility PGA -* Analytical
Billah, A.H.M.M. and Alam, M.S. (2013)
Column, Bearing, Wing wall, Back wall
Displacement ductility, Bearing deformation, Wing wall and back wall displacement,
PGA fc', fy, μB, Ki, ξ, G, θ, Kr, Kθ, Ka Analytical
Billah, A.H.M.M. and Alam, M.S. (2014) Column Displacement ductility, Residual
drift, Maximum Drift PGA -* Analytical
Billah, A.H.M.M. and Alam, M.S. (2012). Column Residual Drift PGA Analytical
Bhuiyan, A.R. and Alam, M.S. (2012). Column, Bearing Displacement ductility, Shear
strain PGA -* Analytical
Brandenberg, S.J., Zhang, J., Kashighandi, P., Huo, Y. and Zhao, M. (2011).
Column, Bearing, Pile cap, Abutment
Curvature ductility, Shear strain, Pile curvature ductility, Abutment displacement and rotation.
PGA
Crust thickness, crust strength, Axial tip capacity, Liquefied sand thickness, p-y spring
Analytical
Choe, D., Gardoni, P., Rosowsky, D., and Haukaas, T. (2008, 2009).
Column Deformation and shear force demand Sa Ls, L/H, D/Ds, fc', fy,
Ksoil, ρ Analytical
Choi, E., DesRoches, R. and Nielson, B.G. (2004).
Column, Fixed bearing, Expansion bearing, Dowel
Curvature ductility, bearing displacement, Dowel displacement
PGA fc', fy, G Analytical
199

Dong, Y., Frangopol, D.M. and Saydam, D. (2013)
Column Displacement ductility PGA fc', fy, Cover depth, Diffusion coefficient, Chloride concentration
Analytical
Elnashai, A., Borzi, B., Vlachos, S. (2004) Column Displacement ductility PGA fc', fy, Analytical
Frankie (2013) Column Cracking, Yielding, Peak load, Loss of load capacity PGA Hybrid
Gardoni, P., Der Kiureghian, A., Mosalam, K. M. (2002)
Column Drift ratio -* fc', fy, fsu, ρ, Pr Experimental and statistical
Gardoni, P., Der Kiureghian, A., Mosalam, K. M. (2003)
Column Column deformation Sa fc', fy, ρ, Ksoil, D/Ds, L/H Analytical and Bayesian method
Gardoni, P and Rosowsky, D. (2011). Column Column deformation Sa fc', fy, ρ, Ksoil, D/Ds, L/H Bayesian
Updating
Ghosh, J. and Padgett, J.E. (2010).
Column, Bearing, Abutment
Curvature ductility, Bearing displacement, Abutment displacement
PGA
Cover depth, Diffusion coefficient, Chloride concentration, Rate of corrosion
Analytical
Huo, Y. and Zhang, J. (2013)
Column Section curvature PGA θ, T, G Analytical
Huang, Q., Gardoni, P. and Hurlebaus, S. (2010). Column Column deformation PGV fc', fy, θ, L, H, ρ, W, Ksoil,
D/Ds, Ka Analytical
Jara, J. M., Galvn, A., Jara, M. and Olmos, B. (2013)
Column, Isolation Bearing
Curvature ductility, Bearing displacement PGA -* Analytical
Karim K.R. and Yamazaki F. (2003) Column Park-Ang damage index PGA, PGV,
SI -* Analytical
Kwon, O.S. and Elnashai, A.S. (2010)
Bearing, Bent, Abutment
Bent deformation, Abutment deformation, Bearing deformation
PGA fc', fy, Sg, Su, Ksoil Analytical
200

Mackie, K., and Stojadinovic, B. (2005). Column
Peak steel strain, peak concrete strain, Peak column curvature, Curvature ductility, Displacement ductility, Drift ratio, Residual deformation index, Plastic rotation, Hysteretic energy, Normalized hysteretic energy
Is, Iv, FR1, FR2, Td, arms, EPD, EPV, EPA, Sd, R, M
fc', fy, θ, L, H, ρ, W, Ksoil, D/Ds Analytical
Moschonas, I.F., Kappos, A.J., Panetsos, P., Papadopoulos, V., Makarios, T., and Thanopoulos, P. (2009)
Column Column displacement PGA -* Analytical
Nielson, B.G. and DesRoches, R. (2007a,b)
Column, Bearing, Abutment
Curvature ductility, Bearing displacement, Abutment displacement
PGA fc', fy, μB, Ki, ξ, G, θ, Kr, Kθ, Ka, Loading direction Analytical
Padgett, J.E., Ghosh, J. and Dueñas-Osorio, L. (2013)
Column, Expansion bearing, Fixed bearing, Abutment piles
Curvature ductility, Bearing deformation, Abutment deformation, Pile deformation
PGA fy, μB, Ki, ξ, G, Sg, Su, Φ, p-y spring, da, db Analytical
Padgett, J.E. and DesRoches, R. (2008, 2009)
Column, Bearing, Abutment, Shear key, Restrainer
Curvature ductility, Bearing deformation, Abutment deformation
PGA
fc', fy, μB, Ki, ξ, G, θ, Kr, Kθ, Ka, Loading direction, Restrainser cable length and slack.
Analytical
Pan, Y., Agrawal, A. K., Ghosn, M., and Alampalli, S. (2010a,b)
Column, Bearing, Abutment
Curvature ductility, Bearing deformation, Abutment deformation
PGA fc', fy, W, ΔT, μB Analytical
Ramanathan, K., DesRoches, R. and Padgett, J.E. 2012
Column, Expansion bearing, Fixed bearing, Abutment
Curvature ductility, Bearing deformation, Abutment deformation
PGA
fc', fy, μB, Ki, ξ, G, θ, Kr, Kθ, Ka, α, Gb, Loading direction, Dowel bar trength
Analytical
Shinozuka et al. 2001 Column Displacement ductility PGA fc', fy Analytical, Empirical
201

Shinozuka, M., Feng, M. Q., Kim, H.-K., Kim, S.-H. (2000)
Column Displacement ductility PGA -* Analytical
Sung, Y.C. and Su, C.K. (2011) Column Displacement PGA -* Analytical
Tavares, D.H., Padgett, J.E. and Paultre, P. 2012
Column, Bearing, Wing wall, Back wall, Abutment footing
Displacement ductility, Bearing deformation, Wing wall and back wall displacement, Abutment deformation
PGA fc', fy, μB, Ki, ξ, G, θ, Kr, Kθ, Ka Analytical
Torbol, M. and Shinozuka, M. (2012a,b) Column Rotational ductility PGA α Analytical
Vosooghi, A. and Saiidi, M.S. (2012) Column
Maximum drift, Residual drift, Frequency ratio, Inelasticity index, Maximum steel strain
-* L/H, D, ρ, Scale factor Experimental
Yamazaki, F., Motomura, H. and Hamada, T. (2000).
Bridge Observed damage PGA, PGV -* Empirical
Zhang, J. and Huo, Y. (2009)
Column, Isolation Bearing
Curvature ductility, Bearing shear strain PGA -* Analytical
Zhong, J., Gardoni, P and Rosowsky, D. (2012). Column Deformation and Shear
deformation Sa
Model Uncertainty, Cover depth, Diffusion coefficient, Chloride concentration, Age factor, Environment factor, Test method factor, Curing factor
Analytical
Note: *no intensity measure or uncertain parameters was considered
202

Table A.0.2. Summary of regional fragility analysis of highway bridges
Region Author Bridge Type Features Eastern US: New
York
Pan et al. (2010a, 2010b) MSSS-SG Identification of vulnerable components and effect of different
retrofit measures
Central and
southern US
Choi et al. (2004)
MSSS-SG, MSC-SG,MSSS-PSC, MSC-PSC
Identified MSSS and MSC steel girder bridges as the most vulnerable ones
Nielson and DesRoches (2007a, 2007b
MSC concrete, MSC Slab, MSC Steel, MSSS concrete, MSSS Slab, MSSS conc . Box, MSSS Steel, SS Concrete, SS steel
Using a component level approach this study identified the steel girder bridges as the most vulnerable ones followed by concrete girder bridges and single span bridges of all types
Padgett and DesRoches (2008)
MSC concrete, MSC Slab, MSC Steel, MSSS concrete, MSSS Slab, MSSS conc . Box, MSSS Steel, SS Concrete, SS steel
Impact of different retrofit measures on bridge component vulnerability as well the bridge as a system. This study developed framework for the use of the fragility curves in retrofit selection including performance-based retrofit and cost-benefit analyses
Ramanathan et al. (2010a, 2012)
MSC concrete, MSC Steel, MSSS concrete, MSSS Steel
Investigated the influence of seismic detailing on the seismic vulnerability of four typical bridge classes in CSUS. Compared their fragility curves with HAZUS fragility curves and developed confidence bounds to characterize the uncertainty associated with the median fragility curve
Western US:
California
Mackie and Stojadinovic (2005)
Concrete Highway Overpass Bridges
Developed demand, damage, and decision fragility curves. These curves were so developed that they were conditioned on an arbitrary intensity measure that can be varied to best suit the structure and site of interest
Zhang and Huo (2009) MSC concrete box girder
Investigated the efficacy and optimal design parameters of isolation devices using a performance based evaluation approach based on PSDA and IDA.
203

Ramanathan (2012)
MSC Conc. Box Girder, MSC Slab, MSC Concrete Girder
Developed fragility curves for typical California bridge classes along with their evolution over three significant design eras. This study developed different damage states for different bridge components in alignment with CALTRANS design and operational guidelines
Dukes et al. (2013) MSC Conc. Box Girder
Proposed a new methodology to incorporate fragility analysis in the design of new bridges and suggested the use of the fragility curves as a design check which will enable the design engineer to determine if performance criteria have been met, and also provide information on potential uncertainty of the performance of the design
Eastern Canada
Tavares et al. (2012)
MSC Slab, MSC Steel, MSC Concrete, MSSS Concrete, MSSS Steel
Developed component and system fragility curves for five different bridge classes in Eastern Canada and concluded that the concrete girder bridges have relatively high vulnerability as compared to steel girder bridges
Lau et al. (2012) MSC-PSC
Proposed a methodology for developing fragility curves for bridges assuming that bridges having same structural configuration and designed and constructed at the same period will have similar vulnerability during a seismic event
Western Canada
Billah and Alam (2013) MSC Concrete Girder
Considering soil-structure interaction along with all types of uncertainties, this study developed fragility curves for MSC concrete girder bridges which represent a significant portion of highway bridges in BC
Japan
Yamazaki et al. (2000) Expressway bridges Developed fragility curves based on actual damage data.
Tanaka et al. (2000) Hanshin Expressway
Utilizing the actual damage data from the 1995 Hyogoken-Nanbu earthquake, this study developed the damage database with GIS. With this database, the fragility curves were developed assuming normal distributions and were evaluated in comparing with the probability damage matrix of ATC-13.
204
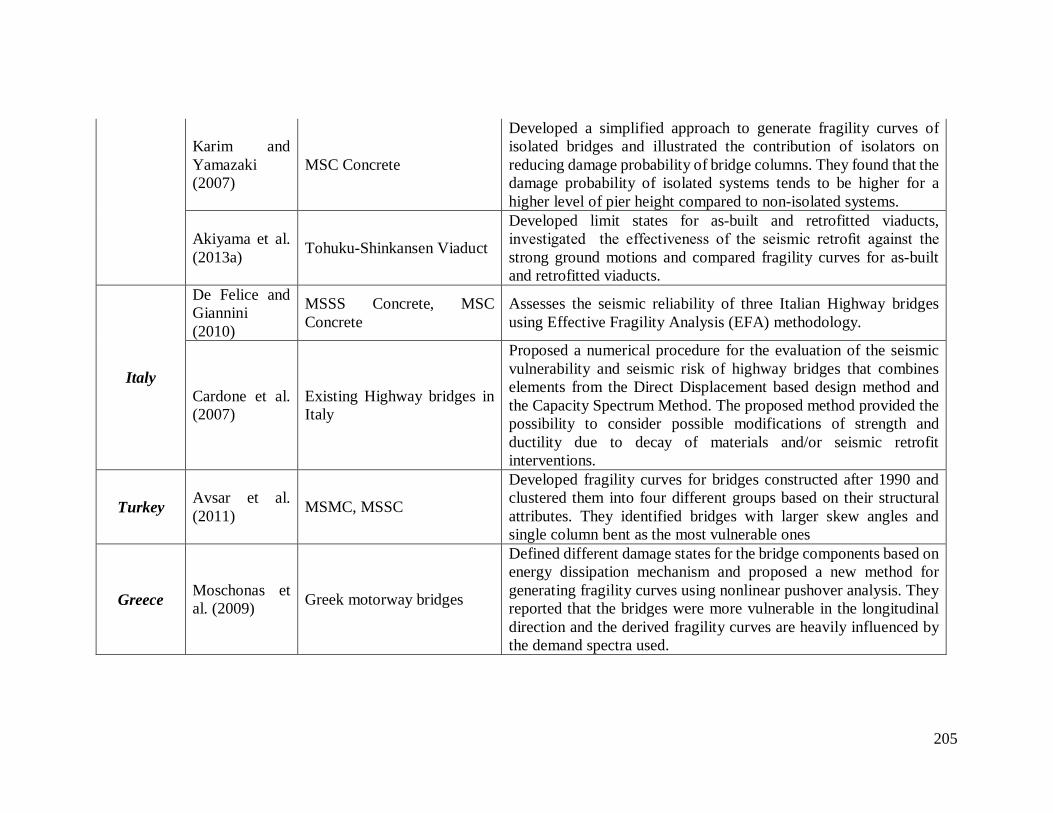
Karim and Yamazaki (2007)
MSC Concrete
Developed a simplified approach to generate fragility curves of isolated bridges and illustrated the contribution of isolators on reducing damage probability of bridge columns. They found that the damage probability of isolated systems tends to be higher for a higher level of pier height compared to non-isolated systems.
Akiyama et al. (2013a) Tohuku-Shinkansen Viaduct
Developed limit states for as-built and retrofitted viaducts, investigated the effectiveness of the seismic retrofit against the strong ground motions and compared fragility curves for as-built and retrofitted viaducts.
Italy
De Felice and Giannini (2010)
MSSS Concrete, MSC Concrete
Assesses the seismic reliability of three Italian Highway bridges using Effective Fragility Analysis (EFA) methodology.
Cardone et al. (2007)
Existing Highway bridges in Italy
Proposed a numerical procedure for the evaluation of the seismic vulnerability and seismic risk of highway bridges that combines elements from the Direct Displacement based design method and the Capacity Spectrum Method. The proposed method provided the possibility to consider possible modifications of strength and ductility due to decay of materials and/or seismic retrofit interventions.
Turkey Avsar et al. (2011) MSMC, MSSC
Developed fragility curves for bridges constructed after 1990 and clustered them into four different groups based on their structural attributes. They identified bridges with larger skew angles and single column bent as the most vulnerable ones
Greece Moschonas et al. (2009) Greek motorway bridges
Defined different damage states for the bridge components based on energy dissipation mechanism and proposed a new method for generating fragility curves using nonlinear pushover analysis. They reported that the bridges were more vulnerable in the longitudinal direction and the derived fragility curves are heavily influenced by the demand spectra used.
205

Algeria Kibboua et al. (2011)
Typical Algerian RC bridge piers
They found that cross sectional geometry and longitudinal reinforcement significantly affects the vulnerability of bridge piers. They concluded that bridges supported on wall piers have lower probability of damage as compared to the others
Korea Lee et al. (2007) Expressway bridges in Korea
Based on the capacity demand ratio of different bridge components, they defined three damage states for the Korean bridges. Using logistic curve equations, they developed relationship between peak ground acceleration and vulnerability.
Taiwan
Liao and Loh (2004) 16 types of highway bridges
Defined five different damage states based on the ductility and displacement demand. Although they carried out an extensive study they did not provide any conclusive remarks regarding the most vulnerable types of bridges.
Sung et al. (2013)
Existing Highway bridges in Taiwan
Proposed a rapid vulnerability assessment method for assessing the seismic vulnerability of existing bridges in Taiwan. The proposed system is capable of estimating and visually demonstrating different damage levels that bridges have encountered due to a specific seismic event and figure out the corresponding economic loss due to the damage of bridges.
MSSS=multi-span simply supported, MSC=multi-span continuous, SG= steel girder, PSC= prestressed concrete girder, MSMC= multi span, multi-column, MSSC=
multi span single column
206

Appendix B
Goodness-of-fit test
The goodness-of-fit of a statistical model describes how well it fits a set of observations.
Measures of goodness-of-fit typically summarize the discrepancy between the observed values
and the values expected under the model in question. Usually goodness-of-fit tests are based
on a null hypothesis that the sample data is taken from a larger population that follows a given
mathematical distribution. If the null hypothesis is accepted at a given level of significance (α),
than it is concluded that the chosen distribution fits the sample data. In this study, two different
levels of significance α= 2% and α=5% were considered to evaluate the fit of the considered
statistical distributions. The significance levels indicate that the chosen distribution has been
selected with a confidence level of 98% and 95%.
Different types of goodness-of-fit tests are available. One of the most commonly used
goodness-of-fit tests is the chi-squared test. It is often used to test if a sample of data came
from a population with a specific distribution (Snedecor and Cochran, 1989). The limitation
associated with this goodness-of-fit test is that it deals with data having only discrete values.
For non-discrete or continuous data (i.e. dispalcement and base shear), the chi-squared test
requires binning the sample data into arbitrary histogram cells which can directly impact the
results of the chi-squared test (D’Agostino and Stepehens, 1986). Another shortcoming of the
chi-squared test is that it requires a sufficient sample size in order for the chi-square
approximation to be valid.
Goodness-of-fit tests based on the empirical density functions (EDF) provide more powerful
goodness-of-fit tests for continuous data. Conover (1971) and D’Agostino and Stepehens
(1986) provided a detailed review of the goodness-of-fit tests based on EDF statistics. In the
present study, the Kolmogorov-Smirnov (K-S) “D” test was adopted (Mood et al., 1974). This
test compares the empirical cumulative distribution function with the cumulative distribution
function (CDF) of an assumed theoretical model. An advantage of this test is that the
distribution of the K-S test statistic itself does not depend on the underlying cumulative
distribution function being tested. Moreover, it is an exact test as compared to the chi-squared
test. The limitation of K-S test is that it only applies to continuous distribution and tends to be
more sensitive near the center of the distribution. The Kolmogorov-Smirnov (K-S) “D” test
207

statistics is based on a single, maximum vertical offset between the EDF and CDF over the
range of sample data. The maximum offset will always occur just to the left or right of an
observation point on the EDF. The value of “D” can be computed using equation B.1.
D= max (|F(x_i)-(i-1)/n|,|F(x_i )-i/n|) (B.1)
where, n is the sample size, xi is the sample data arranged in ascending order, and F(xi) is the
cumulative density function at xi for the statistical distribution under consideration. The first
term in equation 1 represents the vertical offset between the EDF and the CDF to the left of xi,
while the second term is the offset to the right of xi. The value of “D” represents the maximum
of all offsets computed for the entire sample. In particular, the maximum difference (D)
between the empirical (F (x)), based on n data, and the assumed theoretical (F (x)) (with known
parameters) over the entire range of the random variable X (e.g., the yield displacement)are
used as statistics. Then at various significance levels (2% and 5%), which are identified by the
scalar α, Dst is compared with the critical value Dcritical, defined as P[Dst ≤ Dcritical ] = 1 -
α. If the observed Dst is less than the critical value Dcritical, the assumed theoretical model is
acceptable at the specified significance level α.
208

Table B.0.1. Results of K-S goodness-of-fit tests for Spalling Drift Limit
Distribution Bridge Pier
SMA-RC-1 SMA-RC-2 SMA-RC-3 SMA-RC-4 SMA-RC-5
Normal Dst 0.0711 Dst 0.0853 Dst 0.0962 Dst 0.0619 Dst 0.0764
α 0.05 0.02 α 0.05 0.02 α 0.05 0.02 α 0.05 0.02 α 0.05 0.02
Dcritical 0.0955 0.1068 Dcritical 0.0955 0.1068 Dcritical 0.0955 0.1068 Dcritical 0.0955 0.1068 Dcritical 0.0955 0.1068
Fit Yes Yes Fit Yes Yes Fit No Yes Fit Yes Yes Fit Yes Yes
Lognormal Dst 0.0727 Dst 0.0871 Dst 0.0986 Dst 0.0696 Dst 0.0791
α 0.05 0.02 α 0.05 0.02 α 0.05 0.02 α 0.05 0.02 α 0.05 0.02
Dcritical 0.0955 0.1068 Dcritical 0.0955 0.1068 Dcritical 0.0955 0.1068 Dcritical 0.0955 0.1068 Dcritical 0.0955 0.1068
Fit Yes Yes Fit Yes Yes Fit No Yes Fit Yes Yes Fit Yes Yes
Gamma Dst 0.0722 Dst 0.086 Dst 0.0978 Dst 0.0671 Dst 0.0787
α 0.05 0.02 α 0.05 0.02 α 0.05 0.02 α 0.05 0.02 α 0.05 0.02
Dcritical 0.0955 0.1068 Dcritical 0.0955 0.1068 Dcritical 0.0955 0.1068 Dcritical 0.0955 0.1068 Dcritical 0.0955 0.1068
Fit Yes Yes Fit Yes Yes Fit No Yes Fit Yes Yes Fit Yes Yes
Weibull Dst 0.0834 Dst 0.1098 Dst 0.1173 Dst 0.0798 Dst 0.0871
α 0.05 0.02 α 0.05 0.02 α 0.05 0.02 α 0.05 0.02 α 0.05 0.02
Dcritical 0.0955 0.1068 Dcritical 0.0955 0.1068 Dcritical 0.0955 0.1068 Dcritical 0.0955 0.1068 Dcritical 0.0955 0.1068
Fit No Yes Fit No No Fit No Yes Fit Yes Yes Fit Yes Yes
Best Fit Normal Normal Normal Normal Normal
209

Table B.0.2. Results of K-S goodness-of-fit tests for Yielding Drift Limit
Distribution Bridge Pier
SMA-RC-1 SMA-RC-2 SMA-RC-3 SMA-RC-4 SMA-RC-5
Normal
Dst 0.1029 Dst 0.1064 Dst 0.1056 Dst 0.0979 Dst 0.0965
α 0.05 0.02 α 0.05 0.02 α 0.05 0.02 α 0.05 0.02 α 0.05 0.02
Dcritical 0.0955 0.1068 Dcritical 0.0955 0.1068 Dcritical 0.0955 0.1068 Dcritical 0.0955 0.1068 Dcritical 0.0955 0.1068
Fit No Yes Fit No Yes Fit No Yes Fit Yes Yes Fit Yes Yes
Lognormal
Dst 0.1023 Dst 0.1012 Dst 0.1005 Dst 0.0689 Dst 0.0832
α 0.05 0.02 α 0.05 0.02 α 0.05 0.02 α 0.05 0.02 α 0.05 0.02
Dcritical 0.0955 0.1068 Dcritical 0.0955 0.1068 Dcritical 0.0955 0.1068 Dcritical 0.0955 0.1068 Dcritical 0.0955 0.1068
Fit No Yes Fit No No Fit No No Fit Yes Yes Fit Yes Yes
Gamma
Dst 0.1039 Dst 0.1171 Dst 0.1083 Dst 0.0698 Dst 0.0887
α 0.05 0.02 α 0.05 0.02 α 0.05 0.02 α 0.05 0.02 α 0.05 0.02
Dcritical 0.0955 0.1068 Dcritical 0.0955 0.1068 Dcritical 0.0955 0.1068 Dcritical 0.0955 0.1068 Dcritical 0.0955 0.1068
Fit No Yes Fit No No Fit No No Fit Yes Yes Fit Yes Yes
Weibull
Dst 0.1056 Dst 0.1153 Dst 0.1019 Dst 0.0703 Dst 0.1111
α 0.05 0.02 α 0.05 0.02 α 0.05 0.02 α 0.05 0.02 α 0.05 0.02
Dcritical 0.0955 0.1068 Dcritical 0.0955 0.1068 Dcritical 0.0955 0.1068 Dcritical 0.0955 0.1068 Dcritical 0.0955 0.1068
Fit No Yes Fit No Yes Fit No Yes Fit No Yes Fit No No
Best Fit Lognormal Lognormal Lognormal Lognormal Lognormal
210
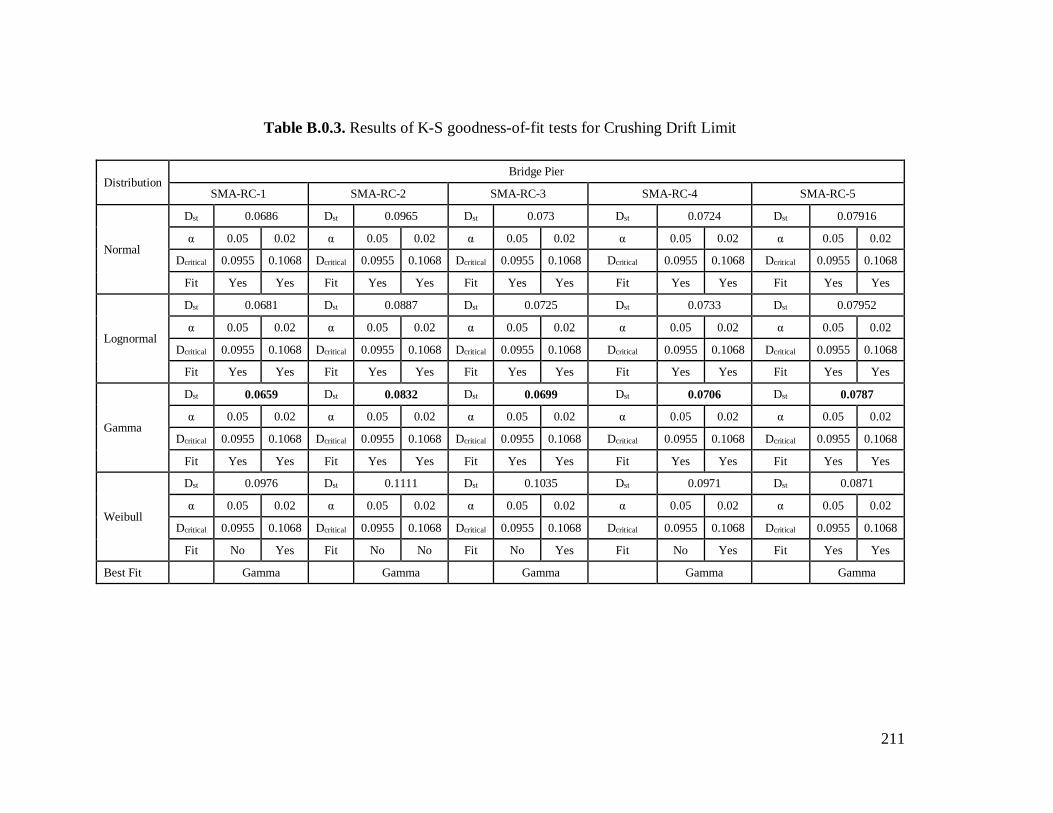
Table B.0.3. Results of K-S goodness-of-fit tests for Crushing Drift Limit
Distribution Bridge Pier
SMA-RC-1 SMA-RC-2 SMA-RC-3 SMA-RC-4 SMA-RC-5
Normal
Dst 0.0686 Dst 0.0965 Dst 0.073 Dst 0.0724 Dst 0.07916
α 0.05 0.02 α 0.05 0.02 α 0.05 0.02 α 0.05 0.02 α 0.05 0.02
Dcritical 0.0955 0.1068 Dcritical 0.0955 0.1068 Dcritical 0.0955 0.1068 Dcritical 0.0955 0.1068 Dcritical 0.0955 0.1068
Fit Yes Yes Fit Yes Yes Fit Yes Yes Fit Yes Yes Fit Yes Yes
Lognormal
Dst 0.0681 Dst 0.0887 Dst 0.0725 Dst 0.0733 Dst 0.07952
α 0.05 0.02 α 0.05 0.02 α 0.05 0.02 α 0.05 0.02 α 0.05 0.02
Dcritical 0.0955 0.1068 Dcritical 0.0955 0.1068 Dcritical 0.0955 0.1068 Dcritical 0.0955 0.1068 Dcritical 0.0955 0.1068
Fit Yes Yes Fit Yes Yes Fit Yes Yes Fit Yes Yes Fit Yes Yes
Gamma
Dst 0.0659 Dst 0.0832 Dst 0.0699 Dst 0.0706 Dst 0.0787
α 0.05 0.02 α 0.05 0.02 α 0.05 0.02 α 0.05 0.02 α 0.05 0.02
Dcritical 0.0955 0.1068 Dcritical 0.0955 0.1068 Dcritical 0.0955 0.1068 Dcritical 0.0955 0.1068 Dcritical 0.0955 0.1068
Fit Yes Yes Fit Yes Yes Fit Yes Yes Fit Yes Yes Fit Yes Yes
Weibull
Dst 0.0976 Dst 0.1111 Dst 0.1035 Dst 0.0971 Dst 0.0871
α 0.05 0.02 α 0.05 0.02 α 0.05 0.02 α 0.05 0.02 α 0.05 0.02
Dcritical 0.0955 0.1068 Dcritical 0.0955 0.1068 Dcritical 0.0955 0.1068 Dcritical 0.0955 0.1068 Dcritical 0.0955 0.1068
Fit No Yes Fit No No Fit No Yes Fit No Yes Fit Yes Yes
Best Fit Gamma Gamma Gamma Gamma Gamma
211

Appendix C
Curve fitting
In this study several regression analyses were conducted for developing different equations such
as, bond stress of SMA rebar in concrete, plastic hinge length equation for SMA-RC bridge pier,
residual drift prediction of SMA-RC elements. All these equations were developed based on data
from experimental and numerical studies. However, all these equations contain several
independent variable. In this study, different forms of regression equations were tested to find the
"best fit" line or curve for a series of data points. The criteria for selecting the suitable equation
type was the minimum square of the error between the original data and the values predicted by
the equation. Although technique may not be the most statistically robust method of fitting a
function to a data set, it has the advantage of being relatively simple. Table C.0.1 provides a list
of equation tested throughout this study.
Table C.0.1. List of equations tested
Equation Category Equation Name Sample Equation
Standard curves Linear axyy += 0
Quadratic 20 bxaxyy ++=
Logarithm 2 parameter xayy ln0 +=
3 parameter ( )00 ln xxayy −+=
Polynomial Linear axyy += 0
Quadratic 20 bxaxyy ++=
Power 3 parameter baxyy += 0
212

Modified pareto function ( )bax
y+
−=1
11
213