Embed Size (px)
Citation preview

State of Washington Joint Legislative Audit and Review Committee (JLARC)
Performance Audit of Capital Budget Processes
Report 05-7
February 8, 2005
Upon request, this document is available in alternative formats for persons with disabilities.

JOINT LEGISLATIVE AUDIT AND REVIEW COMMITTEE 506 16th Avenue SE PO Box 40910 Olympia, WA 98501-2323 (360) 786-5171 (360) 786-5180 Fax http://jlarc.leg.wa.gov
Committee Members SENATORS Brad Benson
Darlene Fairley
Jeanne Kohl-Welles
Bob Oke
Linda Evans Parlette, Secretary
Debbie Regala, Chair
Pat Thibaudeau
Joseph Zarelli
REPRESENTATIVES Gary Alexander, Vice Chair
Glenn Anderson
Kathy Haigh
Janéa Holmquist
Ross Hunter, Asst. Secretary
Fred Jarrett
Kelli Linville
Deb Wallace
LEGISLATIVE AUDITOR Cindi Yates
The Joint Legislative Audit and Review Committee (JLARC) carries out oversight, review, and evaluation of state-funded programs and activities on behalf of the Legislature and the citizens of Washington State. This joint, bipartisan committee consists of eight senators and eight representatives, equally divided between the two major political parties. Its statutory authority is established in RCW 44.28. JLARC staff, under the direction of the Committee and the Legislative Auditor, conduct performance audits, program evaluations, sunset reviews, and other policy and fiscal studies. These studies assess the efficiency and effectiveness of agency operations, impacts and outcomes of state programs, and levels of compliance with legislative direction and intent. The Committee makes recommendations to improve state government performance and to correct problems it identifies. The Committee also follows up on these recommendations to determine how they have been implemented. JLARC has, in recent years, received national recognition for a number of its major studies.

PERFORMANCE AUDIT OF CAPITAL BUDGET
PROCESSES
REPORT 05-7
REPORT DIGEST
FEBRUARY 8, 2005
STATE OF WASHINGTON
JOINT LEGISLATIVE AUDIT AND REVIEW COMMITTEE
STUDY TEAM
Karen Barrett Isabel Muñoz-Colón
Deb Frazier John Woolley
LEGISLATIVE AUDITOR
Cindi Yates
Copies of Final reports and Digests are
available on the JLARC website at:
http://jlarc.leg.wa.gov
or contact
Joint Legislative Audit & Review Committee 506 16th Avenue SE
Olympia, WA 98501-2323 (360) 786-5171
(360) 786-5180 FAX
Mandate
The 2003-2005 Capital Budget directs JLARC to conduct a performance audit of state capital planning, design, and construction processes. In this study, we provide an overview of the capital process, including policy history and oversight roles and responsibilities. We describe the criteria used to evaluate agency planning and execution activities, provide an overall assessment of performance, and highlight good practices and areas of concern. We then describe the evaluation criteria used to assess executive branch oversight activities, and provide an overall assessment of performance and areas of concern.
Background
Washington pays for its long-term investments in public lands and facilities through the state Capital Budget. This budget, presently $2.8 billion in the 2003-05 Biennium, funds over 500 capital projects and programs administered by 36 different state agencies for purposes that range from the construction and repair of state prisons and universities to the distribution of grants, loans, and other pass-through capital for local infrastructure and environmental projects. Nearly $12 billion was spent for these purposes between 1995 and 2004. Major state facility projects comprise just under one-third of this cumulative investment to date.
Study Method
JLARC selected eight state agencies that make up 82 percent of authorized state facility spending to participate in this performance audit: the State Board for Community & Technical Colleges (SBCTC), University of Washington, Washington State University, Western Washington University, Department of Corrections (DOC), Department of Social & Health Services (DSHS), Department of General Administration (GA), and the Military Department. This study also includes a review of the oversight responsibilities of the Office of Financial Management (OFM), GA, and SBCTC, as well as the advisory role of the Higher Education and Coordination Board. The review of these agencies included:
• Conducting interviews with capital staff using best practices for planning and execution.
• Evaluating 17 project case studies to evidence these practices at work in agencies and to test a cross-cutting set of performance indicators.
• Compiling a project portfolio of 200 major facility projects that, in one place, includes all relevant data for each project.

STUDY CONCLUSIONS The study presents findings in three areas of capital process performance:
Agency Planning for Major Facility Projects
JLARC’s overall assessment of agency planning practices is that agencies are planning for major facility construction using a comprehensive, data-driven process. We identify examples of good practices, which are highlighted within this report. We also identify concerns related to strategic planning and the timing of agencies’ revalidation of assumptions before construction.
Agency Execution of Major Facility Projects
JLARC’s overall assessment of agency construction management is that agencies are generally successful in managing construction of major facility projects. We identify and highlight in the report good practices. We also discuss concerns related to early establishment of dispute resolution mechanisms and control of project definition.
Executive Oversight for Agencies’ Major Capital Facility Programs
JLARC concludes that executive oversight of facility projects is not being accomplished in the manner required by statute and OFM’s own process as outlined in the Capital Budget Instructions. We discuss the importance of early intervention in the capital process to affect costs. JLARC looked at where in the process most of OFM’s effort occurs, and the factors affecting the ability of OFM to fulfill its oversight responsibilities.
RECOMMENDATION This study was an evaluation of the state capital process. The greatest weakness we found centered on resources and priorities for OFM. Therefore, our recommendation that follows addresses issues only at this level.
Recommendation
The Office of Financial Management should develop a plan in consultation with fiscal committees and agency capital officers to address weaknesses in oversight that are outlined in this report. The plan should address the following issues:
• Aligning resources to program workload;
• Identifying and institutionalizing procedures and best practices;
• Creating easily accessible, reliable information systems;
• Developing statewide performance measures for all capital projects; and
• Evaluating projects earlier in the planning phases.
The intent is to strengthen and refine OFM activities and information in ways that benefit all the participants in the state capital process.

TABLE OF CONTENTS CHAPTER ONE: INTRODUCTION, BACKGROUND & CONCLUSIONS IN BRIEF .... 1
OVERVIEW..................................................................................................................... 1 BACKGROUND................................................................................................................ 2 STUDY CONCLUSIONS-IN-BRIEF ...................................................................................... 2 STUDY METHOD............................................................................................................. 3
CHAPTER TWO: THE “NUTS AND BOLTS” OF PLANNING AND BUILDING MAJOR CAPITAL PROJECTS .................................................................................................... 5
OVERVIEW..................................................................................................................... 5 POLICY – HOW WE GOT HERE .......................................................................................... 5 ROLES – LEGISLATURE, OFM AND OTHER AGENCIES ....................................................... 6 PROCESS – SEQUENCE OF ACTIVITIES FOR MAJOR CAPITAL PROJECTS ............................. 7 SUMMARY ................................................................................................................ 10
CHAPTER THREE: AGENCY PLANNING AND EXECUTION ................................... 11 CHAPTER OVERVIEW .................................................................................................... 11 PLANNING.................................................................................................................... 11 EXECUTION.................................................................................................................. 15 CHAPTER FINDINGS IN REVIEW...................................................................................... 17
CHAPTER FOUR: OVERSIGHT FOR MAJOR CAPITAL PROJECTS ...................... 19 CHAPTER OVERVIEW.................................................................................................... 19 OFM’S ROLE IN THE CAPITAL BUDGET PROCESS............................................................ 19 ACTIVITY ASSESSMENT & THE IMPORTANCE OF FRONT-END REVIEWS............................. 21 CHAPTER FINDINGS IN REVIEW...................................................................................... 25
CHAPTER FIVE: CONCLUSIONS AND AUDIT RECOMMENDATIONS ................... 27 AGENCY PLANNING FOR MAJOR FACILITY PROJECTS ...................................................... 27 AGENCY EXECUTION OF MAJOR FACILITY PROJECTS ...................................................... 27 OVERSIGHT FOR AGENCIES’ MAJOR CAPITAL FACILITY PROGRAMS.................................. 27 AGENCY RESPONSES ................................................................................................... 28 ACKNOWLEDGEMENTS.................................................................................................. 28
APPENDIX 1 – SCOPE AND OBJECTIVES ................................................................ 29
APPENDIX 2 – AGENCY RESPONSES ...................................................................... 31
APPENDIX 3 – PLANNING PHASE BEST PRACTICES............................................. 35
APPENDIX 4 – EXECUTION PHASE BEST PRACTICE CRITERIA AND ASSESSMENT ............................................................................................................. 37
APPENDIX 5 – MAJOR PROJECT PORTFOLIO: EXAMPLE PROJECT REPORT .. 39

APPENDIX 6 – CASE STUDY METHODOLOGY ........................................................ 41
APPENDIX 7 – CASE-STUDY PROJECT SUMMARIES ............................................. 65
APPENDIX 8 – OFM PROJECT TRACKING SYSTEMS ............................................. 71

CHAPTER ONE: INTRODUCTION, BACKGROUND, & CONCLUSIONS IN BRIEF
OVERVIEW The 2003 Capital Budget instructs the Joint Legislative Audit and Review Committee (JLARC) to study state capital planning, design, and construction processes (Chapter 26, Laws of 2003, 1st Extraordinary Session). The last comprehensive JLARC review of the Capital Budget process occurred 18 years ago.1 Since then, JLARC has engaged in many capital related studies such as the Washington School for the Deaf Capital Facility Study and the Capital Budget Staffing and Administrative Costs Study. For this 2004 review, JLARC focuses on agency practice and performance and statewide oversight for major state facility projects. For purposes of this study, a major project is defined as a project that costs more than $5 million and requires two or three biennia to design, construct, and occupy. Major facility projects have historically comprised approximately 30 percent of the state Capital Budget, as demonstrated in Figure 1.
In this study we provide an overview of the capital process, including policy history and oversight roles and responsibilities. We describe the criteria used to evaluate agency planning and execution activities, provide an overall assessment of performance, and highlight
Figure 1 – Major Projects Account for Approximately 30% of State Capital Spending
$12 Billion in Capital Spending Between 1995-97 and 2003-05
Major State Facility Projects $4 billion
30% of total
Small State Facility Projects $2 billion
17% of total Other Capital
Budget Programs $6 billion
53% of total
(primarily grants and
loans to support local government
projects)
1 Program and Fiscal Review of State Capital Planning and Budgeting Process. Report No. 87-6 by the Legislative Budget Committee (now known as JLARC).
1

PERFORMANCE AUDIT OF CAPITAL BUDGET PROCESSES
good practices and areas of concern. We describe the evaluation criteria used to assess executive branch oversight activities, and provide an overall assessment of performance and areas of concern. We also provide our conclusions, findings, and recommendations to improve the state’s ability to make informed investment decisions in the capital construction program.
BACKGROUND Washington pays for its long-term investments in public lands and facilities through the state Capital Budget. This budget, presently $2.8 billion in the 2003-05 Biennium, funds over 500 capital projects and programs administered by 36 different state agencies for purposes that range from the construction and repair of state prisons and universities to the distribution of grants, loans, and other pass through capital for local infrastructure and environmental projects.2 Nearly $12 billion was spent between fiscal years 1995 and 2004. Major state facility projects comprise just under one-third of this cumulative investment to date.
Washington State owns and operates a variety of facilities to house its programs, including office buildings, laboratories, libraries, classrooms, armories, prisons and hospital wards. Each biennium, lawmakers consider proposals to acquire lands and to construct, repair, and renovate these public assets. The Office of Financial Management, Department of General Administration, and individual agencies oversee the actual facilities work that occurs, much of which is contracted out to private firms.
STUDY CONCLUSIONS-IN-BRIEF The study presents findings in three areas of capital process performance:
Agency Planning for Major Facility Projects
JLARC’s overall assessment of agency planning practices is that agencies are planning for major facility construction using a comprehensive, data-driven process. We identify examples of good practices, which we highlight within this report. We also identify concerns related to strategic planning and the timing of agency updates to assumptions for construction needs.
Agency Execution of Major Facility Projects
JLARC’s overall assessment of agency construction management is that agencies are generally successful in managing construction of major facility projects. We identify and highlight in the report good practices. We also discuss concerns related to early establishment of dispute resolution mechanisms and control of project definition.
Executive Oversight for Agencies’ Major Capital Facility Programs
JLARC concludes that executive oversight of facility projects is not being accomplished in the manner required by statute and OFM’s process as outlined in the Capital Budget Instructions. We discuss the importance of early intervention in the capital process to affect costs. JLARC
2 This does not include the large capital program of the Washington State Department of Transportation (WSDOT).
2

PERFORMANCE AUDIT OF CAPITAL BUDGET PROCESSES
looked at where most of OFM’s staff effort occurs in the capital process, and the factors affecting the ability of OFM to fulfill its oversight responsibilities.
STUDY METHOD JLARC selected eight state agencies to participate in this performance audit.3 These eight agencies make up 82 percent of authorized state facility spending as shown in Figure 2 below. This study also includes a review of the oversight responsibilities of the Office of Financial Management, the Department of General Administration, the State Board for Community and Technical Colleges, as well as the advisory role of the Higher Education and Coordination Board. JLARC found that the state’s monitoring systems currently do not provide ready access to key budgeting, management, and performance information for major state projects. As a result, JLARC developed a review method to overcome these issues, which included:
• Conducting interviews with capital staff using best practices for planning and execution;
• Evaluating 17 project case studies to evidence these practices at work in agencies and test a cross-cutting set of performance indicators; and
• Compiling a major project portfolio of 200 major facility projects that, in one place, contains all relevant data for each project.
Figure 2 - Eight Large Agencies Account for 82 Percent of State Capital Facilities Spending
Agency Percent Of Total Appropriations
1995-97 to 2003-05
Community & Technical Colleges 24%
University of Washington 15%
Department of Corrections 15%
Washington State University 10%
Department of Social & Health Services 6%
Department of General Administration 6%
Military Department 3%
Western Washington University 3%
All Other Agencies 18%
TOTAL 100%
3 The Legislature asked JLARC to focus on higher education, corrections and social service agencies. Chapter 26, Laws of 2003, 1st Extraordinary Session.
3

PERFORMANCE AUDIT OF CAPITAL BUDGET PROCESSES
4

CHAPTER TWO: THE “NUTS AND BOLTS” OF PLANNING AND BUILDING MAJOR CAPITAL PROJECTS
OVERVIEW There has been significant change since the last comprehensive legislative performance audit of the Capital Budget process which occurred 18 years ago.4
This current JLARC audit focuses on two key areas:
1. Statewide oversight, and
2. Agency practice and performance for major state facility projects.
For purposes of this study, a major project is defined as a project that costs more than $5 million and requires four to six years to design, construct, and occupy.
In this chapter, we provide a summary of today’s capital process, which was developed at the start of the 1990s. This “nuts and bolts” description covers:
Policy: A recap of history that helps explain the state’s current policy governing the oversight roles and capital process.
Roles: A summary of the oversight roles of the Legislature and executive branch for the capital process.
Process: A description of the capital process, the milestones and activities as major state facility projects advance from concept to construction.
POLICY – HOW WE GOT HERE The current capital process dates back to initiatives in the 1980s designed to build greater confidence in Washington’s financial reputation. The state was forced to revaluate the capital process soon after the default of Washington Public Power Supply System (WPPSS) bonds. The lack of data or a policy framework for debt-financed investments was deemed a liability by Wall Street and the investment community.
The state needed a way to look at capital projects and cash requirements comprehensively over time. In addition, legislators lacked ways to independently assure that cost and scope for major
4 For the last comprehensive audit of the Capital Budgeting process, see “Program and Fiscal Review of State Capital Planning and Budgeting Process. Report No. 87-6” by the Legislative Budget Committee (now known as JLARC)(1987).
5
PERFORMANCE AUDIT OF CAPITAL BUDGET PROCESSES
projects were appropriate. A six-year master plan was issued in 1985, and the Legislature began to put limits on capital spending in order to lend predictability to the process. The Office of Financial Management (OFM) hired professionals capable of evaluating and validating building programs and unit costs included in agency budget requests. In 1991, a new statute required the Governor to prepare a statewide, ten-year facilities plan. OFM published a pre-design manual to guide agency capital plan development. Within three years, several other changes were implemented to lend more structure to the Capital Budget process:
• Adoption of a two-step funding process for large capital projects requiring OFM review and approval of facility plans before construction funds were made available;
• Creation of an accounting system for OFM to monitor capital project expenditures and schedules; and
• Establishment of a facility inventory system to account for owned and leased space.
ROLES – LEGISLATURE, OFM, AND OTHER AGENCIES The Legislature makes the final decision on which capital projects are to be funded. Since most projects are funded in steps (pre-design, design, construction), the Legislature makes a series of funding decisions. The Governor, in turn, provides a similar high level oversight role by proposing, signing, or in some cases, vetoing specific areas of the Capital Budget.
The Budget & Accounting Act (RCW 43.88.110) requires OFM to assure that major projects as designed are reviewed before construction to reduce long-term costs and increase facility efficiency. Budget provisos in the Capital Budget typically reinforce these requirements and direct OFM to:
• Evaluate facility program requirements and consistency with long-range plans;
• Utilize a system of cost, quality, and performance standards to compare major construction projects;
• Review value engineering studies—a means of ensuring that life-cycle costs are minimized; and
• Confirm that constructability analysis occurs—an assessment of whether the building can be readily constructed on the basis of architectural plans and bidding documents.
OFM’s second major area of responsibility – authorizing expenditures, and monitoring projects after they are funded – is also set forth in the Budget and Accounting Act, and in provisos to the Capital Budget. OFM’s duties include:
6

PERFORMANCE AUDIT OF CAPITAL BUDGET PROCESSES
1. Approving spending plans (allotments) for projects poised to proceed, including specific authorization for agencies to enter into contracts.5
2. Monitoring projects as they proceed. This requisite activity includes:
⇒ Recording total project cost estimates including past, current, and future biennial capital spending;
⇒ Comparing actual costs to estimates, with additional details for major projects;
⇒ Comparing expected design or construction start and completion dates with actual dates realized; and
⇒ Approving and documenting fund transfers between authorized capital projects.
OFM is also responsible for oversight of agencies executing grants and loan capital programs, and agencies executing minor works projects.
Three other agencies also have statutory oversight responsibilities for the capital process.
1. The Department of General Administration (GA) manages projects for state agencies other than the four-year higher education institutions, and the Departments of Transportation, Fish and Wildlife, Natural Resources, and State Parks and Recreation. GA is also responsible for reviewing capital funding requests over $2.5 million made by its client agencies “to ensure that the amount requested by the agency is appropriate for predesign, design, and construction, depending on the phase of the project being requested.” 6
2. The State Board on Community and Technical Colleges (SBCTC) has oversight responsibility for capital requests for two-year colleges.
3. The Higher Education Coordination Board (HECB) acts as an advisory body to the Governor and Legislature about the business, programs, and activities of Washington’s four-year universities.
PROCESS – SEQUENCE OF ACTIVITIES FOR MAJOR CAPITAL PROJECTS The capital process for major projects has two major phases: planning and execution. Each of these phases has major milestones and state budget related tasks that are illustrated and described in Figure 3.
5 Some spending plans carry additional requirements that OFM evaluate unit costs, compare with similar facilities and consider caseload or service levels. 6 Chapter 277, Laws of 2004 (Supplemental Capital Budget).
7

PERFORMANCE AUDIT OF CAPITAL BUDGET PROCESSES
Figure 3 – How Major Projects over $5 Million are Planned and Executed
Proj
ect E
xecu
tion
Concept of Need
Agencies: • Review current facilities, look at trends: cases, enrollment, etc. • Define what they can and cannot do with existing space • Determine what type of building best meets their space needs • Submit ten-year plan (prioritized projects) • Submit project request report (PRR) • Request predesign funding OFM: • Works with agencies on planning and capital needs • Reviews agency ten-year plans • Reviews project request reports (PRR) • Approves or denies request predesign funding Legislature: • Approves or denies request for predesign funding
Construction
Te
n
Ye
ar
s
or
L
es
s
Fo
ur
to S
ix Y
ea
rs
Agencies: • Develop predesigns (rough sketches) and examine alternatives • Develop and analyze cost estimates • Review assumptions from the “need” stage • Organize project team • Refine and finish design, as required for future occupants • Conduct value engineering and constructability reviews • Report to OFM through predesign and design documents OFM: • Reviews predesigns • Makes decision for funding final design • Reviews agency assumptions • Makes decision for funding construction Legislature: • Approves or denies design funding requests • Approves or denies construction funding requests
Predesign & Design
Agencies: • Request bids for construction • Select construction firm • Work with construction firms • Undertake commissioning process (checking to make certain
building electrical, water, air, etc., work) OFM: • Reviews project status reports. Assures that agency building is
within scope • Monitors expenditures for cash flow and budget control Legislature: • Makes decision on re-appropriations or additional
appropriations
Proj
ect P
lann
ing
8

PERFORMANCE AUDIT OF CAPITAL BUDGET PROCESSES
Concept of Need
Planning starts at the agency level with the concept of need. The agency analyzes its future programmatic needs and evaluates the capacity of existing buildings to develop rough footprints for future facilities.
This analysis is documented in two ways. First, it is documented in the agency’s strategic plan (this can be in a master plan or some other agency strategic planning document). This documentation provides linkages from an agency’s mission and goals, operational demands, current facility conditions, and usage to future project requests.
From this planning effort, OFM asks agencies to submit a ten-year plan. Within the ten-year plan, the agency outlines programmatic needs, presents solutions, and prioritizes project proposals.
The Capital Budget instructions acknowledge that uncertainty about program needs increases as an agency predicts further out into the future. Consequently, the last four years of a ten-year plan are less detailed than the first six years. As a result, the ten-year plan is also referred to as the six-year plan, since this earlier section of the document contains greater detail concerning an agency’s future facility requests.
As an agency project moves from concept to request, the agency submits a Project Request Report (PRR). Requirement for the PRR started in 2001.7 Agencies are required to submit a PRR to OFM before requesting predesign funds. The capital instructions state that the PRR should tie facility proposals to agency and institutional strategic and/or master plans.
Project Funding Requests
The Legislature approves major project funding one phase at a time, beginning each 24-month biennium. The first funding request, or project phase, is the facility predesign study. According to OFM’s budget instructions, the predesign study was created to understand the facility need and to provide well thought-out options to meet that need. Agencies are required to provide “a brief description of each alternative that was considered, and the reasons for rejecting each alternative that is not adopted.”8 The predesign also includes a preliminary estimate of construction costs which helps the state size its overall budget. Agencies may hire architect/engineer (A & E) firms to help develop the predesign.
After predesign is complete, funding may be provided for facility design. In this phase, agencies hire an A & E firm to flesh out the rough schematic predesign. Cost figures are also refined.
The design phase is the point in the process where the planning and execution phases of a project overlap. For example, the design phase should include a constructability review which is an assessment of whether the building can be readily constructed based on architectural plans and bidding documents. The purpose of the constructability review is to reduce the number of construction change orders or claims.
7 Office of Financial Management, 2001-2003 Predesign Manual, pages 1-3. 8 Office of Financial Management, 2001-2003 Predesign Manual, page 25.
9

PERFORMANCE AUDIT OF CAPITAL BUDGET PROCESSES
The next step is funding for construction. At this point, agencies consider a number of public works contracting methods to select a construction firm. Agencies, through their project managers, work with private firms through construction and the final acceptance of the new or modified facility.
SUMMARY Planning, designing, and constructing a major capital project are complex undertakings. In this audit, we focus only on the roles and responsibilities of state government (contractors also play important and sometimes key roles in project planning and execution). Throughout this chapter, we have intentionally simplified the description of processes to present the “nuts and bolts” of these complex undertakings. In the next two chapters, we provide more details on agency planning and execution phases of major projects as well as the oversight role played by OFM and the Legislature.
10

CHAPTER THREE: AGENCY PLANNING AND EXECUTION
CHAPTER OVERVIEW Using case studies, JLARC examined planning for and execution of major facility projects by eight state agencies selected for this performance audit. This chapter discusses our approach and conclusions for the two major phases of these large capital projects.
For both phases, we assembled and applied evaluation criteria based on best practice information (as explained below). In general, we found that agencies do a good job with planning, and we identified several examples of good practices. We did identify a few areas of concern: the need to clarify the role of master plans, and to clarify expectations of when it is appropriate to update the assumptions driving the need for a facility.
In general, agencies are executing major capital construction well. Again, we have specific concerns regarding dispute resolution and project definition.
JLARC’s conclusions are base“state” of capital planning and eSince we used case studies, we dThis is because of the limiteimportance, official performanpoints to weakness in how thdiscussed in Chapter 4.
PLANNING Overview
The planning phase involves anafacility to meet its current or futuat the estimated cost and scheduagency planning practices, illustrin which state agencies can impro
Best Practice Principles an
Our goal in developing a set ofenough to apply to a range of a
A Note On Methodology
d on the use of case studies. While designed to reflect the xecution, there will always be exceptions to the cases studies. id not publish project- or agency-specific ratings in this audit. d number of cases sampled for each agency. Of equal ce benchmarks don’t exist for Washington agencies. This e oversight of the capital process presently functions, as
lysis aimed at making certain an agency is building the right re needs. Execution is the process of ensuring a facility is built le. This section describes the criteria JLARC used to evaluate ates best practices at work in state agencies, and discusses areas ve their capital process.
d Overall Assessment
best practices was to identify principles that would be broad gencies, but still be substantive enough to allow for a critical
11
PERFORMANCE AUDIT OF CAPITAL BUDGET PROCESSES
analysis of the planning process used by agencies. In developing criteria to review planning JLARC drew from local, state, and federal practices and conducted a review of related literature.
A detailed description of best practice principles can be found in Appendix 3. JLARC used this set of principles to frame our review of capital planning by state agencies.
Examples of Good Planning Practices
JLARC found that Washington’s agencies are generally using best practice principles required to inform capital discussions and develop major facility investment projects. Agencies are linking operating needs with capital planning. Examples of some these practices are noted below.
1. Project Concept Need Assessment
The State Board for Community & Technical Colleges has a long-standing practice of scoring proposals against criteria to substantiate and assign priority for a college’s proposal early in the process. Criteria include:
• Enrollment trends by program;
• College space deficiencies;
• Suitability of present spaces;
• Building condition and remaining useful life; and
• Cost reasonableness compared to like or similar capital projects.
The University of Washington recently finished a planning study combining condition, space use, and academic demand variables to create a capital “needs” index to prioritize projects.
These types of reviews reflect the best practices of comprehensively assessing both business environment (agencies changing needs) and facility environment (agencies existing facility needs), by connecting capital plans and programmatic circumstances.
2. Project Agreements & Charters
The capital and space planners at the University of Washington and other agencies ask stakeholders to review and sign a project agreement intended to hold parties accountable to the planning process, budget assumptions, scope of work, and eventual construction of a project as scheduled.
These project agreements are a method of implementing the best practice of having an open and documented process.
3. Space Studies & Audits
12

PERFORMANCE AUDIT OF CAPITAL BUDGET PROCESSES
The provosts at both Washington State University and Western Washington University conduct space studies or audits to confirm programming decisions made by deans or others who have been advising the project’s architect, before signing off on the project.
These studies are evidence of consideration of the facilities environment.
4. Design Guidelines for Future Procurement
The Department of Corrections (DOC) and University of Washington have developed design guidelines for their architecture and engineering (A&E) firms. These guidelines draw upon each of the agencies’ experience with design elements that did (or did not) work well in previous projects.
The guidelines show the best practice of consideration of the facilities environment.
5. Integrated Building & Infrastructure Plans
Washington State University (WSU) has developed prototype master plans for sectors of its Pullman campus they refer to as “precincts.” Precinct plans present building footprints and condition of the facility with its surrounding infrastructure (roads, chilled water, sanitary sewer, electrical systems, etc.). These can then be mapped against academic information, such as data about how space is used, configured, and current and projected facility loads. This visual planning tool enables WSU to consider multi-dimensional aspects as they make capital decisions, to sequence major and minor projects and demonstrate six- or ten-year capital plans and biennial budget requests.
This effort represents the best practice of a comprehensive review and consideration of facilities environment.
6. Highest and Best-Use Analysis
In 1994, JLARC released the Department of Corrections (DOC) Capacity Planning and Implementation study. This study recommended that the agency conduct “highest and best use analysis” to determine whether existing facility capacity can be used for different purposes to lower overall operating costs. DOC is using “highest and best use” studies to inform their planning process. The DOC studies analyze various possible security levels and programmatic uses for each facility and then compare their operating costs.
The Military Department just finished a study of all the Armories/Readiness Centers. The study identified different scenarios for renovating, divesting, and building military facilities, and their overall system costs. The Military Department plans on using this information to inform their long-term capital planning.
These efforts are an example of the best practices of comprehensively reviewing business and facility environments.
13

PERFORMANCE AUDIT OF CAPITAL BUDGET PROCESSES Areas of Concern
As stated earlier, our overall assessment of agency level capital planning is positive. At the same, time, however, JLARC has concerns about strategic planning and the timing of agencies’ revalidation or updating of assumptions. We discuss these concerns below.
Facility Master Plans of Mixed Utility for Investment Decision-Making
As discussed earlier, linking the strategic planning effort to the predesign process is essential. One component of the strategic planning process may be the development of a facilities’ master plan.
Routinely developed facility master plans are not required by statute, though at times the Legislature has required an agency to develop a master plan to respond to specific concerns. OFM does not require master plans or provide instructions for the development of master plans, although OFM capital project guidelines imply that agencies draw from the master plan to propose specific projects in the ten-year capital plans.
Master plans should be closely linked to the agency’s mission and goals and the operating budget. According to our interviews with OFM and legislative analysts, a good master plan clearly links business drivers with long-range facility planning. During the course of our interviews, we found that a few agencies with significant capital programs lack a current or comprehensive facility master plan. Agencies indicated that master planning was expensive, time consuming, and outdated by the time the plan was completed. In addition, facility master plans may not provide the program-level detail that OFM and the Legislature expect.
The most important issue is whether agencies’ strategic planning efforts are linked with capital planning efforts. Without clarity from the Legislature and OFM about expectations for the relationship of master plans to the state’s capital process, we have concerns about their utility in supporting the development of the Capital Budget.
Timing of Revalidation is Important
We found that the timing of revalidation of planning assumptions matters in terms of correctly estimating facility needs. The revalidation of assumptions is the process by which agencies check to see if the original conditions that warranted the planning of a new facility still exist. Revalidation should occur at intervals throughout design, since capital planning and prioritization can begin ten years or more in advance of need. Without revalidating program and business drivers in the planning process, agencies may under- or over-estimate their facility needs.
These drivers come in several forms. One major business driver is changes in caseload. For example, university and community colleges track student population trends to determine future enrollment demands, and ultimately facility space. They can also come in the form of statutory or judicial requirements. For instance, a court order led DSHS to build a Special Commitment Center to house sexual offenders that have already served their prison sentences, but are deemed too dangerous to release into the community.
14

PERFORMANCE AUDIT OF CAPITAL BUDGET PROCESSES During our review of revalidation practices, we found that some agencies revalidate program drivers several times a year. Others revalidate late in the design process. Examples of each are cited below:
1. The Department of Corrections (DOC) uses the Caseload Forecast Council’s Adult Inmate Forecast three times a year to update their model that estimates the number of beds for each security level required in DOC institutions. DOC uses this information to reprioritize and resubmit their major project list. This dynamic process, while responsive to changes, results in the perception that DOC does not have a well informed planning process.
2. Western Washington University. Planning by Western includes a quantified analysis of past and likely future program demand. Western’s first attempt to incorporate this analysis in the planning process to validate scope resulted in an adjustment to project space requirements in conjunction with changes required by an OFM BEST analysis performed following predesign. Western found this revalidation effort useful and intends to make this analysis routine early in the process.
EXECUTION Overview
The planning phase involves analysis aimed at making certain an agency is building the right facility to meet their current or future needs. Execution is the process of ensuring a facility is built at the estimated cost and schedule. This section describes the criteria JLARC used to evaluate agency management of major execution, illustrates best practices used in state agencies, and discusses areas for improvement.
Best Practice Principles and Overall Assessment
Our goal for developing a set of best practices for construction management was to identify broad management principles that are reasonable to expect no matter the scale of capital programs or the resources available to different agencies. JLARC drew from industry, state, and federal sources. Detailed descriptions of each practice area, criteria, and examples of what JLARC was looking for by way of evidence are shown in Appendix 4.
Through 17 case study interviews, JLARC documented how agencies approach the management of major construction. JLARC also collected, for the first time, information on a wide variety of major projects, across agencies, to form a case study portfolio. This portfolio enabled us to look for trends that might warrant improvement in capital practices statewide. Detail on the case studies, best practices, and information contained in the portfolio can be found in Appendix 5 of this report.
Examples of Best Practices
JLARC found that Washington’s agencies successfully use many of the best practices for construction management. Overall, agencies perform well on 12 out of 14 best practice areas, such as maintaining control over total project costs throughout design and construction. Agencies routinely identify and assess risks before advertising the project. Based on our case
15

PERFORMANCE AUDIT OF CAPITAL BUDGET PROCESSES studies, there is evidence that agencies’ procedures enable open competition for qualified contractors and the bidding phase is transparent and fair. Examples of this behavior are:
1. Close Attention to Projects is Success Factor #1. All of the agencies that owned the 17 case study projects have their own project managers. The full-time presence of these project managers are important in helping ensure projects are well executed.
2. Project Documentation Minimizes Consequence of Turnover. Most of the 17 major projects case studies spanned a period of four or more years, from the beginning of pre-design to the end of construction. Over half of these projects were managed by a succession of two or more project managers. Some agencies, such as the Department of Corrections and Washington State University, have documented project and construction management procedures to minimize the consequences of staff turnover. These documented procedures, when combined with continuity in the more senior staff accountable for the projects, were useful in managing projects through a succession of project managers.9
3. Building Commissioning Pays Dividends. Building commissioning is the process of ensuring and documenting that all building systems perform together as designed before the facility becomes operational. Some agencies hired a commissioning agent during the construction phase, in addition to quality assurance inspectors. Commissioning is a specialty trade, and independent commissioning agents often find problems that the architect/engineer firm’s quality assurance inspectors miss. For example, on the Spokane Community College project and on the Department of Social and Health Services Eastern State Hospital project, problems were detected by commissioning agents early during construction, resulting in significant savings. Conversely, a major water pressure problem on the Military Department Bremerton Readiness Center project went unnoticed in the absence of a third-party commissioning agent.
Areas of Concern
While our overall assessment of agency construction management is positive, two aspects need improvements: dispute prevention/resolution and scope definition.
Early Dispute Resolution Mechanism All state construction contracts include a formal dispute resolution process. However, approximately half of the agencies in our case studies did not actively seek to prevent disputes by having procedures to expedite resolution. Having a dispute resolution mechanism10 in place for the construction phase allows for early resolution of issues to prevent lost time on projects, and to keep issues from growing into larger problems.
9 There were no cases in the sample in which documented procedures alone carried a project through wholesale changes in management staff, so the effectiveness of the documentation cannot be assessed in isolation. 10 One example would be a dispute review board.
16
PERFORMANCE AUDIT OF CAPITAL BUDGET PROCESSES Shared Responsibility for Scope Performance
There are many participants who influence the scope of a project. However, case studies suggest scope definition and control is an area of weakness for the state with its agencies. Our assessment of scope performance recognizes that managing project scope is intertwined with the Capital Budget process. The Legislature influences the scope of a project through budget actions. OFM, on behalf of the Legislature, plays a role in monitoring the “authorized” scope of a project, from the start of planning through construction. Agencies bear the risk and rewards of market conditions when capital projects are sent out for bid. We found cases where the lack of a clearly defined project scope early in the planning process lead to expensive design changes during construction. We also found cases where project savings, resulting from value engineering, were returned to the state fund balance.11 At other times, they were not. These circumstances led JLARC to ask questions about the oversight practiced today and the quality of front-end reviews OFM conducts. Both topics are discussed in greater depth in the next chapter.
CHAPTER FINDINGS IN REVIEW Overall, for both planning and execution, agencies’ performance is generally aligned with best practices. At the same time, however, we did find aspects of practices that need improvement. JLARC found that expectations for comprehensive planning are clear to agencies. The notable exception to this is the role “master plans” play in the state’s capital process.
11 Placed in reserve allotment status and barring unforeseen circumstances would lapse at the conclusion of a project.
17

PERFORMANCE AUDIT OF CAPITAL BUDGET PROCESSES
18

CHAPTER FOUR: OVERSIGHT FOR MAJOR CAPITAL PROJECTS
CHAPTER OVERVIEW In this chapter, we review the oversight roles of the Legislature and the executive branch for the capital process. Specifically, JLARC outlines OFM’s front-end review role and obligations to monitor agency spending plans during design and construction. We also examine resources and information available to OFM capital analysts for accomplishing their assignment for the entire capital program.
OFM’S ROLE IN THE CAPITAL BUDGET PROCESS JLARC’s evaluation of state-level oversight of major capital projects is based on statutory requirements and budget provisos enacted by the Legislature, as well as OFM’s published procedures and instructions to agencies. Our process evaluation centers on whether OFM is well positioned to assist the Governor, and thereby the Legislature, in making informed capital decisions at the key initial stages of the investment process – those which have a profound influence on project costs and value to taxpayers. We also wanted to understand what OFM analysts rely upon to discern whether particular agencies or projects are ready to proceed.
OFM has two primary areas of responsibility for major capital projects:
1. Front-end review and refinement of projects agencies propose; and
2. Approval and monitoring of spending plans (allotments) after projects are funded.
I. Front-end Review and Refinement
The Legislature makes the final decision on which capital projects are to be funded. Since most projects are funded in steps (pre-design, design, construction), the Legislature makes a series of funding decisions. The Governor, in turn, provides a similar high level oversight role through signing the budget, or in some cases, vetoing specific areas of the Capital Budget.
The Budget & Accounting Act (RCW 43.88.110) requires OFM to assure that major projects are reviewed before construction to reduce long-term costs and increase facility efficiency. Budget provisos in the Capital Budget reinforce these requirements and direct OFM to:
1. Evaluate facility program requirements and consistency with long-range plans;
2. Utilize a system of cost, quality, and performance standards to compare major construction projects;
3. Review value engineering studies—a means of ensuring that life-cycle costs are kept low into final design; and
19
PERFORMANCE AUDIT OF CAPITAL BUDGET PROCESSES
4. Confirm constructability analysis happens—an assessment of whether the building can be readily constructed on the basis of architectural plans and bidding documents.
OFM’s intention to implement these responsibilities is reflected in key evaluation questions described in its Pre-Design Manual and Capital Budget Instructions for agencies (See Figure 4).
II. Approval and Monitoring of Spending Plans
OFM’s second major area of responsibility – authorizing expenditures, and monitoring projects after they are funded – is also set forth in the Budget and Accounting Act, and in provisos to the Capital Budget. OFM’s duties include:
1. Approve spending plans (allotments12) for projects poised to proceed, including specific authorization for agencies to enter into contracts.
2. Monitor projects as they proceed. This requisite activity includes:
⇒ Recording total project cost estimates including past, current, and future biennial capital spending;
⇒ Comparing actual costs to estimated costs, and in detail for major project budgets;
⇒ Comparing expected design or construction start and completion dates with actual dates realized; and
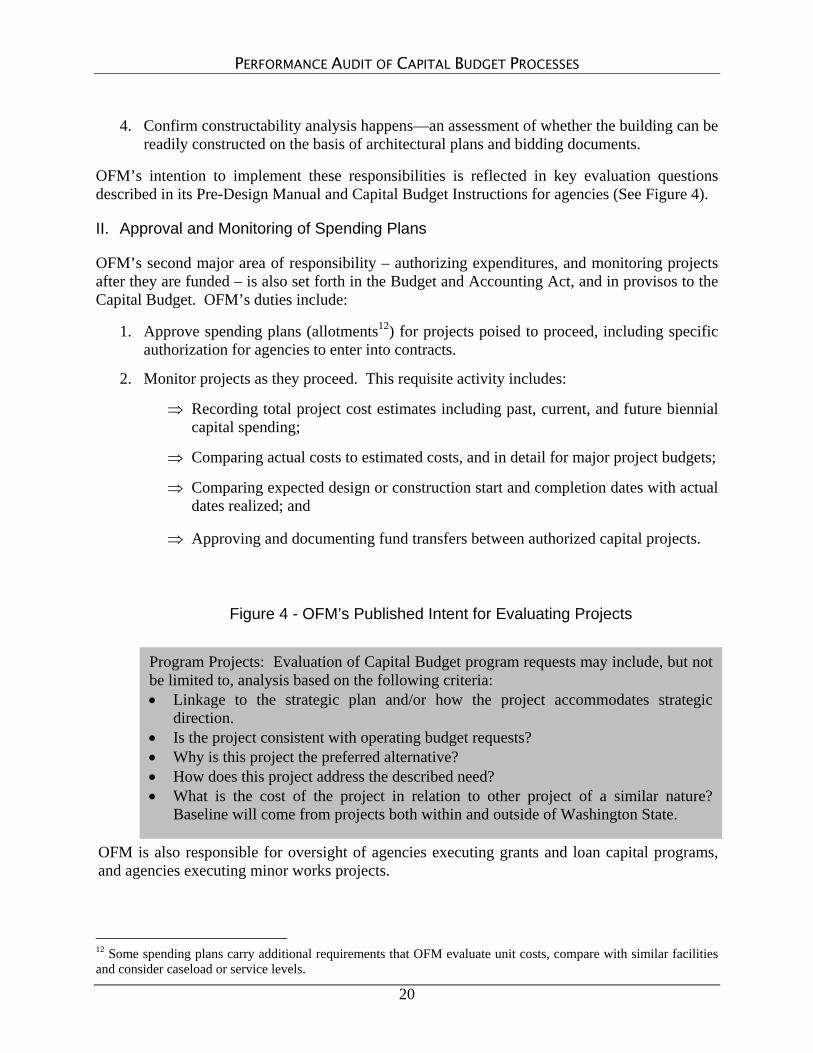
Figure 4 - OFM’s Published Intent for Evaluating Projects
⇒ Approving and documenting fund transfers between authorized capital projects.
Program Projects: Evaluation of Capital Budget program requests may include, but not be limited to, analysis based on the following criteria: • Linkage to the strategic plan and/or how the project accommodates strategic
direction. • Is the project consistent with operating budget requests? • Why is this project the preferred alternative? • How does this project address the described need? • What is the cost of the project in relation to other project of a similar nature?
Baseline will come from projects both within and outside of Washington State.
OFM is also responsible for oversight of agencies executing grants and loan capital programs, and agencies executing minor works projects.
12 Some spending plans carry additional requirements that OFM evaluate unit costs, compare with similar facilities and consider caseload or service levels.
20

PERFORMANCE AUDIT OF CAPITAL BUDGET PROCESSES ACTIVITY ASSESSMENT & THE IMPORTANCE OF FRONT-END REVIEWS The Legislature and the Governor rely heavily on OFM’s front-end review process to ensure proposed projects are ready for funding consideration. Informed decisions require good information in the early planning and design stages. Since OFM is charged with proposing a ten-year capital plan, we wanted to understand if it was utilizing the best possible information as it developed that plan. The importance of this front-end review is illustrated in Figure 5 – Maximum ability to influence project costs and outcomes occurs in the early planning and design stages of projects. JLARC used this concept as a benchmark for reviewing OFM’s activities.
Figure 5 – Ability to Impact Cost is Greatest in Early Stages
100%
Approving Construction Allotment
Procurement and Construction
Startup
Design and Engineering
Conceptual Planning and Feasibility Studies
Operation and Maintenance
Time 0%
Leve
l of I
nflu
ence
on
Cos
t
Derived from: Hendrickson, Chris. Project Management for Construction, Department of Civil and Environmental Engineering, Carnegie Mellon University, Pittsburgh, PA l52l3 June 28, 1999. Copyright C. Hendrickson 1998 (First Edition originally printed by Prentice Hall, ISBN 0-13-731266-0, 1989 with co-author Tung Au. Second Edition prepared for World Wide Webpublication in 2000.)
We found that OFM spends much of its time not at the front-end, but much further on the continuum. Analysts’ activities on balance were focused on approving spending plans after the project moved past a point where OFM has the greatest opportunity to affect costs. We then set out to determine why, and found that it is a function of three factors:
21

PERFORMANCE AUDIT OF CAPITAL BUDGET PROCESSES
1. Workload. Changing workloads have compromised OFM’s ability to conduct front-end capital program evaluation. Moreover, the Legislature contributed to this shift.
2. Information Systems. Good front-end analysis requires current baseline information about agencies and projects. This information is not presently available in information systems available to OFM analysts.
3. Review through Cash Controls. Detailed review of major projects is happening at allotment execution instead of earlier planning stages. Moreover, there is no working definition of “readiness to proceed,” to clarify what OFM is looking for from agencies.
Workload
OFM’s Capital Division is staffed by two analysts and one manager.13 When created approximately 20 years ago, capital staff focused primarily on front-end review and refinement of major capital projects. Spending plan approval and monitoring were performed primarily by other staff within OFM’s budget division. However, several years ago lead “allotment” responsibility was transferred to capital staff. Through interviews with OFM, and corroborated by legislative and agency staff, we found the Capital Division increasingly focused on allotment and financing-related activities and not on front-end evaluations.
The shift in focus appears to be driven by:
• Lack of information, procedures, and systems within OFM, making capital project analysis more time consuming;
• Decisions to move allotment responsibilities to a small capital group without supporting management tools or other resources to help absorb workload;
• Increased legislative interest in having OFM monitor the “details” of projects like equipment purchases; and greater OFM oversight expected by the Legislature for minor works project spending plans; and
• Rising capital investment in local government and community-based projects, resulting in less time available to work on advancing state facility projects.
Capital division staff indicated that workload and time constraints prevent them from systematically engaging with agencies to fully understand and document proposed capital projects, the planning behind those projects, and relationships to agency strategic plans. For example, OFM is not able to critique pre-design reports on a routine basis. Analysts have not been able to initiate Budget Evaluation Study Team (BEST) review, which provide for independent multi-disciplinary team review of project assumptions, designs, and proposals. Knowledge gained through accumulated staff experience is frequently not documented. Finally, new analysts receive little training, and there are no manuals to guide the evaluation process upon staff turnover.
13 OFM currently employs three analysts in the Capital Division.
22

PERFORMANCE AUDIT OF CAPITAL BUDGET PROCESSES Expanding workloads, accompanied by ongoing major capital program responsibilities, has compromised the Capital Division’s ability to perform important functions that support decision making by the Governor and the Legislature – functions it was originally created to support.
Information Systems
OFM’s capital data systems and procedures do not support detailed evaluation of major projects. For example, OFM does not maintain information on past projects in a form helpful to evaluating past investment performance and proposed budget. As part of this audit, JLARC developed the Major Project Portfolio to collect key data on selected projects. The portfolio can serve as a model to help fill this gap. (See Figure 6 on the following page, and additional related materials in Appendix 7.)
Through our interviews, we learned OFM does not maintain, nor has it updated key benchmark data, cost, and space standards useful to evaluate capital projects. We also found that OFM does not have internal written procedures to guide the Capital Division’s evaluation of projects through time and as staff changes occur.
Review through Cash Controls
Approval and monitoring of spending plans (allotments) by OFM is necessary to ensure public funds are applied consistent with Legislative intent. Our interviews indicate that OFM’s capital activities have become heavily weighted towards managing allotments – a milestone in the process where the state’s ability to affect overall project costs is not as great as in the early planning and design stages of projects. Also, there is no working definition for what constitutes “readiness to proceed” for agencies entering project execution phases. JLARC finds this void creates tension and confusion as OFM capital staff perform the oversight roles lawmakers assigned to them.
Additional knowledge of agencies’ individual and collective past performance managing the delivery of projects could help analysts more efficiently manage their workload. For example, while the average cost growth in design for major facility projects might be 10 percent, some proposed projects might lie beyond that benchmark and therefore warrant additional review to determine whether the project is ready to proceed. OFM’s lack of benchmarks, uniform procedures, and historical performance information causes inefficiency in approving spending plans.
As part of this audit, JLARC found that capital program performance can be measured more comprehensively. It is possible to look at a diverse set of agencies and capital projects in the same way to understand Washington’s design and construction experience. There is an objectively valid way to quantify and compare capital work done by agencies in different regions and markets. Its application as a tool to support dialogue between the state and its agencies requires a shift in perspective; one that takes a step back to view the Capital Budget as an overall program, rather than an assemblage of individual project choices and decisions.
23

PERFORMANCE AUDIT OF CAPITAL BUDGET PROCESSES
Figure 6 - JLARC Portfolio of Over 200 Major Capital Projects
Purpose of the Portfolio:
Identify project data that is currently tracked by state systems and the level of effort to collect the key data about major projects that have been funded in the Capital Budget since 1995.
Test the idea that complete project information could be useful for analysts and policymakers working through review of major capital programs (see Appendix 5).
Key Elements:
Project Type
Location
Description
Scope
Size
Construction Method
Schedule
Funding Sources
Budgeted Cost
Actual Cost
JLARC Findings:
OFM’s capital tracking systems do not provide ready access to key budgeting, management, and performance information for major state projects funded in the Capital Budget.
Major project expenditure information is stored on a biennial basis, while projects span multiple biennia.
Expenditures are not tracked at the same level of detail as budget information.
Collecting data to address these shortfalls is labor intensive, but a valuable effort for improving project evaluation and oversight.
The need for comprehensive data around project elements was reinforced by interviews with facility and budget officers for this study. One experienced capital agency employee told JLARC that it no longer seemed to matter that her agency had delivered projects on time, and within budget for the past 20 years. Without improved data tracking, it is difficult for the Legislature and executive branch to assess performance for making decisions. The state measures a lot of activities, but not the performance of capital as an enterprise.
Bearing this in mind, JLARC had its consultant draw up and test a set of plausible performance indicators, based on national metrics and standards, to see if we could “measure the process” using the opportunity presented by 17 major case study performances under review. Our case
24

PERFORMANCE AUDIT OF CAPITAL BUDGET PROCESSES
Figure 7 — JLARC Measuring the Process
Purpose for Project Performance Indicators:
• Establish baseline performance in executing capital projects.
• Look for outliers to focus questions about agency practices to manage capital project risks.
Key Elements:
Scope, Schedule, and Cost Performance Indicators
Examples: scope attainment, change orders, intensity of delivery, design time and cost growth, construction time and cost growth. The median for the state might be 10 percent,but an agency’s major program portfolio might be twice that rate. What is the State’s tolerance for variance?
Also rated “quality” based on deliverable from the agency-owner’s perspective and evidence of “market competition” at time projects were bid.
JLARC Findings:
Washington follows a decentralized oversight model to deliver capital improvements. Given this model, ground rules are not clear in oversight of agencies. For example, there is inadequate means for all participants to discern what “readiness to proceed” looks like. The indicators (in Appendix 5)might begin to evidence such standing for agencies.
The overall budget process for major capital is missing a vital feedback loop. With baseline performance information, criteria, “expectations,” and “tolerances” defined, the state could begin to reward agencies for a job well done and provide agencies with greater predictability and consistency in oversight as they plan and then execute major facility projects.
study tool (See Figure 7 below, and related materials in Appendix 5) could be developed further to monitor performance and identify problem areas on a statewide basis.
CHAPTER FINDINGS IN REVIEW The Legislature and OFM have both identified the need to evaluate major capital facility projects thoroughly at the front end. However, JLARC finds that OFM’s ability to evaluate proposed major projects is compromised by heavy workload demands, unclear priorities and legislative directives, and weak information systems for front-end evaluation and cash control review.
25

PERFORMANCE AUDIT OF CAPITAL BUDGET PROCESSES
26
CHAPTER FIVE: CONCLUSIONS AND AUDIT RECOMMENDATIONS
This study was an evaluation of the capital process. The greatest weakness we found centered on the state – specifically resources and priorities for OFM. Therefore, our recommendations address issues only at this level. JLARC’s premise is that once the state has developed a stronger major capital process, it will then be better positioned to identify and target support to particular agencies.
AGENCY PLANNING FOR MAJOR FACILITY PROJECTS JLARC’s overall assessment of agency planning practices is that agencies are planning for major facility construction using a comprehensive, data-driven process. We identify examples of best practices, which we highlight within this report. We also identify concerns related to strategic planning and the timing of agencies’ revalidation of construction need assumptions.
AGENCY EXECUTION OF MAJOR FACILITY PROJECTS JLARC’s overall assessment of agency construction management is that agencies are generally successful in managing construction of major facility projects. We identify and highlight examples of best practices. We also discuss concerns related to early establishment of dispute resolution mechanisms and control of project definition.
OVERSIGHT FOR AGENCIES’ MAJOR CAPITAL FACILITY PROGRAMS JLARC’s assessment is that oversight of facility projects is not being accomplished in the manner required by statute and OFM’s own budget instructions. We discuss the importance of early intervention in the capital process to affect costs, and observe OFM’s current focus on this is not consistent. We also identify that OFM’s efforts are constrained by heavy workload demands and inadequate information systems.
Recommendation
The Office of Financial Management should develop a plan in consultation with fiscal committees and agency capital officers to address weaknesses in oversight that are outlined in this report. The plan should address the following issues:
• Aligning resources to program workload;
• Identifying and institutionalizing procedures and best practices;
• Creating easily accessible, reliable information systems;
• Developing statewide performance measures for all capital projects; and
• Evaluating projects earlier in the planning phases.
27

PERFORMANCE AUDIT OF CAPITAL BUDGET PROCESSES
Legislation Required: None
Fiscal Impact: TBD
Reporting Date: Interim - April 2005 Final – January 2006
The intent is to strengthen and refine OFM activities and information in ways that benefit all the participants in the state capital process.
AGENCY RESPONSES We have shared the report with the Office of Financial Management (OFM) and provided them an opportunity to submit written comments. Their written response is included as Appendix 2.
ACKNOWLEDGEMENTS We would first like to thank the Office of Financial Management (OFM). OFM analysts and senior officers worked cooperatively and productively with JLARC to assist with implementation of this audit, fully sharing about their capital activities.
We also gratefully acknowledge the time and access afforded to us by agency and capital officers. Namely, we would like to extend our gratitude to the capital divisions of all the two-year colleges, especially Bellevue, Grays Harbor, Highline, and Spokane Community Colleges; the State Board for Community and Technical Colleges; the Department of Social and Health Services; Department of Corrections; the Department of General Administration; the Military Department; University of Washington; Washington State University; and Western Washington University. The multiple interviews, planning document reviews, project case histories and frank conversations helped our teams fully appreciate practices at work today in a variety of government settings and scales of operation.
Cindi Yates
Legislative Auditor
On February 8, 2005, this report was approved for distribution by the Joint Legislative Audit and Review Committee.
Senator Debbie Regala
Chair
28

APPENDIX 1 – SCOPE AND OBJECTIVES
PERFORMANCE AUDIT
OF CAPITAL BUDGET
PROCESSES
SCOPE AND OBJECTIVES
OCTOBER 20, 2004
STATE OF WASHINGTON JOINT LEGISLATIVE AUDIT AND REVIEW COMMITTEE
STUDY TEAM Karen Barrett
Isabel Muñoz-Colón with assistance from
Lisa Jeremiah & Steve Lerch Karl Herzog & Larry Brubaker
LEGISLATIVE AUDITOR
CINDI YATES
Joint Legislative Audit & Review Committee
506 16th Avenue SE Olympia, WA 98501-2323
(360) 786-5171
(360) 786-5180 Fax Website:
http://jlarc.leg.wa.gov e-mail: [email protected]
MANDATE
The 2003-2005 Capital Budget directs JLARC to conduct a performance audit of state capital planning, design, and construction processes. This actinstructs JLARC to consider topics from costs to controls surrounding agencyproject decisions to practices or standards for cost-effective and efficient design and construction contracting, management, oversight, and review.JLARC is to review a sample of major projects constructed during the past decade with a focus on higher education, corrections, social, and healthservice agencies’ experience.
BACKGROUND
Over the past ten years (1995-97 – 2003-05 Biennia), Washington State has spent $12 billion for capital projects. Major state facility projects account for$4 billion or 30 percent of that total. Grants and loans to support localprojects and minor facility improvements make up the balance. Eighty-two percent of authorized state facility spending went to eight agencies. The Governor’s ten-year plan (2003–2013) for Washington mirrors this pattern.
Washington State owns and operates a wide variety of facilities to houseprograms ranging from prisons to office buildings, university libraries, college classrooms, armories, and hospital wards. Each biennium, the Capital Budget is used to fund investments in these assets including acquisition,construction, repair, and major renovation projects. The Office of FinancialManagement, Department of General Administration and individual agencies oversee the actual work that occurs, much of which is contracted out to theprivate sector.
STUDY SCOPE
To examine the strength of Washington’s capital practices when investing instate facilities, JLARC will review the eight agencies representing the 82 percent: the State Board for Community & Technical Colleges, University ofWashington, the Department of Corrections, Washington State University,Department of Social & Health Services, Department of GeneralAdministration, Military Department, and Western Washington University.This audit also reviews the Office of Financial Management and contributionsof the State Higher Education Coordinating Board.
STUDY OBJECTIVES
JLARC’s assessment of the state’s policies, processes, and oversight mechanisms for developing and implementing major capital projects will beguided by the following questions:
29
PERFORMANCE AUDIT OF CAPITAL BUDGET PROCESSES
1. What state facility investments have been undertaken over the past ten years?
2. What information about a total project is readily accessible for performance or accountability purposes?
3. How do agencies validate costs and conditions that warrant major facility investments as projects develop?
4. Given that major facility capital programs develop over a span of time and are informed by multiple participants, do requisite budget practices and processes support effective and efficient planning and delivery?
5. Are there meaningful differences in capital project processes and management across agencies? Taking into account differences in scale, are there exemplary aspects or shortcomings worthy of discussion?
6. When looking at overall state capital practices, how does what is required and what actually gets done compare to principles that support sound investment deliberations and execution on behalf of taxpayers?
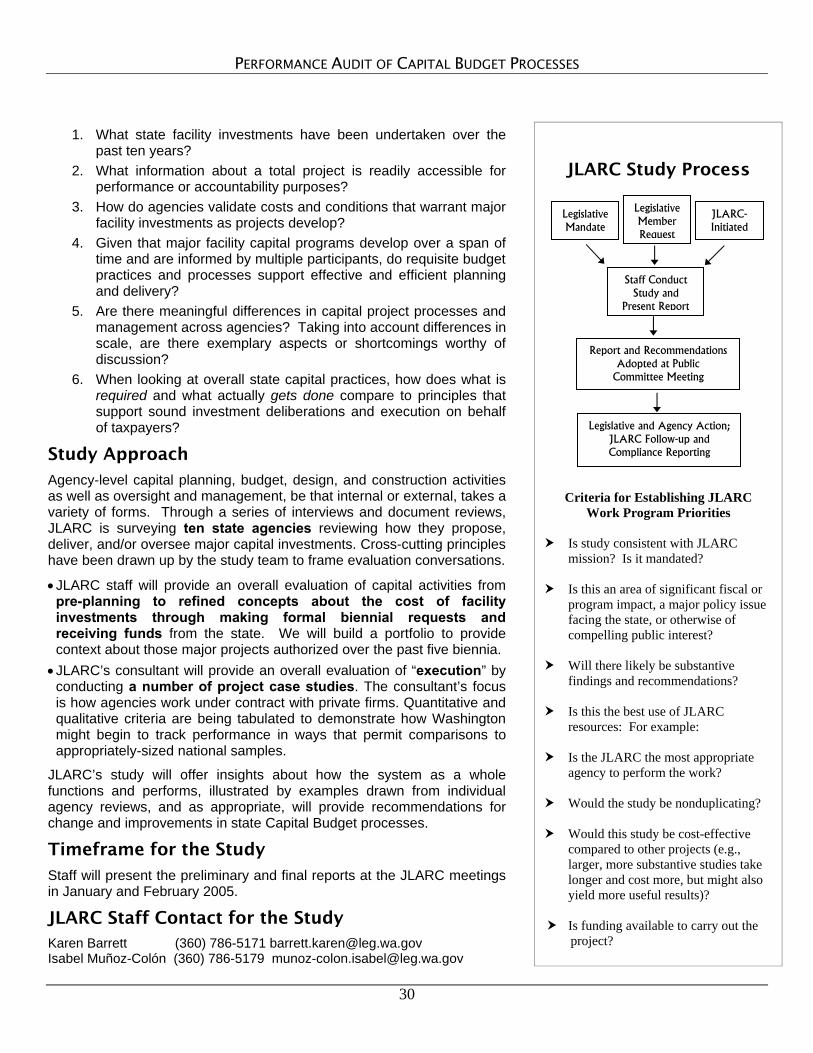
Study Approach
Agency-level capital planning, budget, design, and construction activities as well as oversight and management, be that internal or external, takes a variety of forms. Through a series of interviews and document reviews, JLARC is surveying ten state agencies reviewing how they propose, deliver, and/or oversee major capital investments. Cross-cutting principles have been drawn up by the study team to frame evaluation conversations.
• JLARC staff will provide an overall evaluation of capital activities from pre-planning to refined concepts about the cost of facility investments through making formal biennial requests and receiving funds from the state. We will build a portfolio to provide context about those major projects authorized over the past five biennia.
• JLARC’s consultant will provide an overall evaluation of “execution” by conducting a number of project case studies. The consultant’s focus is how agencies work under contract with private firms. Quantitative and qualitative criteria are being tabulated to demonstrate how Washington might begin to track performance in ways that permit comparisons to appropriately-sized national samples.
JLARC’s study will offer insights about how the system as a whole functions and performs, illustrated by examples drawn from individual agency reviews, and as appropriate, will provide recommendations for change and improvements in state Capital Budget processes.
Timeframe for the Study
Staff will present the preliminary and final reports at the JLARC meetings in January and February 2005.
JLARC Staff Contact for the Study Karen Barrett (360) 786-5171 [email protected] Isabel Muñoz-Colón (360) 786-5179 [email protected]
JLARC Study Process
Criteria for Establishing JLARC
Work Program Priorities
Is study consistent with JLARC mission? Is it mandated?
Is this an area of significant fiscal or
program impact, a major policy issue facing the state, or otherwise of compelling public interest?
Will there likely be substantive
findings and recommendations?
Is this the best use of JLARC resources: For example:
Is the JLARC the most appropriate
agency to perform the work?
Would the study be nonduplicating?
Would this study be cost-effective compared to other projects (e.g., larger, more substantive studies take longer and cost more, but might also yield more useful results)?
Is funding available to carry out the project?
Legislative Mandate
Staff Conduct Study and
Present Report
Report and Recommendations Adopted at Public
Committee Meeting
Legislative and Agency Action; JLARC Follow-up and Compliance Reporting
JLARC- Initiated
Legislative Member Request
30

APPENDIX 2 – AGENCY RESPONSES
•• Office of Financial Management
31

PERFORMANCE AUDIT OF CAPITAL BUDGET PROCESSES
32


PERFORMANCE AUDIT OF CAPITAL BUDGET PROCESSES
34

APPENDIX 3 – PLANNING PHASE BEST PRACTICES
Figure 8- Planning Phase Best Practices
Practice When It Works Best
1. Planning linked shown agency’s stated policies and laws (Legal environment).
Project’s plan linked to agency’s: • Governing statutes and regulations • Mission and goals • Budget requirements • Performance expectations
2. Planning linked to agency’s changing needs (Business environment).
Process incorporates: • Trends and changing demands for services • Availability of resources • Alternatives • Operating and staffing costs and impacts
3. Planning compliments agency’s existing facilities (Facility environment).
Process has considered existing: • Inventory • Conditions • Capacity • Space assignments • Options and alternatives to construction
4. Planning was open and documented.
Process: • Involved key stakeholders • Coordinated with other state, federal, and local agencies • Provided for external review and input.
5. Planning documents provide clear evidence for the need for the project.
Plan shows: • Business needs • Cost-effective solutions to those needs • Options considered and rejected.
6. Planning revalidates assumptions as projects advance.
Process allows: • Where appropriate, final project to reflect current
conditions, not those at the start of the project 7. Planning should account
for changes in the use of facilities.
Process allows for updating: • Assumptions on the use of other facilities as the project
progresses.
8. Planning uses available information to prioritize projects.
Process involves: • Clearly documented criteria and selection process • Evaluation of the relative need for the project • Examination of scheduling and sequencing alternatives. • Resource availability
35

PERFORMANCE AUDIT OF CAPITAL BUDGET PROCESSES
36
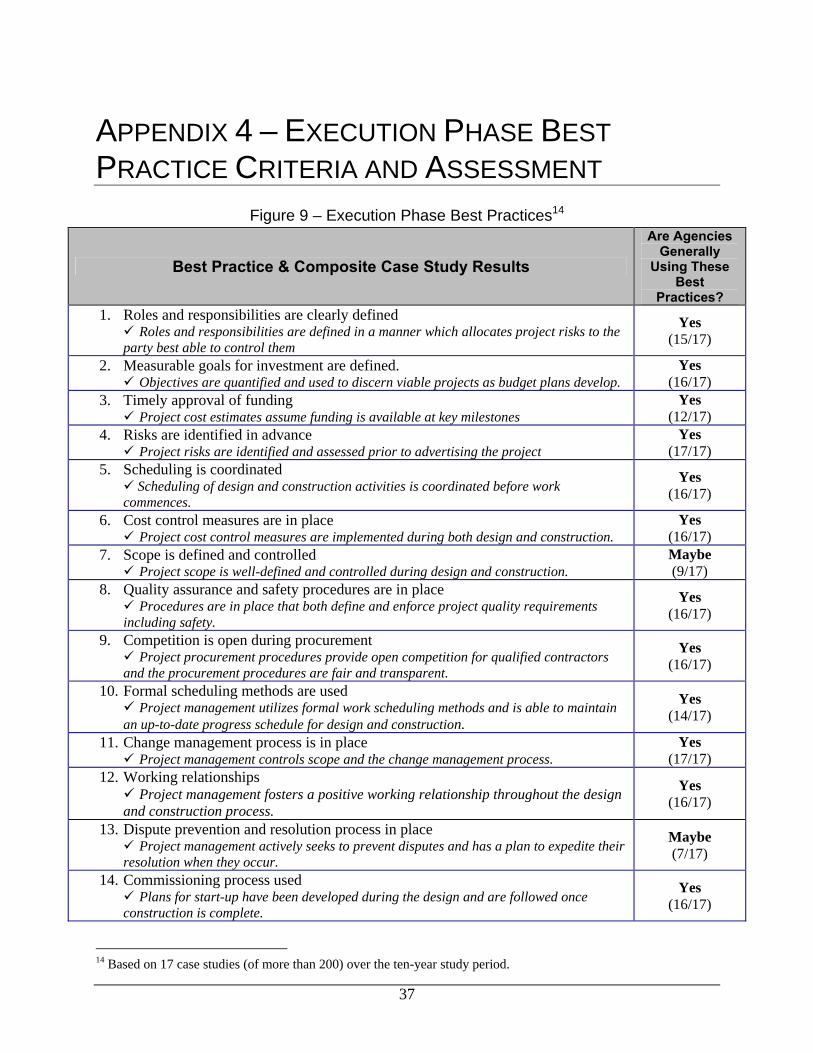
APPENDIX 4 – EXECUTION PHASE BEST PRACTICE CRITERIA AND ASSESSMENT
Figure 9 – Execution Phase Best Practices14
Best Practice & Composite Case Study Results
Are Agencies Generally
Using These Best
Practices? 1. Roles and responsibilities are clearly defined
Roles and responsibilities are defined in a manner which allocates project risks to the party best able to control them
Yes (15/17)
2. Measurable goals for investment are defined. Objectives are quantified and used to discern viable projects as budget plans develop.
Yes (16/17)
3. Timely approval of funding Project cost estimates assume funding is available at key milestones
Yes (12/17)
4. Risks are identified in advance Project risks are identified and assessed prior to advertising the project
Yes (17/17)
5. Scheduling is coordinated Scheduling of design and construction activities is coordinated before work
commences.
Yes (16/17)
6. Cost control measures are in place Project cost control measures are implemented during both design and construction.
Yes (16/17)
7. Scope is defined and controlled Project scope is well-defined and controlled during design and construction.
Maybe (9/17)
8. Quality assurance and safety procedures are in place Procedures are in place that both define and enforce project quality requirements
including safety.
Yes (16/17)
9. Competition is open during procurement Project procurement procedures provide open competition for qualified contractors
and the procurement procedures are fair and transparent.
Yes (16/17)
10. Formal scheduling methods are used Project management utilizes formal work scheduling methods and is able to maintain
an up-to-date progress schedule for design and construction.
Yes (14/17)
11. Change management process is in place Project management controls scope and the change management process.
Yes (17/17)
12. Working relationships Project management fosters a positive working relationship throughout the design
and construction process.
Yes (16/17)
13. Dispute prevention and resolution process in place Project management actively seeks to prevent disputes and has a plan to expedite their
resolution when they occur.
Maybe (7/17)
14. Commissioning process used Plans for start-up have been developed during the design and are followed once
construction is complete.
Yes (16/17)
14 Based on 17 case studies (of more than 200) over the ten-year study period.
37

PERFORMANCE AUDIT OF CAPITAL BUDGET PROCESSES
38

APPENDIX 5 – MAJOR PROJECT PORTFOLIO: EXAMPLE PROJECT REPORT
JLARC Portfolio Agency Responses Summary Project Information Project Title: Bohler Gym Addition OFM Project 19942017 Agency ID: 365 Agency: WSU JLARC ID: Add'l ID: JLARC Functional Area: HIED Legislative District: 9 County: Whitman City: Pullman Project Description: This project provides for construction of a 45,000 sq. ft. addition to Bohler Gym along the north edge of the existing 1928 building. The facility will also house a locker room for team sports, offices for the academic support staff, eligibility and compliance personnel, sports information, and study and meeting areas. Project Management Summary Owning Agency: WSU Contracting Method: Project Managing Agency: WSU DBB GCCM □ DB □ Project Statistics New Renovation Infrastructure NewGSF: 45,000 Renov. Infrastructure Type: NewNSF: 27,000 RenNSF: CostPerS Orig Const. 1/1/1928 Const. Type: Heavy JLARC Bldg Type: Athletics
OFM Key Stats Class: Program Category: Program Need or Requirement Project Type: New Facilities/Additions
Project Schedule Current Project Status: □ Predesign □ Design □ Construction Complete Start Date 7/1/1993 Notice to Proceed: 4/1/1996 Substantial Comp Date: 10/1/1997 Final Acceptance Date: 4/25/1998 Monday, December 20, 2004 JLARC Project Page 7 of 52
39

PERFORMANCE AUDIT OF CAPITAL BUDGET PROCESSES JLARC Portfolio Agency Responses Summary Cost Summary
Original Budgeted Actuals Acquisition Budget: Acquisition Expenditures: Predesign Budget: $123,656 Predesign Expenditures: $123,656 Design Budget: $883,627 Design Expenditures: $774,997 Construction Budget: $8,466,500 Construction Exp: $8,613,056 Fix/Furnish/Equip Budget: $214,223 Fix/Furnish/Equip Exp: $299,569 Project Manag. Budget: $330,000 Total Project Manag. Exp: Project Manag. Agency Exp: $330,000 Project Manag. GA Exp: Other Budget: $365,850 Other Expenditures: $242,578 Total Budget: $10,383,856 Total Expenditures: $10,383,856
Funds and Appropriations Summary State Fund: $10,260,200 91-93 Approp: $123,656 Federal Fund: 93-95 Approp: $900,000 Local Fund: $123,656 95-97 Approp: $9,360,200 Other Fund: 97-99 Approp: Total Fund: $10,383,856.00 99-01 Approp: 01-03 Approp: 03-05 Approp: Total Approp: $10,383,856
Best Studies Information Best Studies COST: Best Studies SAVINGS: Notes Notes:
Monday, December 20, 2004 JLARC Project Page 8 of 52
40

APPENDIX 6 – CASE STUDY METHODOLOGY Dye Management Group, Inc. was contracted by the Joint Legislative Audit and Review Committee (JLARC) to identify capital project execution best practices and to evaluate their use by Washington agencies. This included a review of actual experiences on construction projects.
Best Practices in Project Execution
Best practices in project execution were identified through extensive literature review. These best practices formed an integral part of the analytical framework and provided a point of comparison for management practices on individual projects.
Industry associations such as the Construction Industry Institute, the Project Management Institute, the Construction Management Association of America, the Association for the Advancement of Cost Engineering International, and the Design-Build Institute of America have published extensive literature relating to best practices in project execution. Literature review, followed by a synthesis of best practices identified by each of the industry associations, led to the development of the best practices used for this JLARC performance audit.
Analytical Framework
The analytical framework provides a logical and objective methodology to evaluate the case studies in a consistent manner and to prepare case studies that outline project execution performance. This framework is project-delivery-method neutral, is grounded in nationally recognized best practices, and uses metrics associated with each evaluation criteria to allow uniform comparison of projects.
The analytical framework has three major components:
1. Project definition data, see Figure 10.
2. Project performance data, see Figure 11.
3. Case study ratings, see Figure 12.
4. Best practices implementation data, Figure 13.
Methodology
Eleven different state agencies managed the 17 major projects (See Figure 14, Appendix 7). Sampled projects were diverse in terms of project type (prison, school, and others), geographical location (Western Washington University in the north; Washington State University, Vancouver in the south; Eastern State Hospital in the east), agency,
41

PERFORMANCE AUDIT OF CAPITAL BUDGET PROCESSES
procurement method (such as the general contractor/construction manager and design-bid-build methods), and final outcome of the project in terms of schedule and budget attainment (acceptable, not acceptable). To ensure that project data and project participants were available for this evaluation, active construction projects or those completed in or after 2000 were chosen by JLARC.
Case study work began with sending each agency a packet requesting project information such as the project request report; the pre-design document and pre-design budget request; and summary lists of change orders, safety issues, and cost overruns. An explanation regarding the purpose and scope of the evaluation was also provided to the agencies. Qualitative data like satisfaction and quality ratings were obtained from the project participants during the meetings.
The meetings with agencies also helped the evaluators to gain a clearer insight into the workings of the agency and to make clarifications that would not have been possible through surveys and questionnaires only. Opinions of the project participants were also sought regarding lessons learned from the project, and insights regarding the overall process or a specific phase of the project.
It should be noted that because of the small sample size, the averages of performance metrics should not be perceived as a reflection of all major capital projects for Washington State. The projects studied were diverse, ranging from a $6 million library renovation project to a $70 million surgery medical center. Relative performance metrics like intensity of delivery; speed of delivery; and construction speed, therefore should ideally be compared to the respective industry standards or national averages for performance analysis, and not to the case study averages. It is important to compare performance metrics to national standards for projects of similar type and size.
On each of these 17 projects, the analysis began with the evaluators getting an understanding of the project scope and needs of the project.
• Information on project progress from pre-design to the commissioning phase was then obtained, identifying any factors outside the agency’s control that affected the project outcome.
• The procedures used by each agency to hire the architect/engineer firm and the general contractor/construction manager firm or the contractor were analyzed and understood, leading to the construction phase review.
• Inquiries were made to get an idea of staffing for each project, and the inherent differences between levels of involvement of various parties.
Over 25 quantitative and qualitative metrics like cost growth, schedule growth, user satisfaction, etc., were recorded to analyze project performance. A correlation was then established between project performance and the best practices to determine any shortcomings on the projects, and an overall lack of any management practice, if any. The evaluator’s overall assessment for each case study was then presented to JLARC.
42

PERFORMANCE AUDIT OF CAPITAL BUDGET PROCESSES
Figure 10 – Project Definition Data Project Definition Data Type Evaluation Criterion Metric Name What is project’s name? NA
Geography Where is it located? NA
Agency What agency managed the design and construction contracts? NA
User Who occupies and uses the facility? NA
Size How many SF in initial program? SFi
Budget What is initial budget? $
Delivery method What delivery method was used? Lump sum, design-build, general contractor/construction manager
Type construction What type of project? New construction, renovation, etc. NA
Facility use What type of building? School, prison, warehouse, etc. NA
What is the level of design complexity for the project? Simple, routine, complex, highly complex
What is the level of construction complexity for the project? Simple, routine, complex, highly complex
Technical complexity
What is the level of technical specialization for the project? Simple, routine, complex, highly complex
How much experience does this agency have with the design and/or construction of this type and use facility?
Low, Medium, High Familiarity
If so, how many in the past 10 years? # Same/similar projects
What is the project budget by element and phase? Design, construction, equipment, etc. Budget constraints
What is the project budget by funding source? State, federal, local
Time constraints What are the major milestones on the project? Design completion, construction award, substantial completion, etc.
Desired outcomes Were there certain outcomes that make this project “different” than the routine project?
Political pressure, environmental requirements, public concerns, emergency situations, etc.
43

PERFORMANCE AUDIT OF CAPITAL BUDGET PROCESSES
Project Performance Data Type
Evaluation Criterion Metric Score Reference
How many SF in final facility? SFf SFf > SFi = Met requirement
SFf < SFi = Did not meet requirement
Construction Industry Institute, Pioneer, AACE, Allen
Compare with initial program. SFi Scope Attainment =
SFf – SFi / SFi
Scope Att > 1.0 = Exceeded requirement
Scope Att = 1.0 = Met requirement
Scope Att < 1.0 = Did not meet requirement
How many change orders?
Owner driven scope change
Design error or omission change
Unforeseen site condition change
Administrative change
#CO
#COO
#COD
#COU
#COA
Compare with population averages TxDOT
Average cost of change order? CC’ – CC / #CO Compare with population average TxDOT
What was the intensity of the project delivery?
Intensity = Unit Cost / T’
Compare with population average Construction Industry Institute
Does the final project satisfy the users’ needs?
Adjectival description
Exceeds needs, meets needs, does not meet needs
Construction Industry Institute
Scope
Is the project functional for its intended use?
Adjectival description
Exceeds needs, meets needs, does not meet needs
44

PERFORMANCE AUDIT OF CAPITAL BUDGET PROCESSES
Project Performance Data Type
Evaluation Criterion Metric Score Reference
Did owner’s maintenance staff participate in design development?
Yes/No Yes = Met requirement
No = Did not meet requirement
Wash Fish & Wildlife Joint Legislative Audit and Review Committee interview
What is total final time for design and construction?
T’ Compare with population average Construction Industry Institute, Pioneer, Allen
Original design contract completion date
TD Compare with population average AACE, Allen
Final design contract completion date TD’
Design time growth = TD’ - TD / TD
Design time growth < 1.0 = Met requirement
Design time growth > 1.0 = Did not meet requirement
AACE, Allen
Original construction contractcompletion date
TC Compare with population average Construction Industry Institute, Pioneer, Allen
Schedule
Final construction contract completion date TC’
Construction time growth = TC’ – TC / TC
Construct time growth < 1.0 = Met requirement
Construct time growth > 1.0 = Did not meet requirement
Construction Industry Institute, Pioneer, Allen
45

PERFORMANCE AUDIT OF CAPITAL BUDGET PROCESSES
Project Performance Data Type
Evaluation Criterion Metric Score Reference
Project schedule attainment Project time growth = (TD’ +TC’) – (TD +TC) / TD + TC
Project time growth < 1.0 = Met requirement
Project time growth > 1.0 = Did not meet requirement
AACE Construction Industry Institute, Pioneer, Allen
How fast was the project delivered? Delivery speed =
SFf / T’
Compare with population average Construction Industry Institute
Were all important milestones met to the satisfaction of the owner?
Yes/No Yes = Met requirement
No = Did not meet requirement
What is total final cost for design and construction?
C’ Compare with population average Construction Industry Institute, Pioneer
What was the final unit cost? Unit cost ($/SF) = C’ / SFf
Compare with population average AACE Allen Construction Industry Institute, Pioneer
Original design contract amount CD Compare with population average AACE Allen Pioneer
Final design contract amount CD’ Design cost growth= C
Design cost growth D’ – CD / CD
< 1.0 = Met requirement
Design cost growth > 1.0 = Did not meet requirement
AACE Allen Pioneer
Cost
Original construction contract amount CC Compare with population average AACE Allen Construction Industry Institute, Pioneer
46

PERFORMANCE AUDIT OF CAPITAL BUDGET PROCESSES
Project Performance Data Type
Evaluation Criterion Metric Score Reference
Final construction contract amount CC’ Construction costgrowth = CC’ – CC / CC
Construct cost growth < 1.0 = Met requirement
Construct cost growth > 1.0 = Did not meet requirement
AACE Allen Construction Industry Institute, Pioneer
Project budget attainment Project cost growth = (CD’ +CC’) – (CD +CC) / CD + CC
Project cost growth < 1.0 = Met requirement
Project cost growth > 1.0 = Did not meet requirement
AACE Allen Pioneer
Was value engineering used during design development?
*also applies to schedule
Yes/No Yes = Met requirement
No = Did not meet requirement t
3DI
Were constructability reviews done during design development?
*also applies to schedule
Yes/No Yes = Met requirement
No = Did not meet requirement
3DI
What level of owner resource was committed to managing this project?
Adjectival description
Above normal, normal, below normal
Were additional funds sought for this project after award of the design contract?
Yes/No Yes = Did not meet requirement
No = Met requirement
Were additional funds sought for this project after award of the construction contract?
Yes/No Yes = Did not meet requirement
No = Met requirement
What was the quality of the design in terms of the need to change it after award of the construction contract?
#COD #COD = 0 = Exceeded requirement
#COD = Ave = Met requirement
#COD > Ave = Did not meet requirement
Construction Industry Institute, FCC
Quality
How many warranty call backs? Adjectival description
10 point Construction Industry Institute Likert scale
Allen Construction Industry Institute
47

PERFORMANCE AUDIT OF CAPITAL BUDGET PROCESSES
Project Performance Data Type
Evaluation Criterion Metric Score Reference
Is the user satisfied with the interior space and layout?
Adjectival description
10 point Construction Industry Institute Likert scale
Allen Construction Industry Institute
Is the actual operations and maintenance cost roughly what was expected from the final design?
Adjectival description
10 point Construction Industry Institute Likert scale
Construction Industry Institute
How did the envelope, roof, structure, and foundation perform?
Adjectival description
10 point Construction Industry Institute Likert scale
Allen Construction Industry Institute
How did the environmental systems perform?
Adjectival description
10 point Construction Industry Institute Likert scale
Allen Construction Industry Institute
Are process equipment of the necessary quality?
Adjectival description
10 point Construction Industry Institute Likert scale
Allen Construction Industry Institute
How did the project conform to the specifications?
Adjectival description
Better than spec, meets specs, does not meet specs
Construction Industry Institute
How would you describe the quality of the workmanship?
Adjectival description
Excellent, good, satisfactory, poor FCC
How would you describe the quality of the project?
Adjectival description
Excellent, good, satisfactory, poor FCC
Market Competition
How many firms bid on this project? # bidders > 3 = exceeds desired level of competition
= 3 = met desired level of competition
< 3 = failed desired level of competition
48

PERFORMANCE AUDIT OF CAPITAL BUDGET PROCESSES
Project Performance Data Type
Evaluation Criterion Metric Score Reference
Were all bidders on this project qualified?
Yes/No Yes = Met requirement
No = Did not meet requirement
Were all the bids on this project responsive?
Yes/No Yes = Met requirement
No = Did not meet requirement
Was a stated goal for small and/or disadvantaged business enterprise participation required?
Yes/No Yes, met goal = Met requirement
Yes, not met goal = Did not Meet requirement
No = Met requirement
How much time as allocated for industry to respond to the project solicitation?
# weeks > 6weeks = excess time
4 – 6 weeks = adequate time
< 4weeks = insufficient time
Naval Facilities Engineering Command (NVFAC)?
A maximum of three cases were studied at each agency, which does not allow for a statistically valid comparison between different agencies. Metrics for each case appear in the next table. The state has not assembled information like this before to examine its construction experiences. A brief explanation of each measure follows the table.
49

PERFORMANCE AUDIT OF CAPITAL BUDGET PROCESSES
50
Figure 11 – Project Performance Data
Scope Schedule Cost Quality Market
Competition
Project Performance Metrics State Agency Cases only Sc
ope
Atta
inm
ent
Num
ber o
f
ange
C
h Ord
ers
Mea
n C
ost o
f
ange
C
h Ord
ers
Inte
nsity
of
Del
iver
y
Des
ign
Tim
e G
row
th
Con
stru
ctio
n Ti
me
Gro
wth
Pro
ject
Sc
hedu
le
Atta
inm
ent
Del
iver
y
Spee
d
Des
ign
Cos
t Gro
wth
Con
stru
ctio
n C
ost G
row
th
Pro
ject
C
ost
Atta
inm
ent
Ave
rage
of A
ll S
atis
fact
ion
Rat
ings
Qua
lity
Sat
isfie
d O
wne
r?
Num
ber
of B
ids
Allo
wed
R
espo
nse
Tim
e
PROJECT PERFORMANCE 000 $ $/day ft²/day weeks
Bellevue CC - Parkade 0.77 20 79.90 0.07 1.00 1.09 1.05 415.00 1.25 1.12 1.13 9.2 Y 12 4
Grays Harbor CC - Library Renovation 1.00 95 8.90 0.25 0.82 0.96 0.91 19.50 1.29 1.03 1.06 8.3 Y 3 3
Highline CC - Building 30 Addition 0.92 158 5.00 0.19 0.82 2.58 1.36 12.40 1.25 1.16 1.17 7.8 Y 16 3
Highline CC - Higher Education Center 0.76 89 2.10 0.20 1.00 1.05 1.02 59.90 2.60 1.07 1.14 8.0 Y 5 4
Spokane CC - Health Science Addition 1.50 117 10.94 0.08 0.72 1.44 1.06 38.30 1.15 1.21 1.20 8.0 Y 6 4DSHS - Eastern State Hospital Renovation, phase 5 1.00 235 4.70 0.21 1.88 1.33 1.54 39.00 1.01 1.17 1.14 8.8 Y 3 4
DOC - SOU: 400 bed expansion 1.01 117 4.87 0.24 1.00 1.00 1.00 80.35 0.98 1.02 1.01 8.4 Y 7 4
DOC - WCCW expansion 1.09 44 11.52 0.23 1.91 1.35 1.55 43.50 1.46 1.04 1.08 8.4 Y 6 4
GA - OB2 preservation n/a 228 4.55 n/a n/a n/a n/a n/a 1.50 1.15 1.19 8.0 Y 5 4 Military Department - Bremerton Readiness Center 0.98 30 22.21 0.15 1.00 1.19 1.15 34.18 1.72 1.09 1.17 8.4 Y 8 4
UW - Surgery Pavilion 1.00 650 5.80 0.31 1.20 1.00 1.05 144.23 1.13 0.99 1.01 8.8 Y 7 4
UW - Johnson Hall 1.00 10 10.00 n/a 1.13 n/a n/a n/a n/a n/a n/a n/a n/a 6 4
UW - Tacoma phase 2A 1.00 215 9.03 n/a 1.07 1.27 1.18 36.06 n/a 1.12 n/a 8.0 Y 6 4
WSU - ELSB Vancouver 1.00 91 9.60 0.25 0.75 0.72 0.73 91.38 0.85 1.02 0.99 8.4 Y 5 4
WSU - Shock Physics 0.99 199 3.80 0.26 0.87 1.06 0.95 30.11 1.04 1.11 1.10 8.4 Y 5 6
WSU - Plant Biosciences 1.00 0 0.00 0.30 0.63 1.00 0.85 70.52 0.88 0.92 0.91 n/a n/a 4 6
WWU - Communications Facility 0.95 363 6.30 0.13 1.69 0.85 1.17 74.40 0.95 1.02 1.01 8.5 Y 9 6
Mean – All 1.00 173 13.19 0.20 1.12 1.21 1.12 79.88 1.28 1.08 1.09 8.4 7 4
Median – All 1.00 117 7.60 0.21 1.00 1.08 1.06 41.25 1.15 1.08 1.10 8.4 6 4

PERFORMANCE AUDIT OF CAPITAL BUDGET PROCESSES
Three agency projects were not considered in the averages or the median values, except for the number of bids received and allowed response time, because the projects are still in the construction phase. These are:
• Department of General Administration, Office Building Two.
• University of Washington, Johnson Hall.
• Washington State University, Plant Biosciences Building.
Scope attainment Scope attainment refers to the ratio of square feet of actual construction to the square feet of construction planned initially. A scope attainment lower than one indicates that the final construction area was less than the planned area, while a scope attainment greater than one indicates that the final construction area was more than that planned initially.
• Scope attainment on the reviewed projects ranged from 0.77 to 1.50. The mean and median for scope attainment over all projects was 1.00.
• Spokane Community College, with a scope attainment of 1.50, was an outlier on the list. An increase in scope attainment to such an extent resulted from availability of extra funds after the project began.
• The minimum scope attainment of 0.76 on Highline Community College was a result of underestimation of the project cost during the pre-design phase of the building. This was realized during the design phase, and the scope of the project was reduced to complete the project in the appropriated budget.
Explanation of the statistical terms used later in this section:
Mean: The average of a list of numbers or values in a data set is known as the mean. Mean is calculated as the ratio of the sum of a list of values,or observations, divided by the total number of numbers in the list.
Median: A median is the "middle value" of a given list of observations. It is the smallest number such that at least half the numbers in the list are no greater than it. If the list has an odd number of entries, the median is the middle entry in the list after sorting the list into increasing order. If the list has an even number of entries, the median is equal to the sum of the two middle (after sorting) numbers divided by two.
Outlier: An observation (or measurement) that is unusually large or small relative to the other values in a data set is called an outlier.
Skewness: A parameter that outlines the lack of symmetry in a list of observations or numbers.
Means and medians, the two most common types of “averages” or central tendencies, are mentioned in the analysis below. Statistically, in a set of operations, if one or two observations are unusually higher or lower than the other observations (outliers), the mean will not give an accurate indication of the “average” of all observations. In such a scenario, the median will represent the “average” more accurately.
51

PERFORMANCE AUDIT OF CAPITAL BUDGET PROCESSES
Number of change orders • Number of change orders on projects ranged from 20 (Bellevue Community College) to
650 (University of Washington Medical Center Surgery Pavilion). The mean number of change orders was 173, while the median was 117.
Change orders on an individual project, when compared to projects of similar size and type, help to normalize performance. The number of change orders in and of themselves do not provide a clear indication of the quality of design documents or change in scope, as multiple changes may have been merged into one change order, and all change orders may be of varying amounts, some of them negative.
Mean cost of change orders • The cost of change orders ranged from $2,100 on Highline Community College Higher
Education Center to $79,900 on Bellevue Community College parkade.
• The mean cost of change orders was $13,190, while the median was $7,600.
Intensity of delivery Intensity of delivery, a hybrid cost/schedule metric, indicates the unit cost of design and construction work put in place in a facility per unit time. The unit used in this evaluation is ($/sq ft)/day. A higher intensity of delivery indicates a better outcome in terms of cost and schedule.
• The mean and median for intensity of delivery were 0.20 and 0.21 respectively, indicating that none of the projects had unusually high or low intensity of delivery.
• Public buildings are usually complex, specialized (e.g., prisons, laboratories), and designed for a longer life span than private sector buildings. This can result in a higher cost per square foot and in a higher intensity of delivery (measured as ($/sq ft)/day).
Design time growth Design time growth represents the ratio of final design contract completion time to the original design contract completion time. A design time growth of more than one indicates that the design took longer than anticipated.
• Design time growth on all projects ranged from 0.72 (Spokane Community College) to 1.91 (Washington Corrections Center for Women).
• The mean and median time growths were 1.12 and 1.00. Washington Corrections Center for Women (1.91), and Department of Social and Health Sciences (1.88) were the biggest outliers resulting in a skewed mean.
Construction time growth Construction time growth represents the ratio of final construction contract completion time to the original construction contract completion time. A construction time growth of more than one indicates that the construction phase took longer than scheduled.
• Washington State University, Engineering/Life Sciences Building, Vancouver campus (0.72), had the least construction time growth of the projects evaluated, while Highline
52

PERFORMANCE AUDIT OF CAPITAL BUDGET PROCESSES
Community College Building 30 Addition, had a maximum construction time growth of 2.58.
• The mean construction time growth over all projects was 1.21, while the median was 1.08. This indicates that construction of the evaluated projects took longer than scheduled.
Project schedule attainment Project schedule attainment takes into account both the design and construction time growth to see whether the project was completed as scheduled. Project schedule attainment is calculated as the ratio of final design and construction contract completion time to the original design and construction contract completion time. A project schedule attainment of one indicates that the project was completed on schedule, while a project schedule attainment of more than one indicates that the project was over schedule.
• Schedule attainment on the projects ranged from negative 0.73. (Engineering/Life Sciences Building) to 1.55 (Department of Corrections, Washington Corrections Center for Women).
Delivery speed Delivery speed on a project represents the number of square feet of construction work completed in a day, taking into account both the design and construction time. A higher number represents a better performance. The most common factors affecting delivery speed are amount of renovation work, design complexity, and construction complexity. An increase in any of the three factors mentioned above tends to reduce the delivery speed.
Design cost growth Design cost growth is calculated as the ratio of the final design contract amount to the original design contract amount. A design cost growth of one indicates that the project was completed within budget, and a number greater than one indicates an increase in design cost.
• Design cost growth on projects ranged from negative 0.85 on the Washington State University Engineering/Life Sciences Building project to 2.60 on the Highline Community College Building 30 Addition; the second highest design cost growth was 1.72 on the Bremerton Readiness Center project.15
Construction cost growth Construction cost growth is calculated as the ratio of the final construction contract amount to the original construction contract amount. A construction cost growth of one indicates that the project was completed within budget, and a number greater than one indicates an increase in construction growth.
• Construction cost growth ranged from 0.99 on the University of Washington Medical Center Surgery Pavilion to 1.21 on the Spokane Community College Health Sciences Building.
• The median cost growth over all the projects was found to be 1.08.
15 Building 30 Addition had additional design services resulting from the failure and termination of the initial contractor.
53

PERFORMANCE AUDIT OF CAPITAL BUDGET PROCESSES
Project cost attainment Project cost attainment takes into account both the design and construction cost growths to see whether the project was completed within budget. Project cost attainment is calculated as the ratio of the total of final design and construction contract amounts to the original total of design and construction contract amounts. Values greater than one indicates that the project went over the total design and construction budget.
• Cost increases on all projects ranged from 0.99 (savings) to 1.20 (increase).
• The median project cost attainment over all projects was found to be 1.10.
Average of satisfaction ratings The satisfaction ratings, which are based on the level of satisfaction of building end users, were ranked on a scale from 1 to 10, consistent with the national standards for the satisfaction ratings. The overall high values indicate that the users of all of the projects evaluated have been satisfied with the functionality and the quality of the buildings.
Number of bids • The number of bids received for the construction phase of the projects ranged from a
minimum of three to a maximum of 16. The mean number of bids received was seven, while the median was six.
Literature reviewed for this study suggests that a total of three or more construction bids indicate a healthy amount of competition.
Allowed response time • All of the agencies allowed contractors four to six weeks to respond to the bid request or
proposal request, which is the optimal time range.
Two of the 17 projects allowed the bidders just three weeks to respond. This, though not the optimal time frame, is still within the acceptable limits.
Application of Best Practices Shown below is the table consolidating best practices implementation on all agency and case study projects. Best practices that were found to be properly implemented have been rated with a “yes,” while those followed partially are rated as “partial.” Practices that were not followed on the projects are rated “no.” These best practice ratings are derived from the evaluator’s assessment of the best practice indicators on each project (these indicators are described in detail in C). Though the indicators were confirmed by the agencies in technical review with JLARC’s consultant, the best practice ratings are “subjective” as discussed in Chapter 3.
The best practice ratings are based on both the practices of the agencies and the regulation and oversight under which the agencies function. Because timely approval of funding is dependent on factors outside the agencies’ control, a “partial” rating on this best practice may result from a lack of management practices on the part of the agencies, from limitations in the funding framework, or from a combination of both.
54

PERFORMANCE AUDIT OF CAPITAL BUDGET PROCESSES
Figure 12 – Case Study Ratings
Best Practice Yes Partial No
Defined roles and responsibilities 15 1 1 Measurable goals for investment 16 1 0 Timely approval of funding 12 3 2 Risk assessment 17 0 0 Coordinated scheduling 16 1 0 Cost control 16 1 0 Scope definition and control 9 7 1 Quality assurance and safety 16 1 0 Open competition 16 1 0 Formal scheduling methods 14 3 0 Change management process 17 0 0 Working relationship 16 0 1 Dispute prevention, resolution 7 10 0 Commissioning process 16 0 1
55

PERFORMANCE AUDIT OF CAPITAL BUDGET PROCESSES
Figure 13 – Best Practices Implementation Data Capital Process Phase
Best Practice Evaluation Criterion Score Benchmarking Reference
Planning and Conception
Appropriate project delivery, procurement, and contracting methods were considered for this project.
Policies and Procedures
Does the agency have a published policy regarding the selection of a project delivery method on its projects?
Execution Practice
Describe the process for making the project delivery method selection decision.
Example Indicators of Use
What project delivery alternatives were considered on this project?
What process was used to identify the most appropriate delivery method?
Were the costs and benefits of different project delivery methods explored?
How were various project risks considered when selecting project delivery, procurement, and contracting methods?
Subjective evaluation of best practices by evaluator.
Were related project performance metrics satisfactory? Scope Schedule Cost Market Competition
Design-Build Institute of America, Construction Management Association of America, Construction Industry Institute
Roles and responsibilities are defined in a manner which allocates project risks to the party that is best able to control them.
Policies and Procedures
Does the agency define roles and responsibilities of key owner and contractor personnel on its projects?
Execution Practice
Are these policies modified on a project-by-project basis?
Subjective evaluation of best practices by evaluator.
Were related project performance metrics satisfactory? Scope Market Competition
Design-Build Institute of America, Project Management Institute
56

PERFORMANCE AUDIT OF CAPITAL BUDGET PROCESSES
Figure 13 – Best Practices Implementation Data Capital Process Phase
Best Practice Evaluation Criterion Score Benchmarking Reference
Example Indicators of Use
Was a management plan that identified the roles and responsibilities of key owner and project personnel developed for this project?
Was this plan periodically updated?
How were these roles and responsibilities mapped to the appropriate project risks.
Budget Development & Approval
Measurable goals for project investment are defined.
Policies and Procedures
Does the agency utilize investment goals to identify viable projects?
Execution Practice
Describe the process used to develop measurable investment goals.
Example Indicators of Use
What were the goals for this project?
Were these goals quantified?
Were they achieved?
Were related project performance metrics satisfactory? Scope Cost Schedule Market Competition
OMB
Funding is approved in a timeframe that does not adversely impact project delivery schedule or the project scope.
Policies and Procedures
Does the agency have procedures that track fund authorization against project milestones?
Execution Practice
Subjective evaluation of best practices by evaluator.
Were related project performance metrics satisfactory?
OMB
57

PERFORMANCE AUDIT OF CAPITAL BUDGET PROCESSES
Figure 13 – Best Practices Implementation Data Capital Process Phase
Best Practice Evaluation Criterion Score Benchmarking Reference
Describe the funding authorization and tracking procedures on this project.
Example Indicators of Use
Did project milestones match project authorization documents?
Were any delays or scope changes attributable to non-availability of funds?
Scope Schedule
Project risk management assessment is conducted prior to advertising the project.
Policies and Procedures
Does the agency require risk management assessment to made accounting on its projects?
Execution Practice
Describe the process used to complete a risk management assessment review.
Example Indicators of Use
How were potential risks identified early in the project?
Were these risks quantified?
How were these risks managed or mitigated during the design and construction process?
Subjective evaluation of best practices by evaluator.
Were related project performance metrics satisfactory? Scope Schedule Cost
Project Management Institute
Execution
Design & Construction
Scheduling of design and construction activities is coordinated before work commences.
Policies and Procedures
Describe the design and construction management plans that are in place before work begins.
Subjective evaluation of best practices by evaluator.
Were related project performance metrics
Construction Industry Institute-BP, Project Management Institute, Construction
58
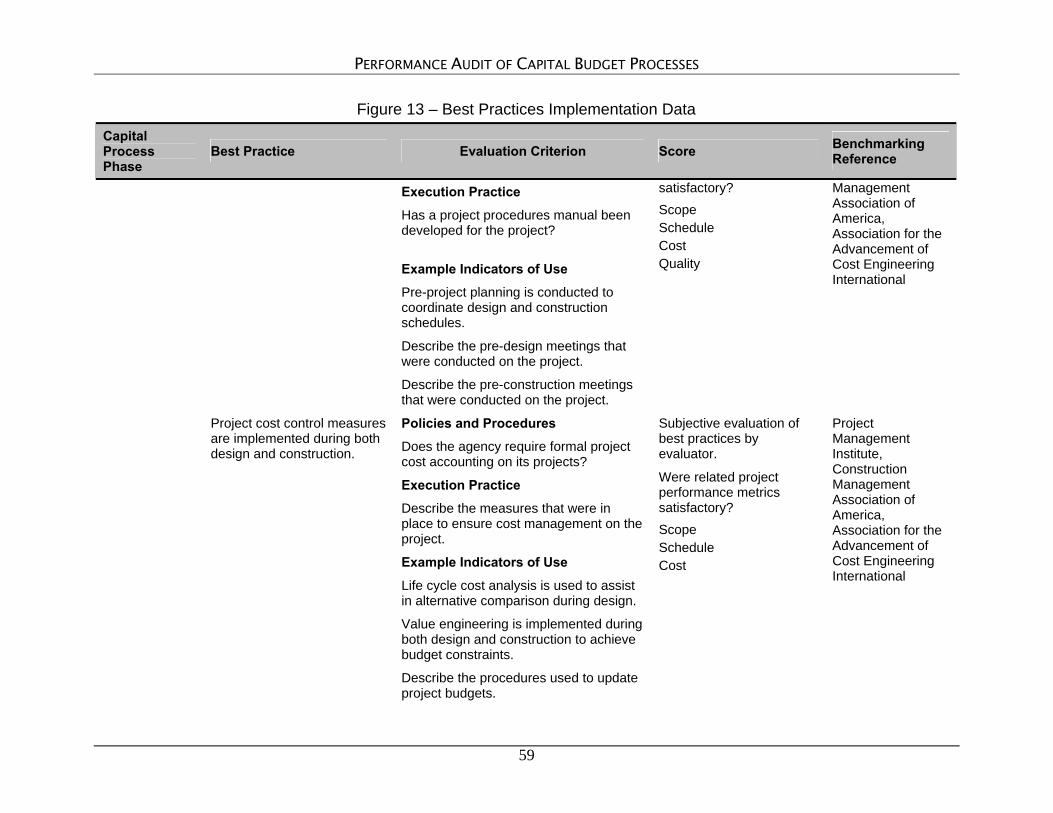
PERFORMANCE AUDIT OF CAPITAL BUDGET PROCESSES
Figure 13 – Best Practices Implementation Data Capital Process Phase
Best Practice Evaluation Criterion Score Benchmarking Reference
Execution Practice
Has a project procedures manual been developed for the project?
Example Indicators of Use
Pre-project planning is conducted to coordinate design and construction schedules.
Describe the pre-design meetings that were conducted on the project.
Describe the pre-construction meetings that were conducted on the project.
satisfactory? Scope Schedule Cost Quality
Management Association of America, Association for the Advancement of Cost Engineering International
Project cost control measures are implemented during both design and construction.
Policies and Procedures
Does the agency require formal project cost accounting on its projects?
Execution Practice
Describe the measures that were in place to ensure cost management on the project.
Example Indicators of Use
Life cycle cost analysis is used to assist in alternative comparison during design.
Value engineering is implemented during both design and construction to achieve budget constraints.
Describe the procedures used to update project budgets.
Subjective evaluation of best practices by evaluator.
Were related project performance metrics satisfactory? Scope Schedule Cost
Project Management Institute, Construction Management Association of America, Association for the Advancement of Cost Engineering International
59

PERFORMANCE AUDIT OF CAPITAL BUDGET PROCESSES
Figure 13 – Best Practices Implementation Data Capital Process Phase
Best Practice Evaluation Criterion Score Benchmarking Reference
How are project budget updates reported and to whom?
Project scope is well-defined and controlled during design and construction.
Policies and Procedures
Does the agency require formal design effectiveness/design responsibility programs on its projects?
Execution Practice
What steps were taken to ensure that the design of the facility conformed to user expectations?
What environmental and building permits were required?
Example Indicators of Use
Have design error/omissions claims been pressed against the designer on the project?
Are constructability reviews being conducted during design development prior to construction?
Did the permitting process cause any delays to the project?
Subjective evaluation of best practices by evaluator.
Were related project performance metrics satisfactory? Scope Schedule Cost Quality Market Competition
Construction Industry Institute-BP, Association for the Advancement of Cost Engineering International, Design-Build Institute of America, Project Management Institute
Procedures are in place that both define and enforce project quality requirements including safety.
Policies and Procedures
Describe the quality management plan that is used for design and construction.
Describe the measures used by the owner to ensure a safe workplace environment.
Subjective evaluation of best practices by evaluator.
Were related project performance metrics satisfactory? Scope
Construction Industry Institute-BP, Project Management Institute, Construction Management Association of
60

PERFORMANCE AUDIT OF CAPITAL BUDGET PROCESSES
Figure 13 – Best Practices Implementation Data Capital Process Phase
Best Practice Evaluation Criterion Score Benchmarking Reference
Execution Practice
What processes are in place to monitor the quality of design on the project?
What processes are in place to monitor Contractor compliance with the quality level expected for the project? Does the agency have published safety policies beyond OSHA regulations on its projects?
Example Indicators of Use
Has a comprehensive written quality management plan been put in place for the project?
Has a comprehensive written safety management plan been put in place for the project?
Schedule Cost Quality
America, Association for the Advancement of Cost Engineering International, Design-Build Institute of America
Public Works Procurement
Project procurement procedures provide open competition for qualified contractors and the procurement procedures are fair and transparent.
Policies and Procedures
Does the agency have a formal written procurement policy in addition to the state legislation for the delivery method used on this project (design-bid-build or general contractor/construction manager)?
Execution Practice
As appropriate for this project, describe the process for selecting the designer, general contractor/construction manager, contractor, and/or major subcontractors
Subjective evaluation of best practices by evaluator.
Were related project performance metrics satisfactory? Schedule Cost Quality Market Competition
FAR, Appropriate WA State Legislation
61

PERFORMANCE AUDIT OF CAPITAL BUDGET PROCESSES
Figure 13 – Best Practices Implementation Data Capital Process Phase
Best Practice Evaluation Criterion Score Benchmarking Reference
on this project.
Example Indicators of Use
Was adequate time provided for offerors/bidders on this project?
Were any procurement protests filed on this project?
Did adequate numbers of qualified offerors/bidders respond to the project solicitation?
Project Management
Project management utilizes formal work scheduling methods and is able to maintain an up to date progress schedule for design and construction.
Policies and Procedures
Does the agency require formal project scheduling on its projects?
Execution Practice
What types of scheduling systems are in place to ensure timely delivery?
Example Indicators of Use
Is a milestone schedule available for the project?
Is a critical path method schedule available for the project?
Was a work breakdown structure created for the project?
How are project schedule changes reported and to whom?
Subjective evaluation of best practices by evaluator.
Were related project performance metrics satisfactory? Schedule Cost Market Competition
Project Management Institute, Construction Management Association of America, Association for the Advancement of Cost Engineering International
Project management controls scope and the change management process.
Policies and Procedures
Does the agency have published change management procedures on its projects?
Subjective evaluation of best practices by evaluator.
Construction Industry Institute-BP, Project
62

PERFORMANCE AUDIT OF CAPITAL BUDGET PROCESSES
Figure 13 – Best Practices Implementation Data Capital Process Phase
Best Practice Evaluation Criterion Score Benchmarking Reference
Execution Practice
Describe the change management process for the project during:
Design phase.
Construction phase.
Example Indicators of Use
Who has authority to agree to change orders?
How are change orders documented during:
Design phase.
Construction phase.
Were related project performance metrics satisfactory? Scope Schedule Cost Quality
Management Institute
Project management fosters a positive working relationship throughout the design and construction process.
Policies and Procedures
Does the agency have any published policies regarding formal partnering procedures?
Execution Practice
Describe the process used to partner a typical project.
Example Indicators of Use
What informal team building steps were employed on this project?
Was a formal partnering charter made for this project?
Subjective evaluation of best practices by evaluator.
Were related project performance metrics satisfactory? Schedule Cost Quality Market Competition
Construction Industry Institute-BP
Project management actively Policies and Procedures Subjective evaluation of Construction
63

PERFORMANCE AUDIT OF CAPITAL BUDGET PROCESSES
Figure 13 – Best Practices Implementation Data Capital Process Phase
Best Practice Evaluation Criterion Score Benchmarking Reference
seeks to prevent disputes and has a plan to expedite their resolution when they occur.
Does the agency require alternative dispute resolution methods on its projects?
Execution Practice
Describe the dispute prevention and resolution processes that have been put in place for the project.
Example Indicators of Use
Were there any early dispute prevention measures put in place on the contract?
Were any alternative dispute resolution techniques put in place on the project?
best practices by evaluator.
Were related project performance metrics satisfactory? Scope Schedule Cost Quality Market Competition
Industry Institute-BP, Project Management Institute
Plans for start-up have been developed during the design process and are followed once construction is complete.
Policies and Procedures
Does the agency require formal facility start-up and/or commissioning plans on its projects?
Execution Practice
Describe the process used to plan for project start-up and/or commissioning.
Example Indicators of Use
Did the project have a formal commissioning plan developed during design and followed during construction and start-up?
Were any major issues encountered at time of facility start-up?
Subjective evaluation of best practices by evaluator.
Were related project performance metrics satisfactory? Schedule Cost Quality
Construction Industry Institute-BP
64

APPENDIX 7 – CASE-STUDY PROJECT SUMMARIES
Figure 14 - Case Studies Overview
State Agency Project Name Delivery Method
Project Classification
Cost* (millions)
Design Start
Const. End
Bellevue Community College Parkade DBB Parking $10.40 Oct-01 May-04 Grays Harbor College Library Renovation DBB Teaching Lab $6.00 Jul-01 Sep-03
Highline Community College Classroom Lab Building: “Building 30 Addition” DBB General Classroom $6.70 Mar-98 Sep-02
Highline Community College Higher Education Center GC/CM Student Services $23.50 Sep-01 Mar-05Spokane Community College Health Sciences Building Addition DBB Teaching Lab $8.40 Mar-98 Sep-02 Department of Social and Health Services
Eastern State Hospital: Campus renovation, Phase 5 DBB Food Services
Facility $9.50 Dec-99 Mar-03
Department of Corrections Special Offender Unit: 400 bed expansion GC/CM Prison - Close
Security Level $36.50 Mar-98 Nov-01
Department of Corrections Washington Corrections Center for Women expansion project GC/CM
Mental Health Facility - Maximum
Security Level $16.20 Aug-99 Mar-02
Washington State General Administration Office Building Two DBB Office Space Active N/A† Active
Military Department Bremerton Readiness Center DBB Readiness Center $10.50 Jul-99 Aug-03 University of Washington Surgery Pavilion GC/CM Medical Center $70.00 Mar-00 Aug-03University of Washington Johnson Hall renovation GC/CM General Classroom Active Feb-03 Active University of Washington Tacoma – Phase 2A DBB Teaching Lab N/A† Jan-99
Dec-01
Washington State University Vancouver - Branch Campus: Engineering/Life Science Building GC/CM Teaching Lab $20.40 Apr-98 Nov-00
Washington State University Shock Physics DBB Teaching Lab $11.40 Sep-99 Jan-03 Washington State University Johnson Hall/Plant Biosciences Phase 1 GC/CM Research Active May-02 Active Western Washington University Communications Building DBB General Classroom $29.50 Apr-00 Aug-04
* Design and construction cost. †Data not available.
65

PERFORMANCE AUDIT OF CAPITAL BUDGET PROCESSES
Bellevue Community College – Parkade
Bellevue Community College Parkade is the first of three such structures planned for the main campus of this college. All of these structures will expand needed parking capacity and consolidate that capacity onto densely used land, freeing up existing parking lots on this hemmed-in site.
Design phase of this project started in October 2001, and construction was substantially completed in May 2004, at a total project cost of approximately $9.4 million.
Bellevue Community College and the Washington State Department of General Administration, Division of Engineering and Architectural Services managed the parkade project using the design-bid-build construction management method.
Grays Harbor College – Library Renovation
The John Spellman Library is on the main campus library for Grays Harbor College. The building renovation project was a combination of 45 percent renovation and 55 percent new construction.
Design on the project started in July 2001, and construction was completed in September 2003, at a total project cost of approximately $5.1 million.
The Grays Harbor College has a very small project management staff and relies almost entirely on third parties to manage its capital projects. Most of the project management and construction management duties for the design and construction on this project were contracted out. Grays Harbor College and Engineering and Architectural Services managed the project using the design-bid-build construction management method.
Highline Community College – Building 30 addition
The Highline Community College Building 30 Addition is a teaching facility on the Highline Community College campus in Des Moines, Washington. The project was a combination of 60 percent renovation and 40 percent new construction.
Design started in March 1998, and construction was completed in September 2002, at a total cost of approximately $7.6 million. Highline Community College and Engineering and Architectural Services managed the Building 30 Addition project using the design-did-build construction management method.
Highline Community College – Higher Education Center
The Higher Education Center is a teaching facility built by Highline Community College on its campus in Des Moines, Washington. The project consists of 100 percent new construction.
Design started in July 2001, and construction is expected to be competed in March 2005, at a total cost of approximately $30.8 million.
66
PERFORMANCE AUDIT OF CAPITAL BUDGET PROCESSES
Highline Community College and Engineering and Architectural Services are managing this project using the general contractor/construction manager method.
Spokane Community College – Health Sciences Building
The Spokane Community College Health Sciences Building Addition consists of 39,000 square feet of addition and 24,000 square feet of renovation work to the existing Health Sciences Building.
Design phase for this project began in March 1998, and construction was completed in September 2002, at a cost of $7.5 million.
Spokane Community College is a part of a multi-college district that operates as Community Colleges of Spokane. The Community Colleges of Spokane district office provides district-wide support, including capital project construction management services, through its district facilities department. Spokane Community College and Engineering and Architectural Services managed this project using the design-bid-build construction management method.
Department of Social and Health Services – Eastern State Hospital
The Kitchen/Dining Building project was one of six phases of renovation throughout the 70 year old Eastern State Hospital building. This is the principal site from which the Washington State Department of Social and Health Services delivers psychiatric treatment to residents of eastern Washington.
Design for this project started in July 1999, and construction was substantially completed in March 2003, at a total cost of approximately $10.2 million.
The Department of Social and Health Services and the Engineering and Architectural Services have formed an integral project management team that jointly manages The Department of Social and Health Services projects. This project was managed using the design-bid-build method.
Department of Corrections – Special Offender Unit: 400-Bed Expansion
The Department of Corrections Special Offender Unit expansion project added 256 medium custody beds to the existing 144 beds at the Special Offender Unit in Monroe, Washington.
Design for this expansion began in March 1998, and construction was completed in November 2001, at a total design and construction cost of $38.9 million.
The Department of Corrections and Engineering and Architectural Services TEAM managed this project using the general contractor/construction manager method of construction management.
67

PERFORMANCE AUDIT OF CAPITAL BUDGET PROCESSES
Department of Corrections – Washington Corrections Center for Women Expansion
The Department of Corrections, Washington Corrections Center for Women, is the primary correctional facility in Washington for all female inmates. This expansion project replaced the pre-existing 30-bed segregation unit and 32-bed special needs unit with a new 150-bed special needs unit.
The design process for this addition began in August 1999, and the construction phase was completed in March 2002, at a total project cost of $19.8 million.
The TEAM managed this project using the general contractor/construction manager method.
Washington State Department of General Administration – Office Building 2 Preservation
Office Building Two is a facility built in 1972 on the Washington State Capitol Campus in Olympia and managed by the Department of General Administration. The Office Building Two renovation project is a combination of 93 percent renovation and seven percent new construction.
Design started in 1996, and the construction in late 2008. The total cost of the project is estimated to be approximately $22 million.
The General Administration’s Division of Facilities Planning and Management is managing the Office Building Two project using the design-bid-build construction management method.
Washington State Military Department – Bremerton Readiness Center
The Army National Guard Bremerton Readiness Center is the training and mustering facility of the National Guard stationed in the Kitsap County area. The building is also used by the Kitsap County fire departments for training and for emergency responses.
Design for this new construction started in July 1999, and construction was substantially completed in August 2003, at a total project cost of approximately $11.4 million.
The Washington State Military Department and Engineering and Architectural Services managed the Bremerton Readiness Center project using the design-bid-build construction management method.
University of Washington – Medical Center Surgery Pavilion
The University of Washington Surgery Pavilion is located on the University of Washington’s main campus in Seattle, and was constructed on the site of pre-existing
68

PERFORMANCE AUDIT OF CAPITAL BUDGET PROCESSES
parking spaces. This three-story building houses short-stay surgery and treatment areas, as well as diagnostic and supplementary services.
Design phase for this project began in May 2000, and construction was completed in August 2003. The design, construction, and management costs on this project totaled approximately $71.5 million.
The University of Washington Capital Projects Office manages construction projects on the University of Washington Seattle and Tacoma campuses independent of any other agencies such as the Engineering and Architectural Services, and managed this project using the general contractor/construction manager construction method.
University of Washington – Johnson Hall Renovation
The University of Washington Johnson Hall primarily houses the Department of Earth and Space Sciences and the Department of Biology. The building was constructed in 1930 with an addition in 1948. Changes in the fields of research and the effect of time had rendered this building inefficient in its intended purposes. The renovation project will not only improve the research facilities, but will also address modern seismic, health, safety, and code requirements to ensure long-term preservation of this architecturally significant building.
Design work for this project began in February 2003, and construction is expected to be completed in October 2005. Total design and construction cost on this project is expected to be around $44.7 million upon completion.
The University of Washington Capital Projects Office is managing this project using the general contractor/construction manager method of construction management.
University of Washington, Tacoma –Phase 2A Central
The University of Washington Tacoma phase 2A central project was part of the ongoing new construction/renovation at University of Washington, Tacoma campus, and added the new Science Building and Keystone Building to the University of Washington, Tacoma campus, along with some renovation work to the existing site work.
Design work on this project began around January 1999, and construction was completed in December 2001, at a total construction cost of $17.5 million.
The University of Washington Capital Projects Office managed this project using the design-bid-build construction management approach.
Washington State University – Vancouver Branch Campus – Engineering/Life Sciences Building
The Engineering/Life Sciences Building is a new building on the Vancouver, Washington campus of Washington State University, built to provide classroom and teaching laboratory space to service the expanding enrollment there.
69
PERFORMANCE AUDIT OF CAPITAL BUDGET PROCESSES
Design on the project started in July 1997, and construction was substantially completed in November 2000, at a total cost of approximately $17.4 million.
Washington State University manages its projects independent of Engineering and Architectural Services, and managed this project using the general contractor/ construction manager construction management method.
Washington State University – Shock Physics Building
The Shock Physics Building is a research and teaching facility built by the Washington State University on its main campus in Pullman. More than 80 percent of the space was new construction, and the balance was the renovation of classroom space in the adjacent Webster Hall.
Design for this project began in September 1999, and construction was substantially completed in January 2003, at a total project cost of approximately $12.6 million.
The Washington State University managed this project using the design-bid-build construction management method.
Washington State University – Johnson Hall/Plant Biosciences Building
The Plant Biosciences Building is a new building on the Pullman campus of the Washington State University that is designed to replace and expand upon the obsolete laboratory space in the 40-year old Johnson Hall. The new building is the first of six development phases that will, by 2015, replace Johnson Hall and some adjacent outdoor tennis courts with six new buildings to house the College of Agriculture and Home Economics, and some research programs of United States Department of Agriculture.
Design for this project started in July 2001, and construction is currently underway with substantial completion scheduled for December 2005. The project is forecast to be completed for about $2 million less that its $38.6 million budget.
The Washington State University is managing the Plant Biosciences Building using the general contractor/construction manager construction management method.
Western Washington University – Communications Facility
The Communications Facility is a teaching facility built by Western Washington University (WWU) on its main campus in Bellingham. The project was 100 percent new construction.
Design started in April 2000, and construction was substantially completed in February 2004, at a total project cost of $30 million.
WWU managed the Communications Facility as a design-bid-build project.
70

APPENDIX 8 – OFM PROJECT TRACKING SYSTEMS
JLARC endeavored to pull together data from various state level systems to create a portfolio of major state projects. The portfolio exercise served three purposes. First, to see what kind of project information was available to OFM, both in electronic and paper form; second, what level of effort was necessary to develop a portfolio with information about a whole project; third, what kind of analysis could be conducted with the information provided.
OFM capital analysts use several systems to track the progress of major capital projects. The following is a list of capital systems and a brief description of their function.
1. C-100 Form is a tool to assist agencies in developing a project construction budget. It is also an analysis tool to help OFM and legislative decision-makers understand the cost and other parameter associated with the project.16 The C-100 Form is submitted at predesign and updated for each of the following phases. It contains a description of the project, project statistics, and detailed cost information for predesign, design, and construction phases.
2. Capital Budget System (CBS) allows agencies to develop and submit their Capital Budget requests (C-100 Form) on-line. The purpose of this system is to allow analysts an easy way to collect project budget information electronically. Previously, agencies had sent in paper copies of their budget. CBS also assigns each project a unique identification number. The system is updated each biennium, as the project moves through each of the three phases.
3. C-2 Form is a print out report from CBS that contains summarized data from the C-100.
4. Agency Financial Reporting System (AFRS) is the state-owned accounting system used by all state agencies and higher-education institutions in the state of Washington. The system performs all aspects of the accounting process. It tracks actual project expenditures to appropriations and fund source by biennium. It does not total the full cost of a project over multiple biennia. It is also not directly linked to the CBS project identification number.
5. Budget and Allotment Support System (BASS) links the budget and allotment systems for analysts. This information is submitted by agencies in the CBS.
16 OFM 2003-2013 Capital Plan Instructions, pg 36.
71

PERFORMANCE AUDIT OF CAPITAL BUDGET PROCESSES
72
6. BuildSum is the system that OFM uses to receive from CBS. Here OFM has access to the C-2 Form and budget request information.
7. Major Project Status Reports are detailed progress status reports submitted to OFM and the fiscal committees of the Legislature. They include basic descriptive information about the project, total cost, and schedule information. These reports are submitted twice annually.
JLARC found, through the portfolio exercise, that OFM did not have a readily available database of detailed project descriptions and budget information. The BASS system gives OFM analysts access only to the C-2 Form which is just a summary of the more detailed C-100. Currently, analysts at OFM must ask agencies to submit paper copies of their C-100. Analysts use the C-100 Form to review the allocated budgeted cost by specific object and to monitor changes in the budget as a project moves from predesign through construction.
JLARC also found inconsistencies in the quality of information found in the Major Project Status Report. The Major Project Status Report is a tool developed by OFM to monitor the progress of a project between biennial cycles. Agencies are given a template that they fill in and submit electronically via email to OFM. However, OFM does not give specific instructions on what goes into these forms; therefore, agencies are left to decide what will be communicated. In addition, OFM does not have a way of compiling the information contained in these reports into a single database. This makes it difficult to track the performance of a project as it moves within and across biennium.
In addition, JLARC found that some projects were assigned different identification numbers every biennium by CBS. When agencies enter in a new project into CBS, the system assigns the project an eight-digit unique identifier. If the project has been requested before, the agency would enter the previous project identifier. When we asked OFM why previously requested projects were being assigned new numbers, they indicated that it was either the agency putting in a new number or sometimes CBS just assigns a new number to a project anyway. Since BASS and AFRS track information by appropriation broken up by fund source, the inconsistency of the project identification number made it very difficult to total the full cost of a project over multiple biennia. This is especially true when the project title also changes from biennium to biennium.
Finally, JLARC found that since the current systems did not provide information that could be easily or accurately collected, there was a limit to the kinds of analysis that could be done. Without this information, OFM is unable to track performance between projects across biennium. For example, OFM analysts have suspected that the amount of soft costs for a project has been increasing as a percentage of total project costs over the last decade or more. Soft Costs are all expenditures excluding construction and acquisition. For example, schematic designs and project management expenditures are considered soft costs. Without an easy system of analyzing a project from start to finish, these types of questions will go unanswered.