Embed Size (px)
Citation preview
EDITION 1.0
INTERNAL AUDIT COORDINATION BOARD
Performance Audit Manual for Public Internal Auditors
Case Studies
ANKARA | April 2016
INTERNAL AUDIT COORDINATION BOARD
Performance Audit Manual for Public Internal Auditors
Case Studies
ANKARA | April 2016

TABLE OF CONTENTS
1. CASE 1
PERFORMANCE AUDIT OF THE LIBRARY PROCESSES OF UNIVERSITY A ........................................ 7
A. LAUNCHING THE AUDIT ENGAGEMENT ................................................................................... 8
A1. ASSIGNMENT ................................................................................................................. 8
A2. PREPARATION OF THE IMPARTIALITY AND CONFIDENTIALITY DOCUMENT .................... 8
A3. NOTIFICATION TO THE AUDITEE ......................................................................................... 8
B. PRELIMINARY WORK ........................................................................................................... 11
B1. DEVELOPING THE AUDIT ENGAGEMENT TIME SCHEDULE ......................................... 10
B2. ASSESSMENT OF THE PERFORMANCE MANAGEMENT SYSTEM ................................. 13
B3. UNDERSTANDING THE LOGICAL FRAMEWORK ........................................................... 16
B4. IDENTIFICATION OF AUDIT COMPONENTS AND METHODS ....................................... 18
B5. KICK OFF MEETING ...................................................................................................... 18
B6. DEVELOPING THE AUDIT MATRIX ............................................................................... 21
B7. PREPARATION AND APPROVAL OF THE WORK PLAN .................................................... 23
C.FIELD WORK......................................................................................................................... 25
C1. DATA COLLECTION ...................................................................................................... 25
C2. DATA ANALYSIS ........................................................................................................... 26
C3. IDENTIFICATION OF FINDINGS AND DEVELOPMENT OF RECOMMENDATIONS ......... 35
D.REPORTING ......................................................................................................................... 43
D1. OFFICIAL SHARING OF FINDINGS ........................................................................................ 43
D2. CLOSING MEETING ....................................................................................................... 48
2. CASE 2
PERFORMANCE AUDIT OF THE BUS OPERATIONS OF MUNICIPALITY A ..................................... 51
A. LAUNCHING THE AUDIT ENGAGEMENT ................................................................................. 52
A1. ASSIGNMENT ............................................................................................................... 52
A2. PREPARATION OF THE IMPARTIALITY AND CONFIDENTIALITY DOCUMENT .................. 52
A3. NOTIFICATION TO THE AUDITEE ................................................................................... 52
B. PRELIMINARY WORK ........................................................................................................... 55
B1. DEVELOPING THE AUDIT ENGAGEMENT TIME SCHEDULE.......................................... 55
B2. ASSESSMENT OF THE PERFORMANCE MANAGEMENT SYSTEM ................................. 56
B3. UNDERSTANDING THE LOGICAL FRAMEWORK ........................................................... 60
B4. IDENTIFICATION OF AUDIT COMPONENTS AND METHODS ....................................... 62
B5. KICK OFF MEETING ...................................................................................................... 63
B6. DEVELOPING THE AUDIT MATRIX ............................................................................... 64
B7. PREPARATION AND APPROVAL OF THE WORK PLAN .................................................... 68
C. FIELD WORK ........................................................................................................................ 70
C1. DATA COLLECTION....................................................................................................... 70
C2. DATA ANALYSIS ........................................................................................................... 72
D.R EPORTING.......................................................................................................................... 81
D1. OFFICIAL SHARING OF FINDINGS ........................................................................................ 81
D2. CLOSING MEETING ....................................................................................................... 85
3
4
3. CASE 3
PERFORMANCE AUDIT OF THE EMERGENCY CALL CENTRE OF PRESIDENCY A ........................... 89
A. DENETİM GÖREVİNİN BAŞLATILMASI ..................................................................................... 90
A1. GÖREVLENDİRME ........................................................................................................ 90
A2. PREPARATION OF THE IMPARTIALITY AND CONFIDENTIALITY DOCUMENT .................. 90
A3. NOTIFICATION TO THE AUDITEE ................................................................................... 90
B. PRELIMINARY WORK ........................................................................................................... 93
B1. DEVELOPING THE AUDIT ENGAGEMENT TIME SCHEDULE ......................................... 93
B2. ASSESSMENT OF THE PERFORMANCE MANAGEMENT SYSTEM ................................. 94
B3. UNDERSTANDING THE LOGICAL FRAMEWORK ........................................................... 98
B4. IDENTIFICATION OF AUDIT COMPONENTS AND METHODS ....................................... 99
B5. KICK OFF MEETING ...................................................................................................... 99
B6. DEVELOPING THE AUDIT MATRIX ............................................................................. 102
B7. PREPARATION AND APPROVAL OF THE WORK PLAN .................................................. 103
C. FIELD WORK ...................................................................................................................... 105
C1. DATA COLLECTION..................................................................................................... 105
C2. DATA ANALYSIS ......................................................................................................... 106
C3. IDENTIFICATION OF FINDINGS AND DEVELOPMENT OF RECOMMENDATIONS ....... 116
D.REPORTING ....................................................................................................................... 118
D1. OFFICIAL SHARING OF FINDINGS ...................................................................................... 118
D2. CLOSING MEETING ..................................................................................................... 123
4. VAKA
PERFORMANCE AUDIT OF THE TRANSITION TO ELECTRONIC SYSTEM PROGRAM ................... 129
A. LAUNCHING THE AUDIT ENGAGEMENT .............................................................................. 130
A1. ASSIGNMENT ............................................................................................................. 130
A2. PREPARATION OF THE IMPARTIALITY AND CONFIDENTIALITY DOCUMENT ................ 130
A3. NOTIFICATION TO THE AUDITEE ................................................................................. 130
B. PRELIMINARY WORK ......................................................................................................... 133
B1. DEVELOPING THE AUDIT ENGAGEMENT TIME SCHEDULE........................................ 133
B2. ASSESSMENT OF THE PERFORMANCE MANAGEMENT SYSTEM ............................... 134
B3. UNDERSTANDING THE LOGICAL FRAMEWORK ......................................................... 138
B4. IDENTIFICATION OF AUDIT COMPONENTS AND METHODS ..................................... 140
B5. KICK OFF MEETING .................................................................................................... 140
B6. DEVELOPING THE AUDIT MATRIX ............................................................................. 142
B7. PREPARATION AND APPROVAL OF THE WORK PLAN .................................................. 147
C. FIELD WORK ...................................................................................................................... 149
C1. DATA COLLECTION ..................................................................................................... 149
C2. DATA ANALYSIS ......................................................................................................... 149
C3. IDENTIFICATION OF FINDINGS AND DEVELOPMENT OF RECOMMENDATIONS ....... 154
D.REPORTING ....................................................................................................................... 156
D1. OFFICIAL SHARING OF FINDINGS ...................................................................................... 156
D2. CLOSING MEETING ..................................................................................................... 159
Kam
u İç
Den
etçi
leri
İçin
Per
form
ans
Den
etim
i Reh
ber
i (V
aka
Çal
ışm
alar
ı)
Performance Audit of the Library Processes of University A
The content of the case study is not related to any organisation, practice or person. The content developed is completely fictional.


7
PERFORMANCE AUDIT OF THE LIBRARY PROCESSES OF UNIVERSITY A
University A is a well-established university with faculties of social sciences, engineering
and fine arts, where the language of instruction is English. According to leading indices, the
university ranks among the ten most successful universities nationwide.
University management declared 2017 as the library year. In this regard, a new objective
was set to enrich the university library, which has been in service since the establishment of the
university and is considered to be among the best of its kind in the country, and to increase the
number of users which was in a decline from 2011 to 2015.
Within the scope of the macro level risk assessment exercise conducted by the internal audit
unit, the library processes, which form part of the audit universe, were assessed against the risk factors
and in consideration of the goals and objectives of the strategic plan and the opinions of the top
manager and other senior managers. At the end of the assessment, it was decided to include the library
process in the audit program for 2016.
The university management is planning to use the audit results to take necessary actions for
the restructuring of the library in 2017.
The main expectations of the top management from the audit to be carried out are:
Assessment of the extent to which the existing library processes are sufficient to reach
the objectives set forth in the strategic plan of the university,
Assessment of the existing activities in comparison with the other city universities similar
to University A and with other good practices,
Identification of areas of development that need to be taken into account while
developing activities within the scope of 2017 library year.
In line with the objectives and expectations of the management, the internal audit unit
of the university decided to carry out a performance audit on the library processes. The audit has
been included in the audit program for 2016.
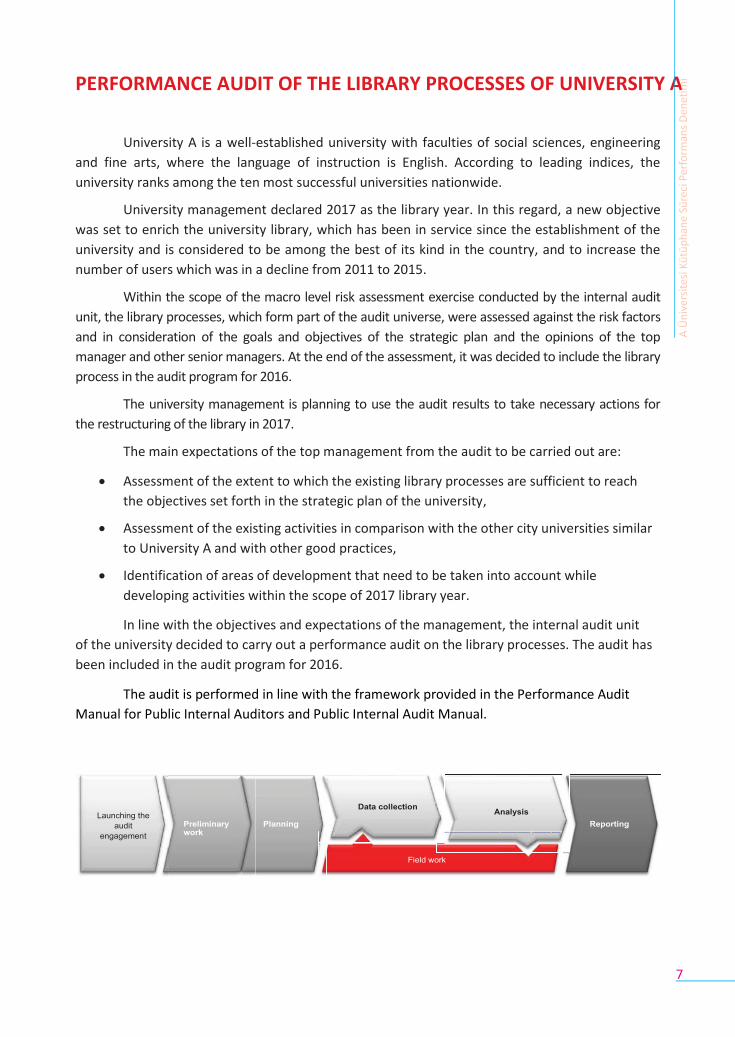
The audit is performed in line with the framework provided in the Performance Audit
Manual for Public Internal Auditors and Public Internal Audit Manual.
A Ü
niv
ers
ites
i Kü
tüp
han
e Sü
reci
Per
form
ans
Den
etim
i
8
A. LAUNCHING THE AUDIT ENGAGEMENT
A1. ASSIGNMENT
The head of the internal audit unit assigned internal auditors Aylin Kaya and Mehmet Akın
for this engagement, in accordance with the annual audit program. Senior auditor Ömer Başkale was
assigned as the Audit Supervisor. In the assignment of internal auditors, the head of internal audit
took into account the following elements:
- Complexity and size of the audit field
- Strategic importance of the audit field
- Technical knowledge requirement of the audit field
A2. PREPARATION OF THE IMPARTIALITY AND CONFIDENTIALITY DOCUMENT
Internal auditors assigned by the head of internal audit unit signed the impartiality and
confidentiality documents.
A3. NOTIFICATION TO THE AUDITEE
The head of internal audit sent a notification letter to the unit to be audited to give them
basic information about the audit.
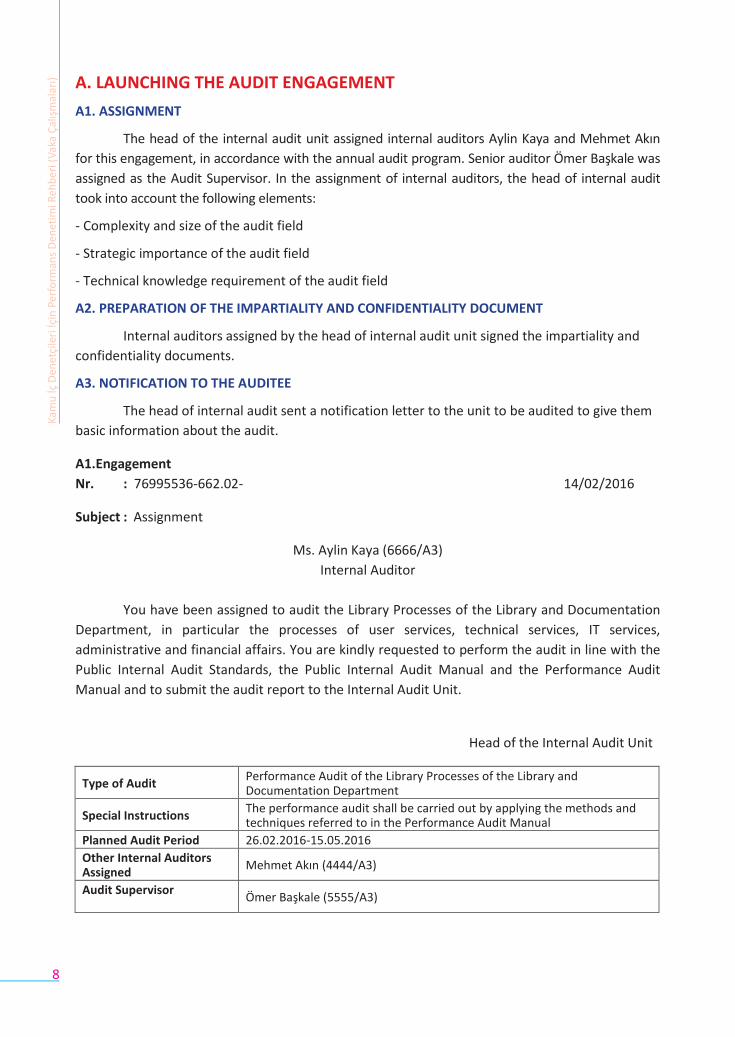
A1.Engagement
Nr. : 76995536-662.02- 14/02/2016
Subject : Assignment
Ms. Aylin Kaya (6666/A3)
Internal Auditor
You have been assigned to audit the Library Processes of the Library and Documentation
Department, in particular the processes of user services, technical services, IT services,
administrative and financial affairs. You are kindly requested to perform the audit in line with the
Public Internal Audit Standards, the Public Internal Audit Manual and the Performance Audit
Manual and to submit the audit report to the Internal Audit Unit.
Head of the Internal Audit Unit
Type of Audit Performance Audit of the Library Processes of the Library and Documentation Department
Special Instructions The performance audit shall be carried out by applying the methods and techniques referred to in the Performance Audit Manual
Planned Audit Period 26.02.2016-15.05.2016
Other Internal Auditors Assigned
Mehmet Akın (4444/A3)
Audit Supervisor Ömer Başkale (5555/A3)
Kam
u İç
Den
etçi
leri
İçin
Per
form
ans
Den
etim
i Reh
ber
i (V
aka
Çal
ışm
alar
ı)
9
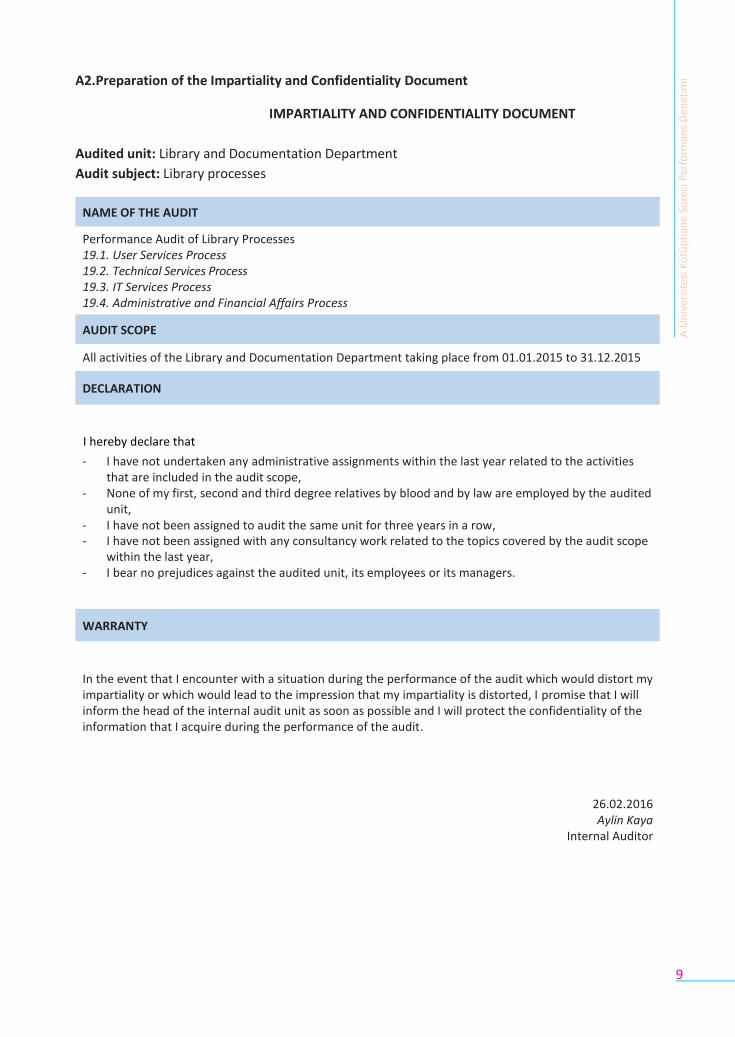
A2.Preparation of the Impartiality and Confidentiality Document
IMPARTIALITY AND CONFIDENTIALITY DOCUMENT
Audited unit: Library and Documentation Department
Audit subject: Library processes
Performance Audit of Library Processes 19.1. User Services Process 19.2. Technical Services Process 19.3. IT Services Process 19.4. Administrative and Financial Affairs Process
All activities of the Library and Documentation Department taking place from 01.01.2015 to 31.12.2015
I hereby declare that
- I have not undertaken any administrative assignments within the last year related to the activities that are included in the audit scope,
- None of my first, second and third degree relatives by blood and by law are employed by the audited unit,
- I have not been assigned to audit the same unit for three years in a row, - I have not been assigned with any consultancy work related to the topics covered by the audit scope
within the last year, - I bear no prejudices against the audited unit, its employees or its managers.
In the event that I encounter with a situation during the performance of the audit which would distort my impartiality or which would lead to the impression that my impartiality is distorted, I promise that I will inform the head of the internal audit unit as soon as possible and I will protect the confidentiality of the information that I acquire during the performance of the audit.
26.02.2016 Aylin Kaya
Internal Auditor
DECLARATION
NAME OF THE AUDIT
AUDIT SCOPE
WARRANTY
A Ü
niv
ers
ites
i Kü
tüp
han
e Sü
reci
Per
form
ans
Den
etim
i
11
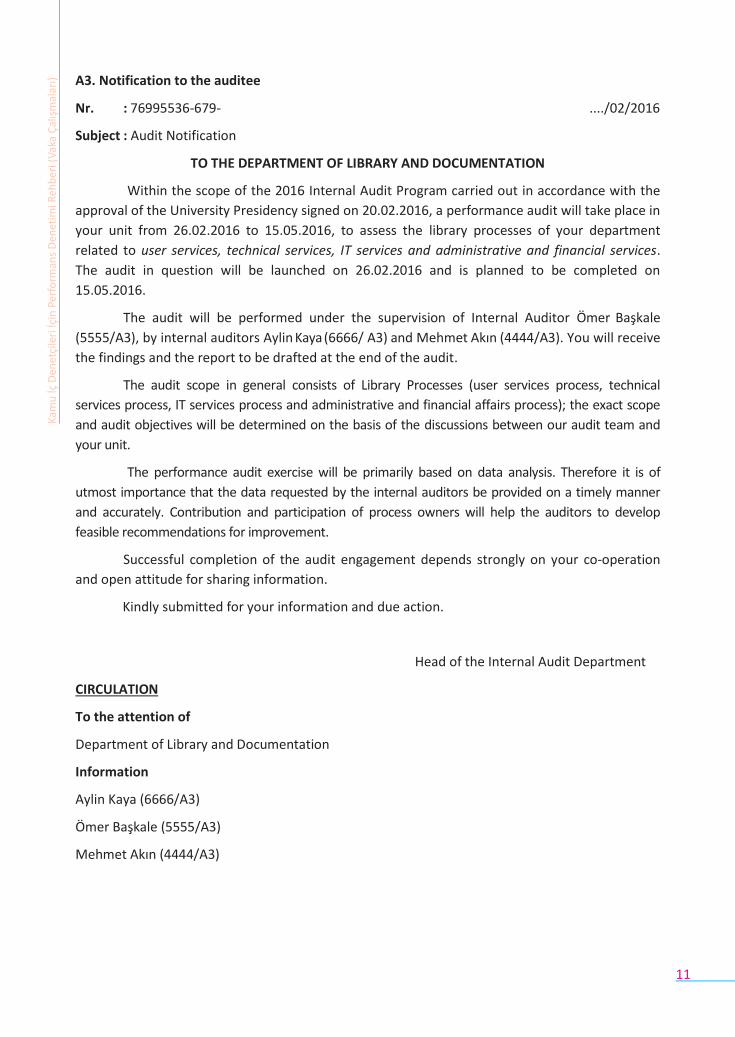
A3. Notification to the auditee
Nr. : 76995536-679- ..../02/2016
Subject : Audit Notification
TO THE DEPARTMENT OF LIBRARY AND DOCUMENTATION
Within the scope of the 2016 Internal Audit Program carried out in accordance with the
approval of the University Presidency signed on 20.02.2016, a performance audit will take place in
your unit from 26.02.2016 to 15.05.2016, to assess the library processes of your department
related to user services, technical services, IT services and administrative and financial services.
The audit in question will be launched on 26.02.2016 and is planned to be completed on
15.05.2016.
The audit will be performed under the supervision of Internal Auditor Ömer Başkale
(5555/A3), by internal auditors Aylin Kaya (6666/ A3) and Mehmet Akın (4444/A3). You will receive
the findings and the report to be drafted at the end of the audit.
The audit scope in general consists of Library Processes (user services process, technical
services process, IT services process and administrative and financial affairs process); the exact scope
and audit objectives will be determined on the basis of the discussions between our audit team and
your unit.
The performance audit exercise will be primarily based on data analysis. Therefore it is of
utmost importance that the data requested by the internal auditors be provided on a timely manner
and accurately. Contribution and participation of process owners will help the auditors to develop
feasible recommendations for improvement.
Successful completion of the audit engagement depends strongly on your co-operation
and open attitude for sharing information.
Kindly submitted for your information and due action.
Head of the Internal Audit Department
CIRCULATION
To the attention of
Department of Library and Documentation
Information
Aylin Kaya (6666/A3)
Ömer Başkale (5555/A3)
Mehmet Akın (4444/A3)
Kam
u İç
Den
etçi
leri
İçin
Per
form
ans
Den
etim
i Reh
ber
i (V
aka
Çal
ışm
alar
ı)
10
Identification of Audit Components and Methods
Kick off meeting
Understanding
the Logical
Framework
Audit Matrix Preparation and
approval of the Work
Plan
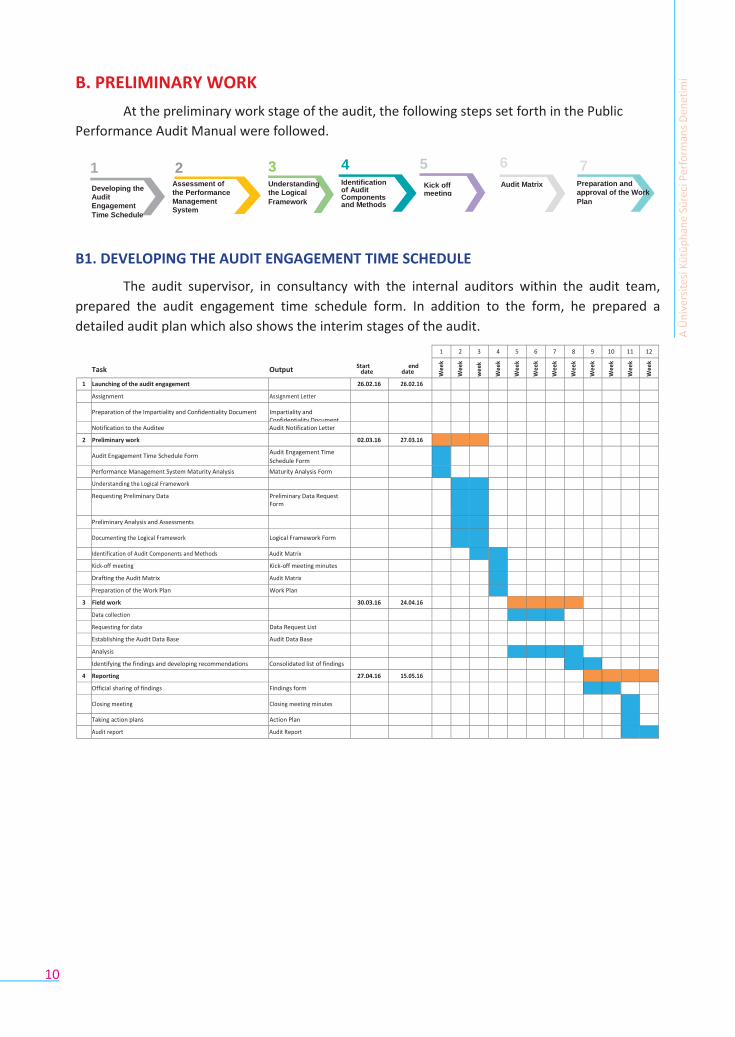
B. PRELIMINARY WORK
At the preliminary work stage of the audit, the following steps set forth in the Public
Performance Audit Manual were followed.
1 2 3 4 5 6 7 Assessment of
the Performance
Management
System
B1. DEVELOPING THE AUDIT ENGAGEMENT TIME SCHEDULE
The audit supervisor, in consultancy with the internal auditors within the audit team,
prepared the audit engagement time schedule form. In addition to the form, he prepared a
detailed audit plan which also shows the interim stages of the audit.
Task Output Start end date date
1 2 3 4 5 6 7 8 9 10 11 12
Wee
k
Wee
k
wee
k
Wee
k
Wee
k
Wee
k
Wee
k
Wee
k
Wee
k
Wee
k
Wee
k
Wee
k
1 Launching of the audit engagement 26.02.16 26.02.16 Assignment Assignment Letter Preparation of the Impartiality and Confidentiality Document Impartiality and
Confidentiality Document
Notification to the Auditee Audit Notification Letter 2 Preliminary work 02.03.16 27.03.16
Audit Engagement Time Schedule Form Audit Engagement Time
Schedule Form
Performance Management System Maturity Analysis Maturity Analysis Form Understanding the Logical Framework Requesting Preliminary Data Preliminary Data Request
Form
Preliminary Analysis and Assessments Documenting the Logical Framework Logical Framework Form
Identification of Audit Components and Methods Audit Matrix Kick-off meeting Kick-off meeting minutes Drafting the Audit Matrix Audit Matrix Preparation of the Work Plan Work Plan
3 Field work 30.03.16 24.04.16 Data collection Requesting for data Data Request List Establishing the Audit Data Base Audit Data Base Analysis Identifying the findings and developing recommendations Consolidated list of findings
4 Reporting 27.04.16 15.05.16 Official sharing of findings Findings form Closing meeting Closing meeting minutes
Taking action plans Action Plan Audit report Audit Report
A Ü
niv
ers
ites
i Kü
tüp
han
e Sü
reci
Per
form
ans
Den
etim
i
Developing the
Audit
Engagement
Time Schedule
12
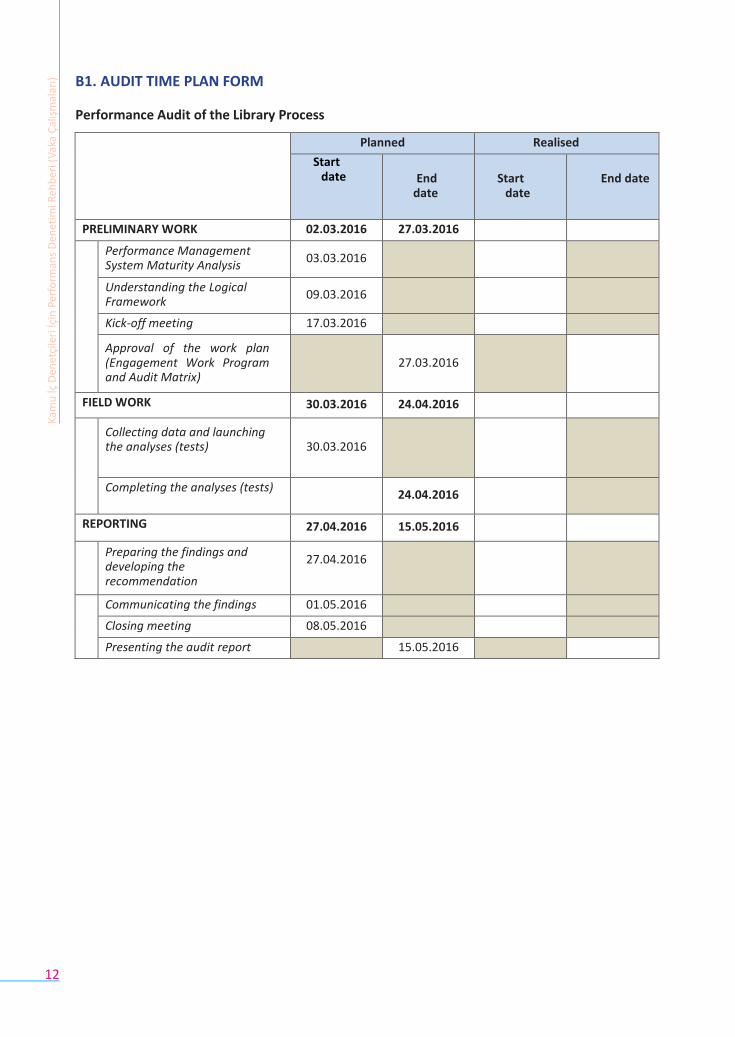
B1. AUDIT TIME PLAN FORM
Performance Audit of the Library Process
Planned Realised
Start date
End
date
Start
date
End date
PRELIMINARY WORK 02.03.2016 27.03.2016
Performance Management System Maturity Analysis
03.03.2016
Understanding the Logical Framework
09.03.2016
Kick-off meeting 17.03.2016
Approval of the work plan (Engagement Work Program and Audit Matrix)
27.03.2016
FIELD WORK 30.03.2016 24.04.2016
Collecting data and launching the analyses (tests)
30.03.2016
Completing the analyses (tests) 24.04.2016
REPORTING 27.04.2016 15.05.2016
Preparing the findings and developing the recommendation
27.04.2016
Communicating the findings 01.05.2016
Closing meeting 08.05.2016
Presenting the audit report 15.05.2016
Kam
u İç
Den
etçi
leri
İçin
Per
form
ans
Den
etim
i Reh
ber
i (V
aka
Çal
ışm
alar
ı)
13
B2. ASSESSMENT OF THE PERFORMANCE MANAGEMENT SYSTEM
The internal auditor assessed the maturity of the performance management system of the
audit field in order to ensure that the results of the performance audit exercise to be conducted
are successful. In this regard, the maturity of the audit field was analysed on the basis of the
following topics:
▪ Assessment of the maturity of the performance management system,
▪ Examination of whether the area to be audited is suitable for performance audit,
▪ Evaluation of whether the performance audit components are applicable on the area to
be audited.
In the assessment of the maturity of the performance management system, the maturity
analysis table provided in the Performance Audit Manual was used. The internal auditor asked the
following questions in this assessment.
Have the goals and objectives been defined at the level of the administration, its units and activities?
Have performance indicators been developed related to these goals and objectives?
Are the goals and objectives at the administration, unit, process, program and activity
level and related performance indicators followed through a system?
Is data related to performance indicators monitored and reported?
The preliminary study revealed that goals and objectives were defined at the level of units and activities of the University. Also, the goals and objectives of the library unit were described in the performance program. These goals and objectives were related with performance indicators. To monitor the performance indicators in a systematic manner, a software called “performance management system” is used. Some of the performance indicators are monitored through this program, which, however, lacks the necessary capacity to report on all performance indicators. The management attaches importance to this program and plans to make necessary investments for its further improvement.
A Ü
niv
ers
ites
i Kü
tüp
han
e Sü
reci
Per
form
ans
Den
etim
i
14
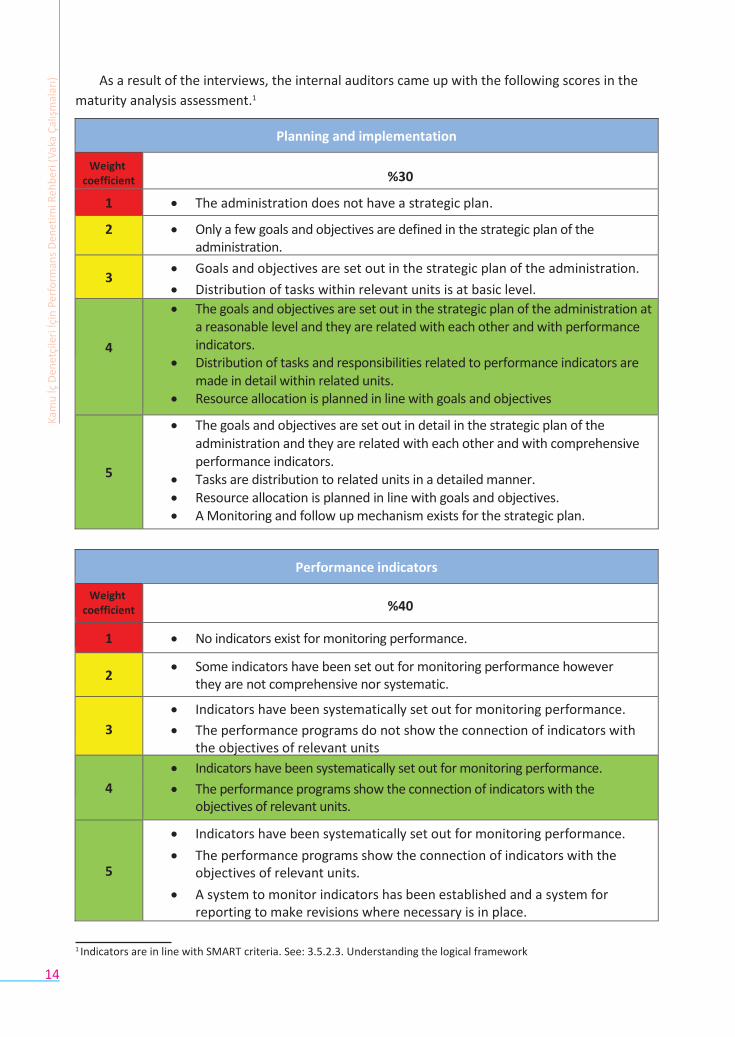
As a result of the interviews, the internal auditors came up with the following scores in the
maturity analysis assessment.1
Planning and implementation
Weight coefficient
%30
1 The administration does not have a strategic plan.
2 Only a few goals and objectives are defined in the strategic plan of the administration.
3 Goals and objectives are set out in the strategic plan of the administration.
Distribution of tasks within relevant units is at basic level.
4
The goals and objectives are set out in the strategic plan of the administration at a reasonable level and they are related with each other and with performance indicators.
Distribution of tasks and responsibilities related to performance indicators are made in detail within related units.
Resource allocation is planned in line with goals and objectives
5
The goals and objectives are set out in detail in the strategic plan of the administration and they are related with each other and with comprehensive performance indicators.
Tasks are distribution to related units in a detailed manner. Resource allocation is planned in line with goals and objectives. A Monitoring and follow up mechanism exists for the strategic plan.
Performance indicators
Weight coefficient %40
1 No indicators exist for monitoring performance.
2 Some indicators have been set out for monitoring performance however
they are not comprehensive nor systematic.
3
Indicators have been systematically set out for monitoring performance.
The performance programs do not show the connection of indicators with the objectives of relevant units
4
Indicators have been systematically set out for monitoring performance.
The performance programs show the connection of indicators with the objectives of relevant units.
5
Indicators have been systematically set out for monitoring performance.
The performance programs show the connection of indicators with the objectives of relevant units.
A system to monitor indicators has been established and a system for reporting to make revisions where necessary is in place.
1 Indicators are in line with SMART criteria. See: 3.5.2.3. Understanding the logical framework
Kam
u İç
Den
etçi
leri
İçin
Per
form
ans
Den
etim
i Reh
ber
i (V
aka
Çal
ışm
alar
ı)
15
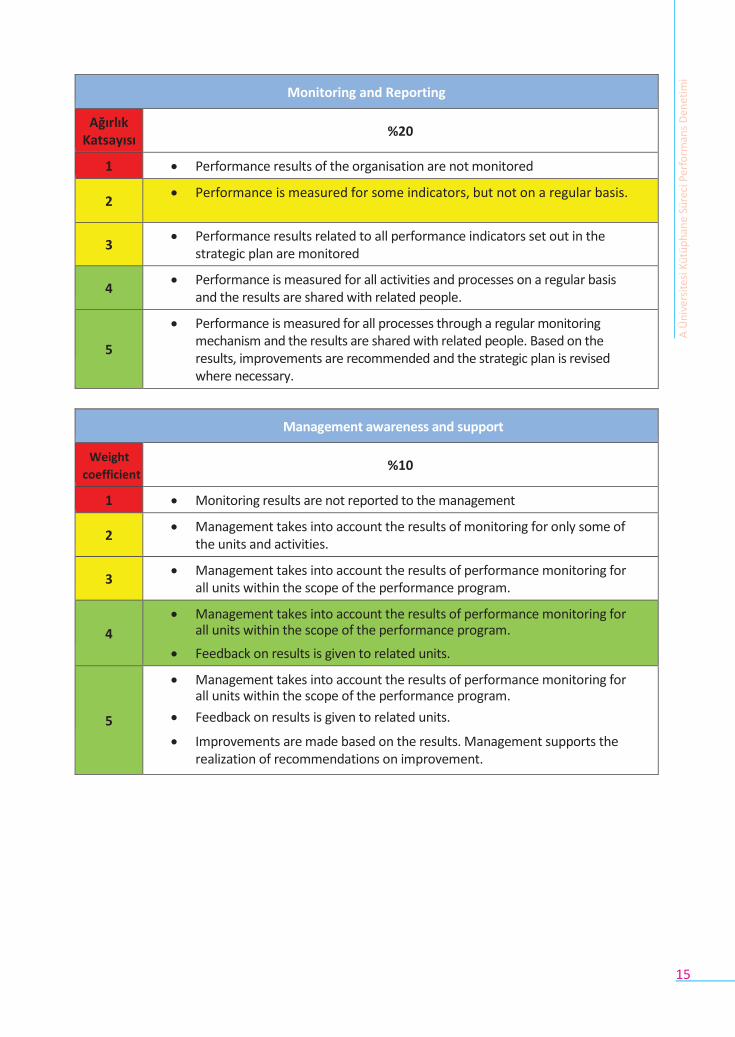
Monitoring and Reporting
Ağırlık Katsayısı
%20
1 Performance results of the organisation are not monitored
2 Performance is measured for some indicators, but not on a regular basis.
3 Performance results related to all performance indicators set out in the
strategic plan are monitored
4 Performance is measured for all activities and processes on a regular basis
and the results are shared with related people.
5
Performance is measured for all processes through a regular monitoring mechanism and the results are shared with related people. Based on the results, improvements are recommended and the strategic plan is revised where necessary.
Management awareness and support
Weight
coefficient %10
1 Monitoring results are not reported to the management
2 Management takes into account the results of monitoring for only some of
the units and activities.
3 Management takes into account the results of performance monitoring for
all units within the scope of the performance program.
4
Management takes into account the results of performance monitoring for all units within the scope of the performance program.
Feedback on results is given to related units.
5
Management takes into account the results of performance monitoring for all units within the scope of the performance program.
Feedback on results is given to related units.
Improvements are made based on the results. Management supports the realization of recommendations on improvement.
A Ü
niv
ers
ites
i Kü
tüp
han
e Sü
reci
Per
form
ans
Den
etim
i
16
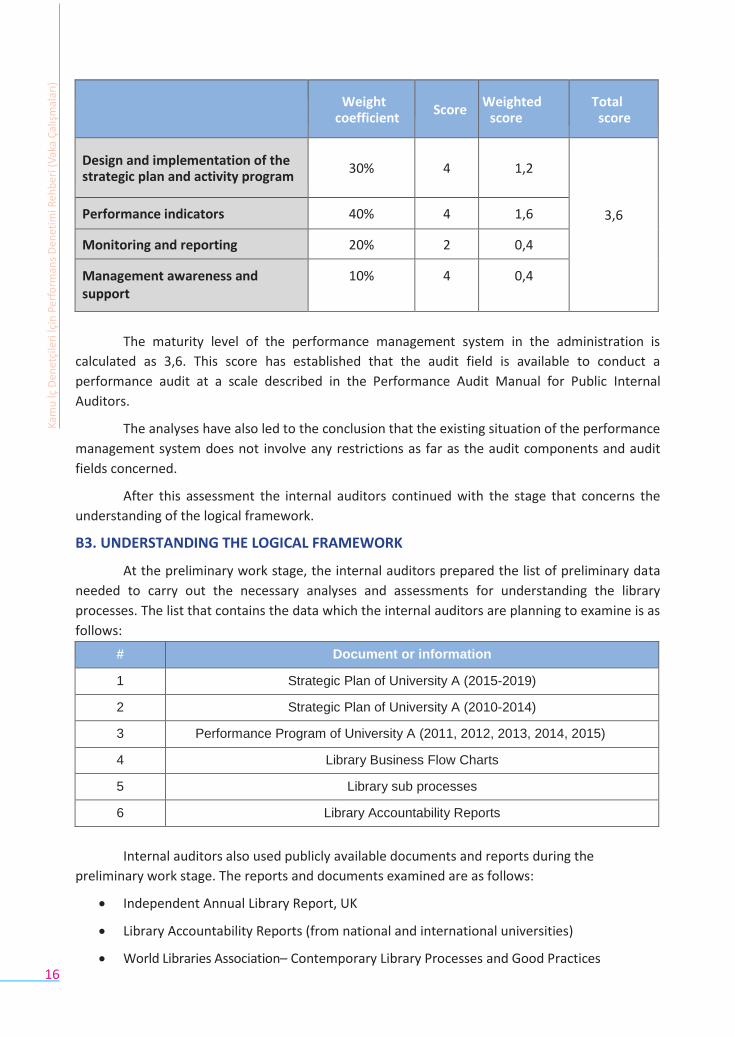
Weight
coefficient
Score
Weighted score
Total score
Design and implementation of the strategic plan and activity program
30%
4
1,2
3,6 Performance indicators 40% 4 1,6
Monitoring and reporting 20% 2 0,4
Management awareness and support
10% 4 0,4
The maturity level of the performance management system in the administration is
calculated as 3,6. This score has established that the audit field is available to conduct a
performance audit at a scale described in the Performance Audit Manual for Public Internal
Auditors.
The analyses have also led to the conclusion that the existing situation of the performance
management system does not involve any restrictions as far as the audit components and audit
fields concerned.
After this assessment the internal auditors continued with the stage that concerns the
understanding of the logical framework.
B3. UNDERSTANDING THE LOGICAL FRAMEWORK
At the preliminary work stage, the internal auditors prepared the list of preliminary data
needed to carry out the necessary analyses and assessments for understanding the library
processes. The list that contains the data which the internal auditors are planning to examine is as
follows:
# Document or information
1 Strategic Plan of University A (2015-2019)
2 Strategic Plan of University A (2010-2014)
3 Performance Program of University A (2011, 2012, 2013, 2014, 2015)
4 Library Business Flow Charts
5 Library sub processes
6 Library Accountability Reports
Internal auditors also used publicly available documents and reports during the
preliminary work stage. The reports and documents examined are as follows:
Independent Annual Library Report, UK
Library Accountability Reports (from national and international universities)
World Libraries Association– Contemporary Library Processes and Good Practices
Kam
u İç
Den
etçi
leri
İçin
Per
form
ans
Den
etim
i Reh
ber
i (V
aka
Çal
ışm
alar
ı)
17
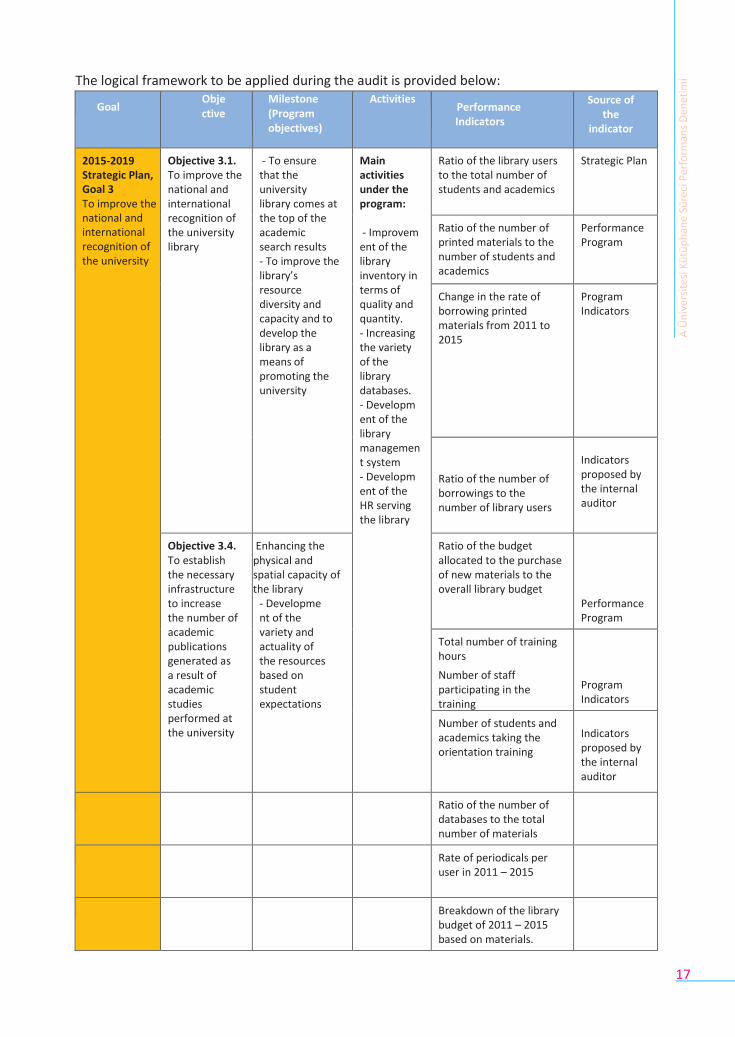
The logical framework to be applied during the audit is provided below:
Goal Objective
Milestone (Program objectives)
Activities Performance Indicators
Source of the
indicator
2015-2019 Strategic Plan, Goal 3 To improve the national and international recognition of the university
Objective 3.1. To improve the national and international recognition of the university library
- To ensure that the university library comes at the top of the academic search results - To improve the library’s resource diversity and capacity and to develop the library as a means of promoting the university
Main activities under the program:
- Improvement of the library inventory in terms of quality and quantity. - Increasing the variety of the library databases. - Development of the library management system - Development of the HR serving the library
Ratio of the library users to the total number of students and academics
Strategic Plan
Ratio of the number of printed materials to the number of students and academics
Performance Program
Change in the rate of borrowing printed materials from 2011 to 2015
Program Indicators
Ratio of the number of borrowings to the number of library users
Indicators proposed by the internal auditor
Objective 3.4. To establish the necessary infrastructure to increase the number of academic publications generated as a result of academic studies performed at the university
Enhancing the physical and spatial capacity of the library
- Development of the variety and actuality of the resources based on student expectations
Ratio of the budget allocated to the purchase of new materials to the overall library budget
Performance Program
Total number of training hours
Number of staff participating in the training
Program Indicators
Number of students and academics taking the orientation training
Indicators proposed by the internal auditor
Ratio of the number of databases to the total number of materials
Rate of periodicals per user in 2011 – 2015
Breakdown of the library budget of 2011 – 2015 based on materials.
A Ü
niv
ers
ites
i Kü
tüp
han
e Sü
reci
Per
form
ans
Den
etim
i
18
B4. IDENTIFICATION OF AUDIT COMPONENTS AND METHODS
After getting the views of the internal auditors, the audit supervisor decided that the
audit exercise, which is based on the expectations of the management and the audit scope, be
conducted focusing on the components of productivity, effectiveness, consistency and
conformity.
During the audit, the aim is to assess the activities and practices that form part of the library
processes against the following audit components and to identify areas of further improvement:
Productivity; assessment of whether the output generated from the available resources is
at an adequate level.
Effectiveness; capacity to reach objectives and realise intended results
Consistency; coherence between the defined goals, objectives and strategies of public
administrations and the planning and design of their programs and projects
Conformity; compliance of the activities and practices with the regulations and
procedures in force and adequacy of the institutional capacity for implementation
The methods that are planned to be applied in auditing the abovementioned components are
benchmarking and measuring and reporting on performance.
The benchmarking analysis will focus on:
the performance trends of the library from 2011 to 2015
performance of the library as compared to the libraries of national and international university libraries.
B5. KICK OFF MEETING
During the kick-off meeting, the internal auditor informed the auditee on the following topics:
audit team and its organisation
audit scope
stages of the audit
time schedule
identification of the comparison group
next steps
During the kick-off meeting, the auditee expressed its expectations as follows:
international university libraries are also used as a benchmark as part of the analysis on
the library activities
universities without a faculty of medicine are included in the comparison group
human resources and physical/spatial conditions of the library are taken into account
during the assessment.
Kam
u İç
Den
etçi
leri
İçin
Per
form
ans
Den
etim
i Reh
ber
i (V
aka
Çal
ışm
alar
ı)
19
since the student gateway of the library became operational towards the end of 2015 is
still under development, conceptual design of the gateway is assessed within the report.
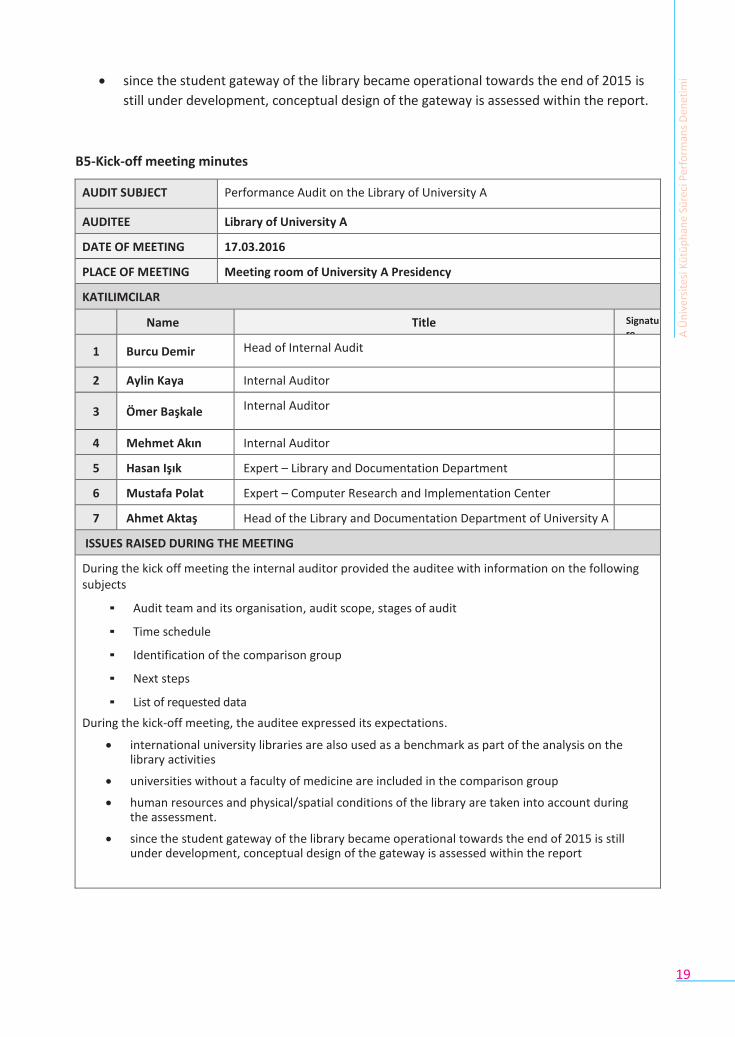
B5-Kick-off meeting minutes
AUDIT SUBJECT Performance Audit on the Library of University A
AUDITEE Library of University A
DATE OF MEETING 17.03.2016
PLACE OF MEETING Meeting room of University A Presidency
KATILIMCILAR
Name Title Signature
1 Burcu Demir Head of Internal Audit
2 Aylin Kaya Internal Auditor
3 Ömer Başkale Internal Auditor
4 Mehmet Akın Internal Auditor
5 Hasan Işık Expert – Library and Documentation Department
6 Mustafa Polat Expert – Computer Research and Implementation Center
7 Ahmet Aktaş Head of the Library and Documentation Department of University A
ISSUES RAISED DURING THE MEETING
During the kick off meeting the internal auditor provided the auditee with information on the following subjects
▪ Audit team and its organisation, audit scope, stages of audit
▪ Time schedule
▪ Identification of the comparison group
▪ Next steps
▪ List of requested data
During the kick-off meeting, the auditee expressed its expectations.
international university libraries are also used as a benchmark as part of the analysis on the library activities
universities without a faculty of medicine are included in the comparison group
human resources and physical/spatial conditions of the library are taken into account during the assessment.
since the student gateway of the library became operational towards the end of 2015 is still under development, conceptual design of the gateway is assessed within the report
A Ü
niv
ers
ites
i Kü
tüp
han
e Sü
reci
Per
form
ans
Den
etim
i
21
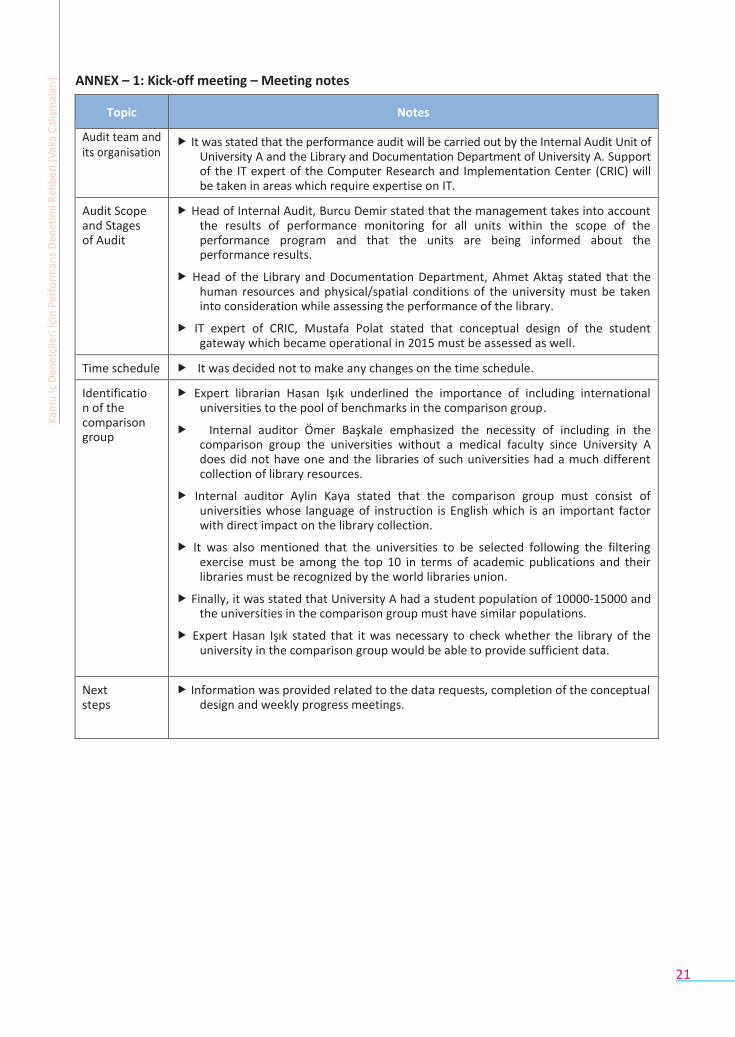
ANNEX – 1: Kick-off meeting – Meeting notes
Topic Notes
Audit team and its organisation
It was stated that the performance audit will be carried out by the Internal Audit Unit of University A and the Library and Documentation Department of University A. Support of the IT expert of the Computer Research and Implementation Center (CRIC) will be taken in areas which require expertise on IT.
Audit Scope and Stages of Audit
Head of Internal Audit, Burcu Demir stated that the management takes into account the results of performance monitoring for all units within the scope of the performance program and that the units are being informed about the performance results.
Head of the Library and Documentation Department, Ahmet Aktaş stated that the human resources and physical/spatial conditions of the university must be taken into consideration while assessing the performance of the library.
IT expert of CRIC, Mustafa Polat stated that conceptual design of the student gateway which became operational in 2015 must be assessed as well.
Time schedule It was decided not to make any changes on the time schedule.
Identification of the comparison group
Expert librarian Hasan Işık underlined the importance of including international universities to the pool of benchmarks in the comparison group.
Internal auditor Ömer Başkale emphasized the necessity of including in the comparison group the universities without a medical faculty since University A does did not have one and the libraries of such universities had a much different collection of library resources.
Internal auditor Aylin Kaya stated that the comparison group must consist of universities whose language of instruction is English which is an important factor with direct impact on the library collection.
It was also mentioned that the universities to be selected following the filtering exercise must be among the top 10 in terms of academic publications and their libraries must be recognized by the world libraries union.
Finally, it was stated that University A had a student population of 10000-15000 and the universities in the comparison group must have similar populations.
Expert Hasan Işık stated that it was necessary to check whether the library of the university in the comparison group would be able to provide sufficient data.
Next steps
Information was provided related to the data requests, completion of the conceptual design and weekly progress meetings.
Kam
u İç
Den
etçi
leri
İçin
Per
form
ans
Den
etim
i Reh
ber
i (V
aka
Çal
ışm
alar
ı)
20
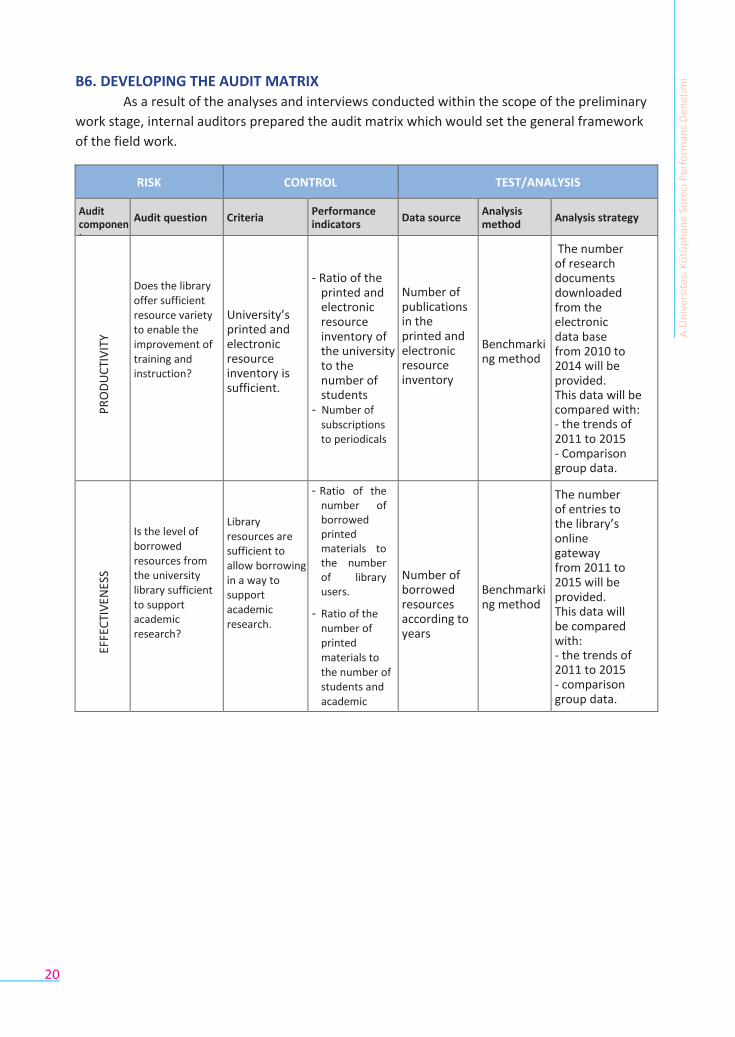
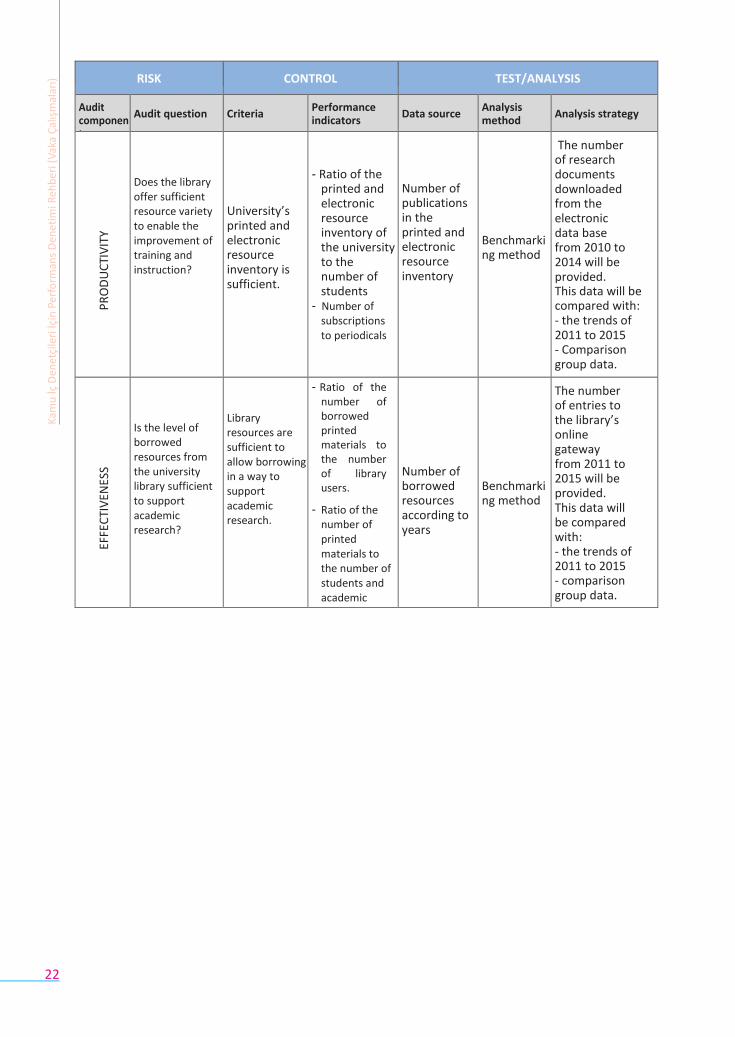
B6. DEVELOPING THE AUDIT MATRIX As a result of the analyses and interviews conducted within the scope of the preliminary
work stage, internal auditors prepared the audit matrix which would set the general framework
of the field work.
RISK CONTROL TEST/ANALYSIS
Audit component
Audit question
Criteria Performance indicators
Data source Analysis method
Analysis strategy
PR
OD
UC
TIV
ITY
Does the library offer sufficient resource variety to enable the improvement of training and instruction?
University’s printed and electronic resource inventory is sufficient.
- Ratio of the
printed and electronic resource inventory of the university to the number of students
- Number of subscriptions to periodicals
Number of publications in the printed and electronic resource inventory
Benchmarking method
The number of research documents downloaded from the electronic data base from 2010 to 2014 will be provided. This data will be compared with: - the trends of 2011 to 2015 - Comparison group data.
E
FFEC
TIV
ENES
S
Is the level of borrowed resources from the university library sufficient to support academic research?
Library resources are sufficient to allow borrowing in a way to support academic research.
- Ratio of the number of borrowed printed materials to the number of library users.
- Ratio of the number of printed materials to the number of students and academic staff.
Number of borrowed resources according to years
Benchmarking method
The number of entries to the library’s online gateway from 2011 to 2015 will be provided. This data will be compared with: - the trends of 2011 to 2015 - comparison group data.
A Ü
niv
ers
ites
i Kü
tüp
han
e Sü
reci
Per
form
ans
Den
etim
i
22
RISK CONTROL TEST/ANALYSIS
Audit component
Audit question
Criteria Performance indicators
Data source Analysis method
Analysis strategy
PR
OD
UC
TIV
ITY
Does the library offer sufficient resource variety to enable the improvement of training and instruction?
University’s printed and electronic resource inventory is sufficient.
- Ratio of the
printed and electronic resource inventory of the university to the number of students
- Number of subscriptions to periodicals
Number of publications in the printed and electronic resource inventory
Benchmarking method
The number of research documents downloaded from the electronic data base from 2010 to 2014 will be provided. This data will be compared with: - the trends of 2011 to 2015 - Comparison group data.
E
FFEC
TIV
ENES
S
Is the level of borrowed resources from the university library sufficient to support academic research?
Library resources are sufficient to allow borrowing in a way to support academic research.
- Ratio of the number of borrowed printed materials to the number of library users.
- Ratio of the number of printed materials to the number of students and academic staff.
Number of borrowed resources according to years
Benchmarking method
The number of entries to the library’s online gateway from 2011 to 2015 will be provided. This data will be compared with: - the trends of 2011 to 2015 - comparison group data.
Kam
u İç
Den
etçi
leri
İçin
Per
form
ans
Den
etim
i Reh
ber
i (V
aka
Çal
ışm
alar
ı)
23
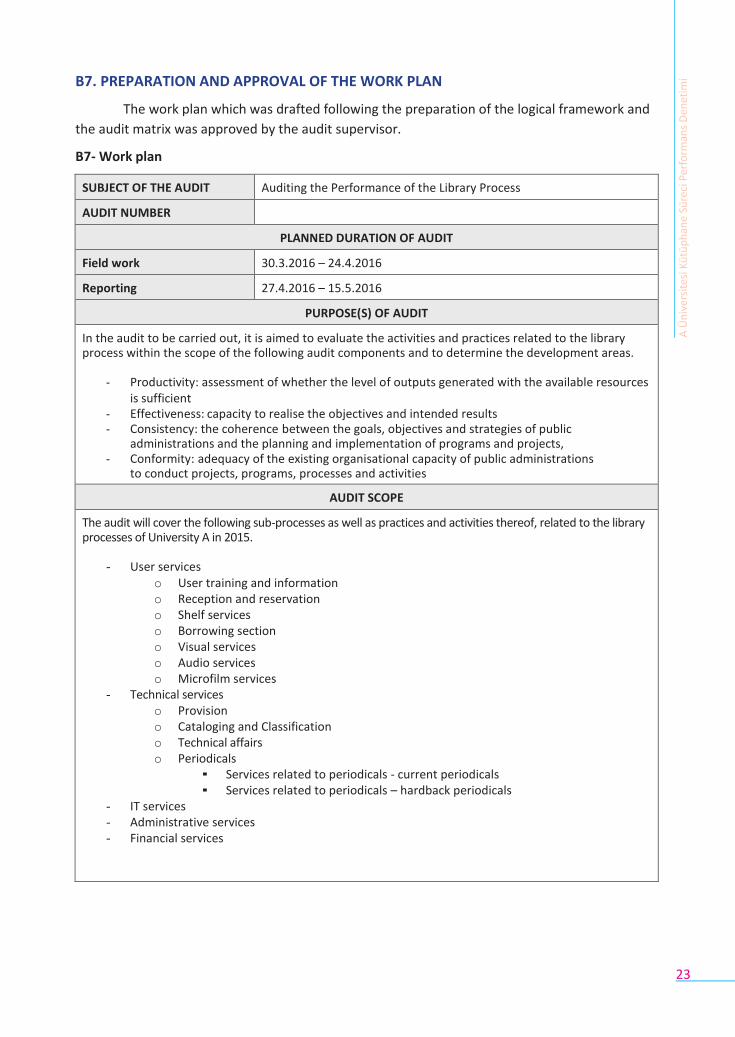
B7. PREPARATION AND APPROVAL OF THE WORK PLAN
The work plan which was drafted following the preparation of the logical framework and
the audit matrix was approved by the audit supervisor.
B7- Work plan
SUBJECT OF THE AUDIT Auditing the Performance of the Library Process
AUDIT NUMBER
PLANNED DURATION OF AUDIT
Field work 30.3.2016 – 24.4.2016
Reporting 27.4.2016 – 15.5.2016
PURPOSE(S) OF AUDIT
In the audit to be carried out, it is aimed to evaluate the activities and practices related to the library process within the scope of the following audit components and to determine the development areas.
- Productivity: assessment of whether the level of outputs generated with the available resources is sufficient
- Effectiveness: capacity to realise the objectives and intended results - Consistency: the coherence between the goals, objectives and strategies of public
administrations and the planning and implementation of programs and projects, - Conformity: adequacy of the existing organisational capacity of public administrations
to conduct projects, programs, processes and activities
AUDIT SCOPE
The audit will cover the following sub-processes as well as practices and activities thereof, related to the library processes of University A in 2015.
- User services o User training and information o Reception and reservation o Shelf services o Borrowing section o Visual services o Audio services o Microfilm services
- Technical services o Provision o Cataloging and Classification o Technical affairs o Periodicals
▪ Services related to periodicals - current periodicals ▪ Services related to periodicals – hardback periodicals
- IT services - Administrative services - Financial services
A Ü
niv
ers
ites
i Kü
tüp
han
e Sü
reci
Per
form
ans
Den
etim
i
24
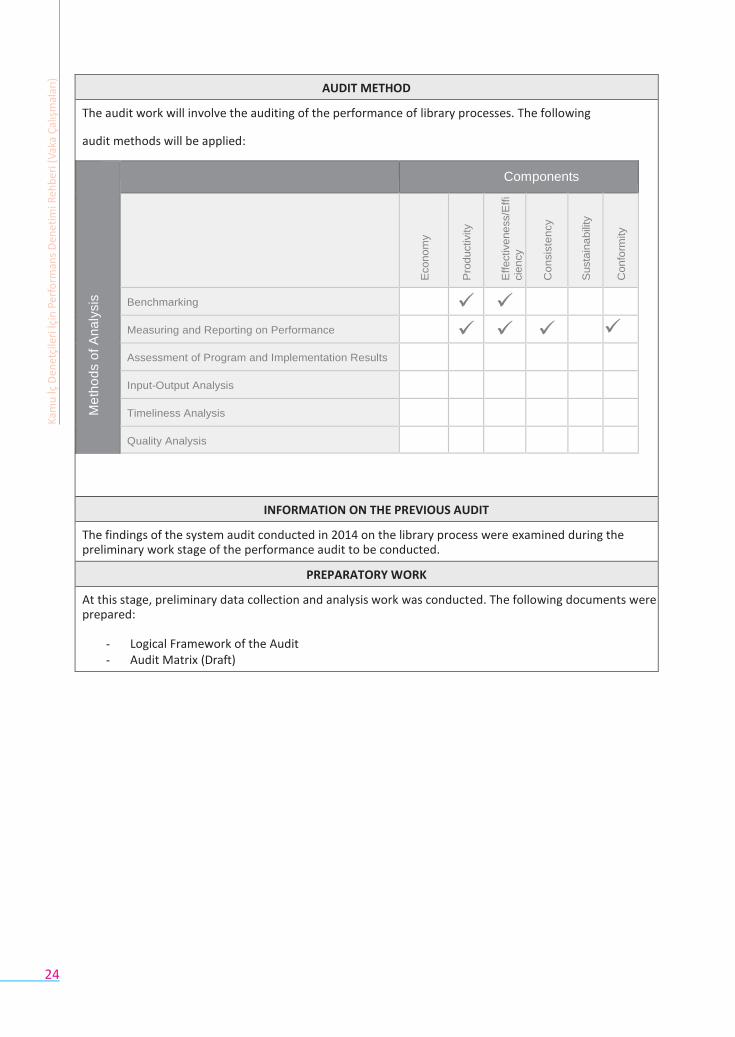
AUDIT METHOD
The audit work will involve the auditing of the performance of library processes. The following
audit methods will be applied:
Me
tho
ds o
f A
na
lysis
Components
Econom
y
Pro
ductivity
E
ffectivene
ss/E
ffi
cie
ncy
C
on
sis
ten
cy
Susta
ina
bili
ty
Confo
rmity
Benchmarking
Measuring and Reporting on Performance
Assessment of Program and Implementation Results
Input-Output Analysis
Timeliness Analysis
Quality Analysis
INFORMATION ON THE PREVIOUS AUDIT
The findings of the system audit conducted in 2014 on the library process were examined during the preliminary work stage of the performance audit to be conducted.
PREPARATORY WORK
At this stage, preliminary data collection and analysis work was conducted. The following documents were prepared:
- Logical Framework of the Audit - Audit Matrix (Draft)
Kam
u İç
Den
etçi
leri
İçin
Per
form
ans
Den
etim
i Reh
ber
i (V
aka
Çal
ışm
alar
ı)
25
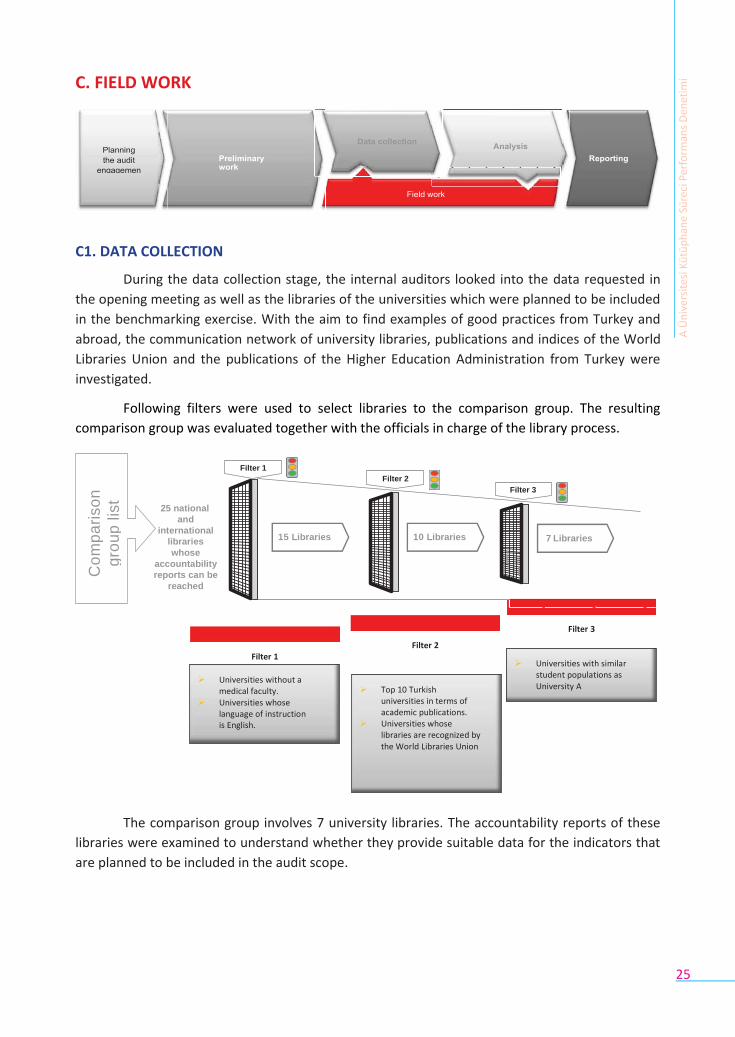
C. FIELD WORK
C1. DATA COLLECTION
During the data collection stage, the internal auditors looked into the data requested in
the opening meeting as well as the libraries of the universities which were planned to be included
in the benchmarking exercise. With the aim to find examples of good practices from Turkey and
abroad, the communication network of university libraries, publications and indices of the World
Libraries Union and the publications of the Higher Education Administration from Turkey were
investigated.
Following filters were used to select libraries to the comparison group. The resulting
comparison group was evaluated together with the officials in charge of the library process.
Filter 1
Filter 2
Filter 3
25 national
and
international
libraries
whose
accountability
reports can be
reached
15 Libraries 10 Libraries 7 Libraries
Filter 1
Filter 2
Filter 3
The comparison group involves 7 university libraries. The accountability reports of these
libraries were examined to understand whether they provide suitable data for the indicators that
are planned to be included in the audit scope.
Universities without a medical faculty. Universities whose language of instruction is English.
Top 10 Turkish universities in terms of academic publications. Universities whose libraries are recognized by the World Libraries Union
Universities with similar student populations as University A
Co
mp
ari
so
n
gro
up
lis
t
A Ü
niv
ers
ites
i Kü
tüp
han
e Sü
reci
Per
form
ans
Den
etim
i
26
Indicators
Data availability
Univ.
B
Univ.
C
Univ.
D
Univ.
E
Univ.
F
Univ.
G
Univ.
H Ratio of library users to the number of students and
academic staff
Ratio of the number of printed materials to the number of students and academic staff
Change in the rates of borrowing printed materials from 2011 to 2015
Ratio of the number of borrowed printed materials to the number of users
Ratio of the budget allocated to purchasing new materials to the overall budget of the library
A A A A A A A
A A A A A A A
A A A A A A A
N/A N/A A A N/A N/A A
N/A A A A N/A N/A A
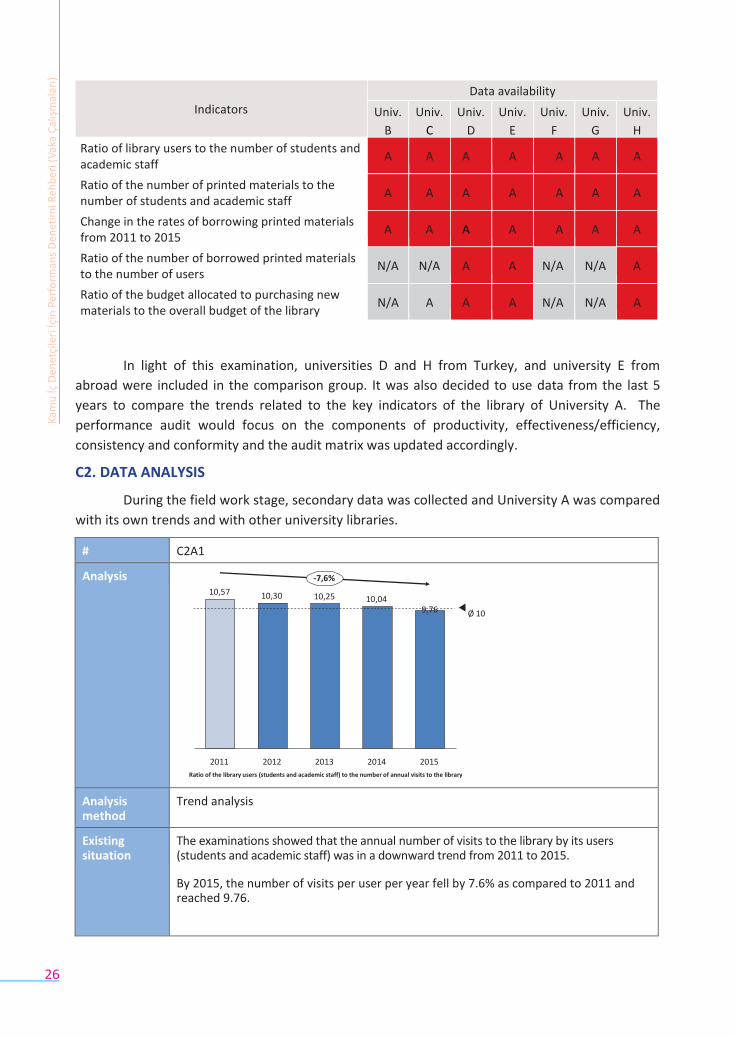
In light of this examination, universities D and H from Turkey, and university E from
abroad were included in the comparison group. It was also decided to use data from the last 5
years to compare the trends related to the key indicators of the library of University A. The
performance audit would focus on the components of productivity, effectiveness/efficiency,
consistency and conformity and the audit matrix was updated accordingly.
C2. DATA ANALYSIS
During the field work stage, secondary data was collected and University A was compared
with its own trends and with other university libraries.
# C2A1
Analysis
-7,6%
10,57 10,30 10,25 10,04
9,76 Ø 10
2011 2012 2013 2014 2015
Ratio of the library users (students and academic staff) to the number of annual visits to the library
Analysis method
Trend analysis
Existing situation
The examinations showed that the annual number of visits to the library by its users (students and academic staff) was in a downward trend from 2011 to 2015.
By 2015, the number of visits per user per year fell by 7.6% as compared to 2011 and reached 9.76.
Kam
u İç
Den
etçi
leri
İçin
Per
form
ans
Den
etim
i Reh
ber
i (V
aka
Çal
ışm
alar
ı)
27
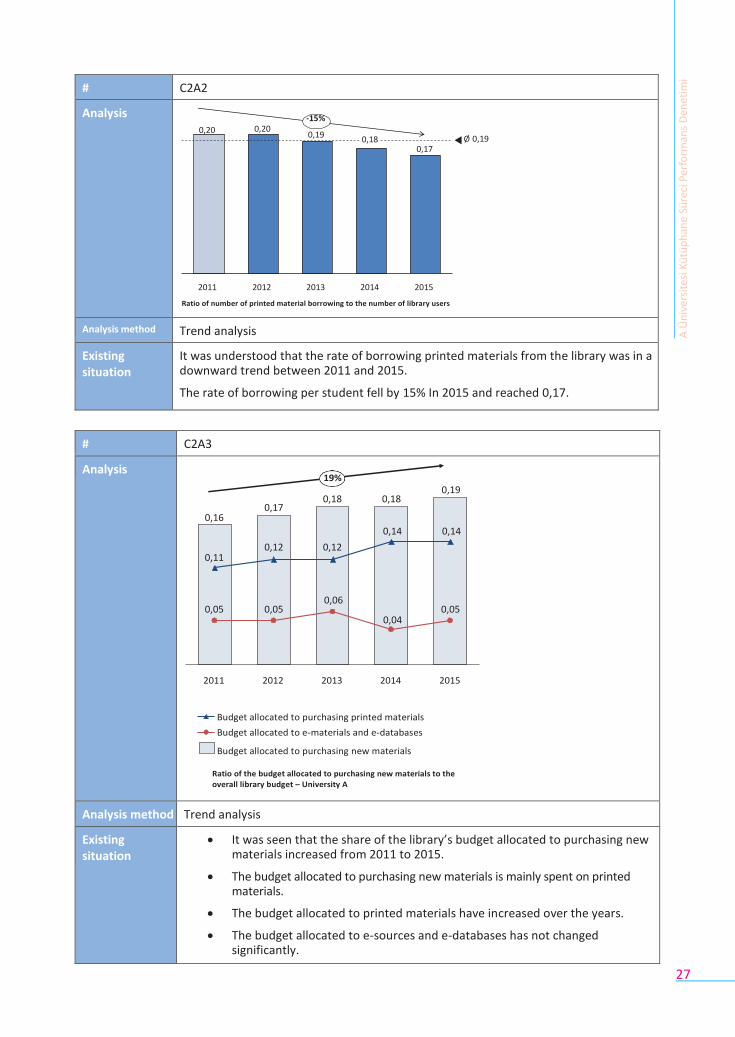
# C2A2
Analysis -15%
0,20 0,20 0,19
0,18 Ø 0,19
0,17
2011 2012 2013 2014 2015
Ratio of number of printed material borrowing to the number of library users
Analysis method Trend analysis
Existing situation
It was understood that the rate of borrowing printed materials from the library was in a downward trend between 2011 and 2015.
The rate of borrowing per student fell by 15% In 2015 and reached 0,17.
# C2A3
Analysis 19%
0,19 0,18 0,18
0,17 0,16
0,14 0,14
0,12 0,12 0,11
0,06 0,05 0,05 0,05
0,04
2011 2012 2013 2014 2015
Budget allocated to purchasing printed materials
Budget allocated to e-materials and e-databases
Budget allocated to purchasing new materials
Ratio of the budget allocated to purchasing new materials to the overall library budget – University A
Analysis method Trend analysis
Existing situation
It was seen that the share of the library’s budget allocated to purchasing new materials increased from 2011 to 2015.
The budget allocated to purchasing new materials is mainly spent on printed materials.
The budget allocated to printed materials have increased over the years.
The budget allocated to e-sources and e-databases has not changed significantly.
A Ü
niv
ers
ites
i Kü
tüp
han
e Sü
reci
Per
form
ans
Den
etim
i
28
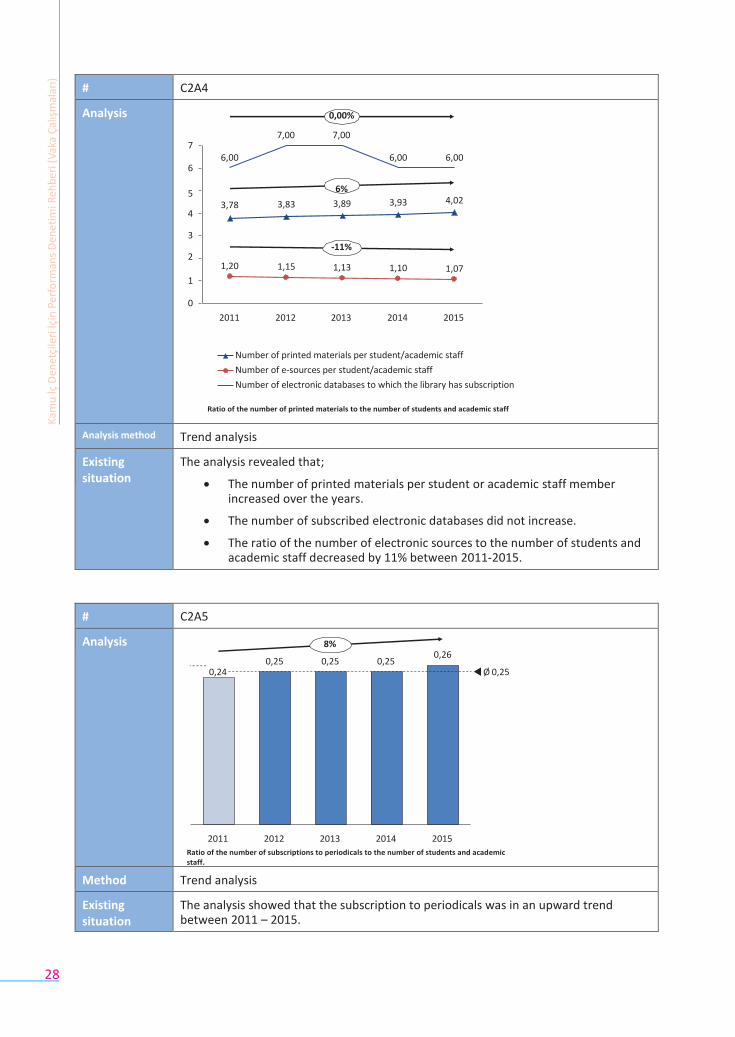
# C2A4
Analysis
0,00%
7,00 7,00 7
6,00 6,00 6,00 6
5 6%
3,78 3,83 3,89 3,93 4,02 4
3 -11%
2 1,20 1,15 1,13 1,10 1,07
1
0
2011 2012 2013 2014 2015
Number of printed materials per student/academic staff
Number of e-sources per student/academic staff
Number of electronic databases to which the library has subscription
Ratio of the number of printed materials to the number of students and academic staff
Analysis method Trend analysis
Existing situation
The analysis revealed that;
The number of printed materials per student or academic staff member increased over the years.
The number of subscribed electronic databases did not increase.
The ratio of the number of electronic sources to the number of students and academic staff decreased by 11% between 2011-2015.
# C2A5
Analysis
8%
0,25 0,25 0,25 0,26
0,24 Ø 0,25
2011 2012 2013 2014 2015
Ratio of the number of subscriptions to periodicals to the number of students and academic staff.
Method Trend analysis
Existing situation
The analysis showed that the subscription to periodicals was in an upward trend between 2011 – 2015.
Kam
u İç
Den
etçi
leri
İçin
Per
form
ans
Den
etim
i Reh
ber
i (V
aka
Çal
ışm
alar
ı)
29
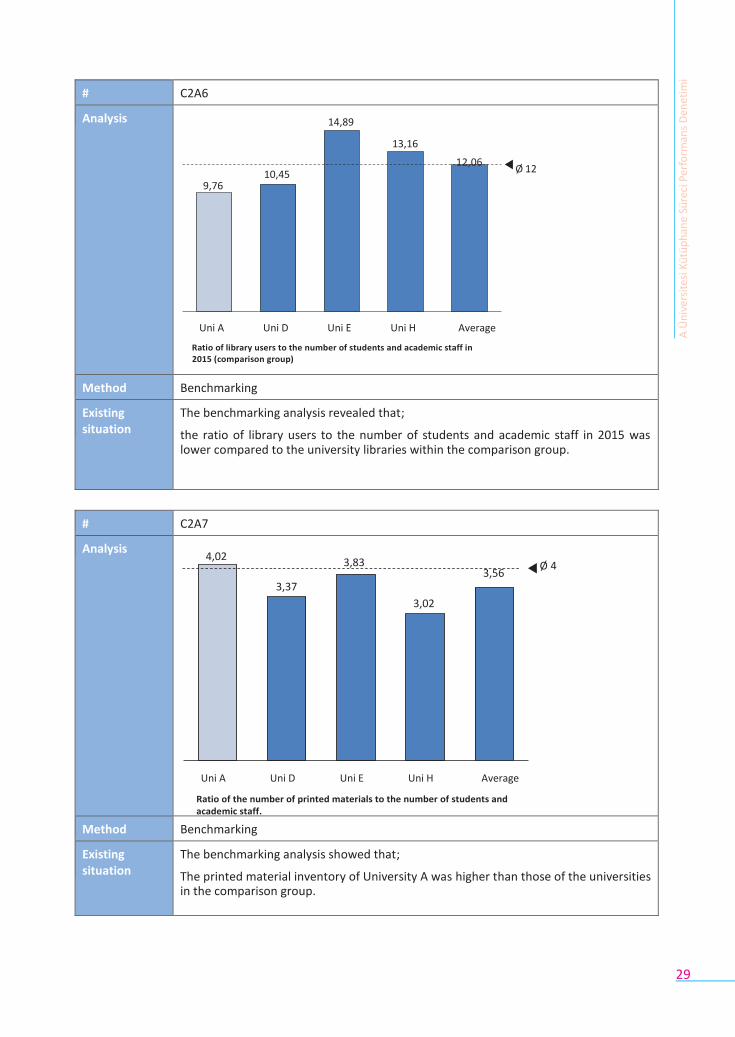
# C2A6
Analysis
14,89
13,16
12,06 Ø 12
10,45
9,76
Uni A Uni D Uni E Uni H Average
Ratio of library users to the number of students and academic staff in 2015 (comparison group)
Method Benchmarking
Existing situation
The benchmarking analysis revealed that;
the ratio of library users to the number of students and academic staff in 2015 was lower compared to the university libraries within the comparison group.
# C2A7
Analysis 4,02
3,83
3,56 Ø 4
3,37
3,02
Uni A Uni D Uni E Uni H Average
Ratio of the number of printed materials to the number of students and academic staff.
Method Benchmarking
Existing situation
The benchmarking analysis showed that;
The printed material inventory of University A was higher than those of the universities in the comparison group.
A Ü
niv
ers
ites
i Kü
tüp
han
e Sü
reci
Per
form
ans
Den
etim
i
37
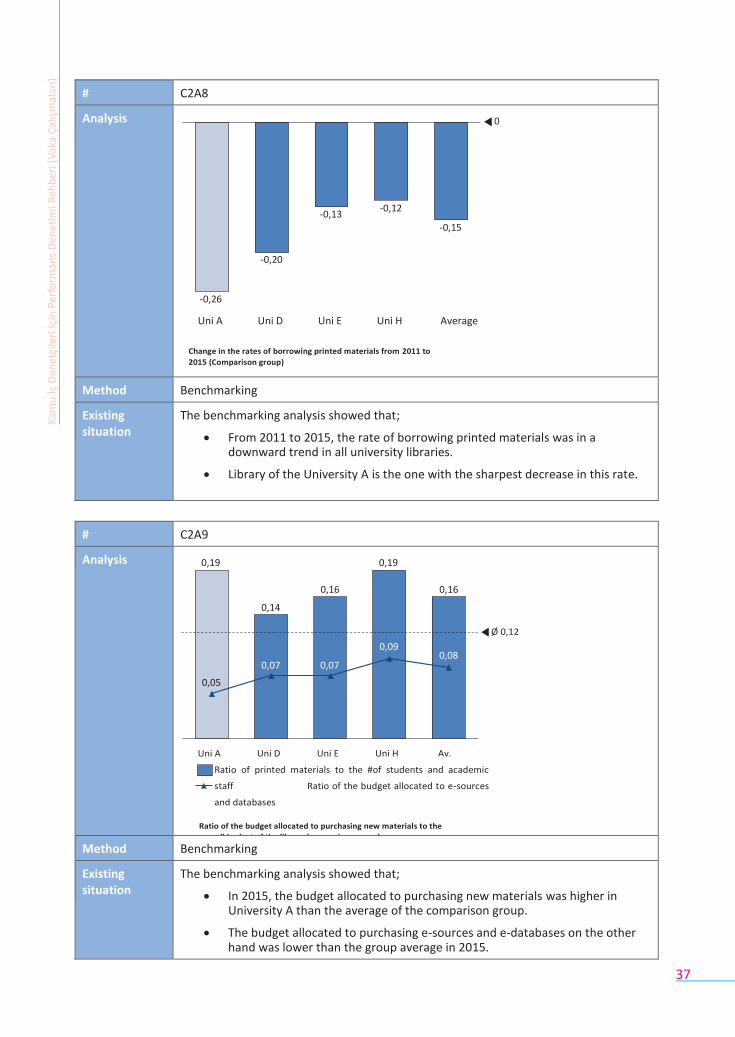
# C2A8
Analysis 0
-0,13 -0,12
-0,15
-0,20
-0,26
Uni A Uni D Uni E Uni H Average
Change in the rates of borrowing printed materials from 2011 to
2015 (Comparison group)
Method Benchmarking
Existing situation
The benchmarking analysis showed that;
From 2011 to 2015, the rate of borrowing printed materials was in a downward trend in all university libraries.
Library of the University A is the one with the sharpest decrease in this rate.
# C2A9
Analysis 0,19 0,19
0,16 0,16
0,14
Ø 0,12
0,09 0,08
0,07 0,07
0,05
Uni A Uni D Uni E Uni H Av.
Ratio of printed materials to the #of students and academic
staff Ratio of the budget allocated to e-sources
and databases
Ratio of the budget allocated to purchasing new materials to the
overall budget of the library (comparison group)
Method Benchmarking
Existing situation
The benchmarking analysis showed that;
In 2015, the budget allocated to purchasing new materials was higher in University A than the average of the comparison group.
The budget allocated to purchasing e-sources and e-databases on the other hand was lower than the group average in 2015.
Kam
u İç
Den
etçi
leri
İçin
Per
form
ans
Den
etim
i Reh
ber
i (V
aka
Çal
ışm
alar
ı)
30
The analysis of the secondary data was followed by an analysis of the primary data related
to the below-mentioned stakeholders. The method of collecting primary data and the stakeholder
groups are stated below.
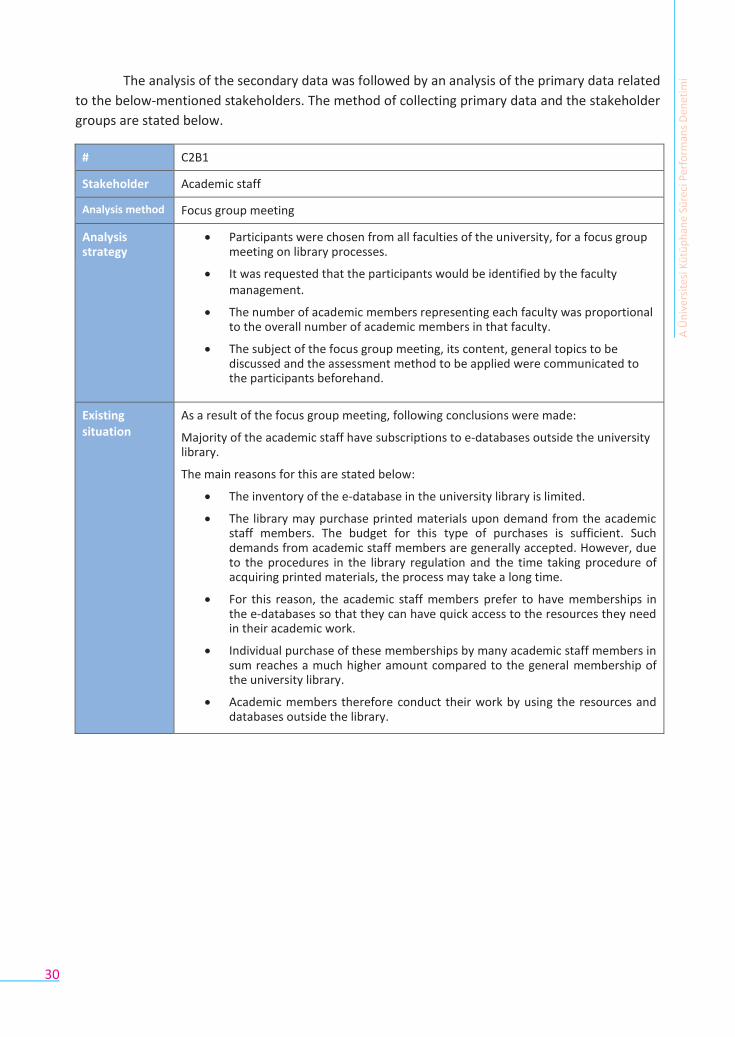
# C2B1
Stakeholder Academic staff
Analysis method Focus group meeting
Analysis strategy
Participants were chosen from all faculties of the university, for a focus group meeting on library processes.
It was requested that the participants would be identified by the faculty management.
The number of academic members representing each faculty was proportional to the overall number of academic members in that faculty.
The subject of the focus group meeting, its content, general topics to be discussed and the assessment method to be applied were communicated to the participants beforehand.
Existing situation
As a result of the focus group meeting, following conclusions were made:
Majority of the academic staff have subscriptions to e-databases outside the university library.
The main reasons for this are stated below:
The inventory of the e-database in the university library is limited.
The library may purchase printed materials upon demand from the academic staff members. The budget for this type of purchases is sufficient. Such demands from academic staff members are generally accepted. However, due to the procedures in the library regulation and the time taking procedure of acquiring printed materials, the process may take a long time.
For this reason, the academic staff members prefer to have memberships in the e-databases so that they can have quick access to the resources they need in their academic work.
Individual purchase of these memberships by many academic staff members in sum reaches a much higher amount compared to the general membership of the university library.
Academic members therefore conduct their work by using the resources and databases outside the library.
A Ü
niv
ers
ites
i Kü
tüp
han
e Sü
reci
Per
form
ans
Den
etim
i
32
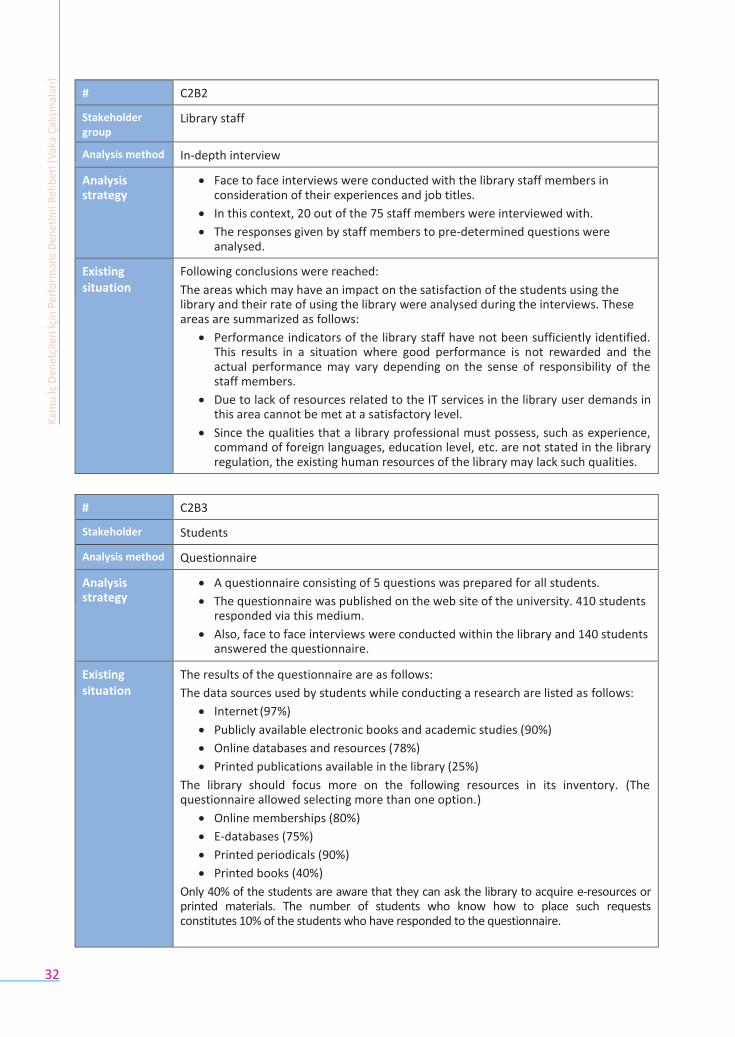
# C2B2
Stakeholder group
Library staff
Analysis method In-depth interview
Analysis strategy
Face to face interviews were conducted with the library staff members in consideration of their experiences and job titles.
In this context, 20 out of the 75 staff members were interviewed with.
The responses given by staff members to pre-determined questions were analysed.
Existing situation
Following conclusions were reached:
The areas which may have an impact on the satisfaction of the students using the library and their rate of using the library were analysed during the interviews. These areas are summarized as follows:
Performance indicators of the library staff have not been sufficiently identified. This results in a situation where good performance is not rewarded and the actual performance may vary depending on the sense of responsibility of the staff members.
Due to lack of resources related to the IT services in the library user demands in this area cannot be met at a satisfactory level.
Since the qualities that a library professional must possess, such as experience, command of foreign languages, education level, etc. are not stated in the library regulation, the existing human resources of the library may lack such qualities.
# C2B3
Stakeholder group
Students
Analysis method Questionnaire
Analysis strategy
A questionnaire consisting of 5 questions was prepared for all students.
The questionnaire was published on the web site of the university. 410 students responded via this medium.
Also, face to face interviews were conducted within the library and 140 students answered the questionnaire.
Existing situation
The results of the questionnaire are as follows:
The data sources used by students while conducting a research are listed as follows:
Internet (97%)
Publicly available electronic books and academic studies (90%)
Online databases and resources (78%)
Printed publications available in the library (25%)
The library should focus more on the following resources in its inventory. (The questionnaire allowed selecting more than one option.)
Online memberships (80%)
E-databases (75%)
Printed periodicals (90%)
Printed books (40%)
Only 40% of the students are aware that they can ask the library to acquire e-resources or printed materials. The number of students who know how to place such requests constitutes 10% of the students who have responded to the questionnaire.
Kam
u İç
Den
etçi
leri
İçin
Per
form
ans
Den
etim
i Reh
ber
i (V
aka
Çal
ışm
alar
ı)
33
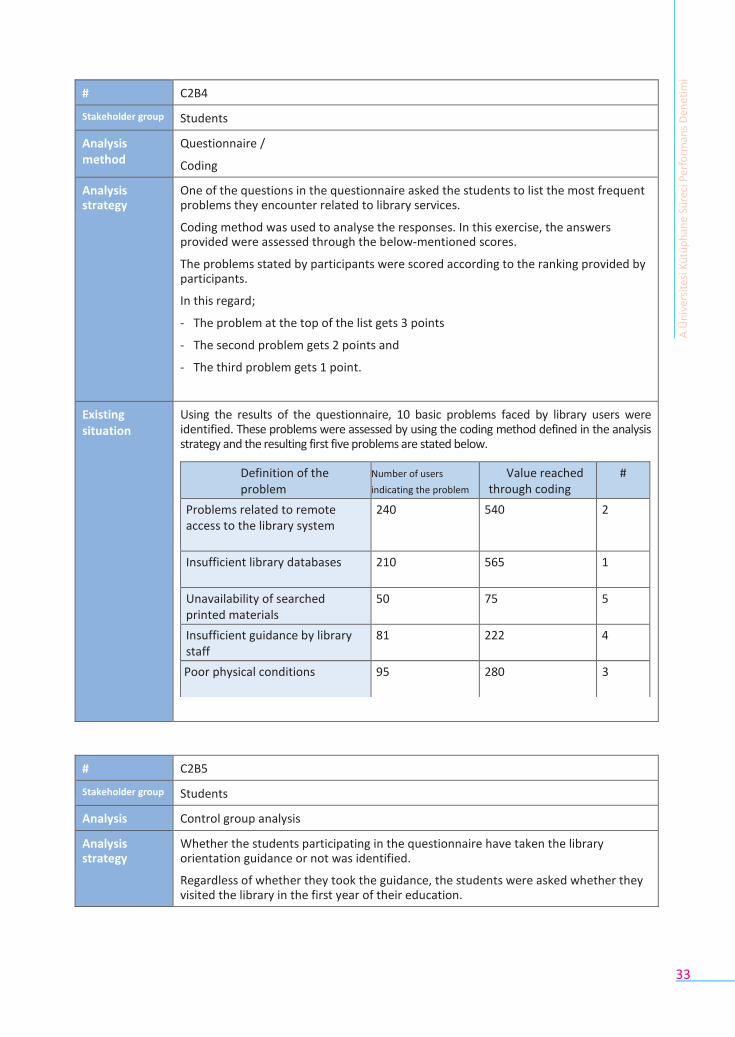
# C2B4
Stakeholder group Students
Analysis method
Questionnaire /
Coding
Analysis strategy
One of the questions in the questionnaire asked the students to list the most frequent problems they encounter related to library services.
Coding method was used to analyse the responses. In this exercise, the answers provided were assessed through the below-mentioned scores.
The problems stated by participants were scored according to the ranking provided by participants.
In this regard;
- The problem at the top of the list gets 3 points
- The second problem gets 2 points and
- The third problem gets 1 point.
Existing situation
Using the results of the questionnaire, 10 basic problems faced by library users were identified. These problems were assessed by using the coding method defined in the analysis strategy and the resulting first five problems are stated below.
# C2B5
Stakeholder group Students
Analysis method
Control group analysis
Analysis strategy
Whether the students participating in the questionnaire have taken the library orientation guidance or not was identified.
Regardless of whether they took the guidance, the students were asked whether they visited the library in the first year of their education.
A Ü
niv
ers
ites
i Kü
tüp
han
e Sü
reci
Per
form
ans
Den
etim
i
Definition of the problem
Number of users
indicating the problem
Value reached through coding
#
Problems related to remote access to the library system
240 540 2
Insufficient library databases 210 565 1
Unavailability of searched printed materials
50 75 5
Insufficient guidance by library staff
81 222 4
Poor physical conditions 95 280 3
34
Ory
an
tasy
on
Eğ
itim
ine
Ka
tıla
n Ö
ğre
nci
leri
n İl
k Y
ıl K
ütü
ph
an
e
Ku
lla
nım
Ora
nla
rı
# C2B6
Stakeholder group Students
Analysis method
Bi-variate analysis
Analysis strategy
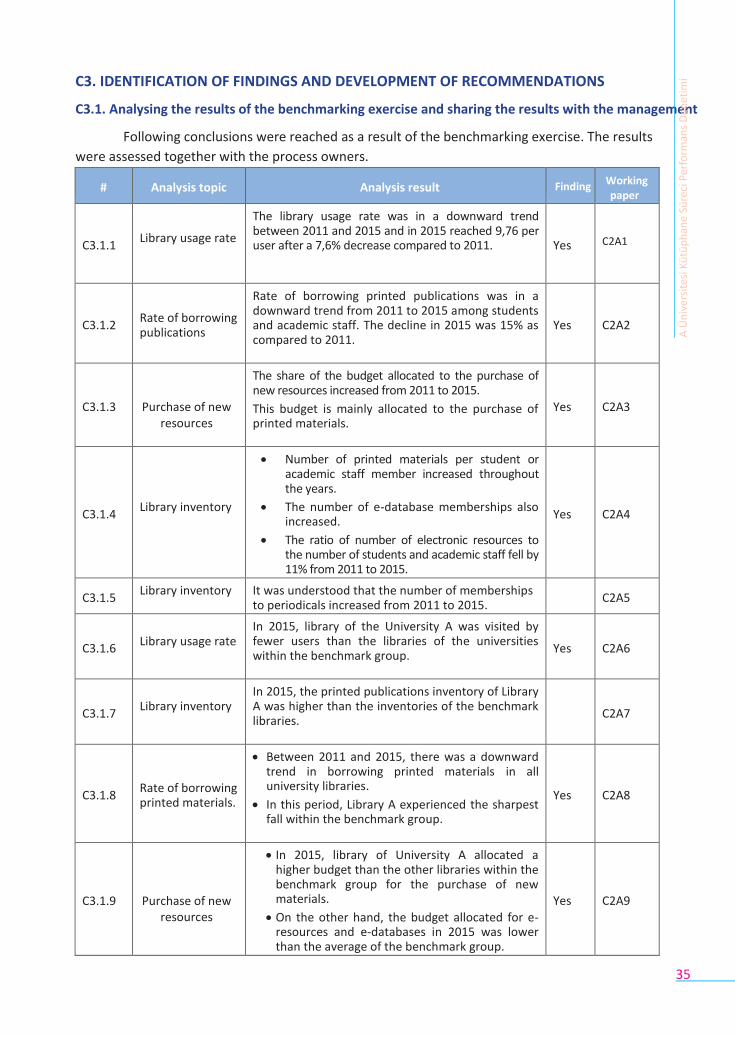
The library usage rate and the ratio of students who have taken the orientation training to the total number of students were compared to analyse the relationship between these variables. The dependent variable was set as the library usage rate (which is found by dividing the total number of visits to the library to the number of students in the university). Number of students who have taken the orientation training was taken from the library data.
Existing situation
Relationship between the orientation training and library usage rate
74%
73%
72%
71%
70%
Library Usage rate
69% Projected library usage rate
68%
67%
66%
54,00% 56,00% 58,00% 60,00% 62,00% 64,00% 66,00%
Ratio of students who have taken the orientation training to the entire student population
The analysis shows that there is high correlation between the library usage rate and the participation to orientation training (the calculations result in a rate of 85%).
Existing situation
2014
Students who have taken the orientation guidance Students who have not taken the orientation guidance
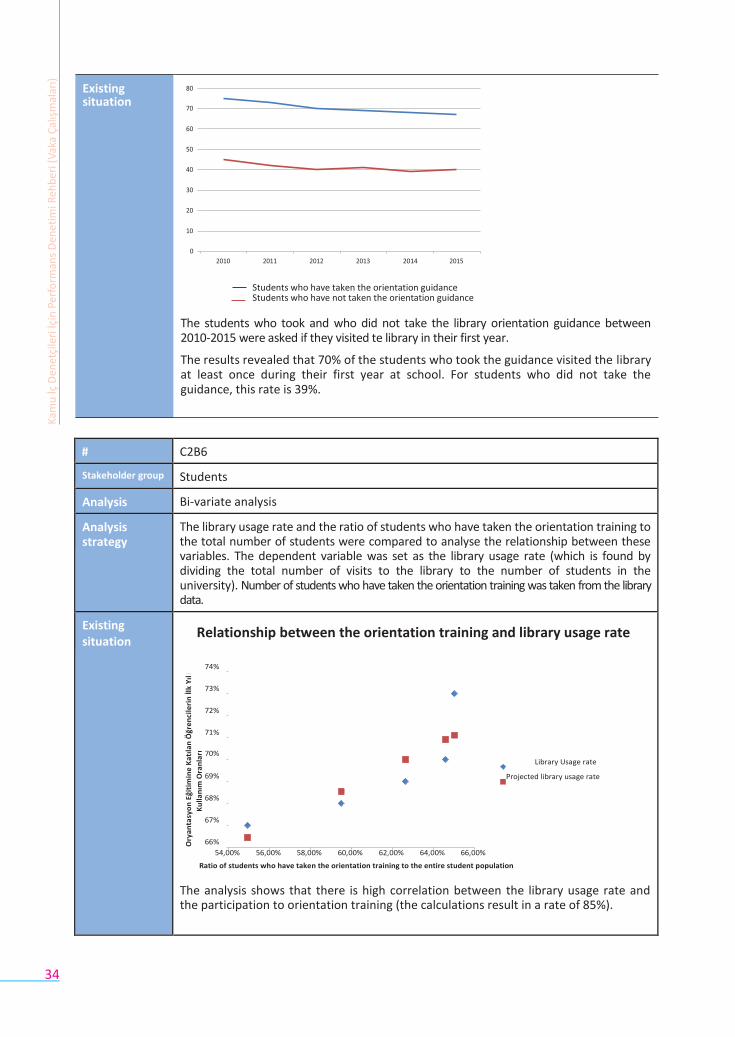
The students who took and who did not take the library orientation guidance between 2010-2015 were asked if they visited te library in their first year.
The results revealed that 70% of the students who took the guidance visited the library at least once during their first year at school. For students who did not take the guidance, this rate is 39%.
Kam
u İç
Den
etçi
leri
İçin
Per
form
ans
Den
etim
i Reh
ber
i (V
aka
Çal
ışm
alar
ı)
35
C3. IDENTIFICATION OF FINDINGS AND DEVELOPMENT OF RECOMMENDATIONS
C3.1. Analysing the results of the benchmarking exercise and sharing the results with the management
Following conclusions were reached as a result of the benchmarking exercise. The results
were assessed together with the process owners.
# Analysis topic Analysis result Finding Working paper
C3.1.1
Library usage rate
The library usage rate was in a downward trend between 2011 and 2015 and in 2015 reached 9,76 per user after a 7,6% decrease compared to 2011.
Yes
C2A1
C3.1.2
Rate of borrowing publications
Rate of borrowing printed publications was in a downward trend from 2011 to 2015 among students and academic staff. The decline in 2015 was 15% as compared to 2011.
Yes
C2A2
C3.1.3
Purchase of new
resources
The share of the budget allocated to the purchase of new resources increased from 2011 to 2015.
This budget is mainly allocated to the purchase of printed materials.
Yes
C2A3
C3.1.4
Library inventory
Number of printed materials per student or academic staff member increased throughout the years.
The number of e-database memberships also increased.
The ratio of number of electronic resources to the number of students and academic staff fell by 11% from 2011 to 2015.
Yes
C2A4
C3.1.5 Library inventory It was understood that the number of memberships
to periodicals increased from 2011 to 2015.
C2A5
C3.1.6
Library usage rate
In 2015, library of the University A was visited by fewer users than the libraries of the universities within the benchmark group.
Yes
C2A6
C3.1.7
Library inventory
In 2015, the printed publications inventory of Library A was higher than the inventories of the benchmark libraries.
C2A7
C3.1.8
Rate of borrowing printed materials.
Between 2011 and 2015, there was a downward trend in borrowing printed materials in all university libraries.
In this period, Library A experienced the sharpest fall within the benchmark group.
Yes
C2A8
C3.1.9
Purchase of new
resources
In 2015, library of University A allocated a higher budget than the other libraries within the benchmark group for the purchase of new materials.
On the other hand, the budget allocated for e-resources and e-databases in 2015 was lower than the average of the benchmark group.
Yes
C2A9
A Ü
niv
ers
ites
i Kü
tüp
han
e Sü
reci
Per
form
ans
Den
etim
i
36
# Analysis topic Analysis result Finding Working paper
C3.1.10
Focus group meeting (Academic members)
- Library usage rate
- Library inventory
- Purchase of new resources
It has been understood that a major part of the academic members have subscriptions to e-databases outside the university library.
According to the academic members, the main reasons for this are as follows:
The inventory of the e-database of the university is limited.
The library has sufficient financial means to purchase printed materials upon the demand of the academic members. Such demands are met positively most of the time. However, due to the procedures provided in the regulation of the library and the time taking nature of the acquisition of new books, this process may take a long time.
For this reason, the academic members prefer to subscribe to e-databases which provide the fastest access to the materials they need in conducting their researches.
When the money spent by individual academic members for such subscriptions are put together, the overall sum is much greater than the amount that would be spent by the library for collective memberships.
For the above reasons, the academic members are conducting their academic studies over the databases and resources outside the university library.
Yes
C2B1
C3.1.11
In depth interviews
(Library staff)
- User satisfaction
- Operations
As a result of the interviews, the areas that might affect the satisfaction and library usage rate of students have been identified as follows:
Performance indicators of the library staff have not been sufficiently identified. This results in a situation where good performance is not rewarded and the actual performance may vary depending on the sense of responsibility of the staff members.
Due to lack of resources related to the IT services in the library user demands in this area cannot be met at a satisfactory level.
Since the qualities that a library professional must possess, such as experience, command of foreign languages, education level, etc. are not stated in the library regulation, the existing human resources of the library may lack such qualities.
Yes
C2B2
Kam
u İç
Den
etçi
leri
İçin
Per
form
ans
Den
etim
i Reh
ber
i (V
aka
Çal
ışm
alar
ı)
37
# Analysis topic Analysis result Finding Working paper
C3.1.12
Questionnaire
(Students)
- User satisfaction
- Operations
The data sources used by students while conducting a research are listed as follows:
Internet (97%)
Publicly available electronic books and academic studies (90%)
Online databases and resources (78%)
Printed publications available in the library (25%)
The library should focus more on the following resources in its inventory. (The questionnaire allowed selecting more than one option.)
Online memberships (80%)
E-databases (75%)
Printed periodicals (90%)
Printed books (40%)
Only 40% of the students are aware that they can ask the library to acquire e-resources or printed materials. The number of students who know how to place such requests constitutes 10% of the students who have responded to the questionnaire.
For students, the most common shortcomings related to the library services are as follows:
Problems related to remote access to the library system (%88)
Insufficient library databases (%65)
Unavailability of searched printed materials (%20)
Insufficient guidance by library staff (%30)
Poor physical conditions (%30)
Yes
C2B3, C2B4
C3.2. Analysis of the findings, risks and root causes that have emerged as a result of the benchmarking exercise
Several findings have been identified as a result of the analysis. These findings are
grouped under different headings. A fishbone diagram has been used to analyse the causes of the
identified finding.
The analyses and interviews revealed that the proportion of the budget allocated by the
university for library activities within the overall budget increased from 2011 to 2015. In terms of its
inventory and the budget allocated for acquiring new resources, the library is among the top
university libraries both at national and international levels.
A Ü
niv
ers
ites
i Kü
tüp
han
e Sü
reci
Per
form
ans
Den
etim
i
38
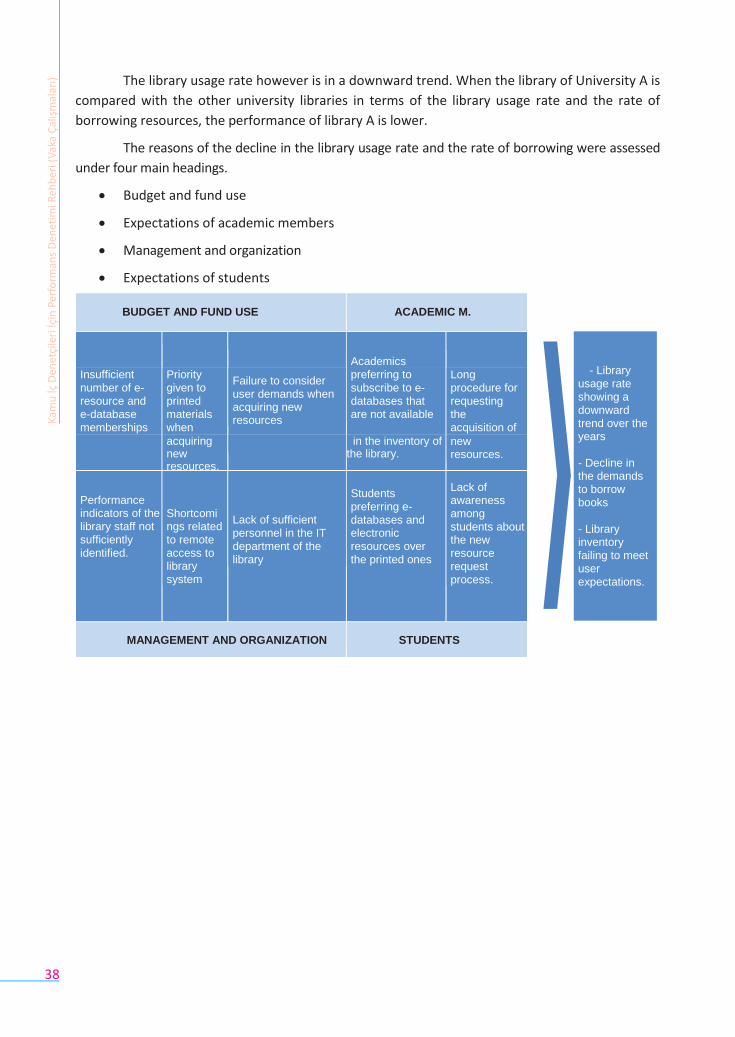
The library usage rate however is in a downward trend. When the library of University A is
compared with the other university libraries in terms of the library usage rate and the rate of
borrowing resources, the performance of library A is lower.
The reasons of the decline in the library usage rate and the rate of borrowing were assessed
under four main headings.
Budget and fund use
Expectations of academic members
Management and organization
Expectations of students
BUDGET AND FUND USE
ACADEMIC M.
Academics
Insufficient number of e-resource and e-database memberships
Priority given to printed materials when
Failure to consider user demands when acquiring new resources
preferring to subscribe to e-databases that are not available
Long procedure for requesting the acquisition of
acquiring new resources.
in the inventory of the library.
new resources.
Performance indicators of the library staff not sufficiently identified.
Shortcomings related to remote access to library system
Lack of sufficient personnel in the IT department of the library
Students preferring e-databases and electronic resources over the printed ones
Lack of awareness among students about the new resource request process.
MANAGEMENT AND ORGANIZATION
STUDENTS
- Library
usage rate showing a downward trend over the years
- Decline in the demands to borrow books
- Library inventory failing to meet user expectations.
Kam
u İç
Den
etçi
leri
İçin
Per
form
ans
Den
etim
i Reh
ber
i (V
aka
Çal
ışm
alar
ı)
39
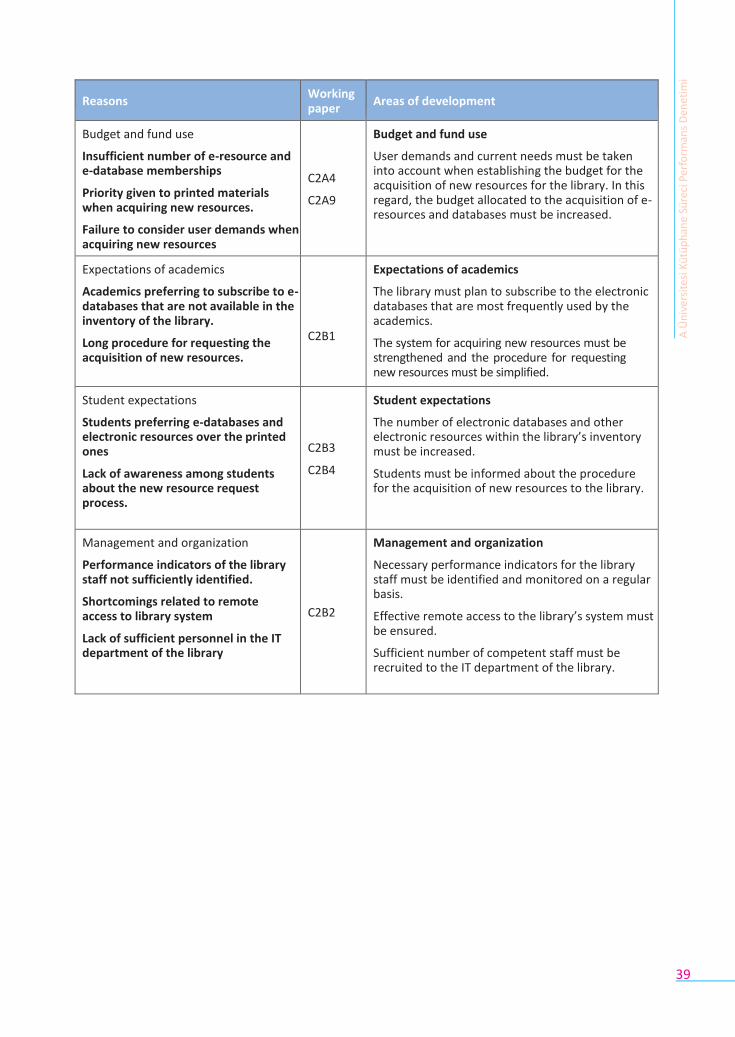
Reasons Working paper
Areas of development
Budget and fund use
Insufficient number of e-resource and e-database memberships
Priority given to printed materials when acquiring new resources.
Failure to consider user demands when acquiring new resources
C2A4
C2A9
Budget and fund use
User demands and current needs must be taken into account when establishing the budget for the acquisition of new resources for the library. In this regard, the budget allocated to the acquisition of e-resources and databases must be increased.
Expectations of academics
Academics preferring to subscribe to e-databases that are not available in the inventory of the library.
Long procedure for requesting the acquisition of new resources.
C2B1
Expectations of academics
The library must plan to subscribe to the electronic databases that are most frequently used by the academics.
The system for acquiring new resources must be strengthened and the procedure for requesting new resources must be simplified.
Student expectations
Students preferring e-databases and electronic resources over the printed ones
Lack of awareness among students about the new resource request process.
C2B3
C2B4
Student expectations
The number of electronic databases and other electronic resources within the library’s inventory must be increased.
Students must be informed about the procedure for the acquisition of new resources to the library.
Management and organization
Performance indicators of the library staff not sufficiently identified.
Shortcomings related to remote access to library system
Lack of sufficient personnel in the IT department of the library
C2B2
Management and organization
Necessary performance indicators for the library staff must be identified and monitored on a regular basis.
Effective remote access to the library’s system must be ensured.
Sufficient number of competent staff must be recruited to the IT department of the library.
A Ü
niv
ers
ites
i Kü
tüp
han
e Sü
reci
Per
form
ans
Den
etim
i
43
Kıy
asla
ma
Gru
bu
Lis
tesi
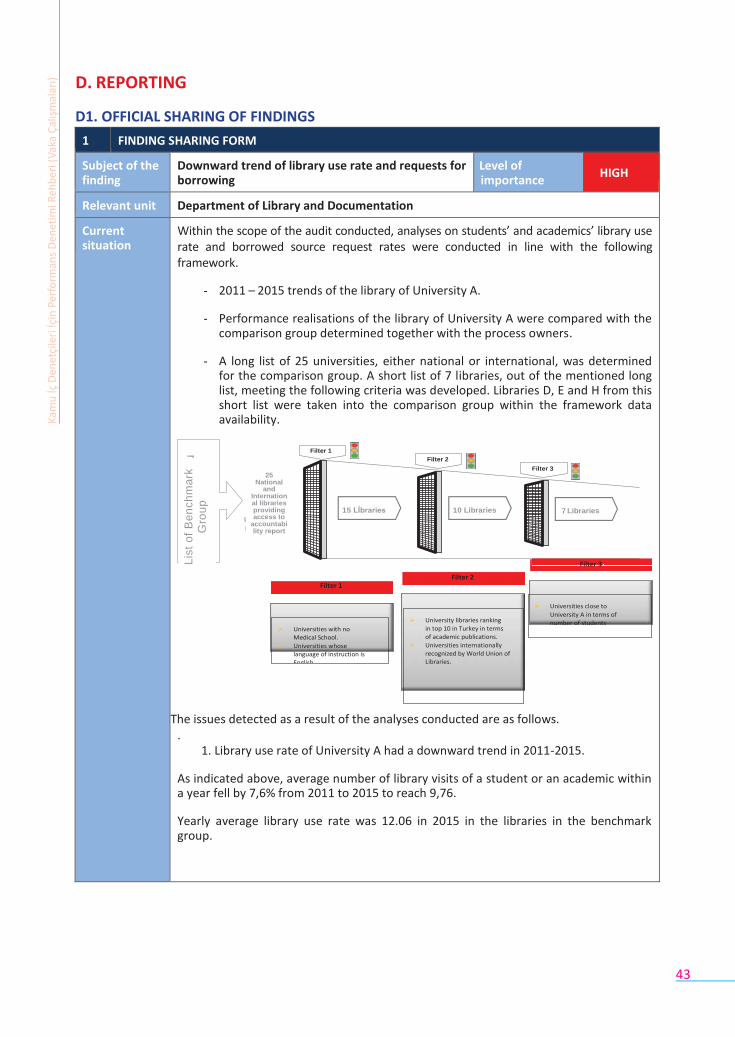
D. REPORTING
D1. OFFICIAL SHARING OF FINDINGS
1 FINDING SHARING FORM
Subject of the finding
Downward trend of library use rate and requests for borrowing
publications by years
Level of importance
HIGH
Relevant unit Department of Library and Documentation
Current situation
Within the scope of the audit conducted, analyses on students’ and academics’ library use rate and borrowed source request rates were conducted in line with the following framework.
- 2011 – 2015 trends of the library of University A.
- Performance realisations of the library of University A were compared with the comparison group determined together with the process owners.
- A long list of 25 universities, either national or international, was determined for the comparison group. A short list of 7 libraries, out of the mentioned long list, meeting the following criteria was developed. Libraries D, E and H from this short list were taken into the comparison group within the framework data availability.
Filter 1
Filter 2
Filter 3
Faaliyet
Raporuna
Ulaşılan 25
Ulusal ve 15 Lİbraries 10 Libraries 7 Libraries
Uluslararası
Küt üphane
Filter 3
Filter 2 Filter 1
The issues detected as a result of the analyses conducted are as follows. .
1. Library use rate of University A had a downward trend in 2011-2015.
As indicated above, average number of library visits of a student or an academic within a year fell by 7,6% from 2011 to 2015 to reach 9,76.
Yearly average library use rate was 12.06 in 2015 in the libraries in the benchmark group.
Kam
u İç
Den
etçi
leri
İçin
Per
form
ans
Den
etim
i Reh
ber
i (V
aka
Çal
ışm
alar
ı)
Lis
t o
f B
en
ch
ma
rk
Gro
up
25 National
and International libraries providing access to
accountability report
Universities with no Medical School.
Universities whose language of instruction is English.
University libraries ranking in top 10 in Turkey in terms of academic publications.
Universities internationally recognized by World Union of Libraries.
Universities close to
University A in terms of number of students
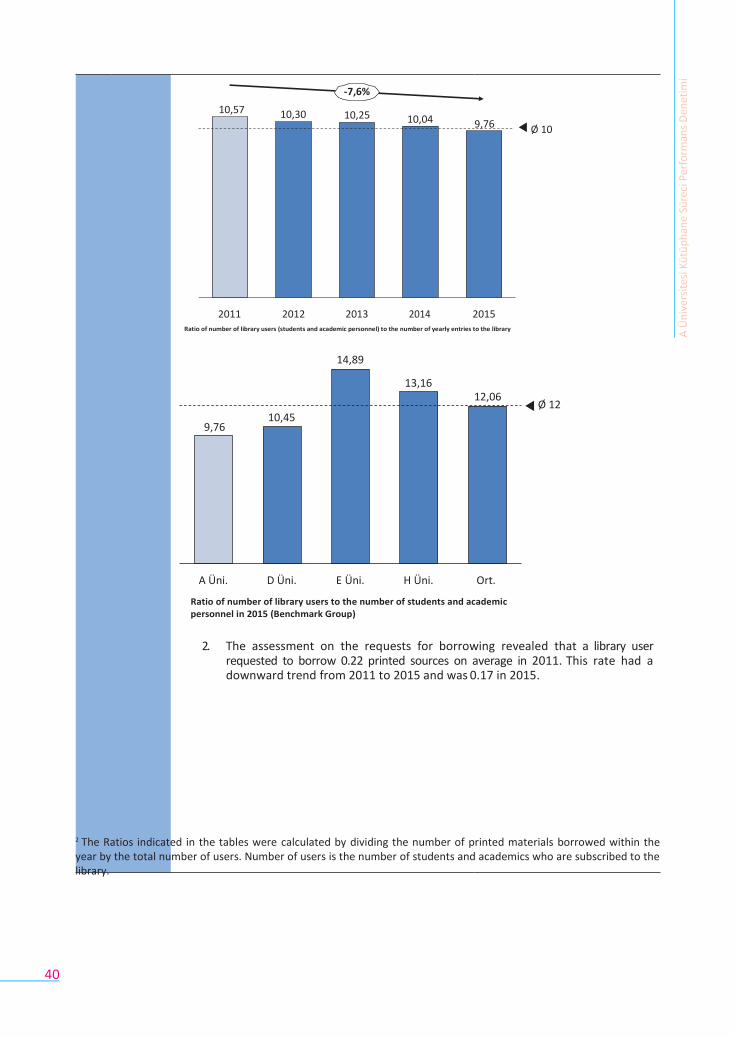
40
10,57
10,30
-7,6%
10,25
10,04
9,76
Ø 10
2011 2012 2013 2014 2015
Ratio of number of library users (students and academic personnel) to the number of yearly entries to the library
9,76
10,45
14,89
13,16
12,06
Ø 12
A Üni. D Üni. E Üni. H Üni. Ort.
Ratio of number of library users to the number of students and academic personnel in 2015 (Benchmark Group)
2. The assessment on the requests for borrowing revealed that a library user requested to borrow 0.22 printed sources on average in 2011. This rate had a downward trend from 2011 to 2015 and was 0.17 in 2015.
2 The Ratios indicated in the tables were calculated by dividing the number of printed materials borrowed within the year by the total number of users. Number of users is the number of students and academics who are subscribed to the library.
A Ü
niv
ers
ites
i Kü
tüp
han
e Sü
reci
Per
form
ans
Den
etim
i
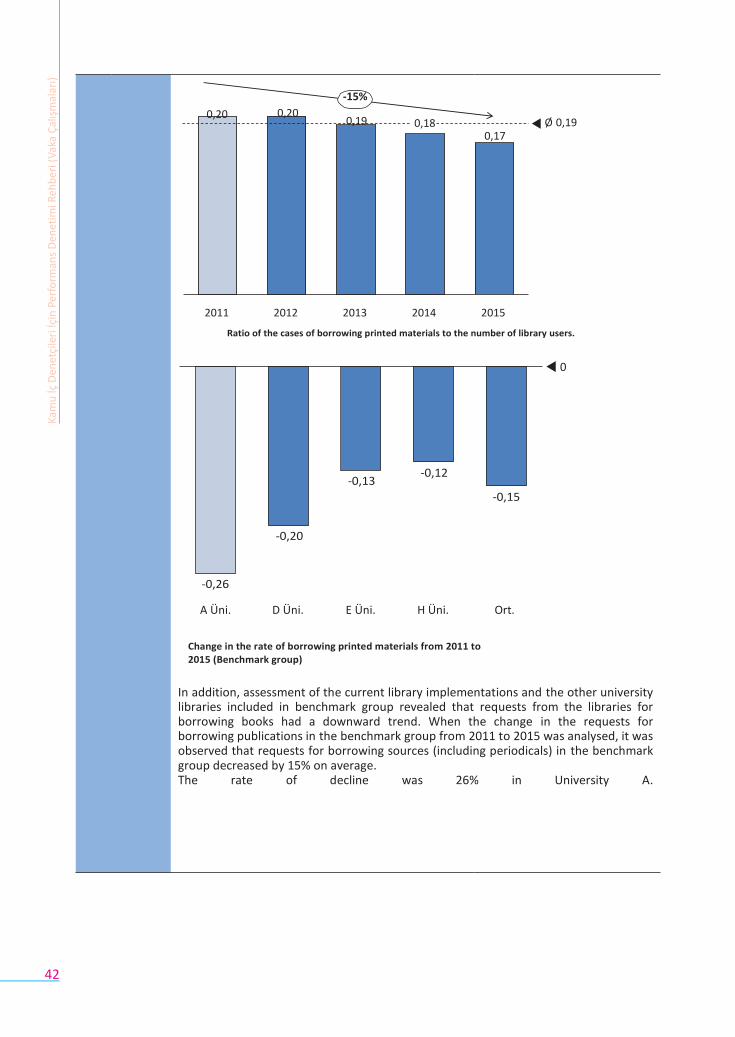
42
-15%
0,20 0,20 0,19
0,18 Ø 0,19 0,17
2011 2012 2013 2014 2015
Ratio of the cases of borrowing printed materials to the number of library users.
0
-0,13 -0,12
-0,15
-0,20
-0,26
A Üni. D Üni. E Üni. H Üni. Ort.
Change in the rate of borrowing printed materials from 2011 to 2015 (Benchmark group)
In addition, assessment of the current library implementations and the other university libraries included in benchmark group revealed that requests from the libraries for borrowing books had a downward trend. When the change in the requests for borrowing publications in the benchmark group from 2011 to 2015 was analysed, it was observed that requests for borrowing sources (including periodicals) in the benchmark group decreased by 15% on average. The rate of decline was 26% in University A.
Kam
u İç
Den
etçi
leri
İçin
Per
form
ans
Den
etim
i Reh
ber
i (V
aka
Çal
ışm
alar
ı)
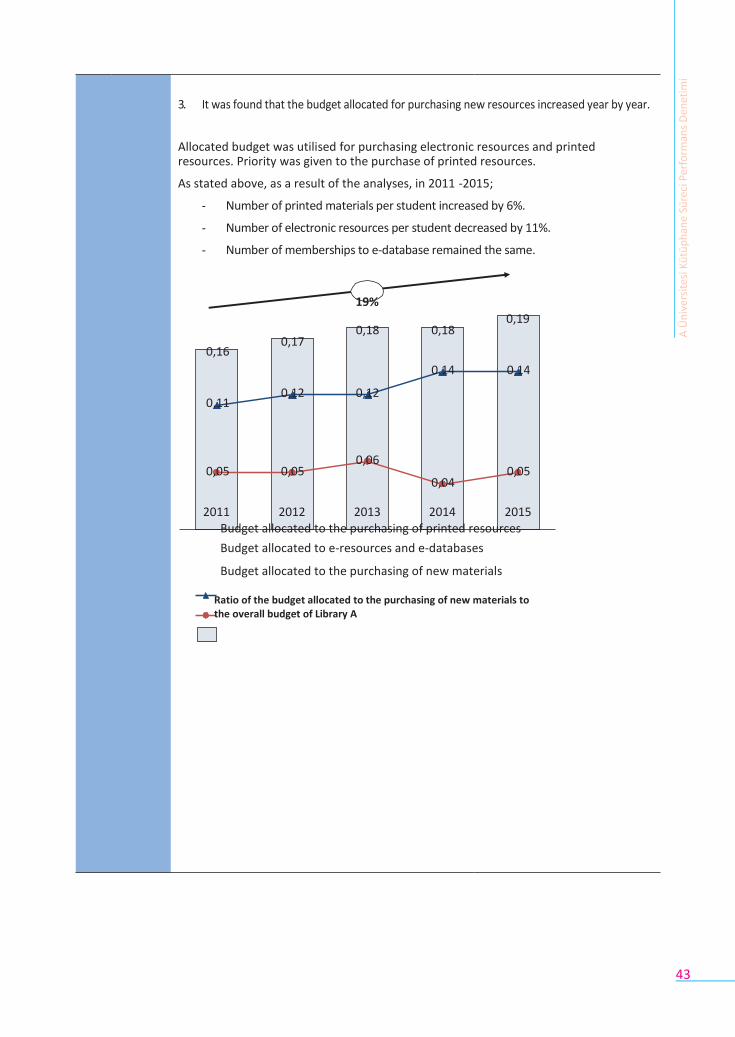
43
3. It was found that the budget allocated for purchasing new resources increased year by year.
Allocated budget was utilised for purchasing electronic resources and printed resources. Priority was given to the purchase of printed resources.
As stated above, as a result of the analyses, in 2011 -2015;
- Number of printed materials per student increased by 6%.
- Number of electronic resources per student decreased by 11%.
- Number of memberships to e-database remained the same.
0,16
0,11
0,17
0,12
19%
0,18
0,12
0,18
0,14
0,19
0,14
0,05
0,05 0,06
0,04
0,05
2011
2012
2013
2014 2015Budget allocated to the purchasing of printed resources
Budget allocated to e-resources and e-databases
Budget allocated to the purchasing of new materials
Ratio of the budget allocated to the purchasing of new materials to the overall budget of Library A
A Ü
niv
ers
ites
i Kü
tüp
han
e Sü
reci
Per
form
ans
Den
etim
i
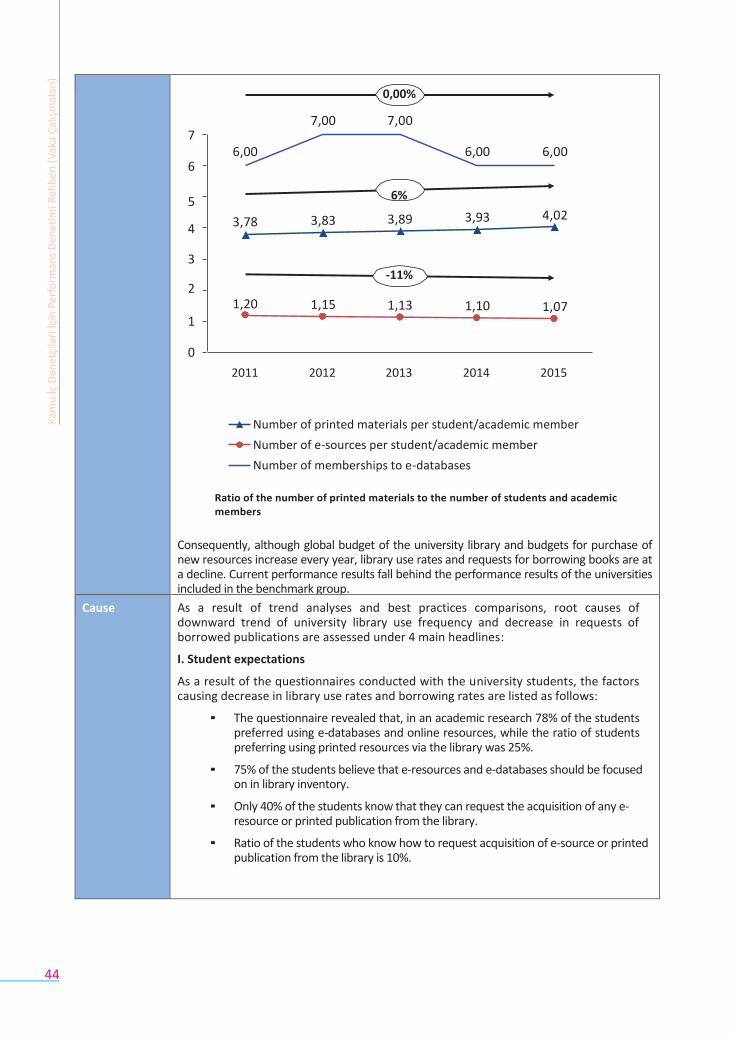
44
0,00%
7,00 7,00 7
6,00 6,00 6,00 6
5 6%
3,78 3,83 3,89 3,93 4,02 4
3 -11%
2 1,20 1,15 1,13 1,10 1,07
1
0
2011 2012 2013 2014 2015
Number of printed materials per student/academic member
Number of e-sources per student/academic member
Number of memberships to e-databases
Ratio of the number of printed materials to the number of students and academic members
Consequently, although global budget of the university library and budgets for purchase of new resources increase every year, library use rates and requests for borrowing books are at a decline. Current performance results fall behind the performance results of the universities included in the benchmark group.
Cause As a result of trend analyses and best practices comparisons, root causes of downward trend of university library use frequency and decrease in requests of borrowed publications are assessed under 4 main headlines:
I. Student expectations
As a result of the questionnaires conducted with the university students, the factors causing decrease in library use rates and borrowing rates are listed as follows:
▪ The questionnaire revealed that, in an academic research 78% of the students preferred using e-databases and online resources, while the ratio of students preferring using printed resources via the library was 25%.
▪ 75% of the students believe that e-resources and e-databases should be focused on in library inventory.
▪ Only 40% of the students know that they can request the acquisition of any e-resource or printed publication from the library.
▪ Ratio of the students who know how to request acquisition of e-source or printed publication from the library is 10%.
Kam
u İç
Den
etçi
leri
İçin
Per
form
ans
Den
etim
i Reh
ber
i (V
aka
Çal
ışm
alar
ı)
45
Cause II. Expectations of the academics
As a result of the focus group meetings held with the academics selected by the faculty management, in line with the academic personnel breakdown of the faculties, from among the academics conducting studies in the faculties, the factors causing a decrease in use of library and borrowing were listed as follows:
▪ It was understood that most of the academics had individual memberships to the e-databases other than the university library due to limited e-database inventory of the university and book provision process taking too long following their request for a printed source.
▪ This results in decrease of university library use by academics.
III. Management and organization
In the in-depth interviews made with library personnel, the fields which may affect the satisfaction of the students, who are users of the library, and library use rates were summarized as below.
▪ Performance indicators of the library personnel were not adequately defined. This results in changes in performance depending on the employees’ devotion and responsibility.
▪ Insufficient resources of the library informatics services result in an inability to adequately meet the requests of the users in terms of information systems.
▪ Lack of remote access to the library system makes it harder for the students to scan available source inventory of the library.
▪ It was found out that library human resources are inadequate since the library by-law did not set out the criteria sought in library personnel such as experience, foreign language knowledge and education level.
IV. Budget and fund use
▪ The examinations revealed that budget allocated to purchase of new sources for the library increased by 19 % from 2011 to 2015. Priority was given to the purchase of printed publications. Budget allocated to e-source and e-database did not change over years.
▪ Budget utilisation may not be consistent with the expectations of the users due to absence of systematic infrastructure and awareness required for receiving the expectations of the students and academics regarding purchase of new sources.
Risks and impacts
In its 2016 – 2020 strategic plan, University A targeted increasing its recognition level and being placed among top 100 universities which are followed, both nationally and internationally, for academic publications.
Failure to diversify the university inventory in line with the improving student requests and decrease in library use may result in a decrease in academic publications of the university and inability to increase the recognition of the university in national and international arena. This may prevent the university from achieving its relevant strategic objectives.
A Ü
niv
ers
ites
i Kü
tüp
han
e Sü
reci
Per
form
ans
Den
etim
i
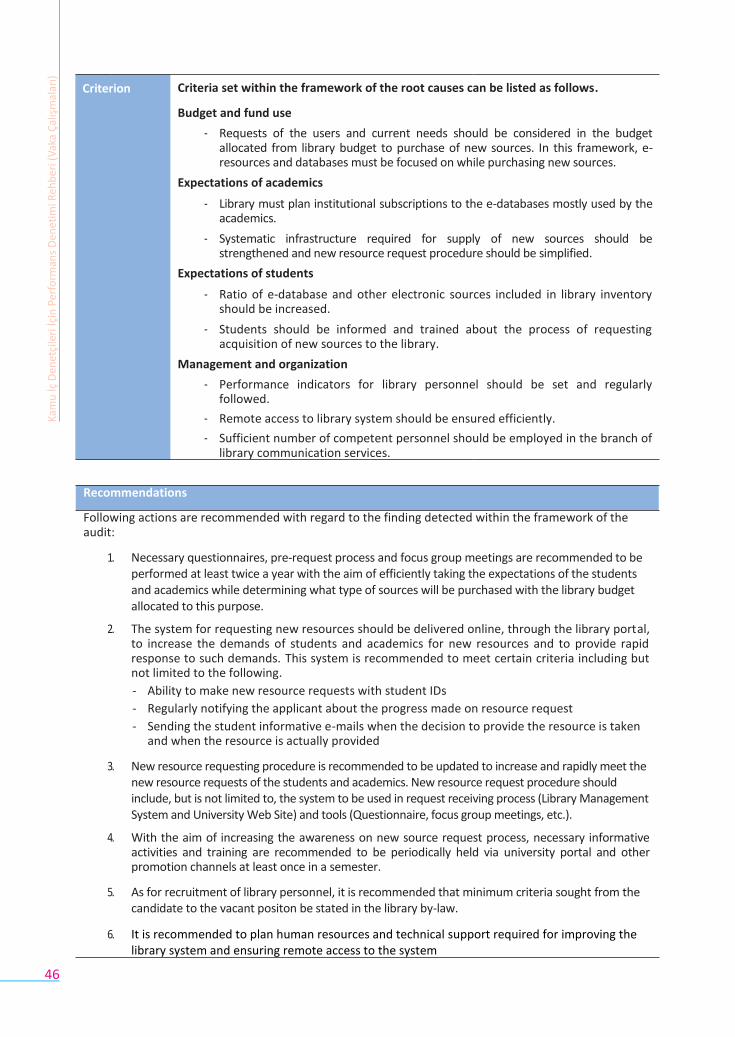
46
Recommendations
Following actions are recommended with regard to the finding detected within the framework of the audit:
1. Necessary questionnaires, pre-request process and focus group meetings are recommended to be performed at least twice a year with the aim of efficiently taking the expectations of the students and academics while determining what type of sources will be purchased with the library budget allocated to this purpose.
2. The system for requesting new resources should be delivered online, through the library portal, to increase the demands of students and academics for new resources and to provide rapid response to such demands. This system is recommended to meet certain criteria including but not limited to the following. - Ability to make new resource requests with student IDs
- Regularly notifying the applicant about the progress made on resource request
- Sending the student informative e-mails when the decision to provide the resource is taken and when the resource is actually provided
3. New resource requesting procedure is recommended to be updated to increase and rapidly meet the new resource requests of the students and academics. New resource request procedure should include, but is not limited to, the system to be used in request receiving process (Library Management System and University Web Site) and tools (Questionnaire, focus group meetings, etc.).
4. With the aim of increasing the awareness on new source request process, necessary informative activities and training are recommended to be periodically held via university portal and other promotion channels at least once in a semester.
5. As for recruitment of library personnel, it is recommended that minimum criteria sought from the candidate to the vacant positon be stated in the library by-law.
6. It is recommended to plan human resources and technical support required for improving the library system and ensuring remote access to the system
Criterion Criteria set within the framework of the root causes can be listed as follows.
Budget and fund use
Requests of the users and current needs should be considered in the budget allocated from library budget to purchase of new sources. In this framework, e-resources and databases must be focused on while purchasing new sources.
Expectations of academics
Library must plan institutional subscriptions to the e-databases mostly used by the academics.
Systematic infrastructure required for supply of new sources should be strengthened and new resource request procedure should be simplified.
Expectations of students
Ratio of e-database and other electronic sources included in library inventory should be increased.
Students should be informed and trained about the process of requesting acquisition of new sources to the library.
Management and organization
Performance indicators for library personnel should be set and regularly followed.
Remote access to library system should be ensured efficiently.
Sufficient number of competent personnel should be employed in the branch of library communication services.
Kam
u İç
Den
etçi
leri
İçin
Per
form
ans
Den
etim
i Reh
ber
i (V
aka
Çal
ışm
alar
ı)
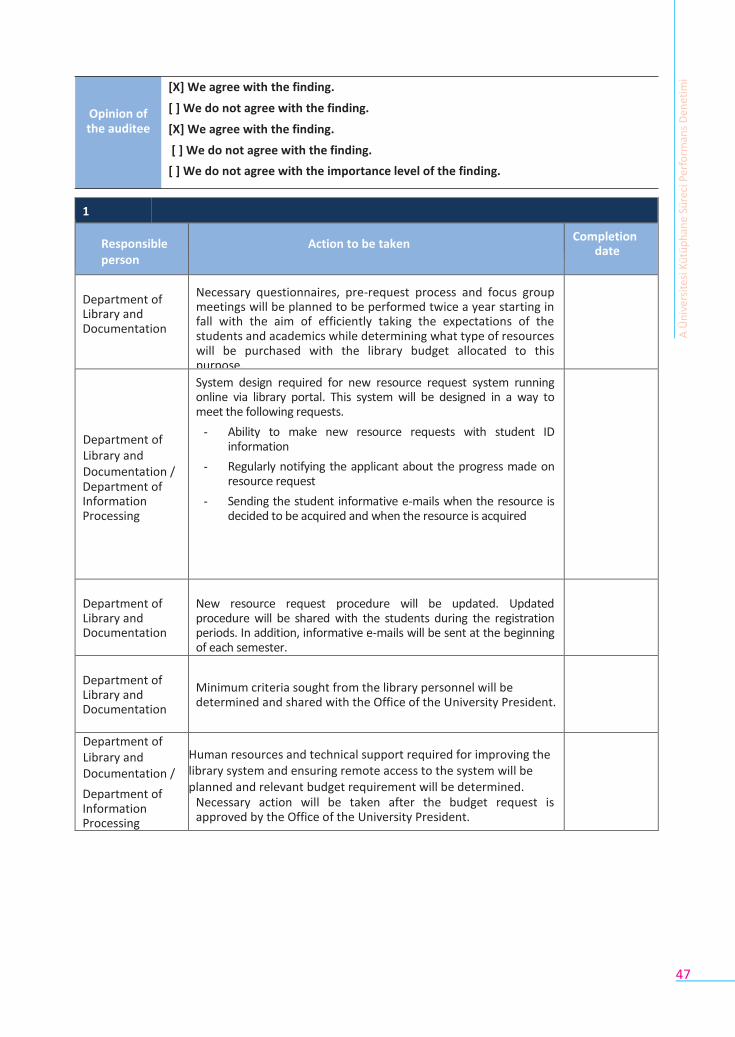
47
1
Responsible person
Action to be taken Completion
date
Department of Library and Documentation
Necessary questionnaires, pre-request process and focus group meetings will be planned to be performed twice a year starting in fall with the aim of efficiently taking the expectations of the students and academics while determining what type of resources will be purchased with the library budget allocated to this purpose.
Department of Library and Documentation / Department of Information Processing
System design required for new resource request system running online via library portal. This system will be designed in a way to meet the following requests.
- Ability to make new resource requests with student ID information
- Regularly notifying the applicant about the progress made on resource request
- Sending the student informative e-mails when the resource is decided to be acquired and when the resource is acquired
Department of Library and Documentation
New resource request procedure will be updated. Updated procedure will be shared with the students during the registration periods. In addition, informative e-mails will be sent at the beginning of each semester.
Department of Library and Documentation
Minimum criteria sought from the library personnel will be determined and shared with the Office of the University President.
Department of Library and Documentation /
Department of Information Processing
Human resources and technical support required for improving the library system and ensuring remote access to the system will be planned and relevant budget requirement will be determined.
Necessary action will be taken after the budget request is approved by the Office of the University President.
Opinion of the auditee
[X] We agree with the finding.
[ ] We do not agree with the finding.
[X] We agree with the finding.
[ ] We do not agree with the finding.
[ ] We do not agree with the importance level of the finding.
A Ü
niv
ers
ites
i Kü
tüp
han
e Sü
reci
Per
form
ans
Den
etim
i
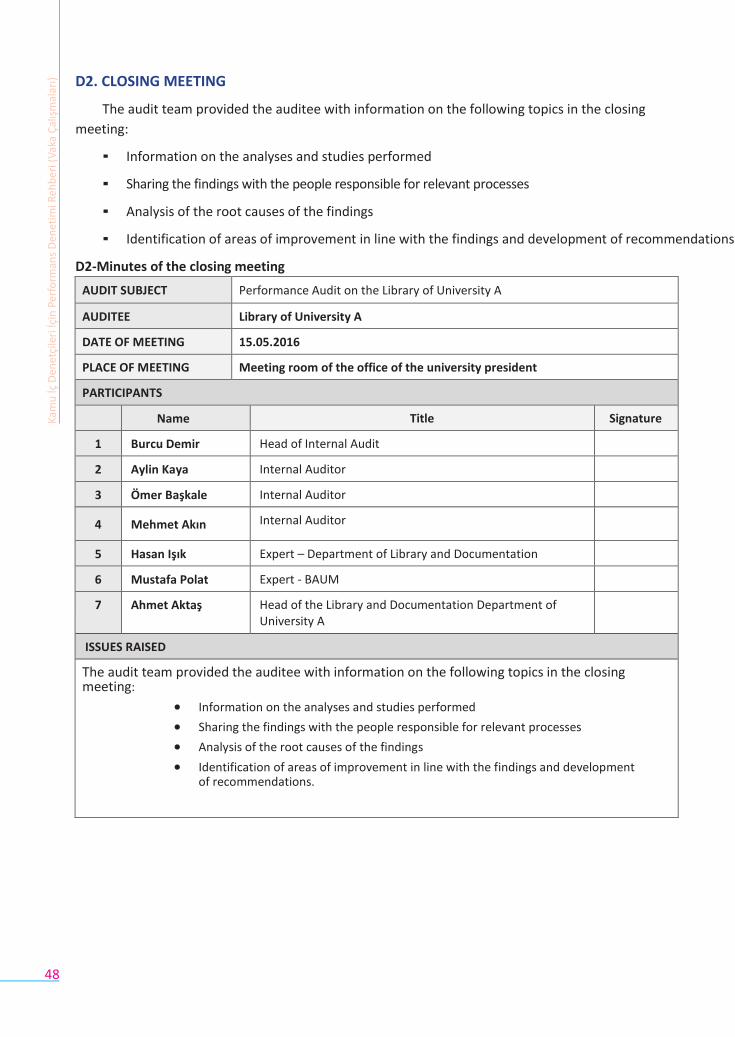
48
D2. CLOSING MEETING
The audit team provided the auditee with information on the following topics in the closing
meeting:
▪ Information on the analyses and studies performed
▪ Sharing the findings with the people responsible for relevant processes
▪ Analysis of the root causes of the findings
▪ Identification of areas of improvement in line with the findings and development of recommendations
D2-Minutes of the closing meeting
AUDIT SUBJECT Performance Audit on the Library of University A
AUDITEE Library of University A
DATE OF MEETING 15.05.2016
PLACE OF MEETING Meeting room of the office of the university president
PARTICIPANTS
Name Title Signature
1 Burcu Demir Head of Internal Audit
2 Aylin Kaya Internal Auditor
3 Ömer Başkale Internal Auditor
4 Mehmet Akın Internal Auditor
5 Hasan Işık Expert – Department of Library and Documentation
6 Mustafa Polat Expert - BAUM
7 Ahmet Aktaş Head of the Library and Documentation Department of University A
ISSUES RAISED
The audit team provided the auditee with information on the following topics in the closing meeting:
Information on the analyses and studies performed
Sharing the findings with the people responsible for relevant processes
Analysis of the root causes of the findings
Identification of areas of improvement in line with the findings and development of recommendations.
Kam
u İç
Den
etçi
leri
İçin
Per
form
ans
Den
etim
i Reh
ber
i (V
aka
Çal
ışm
alar
ı)
49
Performance Audit of the Bus
Operations of Municipality A
The content of the case study is not related to any institution, practice or person. The content is purely fictitious.

50
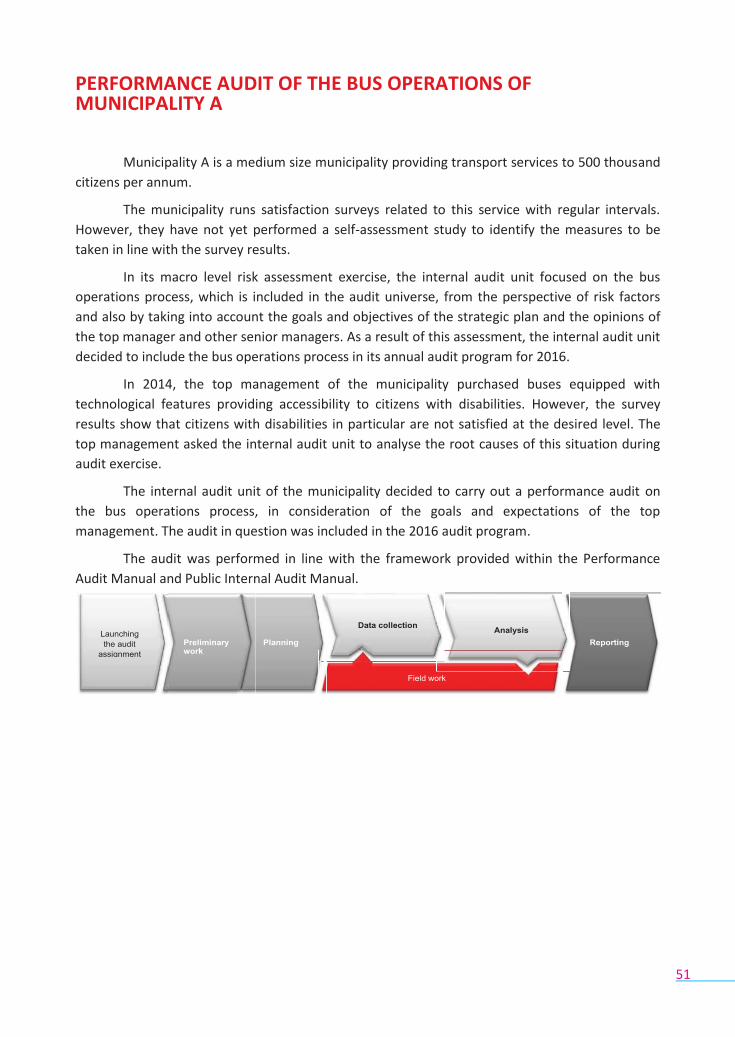
51
PERFORMANCE AUDIT OF THE BUS OPERATIONS OF MUNICIPALITY A
Municipality A is a medium size municipality providing transport services to 500 thousand
citizens per annum.
The municipality runs satisfaction surveys related to this service with regular intervals.
However, they have not yet performed a self-assessment study to identify the measures to be
taken in line with the survey results.
In its macro level risk assessment exercise, the internal audit unit focused on the bus
operations process, which is included in the audit universe, from the perspective of risk factors
and also by taking into account the goals and objectives of the strategic plan and the opinions of
the top manager and other senior managers. As a result of this assessment, the internal audit unit
decided to include the bus operations process in its annual audit program for 2016.
In 2014, the top management of the municipality purchased buses equipped with
technological features providing accessibility to citizens with disabilities. However, the survey
results show that citizens with disabilities in particular are not satisfied at the desired level. The
top management asked the internal audit unit to analyse the root causes of this situation during
audit exercise.
The internal audit unit of the municipality decided to carry out a performance audit on
the bus operations process, in consideration of the goals and expectations of the top
management. The audit in question was included in the 2016 audit program.
The audit was performed in line with the framework provided within the Performance
Audit Manual and Public Internal Audit Manual.
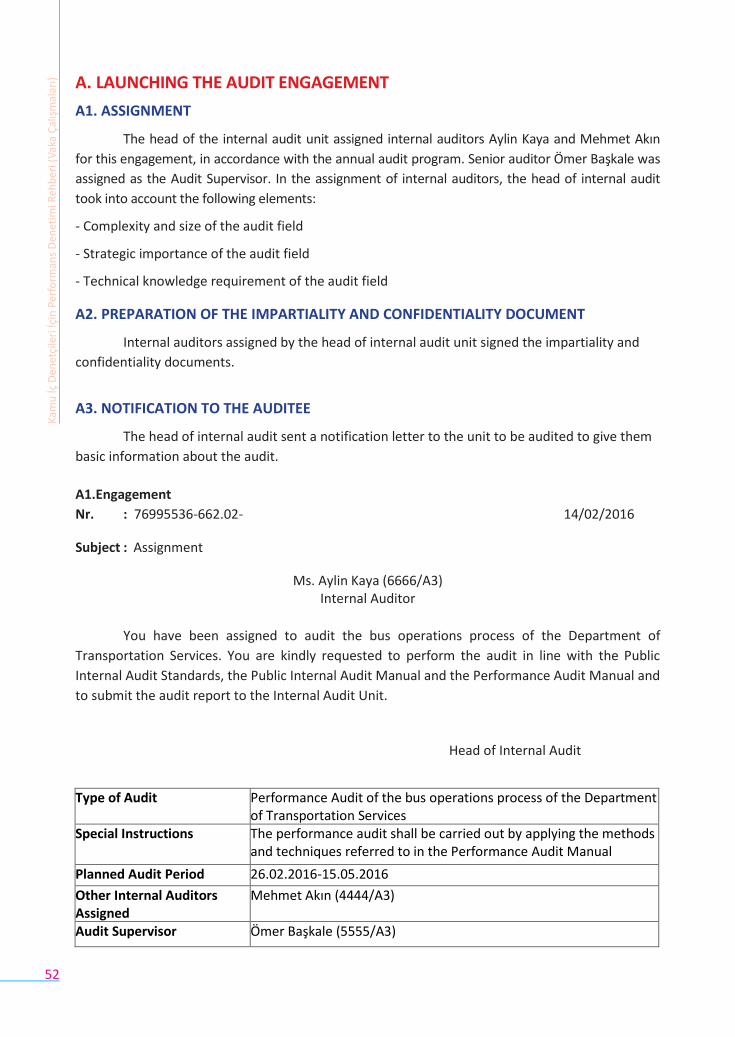
52
A. LAUNCHING THE AUDIT ENGAGEMENT
A1. ASSIGNMENT
The head of the internal audit unit assigned internal auditors Aylin Kaya and Mehmet Akın
for this engagement, in accordance with the annual audit program. Senior auditor Ömer Başkale was
assigned as the Audit Supervisor. In the assignment of internal auditors, the head of internal audit
took into account the following elements:
- Complexity and size of the audit field
- Strategic importance of the audit field
- Technical knowledge requirement of the audit field
A2. PREPARATION OF THE IMPARTIALITY AND CONFIDENTIALITY DOCUMENT
Internal auditors assigned by the head of internal audit unit signed the impartiality and
confidentiality documents.
A3. NOTIFICATION TO THE AUDITEE
The head of internal audit sent a notification letter to the unit to be audited to give them
basic information about the audit.
A1.Engagement
Nr. : 76995536-662.02- 14/02/2016
Subject : Assignment
Ms. Aylin Kaya (6666/A3) Internal Auditor
You have been assigned to audit the bus operations process of the Department of
Transportation Services. You are kindly requested to perform the audit in line with the Public
Internal Audit Standards, the Public Internal Audit Manual and the Performance Audit Manual and
to submit the audit report to the Internal Audit Unit.
Head of Internal Audit
Type of Audit Performance Audit of the bus operations process of the Department of Transportation Services
Special Instructions The performance audit shall be carried out by applying the methods and techniques referred to in the Performance Audit Manual
Planned Audit Period 26.02.2016-15.05.2016
Other Internal Auditors Assigned
Mehmet Akın (4444/A3)
Audit Supervisor Ömer Başkale (5555/A3)
Kam
u İç
Den
etçi
leri
İçin
Per
form
ans
Den
etim
i Reh
ber
i (V
aka
Çal
ışm
alar
ı)
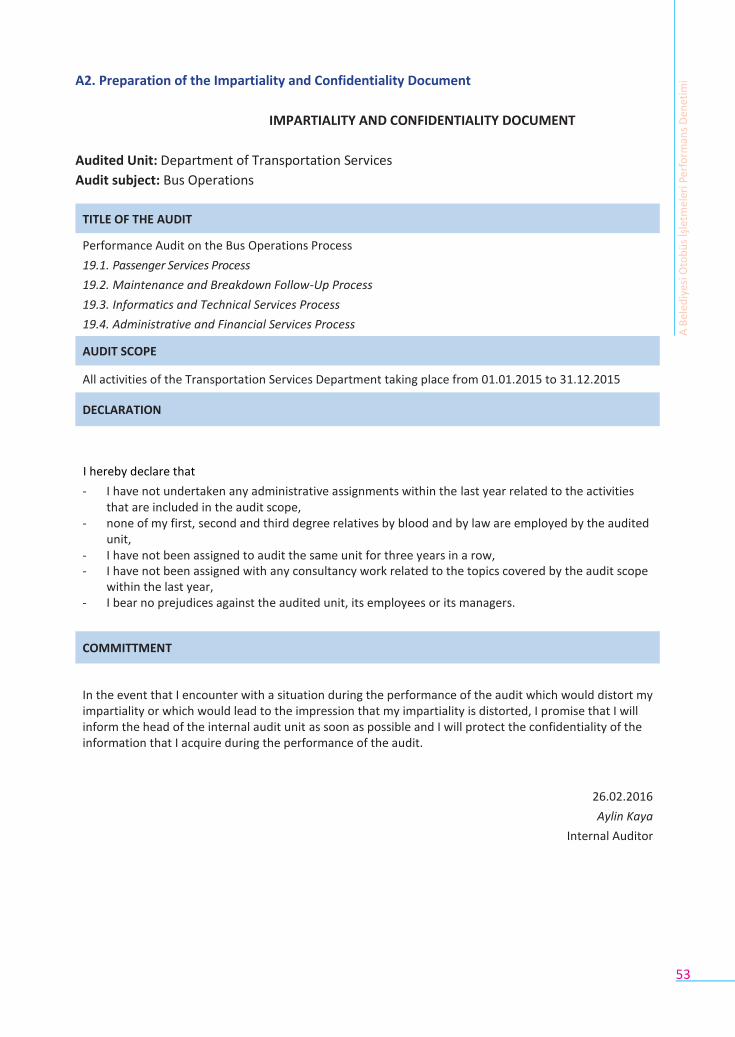
53
A2. Preparation of the Impartiality and Confidentiality Document
IMPARTIALITY AND CONFIDENTIALITY DOCUMENT
Audited Unit: Department of Transportation Services
Audit subject: Bus Operations
Performance Audit on the Bus Operations Process
19.1. Passenger Services Process
19.2. Maintenance and Breakdown Follow-Up Process
19.3. Informatics and Technical Services Process
19.4. Administrative and Financial Services Process
All activities of the Transportation Services Department taking place from 01.01.2015 to 31.12.2015
I hereby declare that
- I have not undertaken any administrative assignments within the last year related to the activities that are included in the audit scope,
- none of my first, second and third degree relatives by blood and by law are employed by the audited unit,
- I have not been assigned to audit the same unit for three years in a row, - I have not been assigned with any consultancy work related to the topics covered by the audit scope
within the last year, - I bear no prejudices against the audited unit, its employees or its managers.
In the event that I encounter with a situation during the performance of the audit which would distort my impartiality or which would lead to the impression that my impartiality is distorted, I promise that I will inform the head of the internal audit unit as soon as possible and I will protect the confidentiality of the information that I acquire during the performance of the audit.
26.02.2016
Aylin Kaya
Internal Auditor
DECLARATION
TITLE OF THE AUDIT
AUDIT SCOPE
COMMITTMENT
A B
eled
iyes
i Oto
bü
s İş
letm
eler
i Per
form
ans
Den
etim
i
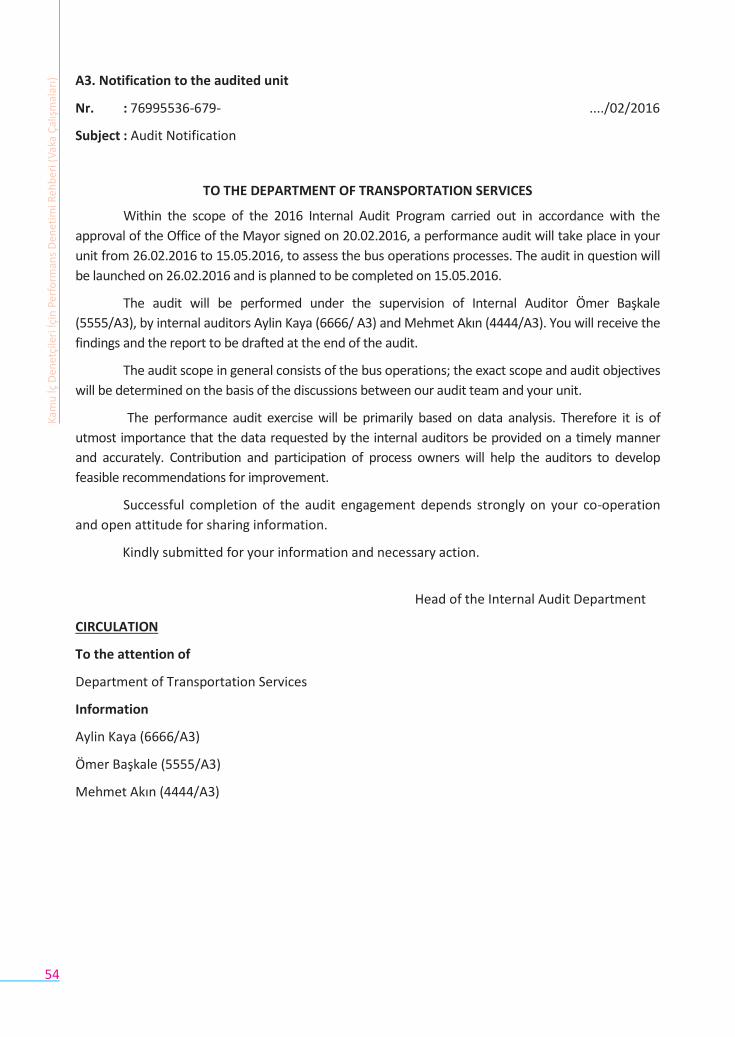
54
A3. Notification to the audited unit
Nr. : 76995536-679- ..../02/2016
Subject : Audit Notification
TO THE DEPARTMENT OF TRANSPORTATION SERVICES
Within the scope of the 2016 Internal Audit Program carried out in accordance with the
approval of the Office of the Mayor signed on 20.02.2016, a performance audit will take place in your
unit from 26.02.2016 to 15.05.2016, to assess the bus operations processes. The audit in question will
be launched on 26.02.2016 and is planned to be completed on 15.05.2016.
The audit will be performed under the supervision of Internal Auditor Ömer Başkale
(5555/A3), by internal auditors Aylin Kaya (6666/ A3) and Mehmet Akın (4444/A3). You will receive the
findings and the report to be drafted at the end of the audit.
The audit scope in general consists of the bus operations; the exact scope and audit objectives
will be determined on the basis of the discussions between our audit team and your unit.
The performance audit exercise will be primarily based on data analysis. Therefore it is of
utmost importance that the data requested by the internal auditors be provided on a timely manner
and accurately. Contribution and participation of process owners will help the auditors to develop
feasible recommendations for improvement.
Successful completion of the audit engagement depends strongly on your co-operation
and open attitude for sharing information.
Kindly submitted for your information and necessary action.
Head of the Internal Audit Department
CIRCULATION
To the attention of
Department of Transportation Services
Information
Aylin Kaya (6666/A3)
Ömer Başkale (5555/A3)
Mehmet Akın (4444/A3)
Kam
u İç
Den
etçi
leri
İçin
Per
form
ans
Den
etim
i Reh
ber
i (V
aka
Çal
ışm
alar
ı)
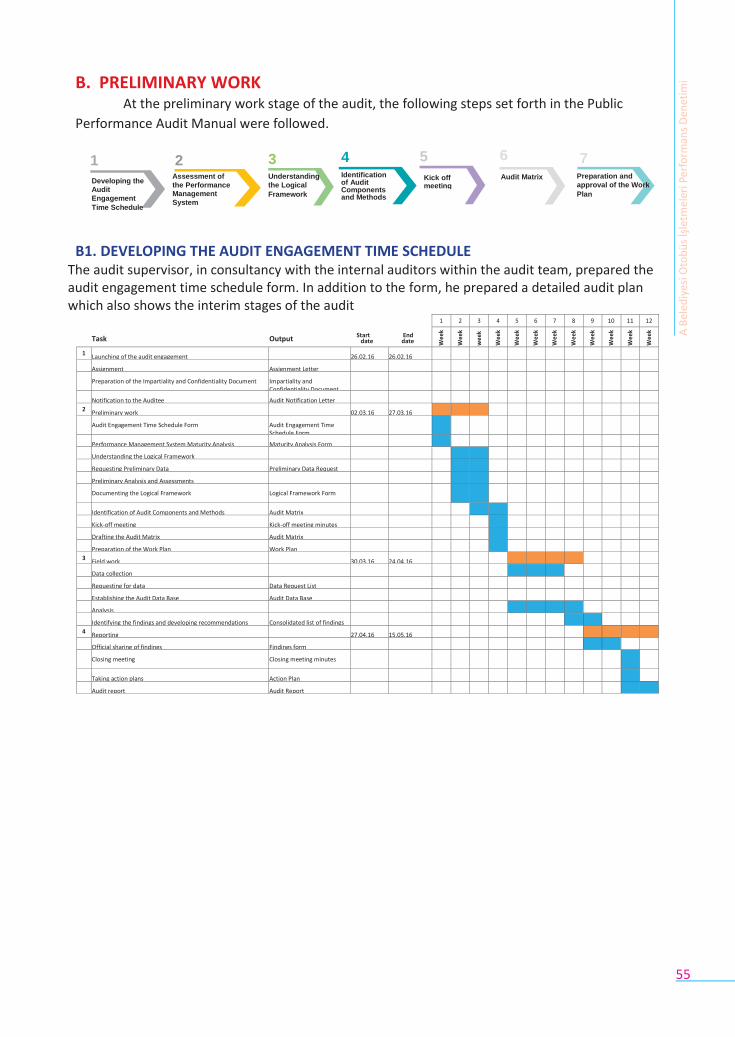
55
Identification of Audit Components and Methods
Kick off meeting
Understanding
the Logical
Framework
Audit Matrix Preparation and
approval of the Work
Plan
B. PRELIMINARY WORK At the preliminary work stage of the audit, the following steps set forth in the Public
Performance Audit Manual were followed.
1 2 3 4 5 6 7 Assessment of
the Performance
Management
System
B1. DEVELOPING THE AUDIT ENGAGEMENT TIME SCHEDULE The audit supervisor, in consultancy with the internal auditors within the audit team, prepared the audit engagement time schedule form. In addition to the form, he prepared a detailed audit plan which also shows the interim stages of the audit
Task Output Start End date date
1 2 3 4 5 6 7 8 9 10 11 12
Wee
k
Wee
k
wee
k
Wee
k
Wee
k
Wee
k
Wee
k
Wee
k
Wee
k
Wee
k
Wee
k
Wee
k
1 Launching of the audit engagement 26.02.16 26.02.16
Assignment Assignment Letter Preparation of the Impartiality and Confidentiality Document Impartiality and
Confidentiality Document
Notification to the Auditee Audit Notification Letter 2
Preliminary work 02.03.16 27.03.16 Audit Engagement Time Schedule Form Audit Engagement Time
Schedule Form
Performance Management System Maturity Analysis Maturity Analysis Form Understanding the Logical Framework Requesting Preliminary Data Preliminary Data Request
Form
Preliminary Analysis and Assessments Documenting the Logical Framework Logical Framework Form
Identification of Audit Components and Methods Audit Matrix Kick-off meeting Kick-off meeting minutes Drafting the Audit Matrix Audit Matrix Preparation of the Work Plan Work Plan
3 Field work 30.03.16 24.04.16
Data collection Requesting for data Data Request List Establishing the Audit Data Base Audit Data Base Analysis Identifying the findings and developing recommendations Consolidated list of findings
4 Reporting 27.04.16 15.05.16
Official sharing of findings Findings form Closing meeting Closing meeting minutes
Taking action plans Action Plan Audit report Audit Report
Developing the
Audit
Engagement
Time Schedule
A B
eled
iyes
i Oto
bü
s İş
letm
eler
i Per
form
ans
Den
etim
i
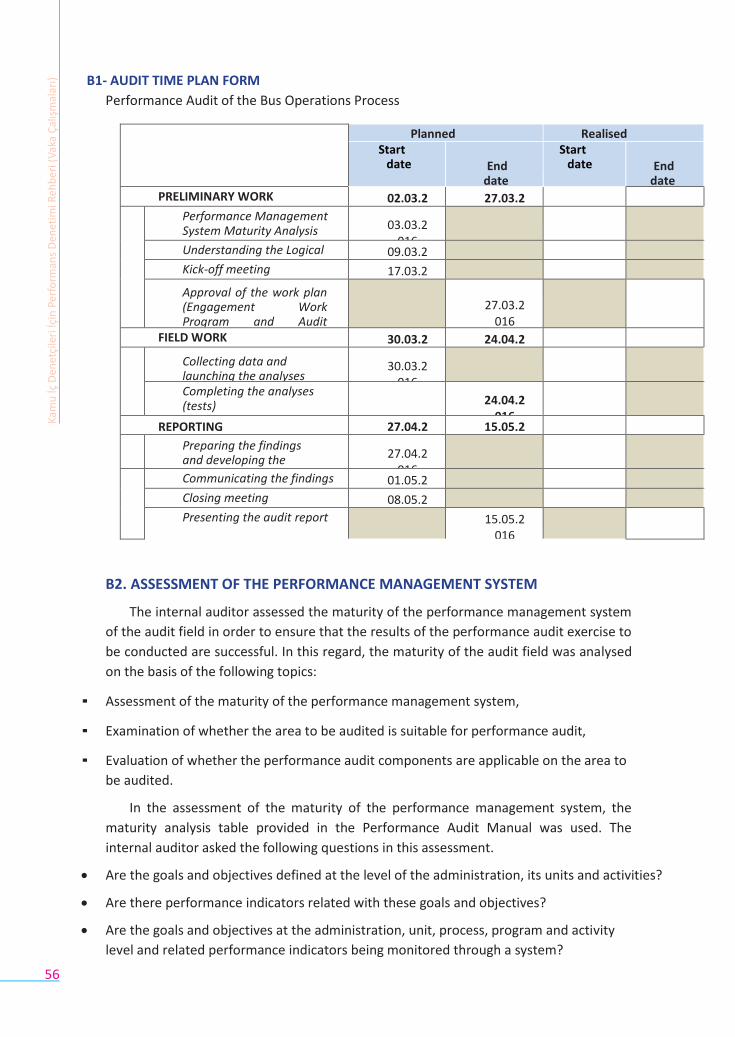
56
B1- AUDIT TIME PLAN FORM
Performance Audit of the Bus Operations Process
Planned Realised Start
date End
date
Start date
End
date PRELIMINARY WORK 02.03.2
016 27.03.2
016
Performance Management System Maturity Analysis 03.03.2
016
Understanding the Logical Framework
09.03.2016
Kick-off meeting 17.03.2016
Approval of the work plan (Engagement Work Program and Audit Matrix)
27.03.2
016
FIELD WORK 30.03.2016
24.04.2016
Collecting data and launching the analyses (tests)
30.03.2016
Completing the analyses (tests)
24.04.2
016
REPORTING 27.04.2016
15.05.2016
Preparing the findings and developing the recommendation
27.04.2016
Communicating the findings 01.05.2016
Closing meeting 08.05.2016
Presenting the audit report 15.05.2016
B2. ASSESSMENT OF THE PERFORMANCE MANAGEMENT SYSTEM
The internal auditor assessed the maturity of the performance management system
of the audit field in order to ensure that the results of the performance audit exercise to
be conducted are successful. In this regard, the maturity of the audit field was analysed
on the basis of the following topics:
▪ Assessment of the maturity of the performance management system,
▪ Examination of whether the area to be audited is suitable for performance audit,
▪ Evaluation of whether the performance audit components are applicable on the area to
be audited.
In the assessment of the maturity of the performance management system, the
maturity analysis table provided in the Performance Audit Manual was used. The
internal auditor asked the following questions in this assessment.
Are the goals and objectives defined at the level of the administration, its units and activities?
Are there performance indicators related with these goals and objectives?
Are the goals and objectives at the administration, unit, process, program and activity
level and related performance indicators being monitored through a system?
Kam
u İç
Den
etçi
leri
İçin
Per
form
ans
Den
etim
i Reh
ber
i (V
aka
Çal
ışm
alar
ı)
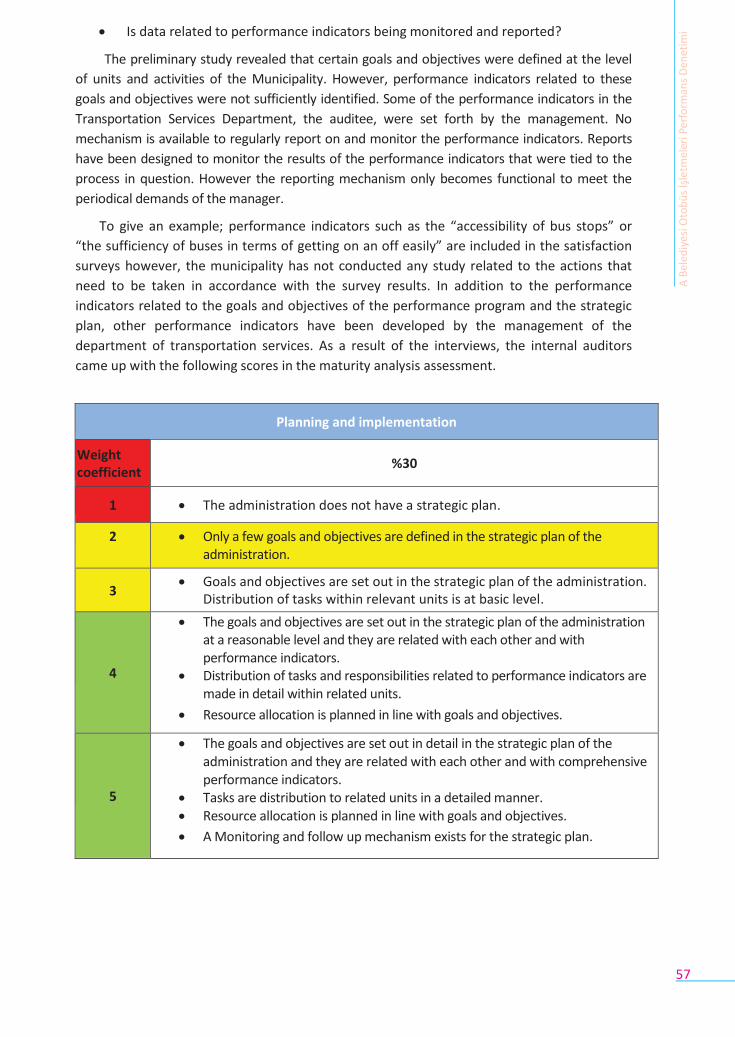
57
Is data related to performance indicators being monitored and reported?
The preliminary study revealed that certain goals and objectives were defined at the level
of units and activities of the Municipality. However, performance indicators related to these
goals and objectives were not sufficiently identified. Some of the performance indicators in the
Transportation Services Department, the auditee, were set forth by the management. No
mechanism is available to regularly report on and monitor the performance indicators. Reports
have been designed to monitor the results of the performance indicators that were tied to the
process in question. However the reporting mechanism only becomes functional to meet the
periodical demands of the manager.
To give an example; performance indicators such as the “accessibility of bus stops” or
“the sufficiency of buses in terms of getting on an off easily” are included in the satisfaction
surveys however, the municipality has not conducted any study related to the actions that
need to be taken in accordance with the survey results. In addition to the performance
indicators related to the goals and objectives of the performance program and the strategic
plan, other performance indicators have been developed by the management of the
department of transportation services. As a result of the interviews, the internal auditors
came up with the following scores in the maturity analysis assessment.
Planning and implementation
Weight coefficient
%30
1 The administration does not have a strategic plan.
2 Only a few goals and objectives are defined in the strategic plan of the administration.
3 Goals and objectives are set out in the strategic plan of the administration.
Distribution of tasks within relevant units is at basic level.
4
The goals and objectives are set out in the strategic plan of the administration at a reasonable level and they are related with each other and with performance indicators.
Distribution of tasks and responsibilities related to performance indicators are made in detail within related units.
Resource allocation is planned in line with goals and objectives.
5
The goals and objectives are set out in detail in the strategic plan of the administration and they are related with each other and with comprehensive performance indicators.
Tasks are distribution to related units in a detailed manner. Resource allocation is planned in line with goals and objectives.
A Monitoring and follow up mechanism exists for the strategic plan.
A B
eled
iyes
i Oto
bü
s İş
letm
eler
i Per
form
ans
Den
etim
i
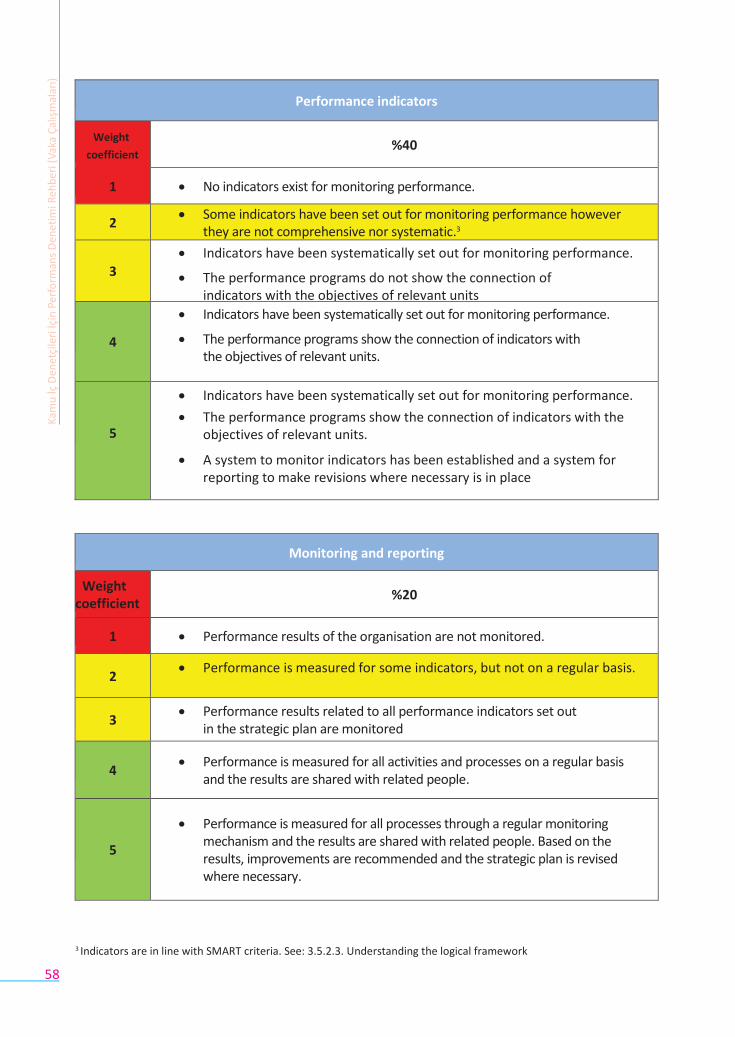
58
Performance indicators
Weight
coefficient
%40
1 No indicators exist for monitoring performance.
2 Some indicators have been set out for monitoring performance however
they are not comprehensive nor systematic.3
3
Indicators have been systematically set out for monitoring performance.
The performance programs do not show the connection of indicators with the objectives of relevant units
4
Indicators have been systematically set out for monitoring performance.
The performance programs show the connection of indicators with the objectives of relevant units.
5
Indicators have been systematically set out for monitoring performance.
The performance programs show the connection of indicators with the objectives of relevant units.
A system to monitor indicators has been established and a system for reporting to make revisions where necessary is in place
Monitoring and reporting
Weight coefficient
%20
1 Performance results of the organisation are not monitored.
2 Performance is measured for some indicators, but not on a regular basis.
3 Performance results related to all performance indicators set out
in the strategic plan are monitored
4
Performance is measured for all activities and processes on a regular basis and the results are shared with related people.
5
Performance is measured for all processes through a regular monitoring mechanism and the results are shared with related people. Based on the results, improvements are recommended and the strategic plan is revised where necessary.
3 Indicators are in line with SMART criteria. See: 3.5.2.3. Understanding the logical framework
Kam
u İç
Den
etçi
leri
İçin
Per
form
ans
Den
etim
i Reh
ber
i (V
aka
Çal
ışm
alar
ı)
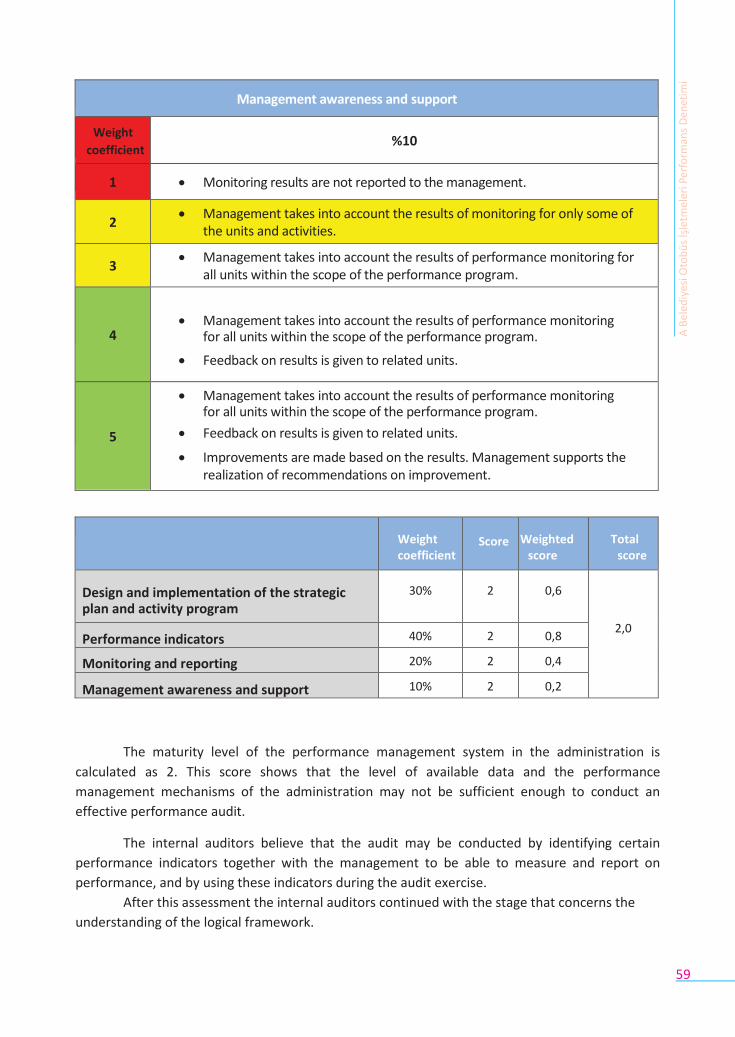
59
Management awareness and support
Weight
coefficient
%10
1 Monitoring results are not reported to the management.
2 Management takes into account the results of monitoring for only some of
the units and activities.
3 Management takes into account the results of performance monitoring for
all units within the scope of the performance program.
4
Management takes into account the results of performance monitoring for all units within the scope of the performance program.
Feedback on results is given to related units.
5
Management takes into account the results of performance monitoring for all units within the scope of the performance program.
Feedback on results is given to related units.
Improvements are made based on the results. Management supports the realization of recommendations on improvement.
Weight coefficient
Score Weighted score
Total score
Design and implementation of the strategic plan and activity program
30% 2 0,6
2,0
Performance indicators 40% 2 0,8
Monitoring and reporting 20% 2 0,4
Management awareness and support 10% 2 0,2
The maturity level of the performance management system in the administration is
calculated as 2. This score shows that the level of available data and the performance
management mechanisms of the administration may not be sufficient enough to conduct an
effective performance audit.
The internal auditors believe that the audit may be conducted by identifying certain
performance indicators together with the management to be able to measure and report on
performance, and by using these indicators during the audit exercise.
After this assessment the internal auditors continued with the stage that concerns the
understanding of the logical framework.
A B
eled
iyes
i Oto
bü
s İş
letm
eler
i Per
form
ans
Den
etim
i
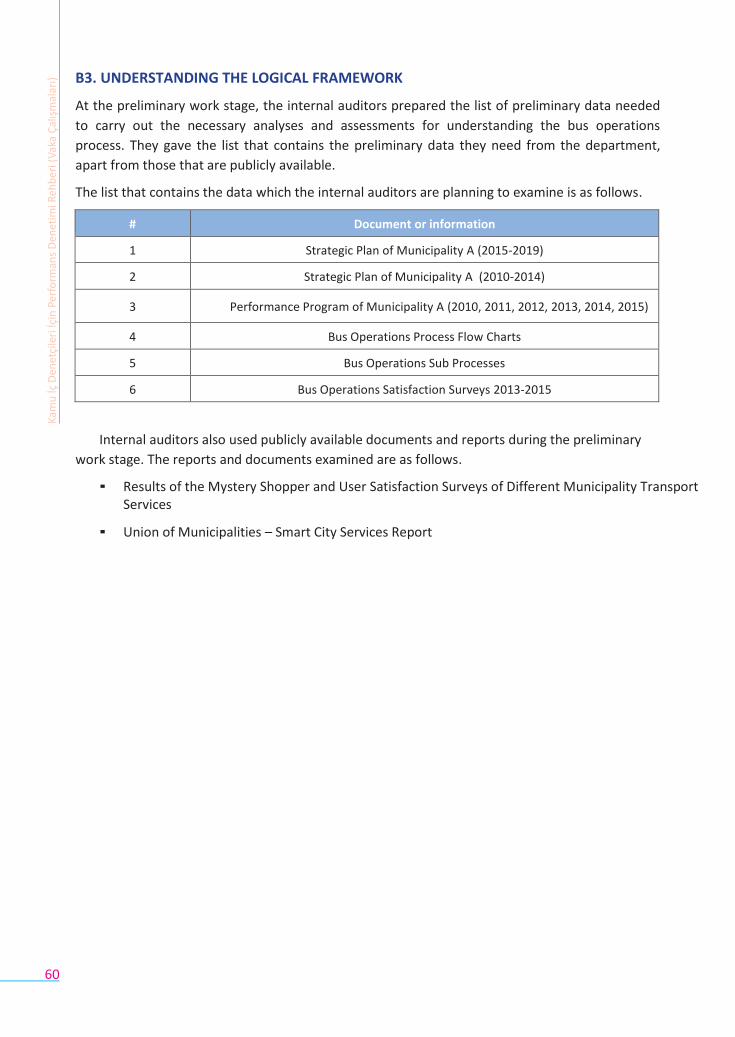
60
B3. UNDERSTANDING THE LOGICAL FRAMEWORK
At the preliminary work stage, the internal auditors prepared the list of preliminary data needed
to carry out the necessary analyses and assessments for understanding the bus operations
process. They gave the list that contains the preliminary data they need from the department,
apart from those that are publicly available.
The list that contains the data which the internal auditors are planning to examine is as follows.
# Document or information
1 Strategic Plan of Municipality A (2015-2019)
2 Strategic Plan of Municipality A (2010-2014)
3 Performance Program of Municipality A (2010, 2011, 2012, 2013, 2014, 2015)
4 Bus Operations Process Flow Charts
5 Bus Operations Sub Processes
6 Bus Operations Satisfaction Surveys 2013-2015
Internal auditors also used publicly available documents and reports during the preliminary
work stage. The reports and documents examined are as follows.
▪ Results of the Mystery Shopper and User Satisfaction Surveys of Different Municipality Transport Services
▪ Union of Municipalities – Smart City Services Report
Kam
u İç
Den
etçi
leri
İçin
Per
form
ans
Den
etim
i Reh
ber
i (V
aka
Çal
ışm
alar
ı)
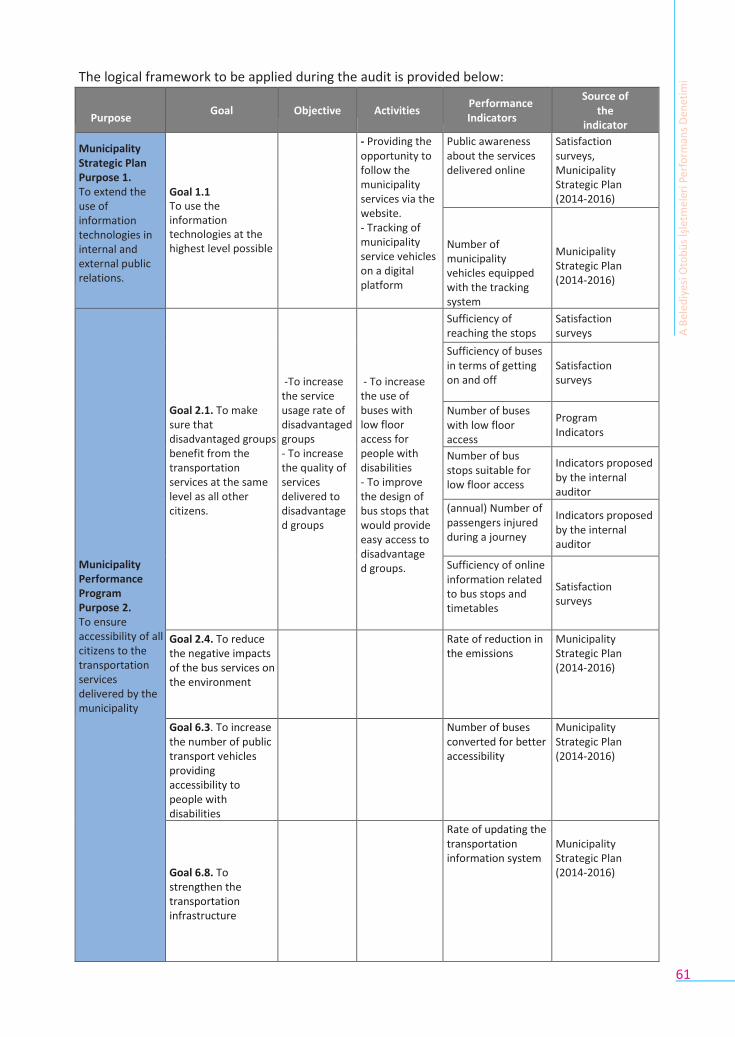
61
The logical framework to be applied during the audit is provided below:
Purpose
Goal
Objective
Activities
Performance Indicators
Source of the
indicator
Municipality Strategic Plan Purpose 1. To extend the use of information technologies in internal and external public relations.
Goal 1.1 To use the information technologies at the highest level possible
- Providing the opportunity to follow the municipality services via the website. - Tracking of municipality service vehicles on a digital platform
Public awareness about the services delivered online
Satisfaction surveys, Municipality Strategic Plan (2014-2016)
Number of municipality vehicles equipped with the tracking system
Municipality Strategic Plan (2014-2016)
Municipality Performance Program Purpose 2. To ensure accessibility of all citizens to the transportation services delivered by the municipality
Goal 2.1. To make sure that disadvantaged groups benefit from the transportation services at the same level as all other citizens.
-To increase
the service usage rate of disadvantaged groups - To increase the quality of services delivered to disadvantaged groups
- To increase
the use of buses with low floor access for people with disabilities - To improve the design of bus stops that would provide easy access to disadvantaged groups.
Sufficiency of reaching the stops
Satisfaction surveys
Sufficiency of buses in terms of getting on and off
Satisfaction surveys
Number of buses with low floor access
Program Indicators
Number of bus stops suitable for low floor access
Indicators proposed by the internal auditor
(annual) Number of passengers injured during a journey
Indicators proposed by the internal auditor
Sufficiency of online information related to bus stops and timetables
Satisfaction surveys
Goal 2.4. To reduce the negative impacts of the bus services on the environment
Rate of reduction in the emissions
Municipality Strategic Plan (2014-2016)
Goal 6.3. To increase the number of public transport vehicles providing accessibility to people with disabilities
Number of buses converted for better accessibility
Municipality Strategic Plan (2014-2016)
Goal 6.8. To strengthen the transportation infrastructure
Rate of updating the transportation information system
Municipality Strategic Plan (2014-2016)
A B
eled
iyes
i Oto
bü
s İş
letm
eler
i Per
form
ans
Den
etim
i
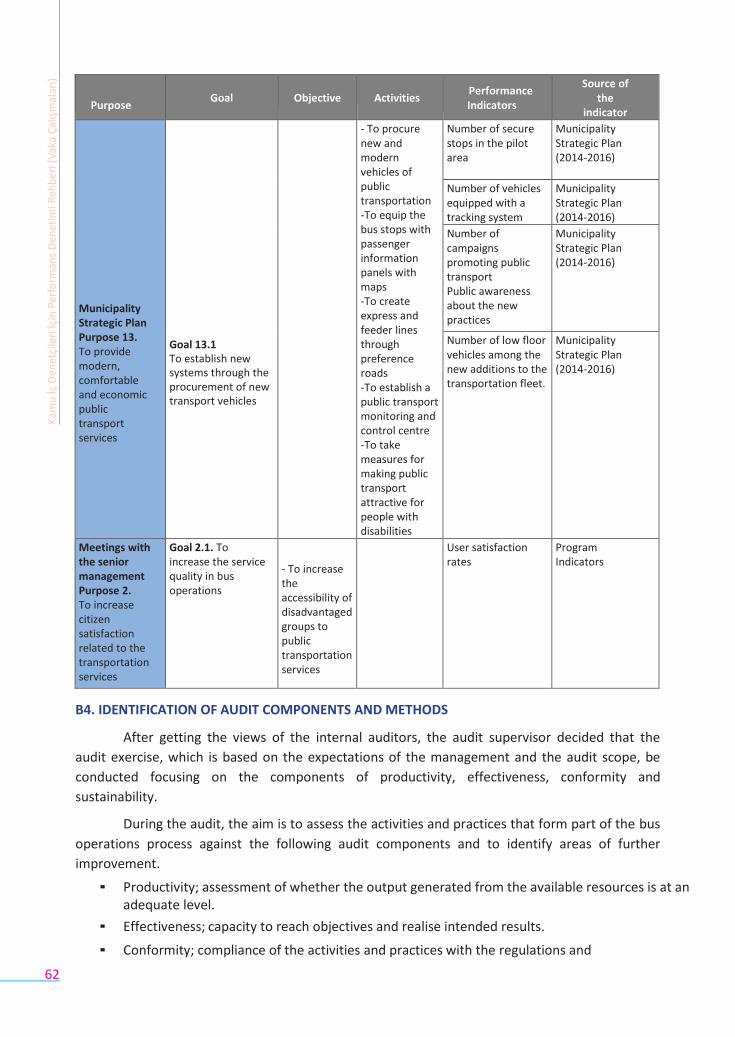
62
Purpose
Goal
Objective
Activities
Performance Indicators
Source of the
indicator
Municipality Strategic Plan Purpose 13. To provide modern, comfortable and economic public transport services
Goal 13.1 To establish new systems through the procurement of new transport vehicles
- To procure new and modern vehicles of public transportation -To equip the bus stops with passenger information panels with maps -To create express and feeder lines through preference roads -To establish a public transport monitoring and control centre -To take measures for making public transport attractive for people with disabilities
Number of secure stops in the pilot area
Municipality Strategic Plan (2014-2016)
Number of vehicles equipped with a tracking system
Municipality Strategic Plan (2014-2016)
Number of campaigns promoting public transport Public awareness about the new practices
Municipality Strategic Plan (2014-2016)
Number of low floor vehicles among the new additions to the transportation fleet.
Municipality Strategic Plan (2014-2016)
Meetings with the senior management Purpose 2. To increase citizen satisfaction related to the transportation services
Goal 2.1. To increase the service quality in bus operations
- To increase the accessibility of disadvantaged groups to public transportation services
User satisfaction rates
Program Indicators
B4. IDENTIFICATION OF AUDIT COMPONENTS AND METHODS
After getting the views of the internal auditors, the audit supervisor decided that the
audit exercise, which is based on the expectations of the management and the audit scope, be
conducted focusing on the components of productivity, effectiveness, conformity and
sustainability.
During the audit, the aim is to assess the activities and practices that form part of the bus
operations process against the following audit components and to identify areas of further
improvement.
▪ Productivity; assessment of whether the output generated from the available resources is at an adequate level.
▪ Effectiveness; capacity to reach objectives and realise intended results.
▪ Conformity; compliance of the activities and practices with the regulations and
Kam
u İç
Den
etçi
leri
İçin
Per
form
ans
Den
etim
i Reh
ber
i (V
aka
Çal
ışm
alar
ı)

63
procedures in force and adequacy of the institutional capacity for implementation.
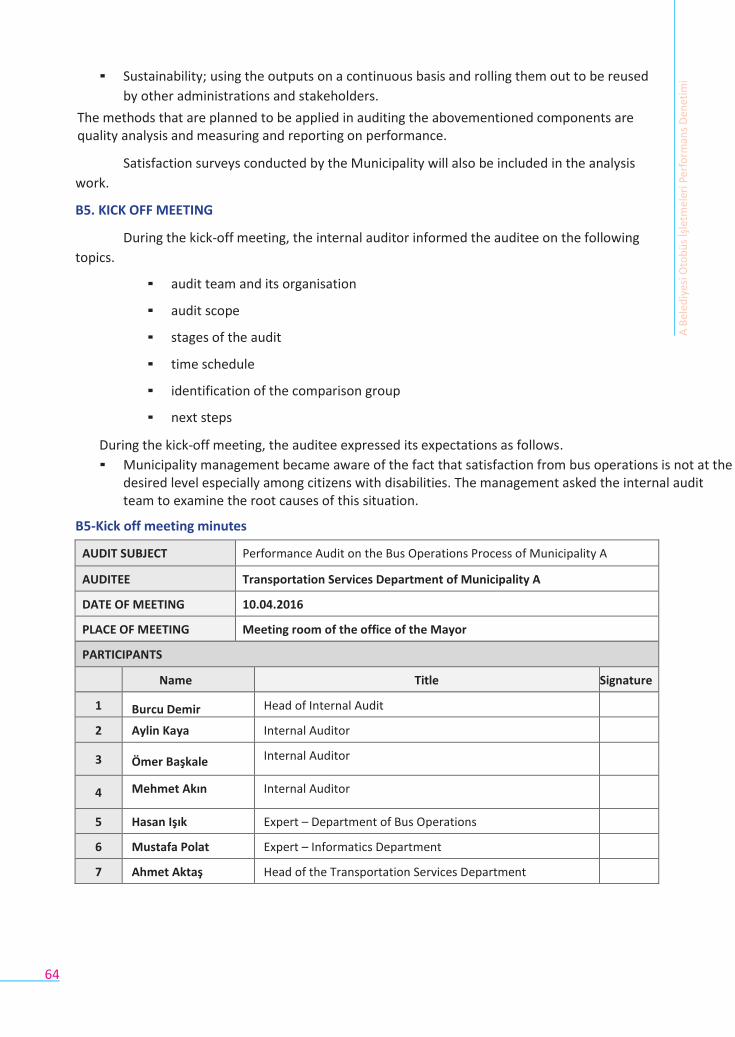
64
▪ Sustainability; using the outputs on a continuous basis and rolling them out to be reused
by other administrations and stakeholders.
The methods that are planned to be applied in auditing the abovementioned components are quality analysis and measuring and reporting on performance.
Satisfaction surveys conducted by the Municipality will also be included in the analysis
work.
B5. KICK OFF MEETING
During the kick-off meeting, the internal auditor informed the auditee on the following
topics.
▪ audit team and its organisation
▪ audit scope
▪ stages of the audit
▪ time schedule
▪ identification of the comparison group
▪ next steps
During the kick-off meeting, the auditee expressed its expectations as follows.
▪ Municipality management became aware of the fact that satisfaction from bus operations is not at the desired level especially among citizens with disabilities. The management asked the internal audit team to examine the root causes of this situation.
B5-Kick off meeting minutes
AUDIT SUBJECT Performance Audit on the Bus Operations Process of Municipality A
AUDITEE Transportation Services Department of Municipality A
DATE OF MEETING 10.04.2016
PLACE OF MEETING Meeting room of the office of the Mayor
PARTICIPANTS
Name Title Signature
1 Burcu Demir Head of Internal Audit
2 Aylin Kaya Internal Auditor
3 Ömer Başkale Internal Auditor
4 Mehmet Akın Internal Auditor
5 Hasan Işık Expert – Department of Bus Operations
6 Mustafa Polat Expert – Informatics Department
7 Ahmet Aktaş Head of the Transportation Services Department
A B
eled
iyes
i Oto
bü
s İş
letm
eler
i Per
form
ans
Den
etim
i
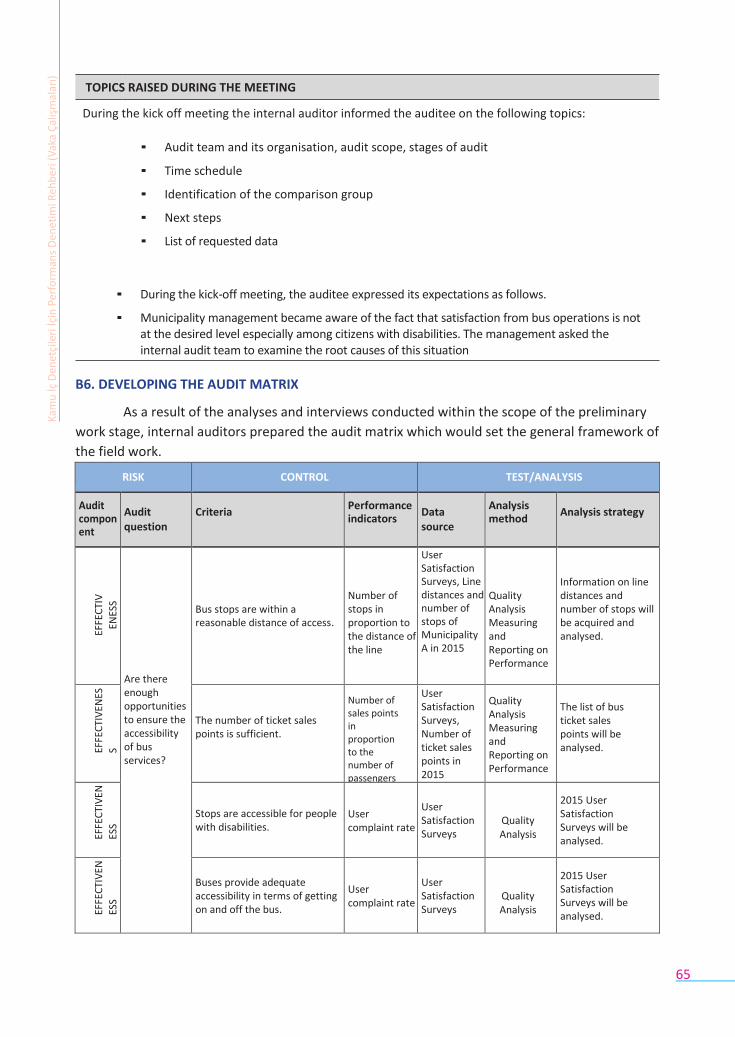
65
B6. DEVELOPING THE AUDIT MATRIX
As a result of the analyses and interviews conducted within the scope of the preliminary
work stage, internal auditors prepared the audit matrix which would set the general framework of
the field work.
RISK CONTROL TEST/ANALYSIS
Audit component
Audit question
Criteria Performance indicators
Data source
Analysis method
Analysis strategy
EF
FEC
TIV
ENES
S
Are there enough opportunities to ensure the accessibility of bus services?
Bus stops are within a reasonable distance of access.
Number of stops in proportion to the distance of the line
User Satisfaction Surveys, Line distances and number of stops of Municipality A in 2015
Quality Analysis Measuring and Reporting on Performance
Information on line distances and number of stops will be acquired and analysed.
EF
FEC
TIV
ENES
S
The number of ticket sales points is sufficient.
Number of sales points in proportion to the number of passengers
User Satisfaction Surveys, Number of ticket sales points in 2015
Quality Analysis Measuring and Reporting on Performance
The list of bus ticket sales points will be analysed.
EF
FEC
TIV
EN
ESS
Stops are accessible for people with disabilities.
User complaint rate
User Satisfaction Surveys
Quality Analysis
2015 User Satisfaction Surveys will be analysed.
EF
FEC
TIV
EN
ESS
Buses provide adequate accessibility in terms of getting on and off the bus.
User complaint rate
User Satisfaction Surveys
Quality Analysis
2015 User Satisfaction Surveys will be analysed.
TOPICS RAISED DURING THE MEETING
During the kick off meeting the internal auditor informed the auditee on the following topics:
Audit team and its organisation, audit scope, stages of audit
Time schedule
Identification of the comparison group
Next steps
List of requested data
During the kick-off meeting, the auditee expressed its expectations as follows.
Municipality management became aware of the fact that satisfaction from bus operations is not at the desired level especially among citizens with disabilities. The management asked the internal audit team to examine the root causes of this situation
Kam
u İç
Den
etçi
leri
İçin
Per
form
ans
Den
etim
i Reh
ber
i (V
aka
Çal
ışm
alar
ı)
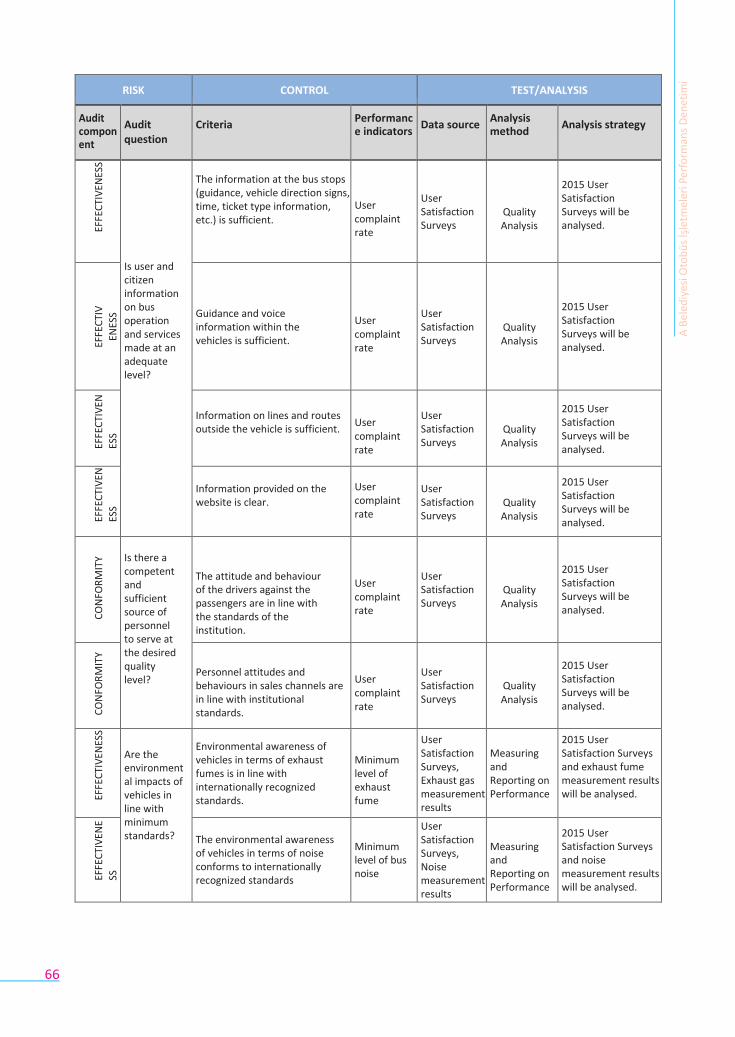
66
RISK CONTROL TEST/ANALYSIS
Audit component
Audit question
Criteria Performance indicators
Data source Analysis method
Analysis strategy
EF
FEC
TIV
ENES
S
Is user and citizen information on bus operation and services made at an adequate level?
The information at the bus stops (guidance, vehicle direction signs, time, ticket type information, etc.) is sufficient.
User complaint rate
User Satisfaction Surveys
Quality Analysis
2015 User Satisfaction Surveys will be analysed.
EF
FEC
TIV
ENES
S
Guidance and voice information within the vehicles is sufficient.
User complaint rate
User Satisfaction Surveys
Quality Analysis
2015 User Satisfaction Surveys will be analysed.
EF
FEC
TIV
EN
ESS
Information on lines and routes outside the vehicle is sufficient.
User complaint rate
User Satisfaction Surveys
Quality Analysis
2015 User Satisfaction Surveys will be analysed.
EF
FEC
TIV
EN
ESS
Information provided on the website is clear.
User complaint rate
User Satisfaction Surveys
Quality Analysis
2015 User Satisfaction Surveys will be analysed.
C
ON
FOR
MIT
Y
Is there a competent and sufficient source of personnel to serve at the desired quality level?
The attitude and behaviour of the drivers against the passengers are in line with the standards of the institution.
The attitudes and behaviors of the staff in the Saftch channels are suited to the institutional standards.
Environmental awareness of exhaust fumes is well suited to internationally recognized standards.
The environmental awareness of vehicles in terms of noise conforms to internationally recognized standards.
User complaint rate
User Satisfaction Surveys
Quality Analysis
2015 User Satisfaction Surveys will be analysed.
C
ON
FOR
MIT
Y
Personnel attitudes and behaviours in sales channels are in line with institutional standards.
User complaint rate
User Satisfaction Surveys
Quality Analysis
2015 User Satisfaction Surveys will be analysed.
EF
FEC
TIV
ENES
S
Are the environmental impacts of vehicles in line with minimum standards?
Environmental awareness of vehicles in terms of exhaust fumes is in line with internationally recognized standards.
Minimum level of exhaust fume
User Satisfaction Surveys, Exhaust gas measurement results
Measuring and Reporting on Performance
2015 User Satisfaction Surveys and exhaust fume measurement results will be analysed.
EF
FEC
TIV
ENE
SS
The environmental awareness of vehicles in terms of noise conforms to internationally recognized standards
Minimum level of bus noise
User Satisfaction Surveys, Noise measurement results
Measuring and Reporting on Performance
2015 User Satisfaction Surveys and noise measurement results will be analysed.
A B
eled
iyes
i Oto
bü
s İş
letm
eler
i Per
form
ans
Den
etim
i
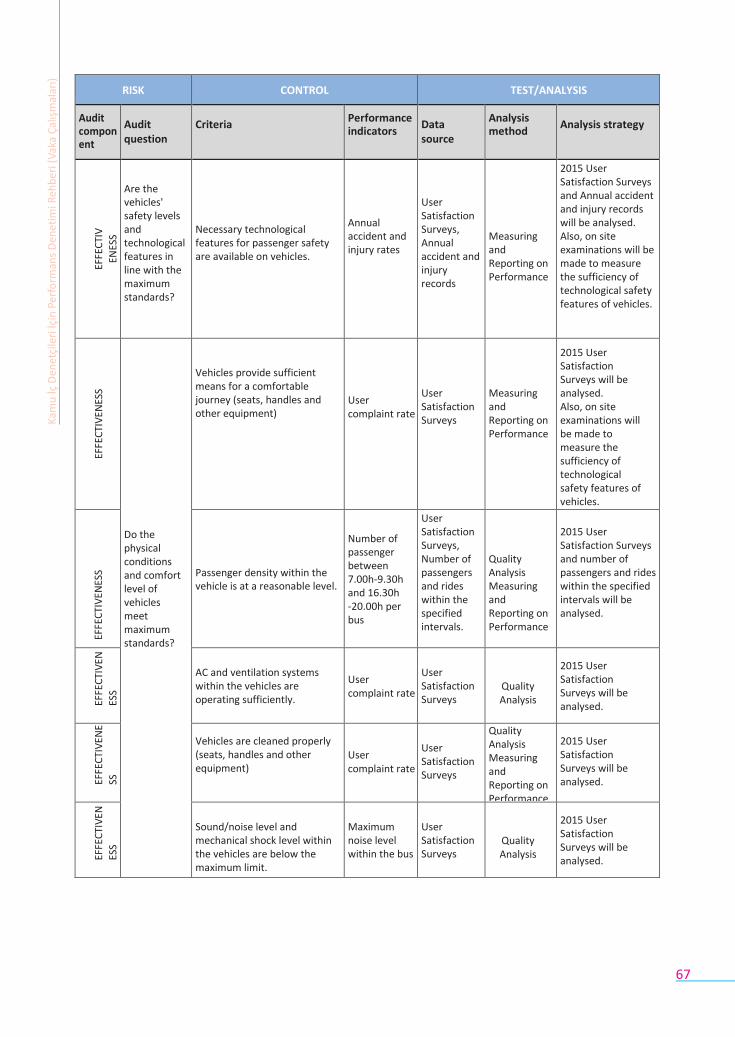
67
RISK CONTROL TEST/ANALYSIS
Audit component
Audit question
Criteria Performance indicators
Data source
Analysis method
Analysis strategy
EF
FEC
TIV
ENES
S
Are the vehicles' safety levels and technological features in line with the maximum standards?
Necessary technological features for passenger safety are available on vehicles.
Annual accident and injury rates
User Satisfaction Surveys, Annual accident and injury records
Measuring and Reporting on Performance
2015 User Satisfaction Surveys and Annual accident and injury records will be analysed. Also, on site examinations will be made to measure the sufficiency of technological safety features of vehicles.
EF
FEC
TIV
ENES
S
Do the physical conditions and comfort level of vehicles meet maximum standards?
Vehicles provide sufficient means for a comfortable journey (seats, handles and other equipment)
User complaint rate
User Satisfaction Surveys
Measuring and Reporting on Performance
2015 User Satisfaction Surveys will be analysed. Also, on site examinations will be made to measure the sufficiency of technological safety features of vehicles.
EFFE
CTI
VEN
ESS
Passenger density within the vehicle is at a reasonable level.
Number of passenger between 7.00h-9.30h and 16.30h -20.00h per bus
User Satisfaction Surveys, Number of passengers and rides within the specified intervals.
Quality Analysis Measuring and Reporting on Performance
2015 User Satisfaction Surveys and number of passengers and rides within the specified intervals will be analysed.
EF
FEC
TIV
EN
ESS
AC and ventilation systems within the vehicles are operating sufficiently.
User complaint rate
User Satisfaction Surveys
Quality Analysis
2015 User Satisfaction Surveys will be analysed.
EF
FEC
TIV
ENE
SS
Vehicles are cleaned properly (seats, handles and other equipment)
User complaint rate
User Satisfaction Surveys
Quality Analysis Measuring and Reporting on Performance
2015 User Satisfaction Surveys will be analysed.
EF
FEC
TIV
EN
ESS
Sound/noise level and mechanical shock level within the vehicles are below the maximum limit.
Maximum noise level within the bus
User Satisfaction Surveys
Quality Analysis
2015 User Satisfaction Surveys will be analysed.
Kam
u İç
Den
etçi
leri
İçin
Per
form
ans
Den
etim
i Reh
ber
i (V
aka
Çal
ışm
alar
ı)
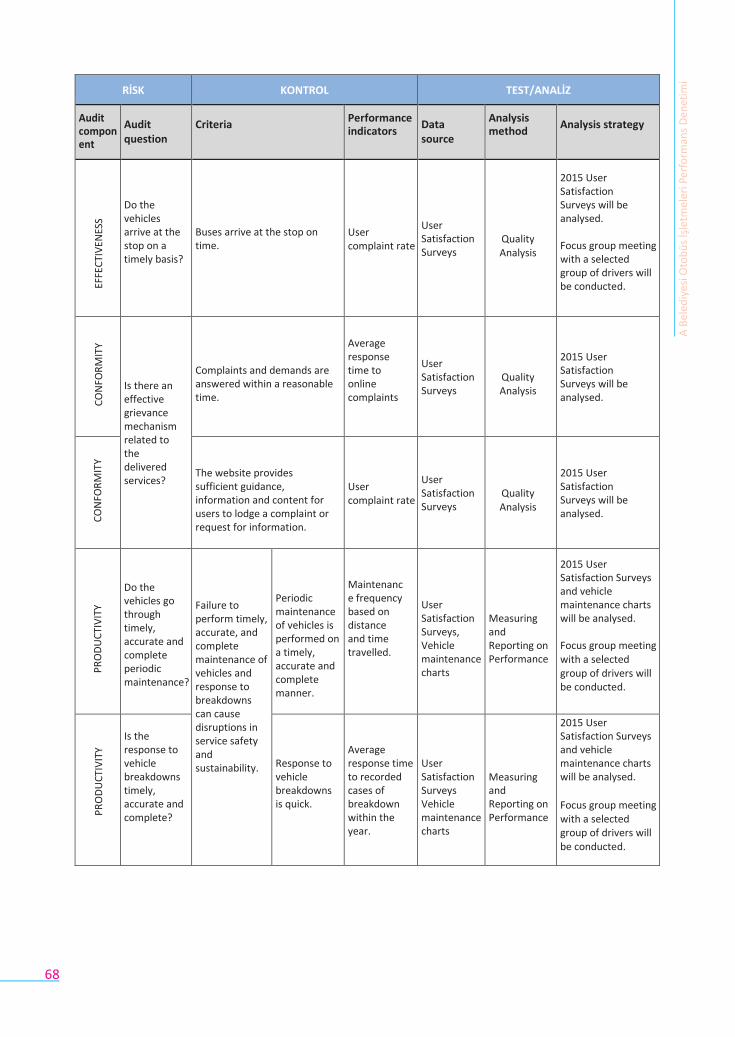
68
RİSK KONTROL TEST/ANALİZ
Audit component
Audit question
Criteria Performance indicators
Data source
Analysis method
Analysis strategy
E
FFEC
TIV
ENES
S
Do the vehicles arrive at the stop on a timely basis?
Buses arrive at the stop on time.
User complaint rate
User Satisfaction Surveys
Quality Analysis
2015 User Satisfaction Surveys will be analysed.
Focus group meeting with a selected group of drivers will be conducted.
C
ON
FOR
MIT
Y
Is there an effective grievance mechanism related to the delivered services?
Complaints and demands are answered within a reasonable time.
Average response time to online complaints
User Satisfaction Surveys
Quality Analysis
2015 User Satisfaction Surveys will be analysed.
C
ON
FOR
MIT
Y
The website provides sufficient guidance, information and content for users to lodge a complaint or request for information.
User complaint rate
User Satisfaction Surveys
Quality Analysis
2015 User Satisfaction Surveys will be analysed.
P
RO
DU
CTI
VIT
Y
Do the vehicles go through timely, accurate and complete periodic maintenance?
Failure to perform timely, accurate, and complete maintenance of vehicles and response to breakdowns can cause disruptions in service safety and sustainability.
Periodic maintenance of vehicles is performed on a timely, accurate and complete manner.
Maintenance frequency based on distance and time travelled.
User Satisfaction Surveys, Vehicle maintenance charts
Measuring and Reporting on Performance
2015 User Satisfaction Surveys and vehicle maintenance charts will be analysed.
Focus group meeting with a selected group of drivers will be conducted.
P
RO
DU
CTI
VIT
Y
Is the response to vehicle breakdowns timely, accurate and complete?
Response to vehicle breakdowns is quick.
Average response time to recorded cases of breakdown within the year.
User Satisfaction Surveys Vehicle maintenance charts
Measuring and Reporting on Performance
2015 User Satisfaction Surveys and vehicle maintenance charts will be analysed.
Focus group meeting with a selected group of drivers will be conducted.
A B
eled
iyes
i Oto
bü
s İş
letm
eler
i Per
form
ans
Den
etim
i
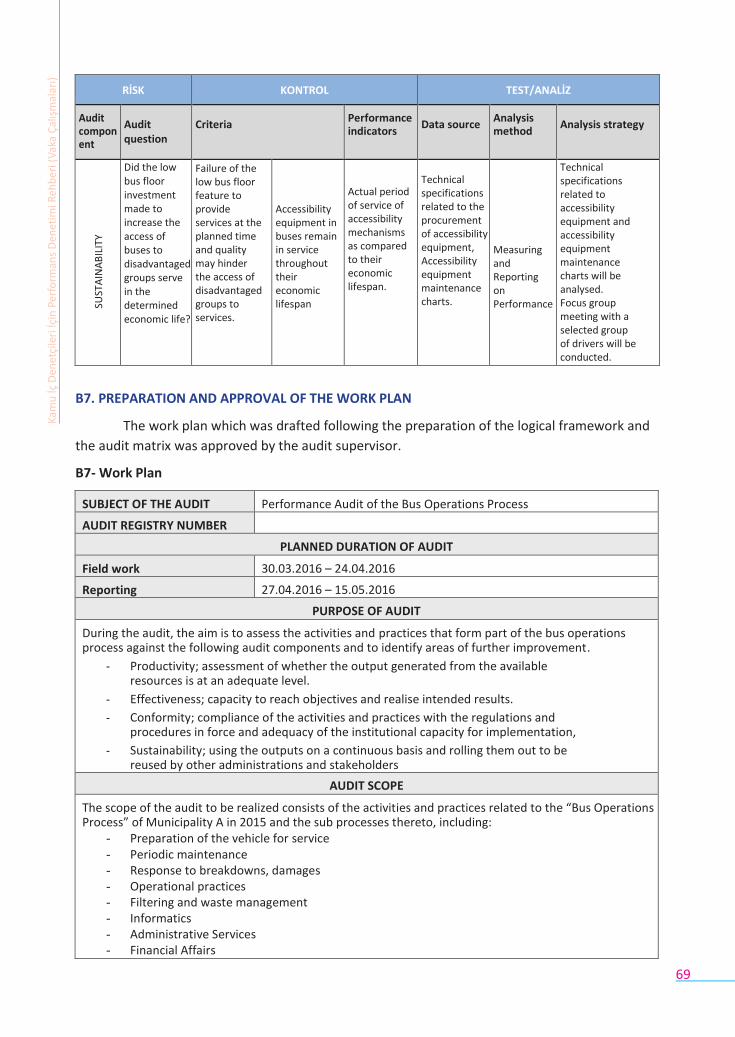
69
RİSK KONTROL TEST/ANALİZ
Audit component
Audit question
Criteria Performance indicators
Data source Analysis method
Analysis strategy
SU
STA
INA
BIL
ITY
Did the low bus floor investment made to increase the access of buses to disadvantaged groups serve in the determined economic life?
Failure of the low bus floor feature to provide services at the planned time and quality may hinder the access of disadvantaged groups to services.
Accessibility equipment in buses remain in service throughout their economic lifespan
Actual period of service of accessibility mechanisms as compared to their economic lifespan.
Technical specifications related to the procurement of accessibility equipment, Accessibility equipment maintenance charts.
Measuring and Reporting on Performance
Technical specifications related to accessibility equipment and accessibility equipment maintenance charts will be analysed. Focus group meeting with a selected group of drivers will be conducted.
B7. PREPARATION AND APPROVAL OF THE WORK PLAN
The work plan which was drafted following the preparation of the logical framework and
the audit matrix was approved by the audit supervisor.
B7- Work Plan
SUBJECT OF THE AUDIT Performance Audit of the Bus Operations Process
AUDIT REGISTRY NUMBER
PLANNED DURATION OF AUDIT
Field work 30.03.2016 – 24.04.2016
Reporting 27.04.2016 – 15.05.2016
PURPOSE OF AUDIT
During the audit, the aim is to assess the activities and practices that form part of the bus operations process against the following audit components and to identify areas of further improvement.
- Productivity; assessment of whether the output generated from the available resources is at an adequate level.
- Effectiveness; capacity to reach objectives and realise intended results.
- Conformity; compliance of the activities and practices with the regulations and procedures in force and adequacy of the institutional capacity for implementation,
- Sustainability; using the outputs on a continuous basis and rolling them out to be reused by other administrations and stakeholders
AUDIT SCOPE
The scope of the audit to be realized consists of the activities and practices related to the “Bus Operations Process” of Municipality A in 2015 and the sub processes thereto, including:
- Preparation of the vehicle for service - Periodic maintenance - Response to breakdowns, damages - Operational practices - Filtering and waste management - Informatics - Administrative Services - Financial Affairs
Kam
u İç
Den
etçi
leri
İçin
Per
form
ans
Den
etim
i Reh
ber
i (V
aka
Çal
ışm
alar
ı)
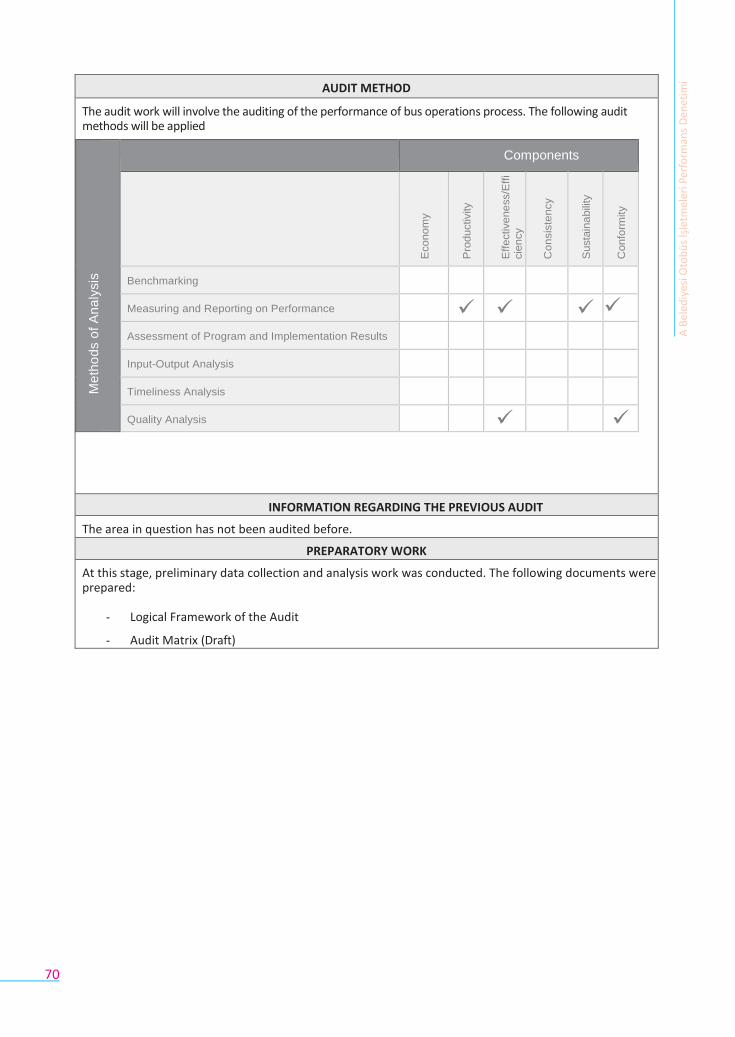
70
AUDIT METHOD
The audit work will involve the auditing of the performance of bus operations process. The following audit methods will be applied
Me
tho
ds o
f A
na
lysis
Components
Econom
y
Pro
ductivity
E
ffectivene
ss/E
ffi
cie
ncy
C
on
sis
ten
cy
Susta
ina
bili
ty
Confo
rmity
Benchmarking
Measuring and Reporting on Performance
Assessment of Program and Implementation Results
Input-Output Analysis
Timeliness Analysis
Quality Analysis
INFORMATION REGARDING THE PREVIOUS AUDIT
The area in question has not been audited before.
PREPARATORY WORK
At this stage, preliminary data collection and analysis work was conducted. The following documents were prepared:
- Logical Framework of the Audit
- Audit Matrix (Draft)
A B
eled
iyes
i Oto
bü
s İş
letm
eler
i Per
form
ans
Den
etim
i
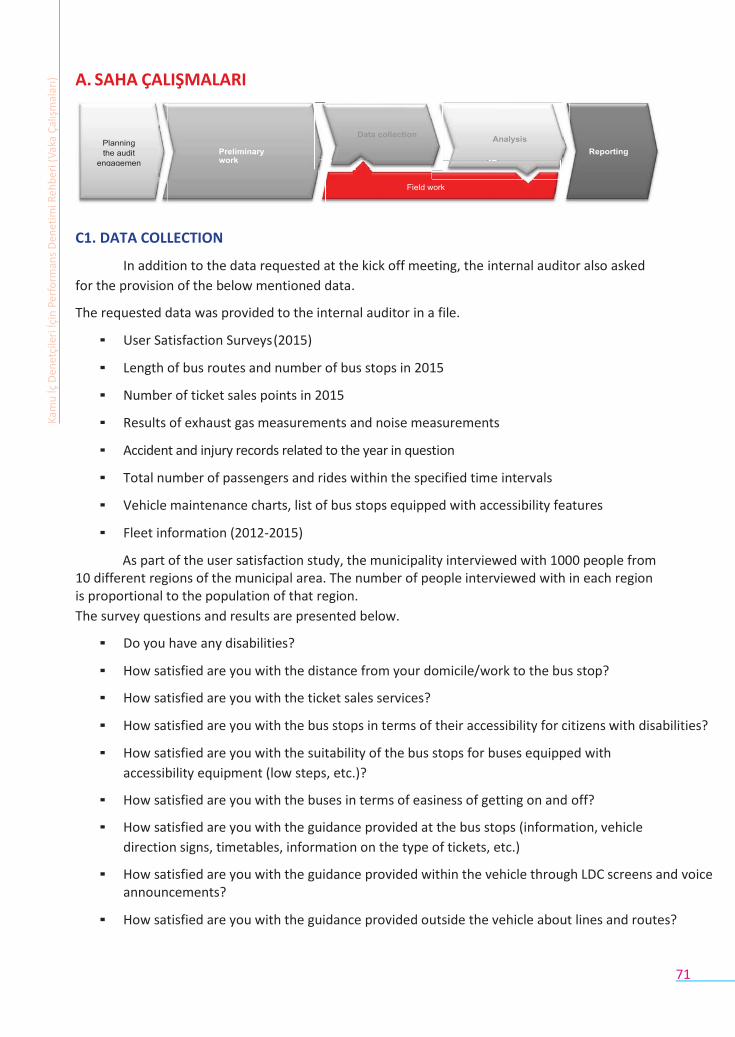
71
A. SAHA ÇALIŞMALARI
C1. DATA COLLECTION
In addition to the data requested at the kick off meeting, the internal auditor also asked
for the provision of the below mentioned data.
The requested data was provided to the internal auditor in a file.
▪ User Satisfaction Surveys (2015)
▪ Length of bus routes and number of bus stops in 2015
▪ Number of ticket sales points in 2015
▪ Results of exhaust gas measurements and noise measurements
▪ Accident and injury records related to the year in question
▪ Total number of passengers and rides within the specified time intervals
▪ Vehicle maintenance charts, list of bus stops equipped with accessibility features
▪ Fleet information (2012-2015)
As part of the user satisfaction study, the municipality interviewed with 1000 people from 10 different regions of the municipal area. The number of people interviewed with in each region is proportional to the population of that region.
The survey questions and results are presented below.
▪ Do you have any disabilities?
▪ How satisfied are you with the distance from your domicile/work to the bus stop?
▪ How satisfied are you with the ticket sales services?
▪ How satisfied are you with the bus stops in terms of their accessibility for citizens with disabilities?
▪ How satisfied are you with the suitability of the bus stops for buses equipped with
accessibility equipment (low steps, etc.)?
▪ How satisfied are you with the buses in terms of easiness of getting on and off?
▪ How satisfied are you with the guidance provided at the bus stops (information, vehicle
direction signs, timetables, information on the type of tickets, etc.)
▪ How satisfied are you with the guidance provided within the vehicle through LDC screens and voice announcements?
▪ How satisfied are you with the guidance provided outside the vehicle about lines and routes?
Kam
u İç
Den
etçi
leri
İçin
Per
form
ans
Den
etim
i Reh
ber
i (V
aka
Çal
ışm
alar
ı)
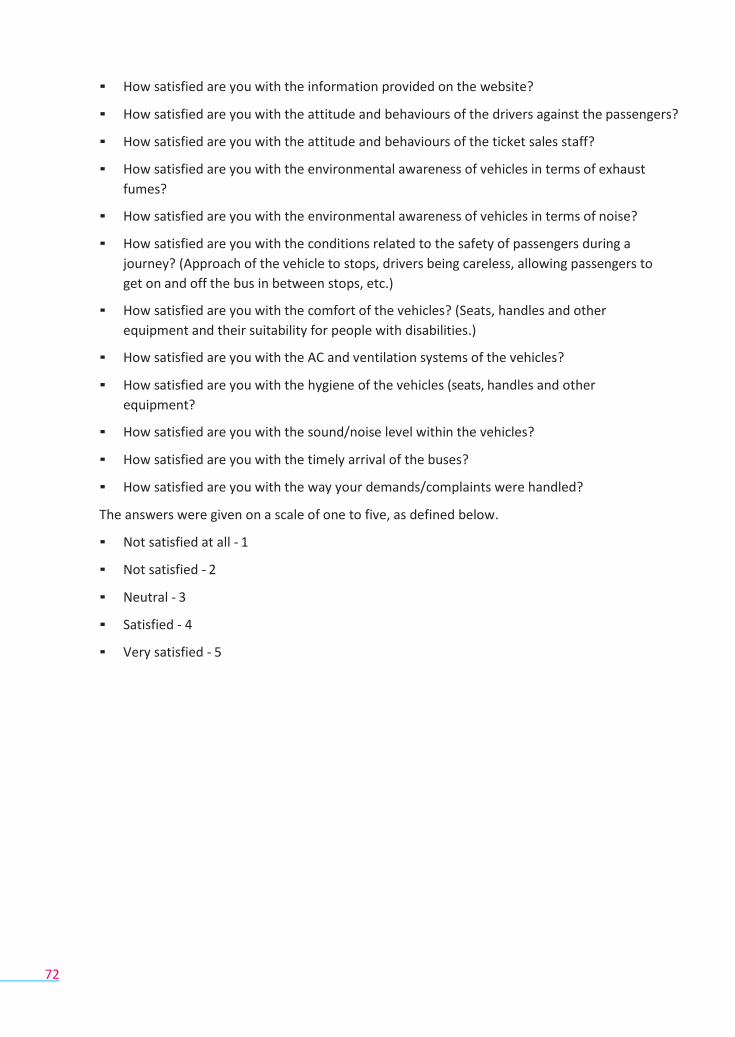
72
▪ How satisfied are you with the information provided on the website?
▪ How satisfied are you with the attitude and behaviours of the drivers against the passengers?
▪ How satisfied are you with the attitude and behaviours of the ticket sales staff?
▪ How satisfied are you with the environmental awareness of vehicles in terms of exhaust
fumes?
▪ How satisfied are you with the environmental awareness of vehicles in terms of noise?
▪ How satisfied are you with the conditions related to the safety of passengers during a
journey? (Approach of the vehicle to stops, drivers being careless, allowing passengers to
get on and off the bus in between stops, etc.)
▪ How satisfied are you with the comfort of the vehicles? (Seats, handles and other
equipment and their suitability for people with disabilities.)
▪ How satisfied are you with the AC and ventilation systems of the vehicles?
▪ How satisfied are you with the hygiene of the vehicles (seats, handles and other
equipment?
▪ How satisfied are you with the sound/noise level within the vehicles?
▪ How satisfied are you with the timely arrival of the buses?
▪ How satisfied are you with the way your demands/complaints were handled?
The answers were given on a scale of one to five, as defined below.
▪ Not satisfied at all - 1
▪ Not satisfied - 2
▪ Neutral - 3
▪ Satisfied - 4
▪ Very satisfied - 5

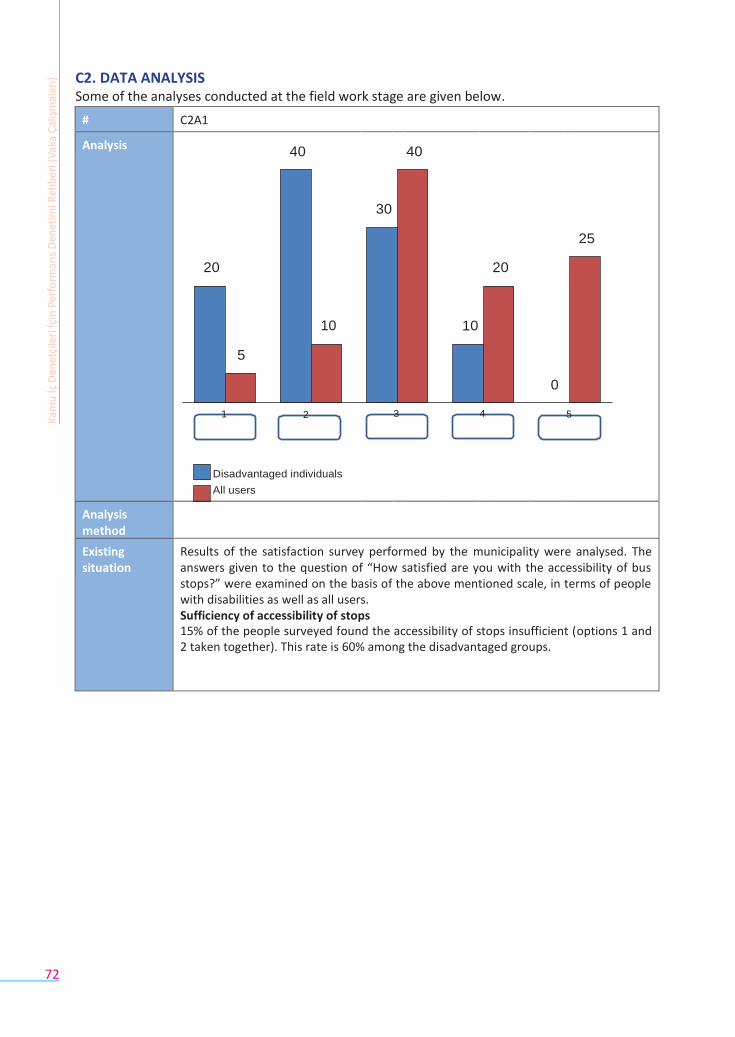
72
C2. DATA ANALYSIS Some of the analyses conducted at the field work stage are given below.
# C2A1
Analysis 40
20
10
5
1 2
Disadvantaged individuals
All users
30
3
40
10
4
20
0
5
25
Analysis method
Existing situation
Results of the satisfaction survey performed by the municipality were analysed. The answers given to the question of “How satisfied are you with the accessibility of bus stops?” were examined on the basis of the above mentioned scale, in terms of people with disabilities as well as all users. Sufficiency of accessibility of stops 15% of the people surveyed found the accessibility of stops insufficient (options 1 and 2 taken together). This rate is 60% among the disadvantaged groups.
Kam
u İç
Den
etçi
leri
İçin
Per
form
ans
Den
etim
i Reh
ber
i (V
aka
Çal
ışm
alar
ı)
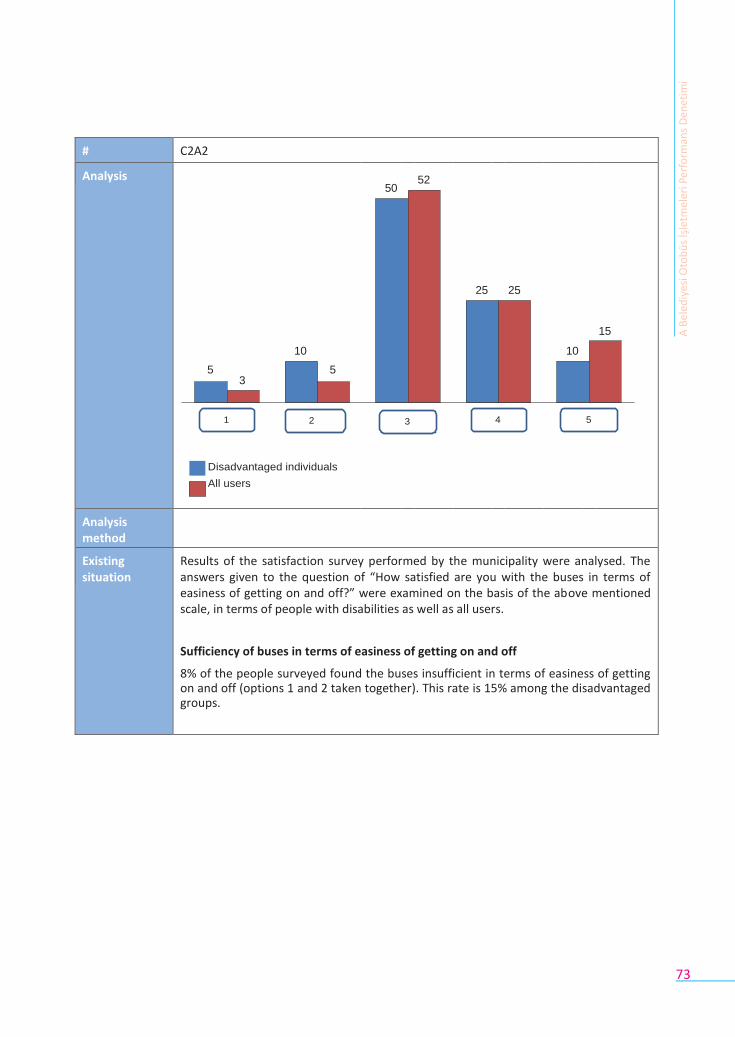
73
# C2A2
Analysis
10
5 5 3
1 2
Disadvantaged individuals
All users
50
3
52
25
4
25
10
5
15
Analysis method
Existing situation
Results of the satisfaction survey performed by the municipality were analysed. The answers given to the question of “How satisfied are you with the buses in terms of easiness of getting on and off?” were examined on the basis of the above mentioned scale, in terms of people with disabilities as well as all users.
Sufficiency of buses in terms of easiness of getting on and off
8% of the people surveyed found the buses insufficient in terms of easiness of getting on and off (options 1 and 2 taken together). This rate is 15% among the disadvantaged groups.
A B
eled
iyes
i Oto
bü
s İş
letm
eler
i Per
form
ans
Den
etim
i
74
# C2A3
Analysis
15 10
5 0
1 2
Disadvantaged individuals
All users
70
3
85
10
4
5
0
5
0
Analysis method
Existing situation
Results of the satisfaction survey performed by the municipality were analysed. The answers given to the question of “How satisfied are you with the information provided on the website of the municipality?” were examined on the basis of the above mentioned scale, in terms of people with disabilities as well as all users.
Sufficiency of information provided on the website about the bus stops and timetables.
85% of the people surveyed picked option 3 as their answer to this question. The explanations show that people in this group are either not aware of the online services delivered by the municipality or do not use the website. Level of dissatisfaction among the disadvantaged group is 20%.
Kam
u İç
Den
etçi
leri
İçin
Per
form
ans
Den
etim
i Reh
ber
i (V
aka
Çal
ışm
alar
ı)
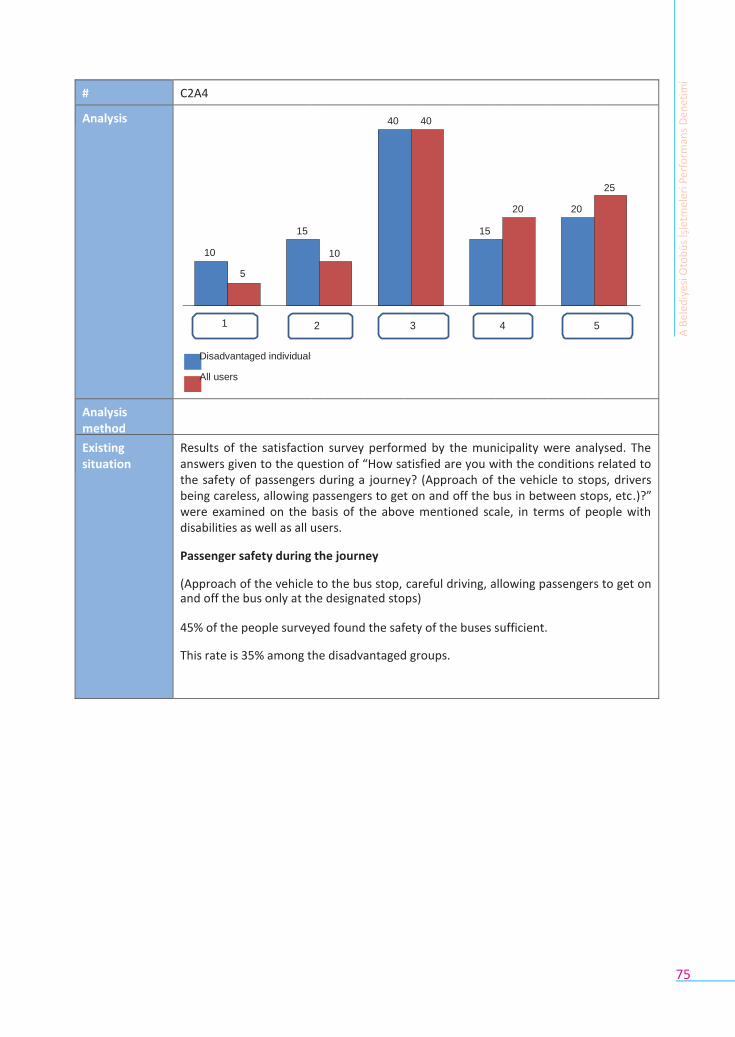
75
# C2A4
Analysis
15
10
5
1
Disadvantaged individuals
All users
2
10
40
3
40
15
4
20
20
5
25
Analysis method
Existing situation
Results of the satisfaction survey performed by the municipality were analysed. The answers given to the question of “How satisfied are you with the conditions related to the safety of passengers during a journey? (Approach of the vehicle to stops, drivers being careless, allowing passengers to get on and off the bus in between stops, etc.)?” were examined on the basis of the above mentioned scale, in terms of people with disabilities as well as all users.
Passenger safety during the journey
(Approach of the vehicle to the bus stop, careful driving, allowing passengers to get on and off the bus only at the designated stops) 45% of the people surveyed found the safety of the buses sufficient.
This rate is 35% among the disadvantaged groups.
A B
eled
iyes
i Oto
bü
s İş
letm
eler
i Per
form
ans
Den
etim
i
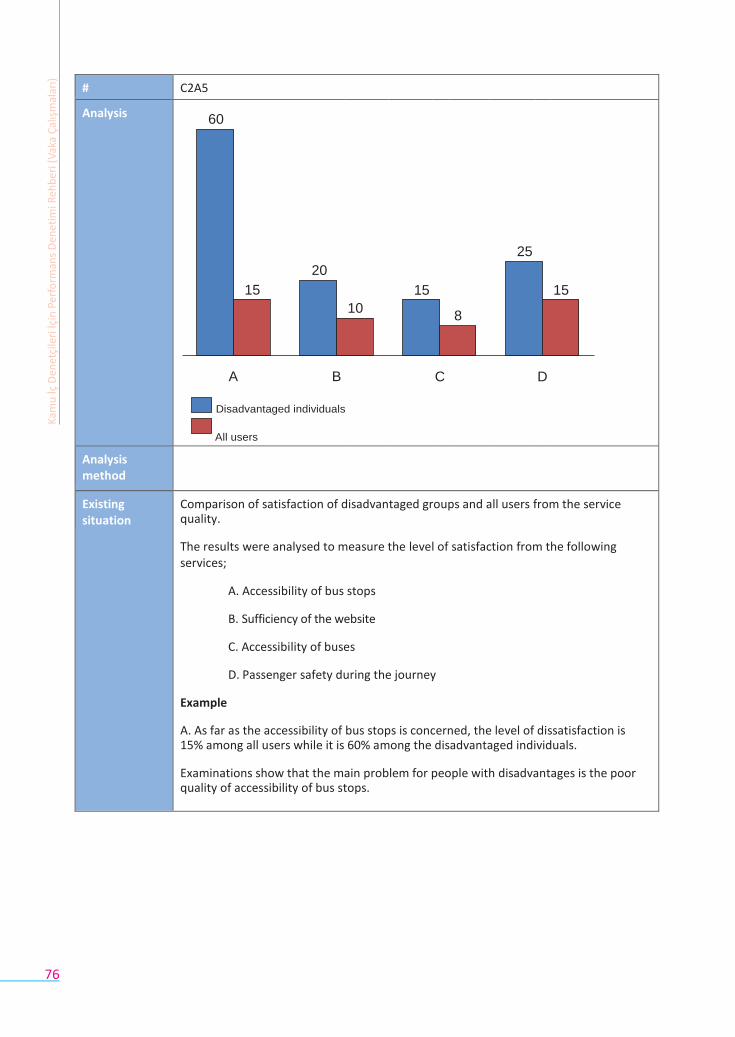
76
# C2A5
Analysis 60
20
15
A B
Disadvantaged individuals
All users
10
15
C
8
25
D
15
Analysis method
Existing situation
Comparison of satisfaction of disadvantaged groups and all users from the service quality.
The results were analysed to measure the level of satisfaction from the following services;
A. Accessibility of bus stops
B. Sufficiency of the website
C. Accessibility of buses
D. Passenger safety during the journey
Example
A. As far as the accessibility of bus stops is concerned, the level of dissatisfaction is 15% among all users while it is 60% among the disadvantaged individuals.
Examinations show that the main problem for people with disadvantages is the poor quality of accessibility of bus stops.
Kam
u İç
Den
etçi
leri
İçin
Per
form
ans
Den
etim
i Reh
ber
i (V
aka
Çal
ışm
alar
ı)
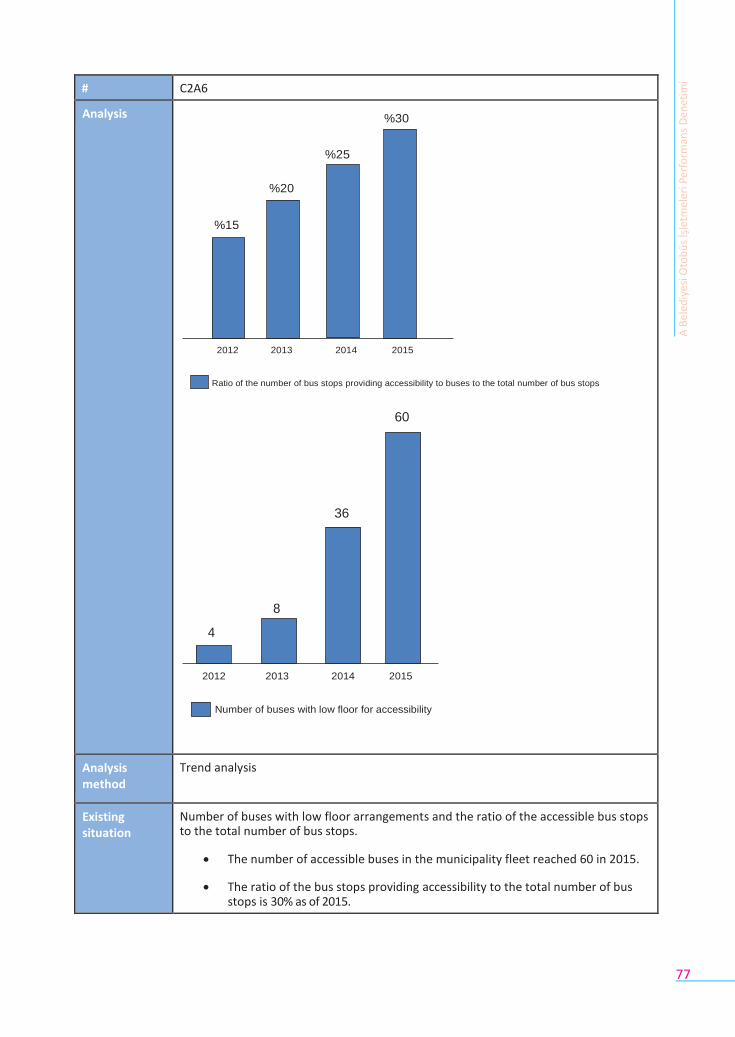
77
# C2A6
Analysis %30
%25
%20
%15
2012 2013 2014 2015
Ratio of the number of bus stops providing accessibility to buses to the total number of bus stops
60
36
8
4
2012 2013 2014 2015
Number of buses with low floor for accessibility
Analysis method
Trend analysis
Existing situation
Number of buses with low floor arrangements and the ratio of the accessible bus stops to the total number of bus stops.
The number of accessible buses in the municipality fleet reached 60 in 2015.
The ratio of the bus stops providing accessibility to the total number of bus stops is 30% as of 2015.
A B
eled
iyes
i Oto
bü
s İş
letm
eler
i Per
form
ans
Den
etim
i
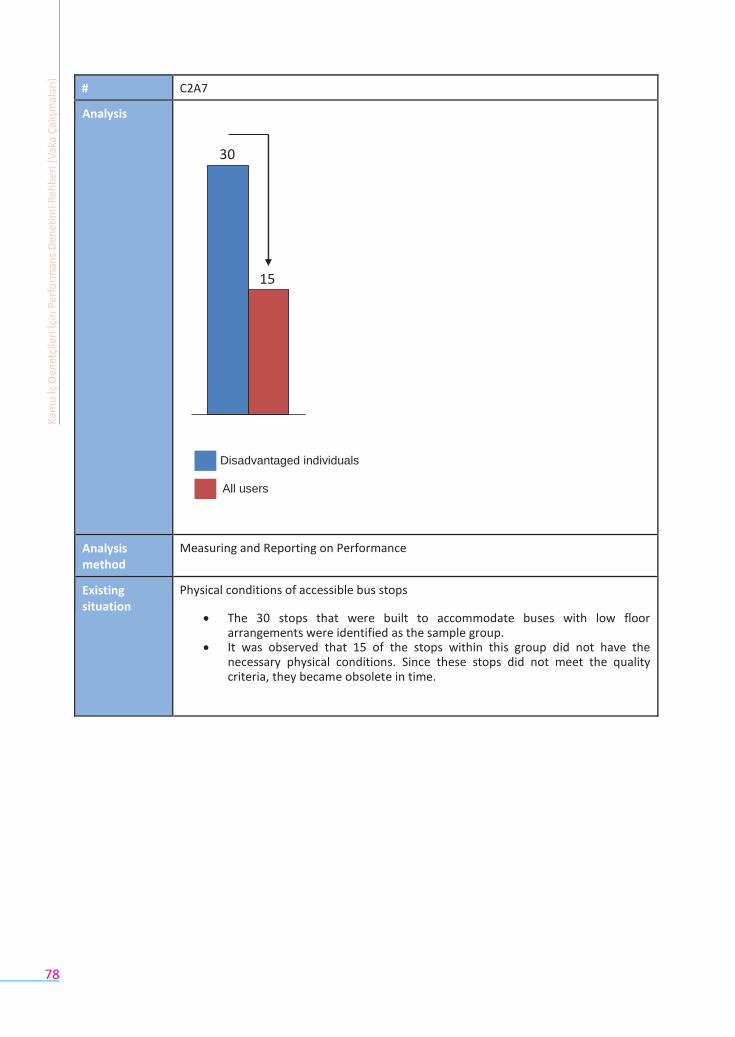
78
# C2A7
Analysis
30
15
Disadvantaged individuals
All users
Analysis method
Measuring and Reporting on Performance
Existing situation
Physical conditions of accessible bus stops
The 30 stops that were built to accommodate buses with low floor arrangements were identified as the sample group.
It was observed that 15 of the stops within this group did not have the necessary physical conditions. Since these stops did not meet the quality criteria, they became obsolete in time.
Kam
u İç
Den
etçi
leri
İçin
Per
form
ans
Den
etim
i Reh
ber
i (V
aka
Çal
ışm
alar
ı)
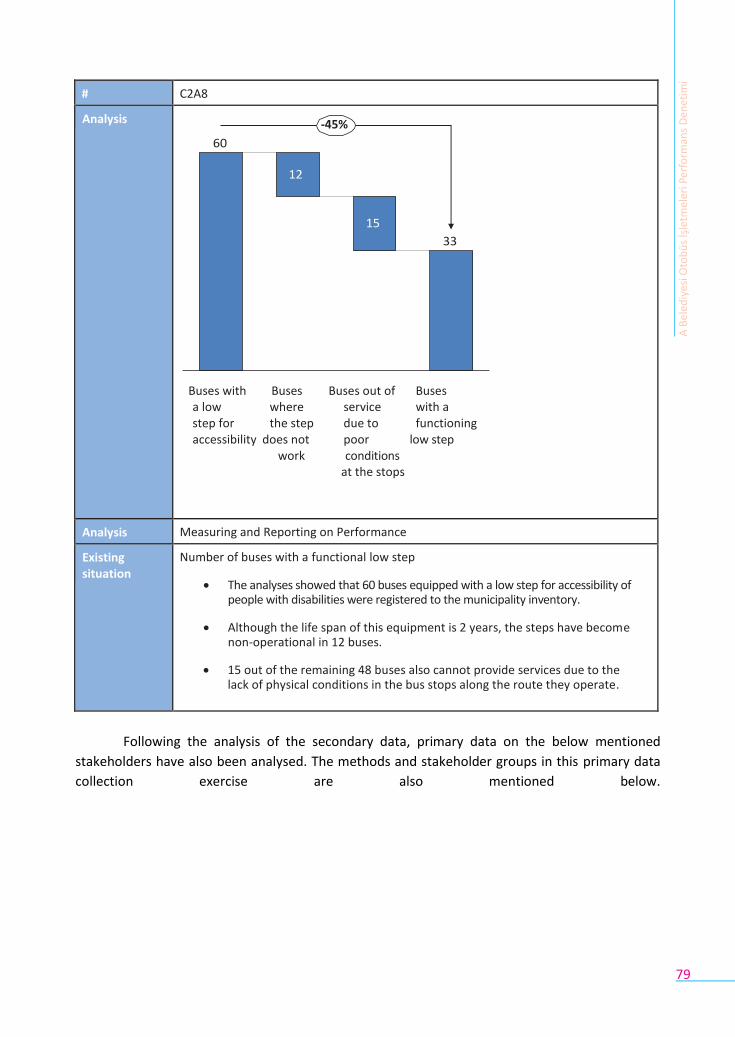
79
# C2A8
Analysis -45%
60
12
15
33
Buses with Buses Buses out of Buses a low where service with a step for the step due to functioning accessibility does not poor low step
work conditions at the stops
Analysis method
Measuring and Reporting on Performance
Existing situation
Number of buses with a functional low step
The analyses showed that 60 buses equipped with a low step for accessibility of people with disabilities were registered to the municipality inventory.
Although the life span of this equipment is 2 years, the steps have become non-operational in 12 buses.
15 out of the remaining 48 buses also cannot provide services due to the lack of physical conditions in the bus stops along the route they operate.
Following the analysis of the secondary data, primary data on the below mentioned
stakeholders have also been analysed. The methods and stakeholder groups in this primary data
collection exercise are also mentioned below.
A B
eled
iyes
i Oto
bü
s İş
letm
eler
i Per
form
ans
Den
etim
i
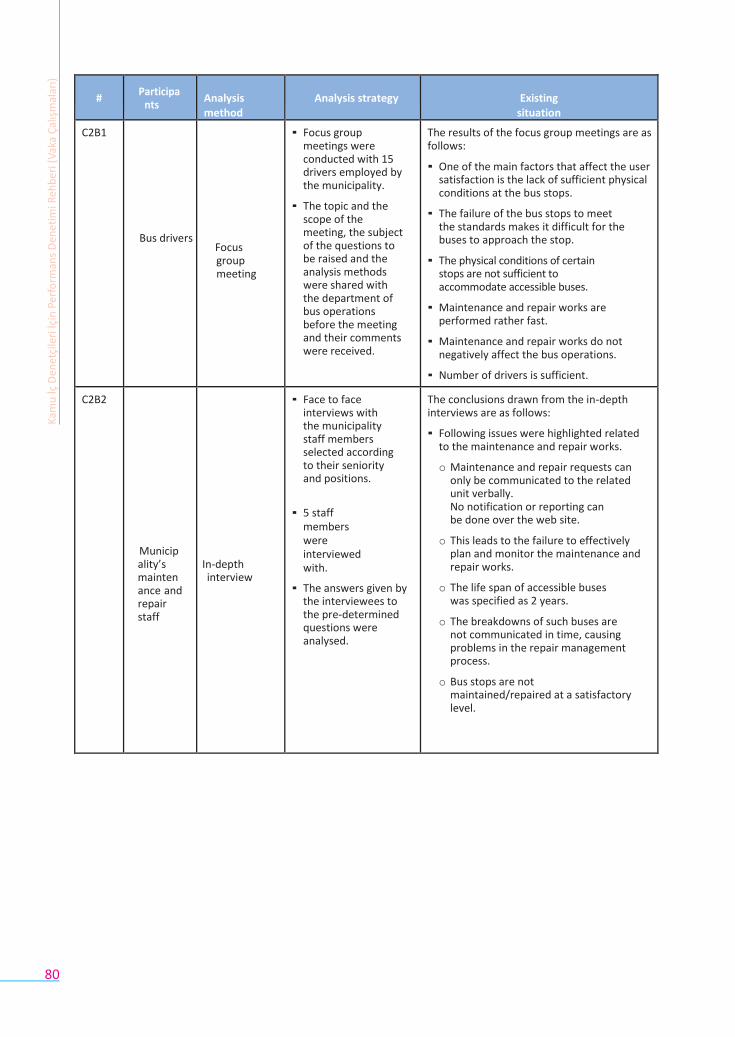
80
# Participa
nts
Analysis method
Analysis strategy
Existing situation
C2B1
Bus drivers
Focus group meeting
▪ Focus group meetings were conducted with 15 drivers employed by the municipality.
▪ The topic and the scope of the meeting, the subject of the questions to be raised and the analysis methods were shared with the department of bus operations before the meeting and their comments were received.
The results of the focus group meetings are as follows:
▪ One of the main factors that affect the user satisfaction is the lack of sufficient physical conditions at the bus stops.
▪ The failure of the bus stops to meet the standards makes it difficult for the buses to approach the stop.
▪ The physical conditions of certain stops are not sufficient to accommodate accessible buses.
▪ Maintenance and repair works are performed rather fast.
▪ Maintenance and repair works do not negatively affect the bus operations.
▪ Number of drivers is sufficient.
C2B2
Municipality’s maintenance and repair staff
In-depth interview
▪ Face to face interviews with the municipality staff members selected according to their seniority and positions.
▪ 5 staff members were interviewed with.
▪ The answers given by the interviewees to the pre-determined questions were analysed.
The conclusions drawn from the in-depth interviews are as follows:
▪ Following issues were highlighted related to the maintenance and repair works.
o Maintenance and repair requests can only be communicated to the related unit verbally. No notification or reporting can be done over the web site.
o This leads to the failure to effectively plan and monitor the maintenance and repair works.
o The life span of accessible buses was specified as 2 years.
o The breakdowns of such buses are not communicated in time, causing problems in the repair management process.
o Bus stops are not maintained/repaired at a satisfactory level.
Kam
u İç
Den
etçi
leri
İçin
Per
form
ans
Den
etim
i Reh
ber
i (V
aka
Çal
ışm
alar
ı)
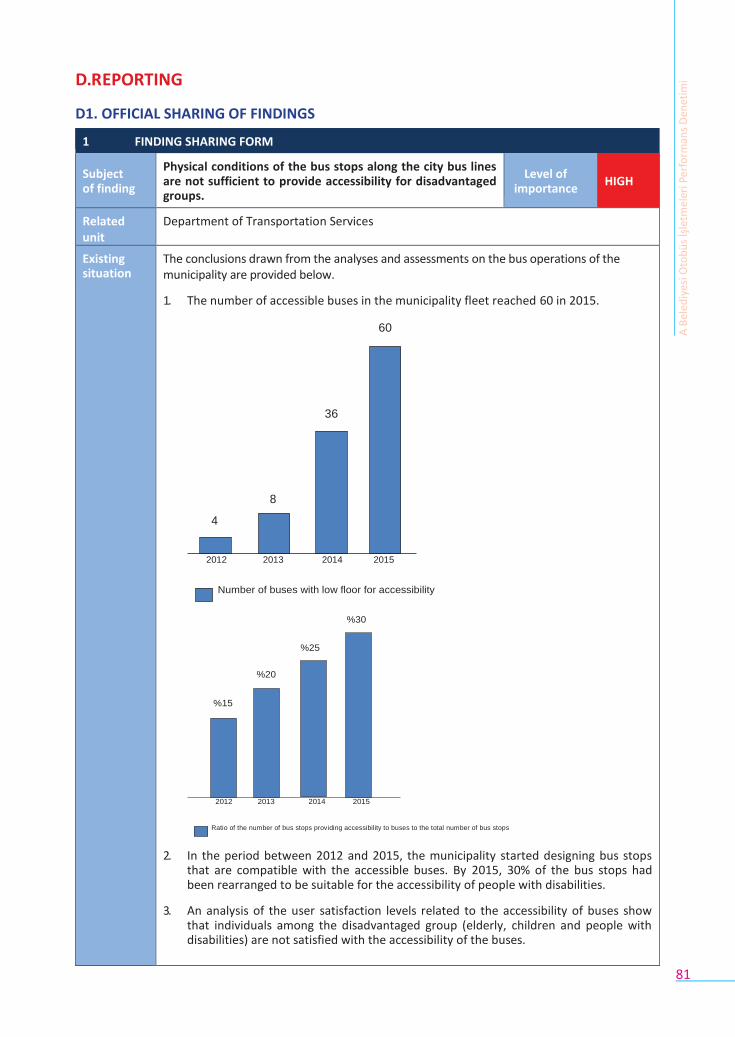
81
D.R EPORTING
D1. OFFICIAL SHARING OF FINDINGS
1 FINDING SHARING FORM
Subject of finding
Physical conditions of the bus stops along the city bus lines are not sufficient to provide accessibility for disadvantaged groups.
Level of importance
HIGH
Related unit
Department of Transportation Services
Existing situation
The conclusions drawn from the analyses and assessments on the bus operations of the municipality are provided below.
1. The number of accessible buses in the municipality fleet reached 60 in 2015.
60
36
8
4
2012 2013 2014 2015
Number of buses with low floor for accessibility
%30
%25
%20
%15
2012 2013 2014 2015
Ratio of the number of bus stops providing accessibility to buses to the total number of bus stops
2. In the period between 2012 and 2015, the municipality started designing bus stops that are compatible with the accessible buses. By 2015, 30% of the bus stops had been rearranged to be suitable for the accessibility of people with disabilities.
3. An analysis of the user satisfaction levels related to the accessibility of buses show that individuals among the disadvantaged group (elderly, children and people with disabilities) are not satisfied with the accessibility of the buses.
A B
eled
iyes
i Oto
bü
s İş
letm
eler
i Per
form
ans
Den
etim
i
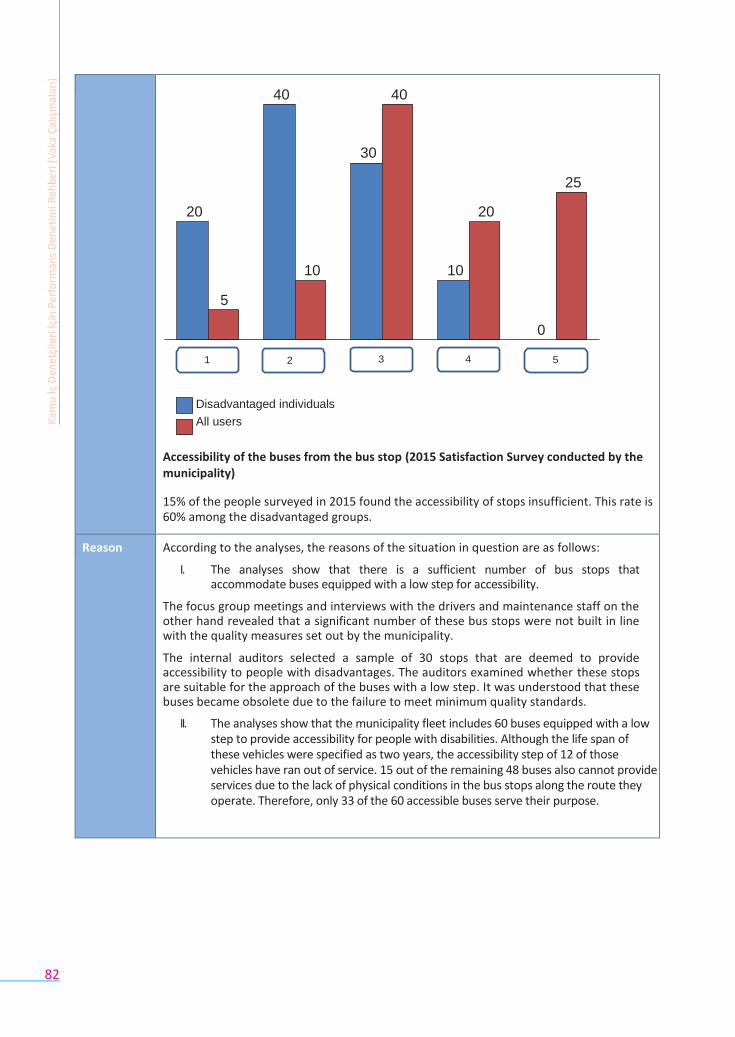
82
40 40
30
25
20 20
10 10
5
0
1 2 3 4 5
Disadvantaged individuals
All users
Accessibility of the buses from the bus stop (2015 Satisfaction Survey conducted by the municipality)
15% of the people surveyed in 2015 found the accessibility of stops insufficient. This rate is 60% among the disadvantaged groups.
Reason According to the analyses, the reasons of the situation in question are as follows:
I. The analyses show that there is a sufficient number of bus stops that accommodate buses equipped with a low step for accessibility.
The focus group meetings and interviews with the drivers and maintenance staff on the other hand revealed that a significant number of these bus stops were not built in line with the quality measures set out by the municipality.
The internal auditors selected a sample of 30 stops that are deemed to provide accessibility to people with disadvantages. The auditors examined whether these stops are suitable for the approach of the buses with a low step. It was understood that these buses became obsolete due to the failure to meet minimum quality standards.
II. The analyses show that the municipality fleet includes 60 buses equipped with a low step to provide accessibility for people with disabilities. Although the life span of these vehicles were specified as two years, the accessibility step of 12 of those vehicles have ran out of service. 15 out of the remaining 48 buses also cannot provide services due to the lack of physical conditions in the bus stops along the route they operate. Therefore, only 33 of the 60 accessible buses serve their purpose.
Kam
u İç
Den
etçi
leri
İçin
Per
form
ans
Den
etim
i Reh
ber
i (V
aka
Çal
ışm
alar
ı)
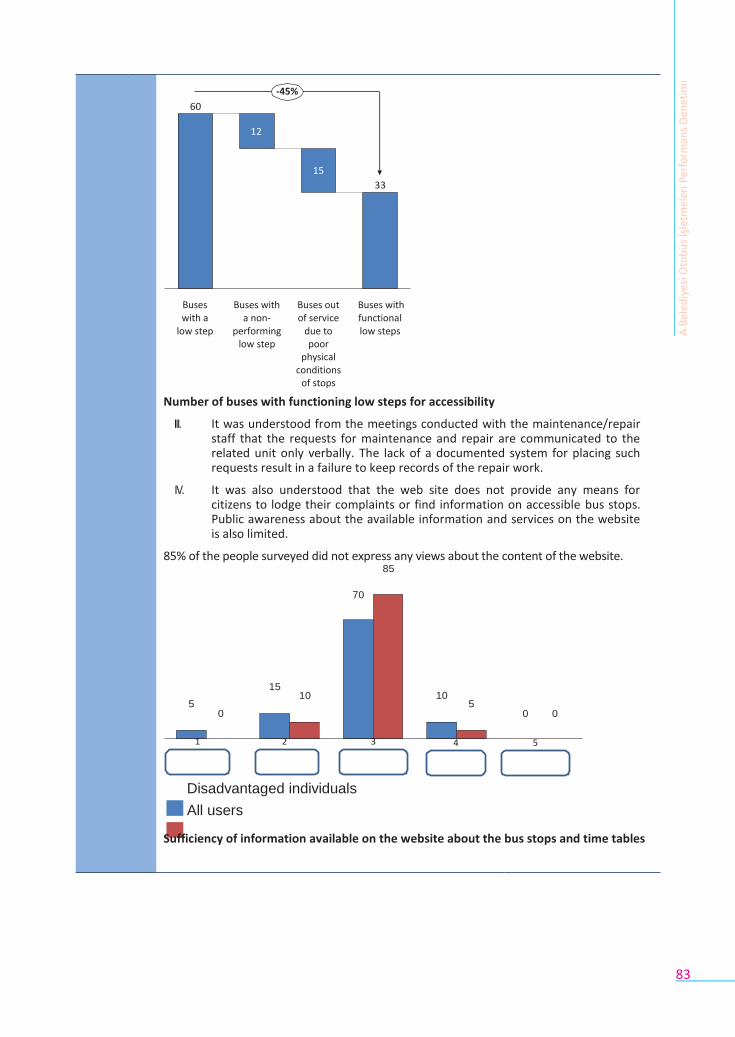
83
-45%
60
12
15
33
Buses with a
low step
Buses with a non-
performing low step
Buses out of service
due to poor
physical conditions
of stops
Buses with functional low steps
Number of buses with functioning low steps for accessibility
III. It was understood from the meetings conducted with the maintenance/repair staff that the requests for maintenance and repair are communicated to the related unit only verbally. The lack of a documented system for placing such requests result in a failure to keep records of the repair work.
IV. It was also understood that the web site does not provide any means for citizens to lodge their complaints or find information on accessible bus stops. Public awareness about the available information and services on the website is also limited.
85% of the people surveyed did not express any views about the content of the website.
85
70
15 10 10
5 5 0 0 0
1 2 3 4 5
Disadvantaged individuals
All users
Sufficiency of information available on the website about the bus stops and time tables
A B
eled
iyes
i Oto
bü
s İş
letm
eler
i Per
form
ans
Den
etim
i
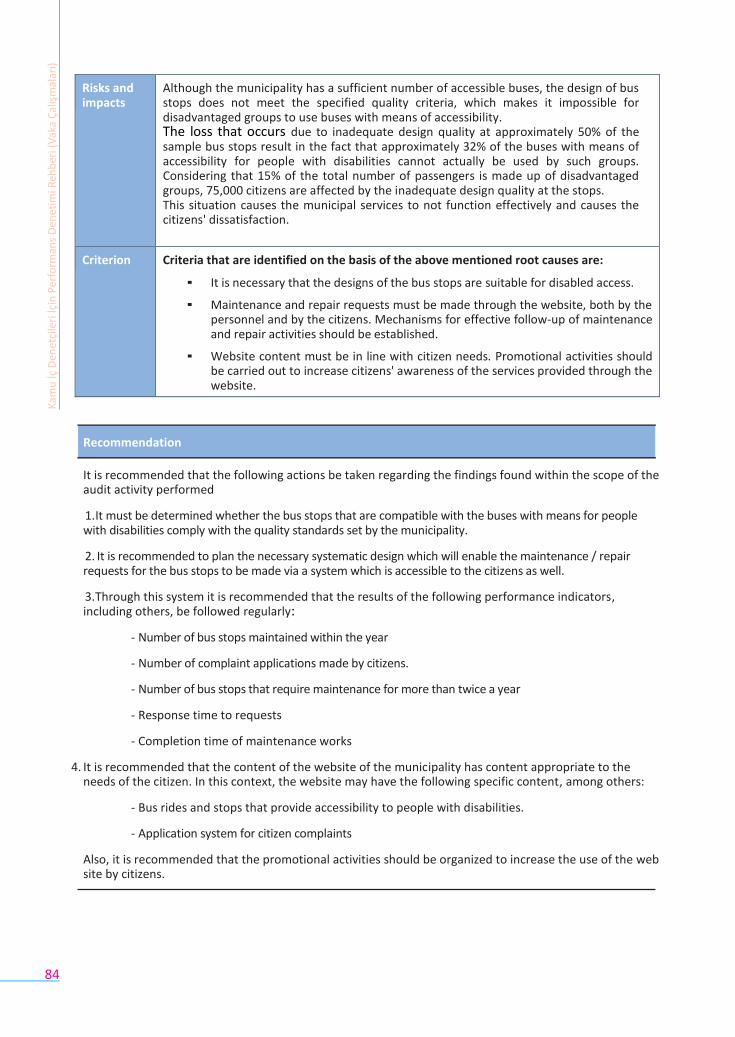
84
Risks and impacts
Although the municipality has a sufficient number of accessible buses, the design of bus stops does not meet the specified quality criteria, which makes it impossible for disadvantaged groups to use buses with means of accessibility. The loss that occurs due to inadequate design quality at approximately 50% of the sample bus stops result in the fact that approximately 32% of the buses with means of accessibility for people with disabilities cannot actually be used by such groups. Considering that 15% of the total number of passengers is made up of disadvantaged groups, 75,000 citizens are affected by the inadequate design quality at the stops. This situation causes the municipal services to not function effectively and causes the citizens' dissatisfaction.
Criterion Criteria that are identified on the basis of the above mentioned root causes are:
▪ It is necessary that the designs of the bus stops are suitable for disabled access.
▪ Maintenance and repair requests must be made through the website, both by the personnel and by the citizens. Mechanisms for effective follow-up of maintenance and repair activities should be established.
▪ Website content must be in line with citizen needs. Promotional activities should be carried out to increase citizens' awareness of the services provided through the website.
Recommendation
It is recommended that the following actions be taken regarding the findings found within the scope of the audit activity performed
1. It must be determined whether the bus stops that are compatible with the buses with means for people with disabilities comply with the quality standards set by the municipality.
2. It is recommended to plan the necessary systematic design which will enable the maintenance / repair requests for the bus stops to be made via a system which is accessible to the citizens as well.
3. Through this system it is recommended that the results of the following performance indicators, including others, be followed regularly:
- Number of bus stops maintained within the year
- Number of complaint applications made by citizens.
- Number of bus stops that require maintenance for more than twice a year
- Response time to requests
- Completion time of maintenance works
4. It is recommended that the content of the website of the municipality has content appropriate to the needs of the citizen. In this context, the website may have the following specific content, among others:
- Bus rides and stops that provide accessibility to people with disabilities.
- Application system for citizen complaints
Also, it is recommended that the promotional activities should be organized to increase the use of the web site by citizens.
Kam
u İç
Den
etçi
leri
İçin
Per
form
ans
Den
etim
i Reh
ber
i (V
aka
Çal
ışm
alar
ı)
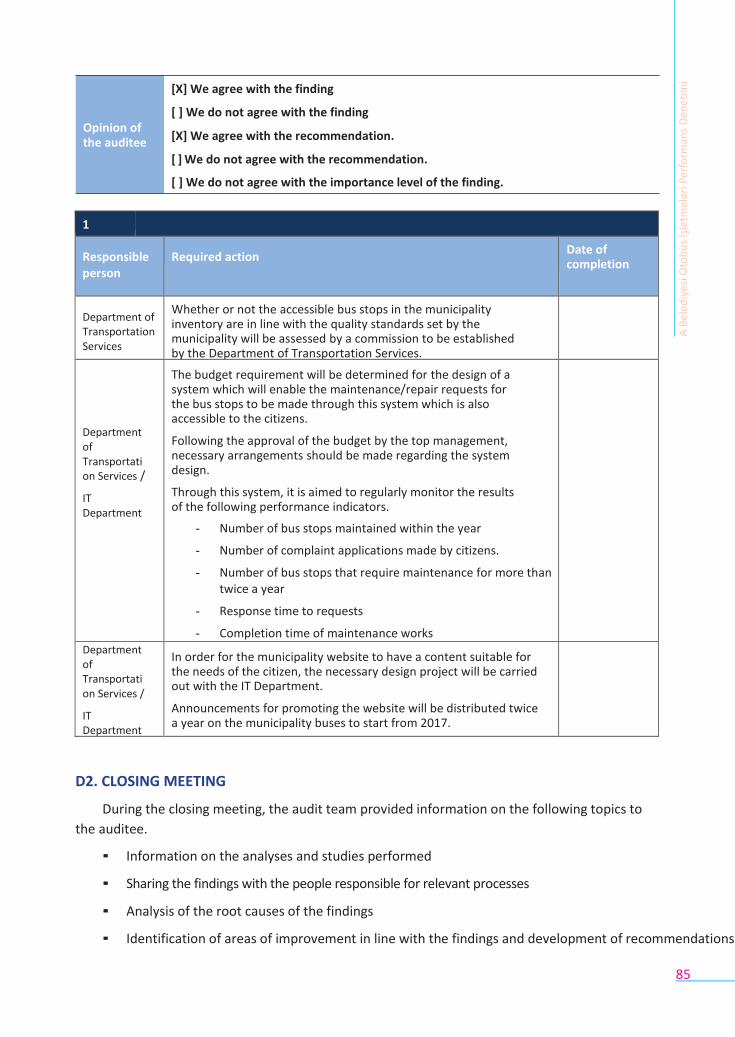
85
1
Responsible person
Required action Date of completion
Department of Transportation Services
Whether or not the accessible bus stops in the municipality inventory are in line with the quality standards set by the municipality will be assessed by a commission to be established by the Department of Transportation Services.
Department of Transportation Services /
IT Department
The budget requirement will be determined for the design of a system which will enable the maintenance/repair requests for the bus stops to be made through this system which is also accessible to the citizens.
Following the approval of the budget by the top management, necessary arrangements should be made regarding the system design.
Through this system, it is aimed to regularly monitor the results of the following performance indicators.
- Number of bus stops maintained within the year
- Number of complaint applications made by citizens.
- Number of bus stops that require maintenance for more than twice a year
- Response time to requests
- Completion time of maintenance works
-
Department of Transportation Services /
IT Department
In order for the municipality website to have a content suitable for the needs of the citizen, the necessary design project will be carried out with the IT Department.
Announcements for promoting the website will be distributed twice a year on the municipality buses to start from 2017.
D2. CLOSING MEETING
During the closing meeting, the audit team provided information on the following topics to
the auditee.
▪ Information on the analyses and studies performed
▪ Sharing the findings with the people responsible for relevant processes
▪ Analysis of the root causes of the findings
▪ Identification of areas of improvement in line with the findings and development of recommendations
Opinion of the auditee
[X] We agree with the finding
[ ] We do not agree with the finding
[X] We agree with the recommendation.
[ ] We do not agree with the recommendation.
[ ] We do not agree with the importance level of the finding.
A B
eled
iyes
i Oto
bü
s İş
letm
eler
i Per
form
ans
Den
etim
i
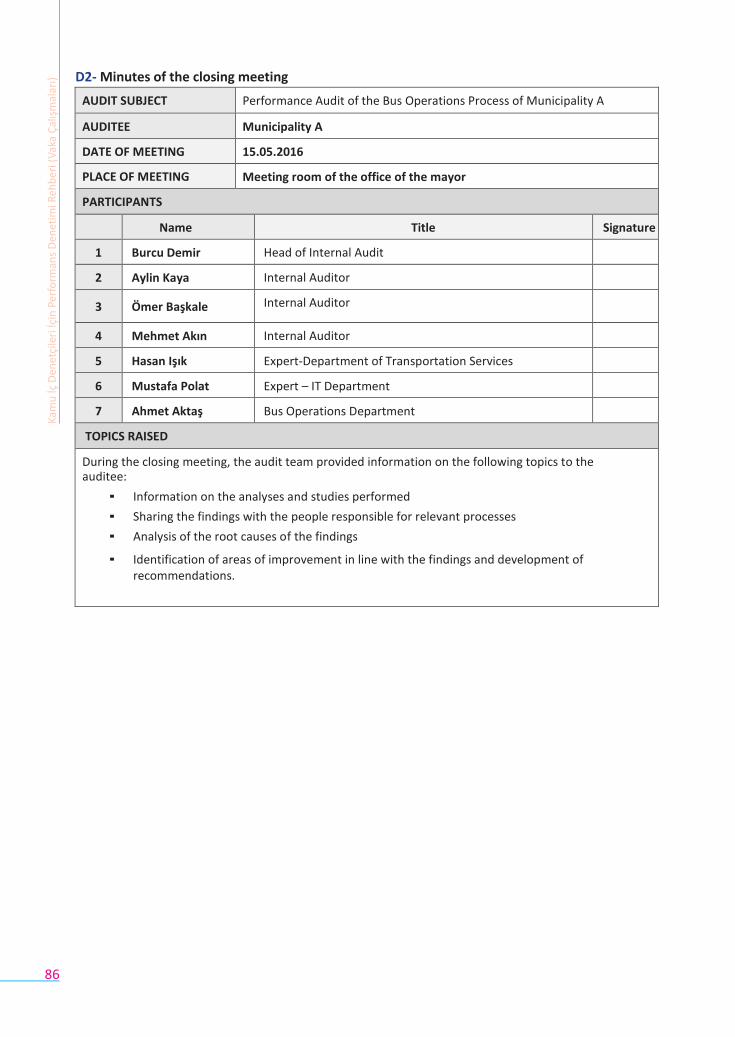
86
D2- Minutes of the closing meeting
AUDIT SUBJECT Performance Audit of the Bus Operations Process of Municipality A
AUDITEE Municipality A
DATE OF MEETING 15.05.2016
PLACE OF MEETING Meeting room of the office of the mayor
PARTICIPANTS
Name Title Signature
1 Burcu Demir Head of Internal Audit
2 Aylin Kaya Internal Auditor
3 Ömer Başkale Internal Auditor
4 Mehmet Akın Internal Auditor
5 Hasan Işık Expert-Department of Transportation Services
6 Mustafa Polat Expert – IT Department
7 Ahmet Aktaş Bus Operations Department
TOPICS RAISED
During the closing meeting, the audit team provided information on the following topics to the auditee:
▪ Information on the analyses and studies performed
▪ Sharing the findings with the people responsible for relevant processes
▪ Analysis of the root causes of the findings
▪ Identification of areas of improvement in line with the findings and development of recommendations.
Kam
u İç
Den
etçi
leri
İçin
Per
form
ans
Den
etim
i Reh
ber
i (V
aka
Çal
ışm
alar
ı)
87
Performance Audit of the Emergency Call Centre Management of Presidency A
The content used in case study is not associated with any organisation, practice or person.
The content developed is completely fictional.

88
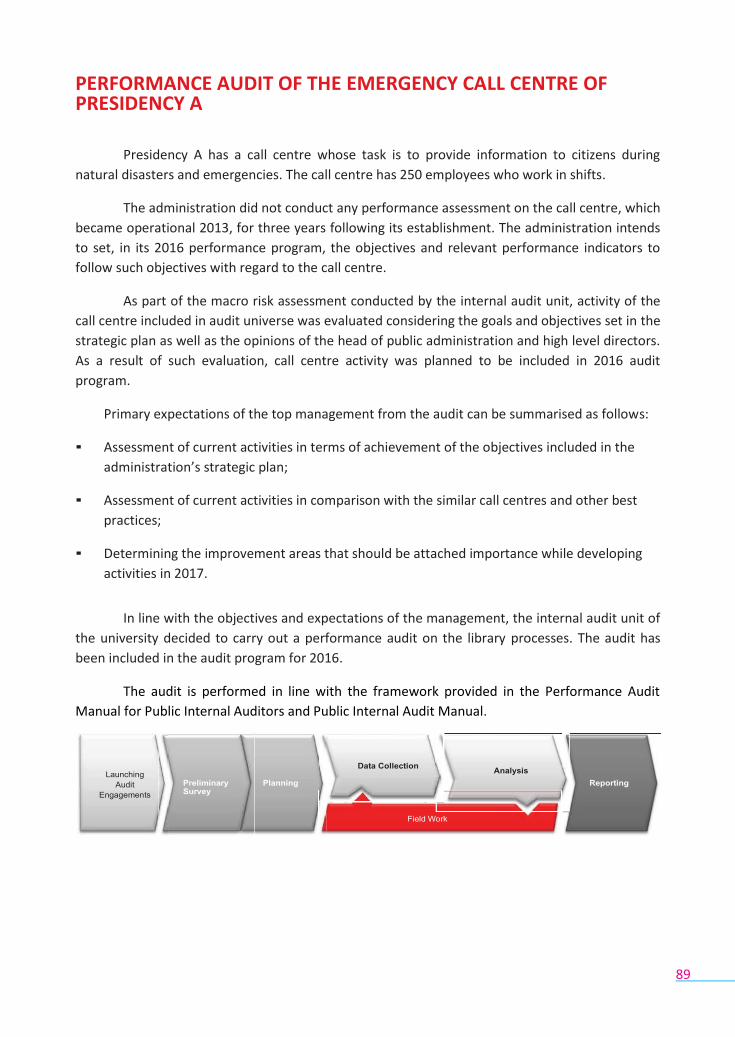
89
PERFORMANCE AUDIT OF THE EMERGENCY CALL CENTRE OF PRESIDENCY A
Presidency A has a call centre whose task is to provide information to citizens during
natural disasters and emergencies. The call centre has 250 employees who work in shifts.
The administration did not conduct any performance assessment on the call centre, which
became operational 2013, for three years following its establishment. The administration intends
to set, in its 2016 performance program, the objectives and relevant performance indicators to
follow such objectives with regard to the call centre.
As part of the macro risk assessment conducted by the internal audit unit, activity of the
call centre included in audit universe was evaluated considering the goals and objectives set in the
strategic plan as well as the opinions of the head of public administration and high level directors.
As a result of such evaluation, call centre activity was planned to be included in 2016 audit
program.
Primary expectations of the top management from the audit can be summarised as follows:
▪ Assessment of current activities in terms of achievement of the objectives included in the
administration’s strategic plan;
▪ Assessment of current activities in comparison with the similar call centres and other best
practices;
▪ Determining the improvement areas that should be attached importance while developing
activities in 2017.
In line with the objectives and expectations of the management, the internal audit unit of
the university decided to carry out a performance audit on the library processes. The audit has
been included in the audit program for 2016.
The audit is performed in line with the framework provided in the Performance Audit
Manual for Public Internal Auditors and Public Internal Audit Manual.
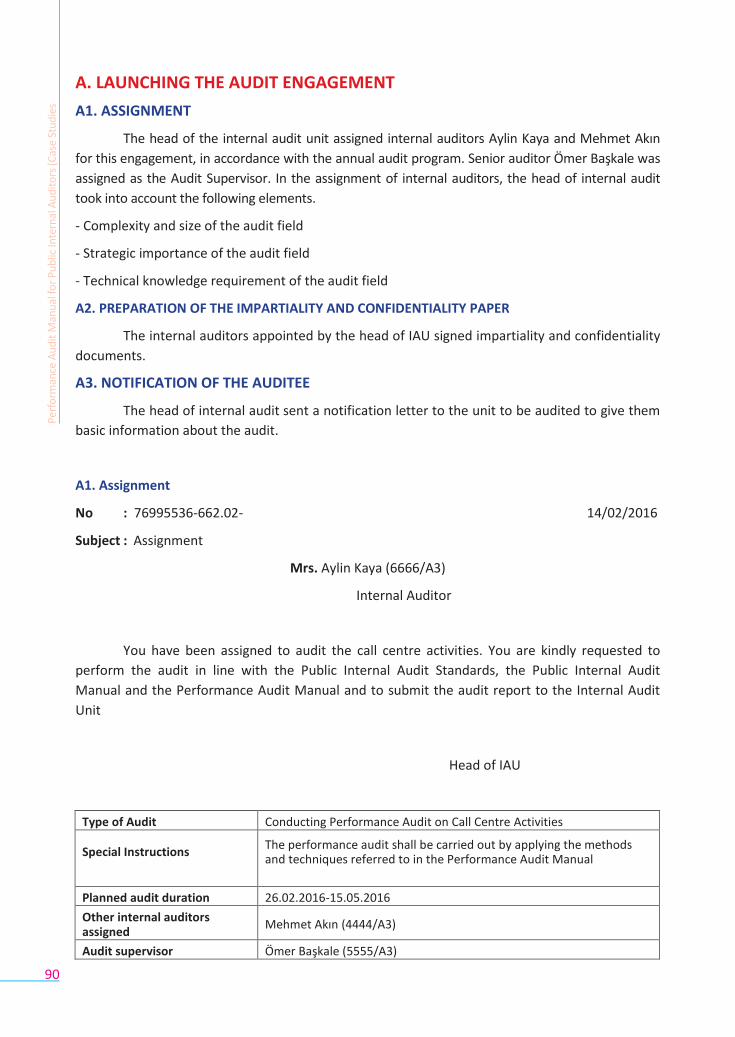
90
A. LAUNCHING THE AUDIT ENGAGEMENT
A1. ASSIGNMENT
The head of the internal audit unit assigned internal auditors Aylin Kaya and Mehmet Akın
for this engagement, in accordance with the annual audit program. Senior auditor Ömer Başkale was
assigned as the Audit Supervisor. In the assignment of internal auditors, the head of internal audit
took into account the following elements.
- Complexity and size of the audit field
- Strategic importance of the audit field
- Technical knowledge requirement of the audit field
A2. PREPARATION OF THE IMPARTIALITY AND CONFIDENTIALITY PAPER
The internal auditors appointed by the head of IAU signed impartiality and confidentiality
documents.
A3. NOTIFICATION OF THE AUDITEE
The head of internal audit sent a notification letter to the unit to be audited to give them
basic information about the audit.
A1. Assignment
No : 76995536-662.02- 14/02/2016
Subject : Assignment
Mrs. Aylin Kaya (6666/A3)
Internal Auditor
You have been assigned to audit the call centre activities. You are kindly requested to
perform the audit in line with the Public Internal Audit Standards, the Public Internal Audit
Manual and the Performance Audit Manual and to submit the audit report to the Internal Audit
Unit
Head of IAU
Type of Audit Conducting Performance Audit on Call Centre Activities
Special Instructions The performance audit shall be carried out by applying the methods and techniques referred to in the Performance Audit Manual
Planned audit duration 26.02.2016-15.05.2016
Other internal auditors assigned
Mehmet Akın (4444/A3)
Audit supervisor Ömer Başkale (5555/A3)
Per
form
ance
Au
dit
Man
ual
for
Pu
blic
Inte
rnal
Au
dit
ors
(Cas
e St
ud
ies
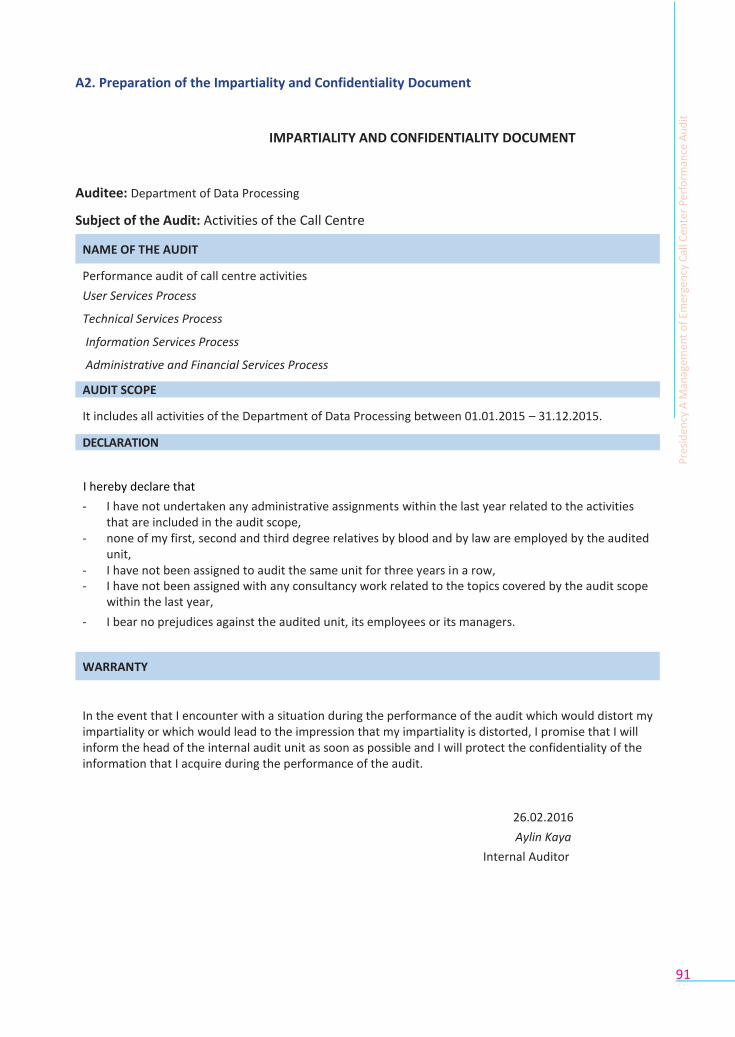
91
A2. Preparation of the Impartiality and Confidentiality Document
IMPARTIALITY AND CONFIDENTIALITY DOCUMENT
Auditee: Department of Data Processing
Subject of the Audit: Activities of the Call Centre
Performance audit of call centre activities
User Services Process
Technical Services Process
Information Services Process
Administrative and Financial Services Process
AUDIT SCOPE
It includes all activities of the Department of Data Processing between 01.01.2015 – 31.12.2015.
DECLARATION
I hereby declare that
- I have not undertaken any administrative assignments within the last year related to the activities that are included in the audit scope,
- none of my first, second and third degree relatives by blood and by law are employed by the audited unit,
- I have not been assigned to audit the same unit for three years in a row, - I have not been assigned with any consultancy work related to the topics covered by the audit scope
within the last year,
- I bear no prejudices against the audited unit, its employees or its managers.
In the event that I encounter with a situation during the performance of the audit which would distort my impartiality or which would lead to the impression that my impartiality is distorted, I promise that I will inform the head of the internal audit unit as soon as possible and I will protect the confidentiality of the information that I acquire during the performance of the audit.
26.02.2016
Aylin Kaya
Internal Auditor
NAME OF THE AUDIT
WARRANTY P
resi
de
ncy
A M
anag
eme
nt
of
Emer
gen
cy C
all C
ente
r Pe
rfo
rman
ce A
ud
it
92
A3. Notification to the Auditee
No : 76995536-679- ..../02/2016
Subject : Notification of Audit
TO THE DEPARTMENT OF DATA PROCESSING
Within the scope of 2015 Internal Audit Program executed in line with the approval of
the Undersecretary of 20.02.2016, performance audit will be conducted in your unit regarding call
centre activities between 26.02.2016-15.05.2016. Mentioned audit will start on 26.02.2016, and it
is expected to completed on 15.05.2016.
The audit will be performed under the supervision of Internal Auditor Ömer Başkale
(5555/A3), by internal auditors Aylin Kaya (6666/ A3) and Mehmet Akın (4444/A3). You will receive
the findings and the report to be drafted at the end of the audit.
Scope of the audit is mainly the call centre activities, and the exact scope and audit goals
will be determined as a result of the interviews to be made between our audit team and your
unit.
Performance audit will mostly be conducted on data analyses. Therefore, it is important
that the data to be requested by the internal auditors be fully and accurately provided on time.
Support and participation by the process owners during the audit process will contribute to
provision of feasible improvement suggestions by internal auditors.
We attach great importance to your cooperation and information sharing for a successful
audit engagement.
Kindly submitted to your information and for due action.
Head of Internal Audit Unit
CIRCULATION
For due action
Department of Data Processing
For information
Aylin Kaya (6666/A3)
Ömer Başkale (5555/A3)
Mehmet Akın (4444/A3)
Per
form
ance
Au
dit
Man
ual
for
Pu
blic
Inte
rnal
Au
dit
ors
(Cas
e St
ud
ies
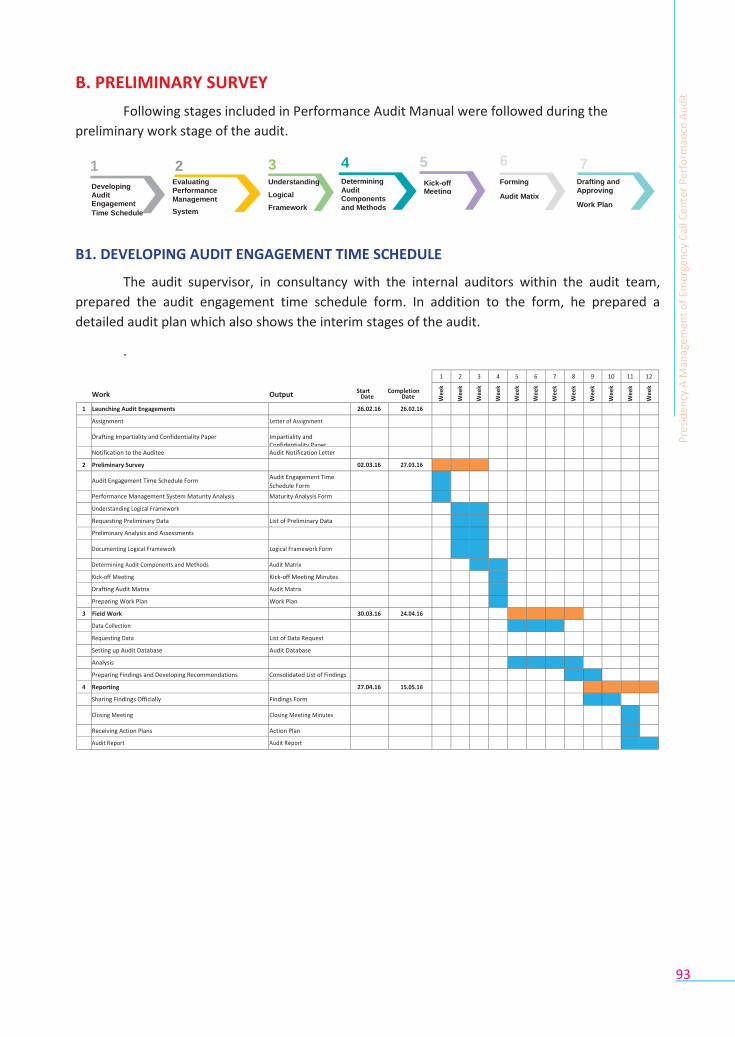
93
Determining
Audit
Components
and Methods
Kick-off Meeting
Understanding
Logical
Framework
Forming
Audit Matix
Drafting and
Approving
Work Plan
B. PRELIMINARY SURVEY
Following stages included in Performance Audit Manual were followed during the
preliminary work stage of the audit.
1 2 3 4 5 6 7 Evaluating
Performance
Management
System
B1. DEVELOPING AUDIT ENGAGEMENT TIME SCHEDULE
The audit supervisor, in consultancy with the internal auditors within the audit team,
prepared the audit engagement time schedule form. In addition to the form, he prepared a
detailed audit plan which also shows the interim stages of the audit.
.
Work Output Start Completion Date Date
1 2 3 4 5 6 7 8 9 10 11 12
Wee
k
Wee
k
Wee
k
Wee
k
Wee
k
Wee
k
Wee
k
Wee
k
Wee
k
Wee
k
Wee
k
Wee
k
1 Launching Audit Engagements 26.02.16 26.02.16 Assignment Letter of Assignment Drafting Impartiality and Confidentiality Paper Impartiality and
Confidentiality Paper
Notification to the Auditee Audit Notification Letter 2 Preliminary Survey 02.03.16 27.03.16
Audit Engagement Time Schedule Form Audit Engagement Time
Schedule Form
Performance Management System Maturity Analysis Maturity Analysis Form Understanding Logical Framework Requesting Preliminary Data List of Preliminary Data
Request Preliminary Analysis and Assessments Documenting Logical Framework Logical Framework Form
Determining Audit Components and Methods Audit Matrix Kick-off Meeting Kick-off Meeting Minutes Drafting Audit Matrix Audit Matrix Preparing Work Plan Work Plan
3 Field Work 30.03.16 24.04.16 Data Collection Requesting Data List of Data Request Setting up Audit Database Audit Database Analysis Preparing Findings and Developing Recommendations Consolidated List of Findings
4 Reporting 27.04.16 15.05.16 Sharing Findings Officially Findings Form Closing Meeting Closing Meeting Minutes
Receiving Action Plans Action Plan Audit Report Audit Report
Developing
Audit
Engagement
Time Schedule
Pre
sid
en
cy A
Man
agem
en
t o
f Em
erge
ncy
Cal
l Cen
ter
Perf
orm
ance
Au
dit
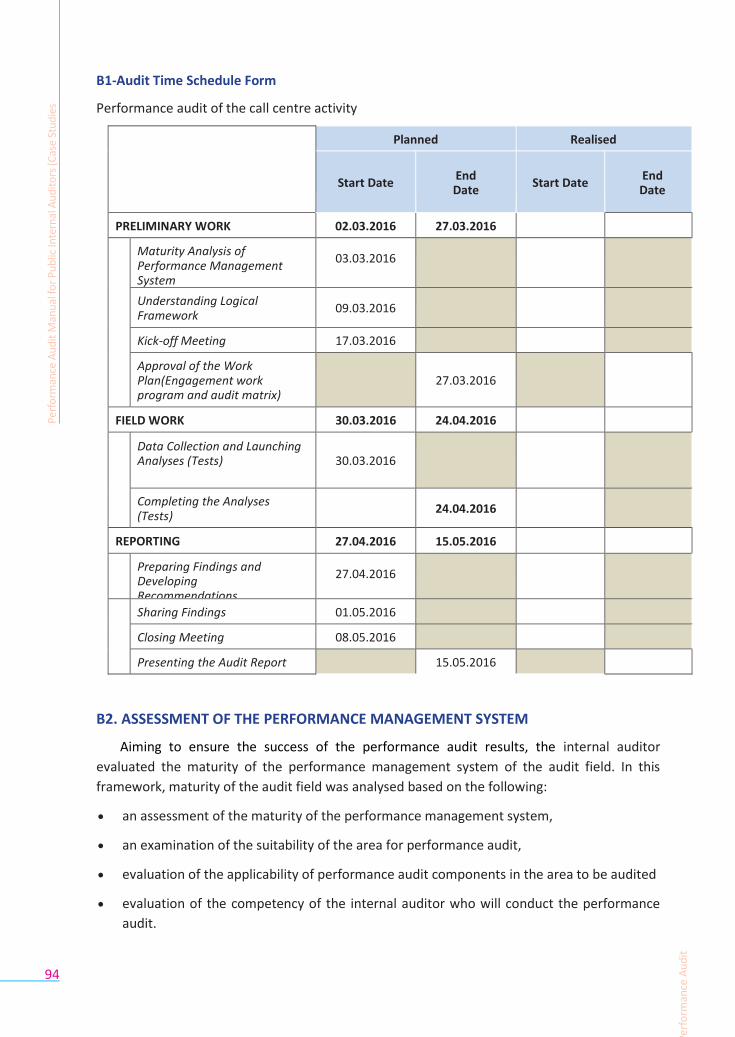
94
B1-Audit Time Schedule Form
Performance audit of the call centre activity
Planned Realised
Start Date
End Date
Start Date
End Date
PRELIMINARY WORK 02.03.2016 27.03.2016
Maturity Analysis of Performance Management System
03.03.2016
Understanding Logical Framework
09.03.2016
Kick-off Meeting 17.03.2016
Approval of the Work Plan(Engagement work program and audit matrix)
27.03.2016
FIELD WORK 30.03.2016 24.04.2016
Data Collection and Launching Analyses (Tests)
30.03.2016
Completing the Analyses (Tests)
24.04.2016
REPORTING 27.04.2016 15.05.2016
Preparing Findings and Developing Recommendations
27.04.2016
Sharing Findings 01.05.2016
Closing Meeting 08.05.2016
Presenting the Audit Report 15.05.2016
B2. ASSESSMENT OF THE PERFORMANCE MANAGEMENT SYSTEM
Aiming to ensure the success of the performance audit results, the internal auditor
evaluated the maturity of the performance management system of the audit field. In this
framework, maturity of the audit field was analysed based on the following:
an assessment of the maturity of the performance management system,
an examination of the suitability of the area for performance audit,
evaluation of the applicability of performance audit components in the area to be audited
evaluation of the competency of the internal auditor who will conduct the performance
audit.
Per
form
ance
Au
dit
Man
ual
for
Pu
blic
Inte
rnal
Au
dit
ors
(Cas
e St
ud
ies
Pre
sid
en
cy A
Man
agem
en
t o
f Em
erge
ncy
Cal
l Cen
ter
Perf
orm
ance
Au
dit
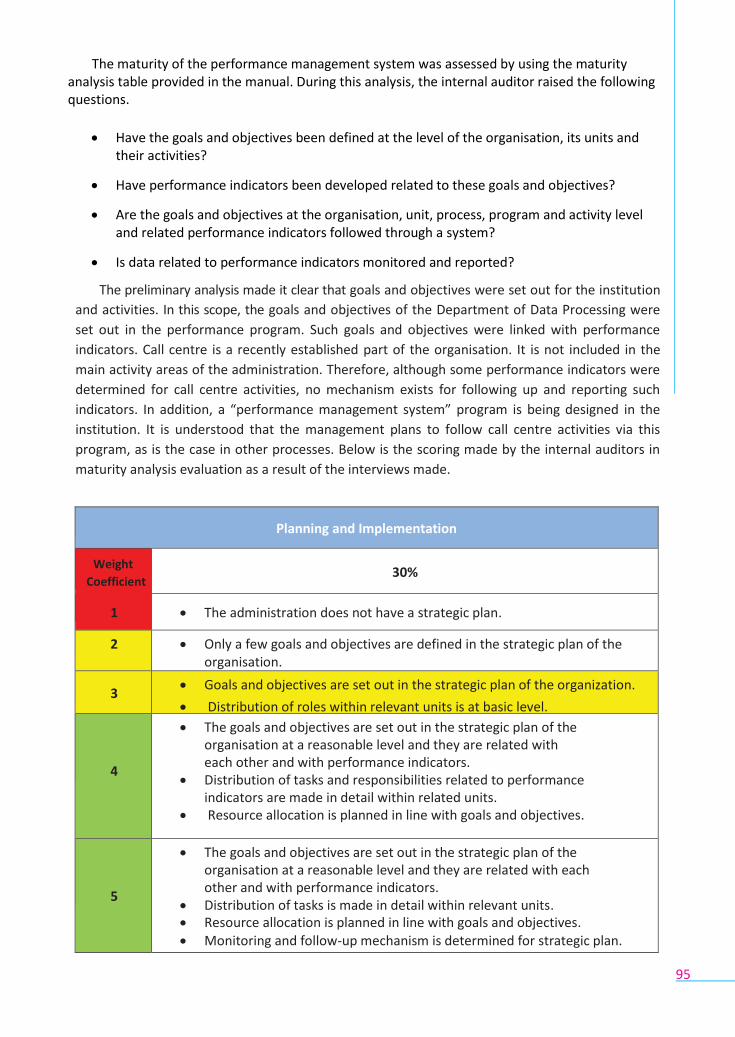
95
The maturity of the performance management system was assessed by using the maturity analysis table provided in the manual. During this analysis, the internal auditor raised the following questions.
Have the goals and objectives been defined at the level of the organisation, its units and
their activities?
Have performance indicators been developed related to these goals and objectives?
Are the goals and objectives at the organisation, unit, process, program and activity level and related performance indicators followed through a system?
Is data related to performance indicators monitored and reported?
The preliminary analysis made it clear that goals and objectives were set out for the institution
and activities. In this scope, the goals and objectives of the Department of Data Processing were
set out in the performance program. Such goals and objectives were linked with performance
indicators. Call centre is a recently established part of the organisation. It is not included in the
main activity areas of the administration. Therefore, although some performance indicators were
determined for call centre activities, no mechanism exists for following up and reporting such
indicators. In addition, a “performance management system” program is being designed in the
institution. It is understood that the management plans to follow call centre activities via this
program, as is the case in other processes. Below is the scoring made by the internal auditors in
maturity analysis evaluation as a result of the interviews made.
Planning and Implementation
Weight
Coefficient
30%
1 The administration does not have a strategic plan.
2 Only a few goals and objectives are defined in the strategic plan of the organisation.
3 Goals and objectives are set out in the strategic plan of the organization.
Distribution of roles within relevant units is at basic level.
.
4
The goals and objectives are set out in the strategic plan of the organisation at a reasonable level and they are related with each other and with performance indicators.
Distribution of tasks and responsibilities related to performance indicators are made in detail within related units.
Resource allocation is planned in line with goals and objectives.
5
The goals and objectives are set out in the strategic plan of the organisation at a reasonable level and they are related with each other and with performance indicators.
Distribution of tasks is made in detail within relevant units. Resource allocation is planned in line with goals and objectives. Monitoring and follow-up mechanism is determined for strategic plan.
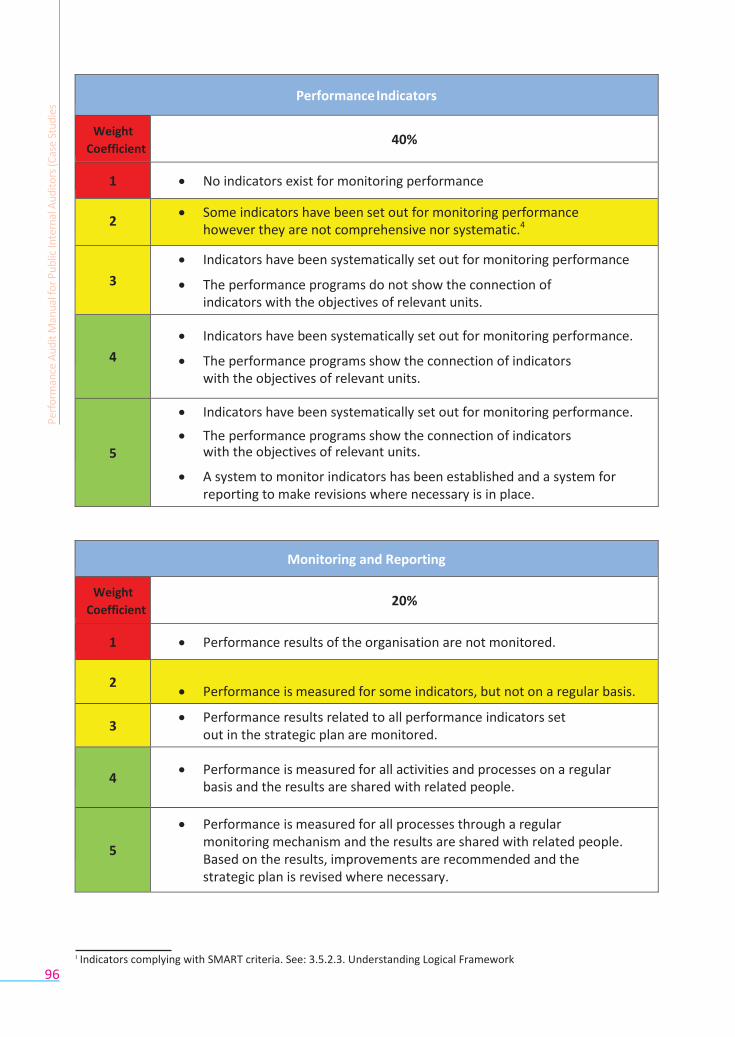
96
Performance Indicators
Weight
Coefficient
40%
1 No indicators exist for monitoring performance
ır. 2
Some indicators have been set out for monitoring performance however they are not comprehensive nor systematic.4
3
Indicators have been systematically set out for monitoring performance
The performance programs do not show the connection of indicators with the objectives of relevant units.
.
4
Indicators have been systematically set out for monitoring performance.
The performance programs show the connection of indicators with the objectives of relevant units.
.
5
Indicators have been systematically set out for monitoring performance.
The performance programs show the connection of indicators with the objectives of relevant units.
A system to monitor indicators has been established and a system for reporting to make revisions where necessary is in place.
Monitoring and Reporting
Weight
Coefficient
20%
1 Performance results of the organisation are not monitored.
2
Performance is measured for some indicators, but not on a regular basis.
3 Performance results related to all performance indicators set
out in the strategic plan are monitored.
. 4
Performance is measured for all activities and processes on a regular basis and the results are shared with related people.
yönelik ölçümler düzenli olarak tüm faaliyet ve süreçler için yapılmaktadır ve ilgililer ile paylaşılmaktadır.
5
Performance is measured for all processes through a regular monitoring mechanism and the results are shared with related people. Based on the results, improvements are recommended and the strategic plan is revised where necessary.
I Indicators complying with SMART criteria. See: 3.5.2.3. Understanding Logical Framework
Per
form
ance
Au
dit
Man
ual
for
Pu
blic
Inte
rnal
Au
dit
ors
(Cas
e St
ud
ies
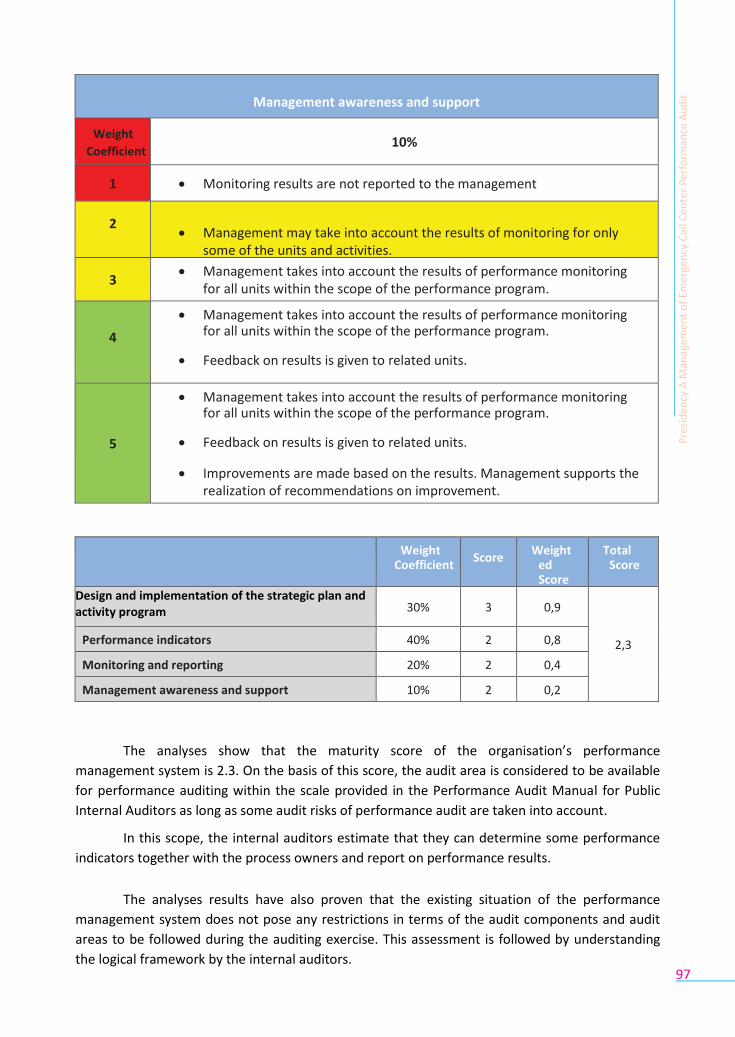
97
Management awareness and support
Weight
Coefficient
10%
1 Monitoring results are not reported to the management
. 2
Management may take into account the results of monitoring for only some of the units and activities.
3 Management takes into account the results of performance monitoring
for all units within the scope of the performance program.
.
4
Management takes into account the results of performance monitoring for all units within the scope of the performance program.
Feedback on results is given to related units.
.
5
Management takes into account the results of performance monitoring for all units within the scope of the performance program.
Feedback on results is given to related units.
Improvements are made based on the results. Management supports the realization of recommendations on improvement.
Weight Coefficient
Score Weight
ed Score
Total Score
Design and implementation of the strategic plan and activity program 30% 3 0,9
2,3 Performance indicators 40% 2 0,8
Monitoring and reporting 20% 2 0,4
Management awareness and support 10% 2 0,2
The analyses show that the maturity score of the organisation’s performance
management system is 2.3. On the basis of this score, the audit area is considered to be available
for performance auditing within the scale provided in the Performance Audit Manual for Public
Internal Auditors as long as some audit risks of performance audit are taken into account.
In this scope, the internal auditors estimate that they can determine some performance
indicators together with the process owners and report on performance results.
The analyses results have also proven that the existing situation of the performance
management system does not pose any restrictions in terms of the audit components and audit
areas to be followed during the auditing exercise. This assessment is followed by understanding
the logical framework by the internal auditors.
Pre
sid
en
cy A
Man
agem
en
t o
f Em
erge
ncy
Cal
l Cen
ter
Perf
orm
ance
Au
dit
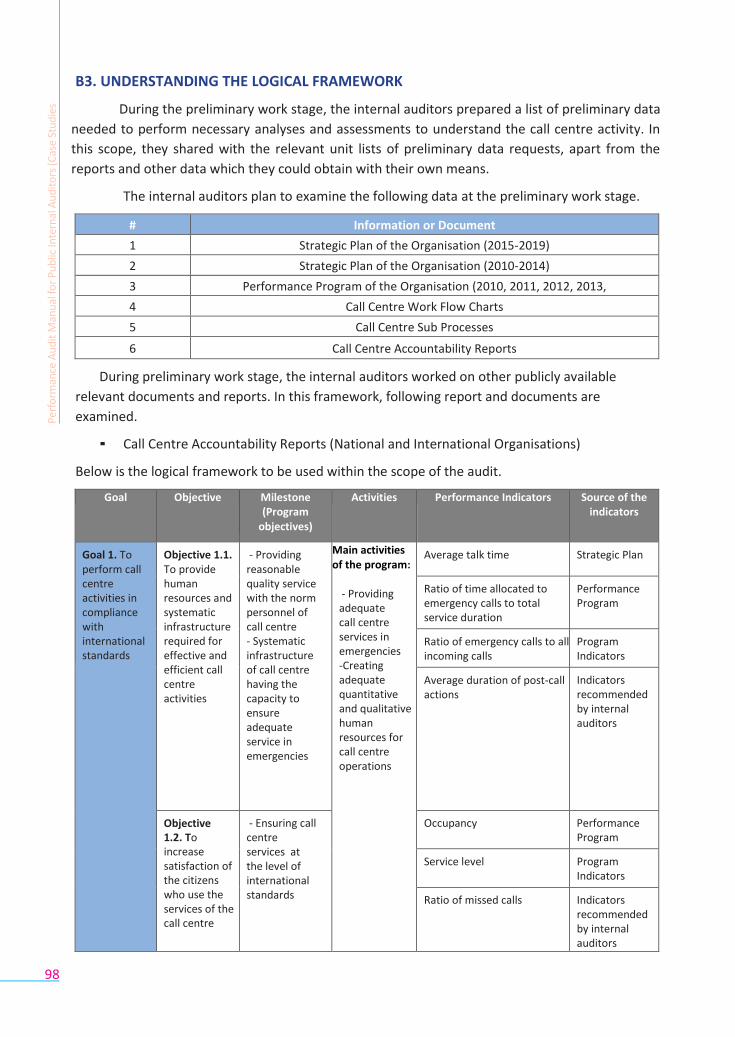
98
B3. UNDERSTANDING THE LOGICAL FRAMEWORK
During the preliminary work stage, the internal auditors prepared a list of preliminary data
needed to perform necessary analyses and assessments to understand the call centre activity. In
this scope, they shared with the relevant unit lists of preliminary data requests, apart from the
reports and other data which they could obtain with their own means.
The internal auditors plan to examine the following data at the preliminary work stage.
# Information or Document
1 Strategic Plan of the Organisation (2015-2019)
2 Strategic Plan of the Organisation (2010-2014)
3 Performance Program of the Organisation (2010, 2011, 2012, 2013, 2014, 2015) 4 Call Centre Work Flow Charts
5 Call Centre Sub Processes
6 Call Centre Accountability Reports
During preliminary work stage, the internal auditors worked on other publicly available
relevant documents and reports. In this framework, following report and documents are
examined.
▪ Call Centre Accountability Reports (National and International Organisations)
Below is the logical framework to be used within the scope of the audit.
Goal Objective Milestone (Program
objectives)
Activities Performance Indicators Source of the indicators
Goal 1. To perform call centre activities in compliance with international standards
Objective 1.1. To provide human resources and systematic infrastructure required for effective and efficient call centre activities
- Providing reasonable quality service with the norm personnel of call centre - Systematic infrastructure of call centre having the capacity to ensure adequate service in emergencies
Main activities of the program:
- Providing adequate call centre services in emergencies -Creating adequate quantitative and qualitative human resources for call centre operations
Average talk time
Strategic Plan
Ratio of time allocated to emergency calls to total service duration
Performance Program
Ratio of emergency calls to all incoming calls
Program Indicators
Average duration of post-call actions
Indicators recommended by internal auditors
Objective 1.2. To increase satisfaction of the citizens who use the services of the call centre
- Ensuring call centre services at the level of international standards
Occupancy Performance Program
Service level Program Indicators
Ratio of missed calls Indicators recommended by internal auditors
Per
form
ance
Au
dit
Man
ual
for
Pu
blic
Inte
rnal
Au
dit
ors
(Cas
e St
ud
ies
99
B4. IDENTIFICATION OF AUDIT COMPONENTS AND METHODS
Taking the opinions of the internal auditors, AS decided to perform an audit aiming at
effectiveness, efficiency and consistency, within the framework of expectations of the
management.
The audit to be conducted aims at assessing the work and transactions of the call centre
within the framework of the audit components below and determining improvement areas.
▪ Effectiveness; Capacity to reach the objectives and intended outcomes
▪ Productivity; assessment of whether the output generated from the available resources is
at an adequate level
▪ Consistency; coherence between the defined goals, objectives and strategies of public
administrations and the planning and design of their programs and projects.
In the audit activities aiming at audit components set in this scope, they mostly plan measuring and reporting performance, and using the methods of efficiency analysis and timeliness analysis.
Within the scope of the analysis, the following are aimed:
▪ Performance results on efficiency and timeliness of call centre activities between 2013 –
2015
▪ Comparing international best practices and call centre performance indicators.
B5. KICK-OFF MEETING
The internal auditor provided the auditee with information on the following issues during the
kick-off meeting.
▪ Audit Team and its organisation
▪ Audit Scope
▪ Audit Stages
▪ Time Schedule
▪ Determining Comparison Group
▪ Following Steps
In the kick-off meeting, the auditee stated its expectations as follows.
▪ Level of the current activities in terms of achieving the objectives included in the strategic
plan of the organisation
▪ Evaluating current activities by comparing the call centre and similar call centres and
other best practices
▪ Determining the improvement areas that should be attached importance in the activities
to be performed in 2016
Pre
sid
en
cy A
Man
agem
en
t o
f Em
erge
ncy
Cal
l Cen
ter
Perf
orm
ance
Au
dit
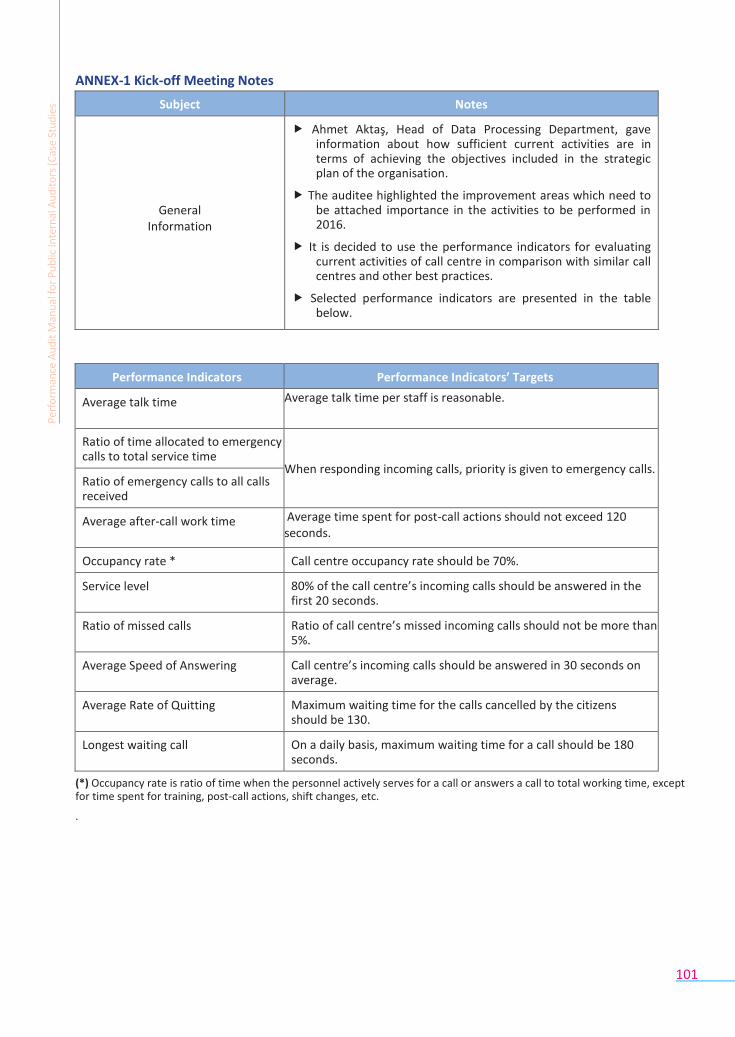
101
ANNEX-1 Kick-off Meeting Notes
Subject Notes
General
Information
Ahmet Aktaş, Head of Data Processing Department, gave information about how sufficient current activities are in terms of achieving the objectives included in the strategic plan of the organisation.
The auditee highlighted the improvement areas which need to be attached importance in the activities to be performed in 2016.
It is decided to use the performance indicators for evaluating current activities of call centre in comparison with similar call centres and other best practices.
Selected performance indicators are presented in the table below.
Performance Indicators Performance Indicators’ Targets
Average talk time Average talk time per staff is reasonable.
Ratio of time allocated to emergency calls to total service time
When responding incoming calls, priority is given to emergency calls. Ratio of emergency calls to all calls received
Average after-call work time Average time spent for post-call actions should not exceed 120 seconds.
Occupancy rate * Call centre occupancy rate should be 70%.
Service level 80% of the call centre’s incoming calls should be answered in the first 20 seconds.
Ratio of missed calls Ratio of call centre’s missed incoming calls should not be more than 5%.
Average Speed of Answering Call centre’s incoming calls should be answered in 30 seconds on average.
Average Rate of Quitting Maximum waiting time for the calls cancelled by the citizens should be 130.
Longest waiting call On a daily basis, maximum waiting time for a call should be 180 seconds.
(*) Occupancy rate is ratio of time when the personnel actively serves for a call or answers a call to total working time, except for time spent for training, post-call actions, shift changes, etc.
.
Per
form
ance
Au
dit
Man
ual
for
Pu
blic
Inte
rnal
Au
dit
ors
(Cas
e St
ud
ies
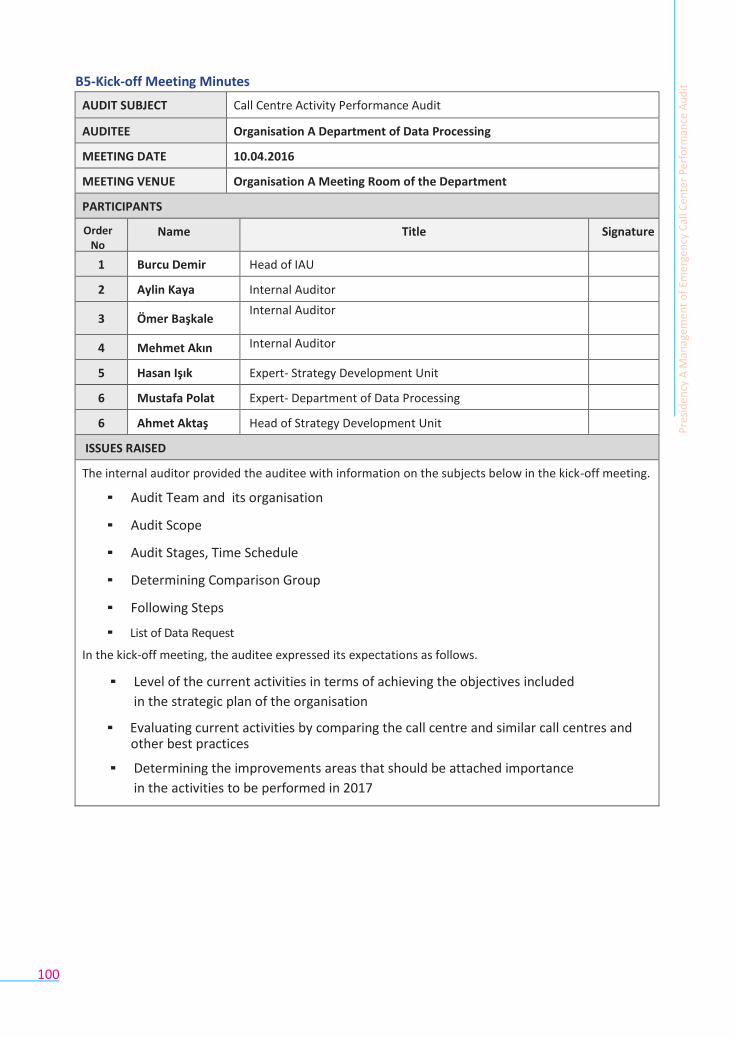
100
B5-Kick-off Meeting Minutes
AUDIT SUBJECT Call Centre Activity Performance Audit
AUDITEE Organisation A Department of Data Processing
MEETING DATE 10.04.2016
MEETING VENUE Organisation A Meeting Room of the Department
PARTICIPANTS
Order No
Name Title Signature
1 Burcu Demir Head of IAU
2 Aylin Kaya Internal Auditor
3 Ömer Başkale Internal Auditor
4 Mehmet Akın Internal Auditor
5 Hasan Işık Expert- Strategy Development Unit
6 Mustafa Polat Expert- Department of Data Processing
6 Ahmet Aktaş Head of Strategy Development Unit
ISSUES RAISED
The internal auditor provided the auditee with information on the subjects below in the kick-off meeting.
▪ Audit Team and its organisation
▪ Audit Scope
▪ Audit Stages, Time Schedule
▪ Determining Comparison Group
▪ Following Steps
▪ List of Data Request
In the kick-off meeting, the auditee expressed its expectations as follows.
▪ Level of the current activities in terms of achieving the objectives included
in the strategic plan of the organisation
▪ Evaluating current activities by comparing the call centre and similar call centres and other best practices
▪ Determining the improvements areas that should be attached importance
in the activities to be performed in 2017
Pre
sid
en
cy A
Man
agem
en
t o
f Em
erge
ncy
Cal
l Cen
ter
Perf
orm
ance
Au
dit
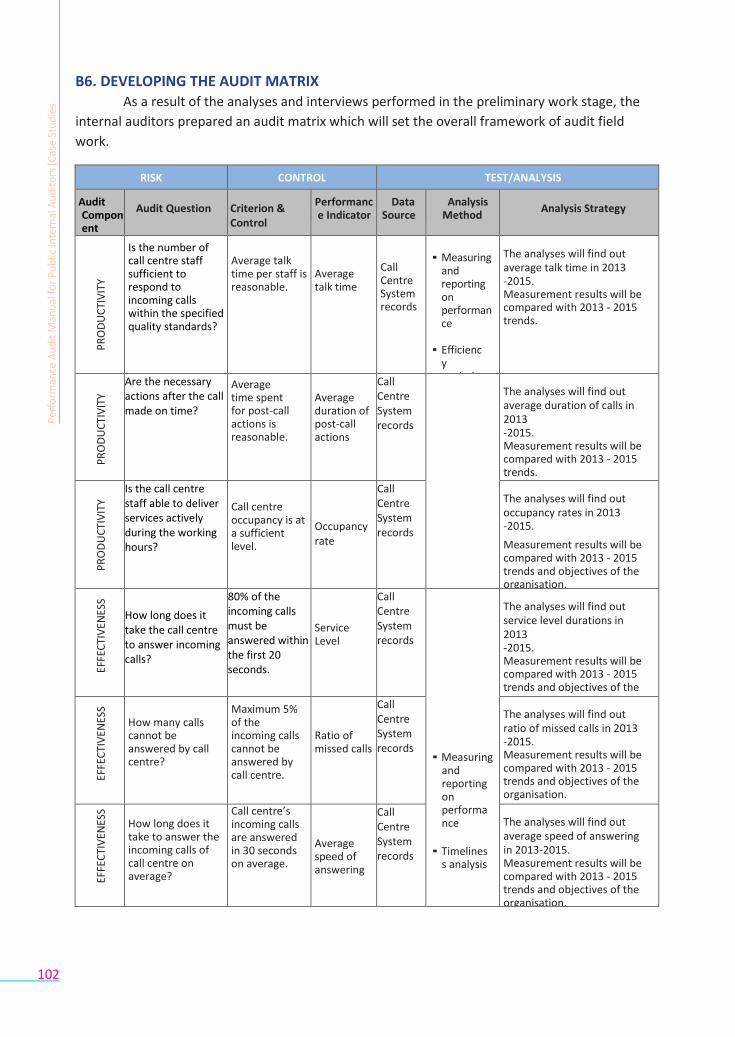
102
B6. DEVELOPING THE AUDIT MATRIX As a result of the analyses and interviews performed in the preliminary work stage, the
internal auditors prepared an audit matrix which will set the overall framework of audit field
work.
RISK CONTROL TEST/ANALYSIS
Audit Component
Audit Question
Criterion & Control
Performance Indicator
Data Source
Analysis Method
Analysis Strategy
P
RO
DU
CTI
VIT
Y
Is the number of call centre staff sufficient to respond to incoming calls within the specified quality standards?
Average talk time per staff is reasonable.
Average talk time
Call Centre System records
▪ Measuring
and reporting on performance
▪ Efficiency analysis
The analyses will find out average talk time in 2013 -2015. Measurement results will be compared with 2013 - 2015 trends.
P
RO
DU
CTI
VIT
Y
Are the necessary actions after the call made on time?
Average time spent for post-call actions is reasonable.
Average duration of post-call actions
Call Centre System records
The analyses will find out average duration of calls in 2013 -2015. Measurement results will be compared with 2013 - 2015 trends.
P
RO
DU
CTI
VIT
Y
Is the call centre staff able to deliver services actively during the working hours?
Call centre occupancy is at a sufficient level.
Occupancy rate
Call Centre System records
The analyses will find out occupancy rates in 2013 -2015.
Measurement results will be compared with 2013 - 2015 trends and objectives of the organisation.
EF
FEC
TIV
ENES
S How long does it take the call centre to answer incoming calls?
80% of the incoming calls must be answered within the first 20 seconds.
Service Level
Call Centre System records
▪ Measuring
and reporting on performance
▪ Timelines
s analysis
The analyses will find out service level durations in 2013 -2015. Measurement results will be compared with 2013 - 2015 trends and objectives of the organisation.
EF
FEC
TIV
ENES
S How many calls cannot be answered by call centre?
Maximum 5% of the incoming calls cannot be answered by call centre.
Ratio of missed calls
Call Centre System records
The analyses will find out ratio of missed calls in 2013 -2015. Measurement results will be compared with 2013 - 2015 trends and objectives of the organisation.
EF
FEC
TIV
ENES
S
How long does it take to answer the incoming calls of call centre on average?
Call centre’s incoming calls are answered in 30 seconds on average.
Average speed of answering
Call Centre System records
The analyses will find out average speed of answering in 2013-2015. Measurement results will be compared with 2013 - 2015 trends and objectives of the organisation.
Per
form
ance
Au
dit
Man
ual
for
Pu
blic
Inte
rnal
Au
dit
ors
(Cas
e St
ud
ies
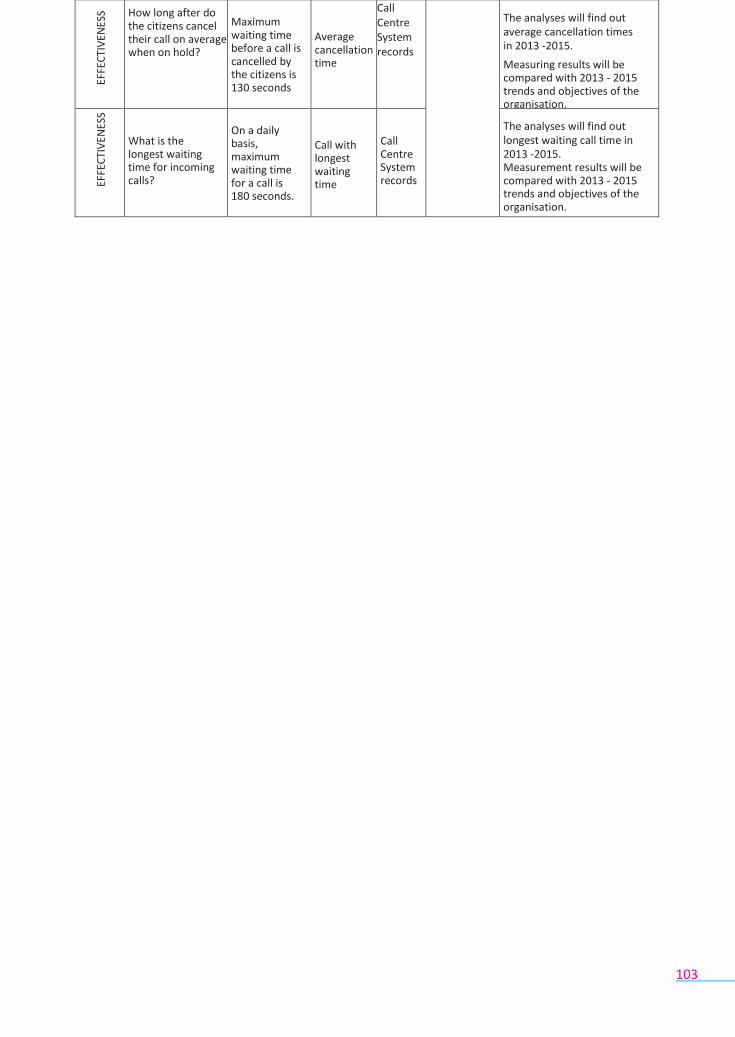
103
EF
FEC
TIV
ENES
S How long after do the citizens cancel their call on average when on hold?
Maximum waiting time before a call is cancelled by the citizens is 130 seconds
Average cancellation time
Call Centre System records
The analyses will find out average cancellation times in 2013 -2015.
Measuring results will be compared with 2013 - 2015 trends and objectives of the organisation.
EF
FEC
TIV
ENES
S
What is the longest waiting time for incoming calls?
On a daily basis, maximum waiting time for a call is 180 seconds.
Call with longest waiting time
Call Centre System records
The analyses will find out longest waiting call time in 2013 -2015. Measurement results will be compared with 2013 - 2015 trends and objectives of the organisation.
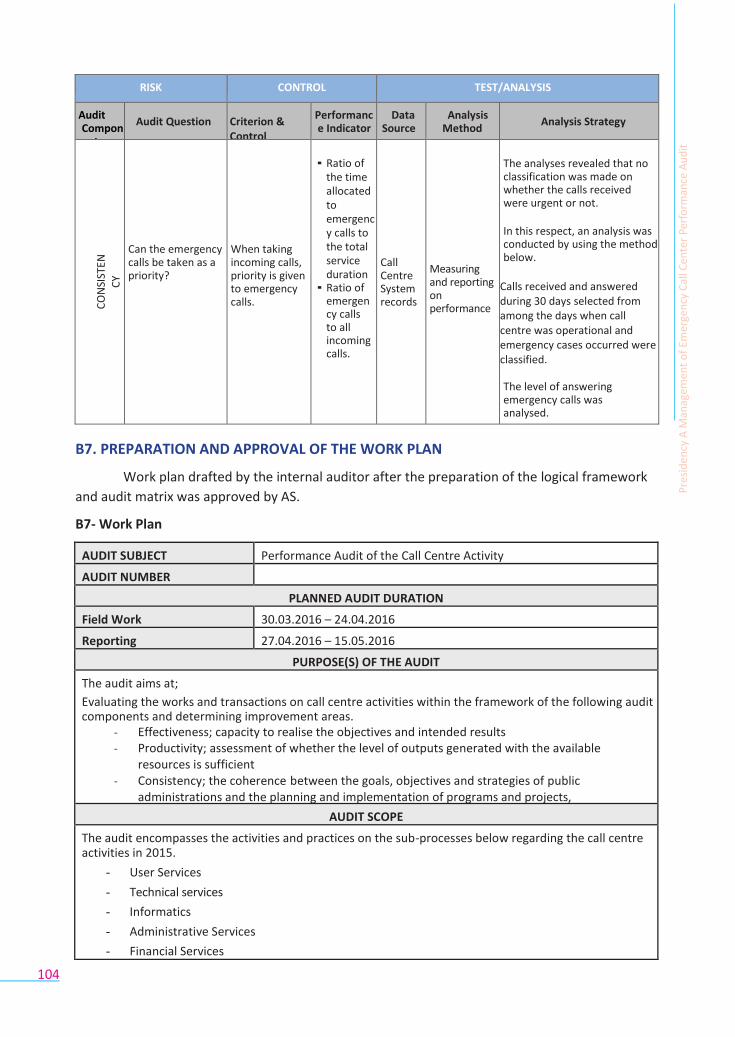
104
RISK CONTROL TEST/ANALYSIS
Audit Component
Audit Question
Criterion & Control
Performance Indicator
Data Source
Analysis Method
Analysis Strategy
C
ON
SIST
ENC
Y
Can the emergency calls be taken as a priority?
When taking incoming calls, priority is given to emergency calls.
▪ Ratio of
the time allocated to emergency calls to the total service duration
▪ Ratio of emergency calls to all incoming calls.
Call Centre System records
Measuring and reporting on performance
The analyses revealed that no classification was made on whether the calls received were urgent or not.
In this respect, an analysis was conducted by using the method below.
Calls received and answered during 30 days selected from among the days when call centre was operational and emergency cases occurred were classified.
The level of answering emergency calls was analysed.
B7. PREPARATION AND APPROVAL OF THE WORK PLAN
Work plan drafted by the internal auditor after the preparation of the logical framework
and audit matrix was approved by AS.
B7- Work Plan
AUDIT SUBJECT Performance Audit of the Call Centre Activity
AUDIT NUMBER
PLANNED AUDIT DURATION
Field Work 30.03.2016 – 24.04.2016
Reporting 27.04.2016 – 15.05.2016
PURPOSE(S) OF THE AUDIT
The audit aims at;
Evaluating the works and transactions on call centre activities within the framework of the following audit components and determining improvement areas.
- Effectiveness; capacity to realise the objectives and intended results - Productivity; assessment of whether the level of outputs generated with the available
resources is sufficient - Consistency; the coherence between the goals, objectives and strategies of public
administrations and the planning and implementation of programs and projects,
AUDIT SCOPE
The audit encompasses the activities and practices on the sub-processes below regarding the call centre activities in 2015.
- User Services
- Technical services
- Informatics
- Administrative Services
- Financial Services
Pre
sid
en
cy A
Man
agem
en
t o
f Em
erge
ncy
Cal
l Cen
ter
Perf
orm
ance
Au
dit
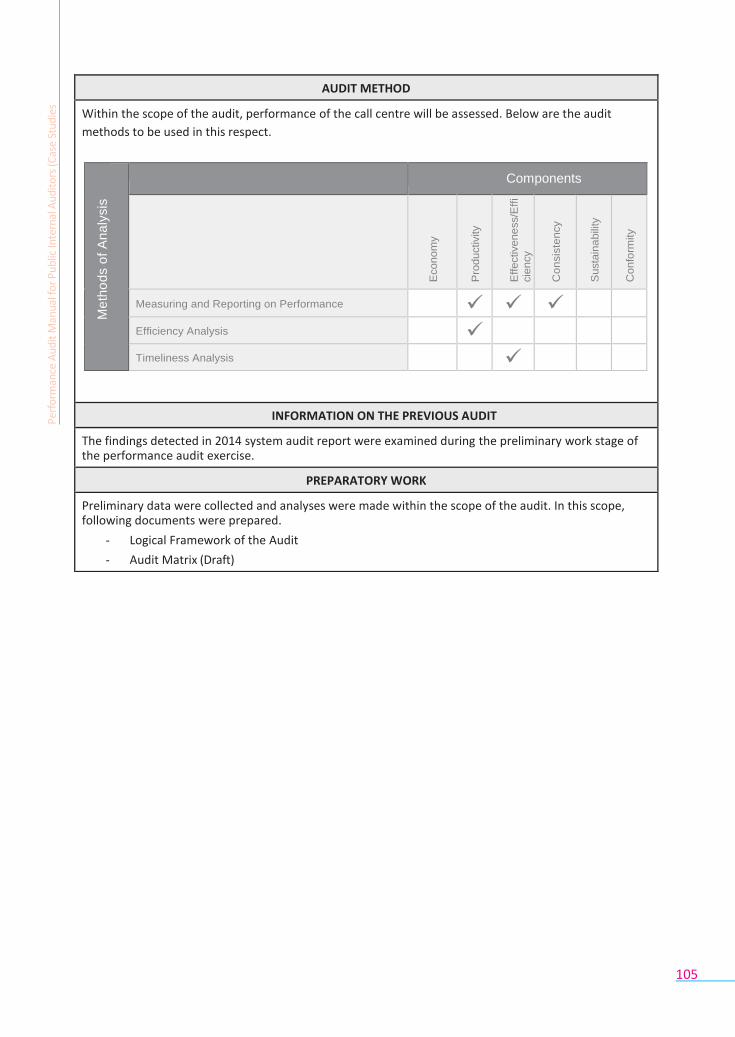
105
AUDIT METHOD
Within the scope of the audit, performance of the call centre will be assessed. Below are the audit
methods to be used in this respect.
INFORMATION ON THE PREVIOUS AUDIT
The findings detected in 2014 system audit report were examined during the preliminary work stage of the performance audit exercise.
PREPARATORY WORK
Preliminary data were collected and analyses were made within the scope of the audit. In this scope, following documents were prepared.
- Logical Framework of the Audit
- Audit Matrix (Draft)
Per
form
ance
Au
dit
Man
ual
for
Pu
blic
Inte
rnal
Au
dit
ors
(Cas
e St
ud
ies
Me
tho
ds o
f A
na
lysis
Components
Econom
y
Pro
ductivity
E
ffectivene
ss/E
ffi
cie
ncy
C
on
sis
ten
cy
Susta
ina
bili
ty
Confo
rmity
Measuring and Reporting on Performance
Efficiency Analysis
Timeliness Analysis
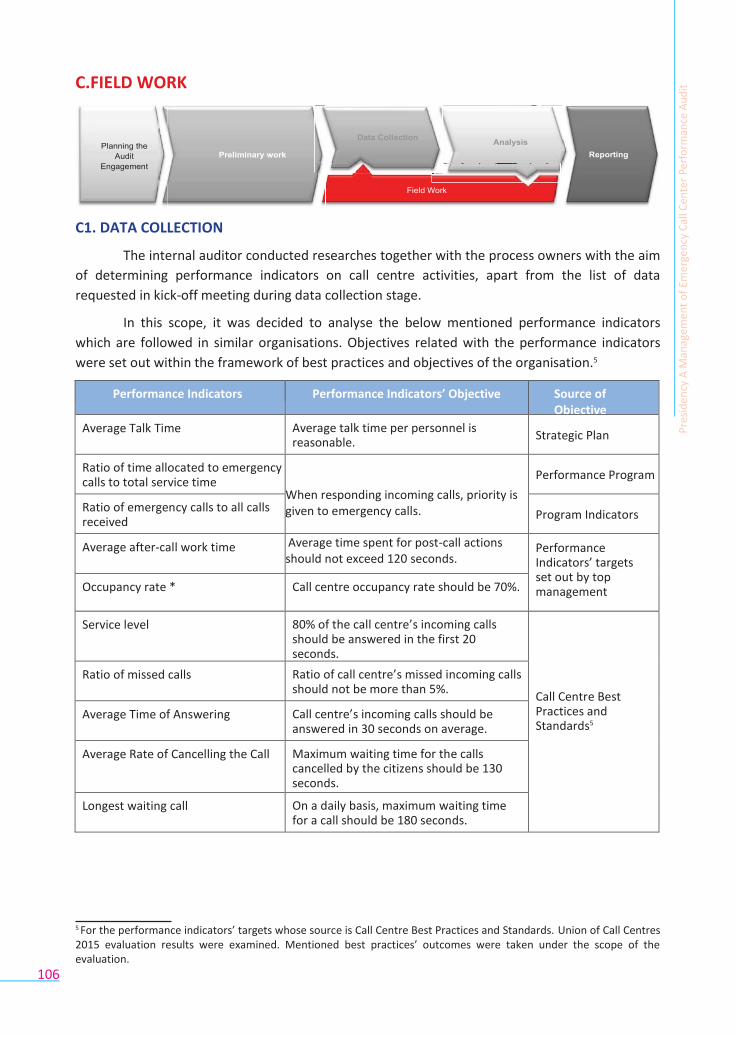
106
C.FIELD WORK
C1. DATA COLLECTION
The internal auditor conducted researches together with the process owners with the aim
of determining performance indicators on call centre activities, apart from the list of data
requested in kick-off meeting during data collection stage.
In this scope, it was decided to analyse the below mentioned performance indicators
which are followed in similar organisations. Objectives related with the performance indicators
were set out within the framework of best practices and objectives of the organisation.5
Performance Indicators Performance Indicators’ Objective Source of Objective
Average Talk Time Average talk time per personnel is reasonable.
Strategic Plan
Ratio of time allocated to emergency calls to total service time
When responding incoming calls, priority is given to emergency calls.
Performance Program
Ratio of emergency calls to all calls received
Program Indicators
Average after-call work time Average time spent for post-call actions should not exceed 120 seconds.
Performance Indicators’ targets set out by top management Occupancy rate * Call centre occupancy rate should be 70%.
Service level 80% of the call centre’s incoming calls should be answered in the first 20 seconds.
Call Centre Best Practices and Standards5
Ratio of missed calls Ratio of call centre’s missed incoming calls should not be more than 5%.
Average Time of Answering Call centre’s incoming calls should be answered in 30 seconds on average.
Average Rate of Cancelling the Call Maximum waiting time for the calls cancelled by the citizens should be 130 seconds.
Longest waiting call On a daily basis, maximum waiting time for a call should be 180 seconds.
5 For the performance indicators’ targets whose source is Call Centre Best Practices and Standards. Union of Call Centres 2015 evaluation results were examined. Mentioned best practices’ outcomes were taken under the scope of the evaluation.
Pre
sid
en
cy A
Man
agem
en
t o
f Em
erge
ncy
Cal
l Cen
ter
Perf
orm
ance
Au
dit
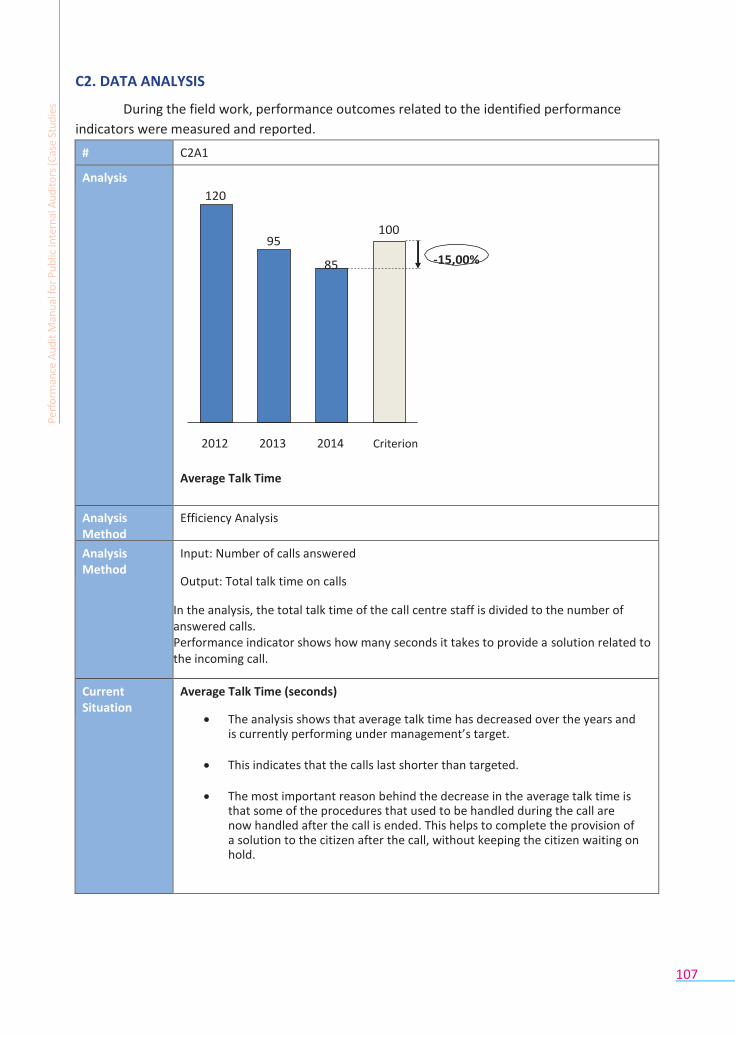
107
C2. DATA ANALYSIS
During the field work, performance outcomes related to the identified performance
indicators were measured and reported.
# C2A1
Analysis 120
100
95
85 -15,00%
2012 2013 2014 Criterion
Average Talk Time
Analysis Method
Efficiency Analysis
Analysis Method
Input: Number of calls answered
Output: Total talk time on calls
In the analysis, the total talk time of the call centre staff is divided to the number of answered calls. Performance indicator shows how many seconds it takes to provide a solution related to the incoming call.
Current Situation
Average Talk Time (seconds)
The analysis shows that average talk time has decreased over the years and is currently performing under management’s target.
This indicates that the calls last shorter than targeted.
The most important reason behind the decrease in the average talk time is
that some of the procedures that used to be handled during the call are now handled after the call is ended. This helps to complete the provision of a solution to the citizen after the call, without keeping the citizen waiting on hold.
Per
form
ance
Au
dit
Man
ual
for
Pu
blic
Inte
rnal
Au
dit
ors
(Cas
e St
ud
ies
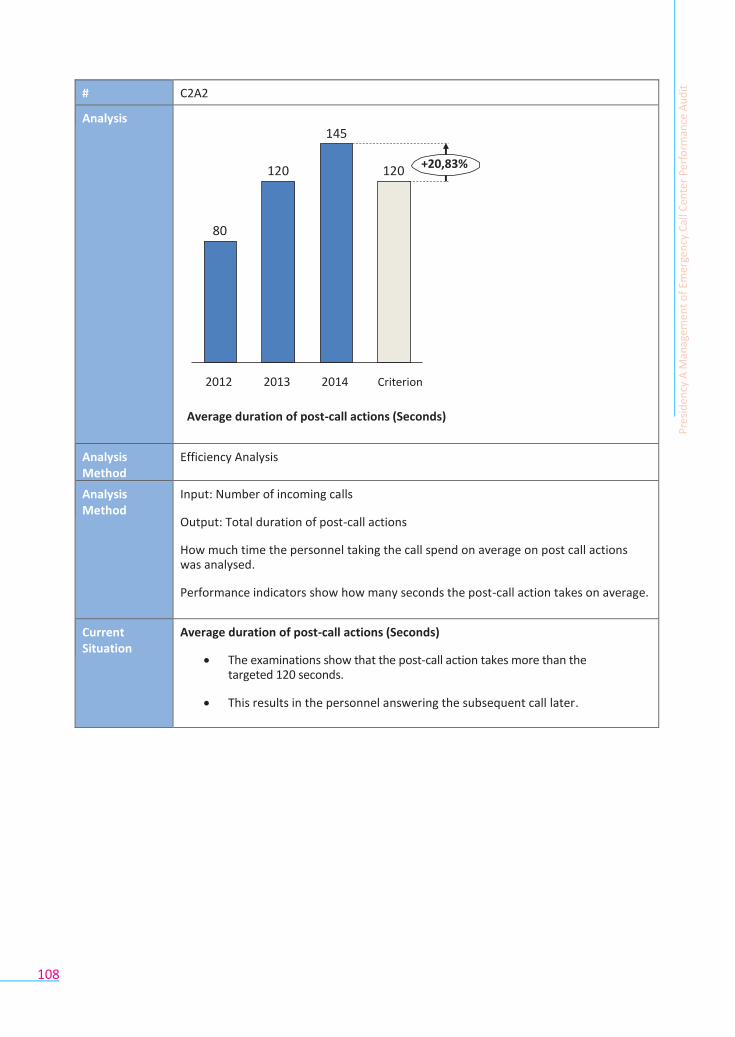
108
# C2A2
Analysis 145
120 120 +20,83%
80
2012 2013 2014 Criterion
Average duration of post-call actions (Seconds)
Analysis Method
Efficiency Analysis
Analysis Method
Input: Number of incoming calls
Output: Total duration of post-call actions
How much time the personnel taking the call spend on average on post call actions was analysed.
Performance indicators show how many seconds the post-call action takes on average.
Current Situation
Average duration of post-call actions (Seconds)
The examinations show that the post-call action takes more than the targeted 120 seconds.
This results in the personnel answering the subsequent call later.
Pre
sid
en
cy A
Man
agem
en
t o
f Em
erge
ncy
Cal
l Cen
ter
Perf
orm
ance
Au
dit
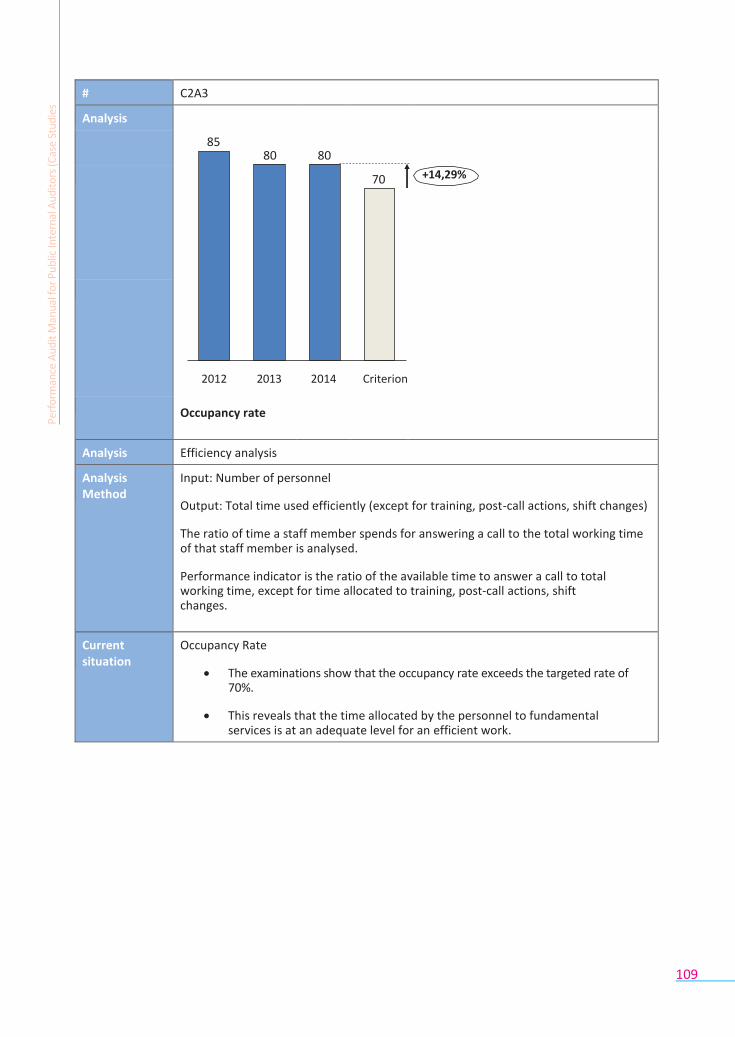
109
# C2A3
Analysis
85 80 80 70 +14,29%
2012 2013
2014
Criterion
Occupancy rate
Analysis Method
Efficiency analysis
Analysis Method
Input: Number of personnel
Output: Total time used efficiently (except for training, post-call actions, shift changes)
The ratio of time a staff member spends for answering a call to the total working time of that staff member is analysed.
Performance indicator is the ratio of the available time to answer a call to total working time, except for time allocated to training, post-call actions, shift changes.
Current situation
Occupancy Rate
The examinations show that the occupancy rate exceeds the targeted rate of 70%.
This reveals that the time allocated by the personnel to fundamental services is at an adequate level for an efficient work.
Per
form
ance
Au
dit
Man
ual
for
Pu
blic
Inte
rnal
Au
dit
ors
(Cas
e St
ud
ies
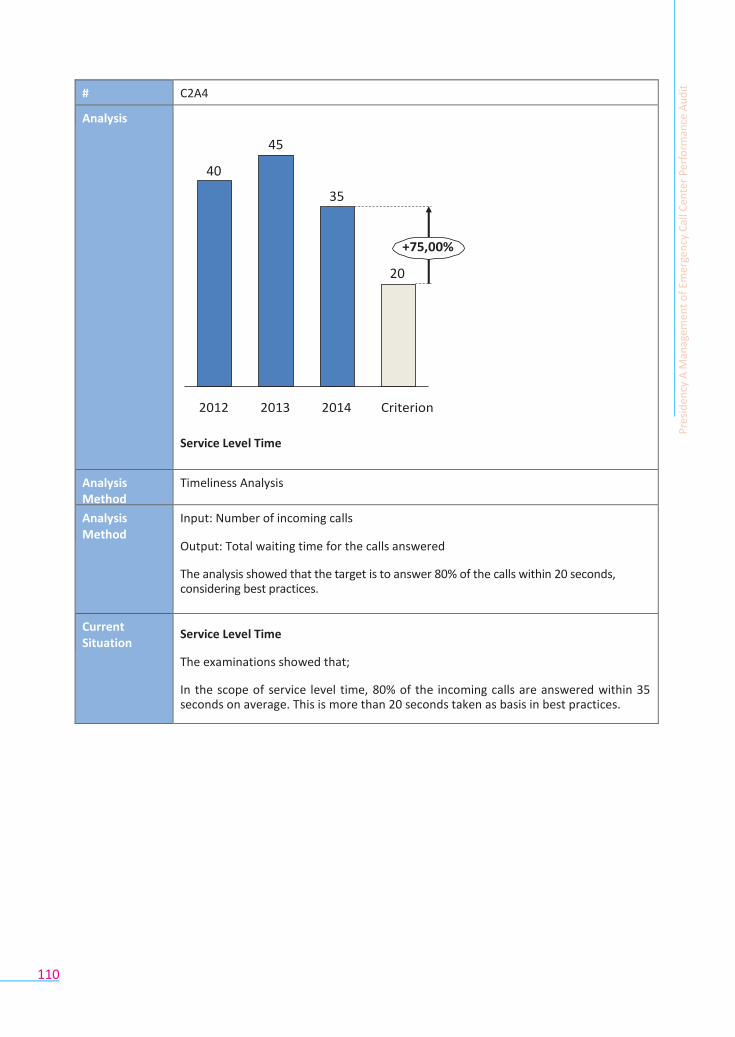
110
# C2A4
Analysis
45
40
35
+75,00%
20
2012 2013 2014 Criterion
Service Level Time
Analysis Method
Timeliness Analysis
Analysis Method
Input: Number of incoming calls
Output: Total waiting time for the calls answered
The analysis showed that the target is to answer 80% of the calls within 20 seconds, considering best practices.
Current Situation
Service Level Time
The examinations showed that;
In the scope of service level time, 80% of the incoming calls are answered within 35 seconds on average. This is more than 20 seconds taken as basis in best practices.
Pre
sid
en
cy A
Man
agem
en
t o
f Em
erge
ncy
Cal
l Cen
ter
Perf
orm
ance
Au
dit
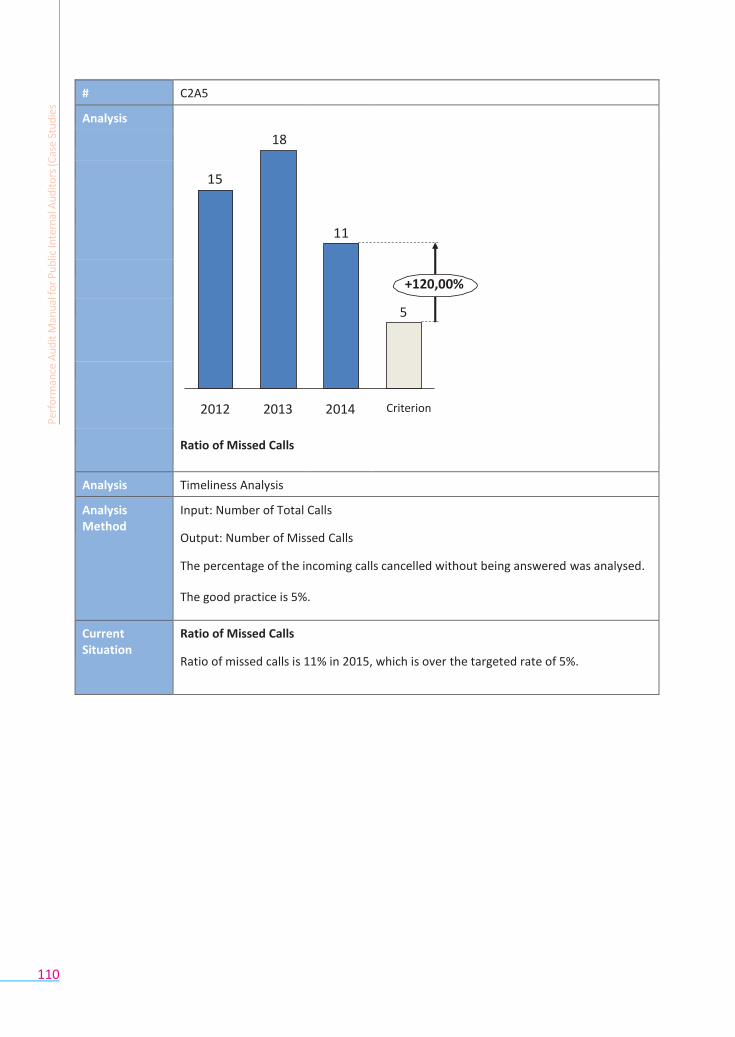
110
# C2A5
Analysis
18
15
11
+120,00%
5
2012 2013
2014
Criterion
Ratio of Missed Calls
Analysis Method
Timeliness Analysis
Analysis Method
Input: Number of Total Calls
Output: Number of Missed Calls
The percentage of the incoming calls cancelled without being answered was analysed.
The good practice is 5%.
Current Situation
Ratio of Missed Calls
Ratio of missed calls is 11% in 2015, which is over the targeted rate of 5%.
Per
form
ance
Au
dit
Man
ual
for
Pu
blic
Inte
rnal
Au
dit
ors
(Cas
e St
ud
ies
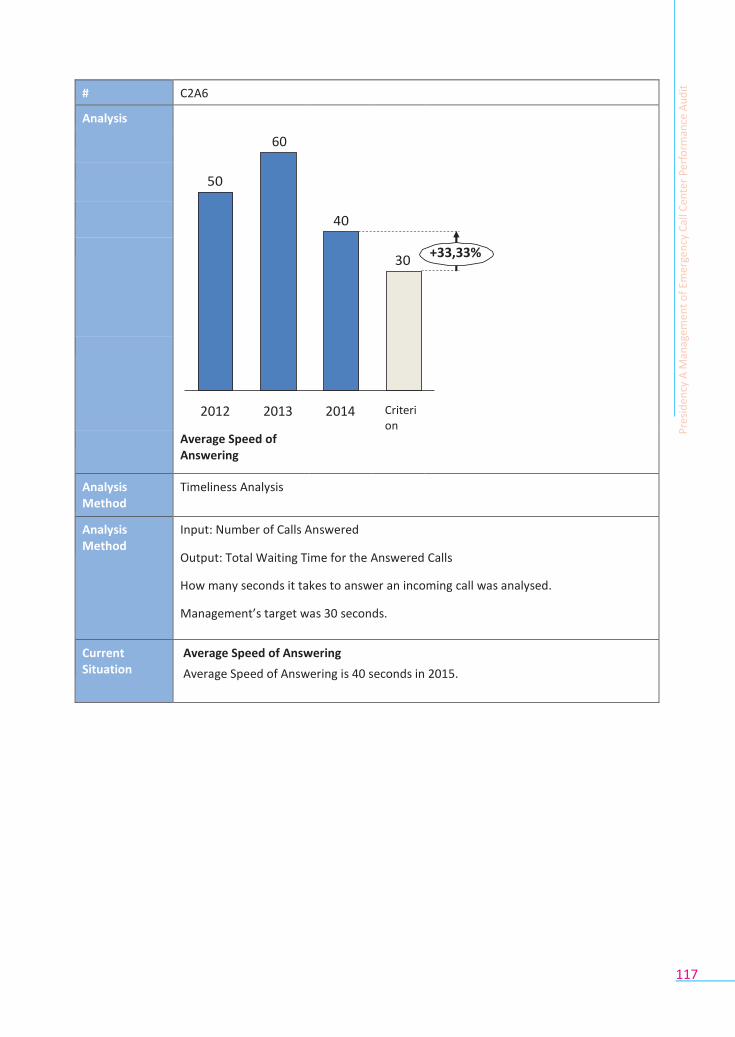
117
# C2A6
Analysis
60
50
40
30 +33,33%
2012 2013
2014
Criterion
Average Speed of Answering
Analysis Method
Timeliness Analysis
Analysis Method
Input: Number of Calls Answered
Output: Total Waiting Time for the Answered Calls
How many seconds it takes to answer an incoming call was analysed.
Management’s target was 30 seconds.
Current Situation
Average Speed of Answering
Average Speed of Answering is 40 seconds in 2015. P
resi
de
ncy
A M
anag
eme
nt
of
Emer
gen
cy C
all C
ente
r Pe
rfo
rman
ce A
ud
it

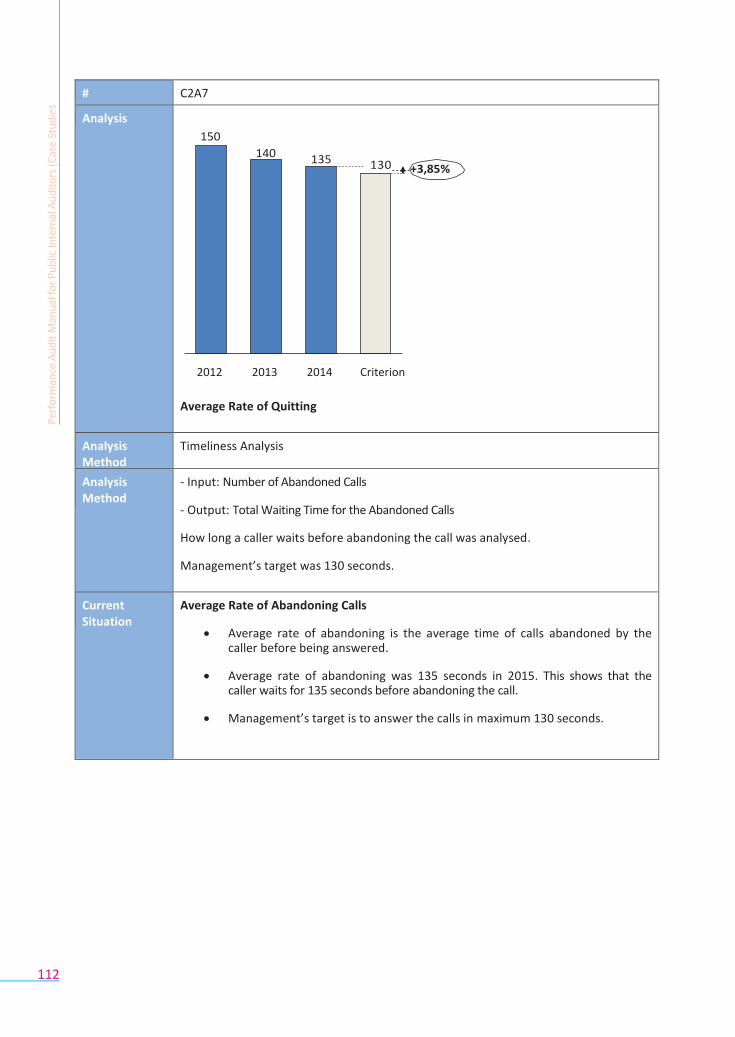
112
# C2A7
Analysis
150
140 135 130 +3,85%
2012 2013 2014 Criterion
Average Rate of Quitting
Analysis Method
Timeliness Analysis
Analysis Method
- Input: Number of Abandoned Calls
- Output: Total Waiting Time for the Abandoned Calls
How long a caller waits before abandoning the call was analysed.
Management’s target was 130 seconds.
Current Situation
Average Rate of Abandoning Calls
Average rate of abandoning is the average time of calls abandoned by the caller before being answered.
Average rate of abandoning was 135 seconds in 2015. This shows that the caller waits for 135 seconds before abandoning the call.
Management’s target is to answer the calls in maximum 130 seconds.
Per
form
ance
Au
dit
Man
ual
for
Pu
blic
Inte
rnal
Au
dit
ors
(Cas
e St
ud
ies
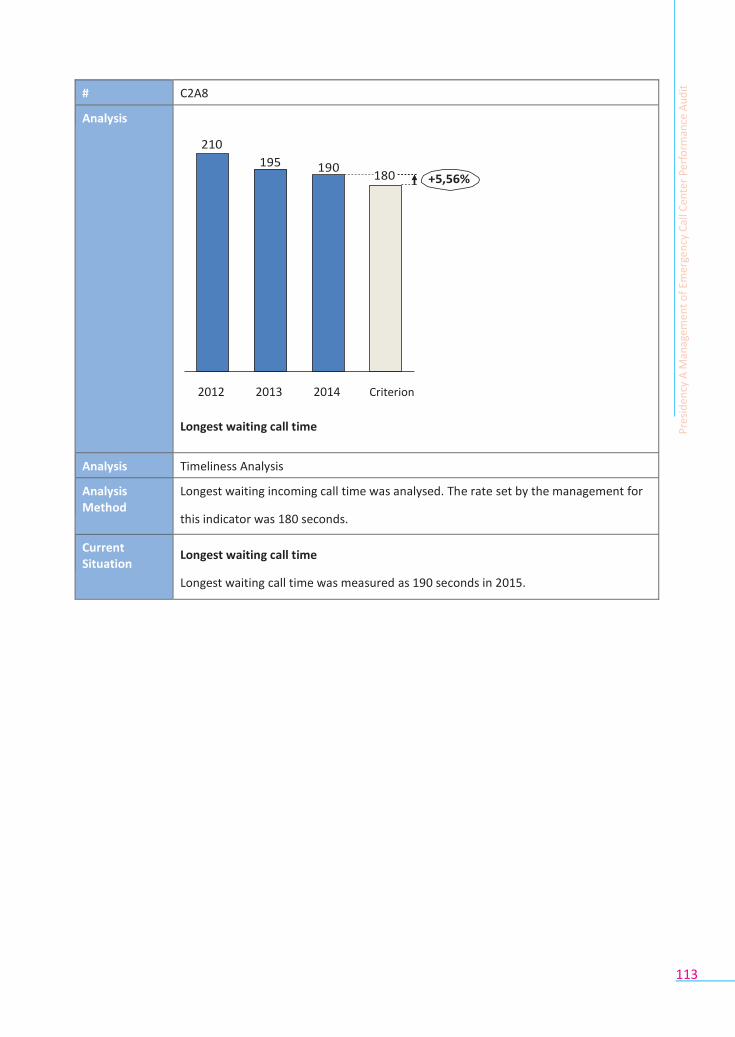
113
# C2A8
Analysis
210
195 190 180 +5,56%
2012 2013 2014 Criterion
Longest waiting call time
Analysis Method
Timeliness Analysis
Analysis Method
Longest waiting incoming call time was analysed. The rate set by the management for
this indicator was 180 seconds.
Current Situation
Longest waiting call time
Longest waiting call time was measured as 190 seconds in 2015.
Pre
sid
en
cy A
Man
agem
en
t o
f Em
erge
ncy
Cal
l Cen
ter
Perf
orm
ance
Au
dit
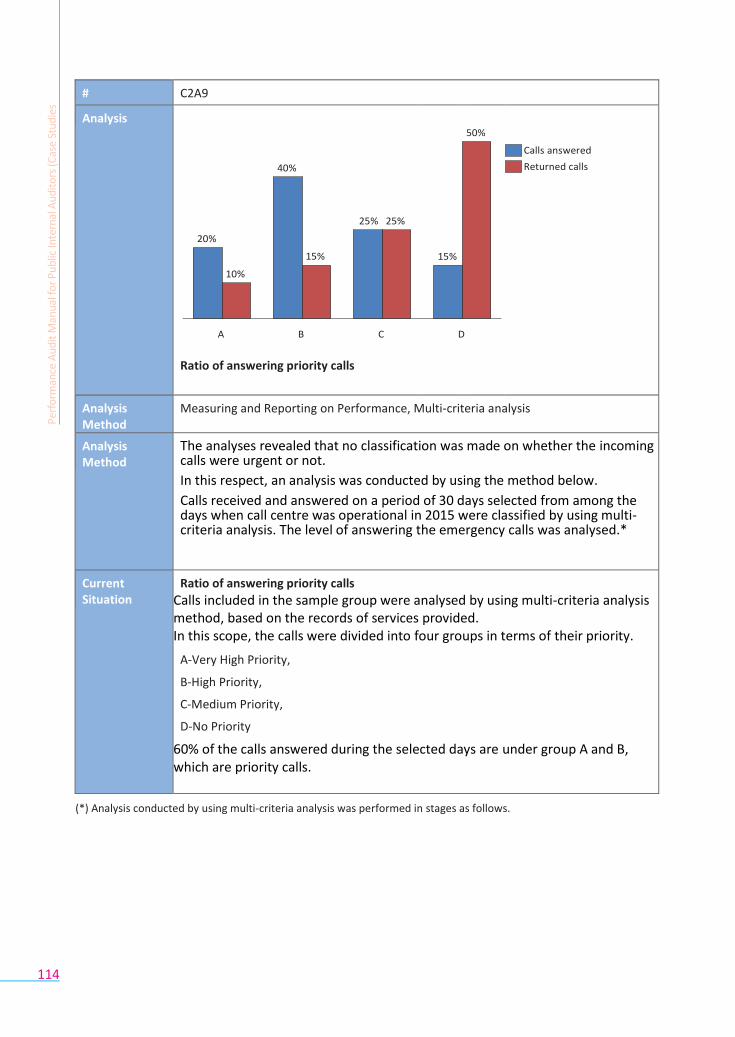
114
# C2A9
Analysis
40%
25% 25%
20%
15%
10%
A B C
Ratio of answering priority calls
15%
D
50%
Calls answered
Returned calls
Analysis Method
Measuring and Reporting on Performance, Multi-criteria analysis
Analysis Method
The analyses revealed that no classification was made on whether the incoming calls were urgent or not.
In this respect, an analysis was conducted by using the method below.
Calls received and answered on a period of 30 days selected from among the days when call centre was operational in 2015 were classified by using multi-criteria analysis. The level of answering the emergency calls was analysed.*
Current Situation
Ratio of answering priority calls
Calls included in the sample group were analysed by using multi-criteria analysis method, based on the records of services provided. In this scope, the calls were divided into four groups in terms of their priority.
A-Very High Priority,
B-High Priority,
C-Medium Priority,
D-No Priority
60% of the calls answered during the selected days are under group A and B, which are priority calls.
(*) Analysis conducted by using multi-criteria analysis was performed in stages as follows.
Per
form
ance
Au
dit
Man
ual
for
Pu
blic
Inte
rnal
Au
dit
ors
(Cas
e St
ud
ies
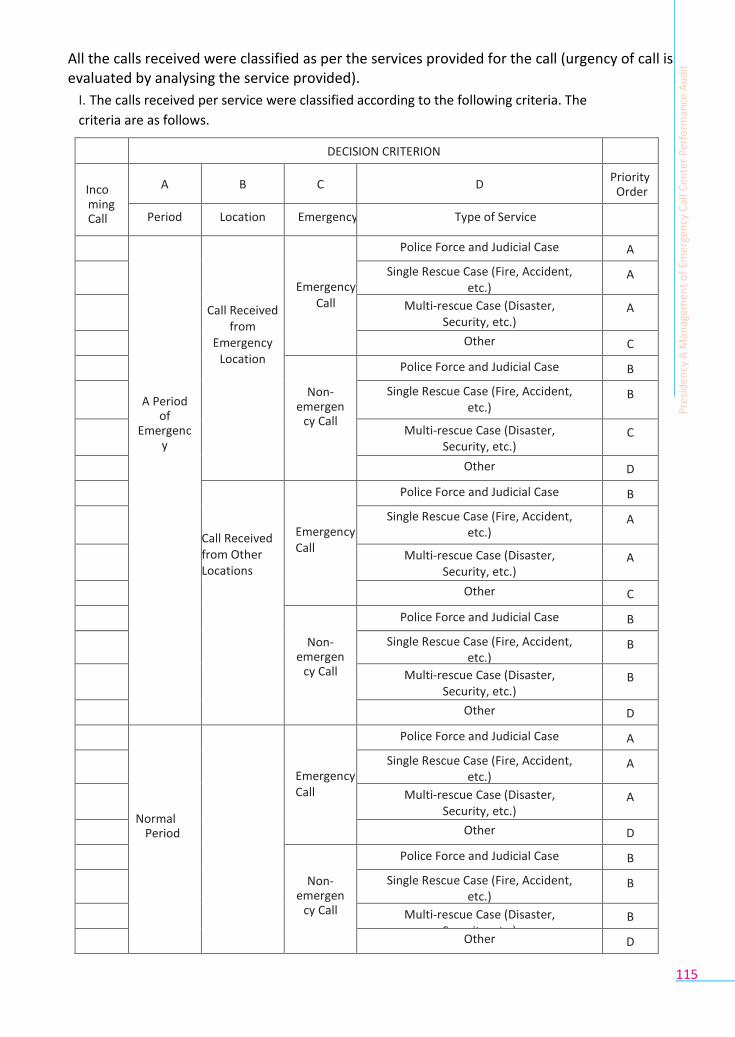
115
All the calls received were classified as per the services provided for the call (urgency of call is evaluated by analysing the service provided).
I. The calls received per service were classified according to the following criteria. The
criteria are as follows.
DECISION CRITERION
Incoming Call
A B C D Priority
Order
Period Location Emergency Type of Service
A Period of
Emergency
Call Received
from Emergency
Location
Emergency Call
Police Force and Judicial Case A
Single Rescue Case (Fire, Accident, etc.)
A
Multi-rescue Case (Disaster, Security, etc.)
A
Other C
Non-emergen
cy Call
Police Force and Judicial Case B
Single Rescue Case (Fire, Accident, etc.)
B
Multi-rescue Case (Disaster, Security, etc.)
C
Other D
Call Received from Other Locations
Emergency Call
Police Force and Judicial Case B
Single Rescue Case (Fire, Accident, etc.)
A
Multi-rescue Case (Disaster, Security, etc.)
A
Other C
Non-emergen
cy Call
Police Force and Judicial Case B
Single Rescue Case (Fire, Accident, etc.)
B
Multi-rescue Case (Disaster, Security, etc.)
B
Other D
Normal
Period
Emergency Call
Police Force and Judicial Case A
Single Rescue Case (Fire, Accident, etc.)
A
Multi-rescue Case (Disaster, Security, etc.)
A
Other D
Non-emergen
cy Call
Police Force and Judicial Case B
Single Rescue Case (Fire, Accident, etc.)
B
Multi-rescue Case (Disaster, Security, etc.)
B
Other D
Pre
sid
en
cy A
Man
agem
en
t o
f Em
erge
ncy
Cal
l Cen
ter
Perf
orm
ance
Au
dit
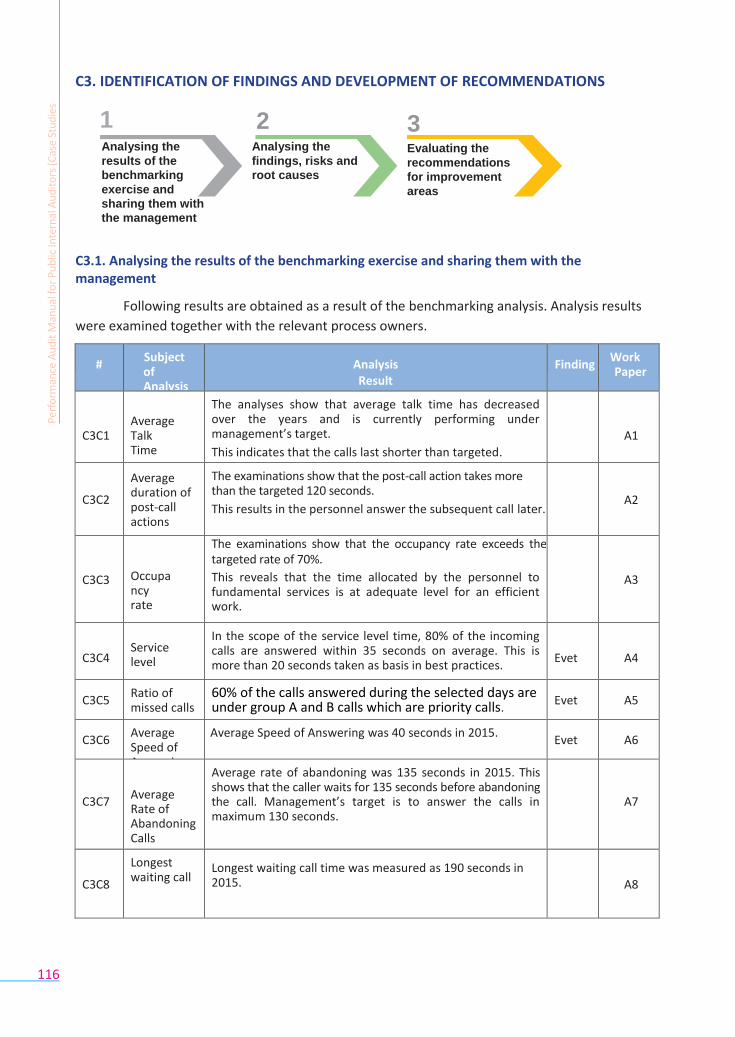
116
Evaluating the
recommendations
for improvement
areas
C3. IDENTIFICATION OF FINDINGS AND DEVELOPMENT OF RECOMMENDATIONS
1 2 3 Analysing the
results of the
benchmarking
exercise and
sharing them with
the management
Analysing the
findings, risks and
root causes
C3.1. Analysing the results of the benchmarking exercise and sharing them with the management
Following results are obtained as a result of the benchmarking analysis. Analysis results
were examined together with the relevant process owners.
# Subject of Analysis
Analysis Result
Finding Work Paper
C3C1
Average Talk Time
The analyses show that average talk time has decreased over the years and is currently performing under management’s target.
This indicates that the calls last shorter than targeted.
A1
C3C2
Average duration of post-call actions
The examinations show that the post-call action takes more than the targeted 120 seconds.
This results in the personnel answer the subsequent call later.
A2
C3C3
Occupancy rate
The examinations show that the occupancy rate exceeds the targeted rate of 70%.
This reveals that the time allocated by the personnel to fundamental services is at adequate level for an efficient work.
A3
C3C4
Service level
In the scope of the service level time, 80% of the incoming calls are answered within 35 seconds on average. This is more than 20 seconds taken as basis in best practices.
Evet
A4
C3C5 Ratio of missed calls
60% of the calls answered during the selected days are under group A and B calls which are priority calls.
Evet A5
C3C6 Average Speed of Answering
Average Speed of Answering was 40 seconds in 2015. Evet A6
C3C7
Average Rate of Abandoning Calls
Average rate of abandoning was 135 seconds in 2015. This shows that the caller waits for 135 seconds before abandoning the call. Management’s target is to answer the calls in maximum 130 seconds.
A7
C3C8
Longest waiting call
Longest waiting call time was measured as 190 seconds in 2015.
A8
Per
form
ance
Au
dit
Man
ual
for
Pu
blic
Inte
rnal
Au
dit
ors
(Cas
e St
ud
ies
117
C3.2. Analysing the findings, risks and root causes
The findings identified as a result of the analyses are consolidated under several headlines.
▪ The audit revealed that 80% of the incoming calls are answered within 35 seconds on
average. Yet, it is understood in the interviews that the resources allocated when
planning the call centre system including its human resources are enough to answer the
incoming calls within 20 seconds on average.
▪ Average speed of answering calls was 40 seconds in 2015.
▪ The late reaction to incoming calls results in 11% of the calls being abandoned without being answered.
Main reason is that some services related with a call are carried out after the call is ended.
This way, the management aims at reducing average time spent on a call. However, as there is no
monitoring and control system on timeliness and efficiency of the post-call actions, there is
unnecessary time loss in the mentioned stage. Post-call action time for a call was 145 seconds in
2015.
6 2014 data.
Pre
sid
en
cy A
Man
agem
en
t o
f Em
erge
ncy
Cal
l Cen
ter
Perf
orm
ance
Au
dit
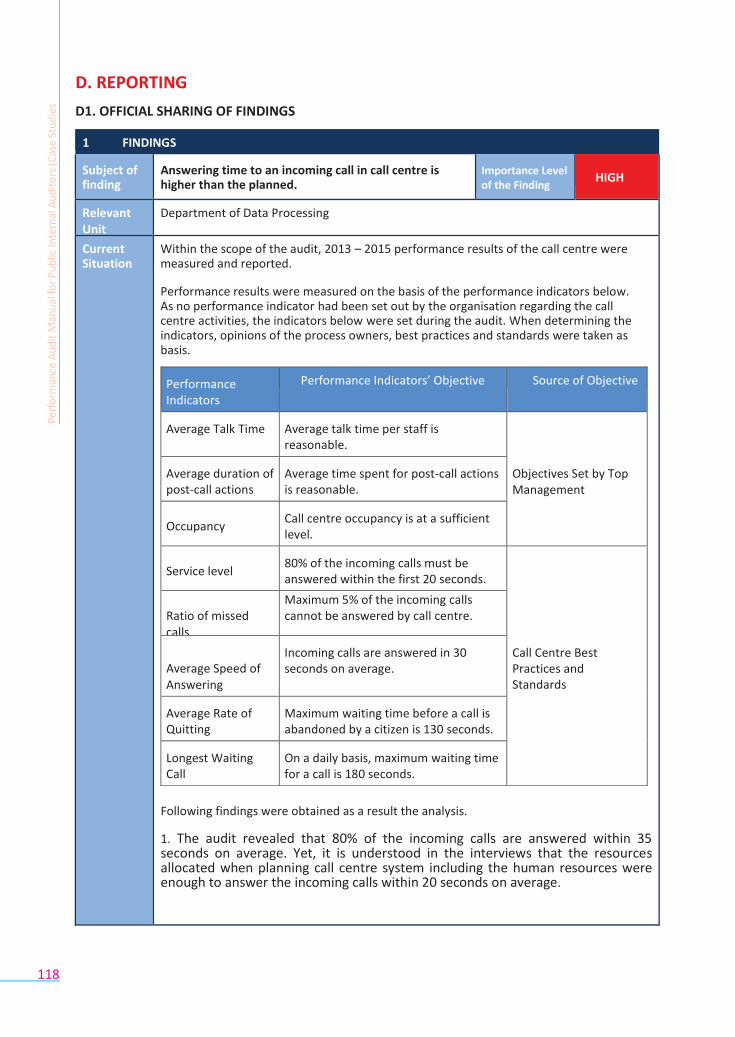
118
D. REPORTING
D1. OFFICIAL SHARING OF FINDINGS
1 FINDINGS
Subject of finding
Answering time to an incoming call in call centre is higher than the planned.
Importance Level of the Finding
HIGH
Relevant Unit
Department of Data Processing
Current Situation
Within the scope of the audit, 2013 – 2015 performance results of the call centre were measured and reported.
Performance results were measured on the basis of the performance indicators below. As no performance indicator had been set out by the organisation regarding the call centre activities, the indicators below were set during the audit. When determining the indicators, opinions of the process owners, best practices and standards were taken as basis.
Following findings were obtained as a result the analysis.
1. The audit revealed that 80% of the incoming calls are answered within 35 seconds on average. Yet, it is understood in the interviews that the resources allocated when planning call centre system including the human resources were enough to answer the incoming calls within 20 seconds on average.
Per
form
ance
Au
dit
Man
ual
for
Pu
blic
Inte
rnal
Au
dit
ors
(Cas
e St
ud
ies
Performance Indicators
Performance Indicators’ Objective Source of Objective
Average Talk Time Average talk time per staff is reasonable.
Objectives Set by Top Management
Average duration of post-call actions
Average time spent for post-call actions is reasonable.
Occupancy
Call centre occupancy is at a sufficient level.
Service level
80% of the incoming calls must be answered within the first 20 seconds.
Call Centre Best Practices and Standards
Ratio of missed calls
Maximum 5% of the incoming calls cannot be answered by call centre.
Average Speed of Answering
Incoming calls are answered in 30 seconds on average.
Average Rate of Quitting
Maximum waiting time before a call is abandoned by a citizen is 130 seconds.
Longest Waiting Call
On a daily basis, maximum waiting time for a call is 180 seconds.
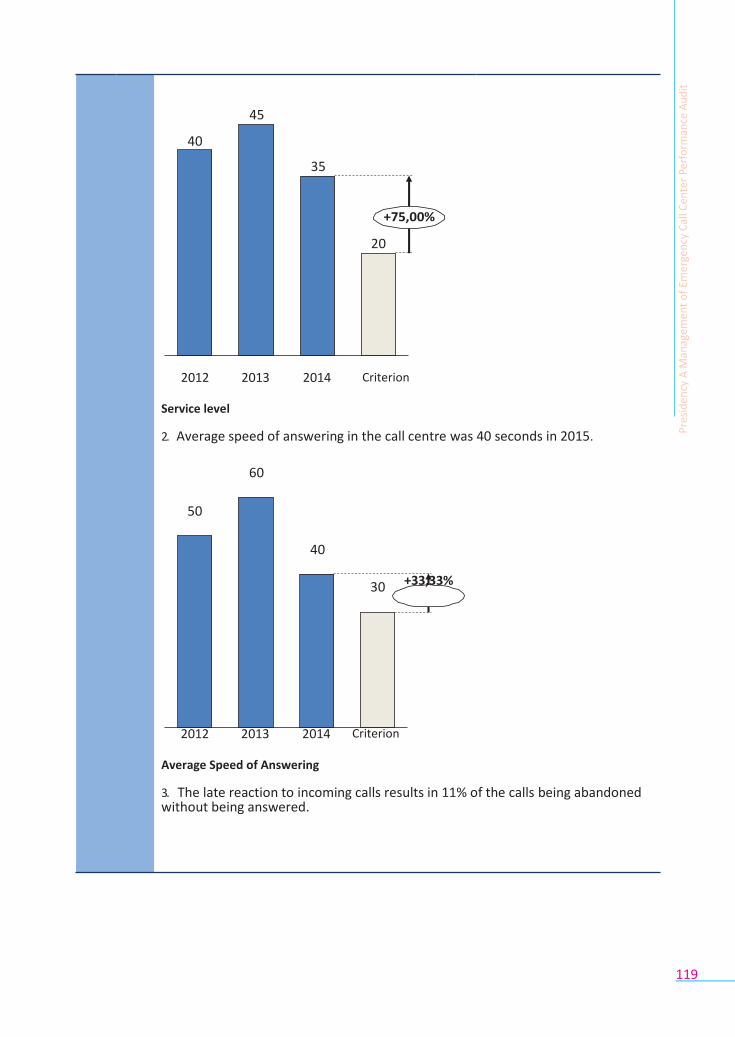
119
45
40
35
+75,00%
20
2012 2013 2014 Criterion
Service level
2. Average speed of answering in the call centre was 40 seconds in 2015.
60
50
40
30 +33,33%
2012
2013
2014
Criterion
Average Speed of Answering
3. The late reaction to incoming calls results in 11% of the calls being abandoned without being answered.
Pre
sid
en
cy A
Man
agem
en
t o
f Em
erge
ncy
Cal
l Cen
ter
Perf
orm
ance
Au
dit
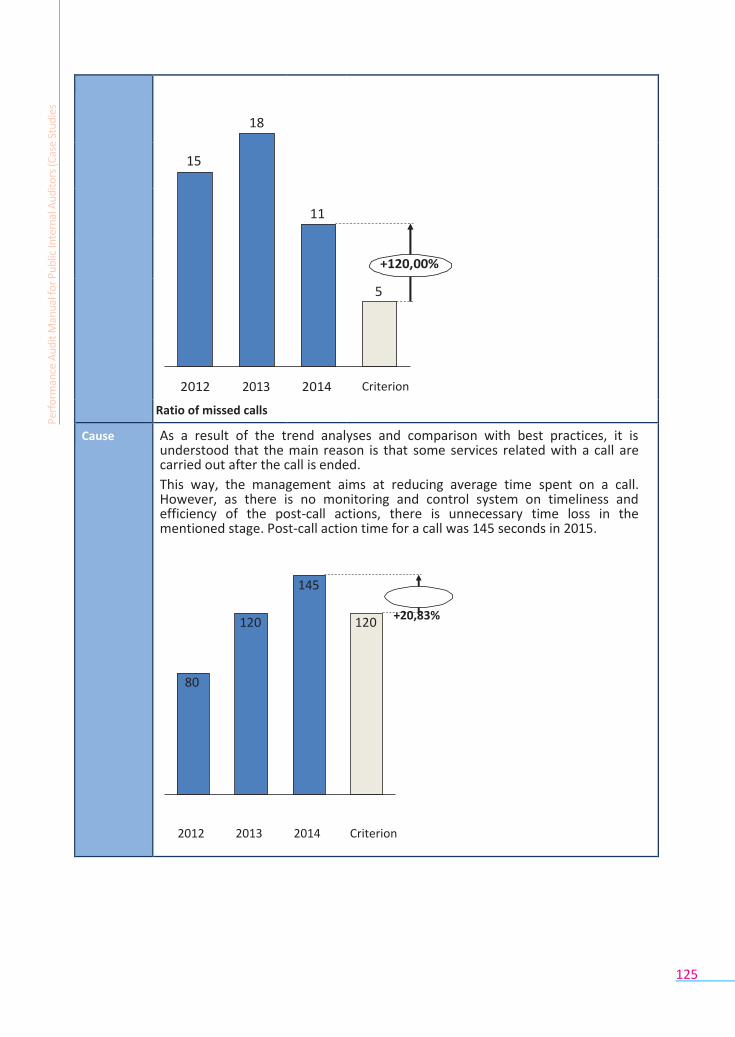
125
18
15
11
+120,00%
5
2012 2013
2014
Criterion
Ratio of missed calls
Cause As a result of the trend analyses and comparison with best practices, it is understood that the main reason is that some services related with a call are carried out after the call is ended.
This way, the management aims at reducing average time spent on a call. However, as there is no monitoring and control system on timeliness and efficiency of the post-call actions, there is unnecessary time loss in the mentioned stage. Post-call action time for a call was 145 seconds in 2015.
145
120 120 +20,83%
80
2012 2013 2014 Criterion
Duration of post-call actions (seconds)
Per
form
ance
Au
dit
Man
ual
for
Pu
blic
Inte
rnal
Au
dit
ors
(Cas
e St
ud
ies
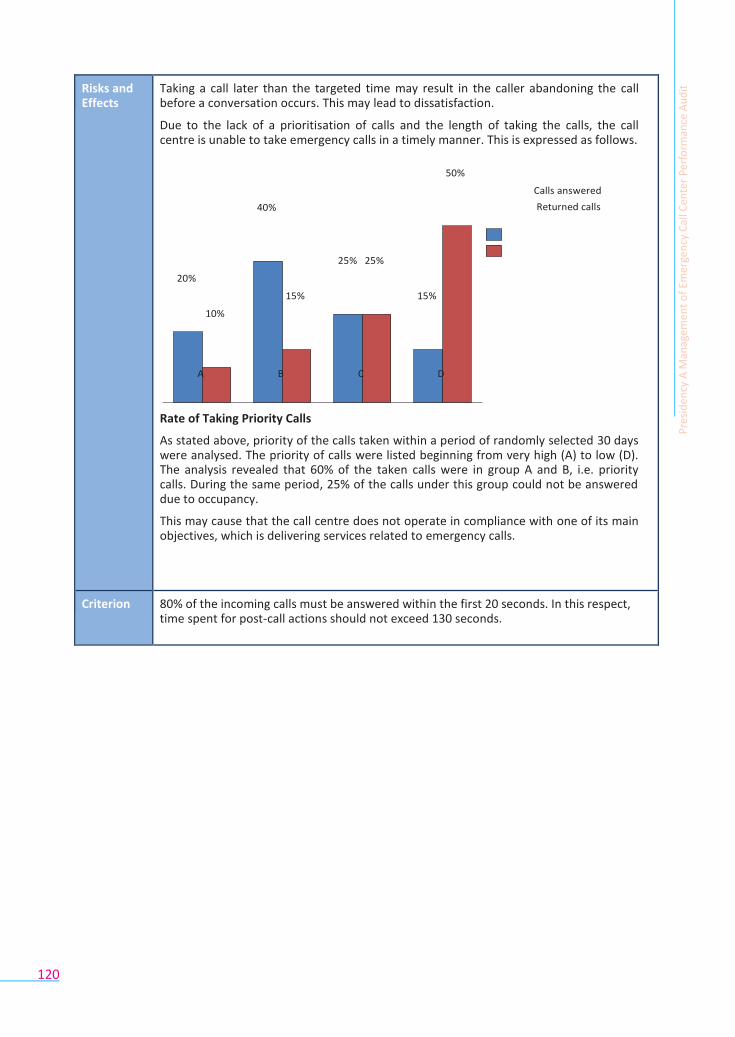
120
Risks and Effects
Taking a call later than the targeted time may result in the caller abandoning the call before a conversation occurs. This may lead to dissatisfaction.
Due to the lack of a prioritisation of calls and the length of taking the calls, the call centre is unable to take emergency calls in a timely manner. This is expressed as follows.
50%
Calls answered
40% Returned calls
25% 25%
20%
15% 15%
10%
A B C D
Rate of Taking Priority Calls
As stated above, priority of the calls taken within a period of randomly selected 30 days were analysed. The priority of calls were listed beginning from very high (A) to low (D). The analysis revealed that 60% of the taken calls were in group A and B, i.e. priority calls. During the same period, 25% of the calls under this group could not be answered due to occupancy.
This may cause that the call centre does not operate in compliance with one of its main objectives, which is delivering services related to emergency calls.
Criterion 80% of the incoming calls must be answered within the first 20 seconds. In this respect, time spent for post-call actions should not exceed 130 seconds.
Pre
sid
en
cy A
Man
agem
en
t o
f Em
erge
ncy
Cal
l Cen
ter
Perf
orm
ance
Au
dit
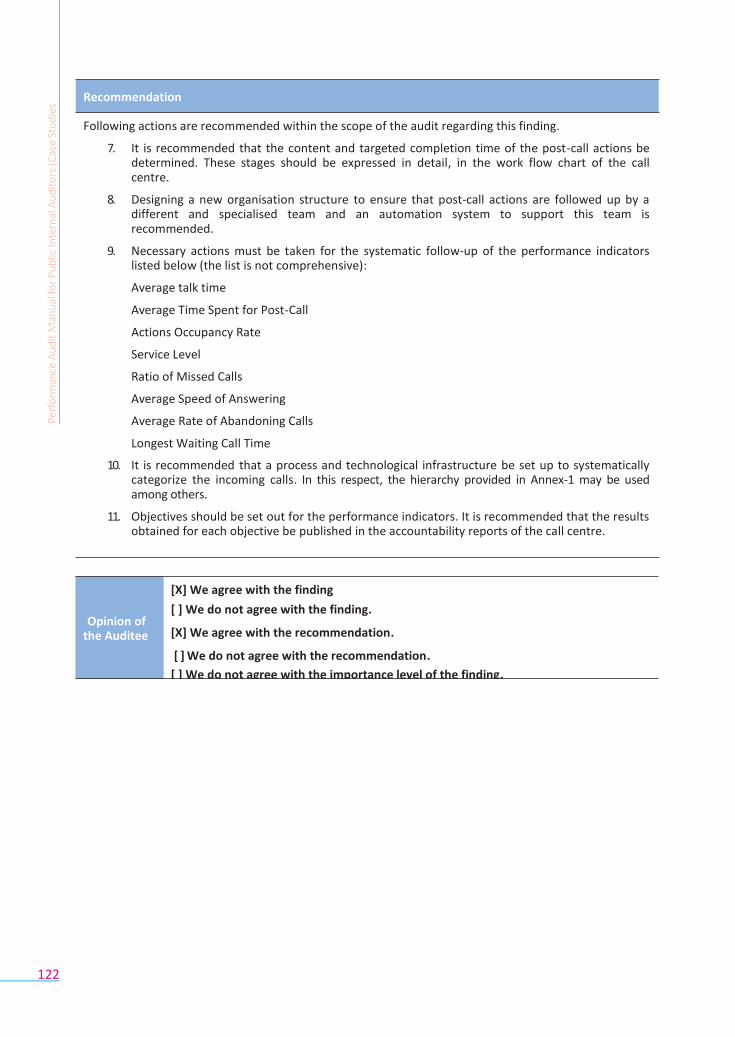
122
Recommendation
Following actions are recommended within the scope of the audit regarding this finding.
7. It is recommended that the content and targeted completion time of the post-call actions be determined. These stages should be expressed in detail, in the work flow chart of the call centre.
8. Designing a new organisation structure to ensure that post-call actions are followed up by a different and specialised team and an automation system to support this team is recommended.
9. Necessary actions must be taken for the systematic follow-up of the performance indicators listed below (the list is not comprehensive):
Average talk time
Average Time Spent for Post-Call
Actions Occupancy Rate
Service Level
Ratio of Missed Calls
Average Speed of Answering
Average Rate of Abandoning Calls
Longest Waiting Call Time
10. It is recommended that a process and technological infrastructure be set up to systematically categorize the incoming calls. In this respect, the hierarchy provided in Annex-1 may be used among others.
11. Objectives should be set out for the performance indicators. It is recommended that the results obtained for each objective be published in the accountability reports of the call centre.
Opinion of
the Auditee
[X] We agree with the finding
[ ] We do not agree with the finding.
[X] We agree with the recommendation.
[ ] We do not agree with the recommendation.
[ ] We do not agree with the importance level of the finding.
Per
form
ance
Au
dit
Man
ual
for
Pu
blic
Inte
rnal
Au
dit
ors
(Cas
e St
ud
ies
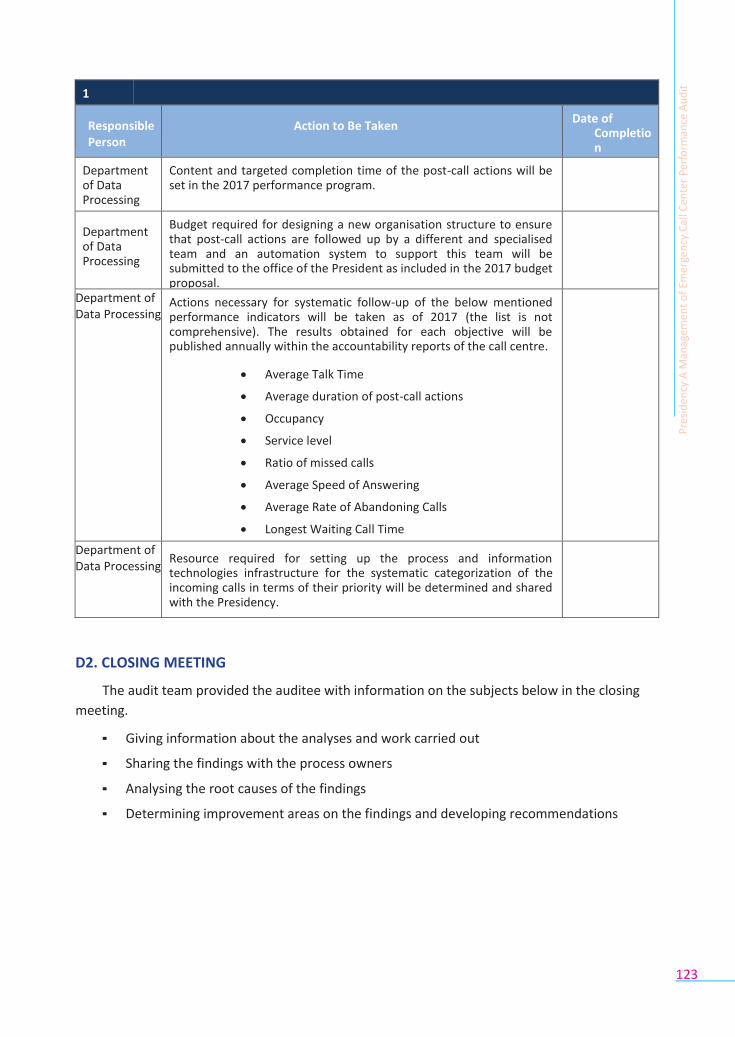
123
1
Responsible Person
Action to Be Taken Date of
Completion
Department of Data Processing
Content and targeted completion time of the post-call actions will be set in the 2017 performance program.
Department of Data Processing
Budget required for designing a new organisation structure to ensure that post-call actions are followed up by a different and specialised team and an automation system to support this team will be submitted to the office of the President as included in the 2017 budget proposal.
Department of Data Processing
Actions necessary for systematic follow-up of the below mentioned performance indicators will be taken as of 2017 (the list is not comprehensive). The results obtained for each objective will be published annually within the accountability reports of the call centre.
Average Talk Time
Average duration of post-call actions
Occupancy
Service level
Ratio of missed calls
Average Speed of Answering
Average Rate of Abandoning Calls
Longest Waiting Call Time
Department of Data Processing
Resource required for setting up the process and information technologies infrastructure for the systematic categorization of the incoming calls in terms of their priority will be determined and shared with the Presidency.
D2. CLOSING MEETING
The audit team provided the auditee with information on the subjects below in the closing
meeting.
▪ Giving information about the analyses and work carried out
▪ Sharing the findings with the process owners
▪ Analysing the root causes of the findings
▪ Determining improvement areas on the findings and developing recommendations
Pre
sid
en
cy A
Man
agem
en
t o
f Em
erge
ncy
Cal
l Cen
ter
Perf
orm
ance
Au
dit
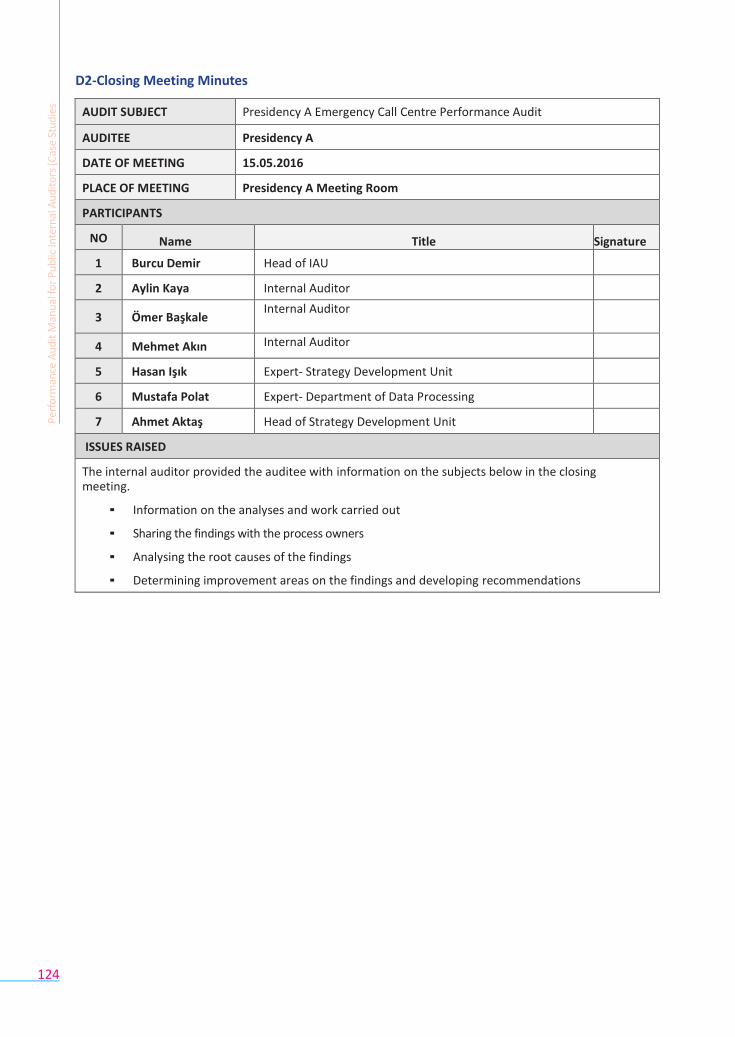
124
D2-Closing Meeting Minutes
AUDIT SUBJECT Presidency A Emergency Call Centre Performance Audit
AUDITEE Presidency A
DATE OF MEETING 15.05.2016
PLACE OF MEETING Presidency A Meeting Room
PARTICIPANTS
NO Name Title Signature
1 Burcu Demir Head of IAU
2 Aylin Kaya Internal Auditor
3 Ömer Başkale Internal Auditor
4 Mehmet Akın Internal Auditor
5 Hasan Işık Expert- Strategy Development Unit
6 Mustafa Polat Expert- Department of Data Processing
7 Ahmet Aktaş Head of Strategy Development Unit
ISSUES RAISED
The internal auditor provided the auditee with information on the subjects below in the closing meeting.
▪ Information on the analyses and work carried out
▪ Sharing the findings with the process owners
▪ Analysing the root causes of the findings
▪ Determining improvement areas on the findings and developing recommendations
Per
form
ance
Au
dit
Man
ual
for
Pu
blic
Inte
rnal
Au
dit
ors
(Cas
e St
ud
ies
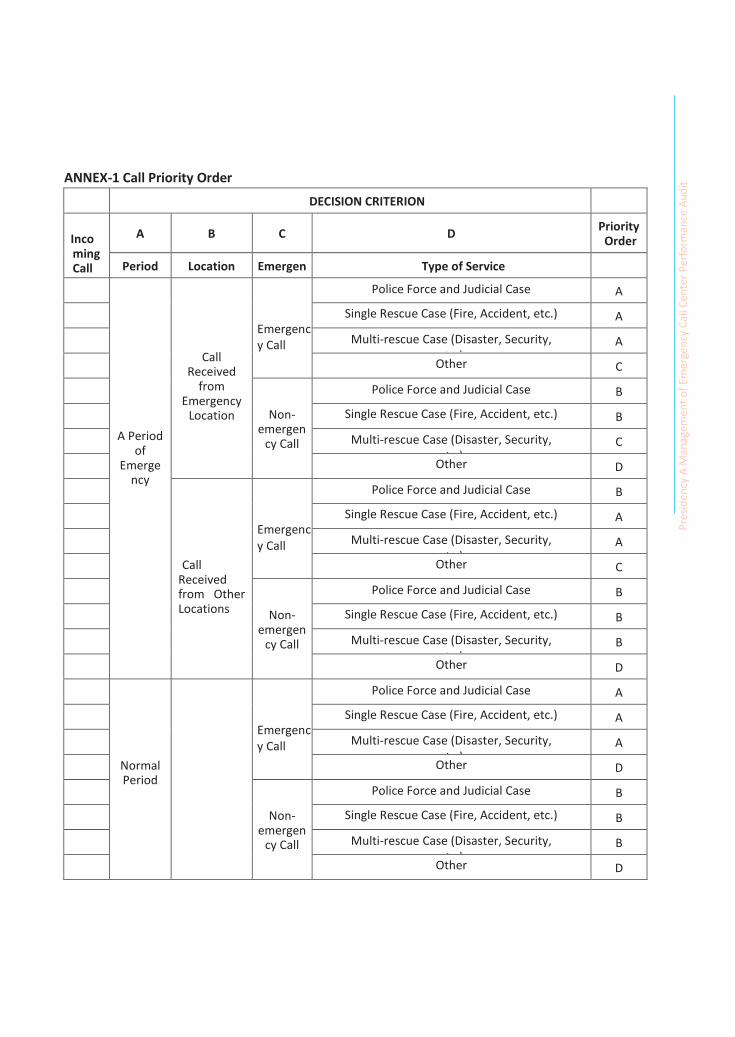
ANNEX-1 Call Priority Order
DECISION CRITERION
Incoming Call
A B C D Priority
Order
Period Location Emergency
Type of Service
A Period
of Emerge
ncy
Call
Received from
Emergency Location
Emergency Call
Police Force and Judicial Case A
Single Rescue Case (Fire, Accident, etc.) A
Multi-rescue Case (Disaster, Security, etc.)
A
Other C
Non-emergen
cy Call
Police Force and Judicial Case B
Single Rescue Case (Fire, Accident, etc.) B
Multi-rescue Case (Disaster, Security, etc.)
C
Other D
Call Received from Other Locations
Emergency Call
Police Force and Judicial Case B
Single Rescue Case (Fire, Accident, etc.) A
Multi-rescue Case (Disaster, Security, etc.)
A
Other C
Non-emergen
cy Call
Police Force and Judicial Case B
Single Rescue Case (Fire, Accident, etc.) B
Multi-rescue Case (Disaster, Security, etc.)
B
Other D
Normal Period
Emergency Call
Police Force and Judicial Case A
Single Rescue Case (Fire, Accident, etc.) A
Multi-rescue Case (Disaster, Security, etc.)
A
Other D
Non-emergen
cy Call
Police Force and Judicial Case B
Single Rescue Case (Fire, Accident, etc.) B
Multi-rescue Case (Disaster, Security, etc.)
B
Other D
Pre
sid
en
cy A
Man
agem
en
t o
f Em
erge
ncy
Cal
l Cen
ter
Perf
orm
ance
Au
dit

127
Performance Audit of the Transition to Electronic System Program within Ministry A
The content used in case study is not associated with any organisation, practice or person.
The content developed is completely fictional.

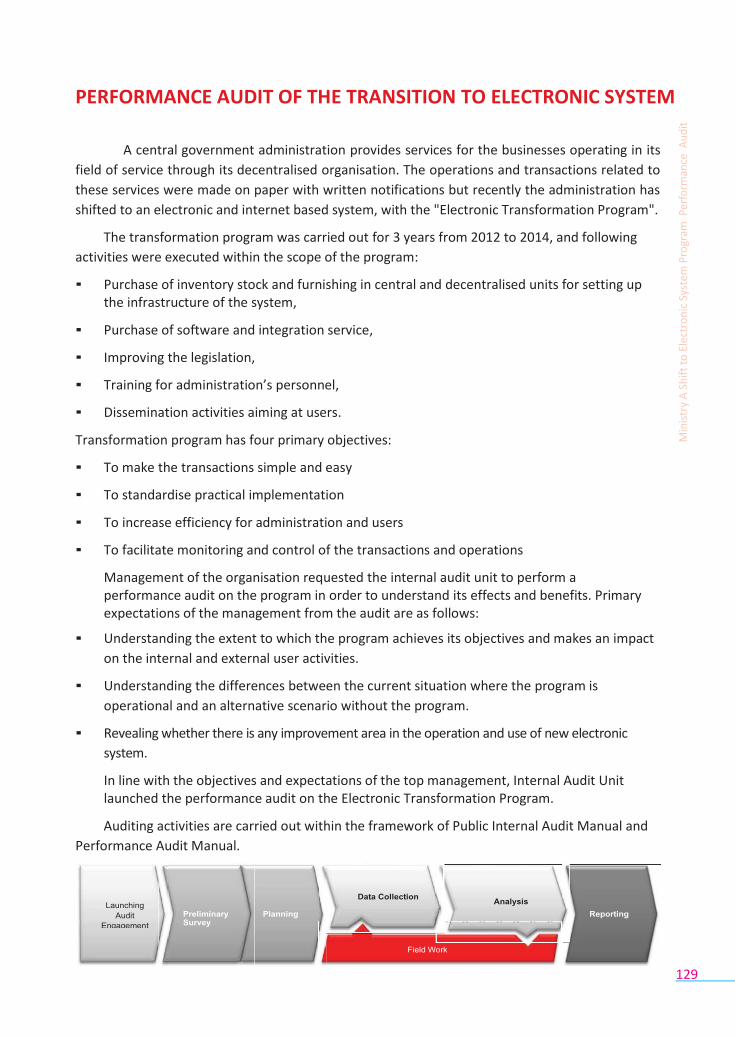
129
PERFORMANCE AUDIT OF THE TRANSITION TO ELECTRONIC SYSTEM
A central government administration provides services for the businesses operating in its
field of service through its decentralised organisation. The operations and transactions related to
these services were made on paper with written notifications but recently the administration has
shifted to an electronic and internet based system, with the "Electronic Transformation Program".
The transformation program was carried out for 3 years from 2012 to 2014, and following
activities were executed within the scope of the program:
▪ Purchase of inventory stock and furnishing in central and decentralised units for setting up the infrastructure of the system,
▪ Purchase of software and integration service,
▪ Improving the legislation,
▪ Training for administration’s personnel,
▪ Dissemination activities aiming at users.
Transformation program has four primary objectives:
▪ To make the transactions simple and easy
▪ To standardise practical implementation
▪ To increase efficiency for administration and users
▪ To facilitate monitoring and control of the transactions and operations
Management of the organisation requested the internal audit unit to perform a performance audit on the program in order to understand its effects and benefits. Primary expectations of the management from the audit are as follows:
▪ Understanding the extent to which the program achieves its objectives and makes an impact
on the internal and external user activities.
▪ Understanding the differences between the current situation where the program is
operational and an alternative scenario without the program.
▪ Revealing whether there is any improvement area in the operation and use of new electronic
system.
In line with the objectives and expectations of the top management, Internal Audit Unit launched the performance audit on the Electronic Transformation Program.
Auditing activities are carried out within the framework of Public Internal Audit Manual and
Performance Audit Manual.
Min
istr
y A
Sh
ift
to E
lect
ron
ic S
yste
m P
rogr
am P
erfo
rman
ce A
ud
it
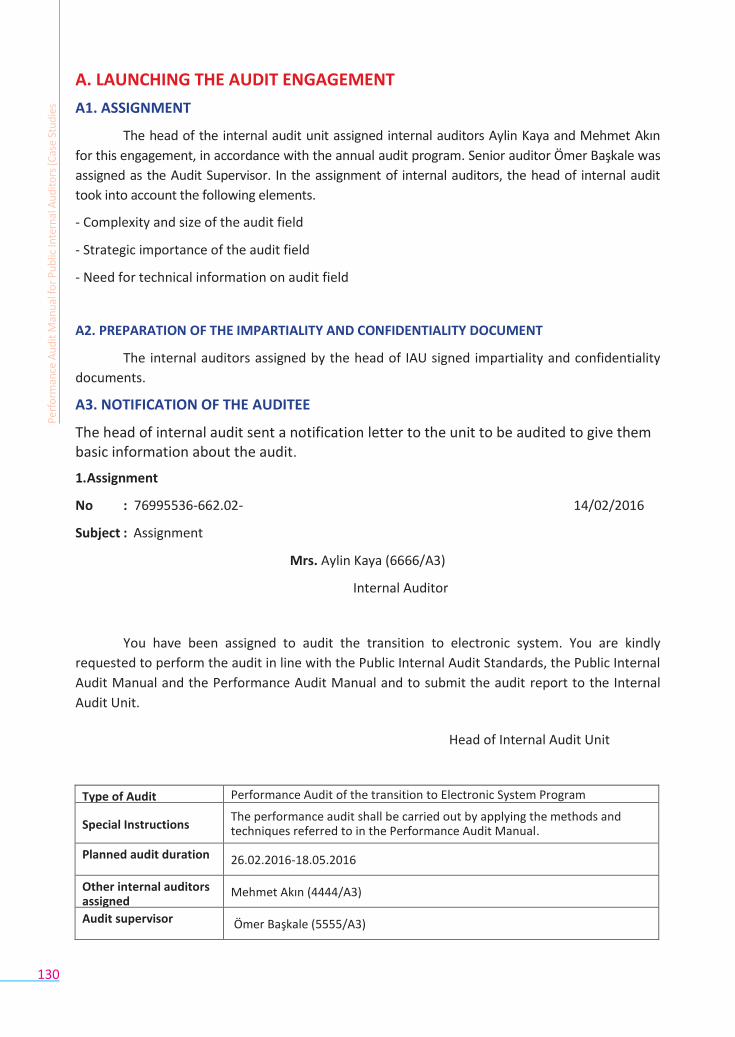
130
A. LAUNCHING THE AUDIT ENGAGEMENT
A1. ASSIGNMENT
The head of the internal audit unit assigned internal auditors Aylin Kaya and Mehmet Akın
for this engagement, in accordance with the annual audit program. Senior auditor Ömer Başkale was
assigned as the Audit Supervisor. In the assignment of internal auditors, the head of internal audit
took into account the following elements.
- Complexity and size of the audit field
- Strategic importance of the audit field
- Need for technical information on audit field
A2. PREPARATION OF THE IMPARTIALITY AND CONFIDENTIALITY DOCUMENT
The internal auditors assigned by the head of IAU signed impartiality and confidentiality
documents.
A3. NOTIFICATION OF THE AUDITEE
The head of internal audit sent a notification letter to the unit to be audited to give them basic information about the audit.
1. Assignment
No : 76995536-662.02- 14/02/2016
Subject : Assignment
Mrs. Aylin Kaya (6666/A3)
Internal Auditor
You have been assigned to audit the transition to electronic system. You are kindly
requested to perform the audit in line with the Public Internal Audit Standards, the Public Internal
Audit Manual and the Performance Audit Manual and to submit the audit report to the Internal
Audit Unit.
Head of Internal Audit Unit
Type of Audit Performance Audit of the transition to Electronic System Program
Special Instructions The performance audit shall be carried out by applying the methods and techniques referred to in the Performance Audit Manual.
Planned audit duration 26.02.2016-18.05.2016
Other internal auditors assigned
Mehmet Akın (4444/A3)
Audit supervisor Ömer Başkale (5555/A3)
Per
form
ance
Au
dit
Man
ual
for
Pu
blic
Inte
rnal
Au
dit
ors
(Cas
e St
ud
ies
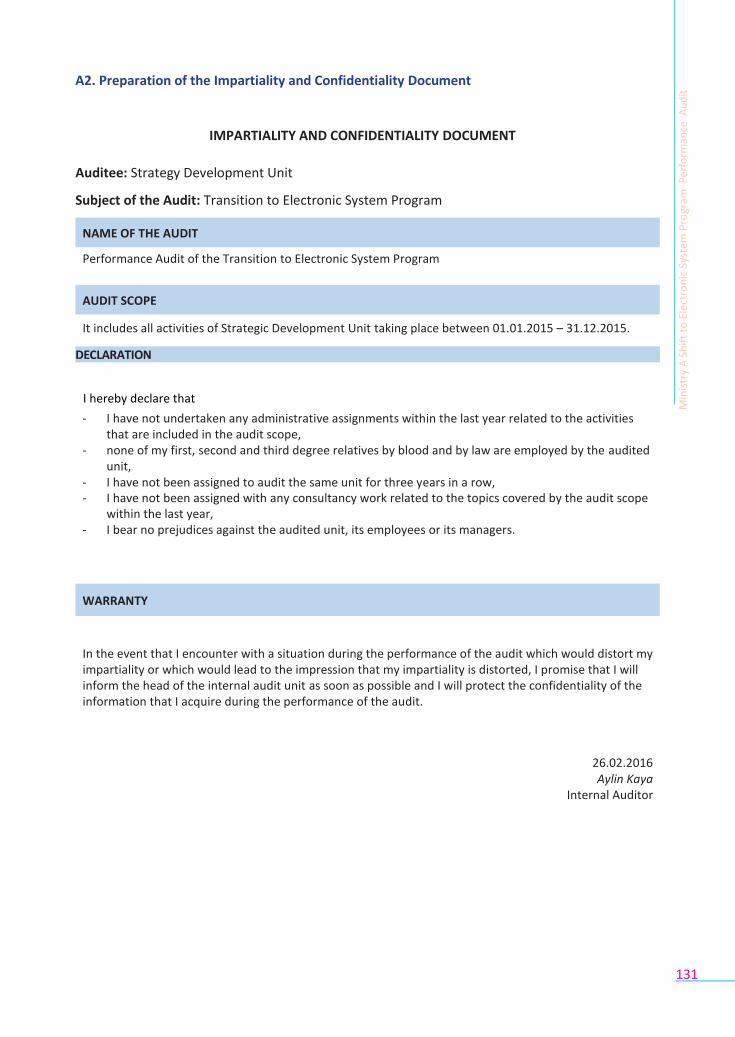
131
A2. Preparation of the Impartiality and Confidentiality Document
IMPARTIALITY AND CONFIDENTIALITY DOCUMENT
Auditee: Strategy Development Unit
Subject of the Audit: Transition to Electronic System Program
Performance Audit of the Transition to Electronic System Program
It includes all activities of Strategic Development Unit taking place between 01.01.2015 – 31.12.2015.
DECLARATION
I hereby declare that
- I have not undertaken any administrative assignments within the last year related to the activities that are included in the audit scope,
- none of my first, second and third degree relatives by blood and by law are employed by the audited unit,
- I have not been assigned to audit the same unit for three years in a row, - I have not been assigned with any consultancy work related to the topics covered by the audit scope
within the last year, - I bear no prejudices against the audited unit, its employees or its managers.
In the event that I encounter with a situation during the performance of the audit which would distort my impartiality or which would lead to the impression that my impartiality is distorted, I promise that I will inform the head of the internal audit unit as soon as possible and I will protect the confidentiality of the information that I acquire during the performance of the audit.
26.02.2016 Aylin Kaya
Internal Auditor
NAME OF THE AUDIT
AUDIT SCOPE
WARRANTY
Min
istr
y A
Sh
ift
to E
lect
ron
ic S
yste
m P
rogr
am P
erfo
rman
ce A
ud
it
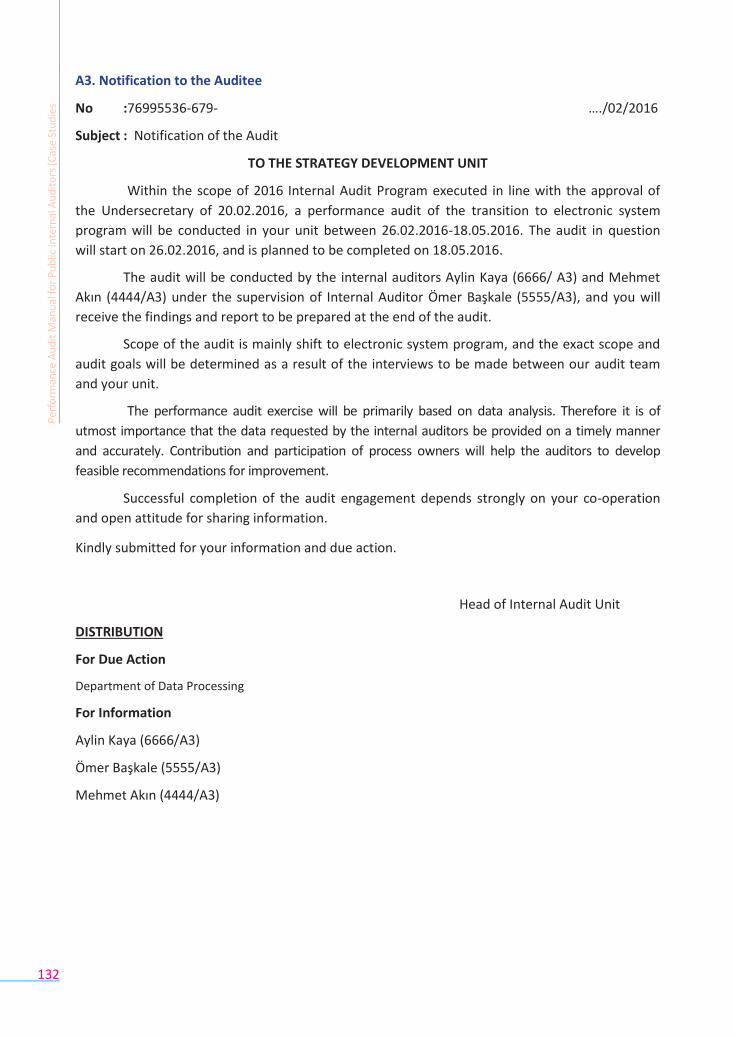
132
A3. Notification to the Auditee
No :76995536-679- …./02/2016
Subject : Notification of the Audit
TO THE STRATEGY DEVELOPMENT UNIT
Within the scope of 2016 Internal Audit Program executed in line with the approval of
the Undersecretary of 20.02.2016, a performance audit of the transition to electronic system
program will be conducted in your unit between 26.02.2016-18.05.2016. The audit in question
will start on 26.02.2016, and is planned to be completed on 18.05.2016.
The audit will be conducted by the internal auditors Aylin Kaya (6666/ A3) and Mehmet
Akın (4444/A3) under the supervision of Internal Auditor Ömer Başkale (5555/A3), and you will
receive the findings and report to be prepared at the end of the audit.
Scope of the audit is mainly shift to electronic system program, and the exact scope and
audit goals will be determined as a result of the interviews to be made between our audit team
and your unit.
The performance audit exercise will be primarily based on data analysis. Therefore it is of
utmost importance that the data requested by the internal auditors be provided on a timely manner
and accurately. Contribution and participation of process owners will help the auditors to develop
feasible recommendations for improvement.
Successful completion of the audit engagement depends strongly on your co-operation
and open attitude for sharing information.
Kindly submitted for your information and due action.
Head of Internal Audit Unit
DISTRIBUTION
For Due Action
Department of Data Processing
For Information
Aylin Kaya (6666/A3)
Ömer Başkale (5555/A3)
Mehmet Akın (4444/A3)
Per
form
ance
Au
dit
Man
ual
for
Pu
blic
Inte
rnal
Au
dit
ors
(Cas
e St
ud
ies
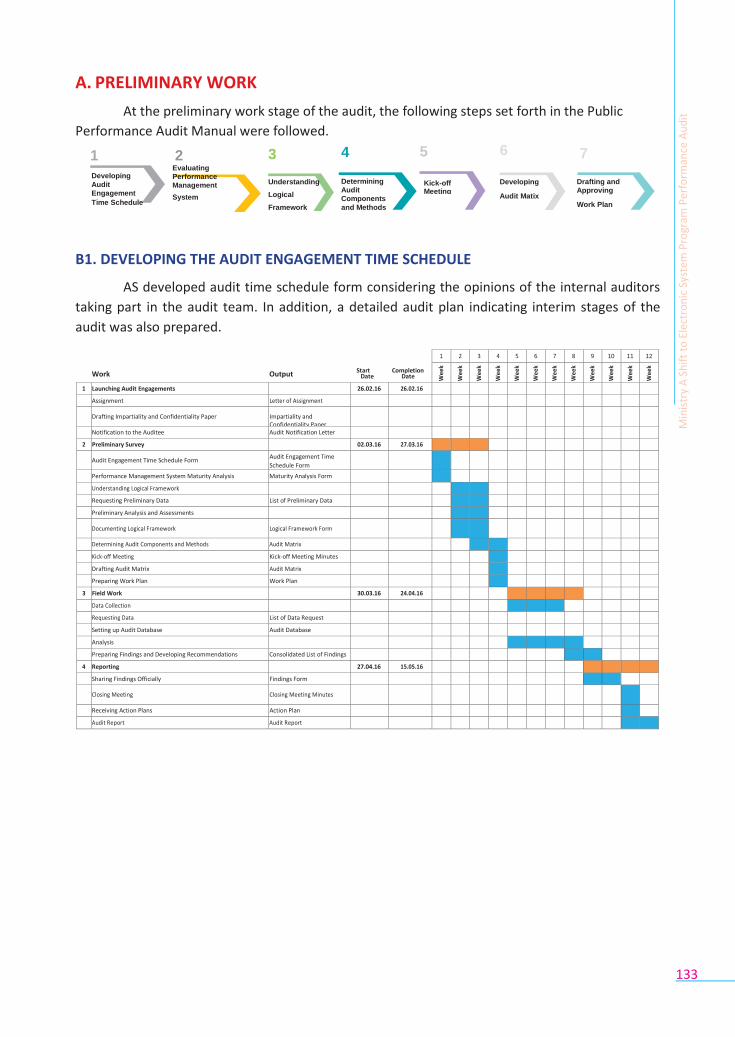
133
Determining
Audit
Components
and Methods
Kick-off Meeting
Understanding
Logical
Framework
Developing
Audit Matix
Drafting and
Approving
Work Plan
A. PRELIMINARY WORK
At the preliminary work stage of the audit, the following steps set forth in the Public
Performance Audit Manual were followed.
1 2 3 4 5 6 7 Evaluating
Performance
Management
System
B1. DEVELOPING THE AUDIT ENGAGEMENT TIME SCHEDULE
AS developed audit time schedule form considering the opinions of the internal auditors
taking part in the audit team. In addition, a detailed audit plan indicating interim stages of the
audit was also prepared.
Work Output Start Completion Date Date
1 2 3 4 5 6 7 8 9 10 11 12
Wee
k
Wee
k
Wee
k
Wee
k
Wee
k
Wee
k
Wee
k
Wee
k
Wee
k
Wee
k
Wee
k
Wee
k
1 Launching Audit Engagements 26.02.16 26.02.16 Assignment Letter of Assignment Drafting Impartiality and Confidentiality Paper Impartiality and
Confidentiality Paper
Notification to the Auditee Audit Notification Letter 2 Preliminary Survey 02.03.16 27.03.16
Audit Engagement Time Schedule Form Audit Engagement Time
Schedule Form
Performance Management System Maturity Analysis Maturity Analysis Form Understanding Logical Framework Requesting Preliminary Data List of Preliminary Data
Request Preliminary Analysis and Assessments Documenting Logical Framework Logical Framework Form
Determining Audit Components and Methods Audit Matrix Kick-off Meeting Kick-off Meeting Minutes Drafting Audit Matrix Audit Matrix Preparing Work Plan Work Plan
3 Field Work 30.03.16 24.04.16 Data Collection Requesting Data List of Data Request Setting up Audit Database Audit Database Analysis Preparing Findings and Developing Recommendations Consolidated List of Findings
4 Reporting 27.04.16 15.05.16 Sharing Findings Officially Findings Form Closing Meeting Closing Meeting Minutes
Receiving Action Plans Action Plan Audit Report Audit Report
Min
istr
y A
Sh
ift
to E
lect
ron
ic S
yste
m P
rogr
am P
erfo
rman
ce A
ud
it
Developing
Audit
Engagement
Time Schedule
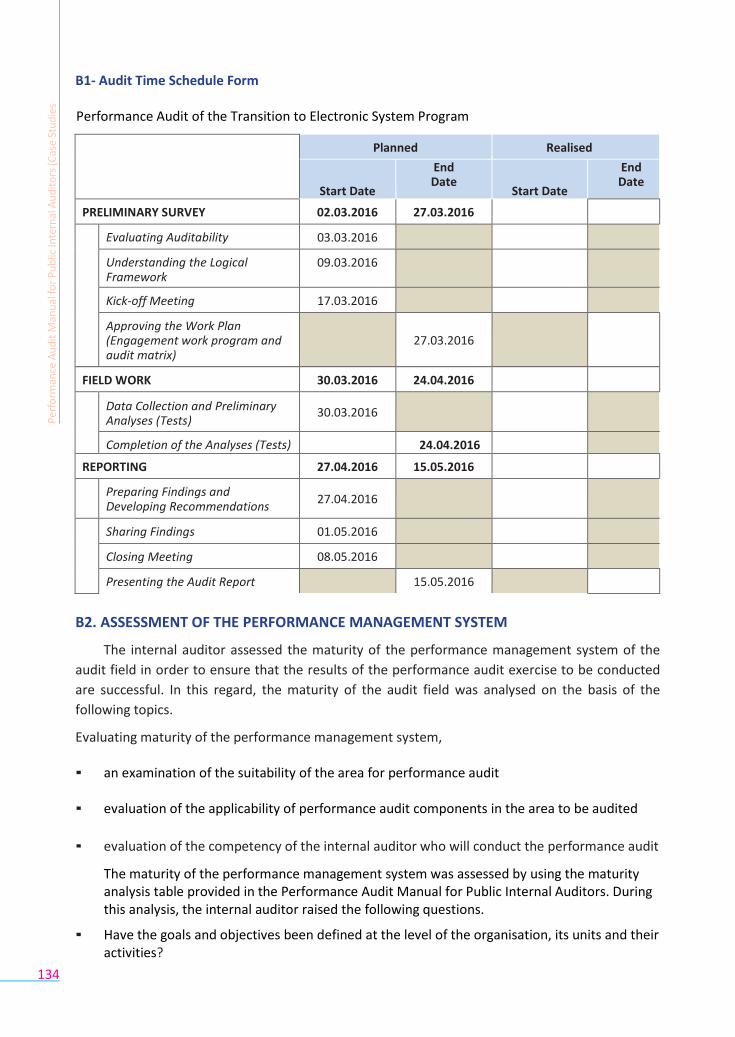
134
B1- Audit Time Schedule Form Performance Audit of the Transition to Electronic System Program
Planned Realised
Start Date
End Date
Start Date
End Date
PRELIMINARY SURVEY 02.03.2016 27.03.2016
Evaluating Auditability 03.03.2016
Understanding the Logical Framework
09.03.2016
Kick-off Meeting 17.03.2016
Approving the Work Plan (Engagement work program and audit matrix)
27.03.2016
FIELD WORK 30.03.2016 24.04.2016
Data Collection and Preliminary Analyses (Tests)
30.03.2016
Completion of the Analyses (Tests) 24.04.2016
REPORTING 27.04.2016 15.05.2016
Preparing Findings and Developing Recommendations
27.04.2016
Sharing Findings 01.05.2016
Closing Meeting 08.05.2016
Presenting the Audit Report 15.05.2016
B2. ASSESSMENT OF THE PERFORMANCE MANAGEMENT SYSTEM
The internal auditor assessed the maturity of the performance management system of the
audit field in order to ensure that the results of the performance audit exercise to be conducted
are successful. In this regard, the maturity of the audit field was analysed on the basis of the
following topics.
Evaluating maturity of the performance management system,
▪ an examination of the suitability of the area for performance audit
▪ evaluation of the applicability of performance audit components in the area to be audited
▪ evaluation of the competency of the internal auditor who will conduct the performance audit
The maturity of the performance management system was assessed by using the maturity analysis table provided in the Performance Audit Manual for Public Internal Auditors. During this analysis, the internal auditor raised the following questions.
▪ Have the goals and objectives been defined at the level of the organisation, its units and their activities?
Per
form
ance
Au
dit
Man
ual
for
Pu
blic
Inte
rnal
Au
dit
ors
(Cas
e St
ud
ies
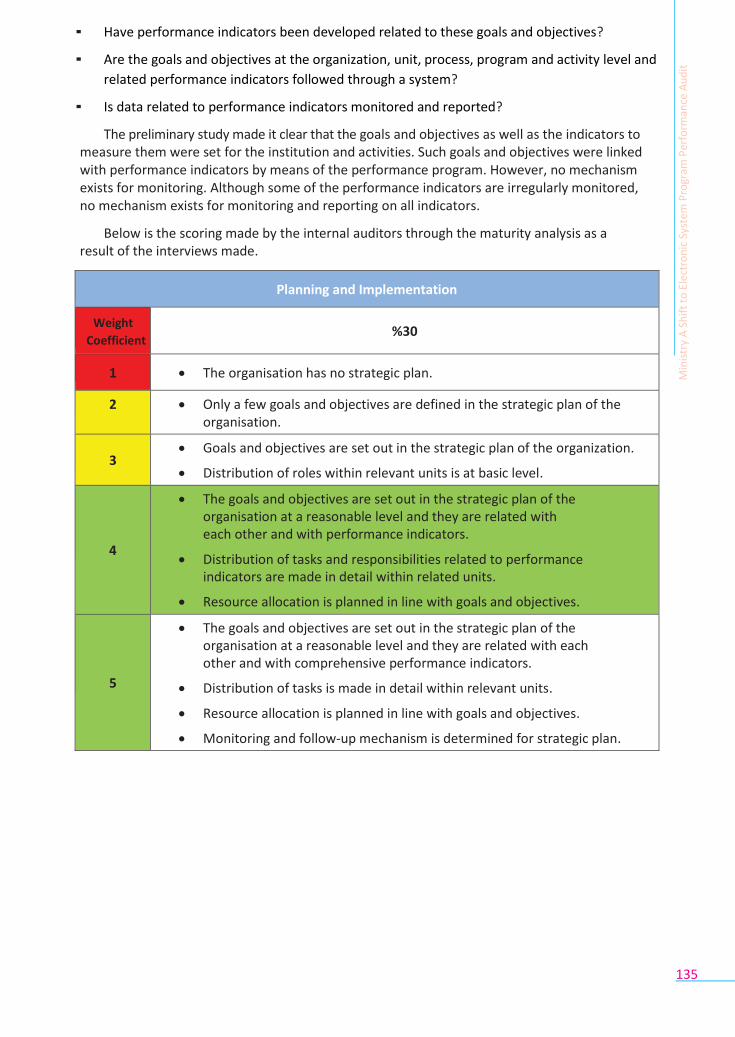
135
▪ Have performance indicators been developed related to these goals and objectives?
▪ Are the goals and objectives at the organization, unit, process, program and activity level and
related performance indicators followed through a system?
▪ Is data related to performance indicators monitored and reported?
The preliminary study made it clear that the goals and objectives as well as the indicators to measure them were set for the institution and activities. Such goals and objectives were linked with performance indicators by means of the performance program. However, no mechanism exists for monitoring. Although some of the performance indicators are irregularly monitored, no mechanism exists for monitoring and reporting on all indicators.
Below is the scoring made by the internal auditors through the maturity analysis as a result of the interviews made.
Planning and Implementation
Weight
Coefficient
%30
1 The organisation has no strategic plan.
2 Only a few goals and objectives are defined in the strategic plan of the organisation.
3 Goals and objectives are set out in the strategic plan of the organization.
Distribution of roles within relevant units is at basic level.
4
The goals and objectives are set out in the strategic plan of the organisation at a reasonable level and they are related with each other and with performance indicators.
Distribution of tasks and responsibilities related to performance indicators are made in detail within related units.
Resource allocation is planned in line with goals and objectives.
5
The goals and objectives are set out in the strategic plan of the organisation at a reasonable level and they are related with each other and with comprehensive performance indicators.
Distribution of tasks is made in detail within relevant units.
Resource allocation is planned in line with goals and objectives.
Monitoring and follow-up mechanism is determined for strategic plan.
Min
istr
y A
Sh
ift
to E
lect
ron
ic S
yste
m P
rogr
am P
erfo
rman
ce A
ud
it
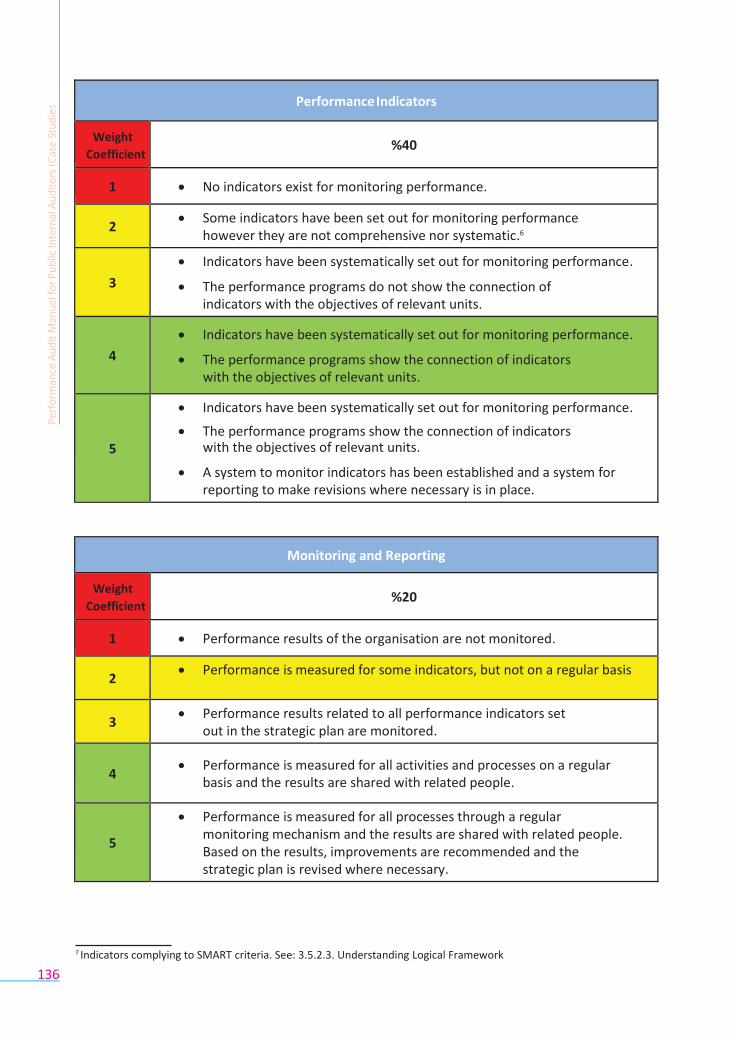
136
Performance Indicators
Weight
Coefficient
%40
1 No indicators exist for monitoring performance.
2 Some indicators have been set out for monitoring performance
however they are not comprehensive nor systematic.6
3
Indicators have been systematically set out for monitoring performance.
The performance programs do not show the connection of indicators with the objectives of relevant units.
4
Indicators have been systematically set out for monitoring performance.
The performance programs show the connection of indicators with the objectives of relevant units.
5
Indicators have been systematically set out for monitoring performance.
The performance programs show the connection of indicators with the objectives of relevant units.
A system to monitor indicators has been established and a system for reporting to make revisions where necessary is in place.
Monitoring and Reporting
Weight
Coefficient
%20
1 Performance results of the organisation are not monitored.
2 Performance is measured for some indicators, but not on a regular basis
3 Performance results related to all performance indicators set
out in the strategic plan are monitored.
4
Performance is measured for all activities and processes on a regular basis and the results are shared with related people.
5
Performance is measured for all processes through a regular monitoring mechanism and the results are shared with related people. Based on the results, improvements are recommended and the strategic plan is revised where necessary.
7 Indicators complying to SMART criteria. See: 3.5.2.3. Understanding Logical Framework
Per
form
ance
Au
dit
Man
ual
for
Pu
blic
Inte
rnal
Au
dit
ors
(Cas
e St
ud
ies
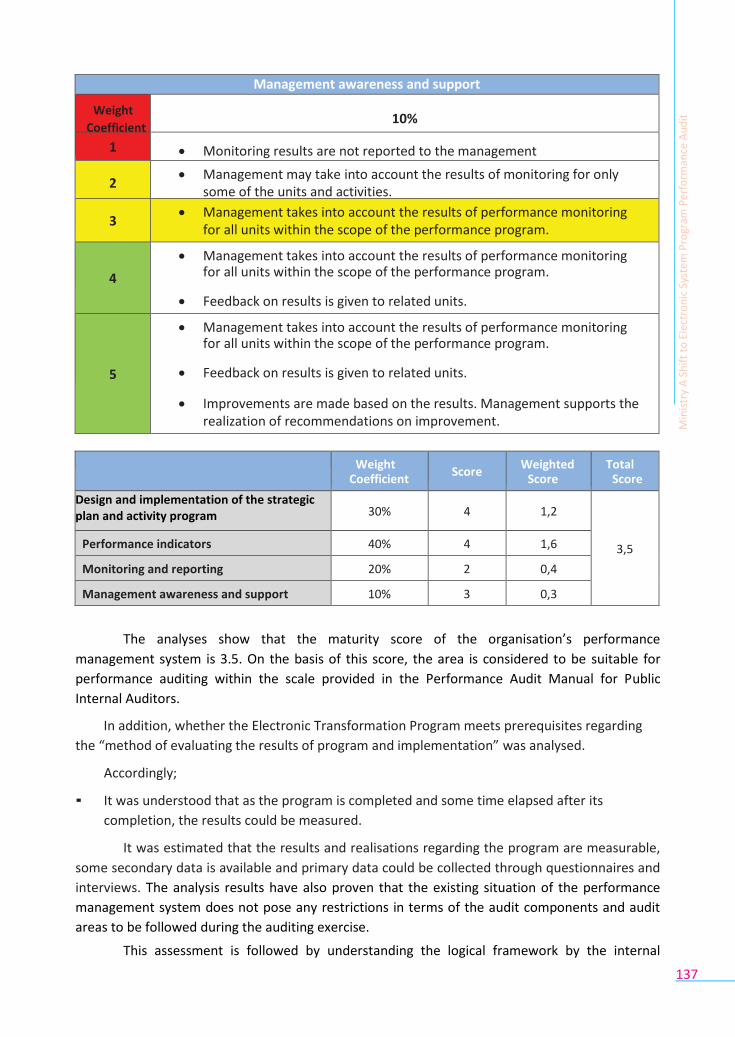
137
Management awareness and support
Weight
Coefficient
10%
1 Monitoring results are not reported to the management
. 2 Management may take into account the results of monitoring for only
some of the units and activities.
3 Management takes into account the results of performance monitoring
for all units within the scope of the performance program.
.
4
Management takes into account the results of performance monitoring for all units within the scope of the performance program.
Feedback on results is given to related units.
.
5
Management takes into account the results of performance monitoring for all units within the scope of the performance program.
Feedback on results is given to related units.
Improvements are made based on the results. Management supports the realization of recommendations on improvement.
Weight Coefficient
Score Weighted
Score Total
Score
Design and implementation of the strategic plan and activity program 30% 4 1,2
3,5 Performance indicators 40% 4 1,6
Monitoring and reporting 20% 2 0,4
Management awareness and support 10% 3 0,3
The analyses show that the maturity score of the organisation’s performance
management system is 3.5. On the basis of this score, the area is considered to be suitable for
performance auditing within the scale provided in the Performance Audit Manual for Public
Internal Auditors.
In addition, whether the Electronic Transformation Program meets prerequisites regarding
the “method of evaluating the results of program and implementation” was analysed.
Accordingly;
▪ It was understood that as the program is completed and some time elapsed after its
completion, the results could be measured.
It was estimated that the results and realisations regarding the program are measurable,
some secondary data is available and primary data could be collected through questionnaires and
interviews. The analysis results have also proven that the existing situation of the performance
management system does not pose any restrictions in terms of the audit components and audit
areas to be followed during the auditing exercise.
This assessment is followed by understanding the logical framework by the internal
Min
istr
y A
Sh
ift
to E
lect
ron
ic S
yste
m P
rogr
am P
erfo
rman
ce A
ud
it

138
auditors.
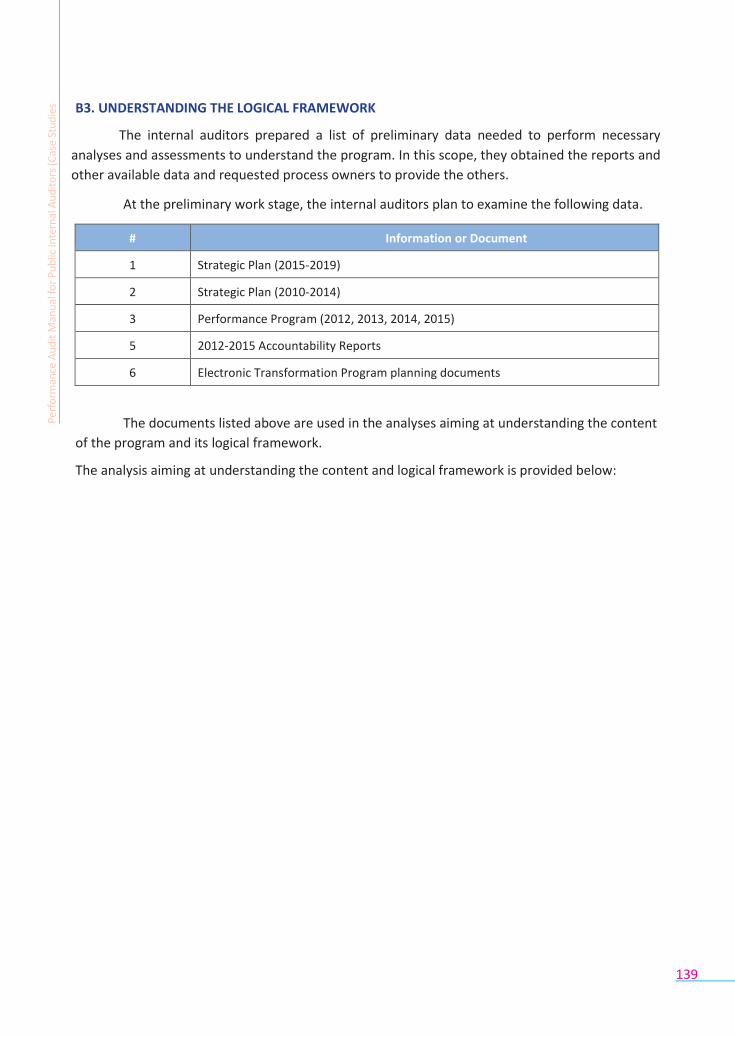
139
B3. UNDERSTANDING THE LOGICAL FRAMEWORK
The internal auditors prepared a list of preliminary data needed to perform necessary
analyses and assessments to understand the program. In this scope, they obtained the reports and
other available data and requested process owners to provide the others.
At the preliminary work stage, the internal auditors plan to examine the following data.
# Information or Document
1 Strategic Plan (2015-2019)
2 Strategic Plan (2010-2014)
3 Performance Program (2012, 2013, 2014, 2015)
5 2012-2015 Accountability Reports
6 Electronic Transformation Program planning documents
The documents listed above are used in the analyses aiming at understanding the content
of the program and its logical framework.
The analysis aiming at understanding the content and logical framework is provided below:
Per
form
ance
Au
dit
Man
ual
for
Pu
blic
Inte
rnal
Au
dit
ors
(Cas
e St
ud
ies
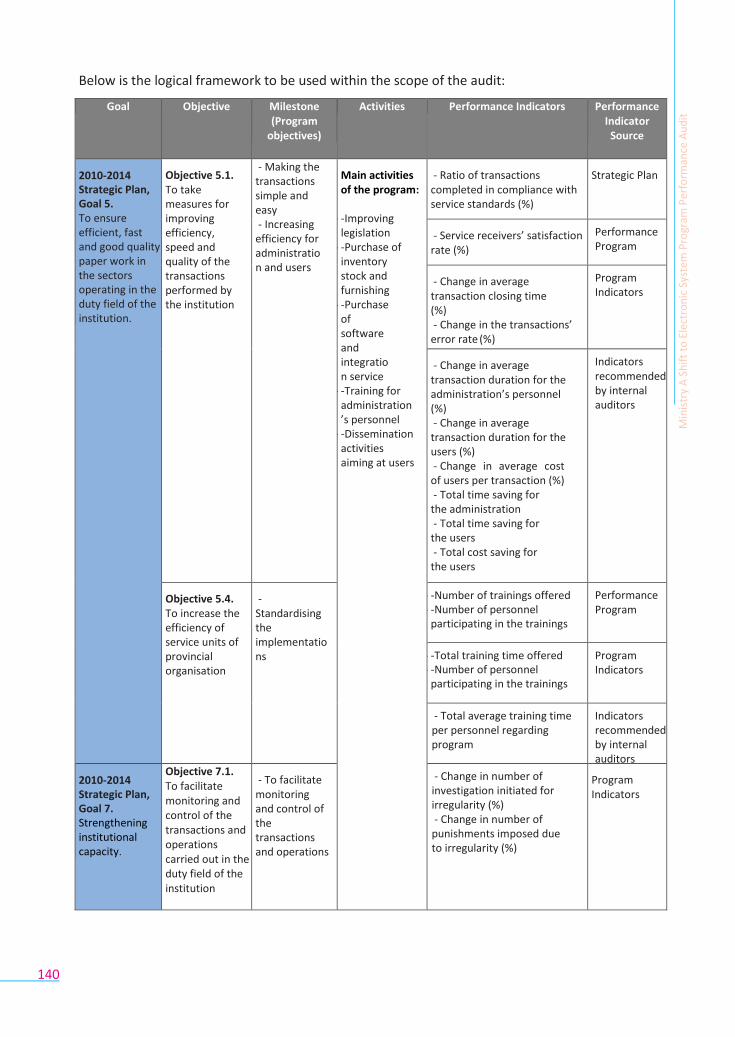
140
Below is the logical framework to be used within the scope of the audit:
Goal Objective Milestone (Program
objectives)
Activities Performance Indicators Performance Indicator
Source
2010-2014 Strategic Plan, Goal 5. To ensure efficient, fast and good quality paper work in the sectors operating in the duty field of the institution.
Objective 5.1. To take measures for improving efficiency, speed and quality of the transactions performed by the institution
- Making the transactions simple and easy - Increasing
efficiency for administration and users
Main activities of the program:
- -Improving legislation
- -Purchase of inventory stock and furnishing
- -Purchase of software and integration service
- -Training for administration’s personnel
- -Dissemination activities aiming at users
- Ratio of transactions completed in compliance with service standards (%)
Strategic Plan
- Service receivers’ satisfaction rate (%)
Performance Program
- Change in average transaction closing time (%) - Change in the transactions’
error rate (%)
Program Indicators
- Change in average transaction duration for the administration’s personnel (%) - Change in average
transaction duration for the users (%) - Change in average cost
of users per transaction (%) - Total time saving for
the administration - Total time saving for
the users - Total cost saving for
the users
Indicators recommended by internal auditors
Objective 5.4. To increase the efficiency of service units of provincial organisation
- Standardising the implementations
- -Number of trainings offered - -Number of personnel
participating in the trainings
Performance Program
- -Total training time offered - -Number of personnel
participating in the trainings
Program Indicators
- Total average training time per personnel regarding program
Indicators recommended by internal auditors
2010-2014 Strategic Plan, Goal 7. Strengthening institutional capacity.
Objective 7.1. To facilitate monitoring and control of the transactions and operations carried out in the duty field of the institution
- To facilitate monitoring and control of the transactions and operations
- Change in number of investigation initiated for irregularity (%) - Change in number of
punishments imposed due to irregularity (%)
Program Indicators
Min
istr
y A
Sh
ift
to E
lect
ron
ic S
yste
m P
rogr
am P
erfo
rman
ce A
ud
it
140
B4. IDENTIFICATION OF AUDIT COMPONENTS AND METHODS
Taking the opinions of the internal auditors, AS decided to assess the economy,
sustainability, effectiveness, efficiency, consistency and conformity of the program during the
audit to be conducted within the framework of expectations of the management.
The audit to be conducted aims at assessing the activities under the program within the
framework of the audit components below and determining improvement areas.
▪ Economy; Obtaining appropriate quality and amount of resources at the most reasonable cost.
▪ Productivity; assessment of whether the output generated from the available resources is at an adequate level.
▪ Effectiveness; capacity to reach objectives and realise intended results
▪ Consistency; coherence between the defined goals, objectives and strategies of public
administrations and the planning and design of their programs and projects
▪ Sustainability; continuing to use activity outputs and making them widespread, as the case
may be, and reuse of them by other organisations and stakeholders
▪ Conformity; examining whether the projects, programs, processes and activities executed by
public administrations comply with relevant legislation, procedures and generally accepted
principles, and the maturity of the process regarding the institutional capacity of the
organisations executing such activities
Within the scope of the audit aiming at assessing the above mentioned components, the internal auditors mostly plan to evaluate the program and implementation results and to use the method of measuring and reporting on performance.
Performance audit to be executed using these methods aims at;
▪ measuring and reporting on the results in the areas affected by the program
▪ understanding the difference between the current situation with the program and the alternative scenario without the program and understanding the real effect of the program, i.e. causality of the intervention on the results via the program.
B5. KICK-OFF MEETING
The internal auditor provided the auditee with information on the subjects below in the kick-
off meeting.
▪ Audit Team and its organisation
▪ Audit Scope
▪ Audit Stages
▪ Time Schedule
▪ Following Steps
Per
form
ance
Au
dit
Man
ual
for
Pu
blic
Inte
rnal
Au
dit
ors
(Cas
e St
ud
ies
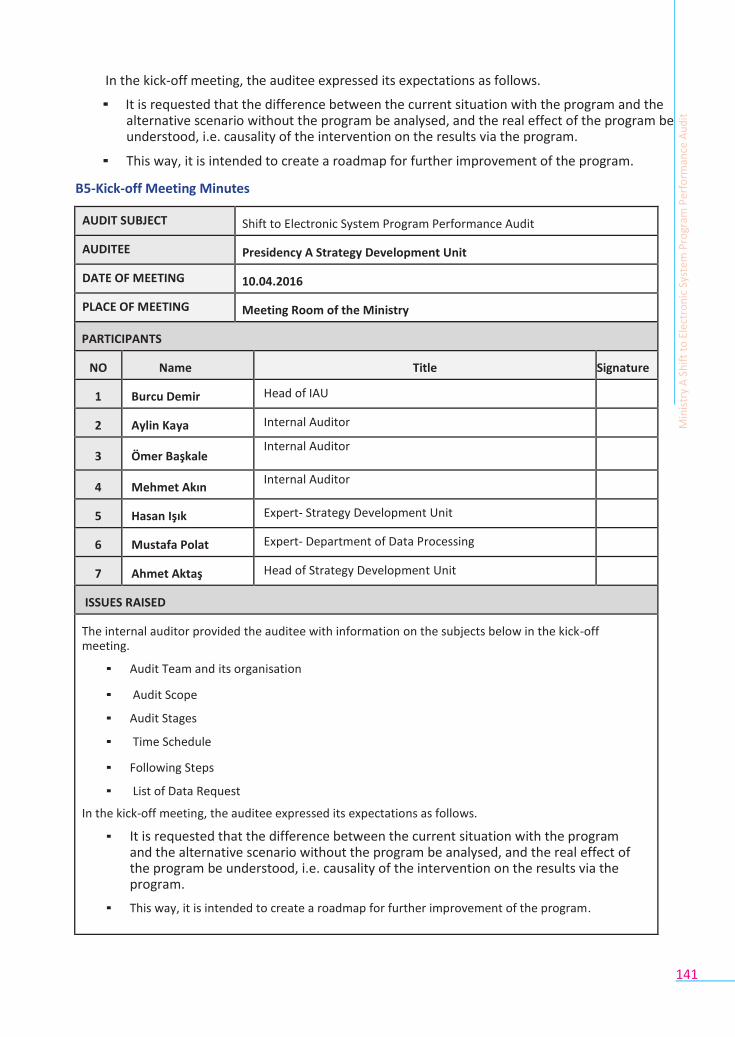
141
In the kick-off meeting, the auditee expressed its expectations as follows.
▪ It is requested that the difference between the current situation with the program and the alternative scenario without the program be analysed, and the real effect of the program be understood, i.e. causality of the intervention on the results via the program.
▪ This way, it is intended to create a roadmap for further improvement of the program.
B5-Kick-off Meeting Minutes
AUDIT SUBJECT Shift to Electronic System Program Performance Audit
AUDITEE Presidency A Strategy Development Unit
DATE OF MEETING 10.04.2016
PLACE OF MEETING Meeting Room of the Ministry
PARTICIPANTS
NO Name Title Signature
1 Burcu Demir Head of IAU
2 Aylin Kaya Internal Auditor
3 Ömer Başkale Internal Auditor
4 Mehmet Akın Internal Auditor
5 Hasan Işık Expert- Strategy Development Unit
6 Mustafa Polat Expert- Department of Data Processing
7 Ahmet Aktaş Head of Strategy Development Unit
ISSUES RAISED
The internal auditor provided the auditee with information on the subjects below in the kick-off meeting.
▪ Audit Team and its organisation
▪ Audit Scope
▪ Audit Stages
▪ Time Schedule
▪ Following Steps
▪ List of Data Request
In the kick-off meeting, the auditee expressed its expectations as follows.
▪ It is requested that the difference between the current situation with the program and the alternative scenario without the program be analysed, and the real effect of the program be understood, i.e. causality of the intervention on the results via the program.
▪ This way, it is intended to create a roadmap for further improvement of the program.
Min
istr
y A
Sh
ift
to E
lect
ron
ic S
yste
m P
rogr
am P
erfo
rman
ce A
ud
it

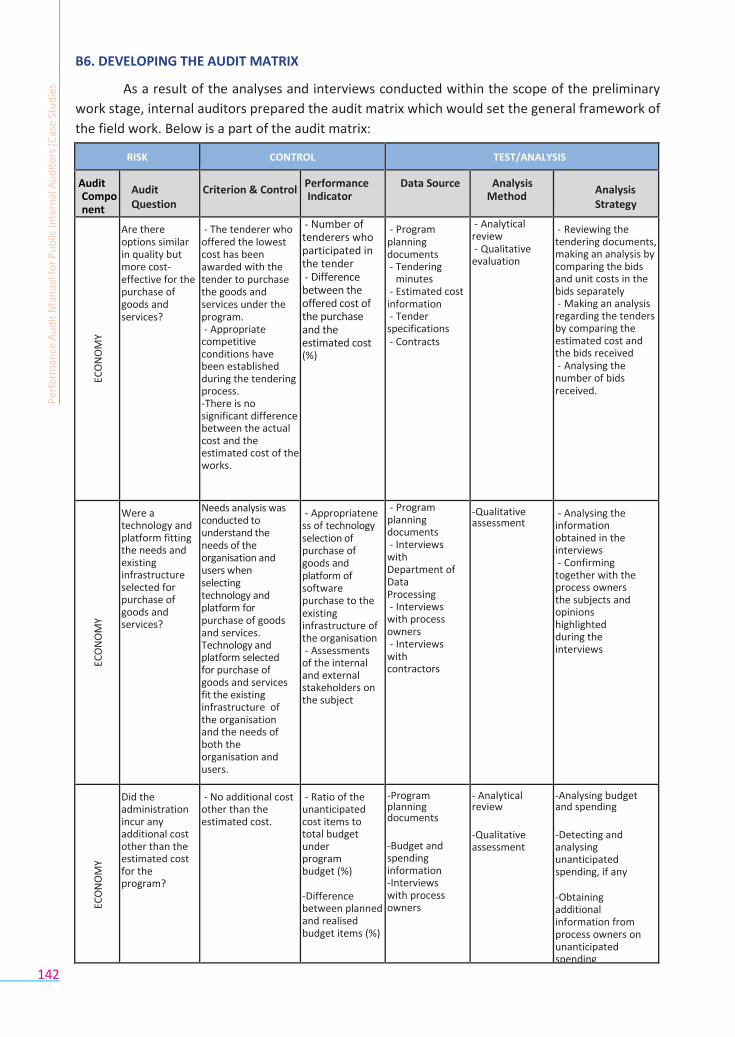
142
B6. DEVELOPING THE AUDIT MATRIX
As a result of the analyses and interviews conducted within the scope of the preliminary
work stage, internal auditors prepared the audit matrix which would set the general framework of
the field work. Below is a part of the audit matrix:
RISK CONTROL TEST/ANALYSIS
Audit Component
Audit Question
Criterion & Control Performance Indicator
Data Source Analysis Method
Analysis Strategy
EC
ON
OM
Y
Are there options similar in quality but more cost-effective for the purchase of goods and services?
- The tenderer who offered the lowest cost has been awarded with the tender to purchase the goods and services under the program. - Appropriate competitive conditions have been established during the tendering process. -There is no significant difference between the actual cost and the estimated cost of the works.
- Number of tenderers who participated in the tender - Difference between the offered cost of the purchase and the estimated cost (%)
- Program planning documents - Tendering
minutes - Estimated cost information - Tender specifications - Contracts
- Analytical review - Qualitative evaluation
- Reviewing the tendering documents, making an analysis by comparing the bids and unit costs in the bids separately - Making an analysis regarding the tenders by comparing the estimated cost and the bids received - Analysing the number of bids received.
EC
ON
OM
Y
Were a technology and platform fitting the needs and existing infrastructure selected for purchase of goods and services?
Needs analysis was conducted to understand the needs of the organisation and users when selecting technology and platform for purchase of goods and services. Technology and platform selected for purchase of goods and services fit the existing infrastructure of the organisation and the needs of both the organisation and users.
- Appropriateness of technology selection of purchase of goods and platform of software purchase to the existing infrastructure of the organisation - Assessments of the internal and external stakeholders on the subject
- Program planning documents - Interviews with Department of Data Processing - Interviews with process owners - Interviews with contractors
- -Qualitative assessment
- Analysing the information obtained in the interviews - Confirming together with the process owners the subjects and opinions highlighted during the interviews
EC
ON
OM
Y
Did the administration incur any additional cost other than the estimated cost for the program?
- No additional cost other than the estimated cost.
- Ratio of the unanticipated cost items to total budget under program budget (%) -Difference between planned and realised budget items (%)
- -Program planning documents
- - -Budget and
spending information
- -Interviews with process owners
- - Analytical review
- - -Qualitative
assessment
- -Analysing budget and spending
- - -Detecting and
analysing unanticipated spending, if any
- - -Obtaining
additional information from process owners on unanticipated spending
Per
form
ance
Au
dit
Man
ual
for
Pu
blic
Inte
rnal
Au
dit
ors
(Cas
e St
ud
ies
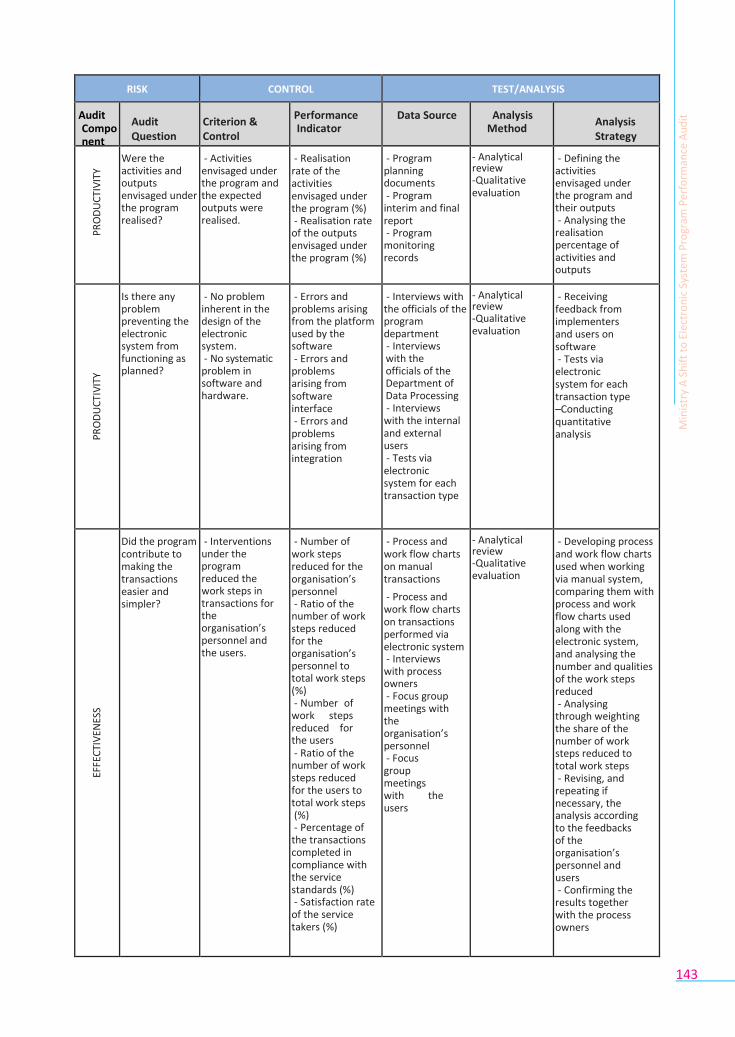
143
RISK CONTROL TEST/ANALYSIS
Audit Component
Audit Question
Criterion & Control
Performance Indicator
Data Source Analysis Method
Analysis Strategy
PR
OD
UC
TIV
ITY
Were the activities and outputs envisaged under the program realised?
- Activities envisaged under the program and the expected outputs were realised.
- Realisation rate of the activities envisaged under the program (%) - Realisation rate of the outputs envisaged under the program (%)
- Program planning documents - Program interim and final report - Program monitoring records
- - Analytical review
- -Qualitative evaluation
- Defining the activities envisaged under the program and their outputs - Analysing the realisation percentage of activities and outputs
PR
OD
UC
TIV
ITY
Is there any problem preventing the electronic system from functioning as planned?
- No problem inherent in the design of the electronic system. - No systematic problem in software and hardware.
- Errors and problems arising from the platform used by the software - Errors and problems arising from software interface - Errors and problems arising from integration
- Interviews with the officials of the program department - Interviews with the officials of the Department of Data Processing - Interviews with the internal and external users - Tests via electronic system for each transaction type
- - Analytical review
- -Qualitative evaluation
- Receiving feedback from implementers and users on software - Tests via electronic system for each transaction type –Conducting quantitative analysis
EFFE
CTI
VEN
ESS
Did the program contribute to making the transactions easier and simpler?
- Interventions under the program reduced the work steps in transactions for the organisation’s personnel and the users.
- Number of work steps reduced for the organisation’s personnel - Ratio of the number of work steps reduced for the organisation’s personnel to total work steps (%) - Number of work steps reduced for the users - Ratio of the number of work steps reduced for the users to total work steps (%) - Percentage of the transactions completed in compliance with the service standards (%) - Satisfaction rate of the service takers (%)
- Process and work flow charts on manual transactions
- Process and work flow charts on transactions performed via electronic system - Interviews with process owners - Focus group meetings with the organisation’s personnel - Focus group meetings with the users
- - Analytical review
- -Qualitative evaluation
- Developing process and work flow charts used when working via manual system, comparing them with process and work flow charts used along with the electronic system, and analysing the number and qualities of the work steps reduced - Analysing through weighting the share of the number of work steps reduced to total work steps - Revising, and repeating if necessary, the analysis according to the feedbacks of the organisation’s personnel and users - Confirming the results together with the process owners
Min
istr
y A
Sh
ift
to E
lect
ron
ic S
yste
m P
rogr
am P
erfo
rman
ce A
ud
it
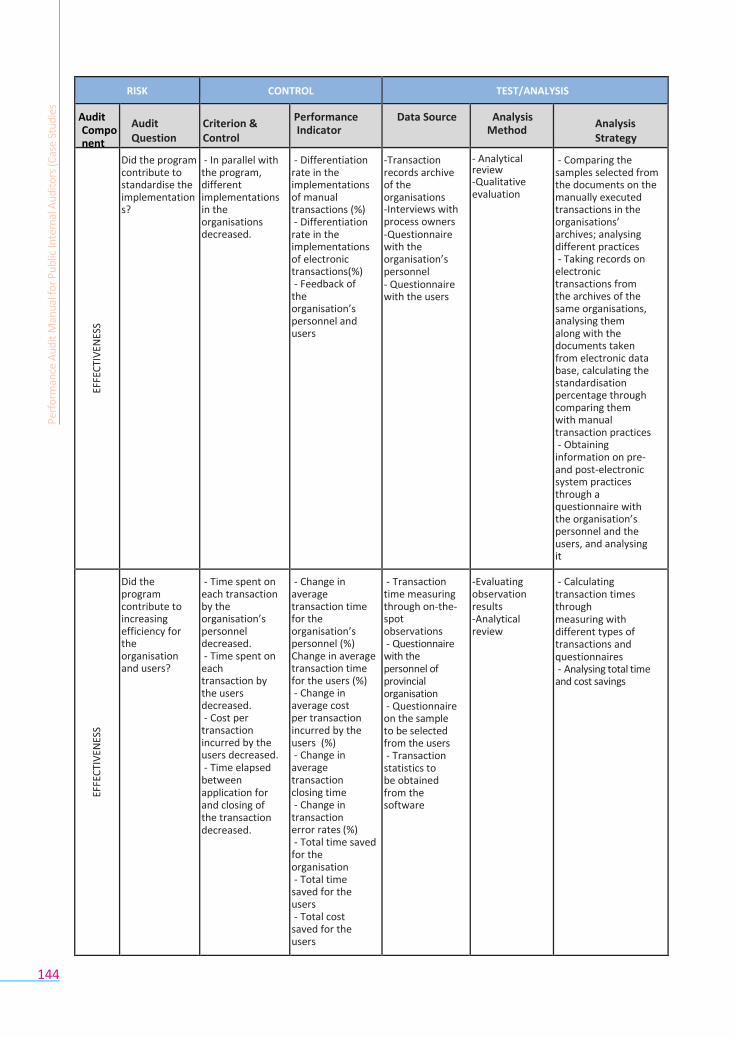
144
RISK CONTROL TEST/ANALYSIS
Audit Component
Audit Question
Criterion & Control
Performance Indicator
Data Source Analysis Method
Analysis Strategy
EFFE
CTI
VEN
ESS
Did the program contribute to standardise the implementations?
- In parallel with the program, different implementations in the organisations decreased.
- Differentiation rate in the implementations of manual transactions (%) - Differentiation rate in the implementations of electronic transactions(%) - Feedback of the organisation’s personnel and users
- -Transaction records archive of the organisations
- -Interviews with process owners
- -Questionnaire with the organisation’s personnel
- - Questionnaire with the users
- - Analytical review
- -Qualitative evaluation
- Comparing the samples selected from the documents on the manually executed transactions in the organisations’ archives; analysing different practices - Taking records on electronic transactions from the archives of the same organisations, analysing them along with the documents taken from electronic data base, calculating the standardisation percentage through comparing them with manual transaction practices - Obtaining information on pre- and post-electronic system practices through a questionnaire with the organisation’s personnel and the users, and analysing it
EFFE
CTI
VEN
ESS
Did the program contribute to increasing efficiency for the organisation and users?
- Time spent on each transaction by the organisation’s personnel decreased. - Time spent on each transaction by the users decreased. - Cost per transaction incurred by the users decreased. - Time elapsed between application for and closing of the transaction decreased.
- Change in average transaction time for the organisation’s personnel (%) Change in average transaction time for the users (%) - Change in average cost per transaction incurred by the users (%) - Change in average transaction closing time - Change in transaction error rates (%) - Total time saved for the organisation - Total time saved for the users - Total cost saved for the users
- Transaction time measuring through on-the-spot observations - Questionnaire with the personnel of provincial organisation - Questionnaire on the sample to be selected from the users - Transaction statistics to be obtained from the software
- -Evaluating observation results
- -Analytical review
- Calculating transaction times through measuring with different types of transactions and questionnaires - Analysing total time and cost savings
Per
form
ance
Au
dit
Man
ual
for
Pu
blic
Inte
rnal
Au
dit
ors
(Cas
e St
ud
ies
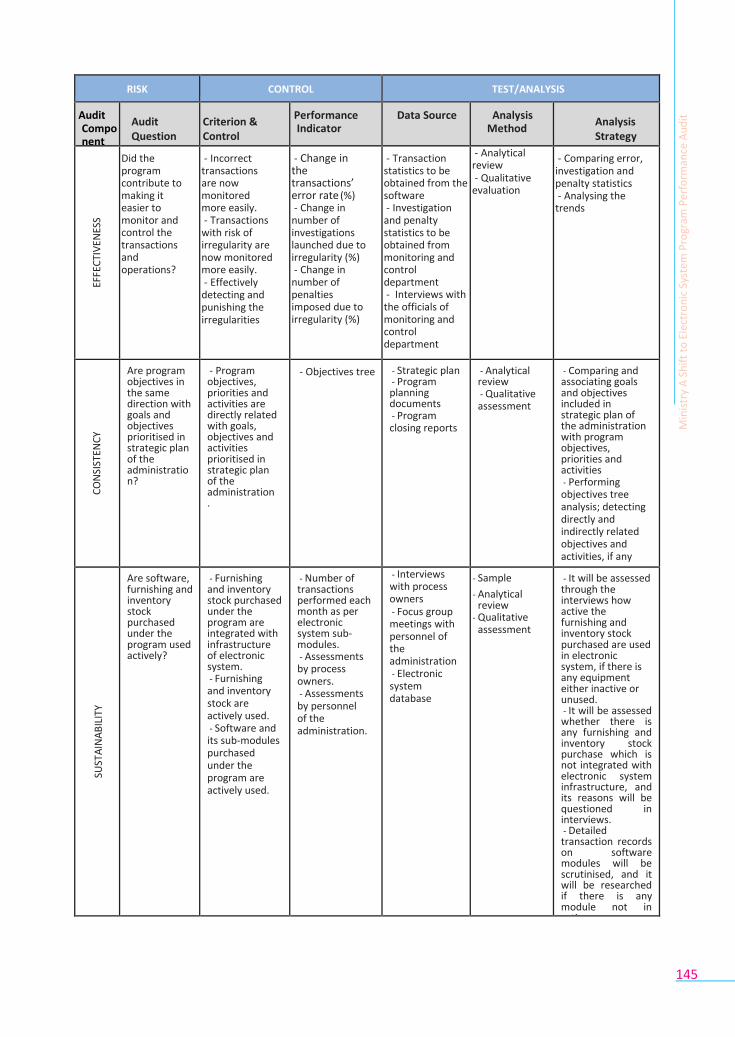
145
RISK CONTROL TEST/ANALYSIS
Audit Component
Audit Question
Criterion & Control
Performance Indicator
Data Source Analysis Method
Analysis Strategy
EFFE
CTI
VEN
ESS
Did the program contribute to making it easier to monitor and control the transactions and operations?
- Incorrect transactions are now monitored more easily. - Transactions with risk of irregularity are now monitored more easily. - Effectively detecting and punishing the irregularities
- Change in the transactions’ error rate (%) - Change in number of investigations launched due to irregularity (%) - Change in number of penalties imposed due to irregularity (%)
- Transaction statistics to be obtained from the software - Investigation and penalty statistics to be obtained from monitoring and control department - Interviews with the officials of monitoring and control department
- Analytical review - Qualitative evaluation
- Comparing error, investigation and penalty statistics - Analysing the trends
CO
NSI
STEN
CY
Are program objectives in the same direction with goals and objectives prioritised in strategic plan of the administration?
- Program objectives, priorities and activities are directly related with goals, objectives and activities prioritised in strategic plan of the administration.
- Objectives tree - Strategic plan - Program planning documents - Program closing reports
- Analytical review - Qualitative assessment
- Comparing and associating goals and objectives included in strategic plan of the administration with program objectives, priorities and activities - Performing objectives tree analysis; detecting directly and indirectly related objectives and activities, if any
SU
STA
INA
BIL
ITY
Are software, furnishing and inventory stock purchased under the program used actively?
- Furnishing and inventory stock purchased under the program are integrated with infrastructure of electronic system. - Furnishing and inventory stock are actively used. - Software and its sub-modules purchased under the program are actively used.
- Number of transactions performed each month as per electronic system sub-modules. - Assessments by process owners. - Assessments by personnel of the administration.
- Interviews with process owners - Focus group meetings with personnel of the administration - Electronic system database
- Sample
- Analytical review
- Qualitative assessment
- It will be assessed through the interviews how active the furnishing and inventory stock purchased are used in electronic system, if there is any equipment either inactive or unused. - It will be assessed whether there is any furnishing and inventory stock purchase which is not integrated with electronic system infrastructure, and its reasons will be questioned in interviews. - Detailed transaction records on software modules will be scrutinised, and it will be researched if there is any module not in active use.
Min
istr
y A
Sh
ift
to E
lect
ron
ic S
yste
m P
rogr
am P
erfo
rman
ce A
ud
it
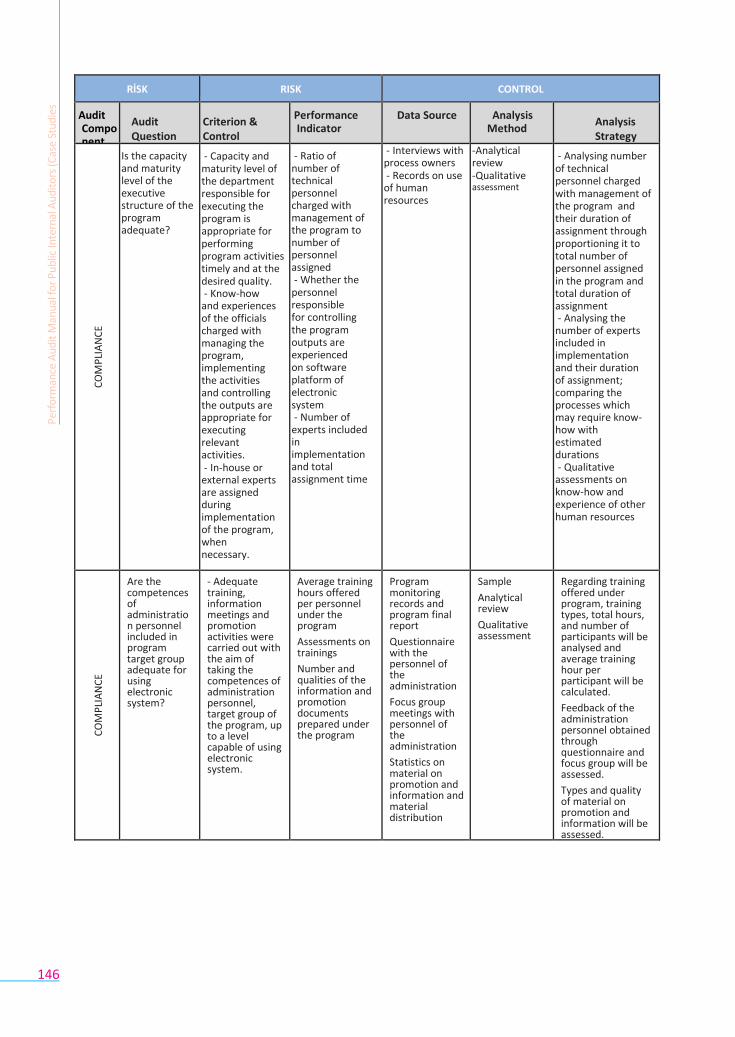
146
RİSK RISK CONTROL
Audit Component
Audit Question
Criterion & Control
Performance Indicator
Data Source Analysis Method
Analysis Strategy
C
OM
PLI
AN
CE
Is the capacity and maturity level of the executive structure of the program adequate?
- Capacity and maturity level of the department responsible for executing the program is appropriate for performing program activities timely and at the desired quality. - Know-how and experiences of the officials charged with managing the program, implementing the activities and controlling the outputs are appropriate for executing relevant activities. - In-house or external experts are assigned during implementation of the program, when necessary.
- Ratio of number of technical personnel charged with management of the program to number of personnel assigned - Whether the personnel responsible for controlling the program outputs are experienced on software platform of electronic system - Number of experts included in implementation and total assignment time
- Interviews with process owners - Records on use of human resources
- -Analytical review
- -Qualitative assessment
- Analysing number of technical personnel charged with management of the program and their duration of assignment through proportioning it to total number of personnel assigned in the program and total duration of assignment - Analysing the number of experts included in implementation and their duration of assignment; comparing the processes which may require know-how with estimated durations - Qualitative assessments on know-how and experience of other human resources
C
OM
PLI
AN
CE
Are the competences of administration personnel included in program target group adequate for using electronic system?
- Adequate training, information meetings and promotion activities were carried out with the aim of taking the competences of administration personnel, target group of the program, up to a level capable of using electronic system.
Average training hours offered per personnel under the program
Assessments on trainings
Number and qualities of the information and promotion documents prepared under the program
Program monitoring records and program final report
Questionnaire with the personnel of the administration
Focus group meetings with personnel of the administration
Statistics on material on promotion and information and material distribution
Sample
Analytical review
Qualitative assessment
Regarding training offered under program, training types, total hours, and number of participants will be analysed and average training hour per participant will be calculated.
Feedback of the administration personnel obtained through questionnaire and focus group will be assessed.
Types and quality of material on promotion and information will be assessed.
Per
form
ance
Au
dit
Man
ual
for
Pu
blic
Inte
rnal
Au
dit
ors
(Cas
e St
ud
ies
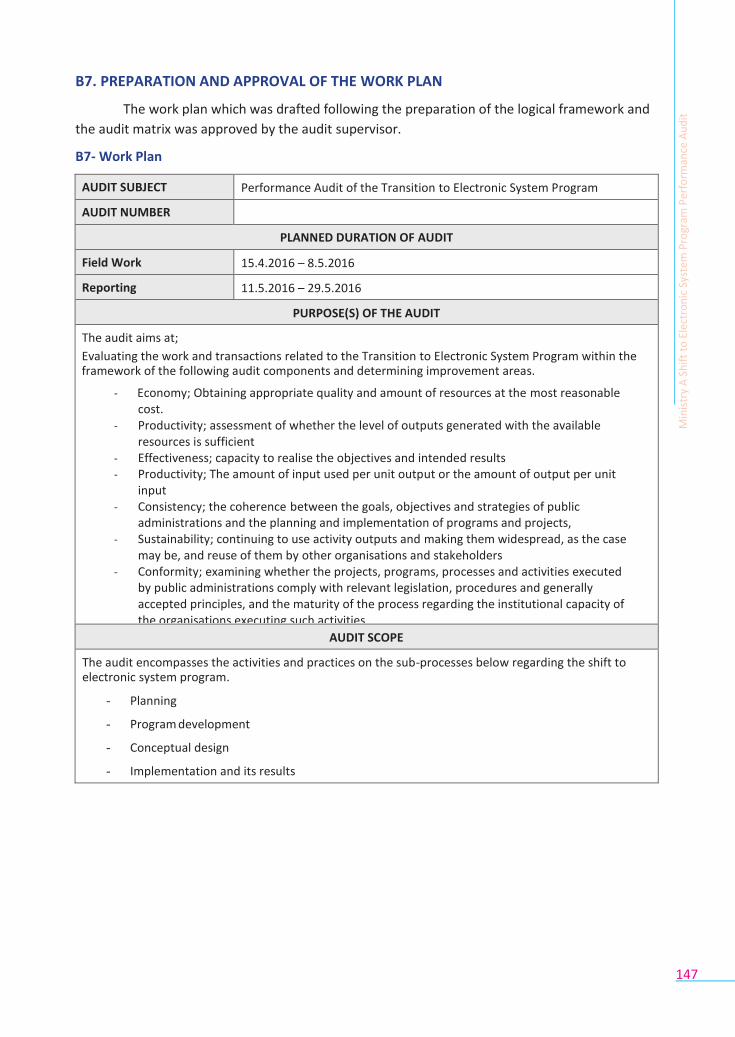
147
B7. PREPARATION AND APPROVAL OF THE WORK PLAN
The work plan which was drafted following the preparation of the logical framework and
the audit matrix was approved by the audit supervisor.
B7- Work Plan
AUDIT SUBJECT Performance Audit of the Transition to Electronic System Program
AUDIT NUMBER
PLANNED DURATION OF AUDIT
Field Work 15.4.2016 – 8.5.2016
Reporting 11.5.2016 – 29.5.2016
PURPOSE(S) OF THE AUDIT
The audit aims at;
Evaluating the work and transactions related to the Transition to Electronic System Program within the framework of the following audit components and determining improvement areas.
- Economy; Obtaining appropriate quality and amount of resources at the most reasonable cost.
- Productivity; assessment of whether the level of outputs generated with the available resources is sufficient
- Effectiveness; capacity to realise the objectives and intended results - Productivity; The amount of input used per unit output or the amount of output per unit
input - Consistency; the coherence between the goals, objectives and strategies of public
administrations and the planning and implementation of programs and projects, - Sustainability; continuing to use activity outputs and making them widespread, as the case
may be, and reuse of them by other organisations and stakeholders - Conformity; examining whether the projects, programs, processes and activities executed
by public administrations comply with relevant legislation, procedures and generally accepted principles, and the maturity of the process regarding the institutional capacity of the organisations executing such activities
-
AUDIT SCOPE
The audit encompasses the activities and practices on the sub-processes below regarding the shift to electronic system program.
- Planning
- Program development
- Conceptual design
- Implementation and its results
Min
istr
y A
Sh
ift
to E
lect
ron
ic S
yste
m P
rogr
am P
erfo
rman
ce A
ud
it
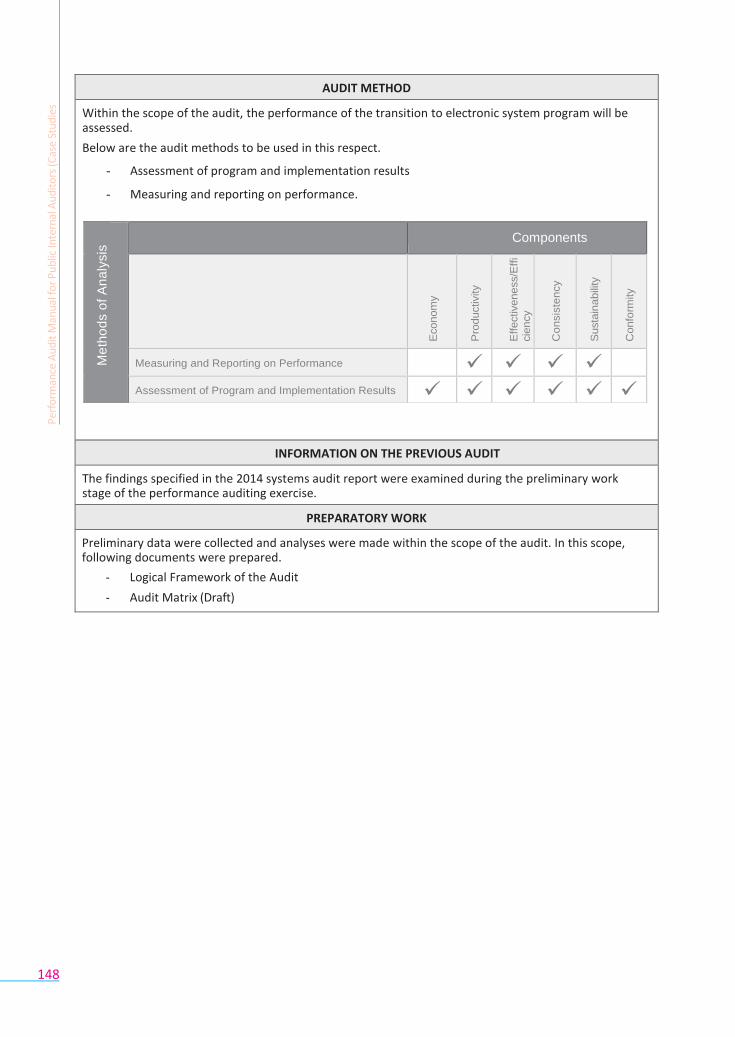
148
AUDIT METHOD
Within the scope of the audit, the performance of the transition to electronic system program will be assessed.
Below are the audit methods to be used in this respect.
- Assessment of program and implementation results
- Measuring and reporting on performance.
INFORMATION ON THE PREVIOUS AUDIT
The findings specified in the 2014 systems audit report were examined during the preliminary work stage of the performance auditing exercise.
PREPARATORY WORK
Preliminary data were collected and analyses were made within the scope of the audit. In this scope, following documents were prepared.
- Logical Framework of the Audit
- Audit Matrix (Draft)
Per
form
ance
Au
dit
Man
ual
for
Pu
blic
Inte
rnal
Au
dit
ors
(Cas
e St
ud
ies
Me
tho
ds o
f A
na
lysis
Components
Econom
y
Pro
ductivity
E
ffectivene
ss/E
ffi
cie
ncy
C
on
sis
ten
cy
Susta
ina
bili
ty
Confo
rmity
Measuring and Reporting on Performance
Assessment of Program and Implementation Results
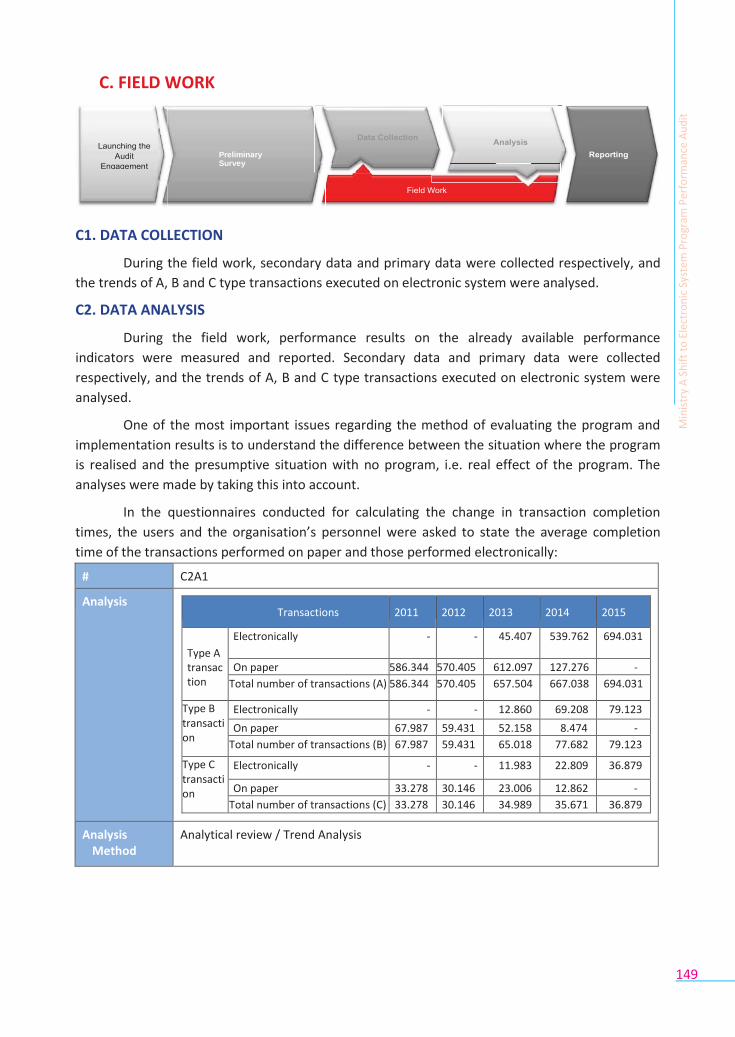
149
C. FIELD WORK
C1. DATA COLLECTION
During the field work, secondary data and primary data were collected respectively, and
the trends of A, B and C type transactions executed on electronic system were analysed.
C2. DATA ANALYSIS
During the field work, performance results on the already available performance
indicators were measured and reported. Secondary data and primary data were collected
respectively, and the trends of A, B and C type transactions executed on electronic system were
analysed.
One of the most important issues regarding the method of evaluating the program and
implementation results is to understand the difference between the situation where the program
is realised and the presumptive situation with no program, i.e. real effect of the program. The
analyses were made by taking this into account.
In the questionnaires conducted for calculating the change in transaction completion
times, the users and the organisation’s personnel were asked to state the average completion
time of the transactions performed on paper and those performed electronically:
# C2A1
Analysis
Analysis Method
Analytical review / Trend Analysis
Preliminary Survey
Min
istr
y A
Sh
ift
to E
lect
ron
ic S
yste
m P
rogr
am P
erfo
rman
ce A
ud
it
Transactions 2011 2012 2013 2014 2015
Type A transaction
Electronically - - 45.407 539.762 694.031
On paper 586.344 570.405 612.097 127.276 -
Total number of transactions (A) 586.344 570.405 657.504 667.038 694.031
Type B transaction
Electronically - - 12.860 69.208 79.123
On paper 67.987 59.431 52.158 8.474 -
Total number of transactions (B) 67.987 59.431 65.018 77.682 79.123
Type C transaction
Electronically - - 11.983 22.809 36.879
On paper 33.278 30.146 23.006 12.862 -
Total number of transactions (C) 33.278 30.146 34.989 35.671 36.879
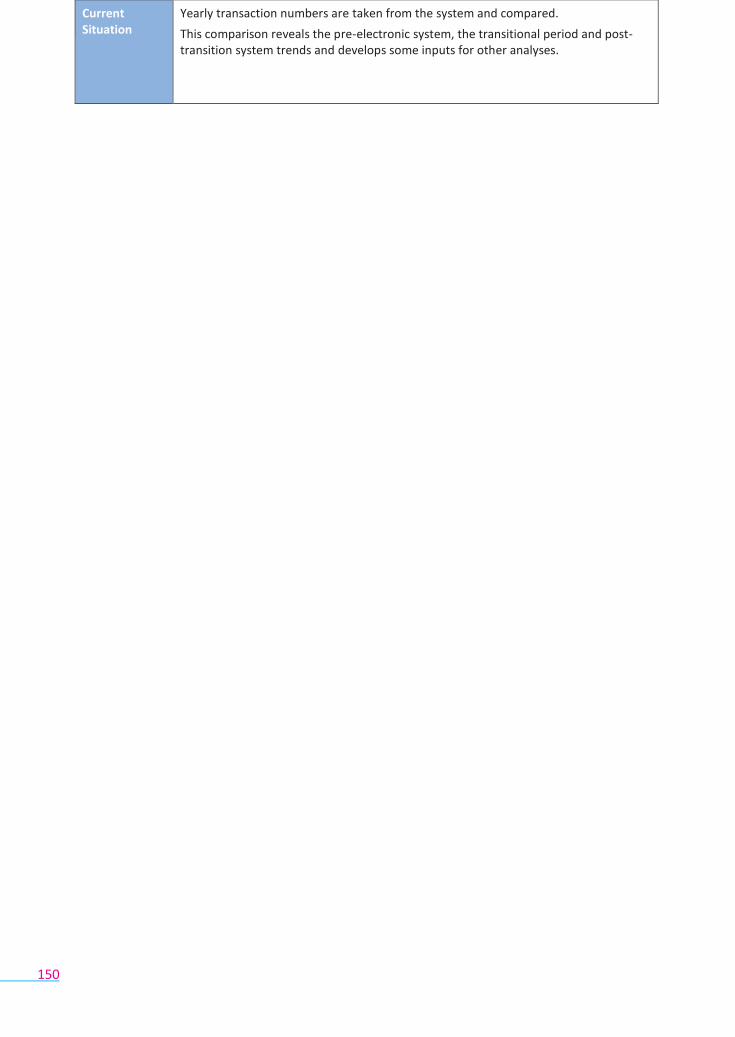
150
Current Situation
Yearly transaction numbers are taken from the system and compared.
This comparison reveals the pre-electronic system, the transitional period and post-transition system trends and develops some inputs for other analyses.
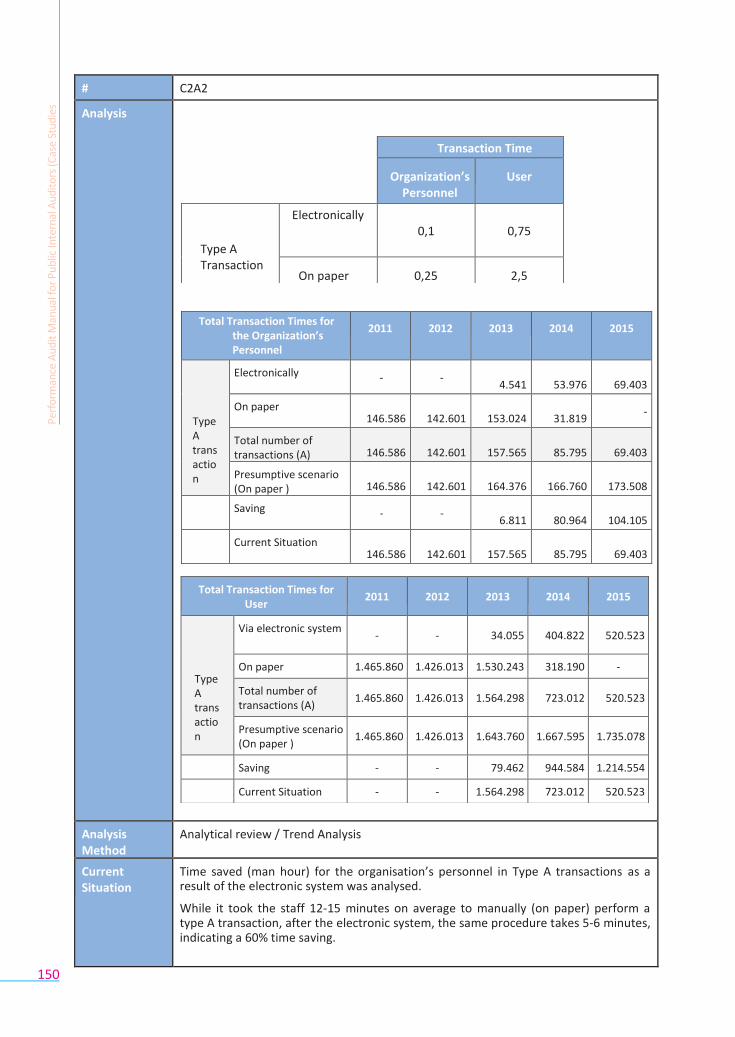
150
# C2A2
Analysis
Analysis Method
Analytical review / Trend Analysis
Current Situation
Time saved (man hour) for the organisation’s personnel in Type A transactions as a result of the electronic system was analysed.
While it took the staff 12-15 minutes on average to manually (on paper) perform a type A transaction, after the electronic system, the same procedure takes 5-6 minutes, indicating a 60% time saving.
Per
form
ance
Au
dit
Man
ual
for
Pu
blic
Inte
rnal
Au
dit
ors
(Cas
e St
ud
ies
Transaction Time
Organization’s Personnel
User
Type A Transaction
Electronically 0,1
0,75
On paper 0,25 2,5
Total Transaction Times for
the Organization’s Personnel
2011 2012 2013 2014 2015
Type A transaction
Electronically - -
4.541
53.976
69.403
On paper 146.586
142.601
153.024
31.819
-
Total number of transactions (A)
146.586
142.601
157.565
85.795
69.403
Presumptive scenario (On paper )
146.586
142.601
164.376
166.760
173.508
Saving - -
6.811
80.964
104.105
Current Situation 146.586
142.601
157.565
85.795
69.403
Total Transaction Times for
User
2011
2012
2013
2014
2015
Type A transaction
Via electronic system
-
-
34.055
404.822
520.523
On paper 1.465.860 1.426.013 1.530.243 318.190 -
Total number of transactions (A)
1.465.860
1.426.013
1.564.298
723.012
520.523
Presumptive scenario (On paper )
1.465.860
1.426.013
1.643.760
1.667.595
1.735.078
Saving - - 79.462 944.584 1.214.554
Current Situation - - 1.564.298 723.012 520.523
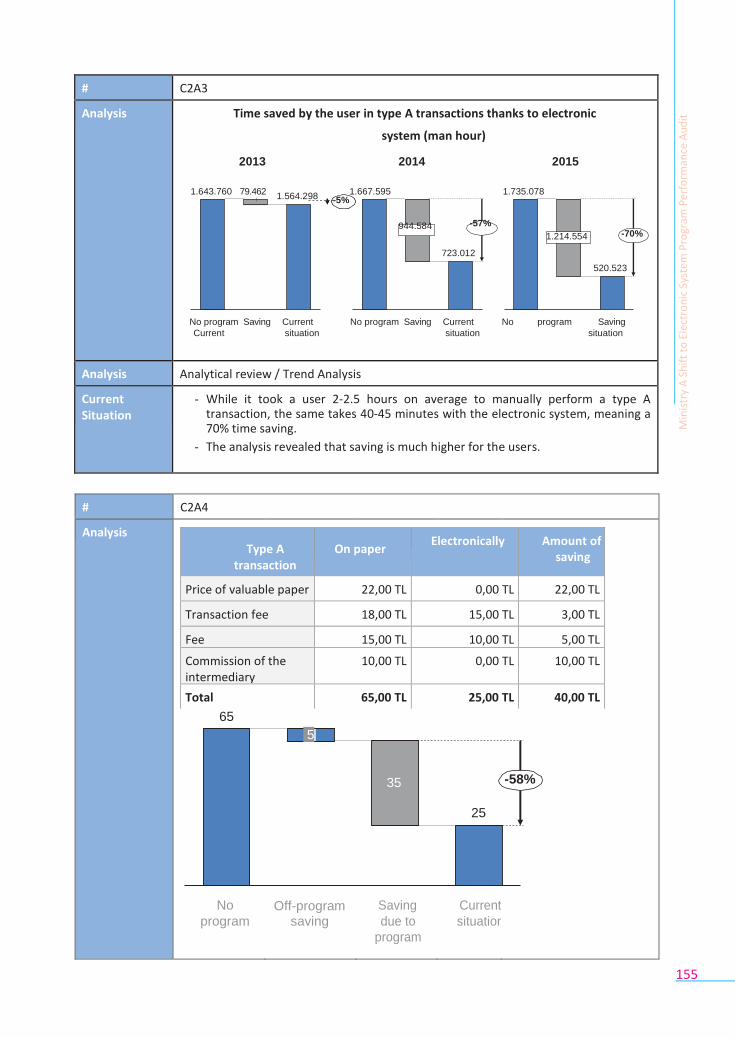
155
# C2A3
Analysis Time saved by the user in type A transactions thanks to electronic
system (man hour)
2013 2014 2015
1.643.760 79.462
1.564.298 -5%1.667.595 1.735.078
944.584 -57% 1.214.554 -70%
723.012
520.523
No program Saving Current No program Saving Current No program Saving
Current situation situation situation
Analysis Method
Analytical review / Trend Analysis
Current Situation
- While it took a user 2-2.5 hours on average to manually perform a type A transaction, the same takes 40-45 minutes with the electronic system, meaning a 70% time saving.
- The analysis revealed that saving is much higher for the users.
# C2A4
Analysis
65
No
program
5
Off-program
saving
35
Saving
due to
program
25
Current
situation
-58%
Min
istr
y A
Sh
ift
to E
lect
ron
ic S
yste
m P
rogr
am P
erfo
rman
ce A
ud
it
Type A transaction
On paper Electronically Amount of
saving
Price of valuable paper 22,00 TL 0,00 TL 22,00 TL
Transaction fee 18,00 TL 15,00 TL 3,00 TL
Fee 15,00 TL 10,00 TL 5,00 TL
Commission of the intermediary
10,00 TL 0,00 TL 10,00 TL
Total 65,00 TL 25,00 TL 40,00 TL

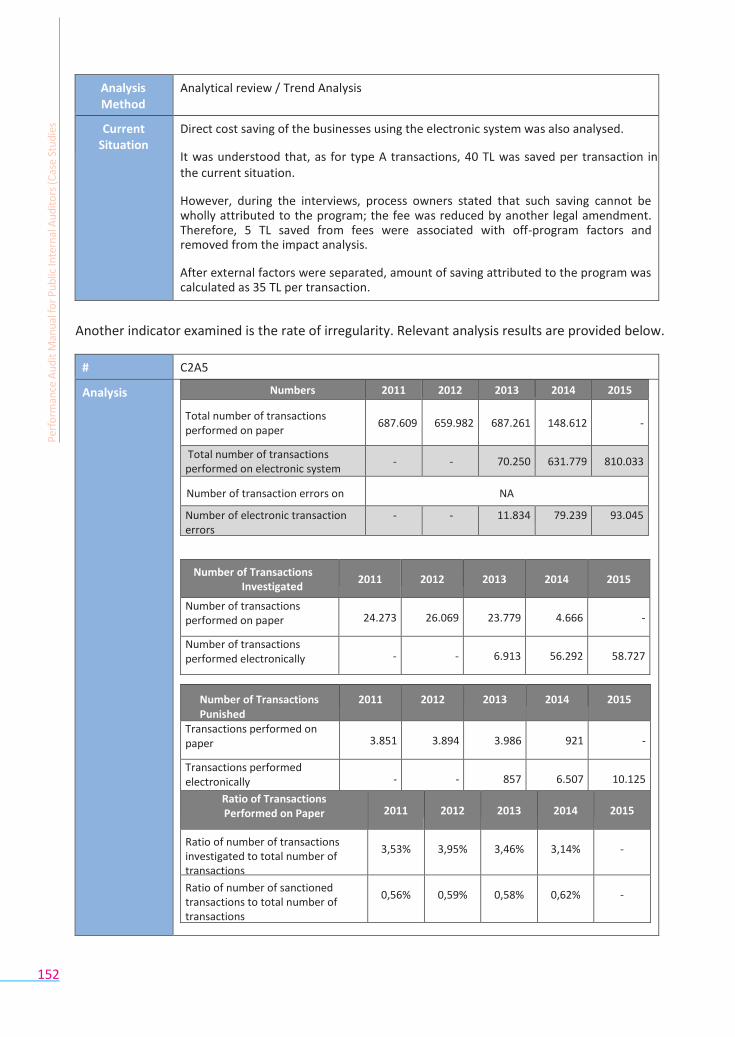
152
Analysis Method
Analytical review / Trend Analysis
Current Situation
Direct cost saving of the businesses using the electronic system was also analysed.
It was understood that, as for type A transactions, 40 TL was saved per transaction in the current situation.
However, during the interviews, process owners stated that such saving cannot be wholly attributed to the program; the fee was reduced by another legal amendment. Therefore, 5 TL saved from fees were associated with off-program factors and removed from the impact analysis.
After external factors were separated, amount of saving attributed to the program was calculated as 35 TL per transaction.
Another indicator examined is the rate of irregularity. Relevant analysis results are provided below.
# C2A5
Analysis
Per
form
ance
Au
dit
Man
ual
for
Pu
blic
Inte
rnal
Au
dit
ors
(Cas
e St
ud
ies
Numbers 2011 2012 2013 2014 2015
Total number of transactions performed on paper
687.609
659.982
687.261
148.612
-
Total number of transactions performed on electronic system
- - 70.250 631.779 810.033
Number of transaction errors on paper
NA
Number of electronic transaction errors
- - 11.834 79.239 93.045
Number of Transactions Investigated
2011
2012
2013
2014
2015
Number of transactions performed on paper
24.273
26.069
23.779
4.666
-
Number of transactions performed electronically
-
-
6.913
56.292
58.727
Number of Transactions Punished
2011 2012 2013 2014 2015
Transactions performed on paper
3.851
3.894
3.986
921
-
Transactions performed electronically
-
-
857
6.507
10.125
Ratio of Transactions Performed on Paper
2011
2012
2013
2014
2015
Ratio of number of transactions investigated to total number of transactions
3,53%
3,95%
3,46%
3,14%
-
Ratio of number of sanctioned transactions to total number of transactions
0,56%
0,59%
0,58%
0,62%
-
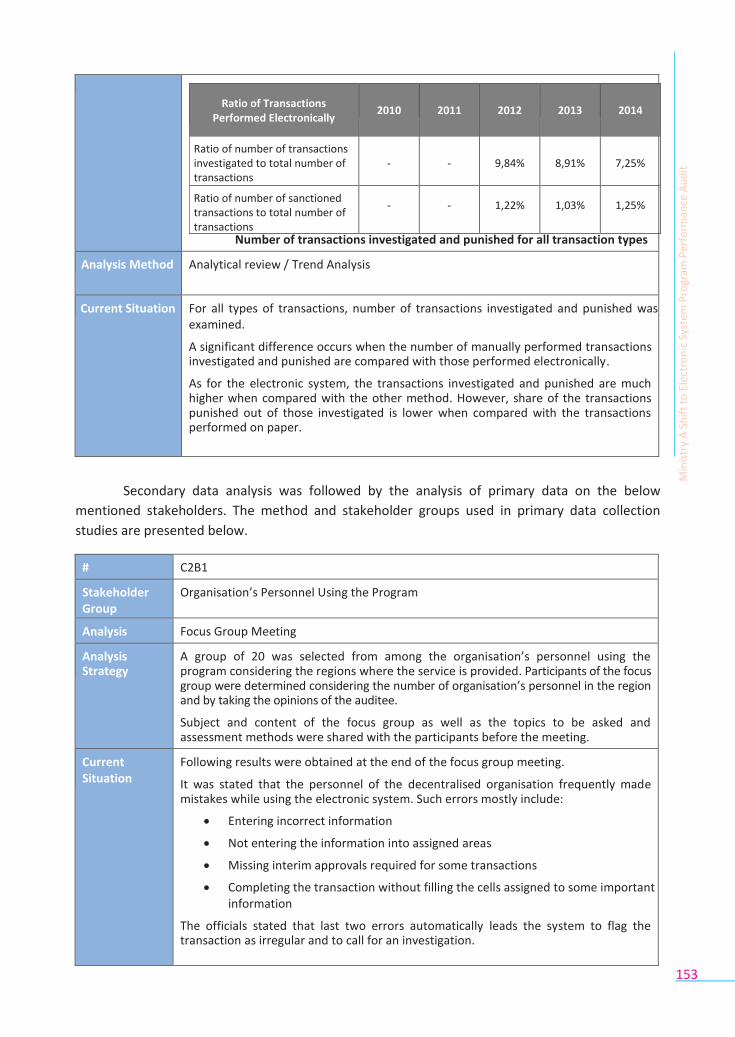
153
Number of transactions investigated and punished for all transaction types
Analysis Method Analytical review / Trend Analysis
Current Situation For all types of transactions, number of transactions investigated and punished was examined.
A significant difference occurs when the number of manually performed transactions investigated and punished are compared with those performed electronically.
As for the electronic system, the transactions investigated and punished are much higher when compared with the other method. However, share of the transactions punished out of those investigated is lower when compared with the transactions performed on paper.
Secondary data analysis was followed by the analysis of primary data on the below
mentioned stakeholders. The method and stakeholder groups used in primary data collection
studies are presented below.
# C2B1
Stakeholder Group
Organisation’s Personnel Using the Program
Analysis Method
Focus Group Meeting
Analysis Strategy
A group of 20 was selected from among the organisation’s personnel using the program considering the regions where the service is provided. Participants of the focus group were determined considering the number of organisation’s personnel in the region and by taking the opinions of the auditee.
Subject and content of the focus group as well as the topics to be asked and assessment methods were shared with the participants before the meeting.
Current Situation
Following results were obtained at the end of the focus group meeting.
It was stated that the personnel of the decentralised organisation frequently made mistakes while using the electronic system. Such errors mostly include:
Entering incorrect information
Not entering the information into assigned areas
Missing interim approvals required for some transactions
Completing the transaction without filling the cells assigned to some important information
The officials stated that last two errors automatically leads the system to flag the transaction as irregular and to call for an investigation.
Min
istr
y A
Sh
ift
to E
lect
ron
ic S
yste
m P
rogr
am P
erfo
rman
ce A
ud
it
Ratio of Transactions Performed Electronically
2010
2011
2012
2013
2014
Ratio of number of transactions investigated to total number of transactions
-
-
9,84%
8,91%
7,25%
Ratio of number of sanctioned transactions to total number of transactions
-
-
1,22%
1,03%
1,25%
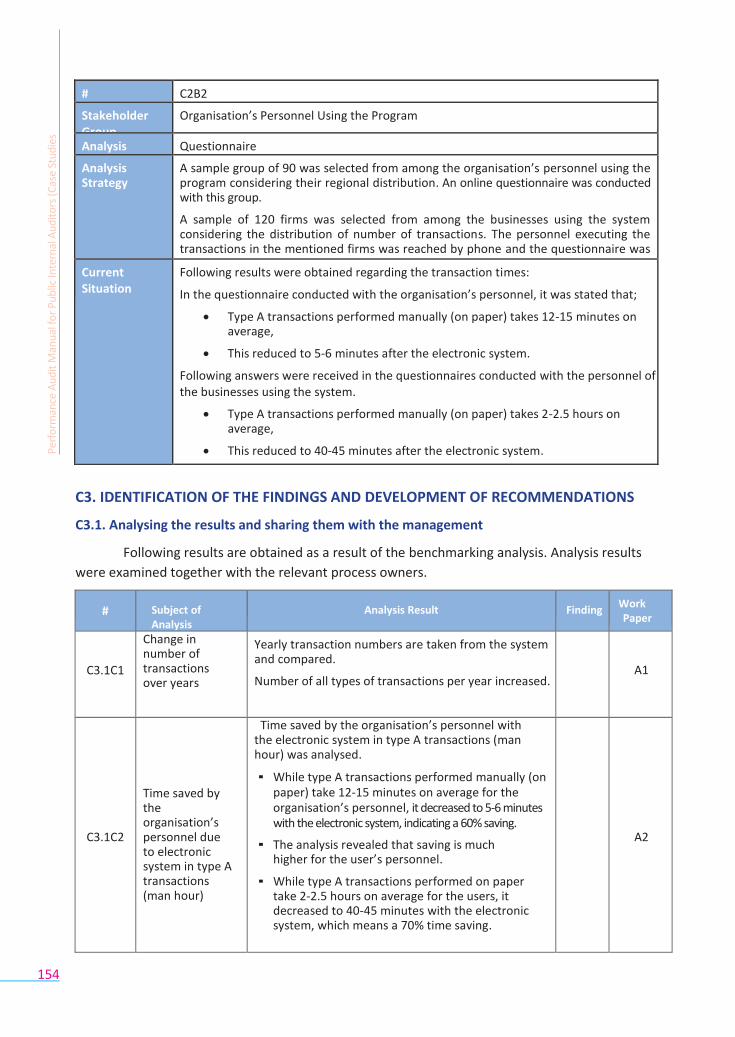
154
# C2B2
Stakeholder Group
Organisation’s Personnel Using the Program
Analysis Method
Questionnaire
Analysis Strategy
A sample group of 90 was selected from among the organisation’s personnel using the program considering their regional distribution. An online questionnaire was conducted with this group.
A sample of 120 firms was selected from among the businesses using the system considering the distribution of number of transactions. The personnel executing the transactions in the mentioned firms was reached by phone and the questionnaire was conducted on the phone.
Current Situation
Following results were obtained regarding the transaction times:
In the questionnaire conducted with the organisation’s personnel, it was stated that;
Type A transactions performed manually (on paper) takes 12-15 minutes on average,
This reduced to 5-6 minutes after the electronic system.
Following answers were received in the questionnaires conducted with the personnel of the businesses using the system.
Type A transactions performed manually (on paper) takes 2-2.5 hours on average,
This reduced to 40-45 minutes after the electronic system.
C3. IDENTIFICATION OF THE FINDINGS AND DEVELOPMENT OF RECOMMENDATIONS
C3.1. Analysing the results and sharing them with the management
Following results are obtained as a result of the benchmarking analysis. Analysis results
were examined together with the relevant process owners.
# Subject of Analysis
Analysis Result Finding Work Paper
C3.1C1
Change in number of transactions over years
Yearly transaction numbers are taken from the system and compared.
Number of all types of transactions per year increased.
A1
C3.1C2
Time saved by the organisation’s personnel due to electronic system in type A transactions (man hour)
Time saved by the organisation’s personnel with the electronic system in type A transactions (man hour) was analysed.
▪ While type A transactions performed manually (on paper) take 12-15 minutes on average for the organisation’s personnel, it decreased to 5-6 minutes with the electronic system, indicating a 60% saving.
▪ The analysis revealed that saving is much higher for the user’s personnel.
▪ While type A transactions performed on paper take 2-2.5 hours on average for the users, it decreased to 40-45 minutes with the electronic system, which means a 70% time saving.
A2
Per
form
ance
Au
dit
Man
ual
for
Pu
blic
Inte
rnal
Au
dit
ors
(Cas
e St
ud
ies
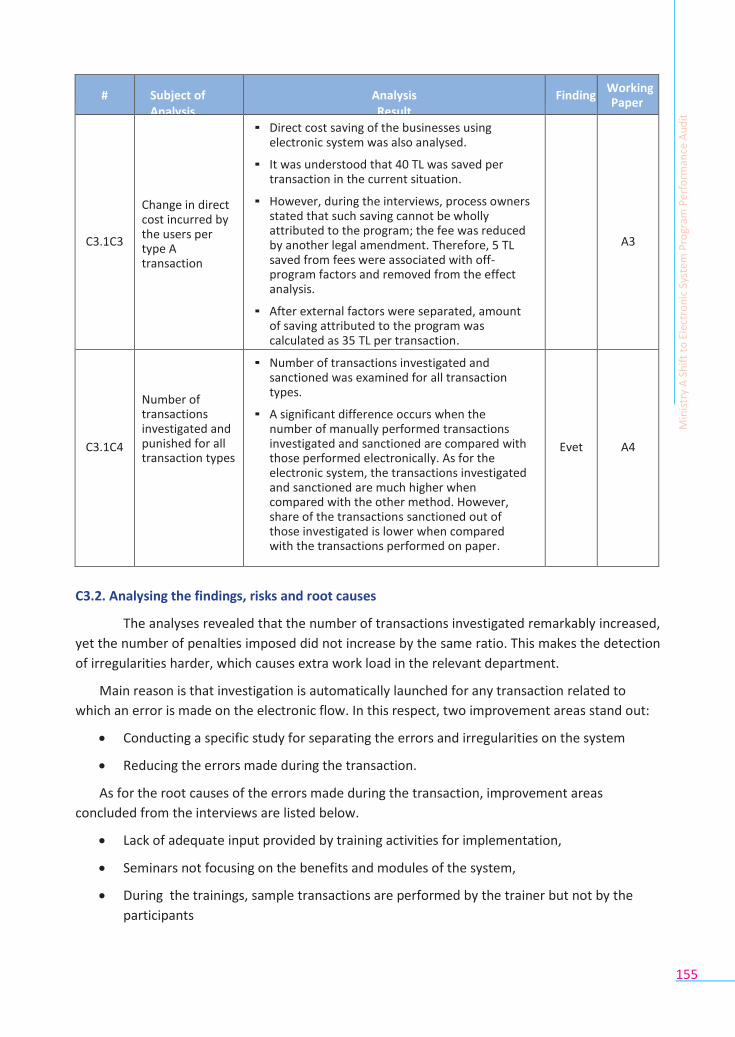
155
# Subject of Analysis
Analysis Result
Finding Working Paper
C3.1C3
Change in direct cost incurred by the users per type A transaction
▪ Direct cost saving of the businesses using electronic system was also analysed.
▪ It was understood that 40 TL was saved per transaction in the current situation.
▪ However, during the interviews, process owners stated that such saving cannot be wholly attributed to the program; the fee was reduced by another legal amendment. Therefore, 5 TL saved from fees were associated with off-program factors and removed from the effect analysis.
▪ After external factors were separated, amount of saving attributed to the program was calculated as 35 TL per transaction.
A3
C3.1C4
Number of transactions investigated and punished for all transaction types
▪ Number of transactions investigated and sanctioned was examined for all transaction types.
▪ A significant difference occurs when the number of manually performed transactions investigated and sanctioned are compared with those performed electronically. As for the electronic system, the transactions investigated and sanctioned are much higher when compared with the other method. However, share of the transactions sanctioned out of those investigated is lower when compared with the transactions performed on paper.
Evet
A4
C3.2. Analysing the findings, risks and root causes
The analyses revealed that the number of transactions investigated remarkably increased,
yet the number of penalties imposed did not increase by the same ratio. This makes the detection
of irregularities harder, which causes extra work load in the relevant department.
Main reason is that investigation is automatically launched for any transaction related to
which an error is made on the electronic flow. In this respect, two improvement areas stand out:
Conducting a specific study for separating the errors and irregularities on the system
Reducing the errors made during the transaction.
As for the root causes of the errors made during the transaction, improvement areas
concluded from the interviews are listed below.
Lack of adequate input provided by training activities for implementation,
Seminars not focusing on the benefits and modules of the system,
During the trainings, sample transactions are performed by the trainer but not by the
participants
Min
istr
y A
Sh
ift
to E
lect
ron
ic S
yste
m P
rogr
am P
erfo
rman
ce A
ud
it
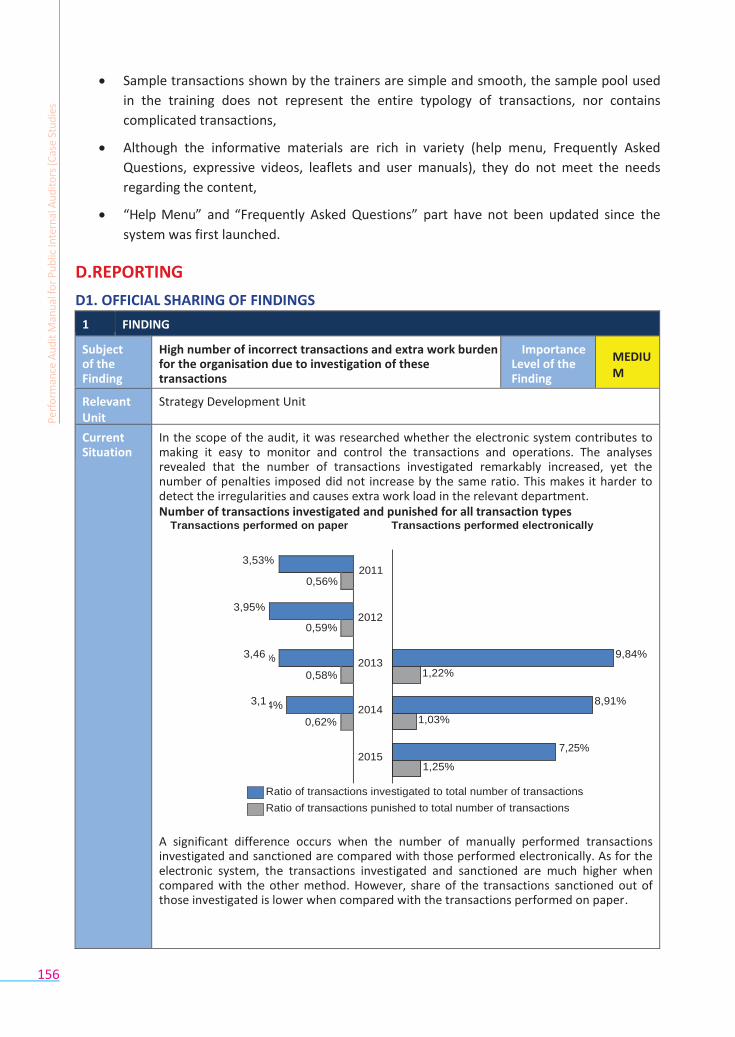
156
Sample transactions shown by the trainers are simple and smooth, the sample pool used
in the training does not represent the entire typology of transactions, nor contains
complicated transactions,
Although the informative materials are rich in variety (help menu, Frequently Asked
Questions, expressive videos, leaflets and user manuals), they do not meet the needs
regarding the content,
“Help Menu” and “Frequently Asked Questions” part have not been updated since the
system was first launched.
D.REPORTING
D1. OFFICIAL SHARING OF FINDINGS
1 FINDING
Subject of the Finding
High number of incorrect transactions and extra work burden for the organisation due to investigation of these transactions
Importance Level of the Finding
MEDIUM
Relevant Unit
Strategy Development Unit
Current Situation
In the scope of the audit, it was researched whether the electronic system contributes to making it easy to monitor and control the transactions and operations. The analyses revealed that the number of transactions investigated remarkably increased, yet the number of penalties imposed did not increase by the same ratio. This makes it harder to detect the irregularities and causes extra work load in the relevant department. Number of transactions investigated and punished for all transaction types
Transactions performed on paper Transactions performed electronically
3,53% 2011
3,95% 2012
3,46 9,84% 2013
1,22%
3,1 8,91%
2014 1,03%
7,25%
2015 1,25%
Ratio of transactions investigated to total number of transactions
Ratio of transactions punished to total number of transactions
A significant difference occurs when the number of manually performed transactions investigated and sanctioned are compared with those performed electronically. As for the electronic system, the transactions investigated and sanctioned are much higher when compared with the other method. However, share of the transactions sanctioned out of those investigated is lower when compared with the transactions performed on paper.
Per
form
ance
Au
dit
Man
ual
for
Pu
blic
Inte
rnal
Au
dit
ors
(Cas
e St
ud
ies
0,56%
0,59%
% 0,58%
4%
0,62%
157
As a result of the interviews with the Department of Monitoring and Control, it was stated that the reason is the increasing number of errors in transactions. We intended to analyse whether the number of errors increased or not, but failed to make any comparison, because no record of error had been kept in the paper-based system. We researched this in the interviews and questionnaires conducted during primary research, and the results revealed that the decentralised organisation frequently make mistakes while using the electronic system. Such errors mostly include:
Entering incorrect information
Not entering the information into assigned areas
Missing interim approvals required for some transactions
Completing the transaction without filling the cells assigned to some
important information
The officials stated that last two errors automatically leads the system to flag the transaction as irregular and to call for an investigation.
Cause As a result of the interviews with the Department of Monitoring and Control, it was stated that some errors made by the organisation’s personnel were defined as irregularity by the system and this resulted in an investigation launched on the transaction concerned. It was stated that relevant officials of the Department of Monitoring Control determined, as a result of a preliminary review, that such transactions were not irregular, but incorrect, and they decided that no investigation was necessary. As a result of the interviews and questionnaires conducted with the personnel of the decentralised organisation, we received a feedback that the training programs on the use of the electronic system were not sufficient, either qualitatively or quantitatively. The results of the analyses conducted with the personnel of decentralised organisation revealed that the most frequent feedback on dissemination activities is about training. Accordingly, most significant comments are as follows:
Lack of adequate input provided by training activities for implementation,
Seminars not focusing on the benefits and modules of the system,
During the trainings, sample transactions are performed by the trainer but not by the participants
Sample transactions shown by the trainers are simple and smooth, the sample pool used in the training does not represent the entire typology of transactions, nor contains complicated transactions,
Although the informative materials are rich in variety (help menu, Frequently Asked Questions, expressive videos, leaflets and user manuals), they do not meet the needs regarding the content,
“Help Menu” and “Frequently Asked Questions” part have not been updated since the system was first launched.
Risks and Effects
High number of errors and transactions against which an investigation is launched result in extra work burden in the Department of Monitoring and Control. Such extra work burden could not be managed with existing resources, and the transactions against which investigation is launched may be closed without being examined in detail. This does not make monitoring and control easy, and it also increases the risk of the irregular transactions be ignored.
High number of incorrect transactions constitutes quality cost for the organisation. Correcting the incorrect transactions may take time either equal to or more than the ordinary transaction time, depending on the feature of the error. This reduces efficiency in the provincial organisation.
Criterion As for the transactions performed electronically, a reasonable level is aimed for transactions being investigated or sanctioned. The aim is to have a maximum of 5% of transactions being investigated. In cases with a higher ratio, rationality controls must be made on the system for the whole investigation.
Min
istr
y A
Sh
ift
to E
lect
ron
ic S
yste
m P
rogr
am P
erfo
rman
ce A
ud
it
Per
form
ance
Au
dit
Man
ual
for
Pu
blic
Inte
rnal
Au
dit
ors
(Cas
e St
ud
ies
158
Recommendation
Following actions are recommended to be taken regarding the findings detected within the scope of the audit performed.
12. Conducting a specific study for separating on the system the transactions which seem to be an irregularity due to the information entered incorrectly.
In this respect:
Categorising existing errors and analysing them in detail
Making a prioritisation of more critical areas to detect the irregularities
Updating the interface in the electronic system open to the organisation in line with such prioritisation
13. As for the training activities on the transition to electronic system, training content is recommended to be updated in such a way to include the following:
▪ Program conceptual design
▪ Key controls and control objectives
▪ Application examples
An important part of the training is recommended to be allocated to the studies on implementing the relevant transactions on test environment.
14. It is recommended that the content of the user support features of the program be enriched with practical implementations and transactions.
User support feature is recommended to encompass the following points among others.
▪ Help menu,
▪ FAQs,
▪ Expressive videos,
▪ Leaflets and user manuals
Opinion of
the Auditee
[X] We agree with the finding
[ ] We do not agree with the finding.
[X] We agree with the recommendation.
[ ] We do not agree with the
recommendation.
[ ] We do not agree with the importance level of the finding.
Per
form
ance
Au
dit
Man
ual
for
Pu
blic
Inte
rnal
Au
dit
ors
(Cas
e St
ud
ies)
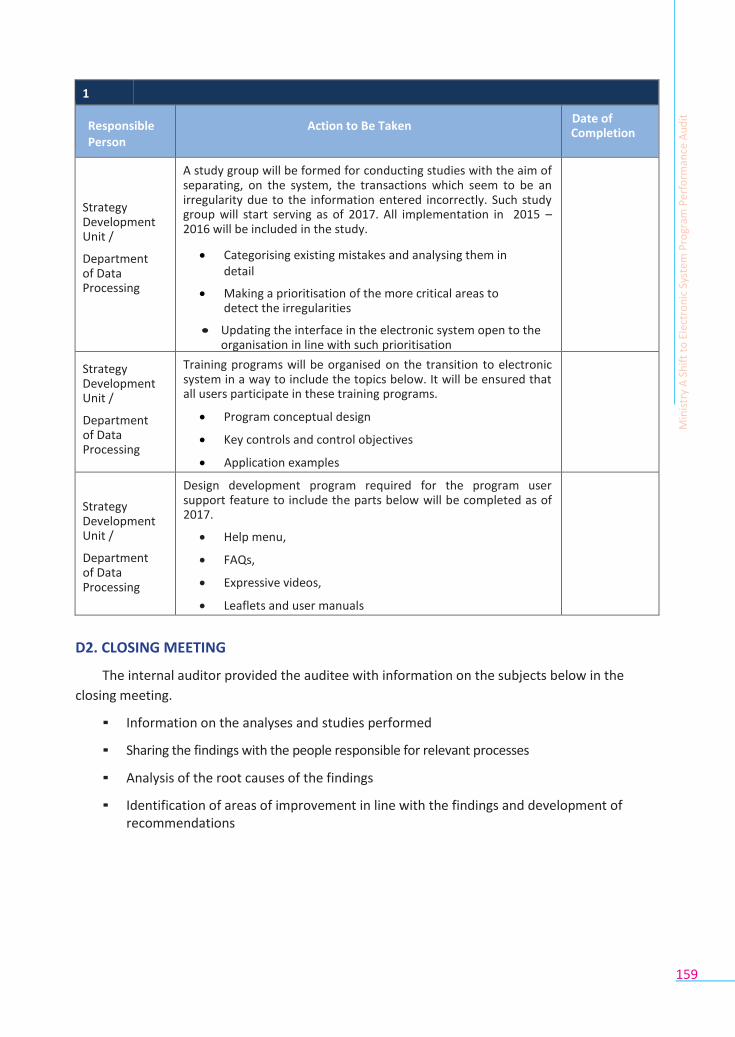
159
1
Responsible Person
Action to Be Taken Date of Completion
Strategy Development Unit /
Department of Data Processing
A study group will be formed for conducting studies with the aim of separating, on the system, the transactions which seem to be an irregularity due to the information entered incorrectly. Such study group will start serving as of 2017. All implementation in 2015 – 2016 will be included in the study.
Categorising existing mistakes and analysing them in detail
Making a prioritisation of the more critical areas to detect the irregularities
Updating the interface in the electronic system open to the organisation in line with such prioritisation
Strategy Development Unit /
Department of Data Processing
Training programs will be organised on the transition to electronic system in a way to include the topics below. It will be ensured that all users participate in these training programs.
Program conceptual design
Key controls and control objectives
Application examples
Strategy Development Unit /
Department of Data Processing
Design development program required for the program user support feature to include the parts below will be completed as of 2017.
Help menu,
FAQs,
Expressive videos,
Leaflets and user manuals
▪
D2. CLOSING MEETING
The internal auditor provided the auditee with information on the subjects below in the
closing meeting.
▪ Information on the analyses and studies performed
▪ Sharing the findings with the people responsible for relevant processes
▪ Analysis of the root causes of the findings
▪ Identification of areas of improvement in line with the findings and development of recommendations
Min
istr
y A
Sh
ift
to E
lect
ron
ic S
yste
m P
rogr
am P
erfo
rman
ce A
ud
it
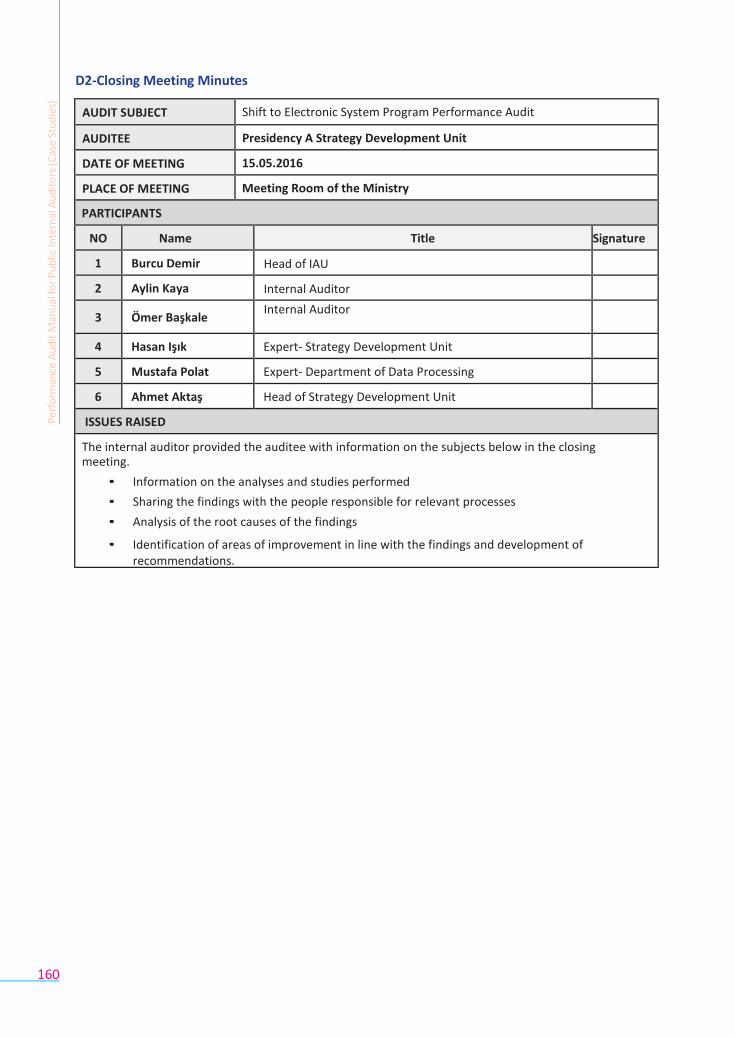
160
D2-Closing Meeting Minutes
AUDIT SUBJECT Shift to Electronic System Program Performance Audit
AUDITEE Presidency A Strategy Development Unit
DATE OF MEETING 15.05.2016
PLACE OF MEETING Meeting Room of the Ministry
PARTICIPANTS
NO Name Title Signature
1 Burcu Demir Head of IAU
2 Aylin Kaya Internal Auditor
3 Ömer Başkale Internal Auditor
4 Hasan Işık Expert- Strategy Development Unit
5 Mustafa Polat Expert- Department of Data Processing
6 Ahmet Aktaş Head of Strategy Development Unit
ISSUES RAISED
The internal auditor provided the auditee with information on the subjects below in the closing meeting.
▪ Information on the analyses and studies performed
▪ Sharing the findings with the people responsible for relevant processes
▪ Analysis of the root causes of the findings
▪ Identification of areas of improvement in line with the findings and development of recommendations.
Per
form
ance
Au
dit
Man
ual
for
Pu
blic
Inte
rnal
Au
dit
ors
(Cas
e St
ud
ies)