Embed Size (px)
Citation preview

Performance assessment of industrial-sized solid
oxide cells operated in a reversible mode: Detailed
numerical and experimental study
Vanja Suboti�c a,*, Thomas Thaller a, Benjamin K€onigshofer a,Norbert H. Menzler b, Edith Bucher c, Andreas Egger c,Christoph Hochenauer a
a Institute of Thermal Engineering, Graz University of Technology, Inffeldgasse 25/B, 8010, Graz, Austriab Forschungzentrum Julich GmbH, Institute of Energy and Climate Research (IEK), IEK-1: Materials Synthesis and
Processing, 52425 Julich, Germanyc Chair of Physical Chemistry, Montanuniversitaet Leoben, Franz-Josef-Straße 18, 8700, Leoben, Austria
h i g h l i g h t s
� Time-efficient spatially-resolved model for industrial-sized rSOCs.
� Detailed performance assessment based on numerical and experimental study.
� Model validation based on in-house made cells and experiments.
� Very good accordance between measured and simulated EIS, DRT and U/i data.
� Comparison of co-flow and counter-flow conditions for rSOC operation.
a r t i c l e i n f o
Article history:
Received 17 June 2020
Received in revised form
16 July 2020
Accepted 17 July 2020
Available online 12 August 2020
Keywords:
Reversible solid oxide cell (rSOC)
Hydrogen
Electrolysis
Numerical study
Experimental study
Electrochemical analysis
a b s t r a c t
Reversible solid oxide cells (rSOCs) present a unique possibility in comparison to other
available technologies to generate electricity, heat and valuable fuels in one system, in a
highly-efficient manner. The major issue hindering their commercialization are system
reliability and durability. A detailed understanding of the processes and mechanisms that
occur within rSOCs of industrial-size, is of critical importance for addressing this chal-
lenge. This study provides in-depth insight into behavior of large planar rSOCs based on a
comprehensive experimental and numerical study. All the numerical data obtained are
validated with the in-house made cells and experiments. The sensitivity analysis, which
covers a wide range of operating conditions relevant for industrial-sized systems, such as
varying operating temperature, H2/H2O-ratio, operating current etc., provides very good
accordance of the cell performance measured and simulated. It reveals that lowering fuel
volume and thus causing fuel starvation has more pronounced effect in an electrolysis
mode, which is visible in both the low-frequency and the middle-frequency range. More-
over, both co- and counter-flow are appropriate for the reversible operation. However,
more uniform current density distribution is achievable for the counter-flow, which is of
crucial importance for the real system design. The most accurate performance prediction
can be achieved when dividing the cell into 15 segments. Slightly lower accuracy is reached
by logarithmic averaging the fuel compositions, thus reducing the calculation time
* Corresponding author.E-mail address: [email protected] (V. Suboti�c).
Available online at www.sciencedirect.com
ScienceDirect
journal homepage: www.elsevier .com/locate/he
i n t e rn a t i o n a l j o u r n a l o f h y d r o g e n en e r g y 4 5 ( 2 0 2 0 ) 2 9 1 6 6e2 9 1 8 5
https://doi.org/10.1016/j.ijhydene.2020.07.165
0360-3199/© 2020 The Author(s). Published by Elsevier Ltd on behalf of Hydrogen Energy Publications LLC. This is an open access article under the CC BY
license (http://creativecommons.org/licenses/by/4.0/).

required. A computationally- and time-efficient model with very precise performance
prediction for industrial-sized cells is thus developed and validated.
© 2020 The Author(s). Published by Elsevier Ltd on behalf of Hydrogen Energy Publications
LLC. This is an open access article under the CC BY license (http://creativecommons.org/
licenses/by/4.0/).
Introduction
An increased share of renewable energies in the European
electricity production mix brings additional uncertainties
regarding planning and prediction of available capacity. In
order to still be able to provide security of supply and grid
stability a higher flexibility of energy supply systems is
necessary. This can be achieved by expansion of energy
storage systems, which store energy during phases of excess
availability and then feed back into the grid according to de-
mand [1e3]. Reversible solid oxide cells (rSOC), which are able
to generate both electricity and heat in fuel cell mode and to
produce valuable fuels in electrolysis mode are considered to
be a promising technology for hydrogen-based energy storage
systems [4]. It has to be noted here that rSOC systems are to
date the only available technology, which can operate in fuel
cell and electrolysis mode in one single system. Any other
technology needs at least two separate systems.
One major challenge of rSOCs is the degradation of cell
performance over time. Recent advances in materials engi-
neering and processing technologies extended fuel cell life-
time and significantly reduced degradation rates down to
0.5%/1000 h, even for extremely long operation times (>
10,000 h) [5e7]. Nevertheless, cells optimized for fuel cell
mode present significantly higher degradation rates of 2e5%/
1000 h when operated in electrolysis mode [8,9]. While the
most frequent degradation modes occurring on the hydrogen
electrode are caused by contaminants or impurities in fuel cell
mode or as a consequence of Ni-spreading and Ni-loss in
electrolysis mode [10,11], the performance of the oxygen
electrode is mainly affected by delamination of the interface
oxygen electrode/electrolyte layer and the formation of sec-
ondary phases [5]. Degradation of the electrolyte can occur as
a consequence of formation of defect associates, which
reduce the mobility of oxygen vacancies in the crystal lattice
and microcracks [12] or prevented diffusion processes, for-
mation of Kirkendall voids [13,14] and the formation of oxygen
in the electrolyte [15]. Nevertheless, besides the material is-
sues, which cause long-term degradation, specific operating
conditions can lead to the accelerated degradation. In order to
enable a reliable operation and longevity of reversible solid
oxide cells, the design of experiments has to be carefully
planned. This includes taking into account operating param-
eters such as current density, voltage, temperature and gas
composition. Therefore, in order to select suitable operational
conditions to reduce degradation rates, it is essential to gain
detailed understanding of reactions and processes that occur
in rSOC cells, their impact on the cell performance and sub-
sequent possible degradation mechanisms [5,16,17].
Individual processes and process parameters in the rSOC
system are difficult to access experimentally, but can be easily
accessible when using simulation tools. Depending on the
application of a model developed and the requirements in
terms of accuracy and scale, different model approaches have
been developed. In black box models the transmission
behavior is determined between predefined input and output
parameters which are based on existing data, whereby the
system structure and physical backgrounds are not taken into
account [18,19]. More complex gray box models utilize the
basic structure of the system, while the single elements are
also parameterized by measured data. The modeling of the
cell behavior based on physical laws is an alternative
approach, which enables the identification of processes and
their connection to chemical, physical and geometrical prop-
erties [20,21]. 0D thermodynamic models represent a simple
solution for simulation of the performance achievable, e.g.
reactions within electrolysers and fuel cells are considered
simply as catalytic reactions [22]. While 1D physical electro-
chemical models provide detailed information on mass
transport, heterogeneous chemistry and porous media
transport, they also require a strong dependency the output
parameters on the input parameters such as operating con-
ditions [23]. 1D models are presented to be able to analyse a
dynamic behavior of both SOFC and SOEC and to suggest
appropriate control strategies [24,25]. Advanced 2D models
offer deeper insight into the spatially-resolved rSOC perfor-
mance such as local temperature, current and potential dis-
tribution, gas distribution, heat fluxes and overpotentials
while also giving information about their impact on the
overall performance [26,27]. In Ref. [28] a 2D-transient single
channel model is developed to illustrate performance of rSOC
when operating under hydrogen and syngas. Detailed simu-
lations led to the conclusion that an H2/H2O mixture is more
appropriate for a reversible operation, while the operation
under syngas can be seen as challenging in terms of switching
between the two operatingmodes. State-of-the-art 3Dmodels
with commercial computational fluid dynamics codes provide
very precise information on species distribution of the
chemical and electrochemical reactions [29]. 3D simulations
can also be used in a very effectively manner to improve
performance of SOC or even formaking a selection of themost
appropriate material designs to enhance electrochemical re-
actions. In Ref. [30] the authors developed a novel porous flow-
field design based on a 3D-model and compared it with several
other material designs, thus enabling an optimization of the
SOEC system. Moreover, when expanding the model from the
single-cell up to the stack level, very important information
relating to both operation stability and system durability can
be obtained. Knowledge about the transient thermal behavior
i n t e r n a t i o n a l j o u r n a l o f h y d r o g e n en e r g y 4 5 ( 2 0 2 0 ) 2 9 1 6 6e2 9 1 8 5 29167

of cells and stacks is of great importance in order to predict
mechanisms that can trigger thermomechanical degradation
mechanisms and thus for designing the operating environ-
ment with the aim of ensuring a stable degradation-free stack
operation, as shown in Ref. [31]. Next, on the system level, the
energy analysis for a 10 kW power to gas system performed in
Ref. [32] showed possibilities for increasing the efficiency of
the electrolysis systems. However, according to the authors’
best knowledge, there is still nomodel available for industrial-
sized rSOCs, which enables very detailed performance simu-
lation considering various operating conditions relevant for
real application, and that is validated by in-house made cells
and experiments.
Scope of this study
This work focuses on the numerical and experimental in-
vestigations of industrial-sized solid oxide cells operated in a
reversible mode. A detailed physical model based on 120
equations was built to analyse cell performance in both
operating modes and to obtain a detailed insight into pro-
cesses and loss mechanisms. By carefully selecting the
fundamental equations, quantitative predictions for opera-
tion in both fuel cell and electrolysis mode can be made,
ensuring extensive validation of the model and detailed
investigation of loss mechanisms.
All the data simulated are validated by experimental re-
sults acquired for the purpose of this study. A mixture of
hydrogen, water vapor and nitrogen was employed as fuel. A
very good accordance between the simulated and measured
data was achieved and the results observed enabled: (i) better
understanding of single processes, which is not possible with
purely experimental investigations, (ii) making suggestions
for the improvement of the experimental setup, and (iii) very
detailed presentation of performance achievable for
industrial-sized rSOCs. It is important to mention here that
the aim of the experimental study was not to achieve the
maximum performance of the cells employed. The cells were
embedded in a housing and the setup was prepared to have
slight leakages and not ideal contacting of the electrodes and
contacting meshes. This makes it possible to simulate such
failure modes and to see their impact in the simulation re-
sults, when simulating systems of industrial scale, and also
for determining failures of this kind when operating the cells
and systems. A physical model of a planar rSOC developed
enables the predicting of polarization curves, electrochemical
impedance performance and distribution of relaxation times
under different operating conditions, thus including varying
operating temperatures, fuel and air volume flows, fuel and
air/oxygen composition, as well as flow conditions. One of the
most common methods for analysis of processes in fuel cells,
the electrochemical impedance spectroscopy (EIS), was
applied in-operando as a state of health diagnosis method.
The data obtained were used to derive and interpret the
equivalent circuit model (ECM) and evaluate distribution of
relaxation times (DRT), or simply to analyse geometrical as-
pects of the EIS curve. ECM is a combination of ideal electrical
elements that simulate charge transfer, mass transport and
other processes. DRT is sort of an equivalent way to express
information contained in ECM, in which the frequency-
dependent impedance values are converted into a spectrum
of serially connected RC-elements according to their relaxa-
tion times [21,33e35]. This makes it easier to differentiate
between the individual loss mechanisms, even if the associ-
ated time constants are close together. The measured and
simulated results could thus be compared with each other.
Although the model enables very detailed analysis of
rSOCs in both operating modes, the aim was not to develop
complex 3D models, which are computationally- and time-
intensive, but the model, which gives as much detailed in-
formation as possible in a time-efficient manner. The model
presented in this study was developed in MATLAB and ac-
cording to the authors’ best knowledge no such model is
currently present in the literature. It is based on the physical
laws and presents a time-efficient solution for very detailed
performance assessment of industrial-sized rSOCs, which is
of crucial importance for development, operation and opti-
mization of rSOC systems. For its validation in-house made
cells and experimental data are used. The model developed
can easily be implemented into available tools for prediction
of cell performance, comparison of monitored and predicted
performances and thus also be used to extend control
algorithms.
Experimental setup
The experimental investigations were carried out on single-
cells embedded in a ceramic-cell housing and the data ob-
tained were used to validate the model developed. For this
purpose, voltage monitoring, polarization curve, electro-
chemical impedance spectroscopy (EIS), extensive tempera-
ture measurements and off-gases analysis were conducted.
Fuel electrode-supported solid oxide cells (further in the text
referred as SOC) were employed. The fuel electrode was
fabricated as Ni/YSZ, mixing raw nickel oxide powder with
8 mol% YSZ and sintering it at approximately 1,200 �C for 5 h.
Afterwards, the anode composed of NiO and 8YSZwas screen-
printed on the YSZ support. In order to ensure the gas-
tightness of the 8YSZ electrolyte, it was co-fired at 1,400 �C
for 5 h. A barrier layer between the electrolyte and the cathode
was composed of GDC. On the top of it, the LSCF perovskite
cathode was screen-printed and sintered at 1,080 �C. The
overall area of the single-cells was 10 cm � 10 cm with an
active area of 80 cm2. The cell geometry is illustrated in Fig. 3b.
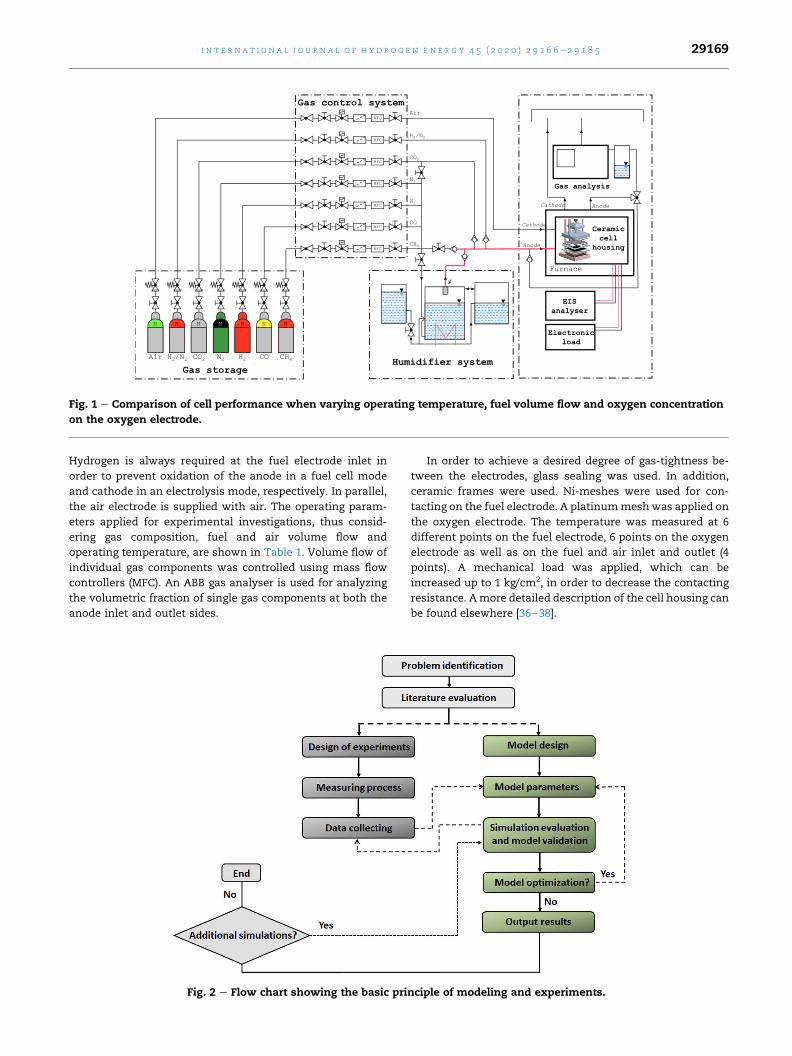
An illustration of the test rig used is provided in Fig. 1. The
cells were embedded in a ceramic cell housing, which was
fabricated as alumina. When using a ceramic cell housing it
is possible to avoid unwanted failure, which could occur
when employing metallic cell housing. The cell anode and
cathode were supplied with gas via gas pipes. The gas inlet
and outlet pipes are ceramic and heated up to the operating
temperature in an electrical furnace. The operating temper-
ature was varied between 700 �C, 750 �C and 800 �C for the
purpose of the detailed investigations. The fuel electrode was
supplied with a mixture of hydrogen/steam/nitrogen, since
the cells are operated in a reversible mode. The same gas
composition can thus be used in both operating modes.
i n t e rn a t i o n a l j o u r n a l o f h y d r o g e n en e r g y 4 5 ( 2 0 2 0 ) 2 9 1 6 6e2 9 1 8 529168
Hydrogen is always required at the fuel electrode inlet in
order to prevent oxidation of the anode in a fuel cell mode
and cathode in an electrolysis mode, respectively. In parallel,
the air electrode is supplied with air. The operating param-
eters applied for experimental investigations, thus consid-
ering gas composition, fuel and air volume flow and
operating temperature, are shown in Table 1. Volume flow of
individual gas components was controlled using mass flow
controllers (MFC). An ABB gas analyser is used for analyzing
the volumetric fraction of single gas components at both the
anode inlet and outlet sides.
In order to achieve a desired degree of gas-tightness be-
tween the electrodes, glass sealing was used. In addition,
ceramic frames were used. Ni-meshes were used for con-
tacting on the fuel electrode. A platinummeshwas applied on
the oxygen electrode. The temperature was measured at 6
different points on the fuel electrode, 6 points on the oxygen
electrode as well as on the fuel and air inlet and outlet (4
points). A mechanical load was applied, which can be
increased up to 1 kg/cm2, in order to decrease the contacting
resistance. Amore detailed description of the cell housing can
be found elsewhere [36e38].
Fig. 1 e Comparison of cell performance when varying operating temperature, fuel volume flow and oxygen concentration
on the oxygen electrode.
Fig. 2 e Flow chart showing the basic principle of modeling and experiments.
i n t e r n a t i o n a l j o u r n a l o f h y d r o g e n en e r g y 4 5 ( 2 0 2 0 ) 2 9 1 6 6e2 9 1 8 5 29169

For the purpose of electrochemical analysis, measure-
ments of polarization curves and electrochemical impedance
spectroscopy were performed. A Bio-Logic impedance analy-
ser with an 80-A booster was employed for this purpose. It is
designed for 4-quadrant operation and can thus be used both
as a potentionstat and a galvanostat, with an option to control
DC and AC signals. Before starting electrochemical measure-
ments, an effort was made to achieve a state of equilibrium.
The polarization curve measurements were performed by
applying the current ramp of 40 mA/s. The impedance mea-
surements were performed in a galvanostatic mode, by
superimposing an AC current wave in the frequency range
100 mHz-10 kHz with 10 points/decade. Since the booster was
used, the maximum frequency was limited to 10 kHz. The AC
value was set to a count of 4% of the DC value for the specific
operating point. The EISmeasurementswere performed in the
entire load range. The impedance data obtained were further
analyzed by applying distribution of relaxation times meth-
odology and the software used for this is detailed explained in
Ref. [34].
Creation of a simple model for rSOC simulation
In order to both numerically examine and predict perfor-
mance of the reversibly operated SOCs of industrial size, a
model based on physical parameters was built. The equations
used are selected to be appropriate for both the fuel cell and
the electrolysis mode. Employing the fundamental model
equations it is possible to simulate polarization curves, elec-
trochemical impedance spectroscopy and detailed loss dis-
tributions. A total of 120 equations were employed for the
model development. They enable to integrate thermody-
namics, charge transfer, mass transfer in both electrodes and
flow field, and reaction kinetics into an advanced model. The
boundary conditions are set based on the experimental setup,
described in the previous section. A detailed explanation of all
the parameters used in the equations can be found in the list
of symbols. We will not show all of the equations that were
used in this study, but only the most representative ones. In
this section, the detailed insight into the modeling steps is
Fig. 3 e Basic overview of a simulation model.
Table 1 e Operating parameters used.
Influencing variable w Fuel electrode Oxygen electrode
xH2 xH2O xN2_VF xO2 xN2
_VO
Variants (Abbreviation) �C % % % SLPM % % SLPM
Temperature
(T) 700 30 30 40 2 21 79 1.6
750 30 30 40 2 21 79 1.6
800 30 30 40 2 21 79 1.6
Volume flow
Fuel electrode (V) 750 30 30 40 2 21 79 1.6
750 30 30 40 0.85 21 79 1.6
Gas composition - Fuel electrode
(XF1) 700 45 15 40 2 21 79 1.6
(XF2) 700 30 30 40 2 21 79 1.6
(XF3) 700 15 15 70 2 21 79 1.6
Flow configuration
Co-/Counter-flow (F) 750 30 30 40 2 21 79 1.6
i n t e rn a t i o n a l j o u r n a l o f h y d r o g e n en e r g y 4 5 ( 2 0 2 0 ) 2 9 1 6 6e2 9 1 8 529170

given, especially with regard to charge transfer, mass transfer
in electrodes, mass transfer in flow field as also polarization
and the impedance model.
The simplified flow chart used for carrying out experi-
mental and numerical investigations within this study is
shown in Fig. 2.
Fundamental equations
The energy conversion in fuel cells can be described focusing
on the basic thermodynamic principles. The chemical re-
actions of crucial importance in this study are hydrogen
oxidation in the fuel cell mode, and in the opposite direction,
steam dissociation in the electrolysis mode:
H2 þ1
2O2#H2O (1)
Besides the macroscopic thermodynamic consideration,
for which only the initial and end conditions are taken into
consideration, additional information on the occurring pro-
cesses can be gained by considering the reaction kinetics. In
the equilibrium state, the forward and reverse reaction rates
are equal and the current density that occurs is indicated as
an exchange current density. Nevertheless, if the operating
state diverges from the equilibrium state, the exchange cur-
rent density is not equal for the forward and reverse reactions,
thus resulting in the net current density, as follows [39]:
i¼Dii ¼ i00,
0
@Y
E
�cmc0
�jnst;mj, ea,
ze,F,hR,T �
Y
P
�cmc0
�jnst;mj, e�ð1�aÞ,ze,F,hR,T
1
A (2)
in which a is the transfer coefficient, h indicates the over-
voltage losses, and c is related to the species concentration.
In contrast to the ideal operating conditions, different ef-
fects occur under real operating conditions, which reduce the
fuel cell performance. The deviation from the ideal voltage is
specified by overvoltage losses. They can be divided into the
equilibrium share ðh0Þ, for which operating current equals
zero, and the current-depending share ðhiÞ, as follows [40]:
h¼h0 þ hi (3)
In the equilibrium state, the current density is considered
to be zero, thus leading to the following overvoltage:
h0 ¼R$T
ze$F$ln
Y
EþP
�cmc0
�nst;m!
(4)
Considering such overvoltage differentiation, the net cur-
rent can be presented as the Butler-Volmer-Equation [35]:
i¼ i0,
0
@ea,ze,F,hact
R,T � e�ð1�aÞ,ze,F,hactR,T
1
A (5)
with the activation overvoltage hactand the exchange current
density i0.
Moreover, the losses are divided into concentration losses,
activation losses and ohmic losses. Depending on the con-
centration of reactants and products on the electrochemically
active reaction sites in comparison to their concentration
under open circuit voltage (OCV) conditions, the local
potential and thus the occurring losses vary in accordance
with Eq. (6) [40].
hconc ¼R,T
ze,F,ln
Y
m
�c*mcm;0
�nst;m!
(6)
cm;0refers to the concentration of the specific gaseous species
at OCV and c*mto the local concentrations. In the present study,
all the losses are related to the H2, H2O and O2 components,
thus differing between losses that occur on the fuel electrode
and those on the oxygen electrode. Taking the electro-
chemical reactions that occur into account, the forward and
reverse reactions are dependent on the required activation
energy and thus the available potential difference, which is
presented as a function of charge transfer. A deviation from
the equilibrium state is thus necessary in order to initiate the
occurrence of reactions, and thus simultaneously leading to
the irreversible entropy increases and losses [41]. For a special
case, inwhich a transfer coefficient is defined to be a ¼ 0:5, the
Butler-Volmer-Equation (Eq. (5)) becomes a hyperbolic sine
function and the overvoltage can be calculated according to
the following equation [40]:
hact ¼2,R,T
ze,F,arsinh
�i
2,i0
�: (7)
Finally, the ohmic losses are determined as a function of
the area specific resistance r and the operating current density
i [40]:
hohm ¼ r,i: (8)
In this study, no further losses except those mentioned
above are considered, in order to simplify the calculations.
Thus, the cell voltage E is determined as a difference of the
Nernst-voltage and the specific losses that occur during the
operation [40]:
E¼EN � hact � hconc � hohm (9)
Modeling principles
The fuel cell is in general divided into several segments in the
flow direction for the purpose of the simulations performed.
The influence the number of segments has on the quality of
the data observed will be discussed later. An illustration of a
segment simulation is shown in Fig. 3a. The gas composition
in the flow field of one segment is assumed to be constant
and thus all the changes across the flow direction and taking
the direction of the cell thickness into consideration can thus
be neglected. The mass transfer only is considered for each
electrode, thus enabling 1D-analysis. However, the division
into several segments makes it possible to analyse the
changes that occur in the flow field direction, thus enabling
the 2D-analysis. The segment number is labeled with an
index n. The parameter x describes the distance from the
boundary layer electrolyte/electrode, and for the flux of
species N the transport from the electrolyte layer towards the
gas flow field is considered as positive. The index F always
refers to the fuel electrode, whereas the index O refers to the
oxygen electrode. The fuel flow velocity is indicated by v and
it concerns the velocity on both the inlet and the outlet of the
i n t e r n a t i o n a l j o u r n a l o f h y d r o g e n en e r g y 4 5 ( 2 0 2 0 ) 2 9 1 6 6e2 9 1 8 5 29171

segment; the velocity at the outlet is indicated by the same
number n as for the corresponding segment. The index m
refers to the gas component; its concentration in the fuel flow
field is indicated by c, and in the electrode by a superscript b.
The contacting meshes are in general considered as a part of
the fuel flow field, whereas the meshes with higher layer
thickness are considered as a part of the fuel electrode. In
Fig. 3b the cell used is presented with the length (l) and width
(b) of its electrochemically active area, as shown in Ref. [42].
As already known, in the fuel cell mode the ionic transfer
occurs in the oxygen electrodes via electrolyte and further
through the fuel electrode, which, because of the negative
oxygen ions corresponds to the technical current direction
from the fuel electrode to the oxygen electrode. Therefore,
this direction is considered as positive in the fuel cell mode,
and negative in the electrolysis mode. For both the fuel cell
and the gas distributed along the cell, a constant temperature
is assumed, and thus the thermal effects are neglected.
Furthermore, in order to simplify the calculations and
considering the available literature, electrochemical reactions
are assumed to occur only on the boundary layer electrolyte/
electrode, thus neglecting reactions in the direction of the
electrode thickness. In Ref. [43], the numerical investigations
carried out showed that reactions strongly diminish with
increasing distance from the boundary layer electrode/elec-
trolyte and thus the reactions can be considered to occur
mainly in a region of several mm.
In the present study, considering the experimental setup
and the ceramic cell housing, although a glass sealing is used,
the occurrence of leakages is presumed, which lead to the
water vapor production even under OCV conditions. This is
considered in the model by properly corrected gas inlet
composition. In addition, it is assumed that the internal
leakage current occurs due to undesired gas and electrons
exchange, which is considered to be constant and thus results
in an offset of the polarization curve [41,44,45]. All the relevant
parameters used for the purpose of the simulations are given
in Table 2.
Charge transfer
The ohmic losses, ascribed to a resistance resulting from the
following: (i) electron conduction in the metallic phase of the
electrodes and in contacting meshes, (ii) ionic conduction in
the electrolyte, as well as (iii) contact resistance between (a)
single wires within the contacting meshes, (b) meshes and
electrodes, and (c) individual layers; are summarized into an
area specific resistance, which is thus presented as a function
of the experimental setup and not solely the rSOC micro-
structure. Resistance of this kind is temperature-dependent
and its function is displayed in the form of an Arrhenius
approach [40]:
r¼ r0,e�Ea;o
R,T (10)
with a pre-exponential factor r0and the activation energy Ea;o.
The parameter values are determined by fitting of the
measured data and as such are presented in Table 2. It is
assumed that this resistance is equal to the high-frequency
resistance in impedance spectra.
Mass transfer in electrodes
A Dusty gas model (DGM) was used to describe the mass
transferwithin the porous electrodes, forwhich themolar flux
of species Nm, the concentrations of individual gas compo-
nents cbmand the pressure pbare considered as a function of the
coordinate x. If the mass transfer occurring in parallel to the
cell surface is neglected, the following equation is valid for
each component m [50]:
X
l
lsm
cbl ,Nm � cbm,Nl
cb,Deml
þ Nm
DemK
¼ �vcbmvx
� Bg,cbmm,De
mK
,vpb
vx(11)
in which,Demlrepresents the binary diffusion coefficients of the
components l and m, the effective Knudsen diffusion coeffi-
cient DemK, the permeability Bg and dynamic viscosity m of the
gas mixture. The terms on the left-hand side describe the
diffusion in a multi-component system according to the
Stefan-Maxwell model and the interaction of the gas compo-
nents with the porous structure, whereby the last term on the
right-hand side refers to the advective mass transfer in the
form of a Darcy equation. For the purpose of the model
simplification, the diffusion coefficients are taken into
consideration as constant on the boundary to the flow chan-
nels, thus resulting in linear pressure and species quantity
distribution. A comparison is made for the results observed
when using constant diffusion coefficients and the data
implemented from the Matlab ode 45 algorithm for a current
density of ±500 mA/cm2 in both fuel cell and electrolysis
mode. In Fig. 4, distribution of the selected parameters for a
stationary case on the fuel electrode is illustrated. The
parameter values used in the model are listed in Table 2,
whereby the mean size of the porous structures is estimated
based on the scanning electrode microscope (SEM) images.
The diagrams show that the results observed in the current
range of interest can be considered as linear and they show
very good accordance with the data obtained when using
linear diffusion coefficients. The change in the effective
diffusion coefficients within the electrode is very low and the
assumption of constant values results in very low deviations
that can be neglected. The effective diffusion coefficient of
water vapor is lower than that of hydrogen, whereby in the
fuel cell mode its partial pressure on the boundary layer
electrode/electrolyte increases slightly and decreases slightly
in the electrolysis mode, since in the first case water vapor is
formed and in the latter case consumed. The pressure
changes can also be effectively reproduced using the constant
diffusion coefficients; these can be neglected, however, in the
current range considered. Furthermore, a higher nitrogen
fraction in the fuelmixtures leads to a decrease in the H2O and
H2 diffusion coefficients, and as a consequence the concen-
tration variation in the electrode increases for constant cur-
rent density. Simultaneously, the influence of nitrogen on the
pressure change is very low.
Mass transfer in the flow field
The mass transfer processes within the flow field are calcu-
lated based on conservation equations of mass, momentum,
energy, charge as well as species balance. Under the
assumption that pressure and temperature within the entire
i n t e rn a t i o n a l j o u r n a l o f h y d r o g e n en e r g y 4 5 ( 2 0 2 0 ) 2 9 1 6 6e2 9 1 8 529172

flow channels as well as the species concentration and ve-
locity within the cross-section are constant, the mass transfer
can be described based on 1D species balance equation. Nu-
merical investigations carried out by other researchers
showed that diffusion along the flow field direction has a very
low impact on the polarization curve and impedance spectra,
even under very high currents ( >600 mA/cm2) [51]. Consid-
ering this, the species balance equation, under the assump-
tion of ideal gas behavior, can be used as follows [52]:
vccmvt
þ v�ccm,v
�
vy¼ b
A, _sm (12)
with ccmas molar concentration, v flow velocity, b electro-
chemically active width of the fuel cell,A as cross-section area
Table 3 e Initial operating conditions applied for modelvalidation.
Parameter Without H2O With H2O
Temperature 800 +C 750 +C
Gas composition fuel
electrode
15 % H2, 85 % N2 30 % H2, 30 % H2O, 40 % N2
Volume flow fuel
electrode
2 SLPM 2 SLPM
Gas composition
oxygen electrode
21 % O2, 79 % N2 21 % O2, 79 % N2
Volume flow oxygen
electrode
1:6 SLPM 1:6 SLPM
Table 2 e Model parameters, cell geometry and charge transfer values.
Parameter Value Unit Source
Length of the electrochemically active area l 8:94,10�2 m
Width of the electrochemically active area b 8:94,10�2 m
Electrochemical active surface l,b 8,10�3 m2
Electrolyte thickness dE 1:5,10�5 m [46]
Fuel electrode thickness dF 3:5,10�4 m [46]
Oxygen electrode thickness dO 3,10�5 m [46]
Fuel flow cross-section on the fuel side AF 1; 2,10�4 m2 Estimated value
Flow field cross-section on the oxygen side AO 1; 2,10�4 m2 Estimated value
Leakage on the fuel side _VL;F 5,10�3 l
min
Measurement data
Leakage current iL 1 mA
cm2
[44]
Inductivity of the measuring cables L 5,10�9 H Measurement data
Pre-exponential factor for ohmic resistance r0 5:47,10�8 U
m2
fit
Activation energy Ea;o 5:64,104 J
molfit
Fuel electrode
Transfer coefficient aF 0.75 � [42]
Pre-exponential factor hydrogen-desorption gH2 1:22,108 PaffiffiffiffiK
p [42]
Activation energy desorption Ea;des 8:812,104 J
mol[42]
Pre-exponential factor gF 2:2,108 A
m2
fit
Activation energy Ea;F 8:49,104 J
mol[43]
Capacitance between fuel electrode and electrolyte CF 25 F
m2
fit
Oxygen electrode
Transfer coefficient aO 0.5 � [47,48]
Pre-exponential factor gO 8,109 A
m2
fit
Activation energy desorption Ea;O 1; 2,105 J
mol[47,48]
Capacitance between oxygen electrode and electrolyte CO 10 F
m2
[49]
Fuel electrode
Average pore radius rp;F 10�6 m SEM
Average particle diameter dp;F 3,10�6 m SEM
Tortuosity tg;F 3.5 � [42]
Porosity Fg;F 0.35 � [42]
Oxygen electrode
Average pore radius rp;O 5,10�7 m SEM
Average particle diameter dp;O 10�6 m SEM
Tortuosity tg;O 3.5 � [42]
Porosity Fg;O 0.35 � [42]
i n t e r n a t i o n a l j o u r n a l o f h y d r o g e n en e r g y 4 5 ( 2 0 2 0 ) 2 9 1 6 6e2 9 1 8 5 29173

of the flow channel, and _sm is the molar current density on the
electrode on the boundary to the flow field. For a segment
analysis a spatial discretisation of the species balance equa-
tion according to the finite difference method with the back-
ward difference for positive flow velocity is used, as shown in
the following equation [52].
vccm;n
vtþccm;n,vn � ccm;n�1,vn�1
Dy¼ b
A, _sm;n (13)
Polarization curve and impedance model
Calculation of the polarization curve occurs according to Eq.
(9) (Nernst-voltage less all the occurring voltage losses, which
are considered as a function of local current densities and gas
composition.) The gas compositions can also be considered as
a function of the operating current. In order to illustrate the
cell impedance the fundamental equations are linearized and
the loss potentials are approached by Taylor series. On the
assumption that electrochemical reactions are characterized
by a very low time constants, the frequencies examined can
be considered as quasi-stationary. Therefore, there is no
explicit time-dependency in the relation between potential
losses that occur as a result of specific reactions. These can be
calculated according to the following equation [53]:
hði; xÞz hði; xÞþ vh
vi
�,ði� iÞ þ vh
vx
�,ðx� xÞ (14)
in which x depicts further current density dependent param-
eters. Because of the linearization applied, the system
response on the harmonic input variable is the harmonic
output variable with the same frequency, but the varied
amplitude and the phase. Thus, the solution obtained can be
presented as follows [53]:
i¼ iþRe�bi , ej,u,t
�h¼hþRe
�bh , ej,u,t
�x¼xþ Re
�bx , ej,u,t
�
(15)
Eventually, the area specific impedance z is calculated as a
ratio between the voltage and current amplitudes [53]:
z¼ bhbi: (16)
If the cell is considered as one segment, the entire simu-
lation can be simplified towards 1D-simulation. It is assumed
that the operating conditions remain constant within the
segment and the voltage amplitude is determined as a sum of
the amplitudes of single voltage losses, which are linked to the
current amplitudes of the specific segment and the alterna-
tions in the gas composition due to the related transfer
function. For the 2D-model, the cell is divided into several
segments and in that case, it was assumed that the cell
voltage and the complex amplitude are equal for all the seg-
ments. The current amplitudes give more detailed informa-
tion about alternations in the gas composition in the flow
channel, which impact the following segments. The overall
impedance can thus be calculated according to Ref. [53]:
Z¼ X
n
b,Dy
zn
!�1
(17)
The equivalent circuit models used to simulate impedance
for both 1D- and 2D-model are shown in Fig. 5.
Model validation and experimental study
In this section the results obtained in the simulation study are
presented and compared with the experimental results. Thus,
model validation and an analysis of the deviations observed
are provided. There are several reasons based on which dif-
ferences in the simulated and measured values can occur,
such as e.g. assumptions made for the model design and pa-
rameters selection. Furthermore, it is also possible that the
Fig. 4 e Distribution of selected parameters in the fuel electrode based on DGM ( H2, H2O, N2) and comparison
with results using the constant diffusion coefficients ( H2, H2O, N2) for species quantities in fuel flow channels for (i)
15 % H2 and 85 % N2 at 500 mA=cm2, (ii) 30%H2, 30%H2O and 40%N2 at q, and (iii) , 30%H2, 30%H2O and 40%
N2¡500 mA/cm2.
i n t e rn a t i o n a l j o u r n a l o f h y d r o g e n en e r g y 4 5 ( 2 0 2 0 ) 2 9 1 6 6e2 9 1 8 529174

experimental setup impacts the ideal operating conditions,
thus causing variations of the results expected. The operating
conditions under which the measured data are obtained and
which are used here for the model validation can be seen in
Table 3.
Detailed insights into the impact of specific parameters on
the results are given here, which are the gas composition in
flow channel, number of segments, flow configuration,
transfer coefficient, operating temperature, fuel volume flow
and fuel composition.
Gas composition in the flow channel
As already described in the previous section, the gas compo-
sition within the fuel flow field is assumed to be constant.
However, there are different criteria available to determine
such constant gas composition: (i) gas composition is
assumed to be same on the segment inlet and outlet, (ii)
logarithmic average value of the concentration of single
components at the inlet and outlet of the segments, and (iii) by
cell division into 15 segments. For the purpose of simulating
gas distribution in the flow field, dry hydrogen fuel was used,
since it causes the highest changes of the gas composition
along the cell as well as a function of operating conditions. In
Fig. 6 the measured voltage (indicated by cross symbols),
simulated voltage (indicated by solid black line) and single
losses (represented by colored areas) are presented. When
considering single losses, these are separated into activation
losses ðactÞ, concentration losses caused by changes in the
flow channels ðconc; chanÞ and in the electrodes ðconc;diffÞ, onthe fuel side (F), on the oxygen side (O) as well as ohmic losses
ðohmÞ.In the first case for which the constant gas composition in
the flow channel is assumed, as shown in Fig. 6a, no con-
centration losses occur in the flow channel, because the
variation of the gas composition is not considered. Therefore,
Fig. 5 e Equivalent circuit used.
Fig. 6 e Comparison of þ the measured and d simulated polarization curves and separation of single losses as a function of
different ways for determination of gas composition in the flow channels.
i n t e r n a t i o n a l j o u r n a l o f h y d r o g e n en e r g y 4 5 ( 2 0 2 0 ) 2 9 1 6 6e2 9 1 8 5 29175

it is not possible to simulate losses that occur as a conse-
quence of high operating currents and high fuel utilization
rates. This is clearly visible in the diagram, since on increasing
the current density, the discrepancy between the measured
and the simulated curves increases significantly. In compari-
son, the 2D representation created by dividing the cell into 15
segments results in increasing concentration losses and
slightly increasing activation losses on the fuel side with an
increasing operating current, as can be seen in Fig. 6c. In the
low current density range (< 100 mA/cm2), the losses remain
almost identical. The results observed using logarithmic
averaging (see Fig. 6b) of the gas concentrations within the
flow channels are similar to those observed for the 2D simu-
lation. However, in this case the concentration losses first
increase strongly at higher operating currents (> 400 mA/
cm2). However, in comparison to the measured data, both
latter models show lower losses and with no such abrupt
decrease as that observed for the measured polarization
curve.
This discrepancy can on the one hand be explained as a
consequence of 3D effects such as non-uniform current den-
sity distribution over the cross-sectional surface, which are
not considered in this numerical study, because of the model
complexity that would avoid the main goal of this study.
Numerical study devoted to the investigation of fuel flow
within the ceramic cell housing used [38], showed that when
using the proposed geometry an area with a 25% higher flow
density on the oxygen side and 15% higher on the fuel side is
formed, whereby the volume flow decreases in the remaining
cross-section. This could be considered through the further
model extension towards a 3D model and simulation of seg-
ments in the cross-sectional direction. This was not done,
however, in the present study. On the other hand, it is possible
that the limited gas distribution within the flow channels
causes a concentration gradient in the cross-sectional flow
field, which thus leads to the greater change of the gas
composition on the boundary electrode/flow channel and to
increasing losses. A further reason for the changes observed
could also be explained based on the results observed in Refs.
[38], where it was shown that local water vapor pressure can
even vary by asmuch as about 10%. Themodel accuracy could
thus be increased using the computational fluid dynamic
simulation tools, which simultaneously have a significant
increase on the complexity of the model. Nevertheless,
further explanation is not the issue in themodeling, but in the
experimental setup, which is based on the leakage and not
ideal contacting of the electrodes, lowering the measured cell
performance.
Impact of the segment numbers on the simulation results
For a 2D perspective the cell is divided into segments and
electrochemical reactions are taken into consideration for
each segment. Thus, the gas composition on one segment
corresponds to the gas composition obtained at the outlet of
the previous segment. In this context current density is
considered to be constant along each segment. On increasing
the number of segments the length of each segment and the
alteration within the segment decreases, while the accuracy
of the simulated data increases. The impact of the number of
segments on the average current density, distribution of
voltage losses as well as electrochemical impedance spectra
and distribution of relaxation times, for an operating voltage
of 0.75 V and under operating conditions defined in Table 3, is
presented in Fig. 7.
In Fig. 7a, a hyperbolic trend of the average current density
as a function of segment numbers is observable, whereby the
curves become flatter with the increasing number of seg-
ments. Increasing the number of segments results in a distinct
increase of concentration losses in the flow field channels on
the fuel side, but only in a slight increase on the oxygen side.
This behavior is most pronounced until segment 5, subse-
quently the changes are very slight until segment 15, after
which no changes are observable, as can be seen in Figs. 7aeb.
When analyzing impedance data observed as Nyquist dia-
grams (Fig. 7c) and DRT-data (Fig. 7d), it can be seen that
increasing the number of segments up to 2 results in distinct
changes, for which low-frequency processes are observable.
The height of the low-frequency arc increases with an
increasing number of segments, but only up to the segment
number 10. If the number of segments is higher than 10, no
further changes occur. In the DRT spectra it is visible that even
middle-frequency peaks initially increase with the increasing
number of segments, and additional peaks are observed be-
tween the low- and middle-frequency peaks. Their time con-
stant decreases with the increasing number of segments and
finally they start to merge with the middle-frequency peak.
The occurrence of such an additional peak may be explained
by processes that occur under very low water vapor partial
pressure, as at the fuel electrode inlet, and their impact de-
creases as the length of the segment decreases.
Impact of the flow configuration
When dividing the cell into segments, it is also possible to
investigate the impact of the flow direction on the cell per-
formance. There are in general, three different possible flow
directions: co-flow, counter-flow and cross-flow. It is also
possible to investigate each of these with the experimental
setup used in the experimental study. Under co-flow condi-
tions, the fuel and air directions are same, but these are in the
opposite directions in the case of counter-flow. In Fig. 8 the
impact of flow direction on the cell performance can be seen
thus taking the voltage (Fig. 8a), current density (Fig. 8b) and
species distribution (Fig. 8c) observed in the numerical study
into consideration.
The polarization curves in Fig. 8a show that the impact of
the flow configuration is very low under specific operating
conditions. Moreover, when taking into account current dis-
tribution, it can be seen that the impact of flow configuration
is low under low current densities and becomes evident only
at higher operating currents. In such a case the counter-flow
results in a more uniform distribution than the co-flow
configuration, the reason for this is the distribution of
gaseous species, as presented in Fig. 8c. On the fuel electrode
side the electrochemical reactions in the fuel cell mode lead to
a decrease in the hydrogen partial pressure and a water vapor
increase in the flow direction, with the result that the local
Nernst-voltages decrease and the concentration losses in-
crease. The decreasing oxygen partial pressure on the oxygen
i n t e rn a t i o n a l j o u r n a l o f h y d r o g e n en e r g y 4 5 ( 2 0 2 0 ) 2 9 1 6 6e2 9 1 8 529176

electrode causes an increase in concentration losses. Thus,
under co-flow conditions the losses on both electrodes in-
crease in the flow direction and cause a drop in the operating
current. The direction of the concentration losses for the
counter-flow configuration is opposite for the two electrodes,
thus resulting in a more uniform current density distribution.
In electrolysis mode this effect is very weak, since oxygen is
formed and thus the changes in the oxygen partial pressure
are lower. Moreover, the increase in the oxygen concentration
increases the exchange current density on the oxygen elec-
trode and causes lower activation losses.
In the experimental investigations performed, the fuel flow
direction remained unchanged, while the air flow direction
was changed in order to achieve the counter-flow configura-
tion. The measured impedance spectra (Fig. 8d) and the cor-
responding DRT spectra (8e) show almost no deviations
between the co-flow and counter-flow. The only difference is
observed in the low-frequency range due to noise. This can be
caused by changes in the temperature distribution when
reversing the flow direction and also from the occurrence of
leakage caused by changes in pressure distribution.
Transfer coefficient
The transfer coefficient a is a kinetic parameter, which de-
scribes the behavior of the activation energy required and
thus the reaction rates of the forward and reverse reactions
considered as a function of the varying electrochemical re-
actions and their potential within the cell [41]. In order to
simulate the cell performance in a correct way, it is important
to first estimate its correct values. For simulation of fuel cells,
a is usually selected to be 0.5 [29]. When simulating reversible
operation, however, it is important to consider the impact of
the transfer coefficient appropriate for simulating losses in
both operating modes. Fig. 9a shows the activation over-
voltage trend as a function of three different transfer co-
efficients, 0.5, 0.75 and 0.85, employing the operating
conditions shown in Table 3. If a ¼ 0.5 (indicated by orange
line) a point-symmetric behavior is observable and losses are
identical in both operating modes. In the range of low current
densities, a linear behavior is observable independent on the a
value, thus concluding that in such a range the transfer co-
efficient does not impact the curve behavior. In the case if
a>0:5, the activation losses are significantly lower for positive
operating currents, based onwhich an asymmetric behavior is
observable. An asymmetric behavior of this kind is intensified
with the increasing values of transfer coefficients. Their
impact is much more pronounced for negative operating
currents in electrolysis mode.
The experimental investigations performed on fuel
electrode-supported cells resulted in significantly higher los-
ses when operating the cell in the electrolysis mode in com-
parison to the fuel cell mode. Therefore, we assume that such
behavior can be linked to the asymmetric activation losses on
the fuel electrode, based on which a is assumed to be greater
than 0.5. In our study, since the cell is operated in a reversible
mode, we performed simulations for two different a values,
and compared the results obtained when employing a ¼ 0.75,
as available in the literature [42] with a ¼ 0.85.
Fig. 7 e Impact of number of segments on the cell performance, when fueling it with dry hydrogen at 0:75 V.
i n t e r n a t i o n a l j o u r n a l o f h y d r o g e n en e r g y 4 5 ( 2 0 2 0 ) 2 9 1 6 6e2 9 1 8 5 29177

The results observed when employing the two different a
values for the simulation study are presented and compared
with the measured data in Fig. 9b for polarization curve, in
Fig. 9c for EIS-spectra and in Fig. 9d for DRT-spectra. Com-
parison of the simulated and measured polarization curves
shows thatwhen considering the fuel cellmode, slightly lower
losses are predicted for the higher a value (indicated by green
solid line), whereby in the electrolysis mode significantly
higher losses are predicted than for the lower a (indicated by
blue solid line). The EIS- and DRT-plots provide the required
explanation for such behavior, showing that this difference
results mainly from the middle-frequency range and the
activation losses. Under OCV conditions, the diagrams are
identical for both a, since the losses in the low-current range
are independent on the transfer coefficient in this case and
the exchange current densities are almost the same based on
the same partial pressures of H2 and H2O. In the DRT-spectra
the middle-frequency range would appear to result in the
highest deviations, which can be explained by several factors.
On the one hand, the reasons are the leakage effects consid-
ered in the developed model, which cause a very low current
to flow even under OCV conditions as well as the subsequent
alternation of the gas composition. On the other hand, the
conversion of the impedance data to the distribution of
relaxation times can result in specific artifacts. On increasing
the current density, the amplitude in the middle-frequency
range in the fuel cell mode decreases and increases in the
electrolysismode, the increase of which is intensifiedwith the
increasing a. Additionally, when increasing a, the dependency
of the exchange current density on the water vapor concen-
tration increases. This even intensifies the rising trend in the
electrolysis mode, since the water vapor concentration de-
creases with increasing operating current due to the
increasing quantity of hydrogen generated, thus leading to
larger activation losses. In the low-frequency range the same
trend is expected as for themiddle-frequency range, although
only apparent to a much lesser extent, which is also to be
ascribed to the dependency on the exchange current density.
In comparison to themeasured data, the simulation results
in the entire range show lower losses, the deviation of which
is higher in the electrolysis mode. The Nyquist-plots show the
higher high-frequency resistance for the measured data,
which can appear as a consequence of contacting issues in the
experiments. The ohmic resistance values used for the
simulation are obtained by curve fitting as a function of the
operating temperature and based on the several measured
data available. Moreover, the measured data show even
stronger dependency of the middle-frequency range on the
Fig. 8 e Comparison of numerical and experimental results observed when fueling the cell with humidified fuel considering
the co-flow and counter-flow configuration.
i n t e rn a t i o n a l j o u r n a l o f h y d r o g e n en e r g y 4 5 ( 2 0 2 0 ) 2 9 1 6 6e2 9 1 8 529178

operating current. In this case, employing higher values for
transfer coefficient results in lower deviations between the
measured and the simulated data. Next, the low-frequency
range of the Nyquist-plot is also lower in the simulated
values, which can occur due to the processes in the flow
channels, as discussed above. Such effects could also provide
a specific impact in the middle-frequency range. The DRT-
spectra show very good accordance of the simulated and the
measured time constants. The measured data show addi-
tional peaks at approximately t ¼ 1 s, which can be caused by
the signal noise in the low-frequency range. In the simulation
the time constant at t ¼ 2,10�3 s is predicted as lower, which
could refer to higher effective diffusion coefficients for the
mass transfer in the fuel electrode.
Impact of operating conditions on the cell performance
In the previous sections a comparison was made between the
measured and the simulated data. It could be seen that slight
deviations often occur between the modeled and experi-
mental values. The reason for this lies on the one hand in the
choice of the model parameters and on the other hand on the
experimental setup, in which small deviations can also result
in considerable performance variations. For example, if there
are leakages in the experimental setup, the volume flow can
change within the flow channels and the cell. Subsequently, it
causes changes of the temperature distribution and the
equilibrium state. Furthermore, depending on the fuel used,
high temperature differences can occur between the cell inlet
and outlet, which impact the average cell temperature, thus
leading to slightly changed operating conditions in compari-
son to those applied in the modeling study. For this reason,
the impact of three selected operating parameters: operating
temperature, fuel volume flow and gas composition, on the
cell performance were investigated in detail in an experi-
mental study.
The operating temperature is an essential parameter for
achieving a sufficient efficiency, both in the fuel cell and
electrolysis mode, since the electrolyte conductivity in-
creases with increasing temperature and the reaction ki-
netics are also enhanced. Nevertheless, the possibility for
specific degradation mechanisms to occur in addition to
more demanding requirements on the system components
also increases simultaneously with the temperature. The
impact of the operating temperature on the cell performance
(T) is illustrated in Figs. 10a and b. The temperature was
varied between 700 �C indicated by blue solid line, 750 �C
depicted in green solid line and 800 �C illustrated by orange
solid line. When varying the operating temperature, the hu-
midified fuel mixture stated as T in Table 1 was used. It
consisted of H2/H2O/N2 ¼ 30/30/40, with the fuel volume flow
of 2 SLPM and the air volume flow of 1.6 SLPM. The measured
polarization curves, as presented in Fig. 10a, show decreasing
OCV with the increasing temperature. In the fuel cell mode
Fig. 9 e Impact of transfer coefficients of 0.5, 0.75 and 0.85 on the cell performance and comparison with
the £ measured data.
i n t e r n a t i o n a l j o u r n a l o f h y d r o g e n en e r g y 4 5 ( 2 0 2 0 ) 2 9 1 6 6e2 9 1 8 5 29179
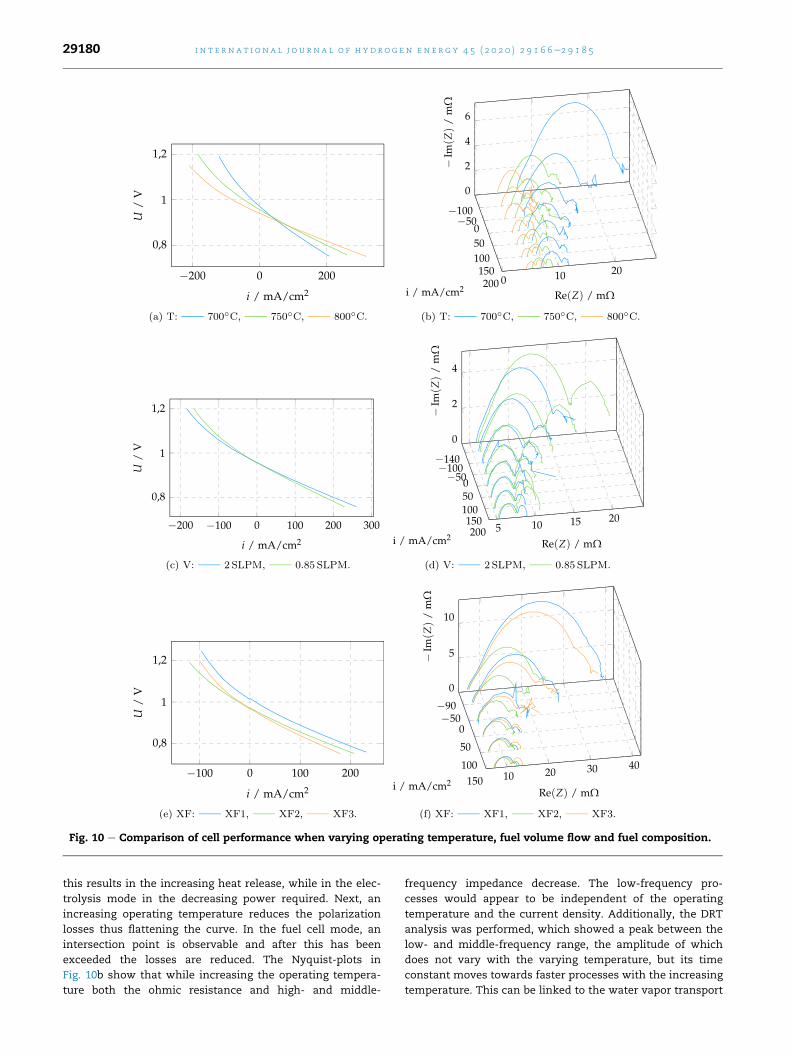
this results in the increasing heat release, while in the elec-
trolysis mode in the decreasing power required. Next, an
increasing operating temperature reduces the polarization
losses thus flattening the curve. In the fuel cell mode, an
intersection point is observable and after this has been
exceeded the losses are reduced. The Nyquist-plots in
Fig. 10b show that while increasing the operating tempera-
ture both the ohmic resistance and high- and middle-
frequency impedance decrease. The low-frequency pro-
cesses would appear to be independent of the operating
temperature and the current density. Additionally, the DRT
analysis was performed, which showed a peak between the
low- and middle-frequency range, the amplitude of which
does not vary with the varying temperature, but its time
constant moves towards faster processes with the increasing
temperature. This can be linked to the water vapor transport
Fig. 10 e Comparison of cell performance when varying operating temperature, fuel volume flow and fuel composition.
i n t e rn a t i o n a l j o u r n a l o f h y d r o g e n en e r g y 4 5 ( 2 0 2 0 ) 2 9 1 6 6e2 9 1 8 529180

in the fuel electrode, as observed in the simulation results
referred to above.
When varying the volume flow, the velocity and thus the
variation of the gas components in the fuel channel are
influenced at the specific current density. The lower volume
flow results in the faster variation of the chemical potential
and thus increasing losses during the electrochemical re-
actions. Moreover, reducing the volume flow leads to an in-
crease in fuel utilization, thus reducing quantity of unused
fuel components at the fuel electrode outlet. The volume flow
can also influence the temperature in the fuel cell system. The
results observed when varying the fuel volume flow (V) be-
tween 2 SLPM and 0.85 SLPM are shown in Fig. 10c and d. The
furnace temperature was kept constant at 750+C, whereas on
the oxygen electrode the volume flowwas set to 1.6 SLPM. The
fuel composition remained unchanged. By reducing the fuel
flow from 2 SLPM (indicated by blue solid line) down to 0.85
SLPM (indicated by green solid line), the losses increased in
the entire load range, the impact of which is even more pro-
nounced in electrolysis mode. The impedance measurements
showed no impact of the volume flow in the high-frequency
range, but a significant difference occurred in the low-
frequency range. This is visible for both operating modes
when increasing the operating current density. In parallel, the
time constant moves towards higher values thus leading to
the conclusion that losses occurred that can be traced back to
the mass transfer effects in the gas channels on the fuel side.
In the electrolysismode, additional losses occur in themiddle-
frequency range and they increase with increasing current
density. This occurs on lowering the exchange current density
due to the decreasing water vapor concentration, which thus
causes higher activation losses.
Finally, the fuel gas composition was changed, in which
the ratio between hydrogen and water vapor concentration as
well as fuel dilution in nitrogenwere varied. The set operating
parameters can be found in Table 1, labeled as XF. The po-
larization curves in Fig. 10e show a clear dependence on the
H2O quantity; the higher H2O partial pressure, the flatter the
curve and lower the losses. For the OCV the H2/H2O-ratio is
also of crucial importance according to the Nernst-equation,
which is also confirmed by the measured data. The more
detailed insight into losses is visible in the Nyquist-plots in
Fig. 10f. Increasing the nitrogen quantity, which means
intensified fuel dilution and lower hydrogen and also the
water vapor quantity, result in higher losses in the low-
frequency range. If the H2O quantity on the fuel electrode is
lower, the impedance of the low- andmiddle-frequency range
increase in the electrolysis mode with the increasing current
density. In the fuel cell mode, the difference between the
impedance spectra is not so pronounced. This behavior may
occur as a consequence of asymmetric activation losses in the
fuel electrode. Additionally, the water vapor concentration
increases in the fuel cell mode due to the restricted transport
in the fuel electrode and decreases in the electrolysis mode,
thus amplifying the observed effect.
Relative error - simulation vs. measurement
In Fig. 11 the relative error is shown as the deviation of the
simulated values in comparison to the measured values at an
average current density of 100 mA/cm2 in electrolysis mode
and 200mA/cm2 in fuel cellmode for both transfer coefficients
used (as discussed in Section Transfer coefficient). The error is
illustrated for the initial operating conditions given in Table 3,
as well as for the variations performed for specific parameters
selected. When decreasing the water vapor quantity (down to
15 vol%) and volume flow on the fuel side (down to 0.85 SLPM)
as well as increasing the operating temperature up to 800 �C,
the concentration losses and their impact on the cell perfor-
mance increase, which is underestimated in the simulation
model leading to the higher voltages in fuel cell mode and
lower voltages in electrolysis mode. With decreasing tem-
perature the impact of activation losses increases, for which
the simulation, based on its dependency on the water vapor
concentration, shows lower losses in electrolysis mode and
higher losses in fuel cell mode. Thus, since individual errors
show the same tendency in the electrolysis mode, the total
relative error increases. In contrast, in the fuel cell mode, the
individual errors feature opposite tendencies, based on which
the total relative error seems to be lower. The higher transfer
coefficient leads on the one hand to the higher activation
losses in electrolysis mode and lower losses in fuel cell mode,
while on the other hand the dependency on the gas compo-
sition is intensified, thus leading to lower losses in electrolysis
mode and higher losses in fuel cell mode. At a lower operating
temperature of 700 �C the higher transfer coefficient results in
Fig. 11 e Comparison of relative error between the simulated and measured cell voltage in both electrolysis and fuel cell
mode for transfer coefficients of 0;75 and 0;85 when varying operating conditions.
i n t e r n a t i o n a l j o u r n a l o f h y d r o g e n en e r g y 4 5 ( 2 0 2 0 ) 2 9 1 6 6e2 9 1 8 5 29181

a low error in the fuel cell mode, since in this range the main
deviation occurs due to the activation losses.
To sum up, the transfer coefficient of 0.85 would appear to
show a lower discrepancy between the simulation and the
experimental results, however, the activation losses are
overestimated for low water vapor concentrations. The gen-
eral trends are thus better predicted when employing a
transfer coefficient of 0.75, although the losses are estimated
to be lower. Nevertheless, since the gas composition as a
function of the cross-sectional flow field is neglected, which
influences the activation losses, the discrepancies observed
are plausible. Nevertheless, for all the cases shown here,
maximum relative errors of 3% in electrolysis mode and 1.5%
in fuel cell mode are observed, which implies very good
agreement of the simulated and measured data and confirms
the suitability of the model developed to simulate processes
within industrial-sized rSOCs.
Conclusion
This study gives a detailed insight into the operating behavior
and loss mechanisms of industrial-sized solid oxide cells
operated in a reversible mode with hydrogen/water vapor
mixture. A model based on physical parameters was used for
this purpose, which aids in a better understanding of the
processes and behavior within the operating cell based on
polarization curves, impedance data and specific losses illus-
trated. The model was validated with respect to varying
operating temperature, volume flow and fuel gas composi-
tions based on experiments performed in-house.
The simulated polarization curves are in a very good
accordance with the measured data for both, fuel cell and
electrolysis mode. The discrepancy between the measured
and simulated data increased: (i) with the decreasing fuel
volume flow in fuel cell mode, and (ii) with increasing oper-
ating temperature in electrolysis mode. Regarding the
Nyquist, the quantitative discrepancy was observed mainly in
the middle- and low frequency range, which is ascribed to the
unconsidered effects occurring in the flow channels, such as
non-uniform gas distribution in the flow cross-section. Next,
it was identified that a non-uniform gas distribution in the
flow channels has a greater influence on the voltage losses in
electrolysis mode in comparison to the fuel cell mode. Taking
into account varying flow configurations, the numerical and
experimental studies showed no significant deviation be-
tween co-flow and counter-flow, whereby a more uniform
current density distribution was achieved for the counter-
flow. This could be of great importance in two cases: (i)
when significantly increasing the operating currents thus
increasing the heat losses, and (ii) for the case of internal
reforming of hydrocarbons. Considering different approaches
for determination of the gas distribution within the cell, the
logarithmic averaging of the gas components between the
inlet and outlet provides similar results as when dividing the
cell into segments. Thus, it can be used as an alternative to
reduce the computing time, especially for large systems.
Focusing on the asymmetric activation losses that occur, it is
not possible to fully predict performance in the electrolysis
modewhen performing investigations solely in fuel cellmode.
However, comparing the numerical and experimental data for
different operating conditions, it is possible to link the pro-
cesses that occur with the specific frequency ranges and to
identify losses. In order to increase the model accuracy,
further steps are possible, but themodel extension toward the
3D model would be required, which would thus significantly
increase the computing requirements.
In conclusion, it must be highlighted that the operating
behavior of reversible solid oxide cells in industrial-size can be
predicted for both operatingmodes in a qualitatively adequate
manner. Themodel developed reveals the entire chemical and
electrochemical analysis of the cells under investigation, en-
ables performance prediction and eventually its optimization.
Declaration of competing interest
The authors declare that they have no known competing
financial interests or personal relationships that could have
appeared to influence the work reported in this paper.
Acknowledgements
The authors gratefully acknowledge the funding of the project
“Degradation monitoring and performance optimization of
SOECs” (project number I 3994) by Austrian Science Fund
(FWF). The authors gratefully acknowledge the Zukunftsfonds
Steiermark (https://www.zukunftsfonds.steiermark.at/) for
funding the project “ReFoxEnergie” (project number 9001). The
colleagues from the cell manufacturing group of IEK-1, For-
schungszentrum Julich are acknowledged for cell fabrication.
Appendix. List of symbols
Symbol Description
SOFC Solid oxide fuel cell
Ni-YSZ NickeleYttrium-stabilized-Doped
zirconia
SEM Scanning electron microscope
NOx Nitrogen-oxide
SOx Sulfur-oxide
CO2 Carbon-dioxide
O2� Oxygen-ion
YSZ Yttrium-stabilized-Zirconia
wO2 Volume fraction of oxygen
wN2 Volume fraction of nitrogen
Unernst Nernst voltage
DrGT;p Gibbs energy change
nel Number of electrons
F Faraday constant
R Universal gas constant
T Cell operating temperature
PO2;ca Cathodic oxygen partial pressure
PO2;an Anodic oxygen partial pressure
i Current density
i0 Equilibrium exchange current
density
a Transfer coefficient
DF Electrode over-voltage
i n t e rn a t i o n a l j o u r n a l o f h y d r o g e n en e r g y 4 5 ( 2 0 2 0 ) 2 9 1 6 6e2 9 1 8 529182

e (continued )
Symbol Description
DUOhmðiÞ Ohmic losses
rA Anode-resistance
rE Electrolyte-resistance
rC Cathode-resistance
DUconcðiÞ Concentration losses
iL Limiting current density
D Diffusion coefficient of reactants
cTPB Reactants concentrations on the
triple-phase boundary
d Thickness of the diffusion layer
DGM Dusty Gas Model
SEM Semi-electron microscopy
m Dynamic viscosity
h Overvoltage
x Coordinate in electrode
d Layer thickness
g Pre-factor
Fg Porosity
tg Tortuosity
n Equivalent number and number of
electrons released due to fuel
utilization
A Cross-section area
N Molar flux
y Coordinate in flow channel
l Length of the electrochemically
active area
b Width of the electrochemically
active area
Bg Gas permeability
p Pressure
R Gas constant
t Time
i Current density
z Area-specific resistance
L Inductivity
C Area-specific capacitance
i0 Exchange current density
i00 Exchange current density under
standard conditions
M Molar mass
rp Pore radius
dp Particle diameter
_s Molar flux
v Velocity
_V Volume flow
F Transfer function for mass transfer
in electrodes
G Transfer function for mass transfer
in fuel channels
H Transfer function for charge
transfer
r e f e r e n c e s
[1] Cebulla F, Naegler T, Pohl M. Electrical energy storage in
highly renewable european energy systems: capacity
requirements, spatial distribution, and storage dispatch. J
Energy Storage 2017;14:211e23. https://doi.org/10.1016/
j.est.2017.10.004.
[2] Energy, transport and environment indicators. In: Eurostat
statistical books. 2017 edition. Luxembourg: Publications
Office of the European Union; 2017.
[3] Perna A, Minutillo M, Jannelli E. Designing and analyzing an
electric energy storage system based on reversible solid
oxide cells. Energy Convers Manag 2018;159:381e95. https://
doi.org/10.1016/j.enconman.2017.12.082.
[4] Santhanam S, Heddrich MP, Riedel M, Friedrich KA.
Theoretical and experimental study of reversible solid oxide
cell (r-soc) systems for energy storage. Energy
2017;141:202e14. https://doi.org/10.1016/
j.energy.2017.09.081.
[5] Chen K, Jiang SP. Reviewdmaterials degradation of solid
oxide electrolysis cells. J Electrochem Soc 2016;163:F3070e83.
https://doi.org/10.1149/2.0101611jes.
[6] Menzler NH, Sebold D, Guillon O. Post-test characterization
of a solid oxide fuel cell stack operated for more than 30,000
hours: the cell. J Power Sources 2018;374:69e76. https://
doi.org/10.1016/j.jpowsour.2017.11.025.
[7] Blum L, de Haart LGJ, Malzbender J, Margaritis N,
Menzler NH. Anode-supported solid oxide fuel cell achieves
70 000 hours of continuous operation. Energy Technol
2016;4:939e42. https://doi.org/10.1002/ente.201600114.
[8] Fang Q, Blum L, Menzler NH, Stolten D. Solid oxide
electrolyzer stack with 20,000 h of operation. ECS
Transactions 2017;78:2885e93. https://doi.org/10.1149/
07801.2885ecst.
[9] Frey CE, Fang Q, Sebold D, Blum L, Menzler NH. A detailed
post mortem analysis of solid oxide electrolyzer cells after
long-term stack operation. J Electrochem Soc
2018;165:F357e64. https://doi.org/10.1149/2.0961805jes.
[10] Trini M, Jørgensen PS, Hauch A, Bentzen JJ, Hendriksen PV,
Chen M. 3D microstructural characterization of Ni/YSZ
electrodes exposed to 1 Year of electrolysis testing. J
Electrochem Soc 2019;166:F158e67. https://doi.org/10.1149/
2.1281902jes.
[11] Jiao Z, Busso EP, Shikazono N. Influence of polarization on
the morphological changes of nickel in fuel electrodes of
solid oxide cells. J Electrochem Soc 2020;167:024516. https://
doi.org/10.1149/1945-7111/ab6f5b.
[12] Atkinson A. Solid oxide fuel cell electrolytesdfactors
influencing lifetime. In: Solid oxide fuel cell lifetime and
reliability. Elsevier; 2017. p. 19e35. https://doi.org/10.1016/
B978-0-08-101102-7.00002-7.
[13] Martin M. Electrotransport and demixing in oxides. Solid
State Ionics 2000;136e137:331e7. https://doi.org/10.1016/
S0167-2738(00)00492-6.
[14] Kuznecov M. Diffusion controlled oxygen transport and
stability at the perovskite/electrolyte interface. Solid State
Ionics 2003;157:371e8. https://doi.org/10.1016/S0167-2738(02)
00235-7.
[15] Knibbe R, Traulsen ML, Hauch A, Ebbesen SD, Mogensen M.
Solid oxide electrolysis cells: degradation at high current
densities. J Electrochem Soc 2010;157:B1209. https://doi.org/
10.1149/1.3447752.
[16] Schefold J, Brisse A, Poepke H. Long-term steam electrolysis
with electrolyte-supported solid oxide cells. Electrochim
Acta 2015;179:161e8. https://doi.org/10.1016/
j.electacta.2015.04.141.
[17] Chatzichristodoulou C, Chen M, Hendriksen PV, Jacobsen T,
Mogensen MB. Understanding degradation of solid oxide
electrolysis cells through modeling of electrochemical
potential profiles. Electrochim Acta 2016;189:265e82. https://
doi.org/10.1016/j.electacta.2015.12.067.
[18] Wang K, Hissel D, P�era MC, Steiner N, Marra D, Sorrentino M,
Pianese C, Monteverde M, Cardone P, Saarinen J. A Review on
solid oxide fuel cell models. Int J Hydrogen Energy
i n t e r n a t i o n a l j o u r n a l o f h y d r o g e n en e r g y 4 5 ( 2 0 2 0 ) 2 9 1 6 6e2 9 1 8 5 29183

2011;36:7212e28. https://doi.org/10.1016/
j.ijhydene.2011.03.051.
[19] Hajimolana SA, Hussain MA, Daud WMW, Soroush M,
Shamiri A. Mathematical modeling of solid oxide fuel cells: a
review. Renew Sustain Energy Rev 2011;15:1893e917. https://
doi.org/10.1016/j.rser.2010.12.011. http://10.1016/j.rser.2010.
12.011.
[20] Bertei A, Arcolini G, Ouweltjes JP, Wuillemin Z, Piccardo P,
Nicolella C. Physically-based deconvolution of impedance
spectra: interpretation, fitting and validation of a numerical
model for lanthanum strontium cobalt ferrite-based solid
oxide fuel cells. Electrochim Acta 2016;208:129e41. https://
doi.org/10.1016/j.electacta.2016.04.181. http://10.1016/j.
electacta.2016.04.181.
[21] Suboti�c V, Schluckner C, Strasser J, Lawlor V, Mathe J,
Rechberger J, Schroettner H, Hochenauer C. In-situ
electrochemical characterization methods for industrial-
sized planar solid oxide fuel cells part i: methodology,
qualification and detection of carbon deposition. Electrochim
Acta 2016;207:224e36. https://doi.org/10.1016/
j.electacta.2016.05.025.
[22] Hauck M, Herrmann S, Spliethoff H. Simulation of a
reversible sofc with aspen plus. Int J Hydrogen Energy
2017;42:10329e40. https://doi.org/10.1016/
j.ijhydene.2017.01.189. http://www.sciencedirect.com/
science/article/pii/S0360319917303579.
[23] Menon V, Fu Q, Janardhanan VM, Deutschmann O. A model-
based understanding of solid-oxide electrolysis cells (soecs)
for syngas production by h2o/co2 co-electrolysis. J Power
Sources 2015;274:768e81. https://doi.org/10.1016/
j.jpowsour.2014.09.158.
[24] Botta G, Romeo M, Fernandes A, Trabucchi S, Aravind P.
Dynamic modeling of reversible solid oxide cell stack and
control strategy development. Energy Convers Manag
2019;185:636e53. https://doi.org/10.1016/
j.enconman.2019.01.082. http://www.sciencedirect.com/
science/article/pii/S0196890419301360.
[25] Barelli L, Bidini G, Cinti G, Ottaviano A. Study of sofc-soe
transition on a rsofc stack. Int J Hydrogen Energy
2017;42:26037e47. https://doi.org/10.1016/
j.ijhydene.2017.08.159. http://www.sciencedirect.com/
science/article/pii/S0360319917334626.
[26] Menon V, Janardhanan VM, Deutschmann O. A
mathematical model to analyze solid oxide electrolyzer cells
(soecs) for hydrogen production. Chem Eng Sci
2014;110:83e93. https://doi.org/10.1016/j.ces.2013.10.025.
[27] Schluckner C, Suboti�c V, Lawlor V, Hochenauer C. Three-
dimensional numerical and experimental investigation of an
industrial-sized sofc fueled by diesel reformat e part ii:
detailed reforming chemistry and carbon deposition
analysis. Int J Hydrogen Energy 2015;40:10943e59. https://
doi.org/10.1016/j.ijhydene.2015.06.024.
[28] Yang C, Shu C, Miao H, Wang Z, Wu Y, Wang J, Zhao J,
Wang F, Ye W, Yuan J. Dynamic modelling and performance
analysis of reversible solid oxide fuel cell with syngas. Int J
Hydrogen Energy 2019;44:6192e211. https://doi.org/10.1016/
j.ijhydene.2019.01.068. http://www.sciencedirect.com/
science/article/pii/S0360319919301703.
[29] Schluckner C, Suboti�c V, Lawlor V, Hochenauer C. Three-
dimensional numerical and experimental investigation of an
industrial-sized sofc fueled by diesel reformat e part i:
creation of a base model for further carbon deposition
modeling. Int J Hydrogen Energy 2014;39:19102e18. https://
doi.org/10.1016/j.ijhydene.2014.09.108.
[30] Wang Y, Du Y, Ni M, Zhan R, Du Q, Jiao K. Three-dimensional
modeling of flow field optimization for co-electrolysis solid
oxide electrolysis cell. Appl Therm Eng 2020;172:114959.
https://doi.org/10.1016/j.applthermaleng.2020.114959. http://
www.sciencedirect.com/science/article/pii/
S1359431119362192.
[31] Peksen M, Al-Masri A, Blum L, Stolten D. 3d transient
thermomechanical behaviour of a full scale sofc short stack.
Int J Hydrogen Energy 2013;38:4099e107. https://doi.org/
10.1016/j.ijhydene.2013.01.072. http://www.sciencedirect.
com/science/article/pii/S0360319913001584.
[32] Kupecki J, Motylinski K, Jagielski S, Wierzbicki M, Brouwer J,
Naumovich Y, Skrzypkiewicz M. Energy analysis of a 100kw
class power to gas system based on a solid oxide electrolyzer,
Energy Conversion and Management 199. 2019. p. 111934.
https://doi.org/10.1016/j.enconman.2019.111934. http://
www.sciencedirect.com/science/article/pii/
S0196890419309252.
[33] Nechache A, Mansuy A, Petitjean M, Mougin J, Mauvy F,
Boukamp BA, Cassir M, Ringued�e A. Diagnosis of a cathode-
supported solid oxide electrolysis cell by electrochemical
impedance spectroscopy. Electrochim Acta
2016;210:596e605. https://doi.org/10.1016/
j.electacta.2016.05.014. http://10.1016/j.electacta.2016.05.014.
[34] Wan TH, Saccoccio M, Chen C, Ciucci F. Influence of the
discretization methods on the distribution of relaxation
times deconvolution: implementing radial basis functions
with DRTtools. Electrochim Acta 2015;184:483e99. https://
doi.org/10.1016/j.electacta.2015.09.097. http://10.1016/j.
electacta.2015.09.097.
[35] Bao C, Bessler WG. A computationally efficient steady-state
electrode-level and 1D þ 1D cell-level fuel cell model. J Power
Sources 2012;210:67e80. https://doi.org/10.1016/
j.jpowsour.2012.03.023. http://10.1016/j.jpowsour.2012.03.023.
[36] Suboti�c V, Schluckner C, Joerg M, Rechberger J,
Schroettner H, Hochenauer C. Anode regeneration following
carbon depositions in an industrial-sized anode supported
solid oxide fuel cell operating on synthetic diesel reformate. J
Power Sources 2015a;295:55e66.
[37] Suboti�c V, Schluckner C, Hochenauer C. An experimental
and numerical study of performance of large planar esc-
sofcs and experimental investigation of carbon depositions. J
Energy Inst 2015b;89:121e37.
[38] Schluckner C, Subotic V, Preißl S, Hochenauer C. Numerical
analysis of flow configurations and electrical contact
positions in sofc single cells and their impact on local effects.
Int J Hydrogen Energy 2019;44:1877e95. https://doi.org/
10.1016/j.ijhydene.2018.11.132. http://www.sciencedirect.
com/science/article/pii/S0360319918337376.
[39] Ivers-Tiff�ee E, Virkar AV. Electrode polarisations.
Amsterdam: Elsevier Science; 2003. p. 229e60. https://
doi.org/10.1016/B978-185617387-2/50026-X. http://www.
sciencedirect.com/science/article/pii/
B978185617387250026X.
[40] O’Hayre R, Cha S-W, Colella W, Prinz FB. Fuel cell
fundamentals. In: Fuel cell fundamentals. New Jersey: John
Wiley and Sons; 2009.
[41] O’Hayre R, Cha S-W, Colella W, Prinz FB. Fuel cell
fundamentals. John Wiley & Sons, Inc; 2016. https://doi.org/
10.1002/9781119191766. http://10.1002/9781119191766.
[42] Zhu H, Kee RJ, Janardhanan VM, Deutschmann O,
Goodwin DG. Modeling elementary heterogeneous chemistry
and electrochemistry in solid-oxide fuel cells. J Electrochem
Soc 2005;152:A2427. https://doi.org/10.1149/1.2116607. http://
jes.ecsdl.org/cgi/doi/10.1149/1.2116607.
[43] Miyawaki K, Kishimoto M, Iwai H, Saito M, Yoshida H.
Comprehensive understanding of the active thickness in
solid oxide fuel cell anodes using experimental, numerical
and semi-analytical approach. J Power Sources
2014;267:503e14. https://doi.org/10.1016/
i n t e rn a t i o n a l j o u r n a l o f h y d r o g e n en e r g y 4 5 ( 2 0 2 0 ) 2 9 1 6 6e2 9 1 8 529184

j.jpowsour.2014.05.112. http://10.1016/j.jpowsour.2014.05.
112.
[44] Rasmussen JFB, Hendriksen PV, Hagen A. Study of internal
and external leaks in tests of anode-supported sofcs. Fuel
Cell 2008;8:385e93. https://doi.org/10.1002/fuce.200800019.
https://onlinelibrary.wiley.com/doi/abs/10.1002/fuce.
200800019.
[45] Mogensen M, Hendriksen PV. Testing of electrodes, cells and
short stacks. Amsterdam: Elsevier Science; 2003. p. 261e89.
https://doi.org/10.1016/B978-185617387-2/50027-1. http://
www.sciencedirect.com/science/article/pii/
B9781856173872500271.
[46] Subotic V, Schluckner C, St€ockl B, Lawlor V, Schroettner H,
Hochenauer C. Strategy for carbon gasification from porous
ni-ysz anodes of industrial-sized asc-sofcs and effects of
carbon growth. J Electrochem Soc 2016;163:F1515e22. https://
doi.org/10.1149/2.0521614jes. http://jes.ecsdl.org/content/
163/14/F1515.abstract.
[47] Ni M, Leung MKH, Leung DYC. Parametric study of solid
oxide steam electrolyzer for hydrogen production. Int J
Hydrogen Energy 2007a;32:2305e13. https://doi.org/10.1016/
j.ijhydene.2007.03.001.
[48] Ni M, Leung MK, Leung DY. Parametric study of solid oxide
fuel cell performance. Energy Convers Manag
2007b;48:1525e35. https://doi.org/10.1016/
j.enconman.2006.11.016.
[49] Yurkiv V. Reformate-operated SOFC anode performance and
degradation considering solid carbon formation: a modeling
and simulation study. Electrochim Acta 2014;143:114e28.
https://doi.org/10.1016/j.electacta.2014.07.136. http://10.1016/
j.electacta.2014.07.136.
[50] Krishna R, Wesselingh J. The maxwell-stefan approach to
mass transfer. Chem Eng Sci 1996;22:861e911.
[51] Bessler WG, Gewies S. Gas concentration impedance of solid
oxide fuel cell anodes: II. Channel geometry. J Electrochem
Soc 2007;154:B548. https://doi.org/10.1149/1.2720639. http://
jes.ecsdl.org/cgi/doi/10.1149/1.2720639.
[52] Bao C, Bessler WG. A computationally efficient steady-state
electrode-level and 1dþ1d cell-level fuel cell model. J Power
Sources 2012;210:67e80. https://doi.org/10.1016/
j.jpowsour.2012.03.023. http://www.sciencedirect.com/
science/article/pii/S0378775312006222.
[53] Orazem ME, Tribollet B. Electrochemical impedance
spectroscopy. Wiley-Blackwell; 2017. https://doi.org/10.1002/
9781119363682. https://onlinelibrary.wiley.com/doi/abs/10.
1002/9781119363682.
i n t e r n a t i o n a l j o u r n a l o f h y d r o g e n en e r g y 4 5 ( 2 0 2 0 ) 2 9 1 6 6e2 9 1 8 5 29185